practice revenue enhancement strategies
TRANSCRIPT

Practice Revenue Enhancement Strategies
Build Expertise in Risk Management
May 4, 2021

About the Healthcare Practice Resource Group (HPRG)The Healthcare Practice Resource Group (HPRG) was established to provide healthcare
practices with key guidance to maximize their potential and give them the confidence
that they are comprehensively supported. Our cross-discipline, collaborative approach
provides access to top business professionals wholly committed to the current, ongoing
and future success of our clients.
2

Leadership Team
Sue ReedM&A Accounting
SAX LLP973-472-6250 x6131 [email protected]
Andrew SlaterBusiness Development/Management
Health Innovation Partners, LLC908-868-4795
Mark StabileValue-Based Care
TEAM of Care Solutions, LLC201-654-0653
Lisa WagnerCommercial Banking Services
ConnectOne Bank201-306-7275
Ted ByerTax & Accounting ServicesSmolin, Lupin & Company
John D. FanburgLegal Services
Brach Eichler LLC973-403-3107
Robert GoodmanInvestment Banking Services
MidCap Advisors, LLC609-636-9584
Peter HoglundWealth Management
Wealth Enhancement Group908-821-9760
Henry KaneMalpractice Insurance
Acadia Professional, LLC908-526-3904

Today’s Presenters
Andrew SlaterBusiness Development/ManagementPartnerHealth Innovation Partners, [email protected]
Robert GoodmanInvestment Banking ServicesMidCap Advisors, [email protected]
Mark Stabile, JD, MPHValue-Based CareChief Executive OfficerTEAM of Care Solutions, [email protected]
Brian Kern, JDHealthcare RiskPartnerAcadia [email protected]

Today’s Agenda
Revenue Enhancement Opportunities• Addressing the continued evolution from fee-for-service to value-based care (VBC)• Fee-for-service / Value-based revenue alignment opportunities
Common Components of Risk in VBC and Risk Contracts• Key success factors for navigating risk in VBC models• Coordinating the patient journey, reducing expenditures & increasing reimbursement• Importance of price transparency, data and risk protection
Make or Breaks for Reimbursements in Value-Based Contracts• What is an HCC and how does it work?• Key success factors for HCC recapture and risk management

Revenue Enhancement Opportunities

Revenue Enhancement Opportunities
FFS and VBC
• Most income is still FFS, but for how much longer?
• Programs that increase FFS income, while increasing quality
• Telemonitoring, Diabetic Retinopathy Screening, Hemodynamic monitoring
• History of Managed Care
• China, Kaiser, Surgery
• REAL REASON JESUS WAS BORN IN THE MANGER
• HMO -The problem is that 99.99% of the HMO's make a bad name for the rest of them.
• Dictionary of Terms
• Fee for Service – (FFS) Under the fee-for-service payment approach, physicians are paid based on the volume of treatments or tests they performed.
• Value Based Contracting – (VBC)
• Medicare Advantage – (MA)
• 4 Categories of Transition from FFS to VBC
7
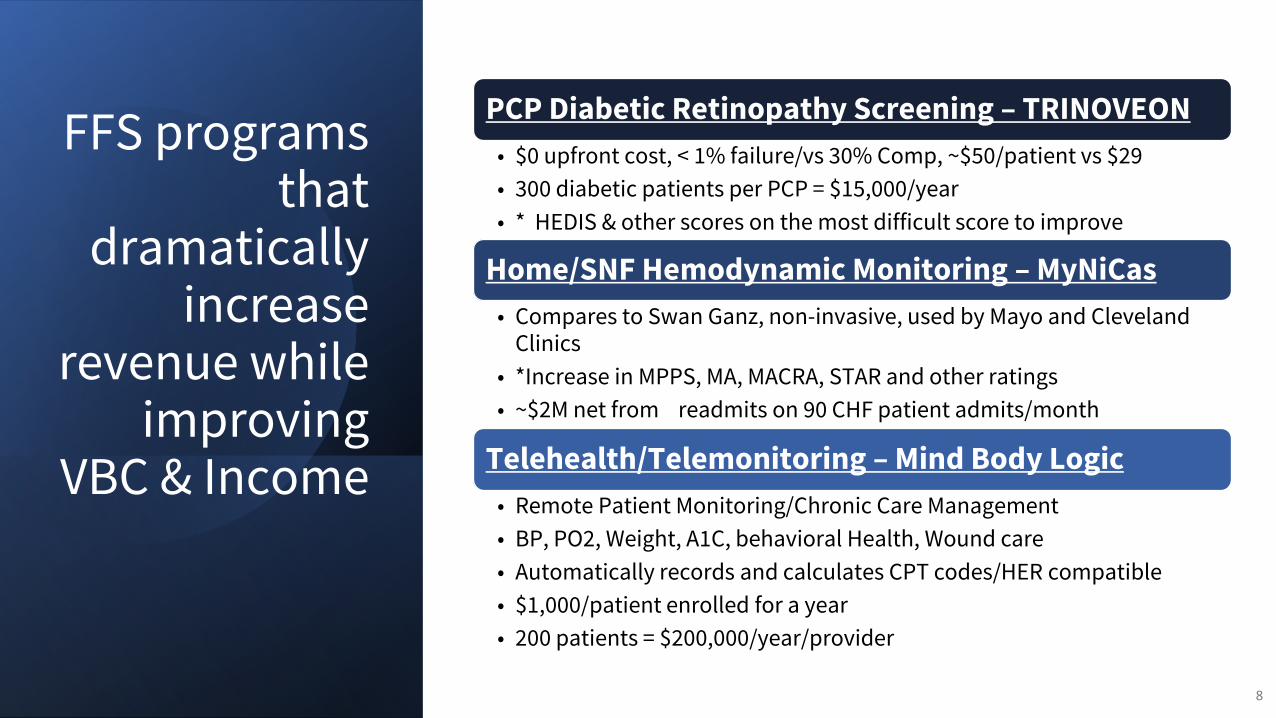
FFS programs that
dramatically increase
revenue while improving
VBC & Income
8
PCP Diabetic Retinopathy Screening – TRINOVEON
• $0 upfront cost, < 1% failure/vs 30% Comp, ~$50/patient vs $29
• 300 diabetic patients per PCP = $15,000/year
• * HEDIS & other scores on the most difficult score to improve
Home/SNF Hemodynamic Monitoring – MyNiCas
• Compares to Swan Ganz, non-invasive, used by Mayo and Cleveland Clinics
• *Increase in MPPS, MA, MACRA, STAR and other ratings
• ~$2M net from readmits on 90 CHF patient admits/month
Telehealth/Telemonitoring – Mind Body Logic
• Remote Patient Monitoring/Chronic Care Management
• BP, PO2, Weight, A1C, behavioral Health, Wound care
• Automatically records and calculates CPT codes/HER compatible
• $1,000/patient enrolled for a year
• 200 patients = $200,000/year/provider

9

• Reimbursement: From FFS to VBC
• Stats on transition: % of VBC
• Medicaid now provides coverage for 21% of the covered lives in the U.S., behind employer-based coverage at 49% but ahead of Medicare at an estimated 14%
• States now have the affirmative authority to require Medicaid Managed Care Organizations (MCOs) in their state to implement value-based payment arrangements. If they choose to exercise this authority, states have significant power to move their state health insurance markets toward value-based payment reform.
• Nationally over 55 million people are covered by some type of VBC
• New Jersey is far behind the rest of the country in both numbers and quality indicator improvements
• This is a significant Opportunity for NJ Providers
• “It is better to learn to swim in the shallow end of the pool.”
• In New Jersey, Horizon Blue Cross Blue Shield, the state’s largest insurance provider with some 3.8 million patients, already directs 60 percent of its medical spending to providers that have value-based arrangements, the company said. Aetna spends nearly two-thirds of its dollars on such programs here and is aiming for 75 percent by 2020, according to representatives. And UnitedHealthcare pays more than half the claims for its employee and individual plans in the state to providers in value-based arrangements, it said.
10
Overview of Changes in Reimbursement
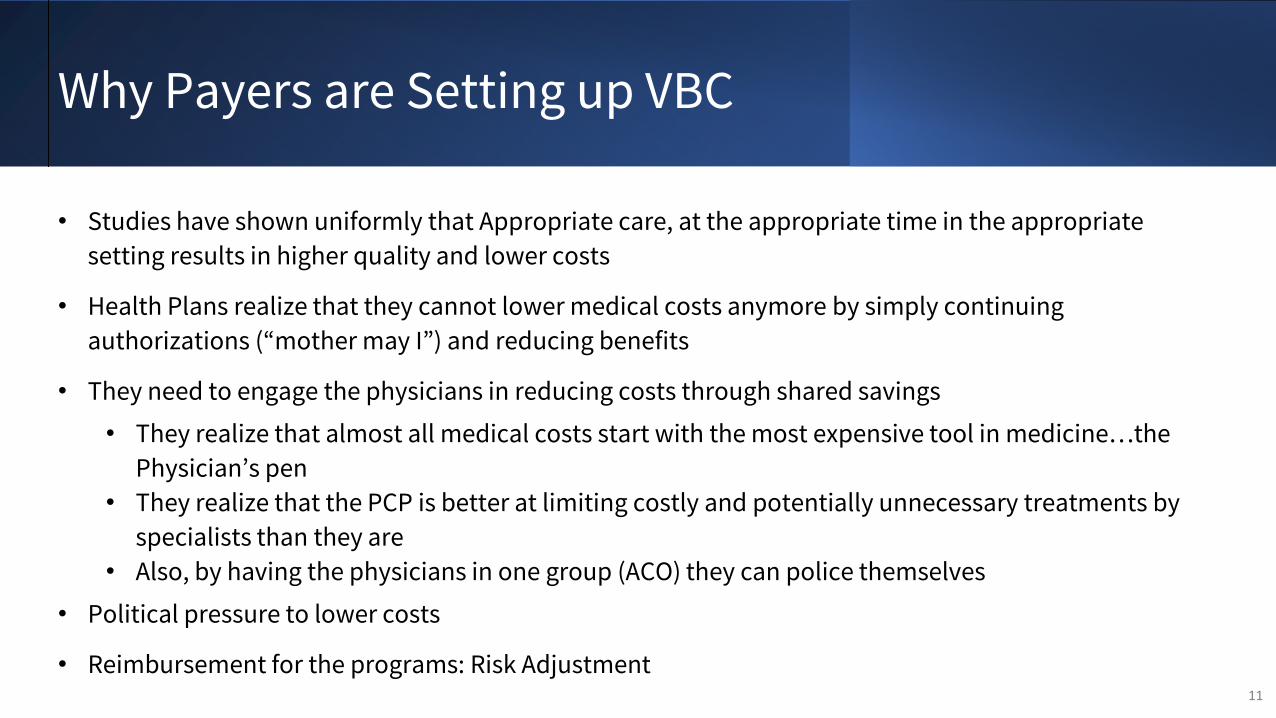
• Studies have shown uniformly that Appropriate care, at the appropriate time in the appropriate
setting results in higher quality and lower costs
• Health Plans realize that they cannot lower medical costs anymore by simply continuing
authorizations (“mother may I”) and reducing benefits
• They need to engage the physicians in reducing costs through shared savings
• They realize that almost all medical costs start with the most expensive tool in medicine…the
Physician’s pen
• They realize that the PCP is better at limiting costly and potentially unnecessary treatments by
specialists than they are
• Also, by having the physicians in one group (ACO) they can police themselves
• Political pressure to lower costs
• Reimbursement for the programs: Risk Adjustment11
Why Payers are Setting up VBC
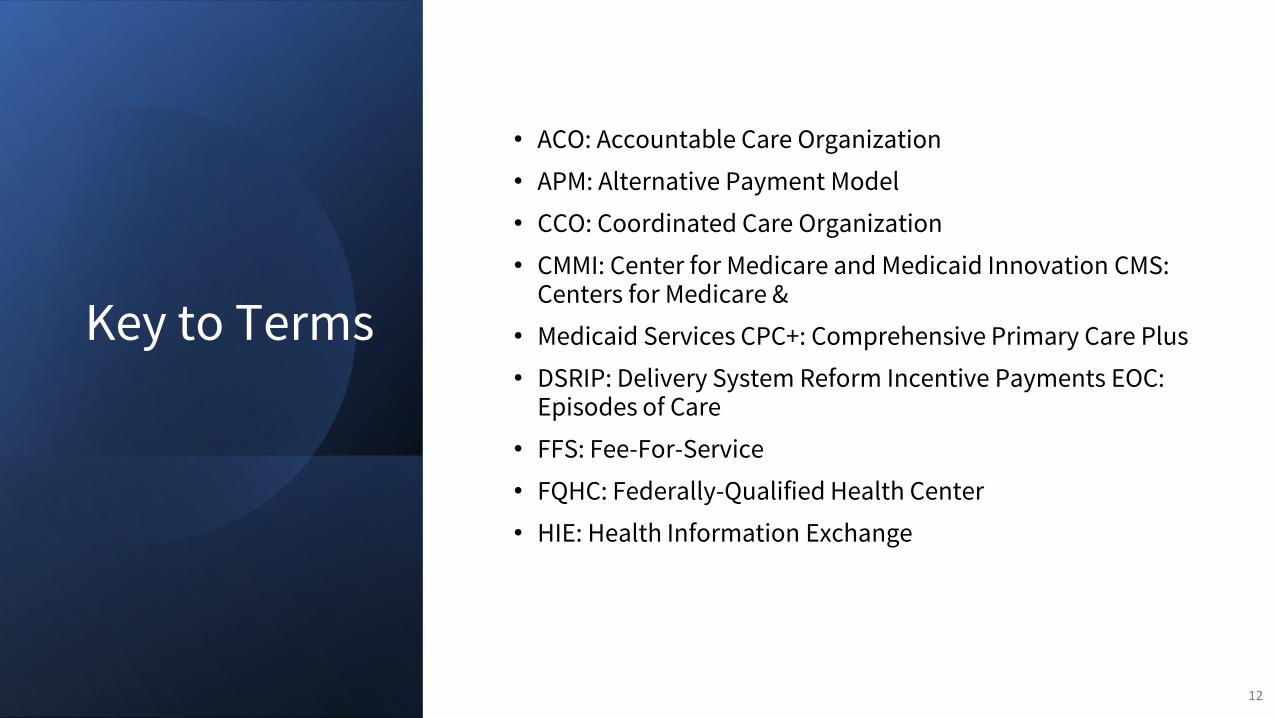
Key to Terms
• ACO: Accountable Care Organization
• APM: Alternative Payment Model
• CCO: Coordinated Care Organization
• CMMI: Center for Medicare and Medicaid Innovation CMS: Centers for Medicare &
• Medicaid Services CPC+: Comprehensive Primary Care Plus
• DSRIP: Delivery System Reform Incentive Payments EOC: Episodes of Care
• FFS: Fee-For-Service
• FQHC: Federally-Qualified Health Center
• HIE: Health Information Exchange
12

Key to Terms
• LTSS: Long-Term Services and Supports
• MCO: Managed Care Org MPC: Multi-Payer Collaborative
• P4P: Pay-for-Performance
• P4V: Pay-for-Value
• PCMH: Patient-Centered Medical Homes
• PMPM: Per Member, Per Month
• PSN: Provider Service Network
• RCO: Regional Care Organization
• SIM: State Innovation Models
• TCOC: Total Cost of Care
13

Common Components of Risk in VBC and Risk Contracts
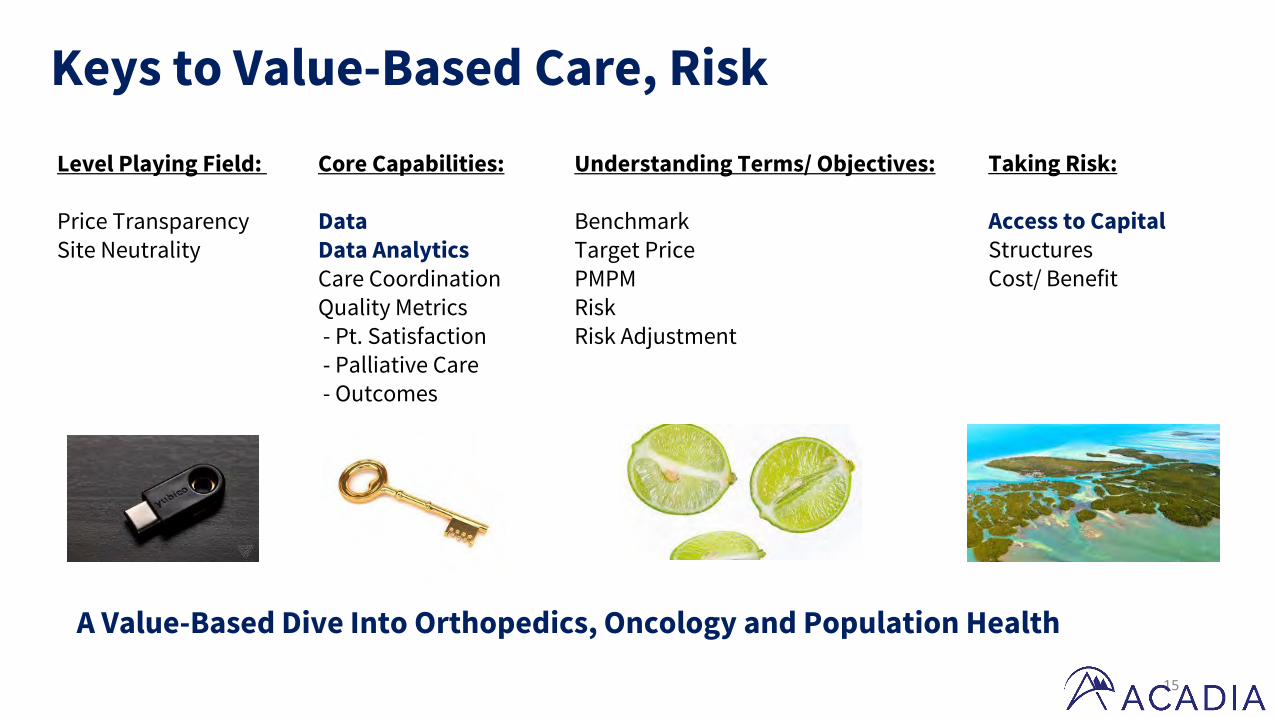
Keys to Value-Based Care, Risk
15
Level Playing Field:
Price Transparency Site Neutrality
Understanding Terms/ Objectives:
BenchmarkTarget PricePMPMRiskRisk Adjustment
Taking Risk:
Access to CapitalStructures Cost/ Benefit
Core Capabilities:
DataData AnalyticsCare Coordination Quality Metrics - Pt. Satisfaction- Palliative Care- Outcomes
A Value-Based Dive Into Orthopedics, Oncology and Population Health

Payor
Surgeon Facility Home
HealthAnesthesia Drugs SNF Rehab
Fee For Service: Avg Cost: $30,000
Value-Based Care: Target Price, $29,000
$$$$$$$$ $$$$$$$$
“GC”
Surgeon FacilityHome
Health Anesthesia Drugs SNF Rehab
$$$$$$$$ $$$$$$$$
Goal: Managing Post-Op ComplicationsGeneral Contractor: Physician Practice Hospital 3rd Party/ “Convener” ACO
EX: ORTHOPEDICS

Assessing Opportunity through VBC Data
17
Access:1. EHR Systems (Incomplete, “Real Time”) 2. CMS: Via value-based care programs (ACOs, BPCI, OCM/ OCF, ESRD, DPC)3. Private Payors: Structure, Quality
Analytics:
EX: ORTHOPEDICSBPCI-A

Prepared by SFL Scientific
Practice-Level Spending Breakdown
The Reconciliation Reports provide data on all OCM practices as comparison points for spending breakdowns. This data can help benchmark expected spending.
18
This Practice
All OCM PracticesA
ll C
an
ce
rs
Acu
te
Le
uk
em
ia
Bre
ast
Ca
nce
r This Practice
All OCM Practices
This Practice
All OCM Practices
EX: ONCOLOGYOCM

Prepared by SFL Scientific
Cost Drivers by Physician
19
Physician-Level Spending BreakdownEX: ONCOLOGYOCM

Population Health: Managing Risk
20
Claim Files/ HCCs
AWV’s Care PlanCare
CoordinationClose Gaps in
Care
Palliative/ End of Life
Care
Identify PtsEmphasizeHigh RiskComorbidities
Telehealth Opps“Recapture” Pts
Individualized“Informed Consent”SDOH
NavigationTeam
ReferralsTestsRx
Living WillsFollow patient wishes

There’s Data for That
21
MetricNational All
LOB 75 Percentile
National All LOB 90th
Percentile
Navvis New Jersey
Performance*
Screenings
Adult BMI Assessment (ABA)
67 70 74.25
Breast Cancer Screening (BCS)
57 60 68.66
Colorectal Cancer Screening (COL)
51 56 58.09
Cervical Cancer Screening (CCS)
59 62 67.64
Disease Control
Comprehensive Diabetes Care: Eye Exam (CDCE)
45 51 27.84
Comprehensive Diabetes Care: (HbA1c) Poor Control (>9%) (CDC)
31 26 53.05
Comprehensive Diabetes Care: Medical Attention for Nephropathy (CDC)
68 70 73.15

Stop Loss Protecting the Downside Risk Associated with Value-Based Programs
Specific: Covers a single complication per patient or diagnosis Aggregate: Protects cumulative downside risk (PP Total Loss)
Ex: 1 Specific, Episodic Ex: 2 Aggregate, Population Target Price : $25,000 Baseline: $100,000,000Deductible: $1,000 Deductible: $1,000,000Premium (per case): $750 Premium: Based on Data Coverage: Above $26,000 Coverage: Above $101,000,000
22
BPCI-A
20% downside/ upside risk corridor
Capped at 99 percentile (winsorization)
90 day cancellation period
OCMUpside: Up to 16% below target price Downside: 8% of Revenue + Chemo 6-month performance periods
MSSP: Progression to RiskTrack A&B: No risk Track C, D, E 50% up 30% down
Caps vary
Episodic Population

Underwriting Stop Loss
What data is being used?
What is the benchmark?
What is included/excluded?
Episodes: Drugs, Codes outside of Specialty?
Population Health: Transplants?
PMPM (MEOS) Payments?
What is the total downside risk?
Winsorization Caps
Cost of insurance?
Loss Ratios Modeling Process
23

Negotiating Stop-Loss
1. Forge a strong data analytic partnership.
2. Understand past performance relative to benchmarks, targets.
3. Identify cost drivers, present strategies to control them.
4. Thoroughly understand risk adjustment.
24
Make or Breaks for Reimbursements in Value-Based Contracts

Value-Based Care Compels Management of Cost, Quality, & Risk Across All Points of Service
26
Medicare ACO(MSSP)
CPC +
Medicare Advantage
Dual Eligible Special Needs
Project
Medicaid Managed Care
Full Risk Contracts
Commercial ACO
PACE
Payer Contract:
FFV
Goal:$
Reduce Cost
Increase Quality
Optimize RAF
Optimize IDC
Value-Based Care Contracts
Today, we are going to focus on “Risk AdjustmentFactors” as a major component of reimbursement in Value-Based Care
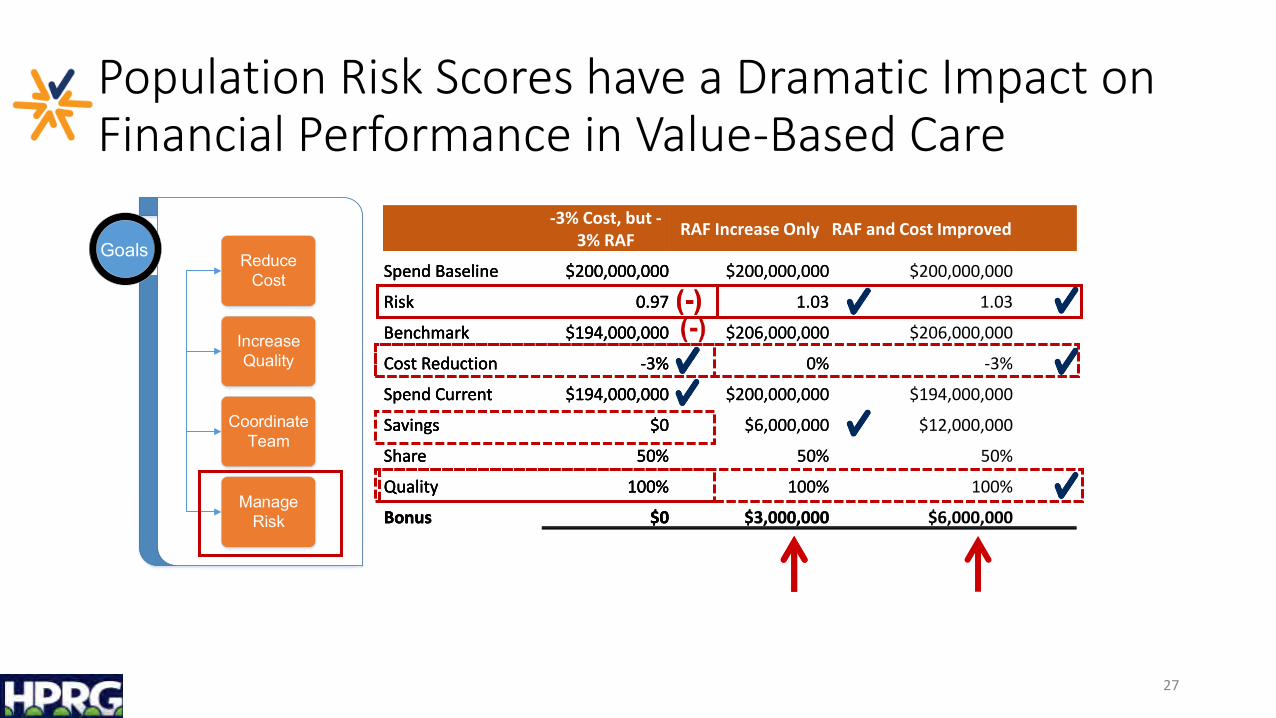
Population Risk Scores have a Dramatic Impact on Financial Performance in Value-Based Care
27
-3% Cost, but -3% RAF
Spend Baseline $200,000,000
Risk 0.97
Benchmark $194,000,000
Cost Reduction -3%
Spend Current $194,000,000
Savings $0
Share 50%
Quality 100%
Bonus $0
GoalsGoals Reduce Cost
Increase Quality
Coordinate Team
Manage Risk
-3% Cost, but -3% RAF
RAF Increase Only
Spend Baseline $200,000,000 $200,000,000
Risk 0.97 1.03
Benchmark $194,000,000 $206,000,000
Cost Reduction -3% 0%
Spend Current $194,000,000 $200,000,000
Savings $0 $6,000,000
Share 50% 50%
Quality 100% 100%
Bonus $0 $3,000,000
-3% Cost, but -3% RAF
RAF Increase Only RAF and Cost Improved
Spend Baseline $200,000,000 $200,000,000 $200,000,000
Risk 0.97 1.03 1.03
Benchmark $194,000,000 $206,000,000 $206,000,000
Cost Reduction -3% 0% -3%
Spend Current $194,000,000 $200,000,000 $194,000,000
Savings $0 $6,000,000 $12,000,000
Share 50% 50% 50%
Quality 100% 100% 100%
Bonus $0 $3,000,000 $6,000,000

Hierarchical Condition Categories (HCC) are Used to Calculate the Risk Adjustment Factor (RAF)
28
+
Demographic Characteristics(Age, Gender, Eligibility)
Health Status (CMS-HCC Model)
=Risk Score
(RAF)
• Maps Certain Diagnosis Codes to a Weighted Scoring Model
• Diagnosis Submitted on a Claim• Weights Vary by Patient Category• Interaction Weights
Each member is assigned a risk score

Wait, What is an HCC??
29
HCC Code HCC Description HCC Weight
ICD Codes
2017 2018 2019 2020
18 Diabetes with Chronic Complications 0.302 E11610 E1165
19 Diabetes without Complication 0.105 E119 E119
85 Congestive Heart Failure 0.331 I509 I5031 I509
86 Acute Myocardial Infarction 0.195 I213
88 Angina Pectoris 0.135 I209
108 Vascular Disease 0.288 I70213 I779
111 Chronic Obstructive Pulmonary Disease 0.335 J449 J449
170 Hip Fracture/Dislocation 0.350 S7290XA
HCC Total Weight for Year 0.633 0.923 0.983 0.954
With Condition Categories Grouped
Diagnosis Codes (ICD)
And Arranged in a Hierarchy by Concurrent Cost / Risk
Each Assigned a Weight based on Cost / Risk
HCC Weights – and Associated RAF Scores - Account for the Additional Time and Cost to Treat More Complex (Sicker) Patients
Mapped to a Condition Category

Basic Rules of HCC / RAF Calculation
• On January 1st All HCCs are Removed• Resets to Zero
• Need to Submit a Claim with Diagnostic Codes from a Qualifying Visit Every Year• Chart must support the claim
• TEAM: Treat, Evaluate, Assess, Monitor
• Telehealth Visits Now Qualify
• Chronic / persistent conditions• Conditions for 34 of the 86 HCCs do not necessarily persist
• 9700 ICD-10 codes map to an HCC; 5757 of those Dx are chronic
• Risk Contracts are Generally a “Prospective” Payment System• Claim for Encounter in 2020 sets the HCC / RAF for Payment in 2021
30

So What is the Problem?
31
HCC Code HCC Description HCC Weight
ICD Codes
2017 2018 2019 2020
18 Diabetes with Chronic Complications 0.302 E11610 X E1165 X
19 Diabetes without Complication 0.105 E119 E119 O
85 Congestive Heart Failure 0.331 I509 X I5031 I509
86 Acute Myocardial Infarction 0.195 I213 X X
88 Angina Pectoris 0.135 I209 O O
108 Vascular Disease 0.288 I70213 X I779
111 Chronic Obstructive Pulmonary Disease 0.335 J449 X J449
170 Hip Fracture/Dislocation 0.350 S7290XA N/A
HCC Total Weight for Year 0.633 0.923 0.983 0.954
HCC Weights Expected 0.633 1.451 1.801 1.451
HCC Weights Missed 0.000 0.528 0.818 0.497
These are gaps of 34 – 45%• Care?• Quality?• Reimbursement?
In 2018, the diagnosis for Diabetes was recorded without complications and there was no claim with CHF• Lost scoring for HCCs• Lost “Interaction Weights”• Once a patient has an AMI, they will always
require management – and coding• Vascular Disease is frequently uncoded• Lost “Interaction Weights” from not coding
COPD
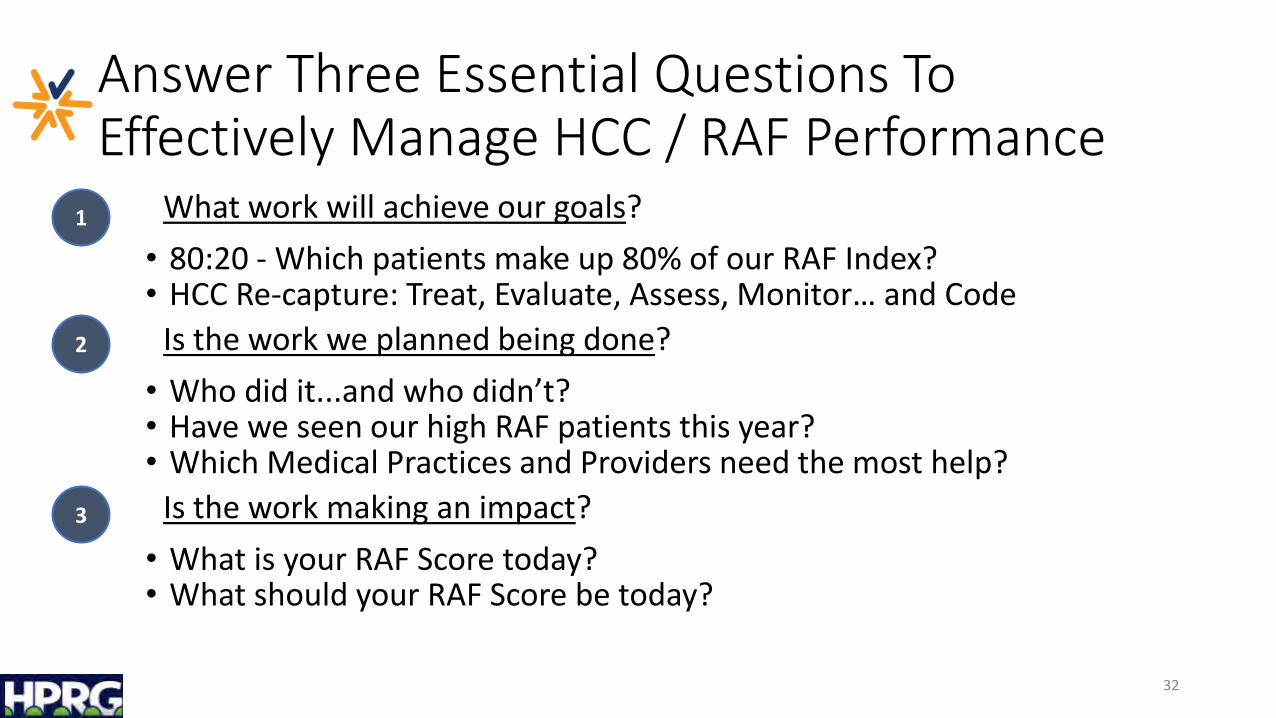
Answer Three Essential Questions To Effectively Manage HCC / RAF Performance
What work will achieve our goals?
• 80:20 - Which patients make up 80% of our RAF Index?• HCC Re-capture: Treat, Evaluate, Assess, Monitor… and Code
Is the work we planned being done?
• Who did it...and who didn’t? • Have we seen our high RAF patients this year? • Which Medical Practices and Providers need the most help?
Is the work making an impact?
• What is your RAF Score today?• What should your RAF Score be today?
32
1
2
3
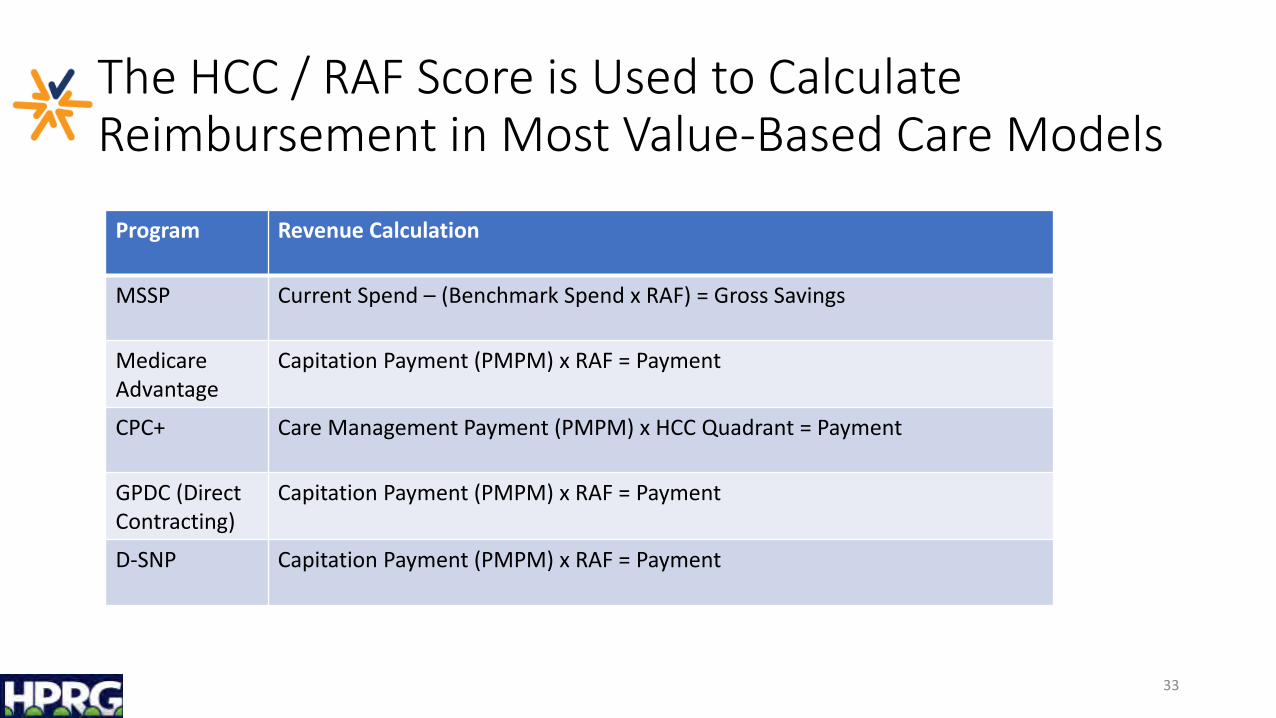
The HCC / RAF Score is Used to Calculate Reimbursement in Most Value-Based Care Models
33
Program Revenue Calculation
MSSP Current Spend – (Benchmark Spend x RAF) = Gross Savings
Medicare Advantage
Capitation Payment (PMPM) x RAF = Payment
CPC+ Care Management Payment (PMPM) x HCC Quadrant = Payment
GPDC (Direct Contracting)
Capitation Payment (PMPM) x RAF = Payment
D-SNP Capitation Payment (PMPM) x RAF = Payment

QUESTIONS & ANSWERS
Tuesday, May 25, 2021 | 12:00 - 1:00 p.m.
Pandemic Impact Interplay – CARES Act Questions Addressed for Medical Practices
UPCOMING WEBINARS
RECORDED RESOURCES
1. Rethinking the Private Practice of Medicine in a Post-Pandemic World
2. Telemedicine Opportunities and Guidance
VISIT HPRGHEALTH.COM TO REGISTER & WATCH OUR WEBINAR SERIES

Thank You!
Andrew SlaterBusiness Development/ManagementPartnerHealth Innovation Partners, [email protected]
Robert GoodmanInvestment Banking ServicesMidCap Advisors, [email protected]
Mark Stabile, JD, MPHValue-Based CareChief Executive OfficerTEAM of Care Solutions, [email protected]
Brian Kern, JDHealthcare RiskPartnerAcadia [email protected]