poverty: key facts
TRANSCRIPT
Research Briefing 2012-01February 2012
Poverty: key facts A profile of poverty in Tower Hamlets
SUMMARY OF FINDINGS
Households in income poverty About this briefing This briefing presents key statistics about poverty in Tower Hamlets. The analysis draws together selected indicators that offer different perspectives on the scale and severity of poverty in the borough.
In Tower Hamlets, it is estimated that 44per cent of households are in incomepoverty – defined as those living below 60per cent of the median (or ‘middle’) UKhousehold income, after housing costs(2007/08)1. This is the highest rate ofincome poverty across all local authoritiesin England and Wales and double thenational average (22 per cent).
Council Tax Benefit claimants In Tower Hamlets, just over one third (35per cent) of households were in receipt ofCouncil Tax Benefit (CTB) - as at March20112. CTB is a means tested benefit forthose on low incomes who need helppaying their Council Tax. CTB statisticsprovide useful proxy data on low incomehouseholds and their characteristics. Note:CTB data presented in this report are drawnfrom the Mayhew Harper Associates TowerHamlets Population Study.
At ward level, the percentage of householdsin receipt of CTB ranges from 18 per cent ofhouseholds in St.Katharine’s & Wappingward up to 55 per cent of households inEast India & Lansbury ward.
Across the borough’s 130 Lower SuperOutput Areas (LSOAs)3, rates are evenmore polarised: the percentage ofhouseholds on CTB ranges from only 3 per
Contents Page 1 Introduction 52 Households in income poverty 73 Council Tax Benefit households 124 Child poverty rates 175 Claimants on out-of-work benefits 236 Pensioner poverty 277 Indices of deprivation 308 Financial inclusion 38
Appendices A: Benefits take-up rates 44B: Further information 45
This briefing was produced by the Council’s Corporate Research Unit (Chief Executive’s Directorate). Research briefings provide timely and in-depth analysis of data about Tower Hamlets and are designed to improve the use and sharing of data across the Partnership.
Poverty: key facts Page 2 Summary of findings
cent in the riverside part of Millwall up to 66 per cent in part of Bromley by Bow. The majority of the borough’s LSOAs have CTB rates well above the London average.
Pensioner households and families withchildren are the two family types most likelyto be receiving Council Tax Benefit:
- 61 per cent of households with dependent children were on CTB compared with 26 per cent of households without children.
- 68 per cent of single pensioner households receive CTB.
Almost two thirds (63 per cent) ofhouseholds in social housing were receivingCTB compared with 16 per cent ofhouseholds in other tenures.
CTB households are typically larger in sizethan non-CTB households. For this reason,while just over a third of households are onCTB, at an individual level, almost half (47per cent) of the borough’s population live inhouseholds in receipt of CTB.
There are considerable ethnic differentialsin CTB claimant rates: 78 per cent ofBangladeshi residents live in CTBhouseholds compared with 33 per cent ofnon-Bangladeshi residents.
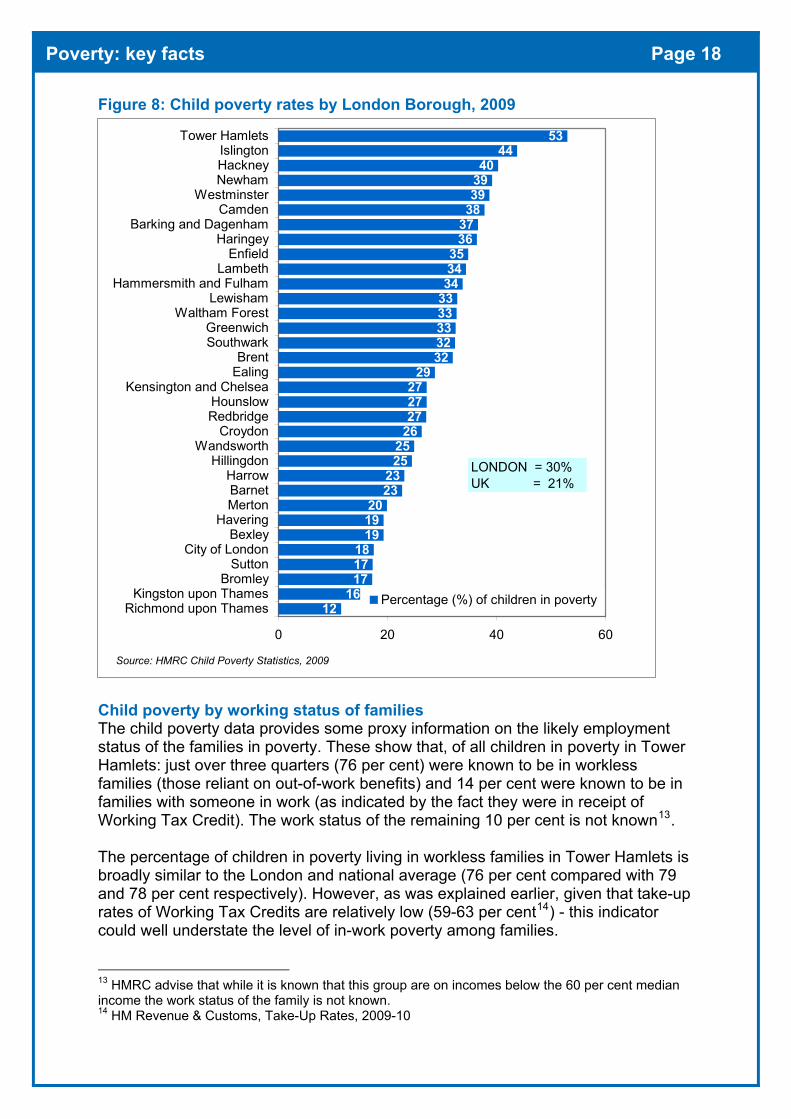
Child poverty rates 2009 The latest child poverty rates for 2009 showthat 29,680 children in Tower Hamlets livein poverty which represents 53 per cent ofall children - the highest rate in the UK4.The poverty rate measures the percentageof children who live in families in receipt ofout-of-work (means tested) benefits or inreceipt of tax credits where income is lessthan 60 per cent of median income.
Tower Hamlets is the only local authorityarea in the UK where the percentage ofchildren in poverty is more than half -Islington has the second highest rate at 44per cent.
Around one third of all children in poverty inTower Hamlets are from families with fouror more children – the highest proportion ofall UK local authorities. The percentage ofchildren in poverty rises with family size: 41per cent of children who live in one childfamilies are in poverty compared with 66per cent of those who live in families withfour or more children.
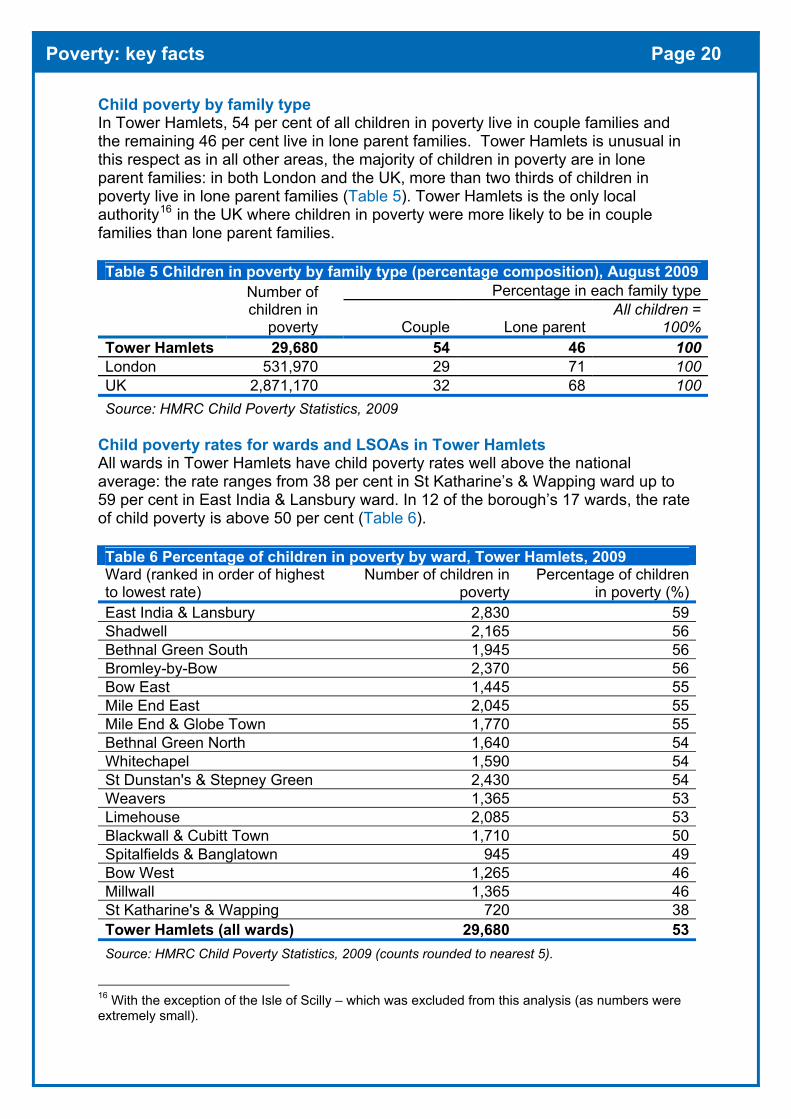
In Tower Hamlets, just over half (54 percent) of all children in poverty live in couplefamilies and the remaining 46 per cent livein lone parent families. Tower Hamlets isunusual in this respect as in all other localauthority areas – more children in povertylive in lone parent than couple families.
All wards in Tower Hamlets have childpoverty rates well above the nationalaverage (21 per cent): the rate ranges from38 per cent in St Katharine’s & Wapping upto 59 per cent in East India & Lansbury.
At Lower Super Output area level, there iseven more variation in rates: the childpoverty rate ranges from 4 per cent in partof Millwall (Canary Wharf area) up to 71 percent in part of Mile End East.
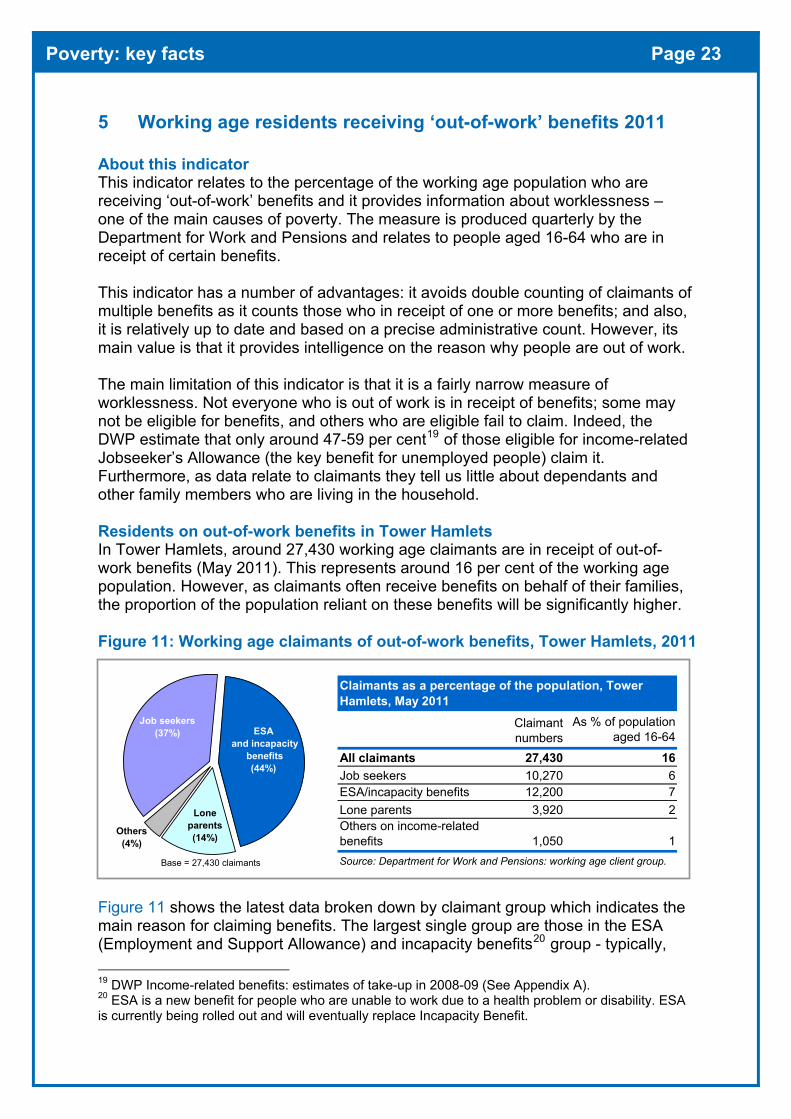
Residents receiving out-of-work benefits In Tower Hamlets, 27,430 working ageclaimants were in receipt of out-of-workbenefits as at May 20115 - this representsaround 16 per cent of the working agepopulation.
Out-of-work claimants comprise threegroups: those in the ESA6 and incapacitybenefits group who are unable to work dueto health problems and/or a disability (44per cent of all claimants); those in thejobseeker’s group who are unemployed andactively seeing work (37 per cent ofclaimants); and lastly, lone parents andothers on income-related benefits whocomprise just under one fifth of allclaimants.
Poverty: key facts Page 3 Summary of findings
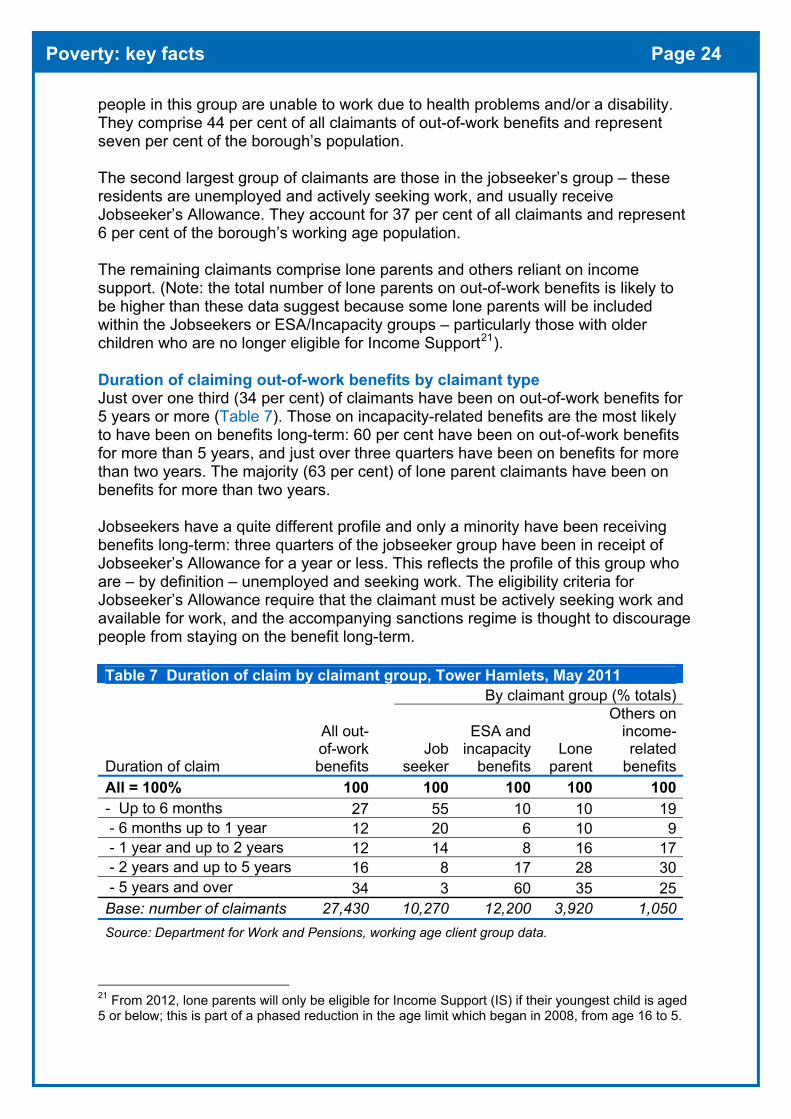
Over one third (34 per cent) of the out-of-work benefits group are have been onbenefits for 5 years or more. Those in theESA/Incapacity benefit group are theclaimant group most likely to be long-termclaimants: 60 per cent have been claimingbenefits for five or more years.
The percentage of working age residents onout-of-work benefits is high in TowerHamlets (16 per cent) relative to both thenational and London average - both 12 percent. Within London, the claim rate rangesfrom 3 per cent in the City of London up to19 per cent in Hackney. Tower Hamlets isranked 6th highest in London on thisindicator and has the same rate asGreenwich and Brent.
At ward level, the percentage of workingage residents claiming out-of-work benefitsranges from 10 per cent in Millwall up to 24per cent in East India & Lansbury; 15 out ofthe borough’s 17 wards have claim ratesabove the London average.
Pensioner poverty rates7
In May 2011, 9,820 of the borough’sresidents aged 60 and over claimed thePension Credit Guarantee – this is a meanstested benefit paid to pensioners living onlow incomes with little or no savings. Thisrepresents almost half (46 per cent) of allthe borough’s pensioners – the highestproportion in England and more than threetimes the national average (15 per cent).
All wards in the borough have PensionCredit Guarantee rates well above thenational average – the percentage rangesfrom 31 per cent in St Katherine’s &Wapping ward up to 65 per cent inSpitalfields & Banglatown ward.
Taking into account the partners ofclaimants, the percentage of the borough’spensioners who are reliant on the PensionCredit Guarantee rises to 56 per cent.Again, this is the highest rate in Englandand more than three times the nationalaverage (18 per cent).
Indices of Deprivation 2010 The Index of Multiple Deprivation (IMD)8
profiles the scale and severity of deprivationacross small areas in England. The indexaims to reflect the nature of multipledisadvantage in its widest sense, and isbased on 38 different indicators spanning arange of topics (eg income, employment,education, health, crime, housing).
The 2010 IMD shows that deprivation is verywidespread in Tower Hamlets: the majority(72 per cent) of the borough’s 130 LowerLevel Super Output Areas (LSOAs) are in themost deprived 20 per cent of LSOAsnationally.
Wards containing LSOAs with relatively highlevels of deprivation include: East India &Lansbury, Mile End East and Bromley byBow. In these wards, most or all of the LSOAsare in the 20 per cent most deprivednationally.
The average IMD score measure, whichreflects the average level of deprivationacross LSOAs in an area, shows that TowerHamlets is the 7th most deprived localauthority district in England out of 326 areas.On the IMD extent measure - which depictshow widespread levels of deprivation are inan area – Tower Hamlets is ranked 3rd mostdeprived in England.
The IMD is made up of seven ‘domains’ –one of which focuses on incomedeprivation. On this measure, almost twothirds (63 per cent) of all LSOAs in TowerHamlets fall into the 10 per cent mostincome deprived nationally - the highestpercentage of all local authorities inEngland.
Tower Hamlets also has the highestpercentage of both children and olderpeople living in income deprived families inEngland, consistent with the earlieranalysis.
Poverty: key facts Page 4 Summary of findings
Financial Inclusion Experian has developed a statistical model
that predicts levels of financial capability across the population and the likely need for money advice services9. The concept of financial capability is about having the confidence and skills to manage your finances and is an issue inextricably linked with poverty – as those in poverty are most at risk of the adverse consequences of poor financial decision making.
The 2010 Experian data show that the majority of postcode areas (71 per cent) in Tower Hamlets are areas where the population has high levels of financial vulnerability10 - almost three times higher than the London-wide percentage (26 per cent). This group are the most likely to be under-confident in financial matters, the most likely to be in debt and the least likely to have financial safety nets such as savings or insurance.
At ward level, the percentage of areas in the most vulnerable group ranges from 95 per cent in Bromley-by-Bow down to 29 per cent in St Katherine’s & Wapping.
ING direct11 has produced modelled
estimates of household savings levels at local authority level. These relate to the amount of readily accessible cash savings that households typically have.
In Tower Hamlets, the median household savings is £776, which compares with a UK figure more than four times higher - £3,225. Tower Hamlets has the fifth lowest savings levels in England and Wales after Manchester (£569), Hackney (£749), Islington (£751) and Lambeth (£753). Future work
This briefing has presented a range of data that illustrate the scale and severity of poverty in Tower Hamlets. The Corporate Research Unit is planning future work to explore poverty and welfare data in more detail. The analysis will be designed to
provide evidence to help assess the likely impacts of the welfare reforms taking place and, more specifically, to profile the groups most at risk as a result of these reforms.
Notes (Summary of findings)
1 Office for National Statistics, Model based estimates (2007/08), released November 2010. 2 Here, CTB data are drawn from the Mayhew Harper Associates (MHA) Tower Hamlets Population Study 2011 - these data may differ from CTB data obtained directly from the Council’s Benefits Team. 3 Tower Hamlets has 130 LSOAs and they typically cover a population of between 1,000-3,000 people. 4 HMRC, Child Poverty Statistics 2009 5 DWP benefit claimants working age client group dataset. Key out-of-work benefits include the groups: job seekers, ESA and incapacity benefits, lone parents and others on income related benefits. 6 Employment and Support Allowance is a new benefit being rolled out and is replacing Incapacity Benefit. 7 Pension credit rates presented here have been calculated by LBTH and are based on benefits data from the DWP and ONS 2010 population estimates. 8 CLG, Indices of Deprivation 2010 9 Experian Financial Capability data 2010 10 Most vulnerable groups are Experian segments 9-11 11 ING Direct, Consumer Savings Monitor, Q3 2011
Poverty: key facts Page 5
1 Introduction
Defining and measuring poverty There is no one single definition of what poverty means and how it should be measured. However, there is some consensus that poverty needs to be understood in relation to typical living standards in society. Professor Peter Townsend defines relative poverty as follows:
‘Individuals, families and groups in the population can be said to be in poverty when they lack the resources to obtain the types of diet, participate in the activities and have the living conditions and amenities which are customary, or are at least widely encouraged and approved, in the societies to which they belong. Their resources are so seriously below those commanded by the average individual of family, that they are, in effect, excluded from ordinary living patterns, customs and activities’ (Source: P Townsend, Poverty in the United Kingdom: a survey of household resources and standards of living, 1979, p31)
There are, of course, numerous ways to measure and profile the broad concept of poverty. The Government’s official statistics on poverty relate to income poverty and seek to measure the percentage of households who live below the ‘poverty line’ – this is commonly defined as incomes that are below 60 per cent of median or ‘middle’ incomes (though, in practice, various interpretations and measures exist). Other studies cast the net wider and explore concepts such as deprivation and exclusion, as well as related evidence about the underlying causes and consequences of poverty.
The scope of this report While there a considerable body of research and analysis about poverty measures at a national and regional level - local data is less readily available. This analysis aims to fill this gap and presents a range of evidence about the scale and nature of poverty in Tower Hamlets. The analysis includes direct measures of income poverty alongside a number of proxy measures which are useful in building intelligence about those most at risk of poverty. No one measure is favoured over another – they all provide insight about different aspects of poverty.
The data presented provide a snapshot of poverty in Tower Hamlets at a point in time and are the latest available. However, in practice, the various indicators span the period 2007-2011.
How this work relates to strategy development and needs assessments The analysis has been undertaken to inform the Council’s developing strategies on both financial inclusion and homelessness and will form part of the evidence base being prepared to underpin these strategies. The analysis is also intended to help with the updating of needs assessments across the Partnership, and to inform future work on the impacts of welfare reforms.
Measuring poverty – data quality There are various challenges in measuring poverty at a local level and no data source is perfect – they each have strengths and limitations. Common problems are:
Poverty: key facts Page 6
Some indicators are drawn from surveys or are modelled data. This meansthese data are estimates not precise measures - and as such - have a degreeof error attached to them.
Indicators based on benefits data are subject to potential undercounting - asnot everyone who is eligible for benefits claims them. Appendix A quantifiesthe extent of this problem in relation to income-related benefits and tax credits.This means, that benefits based indicators will inevitably understate the trueextent of income poverty in the borough.
Issues in relation to specific indicators are raised in the relevant sections. In short, data quality is inevitably variable and this is why it is sensible to consider a variety of different indicators on poverty – this way, we can assess whether the various indicators are painting a consistent picture.
A guide to the geographies used in this report To explore variations in poverty within the borough, where possible, data have been broken down into small areas. Three different geographical areas are used in this report (depending on data availability):
Wards: Tower Hamlets has 17 wards which relate to the Council’s electoral areas.
Middle Layer Super Output Areas (MSOAs): Tower Hamlets has 31 MSOAs - these areas are smaller than wards and vary in population size from between 5,000-10,000 residents. While most MSOAs nest within wards some cross ward boundaries.
Lower Layer Super Output Areas (LSOAs): LSOAs are small geographical areas used for statistical purposes. Tower Hamlets has 130 LSOAs and they typically cover a population of between 1,000-3,000 people. These areas nest within wards - each ward has between 5-9 LSOAs.
Structure of report The report covers the following indicators:
Section 2 Households in income poverty Section 3 Households on Council Tax Benefit Section 4 Child poverty rates Section 5 Working age adults on out-of-work benefits Section 6 Pensioner poverty Section 7 Indices of Deprivation 2010 Section 8 Financial inclusion
Appendix A summarises the latest data on take-up rates relating to benefits.
Copyright statement Maps in this report are based upon Ordnance Survey material with the permission of Ordnance Survey on behalf of Her Majesty’s Stationery Office © Crown Copyright (London Borough of Tower Hamlets 100019288 2012).
Poverty: key facts Page 7
2 Households in income poverty About this indicator This indicator provides an estimate of the proportion of households living under the poverty line at small area level. These data are modelled estimates produced by the Office for National Statistics (ONS). They were designed to be consistent with the survey based national and regional poverty figures produced by the Department for Work and Pensions1. The data fill an important gap in official statistics by providing a local poverty indicator to match the national measures the Government monitors. The data have three limitations: first, as the data are modelled estimates not precise measures they have a degree of error attached to them; second, they relate to 2007/08 so are not as timely as other indicators; third, the figures are ‘experimental’ which means the methodology may be subject to change in the future. Defining the poverty line On this indicator, households in poverty are defined as those living on income below 60 per cent of UK median income (equivalised) after housing costs. Equivalisation is a way of adjusting the data to provide a like for like comparison between different sizes and types of household (this accounts for the fact that smaller households need less to live on than larger families to achieve the same standard of living). Income relates to net income and relates to all sources of household income less certain deductions (eg tax), and after housing costs have been paid. Table 1 Equivalent money values of the ‘poverty line’ for different family types
UK weekly income (after housing costs)
Money values as at 2009/10 prices Median income
60% of median income: the poverty line
Single with no children £207 £124Couple with no children £356 £214Single with two children aged 5 & 14 £427 £256Couple with two children aged 5 & 14 £577 £346Couple with three children aged 5, 9 & 14 £648 £389Couple with four children aged 5, 9, 12 & 14 £719 £431Source: DWP, Households Below Average Income 2009/10 (Table 2.4ts and Appendix 2). Note: OECD equivalence scales conventionally take a couple with no children as the reference point.
Table 1 gives an idea of what the poverty line is for different family types (at 2009/10 prices). Using this measure, a couple with no children would be in poverty if their income after housing costs was less than £214 per week. Whereas, for a couple with three children, the poverty line would be higher (£389) – reflecting the fact they require more money to achieve the same standard of living.
1 Regional and national poverty data are from the Households Below Average Income dataset, which is derived from the Family Resources Survey (FRS). The FRS sample size is not large enough to produce estimates below regional level which is why these modelled estimates have been produced. The modelling draws on the regional level survey alongside localised administrative benefits data.

Poverty: key facts Page 8
Income poverty estimates for local authority areas In Tower Hamlets, the estimates for 2007/08, suggest that around 44 per cent of households are in income poverty (ie are living on incomes below 60 per cent of the average UK income, after housing costs). This is the highest poverty rate of all local authorities in England and Wales and double the national average (22 per cent). Applying this rate to the current number of households in the borough would suggest around 46,000 Tower Hamlets households are in poverty2. Newham has the second highest poverty rate (39 per cent) followed by Leicester and Hackney (both 37 per cent). London boroughs and other metropolitan areas make up the ten areas with the highest poverty rates nationally (Figure 1). At the other end of the spectrum, areas in the South East and East of England regions dominate the list of areas with low poverty rates. Hart (Hampshire) is the area with the lowest rate in England and Wales – where 10 per cent of households are in poverty, closely followed by Wokingham, Surrey Heath and South Cambridgeshire (with rates of 11-12 per cent). Figure 1: The ten local authority areas with the highest average proportion of households in poverty (in England and Wales), 2007/08
30
31
32
32
33
33
37
37
39
44
0 10 20 30 40 5
Barking and Dagenham
Nottingham
Southwark
Brent
Manchester
Birmingham
Hackney
Leicester
Newham
Tower Hamlets
0
Percentage of households in poverty (average across MSOAs)
Source: Office for National Statistics; Model based estimates of poverty at MSOA Level, 2007/2008
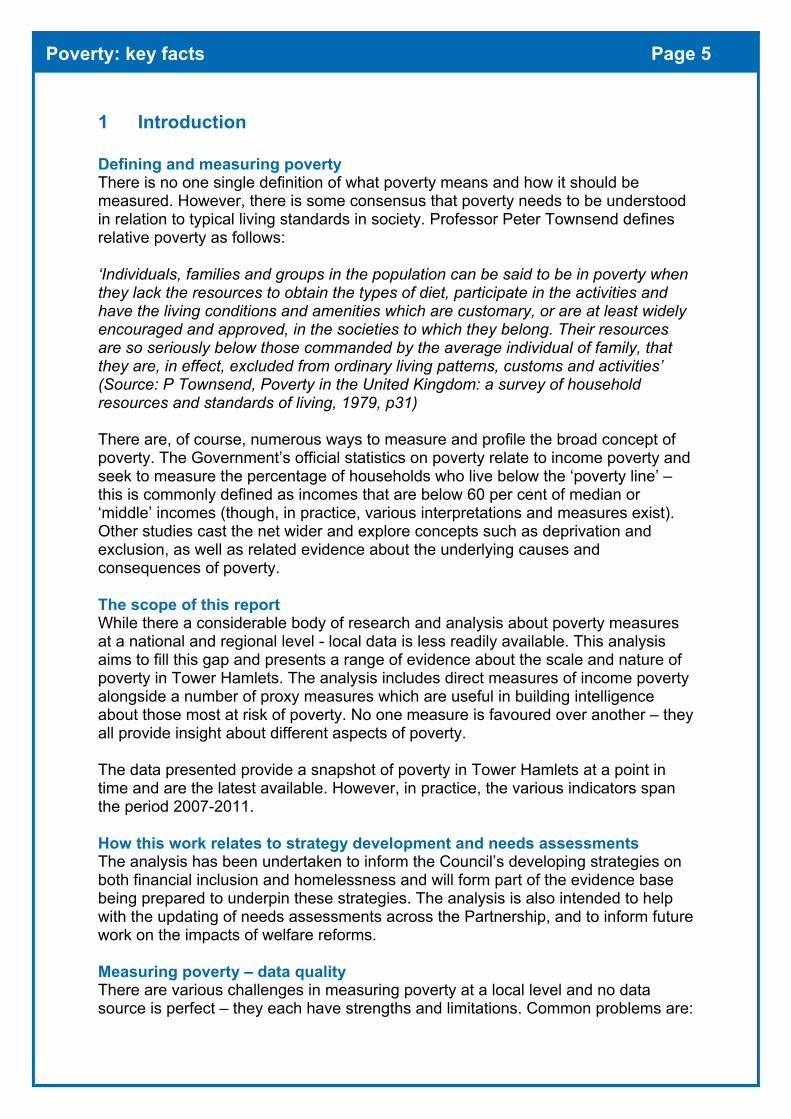
Poverty rates within Tower Hamlets at MSOA level The 44 per cent figure for Tower Hamlets is a simple average3 of the rate across the 31 Middle Layer Super Output Areas (MSOAs) in the borough. Figure 2 shows the poverty estimates for MSOAs in the borough alongside the confidence intervals attached to the estimates. Figure 3 shows the same data mapped by area. The data highlight the widespread nature of poverty in Tower Hamlets – in most areas (28 out of the 31 MSOAs) the poverty rate is above the London average of 26 per cent. The three areas with below average rates are all riverside areas.
2 Estimate based on the total number of households in Tower Hamlets (104,935) as at March 2011 (Source: Mayhew Harpers Associates Tower Hamlets population study). 3 This average is a mean measure of the MSOA poverty rates divided by the number of MSOAs. This is a ‘crude’ average as it does not account for the fact that MSOA’s may differ in population size. For more detail on methodology - see Regional Trends 43.

Poverty: key facts Page 9
The data also highlight the unusually high levels of poverty across the borough – in 12 of the 31 MSOAs in Tower Hamlets, more than one half of households are in poverty. Across the 31 MSOAs, the percentage of households living in income poverty ranges from 12 per cent in the riverside area of St Katherine’s & Wapping ward up to 66 per cent in part of Whitechapel (the highest rate in London). However, these individual MSOA estimates do need interpreted with some caution due to their sizeable confidence intervals4. For example, the true figure for Whitechapel (west) could be up to 10-12 percentage points lower or higher than the estimate suggests. Figure 2: Percentage of households in poverty in Tower Hamlets by Middle Layer Super Output Areas (MSOAs), 2007/08
4 Confidence intervals allow us to take a view, based on statistical probability theory, about how close an estimate is likely to be to the true value. Here, the ONS modelled estimates are subject to some uncertainty due to both survey sampling and the modelling process; eg for Whitechapel (west), the confidence interval is 54 to 76 per cent - therefore we can be 95% confident that the true income poverty figure for Whitechapel West lies within this range.
1219
252828
32333333
38394142424445474749
5354555556565859595961
66
0 20 40 60 80
St Katharine's and Wapping (riverside)Millwall (south)
Blackwall and Cubitt Town (south)Bow West (part)
Bow East / Bow WestSt Katharine's and Wapping (north)
Millwall (north)Blackwall and Cubitt Town (north)
Limehouse (west)Mile End and Globe Town (west)
Weavers (north)Bow East (part)
Bethnal Green North (west)Shadwell (south)
Whitechapel (east)Bethnal Green South (west)Bethnal Green North (east)
St Dunstan's and Stepney Green (west)East India and Lansbury (east)
Mile End and Globe Town (east)Mile End East / Bromley By BowEast India and Lansbury (west)
Weavers (south)Mile End East (part)
Limehouse (east)Shadwell (North)
St Dunstan's and Stepney Green (east)Bromley-by-Bow (east)
Spitalfields and BanglatownBethnal Green South (east)
Whitechapel (west)
% households in income poverty
Size of confidence interval attached to estimate
Source: Office for National Statistics; Model based estimates of poverty at MSOA Level, 2007/2008
Middle Layer Super Output Areas:
London average= 26%
Poverty: key facts Page 10
Figure 3: The percentage of households in income poverty, Tower Hamlets: Middle Layer Super Output Areas, 2007/2008 (Note: this map shows MSOA areas but ward names are shown to aid navigation) Figure 4: Percentage of households in poverty, London Boroughs, 2007/08
0
10
20
30
40
50
60
70
Tower
Hamlet
s
Newha
m
Hackn
eyBren
t
Southw
ark
Barking
& D
agen
ham
Haring
ey
Walt
ham Fore
st
Isling
ton
Enfield
Lambe
th
Lewish
am
Greenw
ichEali
ng
Houns
low
Redbri
dge
Camde
n
Harrow
Barnet
Croydo
n
Hillingd
on
Wes
tmins
ter
Hammers
mith &
Fulham
Kensin
gton &
Che
lsea
Wan
dswort
h
Merton
Bexley
Sutton
Haveri
ng
Bromley
Kingsto
n upo
n Tha
mes
Richmon
d upo
n Tha
mes
Source: Office for National Statistics; Model Based Estimates of poverty at MSOA Level, 2007/2008
Average rate (across MSOAs in borough)Range of poverty rates (across MSOAs in borough)
© Crown copyright and database rights 2012 Ordnance Survey, London Borough of Tower Hamlets 100019288.

Poverty: key facts Page 11
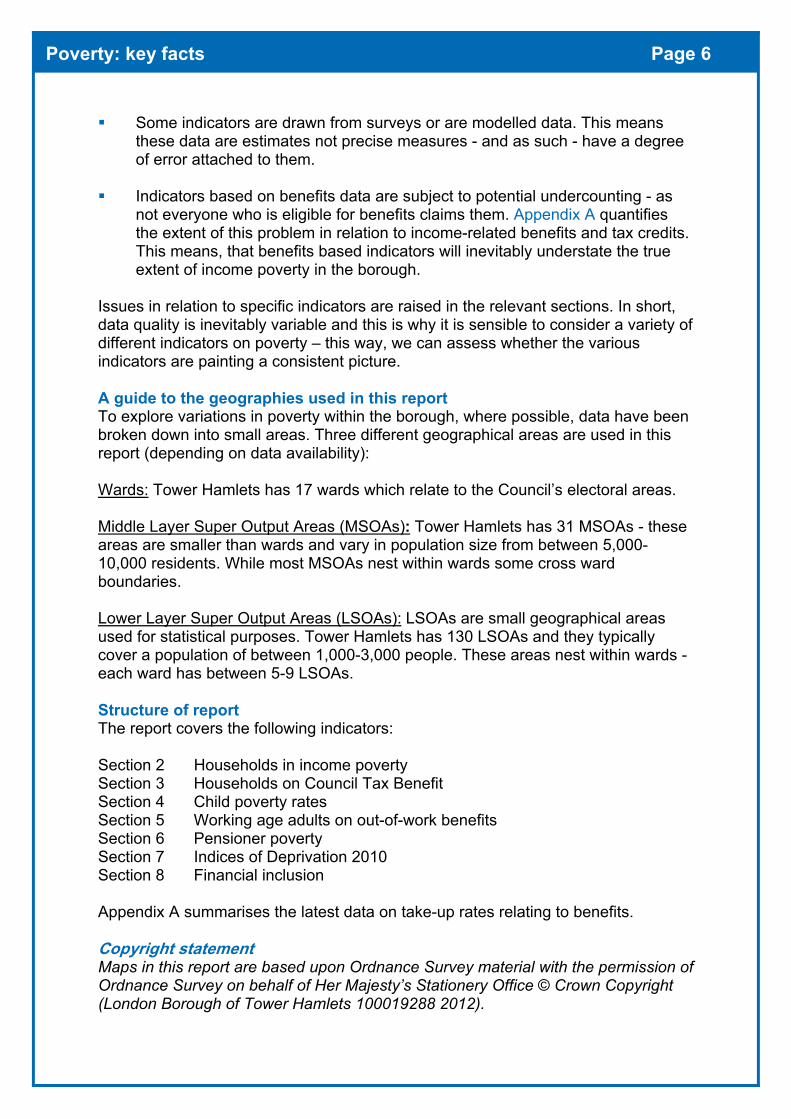
Income poverty rates compared for London Boroughs Across London Boroughs, the poverty rate ranges from 14 per cent in Richmond upon Thames up to 44 per cent in Tower Hamlets5. Figure 4 shows the spread of poverty rates for MSOAs within each London Borough. The chart shows that Tower Hamlets has the largest spread of rates at MSOA level. The difference between the highest and lowest poverty rate in Tower Hamlets is 54 percentage points compared with only 15 percentage points in Richmond upon Thames (where all MSOAs have poverty rates below the London average). Newham has the second highest poverty rate in London at 39 per cent but the spread of rates (24 percentage points) is far narrower than that of Tower Hamlets. Hackney has the third highest rate with a spread of 32 percentage points – which is fairly typical for London. Tower Hamlets is – by far - the most polarised London borough on this particular measure. Further information Data on income poverty can be downloaded directly from ONS neighbourhood statistics website. For more detail on the methodology used to produce the estimates, see journal article: Understanding household income poverty and small area level, Regional Trends 43, November 2010. Web-link: http://www.ons.gov.uk/ons/rel/regional-trends/regional-trends/no--43--2011-edition/understanding-household-income-poverty-at-small-area-level.pdf.
5 Data for the City of London are included in the calculation of London-wide averages but are excluded from the borough level analysis (as there is only one MSOA in the City).
Poverty: key facts Page 12
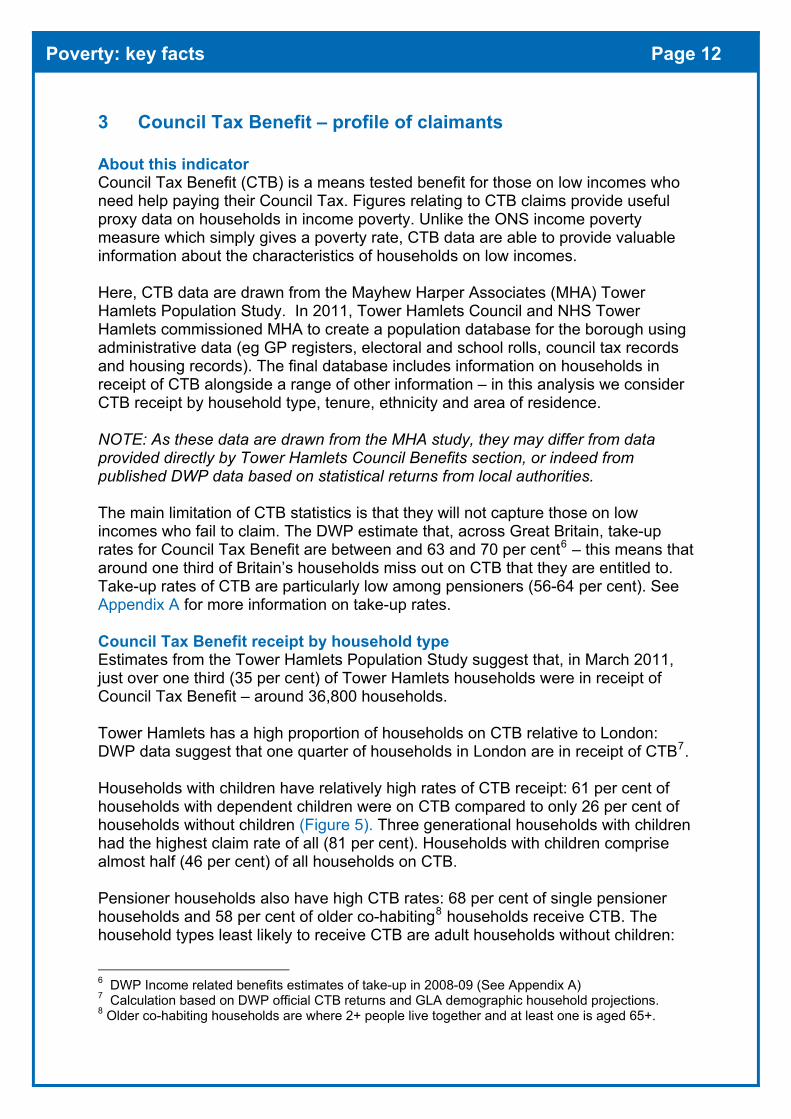
3 Council Tax Benefit – profile of claimants About this indicator Council Tax Benefit (CTB) is a means tested benefit for those on low incomes who need help paying their Council Tax. Figures relating to CTB claims provide useful proxy data on households in income poverty. Unlike the ONS income poverty measure which simply gives a poverty rate, CTB data are able to provide valuable information about the characteristics of households on low incomes. Here, CTB data are drawn from the Mayhew Harper Associates (MHA) Tower Hamlets Population Study. In 2011, Tower Hamlets Council and NHS Tower Hamlets commissioned MHA to create a population database for the borough using administrative data (eg GP registers, electoral and school rolls, council tax records and housing records). The final database includes information on households in receipt of CTB alongside a range of other information – in this analysis we consider CTB receipt by household type, tenure, ethnicity and area of residence. NOTE: As these data are drawn from the MHA study, they may differ from data provided directly by Tower Hamlets Council Benefits section, or indeed from published DWP data based on statistical returns from local authorities. The main limitation of CTB statistics is that they will not capture those on low incomes who fail to claim. The DWP estimate that, across Great Britain, take-up rates for Council Tax Benefit are between and 63 and 70 per cent6 – this means that around one third of Britain’s households miss out on CTB that they are entitled to. Take-up rates of CTB are particularly low among pensioners (56-64 per cent). See Appendix A for more information on take-up rates. Council Tax Benefit receipt by household type Estimates from the Tower Hamlets Population Study suggest that, in March 2011, just over one third (35 per cent) of Tower Hamlets households were in receipt of Council Tax Benefit – around 36,800 households. Tower Hamlets has a high proportion of households on CTB relative to London: DWP data suggest that one quarter of households in London are in receipt of CTB7. Households with children have relatively high rates of CTB receipt: 61 per cent of households with dependent children were on CTB compared to only 26 per cent of households without children (Figure 5). Three generational households with children had the highest claim rate of all (81 per cent). Households with children comprise almost half (46 per cent) of all households on CTB. Pensioner households also have high CTB rates: 68 per cent of single pensioner households and 58 per cent of older co-habiting8 households receive CTB. The household types least likely to receive CTB are adult households without children:
6 DWP Income related benefits estimates of take-up in 2008-09 (See Appendix A) 7 Calculation based on DWP official CTB returns and GLA demographic household projections. 8 Older co-habiting households are where 2+ people live together and at least one is aged 65+.
Poverty: key facts Page 13
20 per cent of single adult households receive CTB and 18 per cent of households with two or more adults living together (or sharing) receive CTB. Those living in social housing are far more likely than other households to be on CTB: the percentage of households in social housing who are on CTB is 63 per cent compared with 16 per cent of households in other tenures. Households in social housing comprise almost three quarters (72 per cent) of all CTB households. Figure 5: Percentage of households in receipt of CTB by household type and tenure, Tower Hamlets, 2011
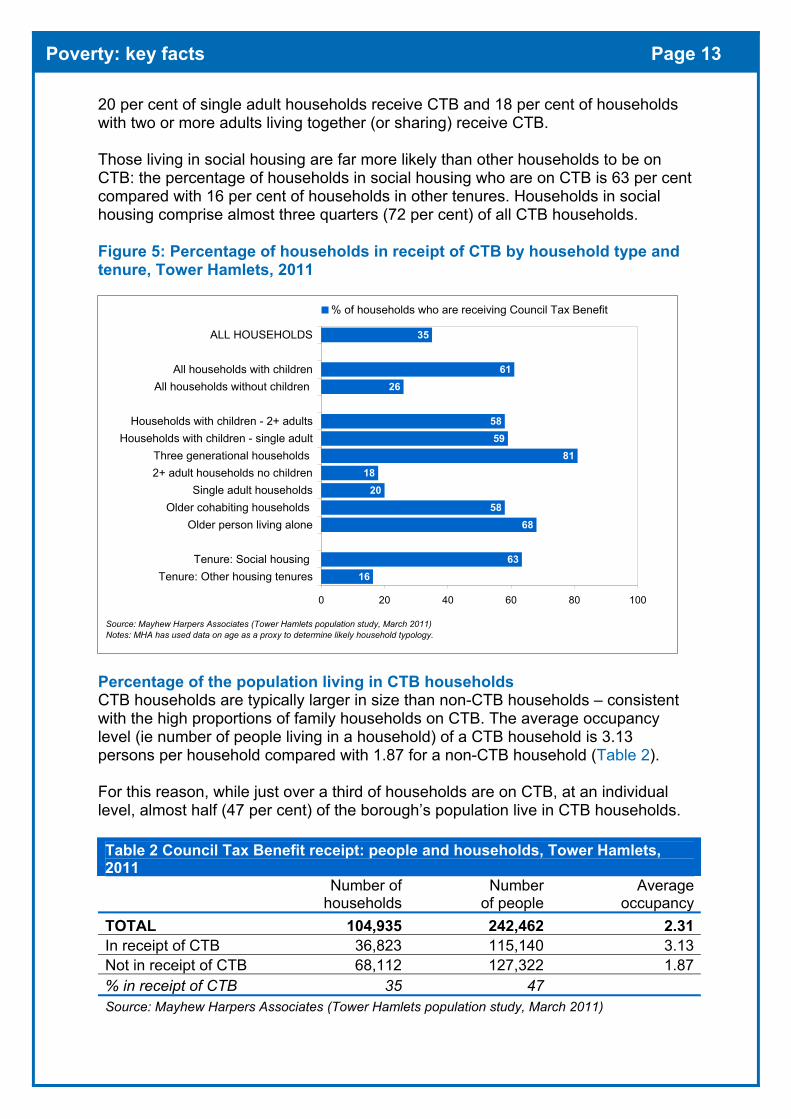
Percentage of the population living in CTB households CTB households are typically larger in size than non-CTB households – consistent with the high proportions of family households on CTB. The average occupancy level (ie number of people living in a household) of a CTB household is 3.13 persons per household compared with 1.87 for a non-CTB household (Table 2). For this reason, while just over a third of households are on CTB, at an individual level, almost half (47 per cent) of the borough’s population live in CTB households. Table 2 Council Tax Benefit receipt: people and households, Tower Hamlets, 2011
Number of
householdsNumber
of peopleAverage
occupancyTOTAL 104,935 242,462 2.31In receipt of CTB 36,823 115,140 3.13Not in receipt of CTB 68,112 127,322 1.87% in receipt of CTB 35 47 Source: Mayhew Harpers Associates (Tower Hamlets population study, March 2011)
1663
6858
2018
8159
58
2661
35
0 20 40 60 80 100
Tenure: Other housing tenuresTenure: Social housing
Older person living alone Older cohabiting households
Single adult households 2+ adult households no children Three generational households
Households with children - single adult Households with children - 2+ adults
All households without children All households with children
ALL HOUSEHOLDS
% of households who are receiving Council Tax Benefit
Source: Mayhew Harpers Associates (Tower Hamlets population study, March 2011)Notes: MHA has used data on age as a proxy to determine likely household typology.
Poverty: key facts Page 14
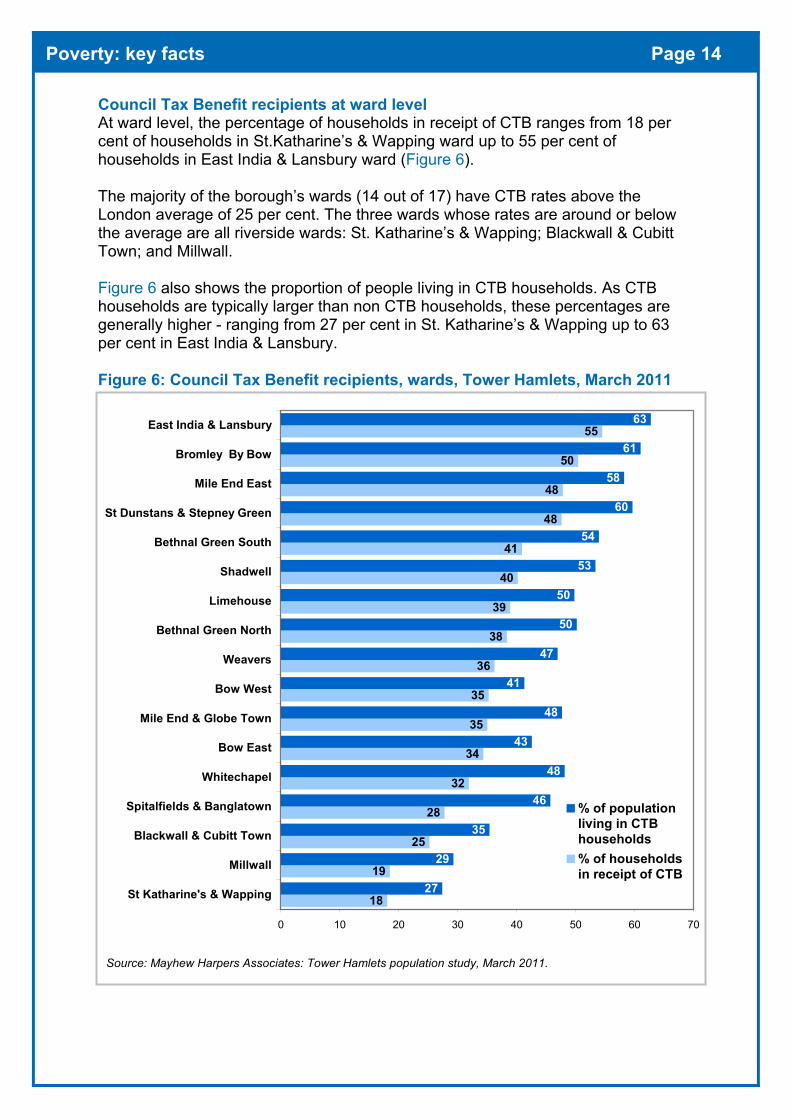
Council Tax Benefit recipients at ward level At ward level, the percentage of households in receipt of CTB ranges from 18 per cent of households in St.Katharine’s & Wapping ward up to 55 per cent of households in East India & Lansbury ward (Figure 6). The majority of the borough’s wards (14 out of 17) have CTB rates above the London average of 25 per cent. The three wards whose rates are around or below the average are all riverside wards: St. Katharine’s & Wapping; Blackwall & Cubitt Town; and Millwall. Figure 6 also shows the proportion of people living in CTB households. As CTB households are typically larger than non CTB households, these percentages are generally higher - ranging from 27 per cent in St. Katharine’s & Wapping up to 63 per cent in East India & Lansbury. Figure 6: Council Tax Benefit recipients, wards, Tower Hamlets, March 2011
18
19
25
28
32
34
35
35
36
38
39
40
41
48
48
50
55
27
29
35
46
48
43
48
41
47
50
50
53
54
60
58
61
63
0 10 20 30 40 50 60
St Katharine's & Wapping
Millwall
Blackwall & Cubitt Town
Spitalfields & Banglatown
Whitechapel
Bow East
Mile End & Globe Town
Bow West
Weavers
Bethnal Green North
Limehouse
Shadwell
Bethnal Green South
St Dunstans & Stepney Green
Mile End East
Bromley By Bow
East India & Lansbury
70
% of populationliving in CTBhouseholds% of householdsin receipt of CTB
Source: Mayhew Harpers Associates: Tower Hamlets population study, March 2011.
Poverty: key facts Page 15
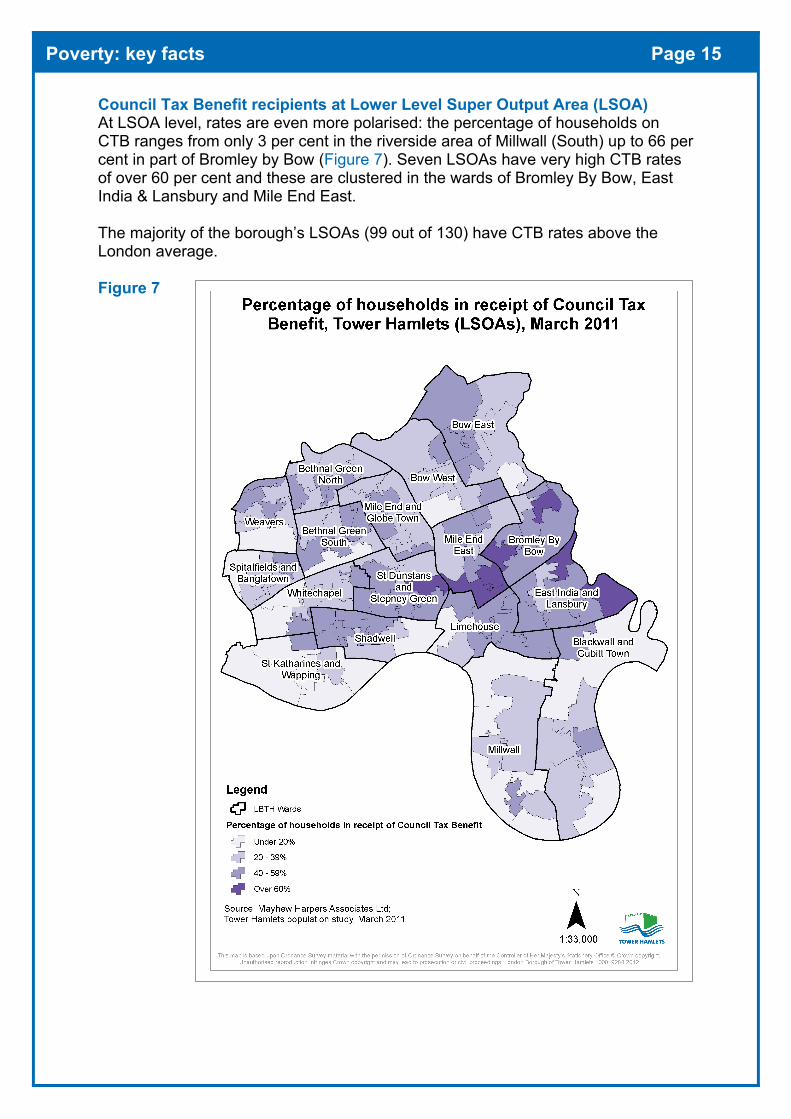
Council Tax Benefit recipients at Lower Level Super Output Area (LSOA) At LSOA level, rates are even more polarised: the percentage of households on CTB ranges from only 3 per cent in the riverside area of Millwall (South) up to 66 per cent in part of Bromley by Bow (Figure 7). Seven LSOAs have very high CTB rates of over 60 per cent and these are clustered in the wards of Bromley By Bow, East India & Lansbury and Mile End East. The majority of the borough’s LSOAs (99 out of 130) have CTB rates above the London average. Figure 7
Poverty: key facts Page 16
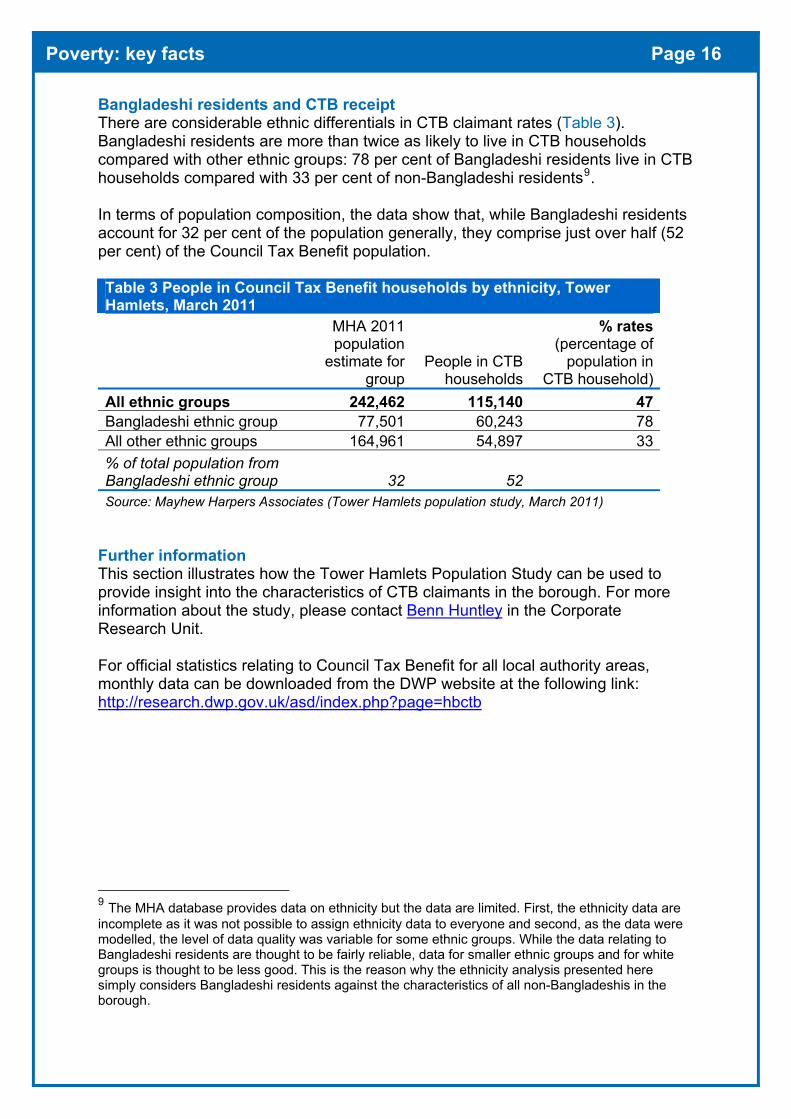
Bangladeshi residents and CTB receipt There are considerable ethnic differentials in CTB claimant rates (Table 3). Bangladeshi residents are more than twice as likely to live in CTB households compared with other ethnic groups: 78 per cent of Bangladeshi residents live in CTB households compared with 33 per cent of non-Bangladeshi residents9. In terms of population composition, the data show that, while Bangladeshi residents account for 32 per cent of the population generally, they comprise just over half (52 per cent) of the Council Tax Benefit population. Table 3 People in Council Tax Benefit households by ethnicity, Tower Hamlets, March 2011
MHA 2011 population
estimate for group
People in CTB households
% rates (percentage of
population in CTB household)
All ethnic groups 242,462 115,140 47 Bangladeshi ethnic group 77,501 60,243 78 All other ethnic groups 164,961 54,897 33 % of total population from Bangladeshi ethnic group 32 52 Source: Mayhew Harpers Associates (Tower Hamlets population study, March 2011)
Further information This section illustrates how the Tower Hamlets Population Study can be used to provide insight into the characteristics of CTB claimants in the borough. For more information about the study, please contact Benn Huntley in the Corporate Research Unit. For official statistics relating to Council Tax Benefit for all local authority areas, monthly data can be downloaded from the DWP website at the following link: http://research.dwp.gov.uk/asd/index.php?page=hbctb
9 The MHA database provides data on ethnicity but the data are limited. First, the ethnicity data are incomplete as it was not possible to assign ethnicity data to everyone and second, as the data were modelled, the level of data quality was variable for some ethnic groups. While the data relating to Bangladeshi residents are thought to be fairly reliable, data for smaller ethnic groups and for white groups is thought to be less good. This is the reason why the ethnicity analysis presented here simply considers Bangladeshi residents against the characteristics of all non-Bangladeshis in the borough.
Poverty: key facts Page 17
4 Child poverty rates About this indicator There are different ways to measure child poverty, but at a borough level, the most commonly used measure is the HM Revenue & Customs (HMRC) child poverty rate which is based on benefits records. This measure is different from the survey based measure the Government uses to measure regional and national child poverty rates. The latest data relate to August 2009 and measure: the proportion of children living in families in receipt of out-of-work (means tested) benefits10 or those in receipt of tax credits where their reported income is less than 60 per cent of median income. The definition of children used refers all those aged under 16 and dependent children aged between 16-19 (these include children still in full-time education who live with their parents). Data on child benefit claimants are used to estimate the number of dependent children living in each area so that poverty rates can be calculated. The main strength of this indicator is that it is entirely based on administrative counts so it is a precise measure of those on particular benefits. However, it should be borne in mind that it will fail to capture children in families who may be living in poverty but are not in receipt of such benefits. Indeed, HMRC data show that take-up rates of Working Tax Credits are relatively low at between 59-63 per cent11 suggesting that many families fail to claim tax credits they are entitled to. This means the child poverty indicator is likely to understate the level of in-work poverty among families - see Appendix A. Children poverty rates for London Boroughs The HMRC data for August 2009 show that 29,680 children in Tower Hamlets live in poverty – this represents 53 per cent of all children in the borough and is the highest child poverty rate in the UK12. The borough’s child poverty rate is more than double the rate nationally (21 per cent), and well above the London average of 30 per cent. At a regional level, London has the highest rate of child poverty across the UK – double the rate in the South East region (15 per cent). Tower Hamlets is the only local authority area in the UK where the percentage of children in poverty is more than half and it is the highest rate by some way - the second highest rate is Islington at 44 per cent. Figure 8 shows child poverty rates for all London Boroughs and the chart illustrates the massive variation in rates across the capital: the child poverty rate in Tower Hamlets is more than four times higher than the rate in Richmond (12 per cent). Across the UK, Tower Hamlets, Islington and Hackney have the highest rates, closely followed by Manchester and Newham. 10 Out-of-work benefits include: Income Support, Jobseeker’s Allowance, Employment and Support Allowance / Incapacity Benefit and Pension Credit. The measure is equivalised to take account of differences in household type and composition, but unlike the income poverty measure, no adjustment is made for housing costs. 11 HM Revenue & Customs, Take-Up Rates, 2009-10 12 HM Revenue & Customs, Child Poverty Statistics 2009; (revised definition, former NI 116).
Poverty: key facts Page 18
Figure 8: Child poverty rates by London Borough, 2009
Child poverty by working status of families The child poverty data provides some proxy information on the likely employment status of the families in poverty. These show that, of all children in poverty in Tower Hamlets: just over three quarters (76 per cent) were known to be in workless families (those reliant on out-of-work benefits) and 14 per cent were known to be in families with someone in work (as indicated by the fact they were in receipt of Working Tax Credit). The work status of the remaining 10 per cent is not known13. The percentage of children in poverty living in workless families in Tower Hamlets is broadly similar to the London and national average (76 per cent compared with 79 and 78 per cent respectively). However, as was explained earlier, given that take-up rates of Working Tax Credits are relatively low (59-63 per cent14) - this indicator could well understate the level of in-work poverty among families. 13 HMRC advise that while it is known that this group are on incomes below the 60 per cent median income the work status of the family is not known. 14 HM Revenue & Customs, Take-Up Rates, 2009-10
1216
171718
191920
2323
2525
26272727
293232333333343435
363738393940
4453
0 20 40 60
Richmond upon ThamesKingston upon Thames
BromleySutton
City of LondonBexley
HaveringMertonBarnet
HarrowHillingdon
WandsworthCroydon
RedbridgeHounslow
Kensington and ChelseaEalingBrent
SouthwarkGreenwich
Waltham ForestLewisham
Hammersmith and FulhamLambeth
EnfieldHaringey
Barking and DagenhamCamden
WestminsterNewhamHackneyIslington
Tower Hamlets
Percentage (%) of children in poverty
Source: HMRC Child Poverty Statistics, 2009
LONDON = 30%UK = 21%
Poverty: key facts Page 19
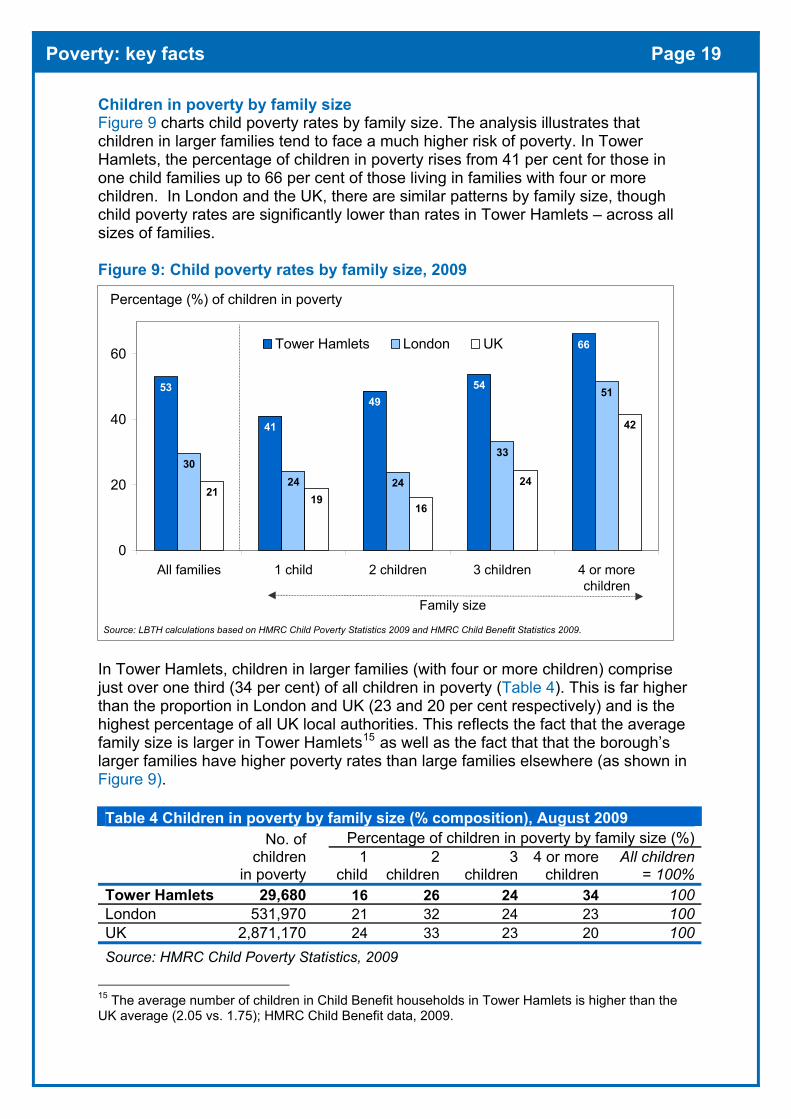
Children in poverty by family size Figure 9 charts child poverty rates by family size. The analysis illustrates that children in larger families tend to face a much higher risk of poverty. In Tower Hamlets, the percentage of children in poverty rises from 41 per cent for those in one child families up to 66 per cent of those living in families with four or more children. In London and the UK, there are similar patterns by family size, though child poverty rates are significantly lower than rates in Tower Hamlets – across all sizes of families. Figure 9: Child poverty rates by family size, 2009
In Tower Hamlets, children in larger families (with four or more children) comprise just over one third (34 per cent) of all children in poverty (Table 4). This is far higher than the proportion in London and UK (23 and 20 per cent respectively) and is the highest percentage of all UK local authorities. This reflects the fact that the average family size is larger in Tower Hamlets15 as well as the fact that that the borough’s larger families have higher poverty rates than large families elsewhere (as shown in Figure 9). Table 4 Children in poverty by family size (% composition), August 2009
Percentage of children in poverty by family size (%)
No. of children
in poverty 1
child2
children3
children4 or more
children All children
= 100%Tower Hamlets 29,680 16 26 24 34 100London 531,970 21 32 24 23 100UK 2,871,170 24 33 23 20 100Source: HMRC Child Poverty Statistics, 2009
15 The average number of children in Child Benefit households in Tower Hamlets is higher than the UK average (2.05 vs. 1.75); HMRC Child Benefit data, 2009.
53
41
4954
66
3024 24
33
51
21 1916
24
42
0
20
40
60
All families 1 child 2 children 3 children 4 or morechildren
Tower Hamlets London UK
Percentage (%) of children in poverty
Family size
Source: LBTH calculations based on HMRC Child Poverty Statistics 2009 and HMRC Child Benefit Statistics 2009.
Poverty: key facts Page 20
Child poverty by family type In Tower Hamlets, 54 per cent of all children in poverty live in couple families and the remaining 46 per cent live in lone parent families. Tower Hamlets is unusual in this respect as in all other areas, the majority of children in poverty are in lone parent families: in both London and the UK, more than two thirds of children in poverty live in lone parent families (Table 5). Tower Hamlets is the only local authority16 in the UK where children in poverty were more likely to be in couple families than lone parent families. Table 5 Children in poverty by family type (percentage composition), August 2009 Percentage in each family type
Number of children in
poverty Couple Lone parent All children =
100%Tower Hamlets 29,680 54 46 100London 531,970 29 71 100UK 2,871,170 32 68 100Source: HMRC Child Poverty Statistics, 2009
Child poverty rates for wards and LSOAs in Tower Hamlets All wards in Tower Hamlets have child poverty rates well above the national average: the rate ranges from 38 per cent in St Katharine’s & Wapping ward up to 59 per cent in East India & Lansbury ward. In 12 of the borough’s 17 wards, the rate of child poverty is above 50 per cent (Table 6). Table 6 Percentage of children in poverty by ward, Tower Hamlets, 2009 Ward (ranked in order of highest to lowest rate)
Number of children in poverty
Percentage of children in poverty (%)
East India & Lansbury 2,830 59Shadwell 2,165 56Bethnal Green South 1,945 56Bromley-by-Bow 2,370 56Bow East 1,445 55Mile End East 2,045 55Mile End & Globe Town 1,770 55Bethnal Green North 1,640 54Whitechapel 1,590 54St Dunstan's & Stepney Green 2,430 54Weavers 1,365 53Limehouse 2,085 53Blackwall & Cubitt Town 1,710 50Spitalfields & Banglatown 945 49Bow West 1,265 46Millwall 1,365 46St Katharine's & Wapping 720 38Tower Hamlets (all wards) 29,680 53Source: HMRC Child Poverty Statistics, 2009 (counts rounded to nearest 5).
16 With the exception of the Isle of Scilly – which was excluded from this analysis (as numbers were extremely small).
Poverty: key facts Page 21
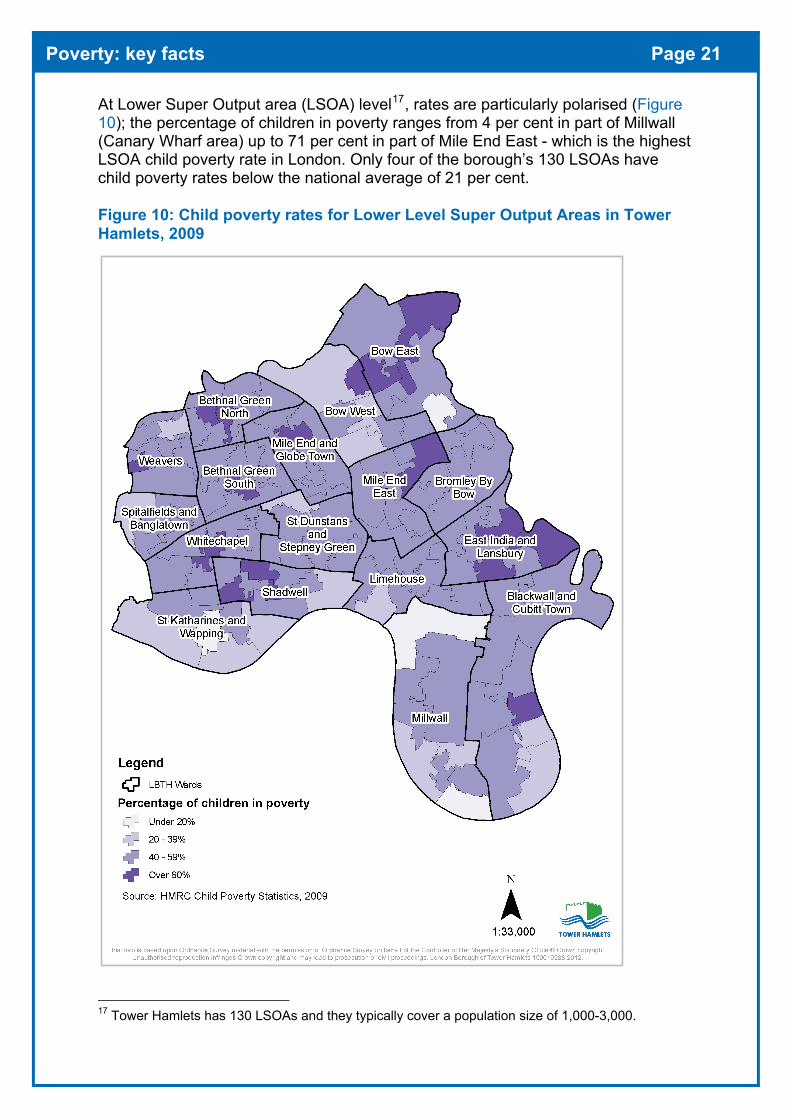
At Lower Super Output area (LSOA) level17, rates are particularly polarised (Figure 10); the percentage of children in poverty ranges from 4 per cent in part of Millwall (Canary Wharf area) up to 71 per cent in part of Mile End East - which is the highest LSOA child poverty rate in London. Only four of the borough’s 130 LSOAs have child poverty rates below the national average of 21 per cent. Figure 10: Child poverty rates for Lower Level Super Output Areas in Tower Hamlets, 2009
17 Tower Hamlets has 130 LSOAs and they typically cover a population size of 1,000-3,000.

Poverty: key facts Page 22
Areas in Tower Hamlets dominate the list of London LSOAs with the highest levels of poverty: the top percentile (ie the highest one per cent) of London’s LSOAs have child poverty rates of between 59-71 per cent and areas in Tower Hamlets comprise around one half of these areas. Recent GLA analysis of patterns of child poverty at LSOA level across London, confirms that Tower Hamlets has some of the highest concentrations of child poverty in London18. Further information A full set of child poverty data for local authorities can be downloaded directly from the HMRC web-site: http://www.hmrc.gov.uk/stats/personal-tax-credits/child_poverty.htm The GLA has produced a useful London-wide analysis of the HMRC data: Children in Poverty, Update 14-2011: http://www.london.gov.uk/who-runs-london/mayor/publications/society/facts-and-figures/poverty The Council produced a Child Poverty Needs Assessment for the borough in 2010. While some of the data have now been superseded, the assessment provides a far more in-depth analysis of the extent and nature of child poverty in Tower Hamlets than is provided here. The assessment is available on the Council’s website at the following link: http://www.towerhamlets.gov.uk/idoc.ashx?docid=d7bda100-561d-4a04-9c04-c8a278173a16&version=-1
18 Greater London Authority, Children in Poverty, Intelligence Update 14-2011.
Poverty: key facts Page 23
5 Working age residents receiving ‘out-of-work’ benefits 2011
About this indicator This indicator relates to the percentage of the working age population who are receiving ‘out-of-work’ benefits and it provides information about worklessness – one of the main causes of poverty. The measure is produced quarterly by the Department for Work and Pensions and relates to people aged 16-64 who are in receipt of certain benefits.
This indicator has a number of advantages: it avoids double counting of claimants of multiple benefits as it counts those who in receipt of one or more benefits; and also, it is relatively up to date and based on a precise administrative count. However, its main value is that it provides intelligence on the reason why people are out of work.
The main limitation of this indicator is that it is a fairly narrow measure of worklessness. Not everyone who is out of work is in receipt of benefits; some may not be eligible for benefits, and others who are eligible fail to claim. Indeed, the DWP estimate that only around 47-59 per cent19 of those eligible for income-related Jobseeker’s Allowance (the key benefit for unemployed people) claim it. Furthermore, as data relate to claimants they tell us little about dependants and other family members who are living in the household.
Residents on out-of-work benefits in Tower Hamlets In Tower Hamlets, around 27,430 working age claimants are in receipt of out-of-work benefits (May 2011). This represents around 16 per cent of the working age population. However, as claimants often receive benefits on behalf of their families, the proportion of the population reliant on these benefits will be significantly higher.
Figure 11: Working age claimants of out-of-work benefits, Tower Hamlets, 2011
Figure 11 shows the latest data broken down by claimant group which indicates the main reason for claiming benefits. The largest single group are those in the ESA (Employment and Support Allowance) and incapacity benefits20 group - typically,
19 DWP Income-related benefits: estimates of take-up in 2008-09 (See Appendix A). 20 ESA is a new benefit for people who are unable to work due to a health problem or disability. ESA is currently being rolled out and will eventually replace Incapacity Benefit.
Job seekers(37%)
Others (4%)
ESA and incapacity
benefits(44%)
Lone parents (14%)
Base = 27,430 claimants
Claimant numbers
As % of population aged 16-64
All claimants 27,430 16Job seekers 10,270 6ESA/incapacity benefits 12,200 7Lone parents 3,920 2Others on income-related benefits 1,050 1Source: Department for Work and Pensions: working age client group.
Claimants as a percentage of the population, Tower Hamlets, May 2011
Poverty: key facts Page 24
people in this group are unable to work due to health problems and/or a disability. They comprise 44 per cent of all claimants of out-of-work benefits and represent seven per cent of the borough’s population. The second largest group of claimants are those in the jobseeker’s group – these residents are unemployed and actively seeking work, and usually receive Jobseeker’s Allowance. They account for 37 per cent of all claimants and represent 6 per cent of the borough’s working age population. The remaining claimants comprise lone parents and others reliant on income support. (Note: the total number of lone parents on out-of-work benefits is likely to be higher than these data suggest because some lone parents will be included within the Jobseekers or ESA/Incapacity groups – particularly those with older children who are no longer eligible for Income Support21). Duration of claiming out-of-work benefits by claimant type Just over one third (34 per cent) of claimants have been on out-of-work benefits for 5 years or more (Table 7). Those on incapacity-related benefits are the most likely to have been on benefits long-term: 60 per cent have been on out-of-work benefits for more than 5 years, and just over three quarters have been on benefits for more than two years. The majority (63 per cent) of lone parent claimants have been on benefits for more than two years. Jobseekers have a quite different profile and only a minority have been receiving benefits long-term: three quarters of the jobseeker group have been in receipt of Jobseeker’s Allowance for a year or less. This reflects the profile of this group who are – by definition – unemployed and seeking work. The eligibility criteria for Jobseeker’s Allowance require that the claimant must be actively seeking work and available for work, and the accompanying sanctions regime is thought to discourage people from staying on the benefit long-term. Table 7 Duration of claim by claimant group, Tower Hamlets, May 2011 By claimant group (% totals)
Duration of claim
All out-of-work benefits
Job seeker
ESA and incapacity
benefitsLone
parent
Others on income-related
benefitsAll = 100% 100 100 100 100 100- Up to 6 months 27 55 10 10 19 - 6 months up to 1 year 12 20 6 10 9 - 1 year and up to 2 years 12 14 8 16 17 - 2 years and up to 5 years 16 8 17 28 30 - 5 years and over 34 3 60 35 25Base: number of claimants 27,430 10,270 12,200 3,920 1,050Source: Department for Work and Pensions, working age client group data.
21 From 2012, lone parents will only be eligible for Income Support (IS) if their youngest child is aged 5 or below; this is part of a phased reduction in the age limit which began in 2008, from age 16 to 5.

Poverty: key facts Page 25
Claimants of out-of-work benefits across London Boroughs The percentage of working age residents on out-of-work benefits is high in Tower Hamlets (16 per cent) relative to both the national and London average (both 12 per cent). Within London, the claim rate ranges from 3 per cent in the City of London up to 19 per cent in Hackney. Tower Hamlets is ranked 6th highest in London and has the same rate as Greenwich and Brent (Figure 12). The borough’s ranking on this measure is less negative compared with the previous measures of income poverty which ranked the borough highest. This is because it measures something quite different. First, as it focuses on those out of work, it doesn’t capture those in work who fall under the poverty line. Further, unlike broader household income measures, it does not capture the circumstances of pensioner households nor does it takes no account of the dependants of claimants (eg children or partners). Figure 12: Percentage of working age residents claiming out-of-work benefits by London Borough, May 2011
11.812.4
3.25.65.8
7.68.58.68.99.19.59.89.9
10.010.110.410.810.811.2
12.012.813.3
14.214.915.315.415.415.715.715.7
16.417.517.8
18.619.4
0 5 10 15 20 25
EnglandLondon
City of LondonRichmond upon Thames
Kingston upon ThamesMertonSutton
HarrowBromley
WandsworthBarnet
Kensington and ChelseaHillingdon
WestminsterBexley
HaveringHounslowRedbridge
CamdenEaling
CroydonHammersmith and Fulham
SouthwarkLambeth
LewishamEnfield
Waltham ForestBrent
GreenwichTower Hamlets
IslingtonHaringey
Barking and DagenhamNewhamHackney
Percentage (%) of residents aged 16-64 who are claiming out-of-work benefits
Source: DWP benefit claimants - working age client group.
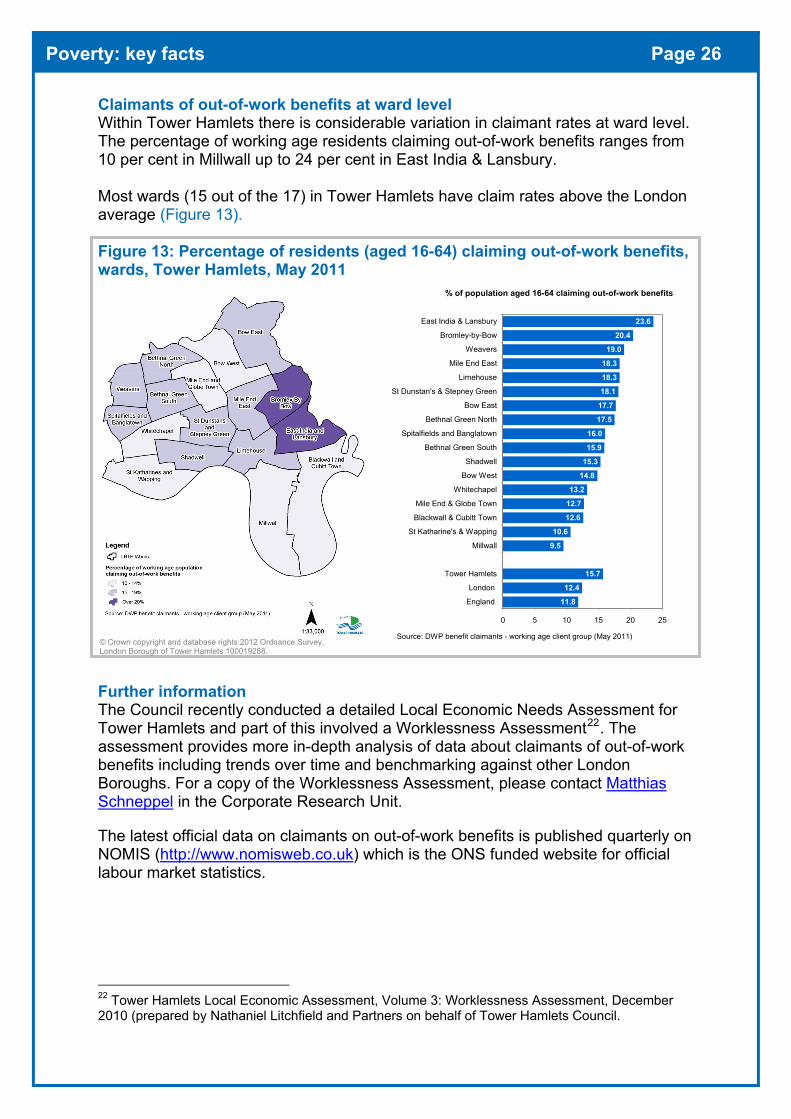
Poverty: key facts Page 26
Claimants of out-of-work benefits at ward level Within Tower Hamlets there is considerable variation in claimant rates at ward level. The percentage of working age residents claiming out-of-work benefits ranges from 10 per cent in Millwall up to 24 per cent in East India & Lansbury. Most wards (15 out of the 17) in Tower Hamlets have claim rates above the London average (Figure 13). Figure 13: Percentage of residents (aged 16-64) claiming out-of-work benefits, wards, Tower Hamlets, May 2011
11.8
12.4
15.7
9.5
10.6
12.6
12.7
13.2
14.8
15.3
15.9
16.0
17.5
17.7
18.1
18.3
18.3
19.0
20.4
23.6
0 5 10 15 20 25
England
London
Tower Hamlets
Millwall
St Katharine's & Wapping
Blackwall & Cubitt Town
Mile End & Globe Town
Whitechapel
Bow West
Shadwell
Bethnal Green South
Spitalfields and Banglatown
Bethnal Green North
Bow East
St Dunstan's & Stepney Green
Limehouse
Mile End East
Weavers
Bromley-by-Bow
East India & Lansbury
Source: DWP benefit claimants - working age client group (May 2011)
% of population aged 16-64 claiming out-of-work benefits
Further information The Council recently conducted a detailed Local Economic Needs Assessment for Tower Hamlets and part of this involved a Worklessness Assessment22. The assessment provides more in-depth analysis of data about claimants of out-of-work benefits including trends over time and benchmarking against other London Boroughs. For a copy of the Worklessness Assessment, please contact Matthias Schneppel in the Corporate Research Unit.
The latest official data on claimants on out-of-work benefits is published quarterly on NOMIS (http://www.nomisweb.co.uk) which is the ONS funded website for official labour market statistics.
22 Tower Hamlets Local Economic Assessment, Volume 3: Worklessness Assessment, December 2010 (prepared by Nathaniel Litchfield and Partners on behalf of Tower Hamlets Council.
© Crown copyright and database rights 2012 Ordnance Survey, London Borough of Tower Hamlets 100019288.

Poverty: key facts Page 27
6 Pensioner poverty
About this indicator This section explores income poverty among older residents in the borough and draws on Pension Credit statistics from the Department for Work and Pensions.
Pension Credit is a means tested benefit paid to people aged 60 and over and guarantees all pensioners a minimum level of income (£137.35 for a single person, and £209.70 for a couple as at January 2012). There are two parts to Pension Credit: the Guarantee Credit - the part that ensures a guaranteed level of income for those on low incomes; and the Savings Credit - for people who have made some (modest) savings provision for their retirement. Pensioners can receive one or both parts. Here, the indicator used relates to the percentage of people aged 60 and over who are in receipt of the guarantee part of Pension Credit (either by itself or in addition to the savings credit). In effect, this captures pensioners living on low incomes with little or no savings.
The main strength of this indicator is it is based on a precise administrative count of claimants and is very up to date (May 2011). The major limitation is that not all pensioners claim the benefits they are entitled to. DWP estimate that, nationally, take-up rates for the Guarantee part of Pension Credit are between 71 and 83 per cent23 – this means that around one quarter of pensioners in Britain are missing out on Pension Credit they are entitled to. For this reason, the figures that follow are likely to understate the number of pensioners living on low incomes in the borough.
Pension credit claimants in Tower Hamlets Tower Hamlets has a relatively small pensioner population compared with other areas: nine per cent of the borough’s population are aged 60 and over compared with 22 per cent across England24. Despite the fact the proportionately fewer pensioners live in the borough, those that do, face unusually high levels of income poverty.
Table 8 Pension Credit (Guarantee) recipients, May 2011 Number Pension Credit
Guarantee claimantsClaimants as % of
population aged 60+Claimants Beneficiaries*
Population aged 60 +
(2010) Claimant BeneficiariesTower Hamlets 9,820 11,960 21,500 46 56Greater London 251,670 297,060 1,236,400 20 24England 1,751,380 2,098,820 11,746,500 15 18Sources: LBTH calculations based on: DWP (claimant data - 100% count); and ONS mid-year population estimates 2010. * Beneficiaries figure includes the partners of claimants.
In Tower Hamlets, 9,820 pensioners receive the guarantee part of Pension Credit (Table 8). These represent half of all people aged 60 and over (46 per cent) – this is the highest pension credit guarantee rate in England and more than three times the national average (15 per cent).
23 DWP, Income related benefits estimates of take-up in 2008-09 (See Appendix A for more details). 24 Office for National Statistics, Mid-year estimates of population 2010.
Poverty: key facts Page 28
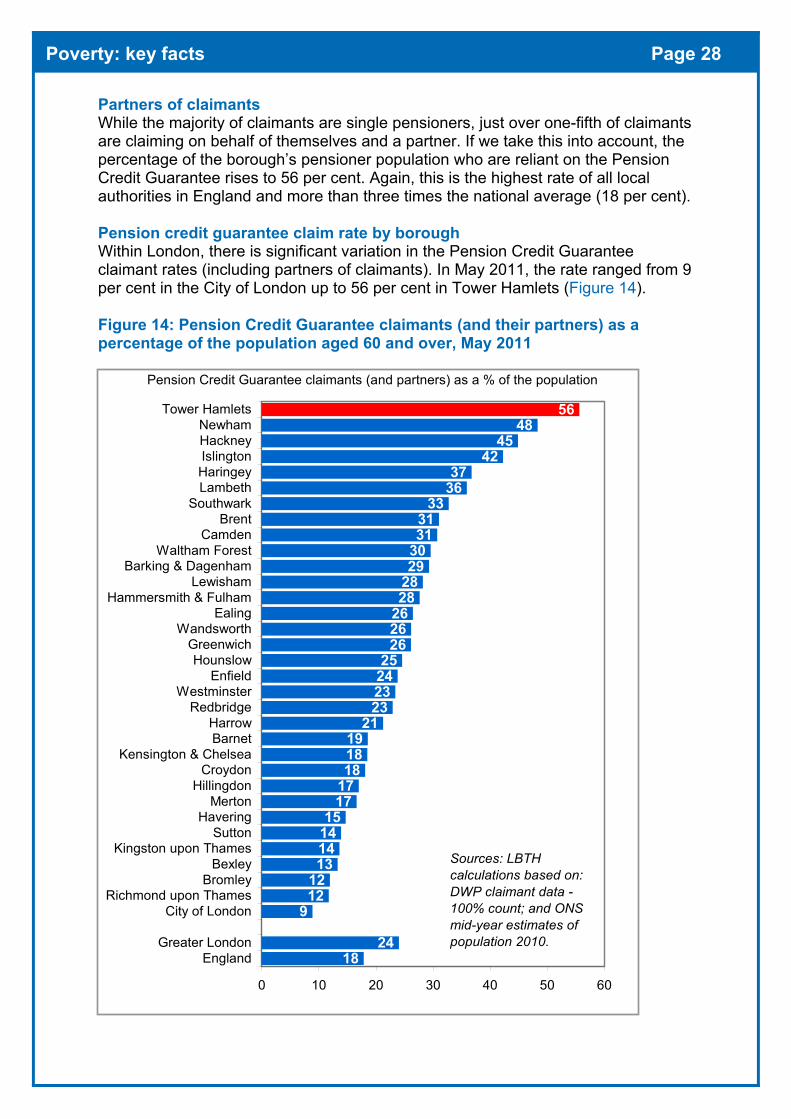
Partners of claimants While the majority of claimants are single pensioners, just over one-fifth of claimants are claiming on behalf of themselves and a partner. If we take this into account, the percentage of the borough’s pensioner population who are reliant on the Pension Credit Guarantee rises to 56 per cent. Again, this is the highest rate of all local authorities in England and more than three times the national average (18 per cent).
Pension credit guarantee claim rate by borough Within London, there is significant variation in the Pension Credit Guarantee claimant rates (including partners of claimants). In May 2011, the rate ranged from 9 per cent in the City of London up to 56 per cent in Tower Hamlets (Figure 14).
Figure 14: Pension Credit Guarantee claimants (and their partners) as a percentage of the population aged 60 and over, May 2011
1824
9121213141415
1717181819
2123232425
262626282829303131
333637
4245
4856
0 10 20 30 40 50 60
EnglandGreater London
City of LondonRichmond upon Thames
BromleyBexley
Kingston upon ThamesSutton
HaveringMerton
HillingdonCroydon
Kensington & ChelseaBarnetHarrow
RedbridgeWestminster
EnfieldHounslow
GreenwichWandsworth
EalingHammersmith & Fulham
LewishamBarking & Dagenham
Waltham ForestCamden
BrentSouthwark
LambethHaringeyIslingtonHackneyNewham
Tower Hamlets
Sources: LBTH calculations based on: DWP claimant data - 100% count; and ONS mid-year estimates of population 2010.
Pension Credit Guarantee claimants (and partners) as a % of the population
Poverty: key facts Page 29
Tower Hamlets has the highest rate in England - by some way – Newham and Hackney are the areas with the second and third highest rates but both are below 50 per cent (48 and 45 per cent respectively). Six out of the ten local authorities in England with the highest claim rates are in London.
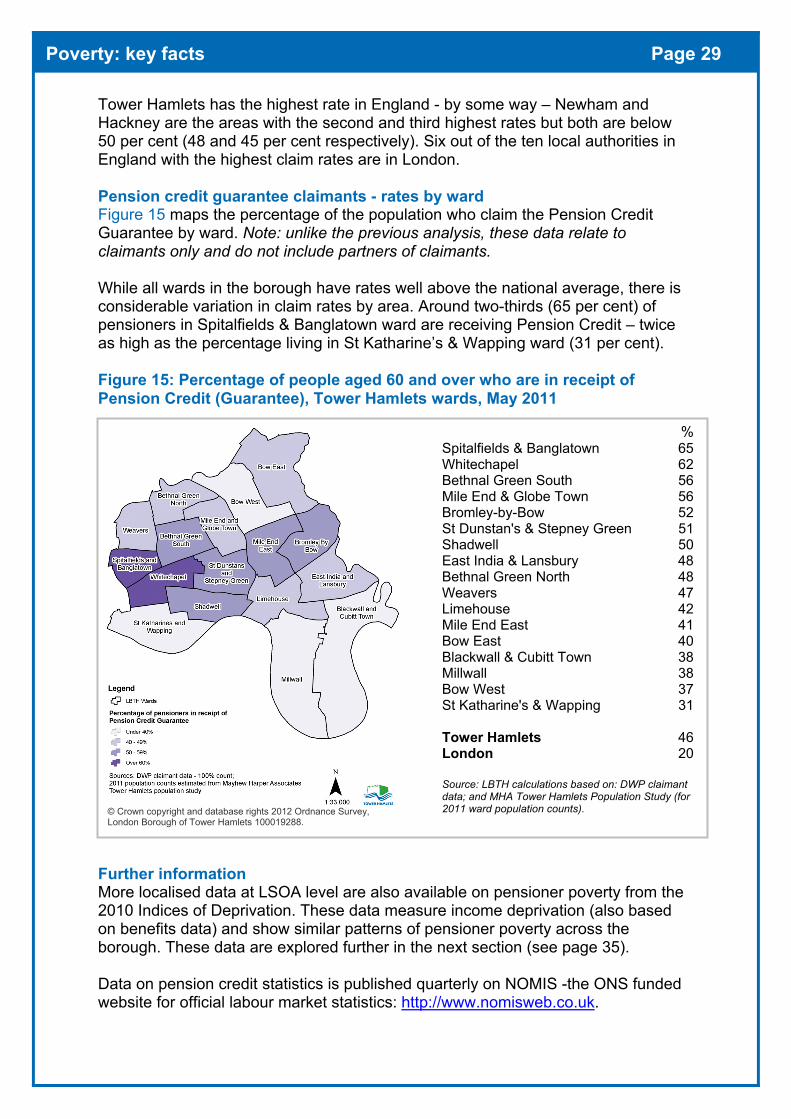
Pension credit guarantee claimants - rates by ward Figure 15 maps the percentage of the population who claim the Pension Credit Guarantee by ward. Note: unlike the previous analysis, these data relate to claimants only and do not include partners of claimants.
While all wards in the borough have rates well above the national average, there is considerable variation in claim rates by area. Around two-thirds (65 per cent) of pensioners in Spitalfields & Banglatown ward are receiving Pension Credit – twice as high as the percentage living in St Katharine’s & Wapping ward (31 per cent).
Figure 15: Percentage of people aged 60 and over who are in receipt of Pension Credit (Guarantee), Tower Hamlets wards, May 2011
%Spitalfields & Banglatown 65Whitechapel 62Bethnal Green South 56Mile End & Globe Town 56Bromley-by-Bow 52St Dunstan's & Stepney Green 51Shadwell 50East India & Lansbury 48Bethnal Green North 48Weavers 47Limehouse 42Mile End East 41Bow East 40Blackwall & Cubitt Town 38Millwall 38Bow West 37St Katharine's & Wapping 31
Tower Hamlets 46London 20
Source: LBTH calculations based on: DWP claimant data; and MHA Tower Hamlets Population Study (for 2011 ward population counts).
Further information More localised data at LSOA level are also available on pensioner poverty from the 2010 Indices of Deprivation. These data measure income deprivation (also based on benefits data) and show similar patterns of pensioner poverty across the borough. These data are explored further in the next section (see page 35).
Data on pension credit statistics is published quarterly on NOMIS -the ONS funded website for official labour market statistics: http://www.nomisweb.co.uk.
© Crown copyright and database rights 2012 Ordnance Survey, London Borough of Tower Hamlets 100019288.
Poverty: key facts Page 30
7 Indices of Deprivation 2010
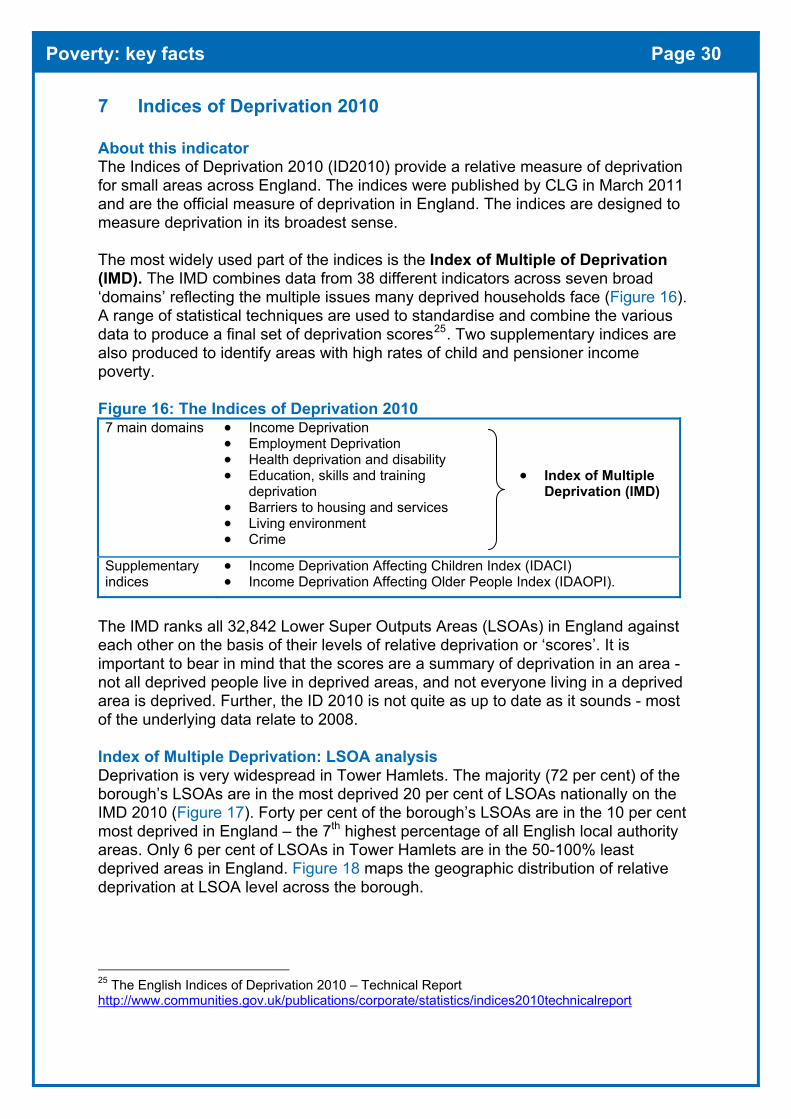
About this indicator The Indices of Deprivation 2010 (ID2010) provide a relative measure of deprivation for small areas across England. The indices were published by CLG in March 2011 and are the official measure of deprivation in England. The indices are designed to measure deprivation in its broadest sense.
The most widely used part of the indices is the Index of Multiple of Deprivation (IMD). The IMD combines data from 38 different indicators across seven broad ‘domains’ reflecting the multiple issues many deprived households face (Figure 16). A range of statistical techniques are used to standardise and combine the various data to produce a final set of deprivation scores25. Two supplementary indices are also produced to identify areas with high rates of child and pensioner income poverty.
Figure 16: The Indices of Deprivation 2010 7 main domains • Income Deprivation
• Employment Deprivation• Health deprivation and disability• Education, skills and training
deprivation• Barriers to housing and services• Living environment• Crime
• Index of MultipleDeprivation (IMD)
Supplementary indices
• Income Deprivation Affecting Children Index (IDACI)• Income Deprivation Affecting Older People Index (IDAOPI).
The IMD ranks all 32,842 Lower Super Outputs Areas (LSOAs) in England against each other on the basis of their levels of relative deprivation or ‘scores’. It is important to bear in mind that the scores are a summary of deprivation in an area - not all deprived people live in deprived areas, and not everyone living in a deprived area is deprived. Further, the ID 2010 is not quite as up to date as it sounds - most of the underlying data relate to 2008.
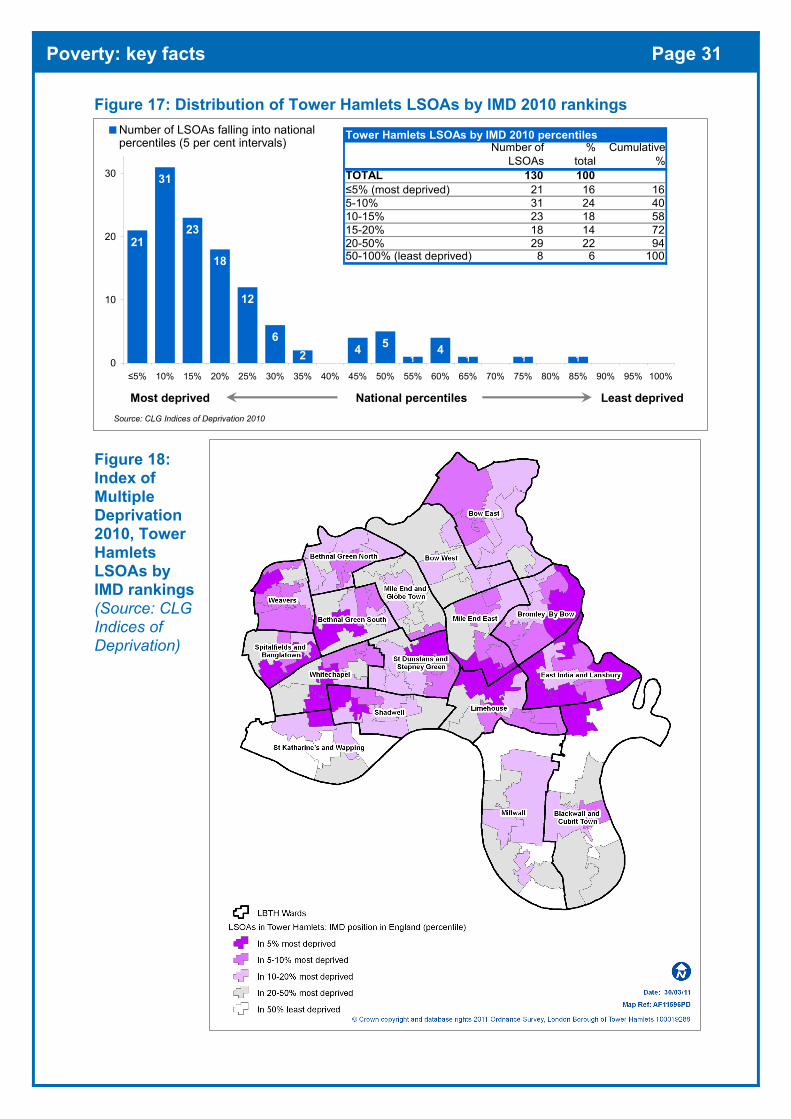
Index of Multiple Deprivation: LSOA analysis Deprivation is very widespread in Tower Hamlets. The majority (72 per cent) of the borough’s LSOAs are in the most deprived 20 per cent of LSOAs nationally on the IMD 2010 (Figure 17). Forty per cent of the borough’s LSOAs are in the 10 per cent most deprived in England – the 7th highest percentage of all English local authority areas. Only 6 per cent of LSOAs in Tower Hamlets are in the 50-100% least deprived areas in England. Figure 18 maps the geographic distribution of relative deprivation at LSOA level across the borough.
25 The English Indices of Deprivation 2010 – Technical Report http://www.communities.gov.uk/publications/corporate/statistics/indices2010technicalreport
Poverty: key facts Page 31
Figure 17: Distribution of Tower Hamlets LSOAs by IMD 2010 rankings
Figure 18: Index of Multiple Deprivation 2010, Tower Hamlets LSOAs by IMD rankings (Source: CLG Indices of Deprivation)
21
31
23
18
12
64 5 4 0
1 1 1 120
10
20
30
≤5% 10% 15% 20% 25% 30% 35% 40% 45% 50% 55% 60% 65% 70% 75% 80% 85% 90% 95% 100%
Number of LSOAs falling into nationalpercentiles (5 per cent intervals)
Most deprived Least deprivedNational percentilesSource: CLG Indices of Deprivation 2010
Number of LSOAs
% total
Cumulative %
TOTAL 130 100≤5% (most deprived) 21 16 165-10% 31 24 4010-15% 23 18 5815-20% 18 14 7220-50% 29 22 9450-100% (least deprived) 8 6 100
Tower Hamlets LSOAs by IMD 2010 percentiles
Poverty: key facts Page 32
While deprivation in Tower Hamlets is widespread, none of Tower Hamlets 130 LSOAs appear in the most severely deprived areas in England - that is the most deprived 1 per cent of LSOAs (the top 324 LSOAs); just over half of the these LSOAs are based in the North West of England and none are in London. However, relative to other areas in London, concentrations of deprivation remain very high in Tower Hamlets. Indeed, the most deprived LSOA in all of London is in Tower Hamlets within Spitalfields & Banglatown.
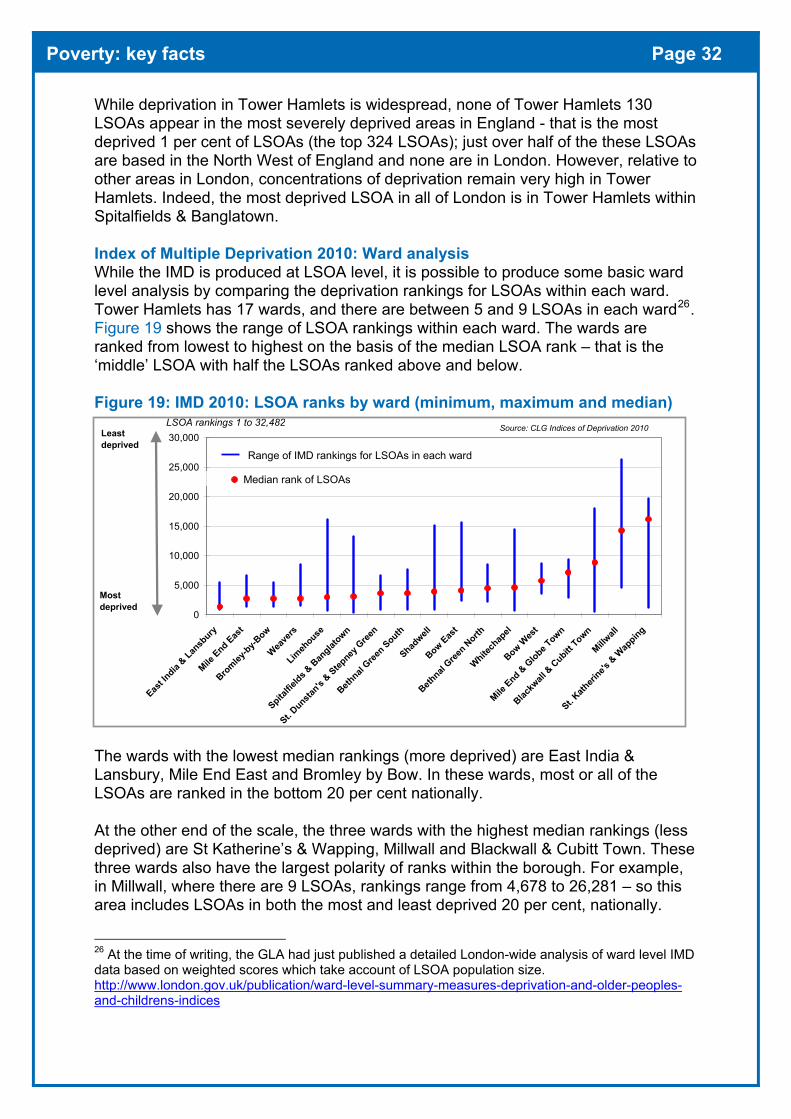
Index of Multiple Deprivation 2010: Ward analysis While the IMD is produced at LSOA level, it is possible to produce some basic ward level analysis by comparing the deprivation rankings for LSOAs within each ward. Tower Hamlets has 17 wards, and there are between 5 and 9 LSOAs in each ward26. Figure 19 shows the range of LSOA rankings within each ward. The wards are ranked from lowest to highest on the basis of the median LSOA rank – that is the ‘middle’ LSOA with half the LSOAs ranked above and below.
Figure 19: IMD 2010: LSOA ranks by ward (minimum, maximum and median)
The wards with the lowest median rankings (more deprived) are East India & Lansbury, Mile End East and Bromley by Bow. In these wards, most or all of the LSOAs are ranked in the bottom 20 per cent nationally.
At the other end of the scale, the three wards with the highest median rankings (less deprived) are St Katherine’s & Wapping, Millwall and Blackwall & Cubitt Town. These three wards also have the largest polarity of ranks within the borough. For example, in Millwall, where there are 9 LSOAs, rankings range from 4,678 to 26,281 – so this area includes LSOAs in both the most and least deprived 20 per cent, nationally.
26 At the time of writing, the GLA had just published a detailed London-wide analysis of ward level IMD data based on weighted scores which take account of LSOA population size. http://www.london.gov.uk/publication/ward-level-summary-measures-deprivation-and-older-peoples-and-childrens-indices
0
5,000
10,000
15,000
20,000
25,000
30,000
East In
dia & Lan
sbury
Mile End Eas
t
Bromley
-by-Bow
Weave
rs
Limeh
ouse
Spitalfie
lds & B
anglat
own
St. Dunsta
n's & Step
ney G
reen
Bethnal
Green South
Shadwell
Bow East
Bethnal
Green N
orth
Whitech
apel
Bow Wes
t
Mile End &
Globe T
own
Blackw
all &
Cubitt
Town
Millwall
St. Kath
erine's
& W
apping
Median rank of LSOAs
Range of IMD rankings for LSOAs in each ward
LSOA rankings 1 to 32,482
Most deprived
Least deprived
Source: CLG Indices of Deprivation 2010
Poverty: key facts Page 33
Index of Multiple Deprivation (IMD) 2010: Local authority rankings Deprivation across LSOAs is summarised at local authority level using six different measures; these allow local authority districts to be ranked according to how deprived they are relative to other districts. The different measures reflect different dimensions of the scale, severity and nature of multiple deprivation in an area - no one measure is favoured over another (Table 9).
The average IMD score measure – which reflects the average27 level of deprivation across LSOAs in the borough – shows that Tower Hamlets is the 7th most deprived local authority district in England out of 326 local authority districts. The top 6 were: Liverpool, Hackney, Newham, Manchester, Knowsley and Blackpool.
The average IMD rank measure is a similar measure but is based on average IMD rankings across LSOAs. The average rank measure is less affected by the impact of extreme scores than the average score measure. On this measure, Tower Hamlets is ranked as the 3rd most deprived local authority district in England.
Table 9 Tower Hamlets IMD 2010 rankings on summary LA measures
1=most deprived
National rank (out of 326
English LAs)
London rank Out of 33 LAs
Average IMD score (across LSOAs) 7 3 Average IMD rank (across LSOAs) 3 3 Extent (% living in most deprived LSOAs nationally) 3 3 Local concentration (profiles hotspots) 38 1 Income Scale (number income deprived) 10 2 Employment Scale (number employment deprived) 38 7 Source: CLG, Indices of Deprivation 2010
On the extent measure - which depicts how widespread28 levels of deprivation are in a district – Tower Hamlets is also ranked 3rd most deprived in England. On these three measures (average score, rank and extent), Tower Hamlets is ranked 3rd highest in London, after Hackney and Newham.
On the local concentration measure, Tower Hamlets is ranked 38th most deprived in England and the most deprived in London. This measure captures the severity of deprivation in an area by profiling and comparing deprivation in ‘hotspot’ areas29.
The final two measures are the income and employment scale measures – these reflect the actual number of people experiencing income and employment deprivation in an area. On the income scale measure, Tower Hamlets ranks 10th most deprived in England and on the employment scale measure, the borough ranks 38th most
27 Averages are population weighted to account for the differing population size of LSOAs. 28 The extent measure captures the proportion of an area’s population that live in the most deprived LSOAs in England - ‘most deprived’ LSOAs include all of those in the most deprived 10% LSOAs and then a proportion (on a sliding scale) of those living in the 11-30% most deprived. 29 The measure is a population weighted average of the ranks of a local authority district’s most deprived LSOAs that contain exactly 10% of the district’s population.

Poverty: key facts Page 34
deprived. As these measures are scale measures, they are heavily influenced by population size as well as the proportion of people experiencing deprivation; on both measures Birmingham (which is large in population size) is ranked the most deprived and the Isles of Scilly the least deprived.
Overall, Hackney and Tower Hamlets are the only two boroughs in London that feature in the most deprived 50 local authorities in England on all six summary measures (Newham just misses being included as it is ranked 51st on the concentration measure). The City of London, Richmond upon Thames and Kingston upon Thames emerge as the least deprived areas in London on all six measures.
Figure 20: Range of LSOA ranks on IMD 2010 for London boroughs
Polarity and variation within Boroughs Local authority summary measures – while widely used – disguise the considerable variation in deprivation levels within boroughs. Figure 20 illustrates this by showing the spread of deprivation rankings for LSOAs within each borough. The boroughs are ranked from lowest to highest on the basis of the median LSOA rank; the median is the ‘middle’ LSOA with half the LSOAs ranked above and below.
Many London boroughs have a wide spread of rankings and contain LSOAs is the most and least deprived areas nationally. However, Tower Hamlets is distinct in that, while its median LSOA rank is very low, reflecting the significant clustering of LSOAs at the deprived end of the range, the spread of ranks between the most and least deprived areas is fairly wide – especially when compared with Newham and Hackney. Put another way - IMD rankings are more polarised in Tower Hamlets than in its East London neighbours. Indeed, unlike Tower Hamlets, neither Newham nor Hackney has any LSOAs in the least deprived 50 per cent nationally. This helps explain why Hackney and Newham are more deprived than Tower Hamlets on some of the summary local authority level indicators.
0
10,000
20,000
30,000
Hackn
ey
Newha
m
Tower
Hamlet
s
Haring
ey
Walt
ham Fore
st
Isling
ton
Barking
and D
agen
ham
Lewish
am
Southw
ark
Lambe
th
Greenw
ichBren
t
Hammers
mith an
d Fulh
amEnfi
eld
Camde
nEali
ng
City of
Wes
tmins
ter
Houns
low
Croydo
n
Kensin
gton a
nd C
helse
a
Wan
dswort
h
Hillingd
on
Redbri
dge
Barnet
Harrow
Haveri
ng
Merton
Bexley
Sutton
City of
Lond
on
Bromley
Kingsto
n upo
n Tha
mes
Richmon
d upo
n Tha
mes
Range of IMD rankings for LSOAs in each borough
Median LSOA rank (in each borough)
Source: CLG Indices of Deprivation 2010
Most deprived
Least deprived
LSOA ki
Poverty: key facts Page 35
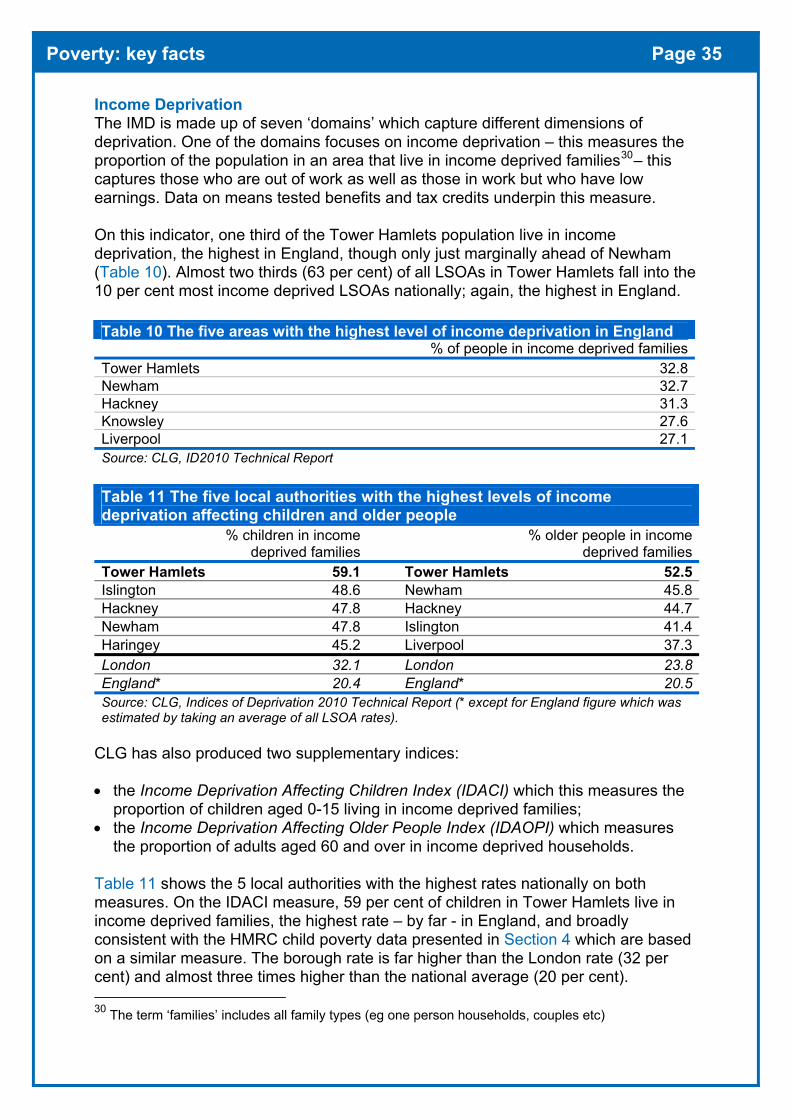
Income Deprivation The IMD is made up of seven ‘domains’ which capture different dimensions of deprivation. One of the domains focuses on income deprivation – this measures the proportion of the population in an area that live in income deprived families30– this captures those who are out of work as well as those in work but who have low earnings. Data on means tested benefits and tax credits underpin this measure.
On this indicator, one third of the Tower Hamlets population live in income deprivation, the highest in England, though only just marginally ahead of Newham (Table 10). Almost two thirds (63 per cent) of all LSOAs in Tower Hamlets fall into the 10 per cent most income deprived LSOAs nationally; again, the highest in England.
Table 11 The five local authorities with the highest levels of income deprivation affecting children and older people
% children in income deprived families
% older people in income deprived families
Tower Hamlets 59.1 Tower Hamlets 52.5Islington 48.6 Newham 45.8Hackney 47.8 Hackney 44.7Newham 47.8 Islington 41.4Haringey 45.2 Liverpool 37.3London 32.1 London 23.8England* 20.4 England* 20.5Source: CLG, Indices of Deprivation 2010 Technical Report (* except for England figure which was estimated by taking an average of all LSOA rates).
CLG has also produced two supplementary indices:
• the Income Deprivation Affecting Children Index (IDACI) which this measures theproportion of children aged 0-15 living in income deprived families;
• the Income Deprivation Affecting Older People Index (IDAOPI) which measuresthe proportion of adults aged 60 and over in income deprived households.
Table 11 shows the 5 local authorities with the highest rates nationally on both measures. On the IDACI measure, 59 per cent of children in Tower Hamlets live in income deprived families, the highest rate – by far - in England, and broadly consistent with the HMRC child poverty data presented in Section 4 which are based on a similar measure. The borough rate is far higher than the London rate (32 per cent) and almost three times higher than the national average (20 per cent).
30 The term ‘families’ includes all family types (eg one person households, couples etc)
Table 10 The five areas with the highest level of income deprivation in England % of people in income deprived families
Tower Hamlets 32.8Newham 32.7Hackney 31.3Knowsley 27.6Liverpool 27.1Source: CLG, ID2010 Technical Report
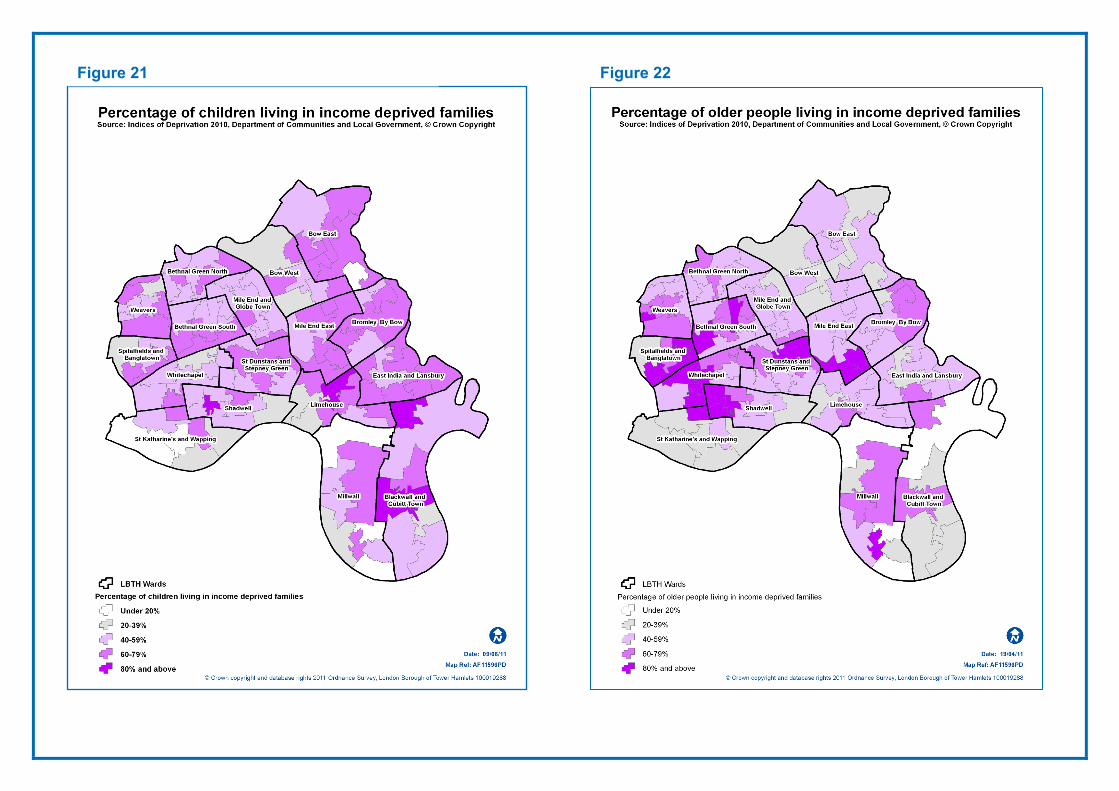
Figure 21 Figure 22

Poverty: key facts Page 37
On the IDAOPI measure, just over half (53 per cent) of older residents in Tower Hamlets live in income deprivation, also the highest rate in England. This reflects the high proportion of pensioners reliant on means tested benefits in the borough – the borough rate is more than twice as high as the rate both regionally and nationally. Again this indicator presents a similar picture to the pension credit statistics presented in Section 6 which are based on a similar measure.
Pensioner and child poverty is very widespread across the borough and on both measures the vast majority of the borough’s LSOAs fall into the most deprived LSOAs nationally. On the Income Deprivation affecting Children Index - 84 per cent of LSOAs in the borough fall into the most deprived 10 per cent of LSOAs nationally and on the Income Deprivation affecting Older people Index - 79 per cent of LSOAs in the borough fall into the most deprived 10 per cent of LSOAs nationally.
Patterns of income deprivation by LSOA Figures 21 and 22 map levels of income deprivation among children and older people at LSOA level. The white areas on the maps show LSOAs where less than 20 per cent of families are income deprived – this is around the national average. As the maps show there are very few of these areas – only 6 LSOAs on the children index and 4 on the older people measure have levels below 20 per cent. The majority of LSOAs in the borough have high rates of income deprivation on both the children and older people measures.
Income deprivation is particularly widespread on the children index. In almost half (46 per cent) of all LSOAs in the borough, the percentage of children living in income deprivation is 60 per cent or higher. On the older people index, one third of all LSOAs have income deprivation rates of 60 per cent or more. The five most deprived LSOAs nationally on the older people index are all in Tower Hamlets.
Further information The Corporate Research Unit has produced a more in-depth analysis of these data for Tower Hamlets. This analysis is summarised in Research Briefing 2011-03: Indices of Deprivation 2010 and is available on the Council’s website. http://www.towerhamlets.gov.uk/idoc.ashx?docid=7d09b443-cc9a-4913-bb2b-b0a88c654f49&version=-1
Also, the Greater London Authority has published a useful London-wide analysis of the ID2010 results: English Indices of Deprivation 2010: A London Perspective: http://www.london.gov.uk/who-runs-london/mayor/publications/society/facts-and-figures/poverty
The full set of ID2010 datasets in excel format is available at the following link: http://www.communities.gov.uk/publications/corporate/statistics/indices2010
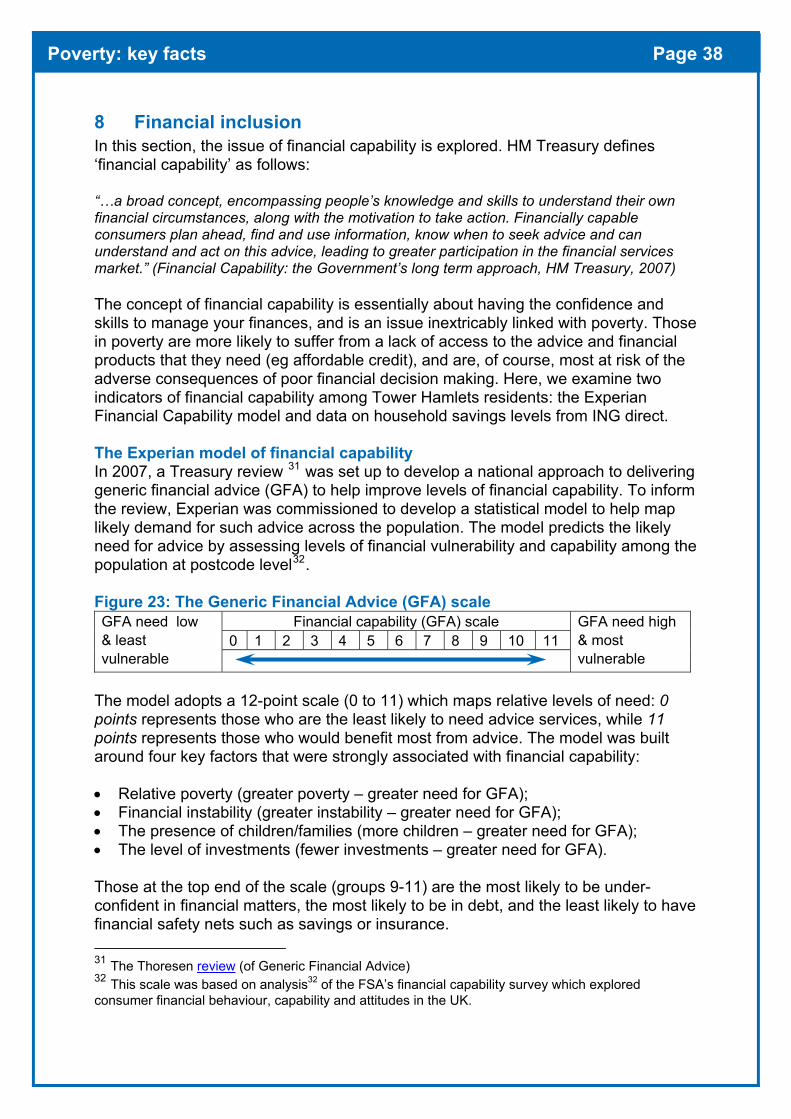
Poverty: key facts Page 38
8 Financial inclusion In this section, the issue of financial capability is explored. HM Treasury defines ‘financial capability’ as follows:
“…a broad concept, encompassing people’s knowledge and skills to understand their own financial circumstances, along with the motivation to take action. Financially capable consumers plan ahead, find and use information, know when to seek advice and can understand and act on this advice, leading to greater participation in the financial services market.” (Financial Capability: the Government’s long term approach, HM Treasury, 2007)
The concept of financial capability is essentially about having the confidence and skills to manage your finances, and is an issue inextricably linked with poverty. Those in poverty are more likely to suffer from a lack of access to the advice and financial products that they need (eg affordable credit), and are, of course, most at risk of the adverse consequences of poor financial decision making. Here, we examine two indicators of financial capability among Tower Hamlets residents: the Experian Financial Capability model and data on household savings levels from ING direct.
The Experian model of financial capability In 2007, a Treasury review 31 was set up to develop a national approach to delivering generic financial advice (GFA) to help improve levels of financial capability. To inform the review, Experian was commissioned to develop a statistical model to help map likely demand for such advice across the population. The model predicts the likely need for advice by assessing levels of financial vulnerability and capability among the population at postcode level32.
Figure 23: The Generic Financial Advice (GFA) scale Financial capability (GFA) scale
0 1 2 3 4 5 6 7 8 9 10 11 GFA need low & least vulnerable
GFA need high & most vulnerable
The model adopts a 12-point scale (0 to 11) which maps relative levels of need: 0 points represents those who are the least likely to need advice services, while 11 points represents those who would benefit most from advice. The model was built around four key factors that were strongly associated with financial capability:
• Relative poverty (greater poverty – greater need for GFA);• Financial instability (greater instability – greater need for GFA);• The presence of children/families (more children – greater need for GFA);• The level of investments (fewer investments – greater need for GFA).
Those at the top end of the scale (groups 9-11) are the most likely to be under-confident in financial matters, the most likely to be in debt, and the least likely to have financial safety nets such as savings or insurance.
31 The Thoresen review (of Generic Financial Advice) 32 This scale was based on analysis32 of the FSA’s financial capability survey which exploredconsumer financial behaviour, capability and attitudes in the UK.

Poverty: key facts Page 39
Financial capability in Tower Hamlets The majority of areas in Tower Hamlets are classified as areas where the population has high levels of financial vulnerability and low levels of financial capability: 71 per cent of postcode areas in the borough are in GFA segments 9 to 11 – almost three times higher than the London-wide percentage (26 per cent). People in groups 9-11 are the most likely to be at risk of adverse consequences from poor financial decision making and the most likely to benefit from financial advice.
None of the postcode areas in Tower Hamlets fall into the least vulnerable GFA groups 0-1, and only 8 per cent fall into GFA groups 2-5. These groups typically have higher levels of financial capability and are the least likely to need financial advice.
Figure 25 illustrates patterns in more detail by mapping GFA segments at postcode level. The darker areas show areas in segments 9-11. There is considerable similarity between patterns of financial vulnerability and patterns of deprivation across the borough. The borough’s riverside areas have relatively higher levels of financial capability and lower levels of deprivation. This is perhaps to be expected, given that relative poverty is one of the indicators Experian use in their model to predict GFA segments.
Figure 24: Percentage of areas in GFA financial capability segments, Tower Hamlets & London, 2010
Figure 25: Postcode areas in Tower Hamlets by levels of financial capability, 2010
© Crown copyright and database rights 2012 Ordnance Survey, London Borough of Tower Hamlets 100019288.
1
6
11
11
8
8
10
10
10
10
10
6
6
8
7
12
26
32
4
1
<0
3
0 10 20 30 40
0
1
2
3
4
5
6
7
8
9
10
11
Greater London Tower Hamlets
GFA segments
Least vulnerable
Most vulnerable
Source: Experian, Financial Capability data 2010
% of unit postcode areas falling into each segment
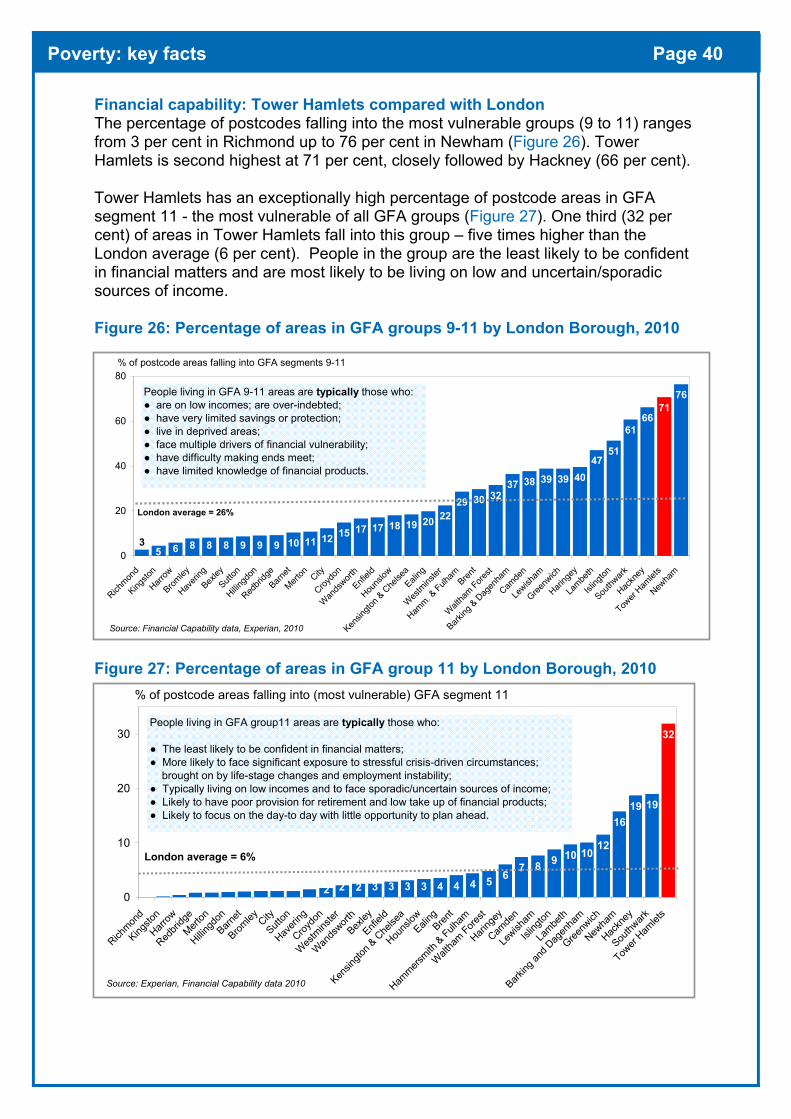
Poverty: key facts Page 40
Financial capability: Tower Hamlets compared with London The percentage of postcodes falling into the most vulnerable groups (9 to 11) ranges from 3 per cent in Richmond up to 76 per cent in Newham (Figure 26). Tower Hamlets is second highest at 71 per cent, closely followed by Hackney (66 per cent).
Tower Hamlets has an exceptionally high percentage of postcode areas in GFA segment 11 - the most vulnerable of all GFA groups (Figure 27). One third (32 per cent) of areas in Tower Hamlets fall into this group – five times higher than the London average (6 per cent). People in the group are the least likely to be confident in financial matters and are most likely to be living on low and uncertain/sporadic sources of income.
Figure 26: Percentage of areas in GFA groups 9-11 by London Borough, 2010
Figure 27: Percentage of areas in GFA group 11 by London Borough, 2010
% of postcode areas falling into GFA segments 9-11
8 8 8 9 9 9 10 11 12 15 17 17 18 19 20 2229 30 32
37 38 39 39 4047
51
6166
7176
53 6
0
20
40
60
80
Richmon
d
Kingsto
n
Harrow
Bromley
Haveri
ng
Bexley
Sutton
Hillingd
on
Redbri
dge
Barnet
Merton City
Croydo
n
Wands
worth
Enfield
Houns
low
Kensin
gton &
Che
lseaEali
ng
Westm
inster
Hamm. &
Fulham
Brent
Waltha
m Forest
Barking
& Dag
enha
m
Camde
n
Lewish
am
Greenw
ich
Haring
ey
Lambe
th
Isling
ton
Southw
ark
Hackn
ey
Tower
Hamlet
s
Newha
m
Source: Financial Capability data, Experian, 2010
London average = 26%
People living in GFA 9-11 areas are typically those who: ● are on low incomes; are over-indebted;● have very limited savings or protection;● live in deprived areas;● face multiple drivers of financial vulnerability;● have difficulty making ends meet;● have limited knowledge of financial products.
% of postcode areas falling into (most vulnerable) GFA segment 11
0 0 0 1 1 1 1 1 1 1 3 3 3 4 4 4 5 67 8 9 10 10
12
1619 19
32
2 32 20
10
20
30
Richmon
d
Kingsto
n
Harrow
Redbri
dge
Merton
Hillingd
on
Barnet
Bromley City
Sutton
Haveri
ng
Croydo
n
Westm
inster
Wands
worth
Bexley
Enfield
Kensin
gton &
Che
lsea
Houns
lowEali
ngBren
t
Hammers
mith &
Fulham
Walt
ham Fore
st
Haring
ey
Camde
n
Lewish
am
Isling
ton
Lambe
th
Barking
and D
agen
ham
Greenw
ich
Newha
m
Hackn
ey
Southw
ark
Tower
Hamlet
s
Source: Experian, Financial Capability data 2010
London average = 6%
People living in GFA group11 areas are typically those who:
● The least likely to be confident in financial matters;● More likely to face significant exposure to stressful crisis-driven circumstances;
brought on by life-stage changes and employment instability;● Typically living on low incomes and to face sporadic/uncertain sources of income;● Likely to have poor provision for retirement and low take up of financial products;● Likely to focus on the day-to day with little opportunity to plan ahead.
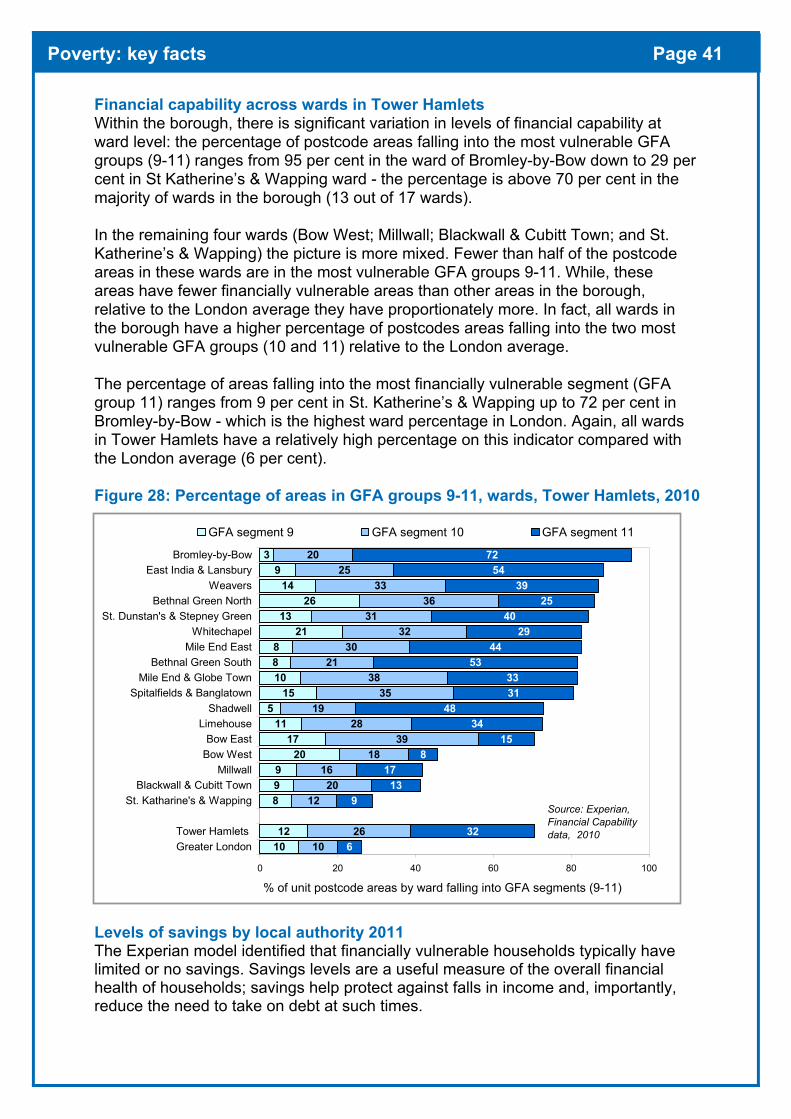
Poverty: key facts Page 41
Financial capability across wards in Tower Hamlets Within the borough, there is significant variation in levels of financial capability at ward level: the percentage of postcode areas falling into the most vulnerable GFA groups (9-11) ranges from 95 per cent in the ward of Bromley-by-Bow down to 29 per cent in St Katherine’s & Wapping ward - the percentage is above 70 per cent in the majority of wards in the borough (13 out of 17 wards).
In the remaining four wards (Bow West; Millwall; Blackwall & Cubitt Town; and St. Katherine’s & Wapping) the picture is more mixed. Fewer than half of the postcode areas in these wards are in the most vulnerable GFA groups 9-11. While, these areas have fewer financially vulnerable areas than other areas in the borough, relative to the London average they have proportionately more. In fact, all wards in the borough have a higher percentage of postcodes areas falling into the two most vulnerable GFA groups (10 and 11) relative to the London average.
The percentage of areas falling into the most financially vulnerable segment (GFA group 11) ranges from 9 per cent in St. Katherine’s & Wapping up to 72 per cent in Bromley-by-Bow - which is the highest ward percentage in London. Again, all wards in Tower Hamlets have a relatively high percentage on this indicator compared with the London average (6 per cent).
Figure 28: Percentage of areas in GFA groups 9-11, wards, Tower Hamlets, 2010
1012
899
2017
115
151088
2113
2614
93
1026
1220
1618
3928
1935
3821
3032
3136
3325
20
632
913
178
1534
483133
5344
2940
2539
5472
0 20 40 60 80 10
Greater LondonTower Hamlets
St. Katharine's & WappingBlackwall & Cubitt Town
MillwallBow WestBow East
LimehouseShadwell
Spitalfields & BanglatownMile End & Globe Town
Bethnal Green SouthMile End East
WhitechapelSt. Dunstan's & Stepney Green
Bethnal Green NorthWeavers
East India & LansburyBromley-by-Bow
0
GFA segment 9 GFA segment 10 GFA segment 11
% of unit postcode areas by ward falling into GFA segments (9-11)
Source: Experian, Financial Capability data, 2010
Levels of savings by local authority 2011 The Experian model identified that financially vulnerable households typically have limited or no savings. Savings levels are a useful measure of the overall financial health of households; savings help protect against falls in income and, importantly, reduce the need to take on debt at such times.
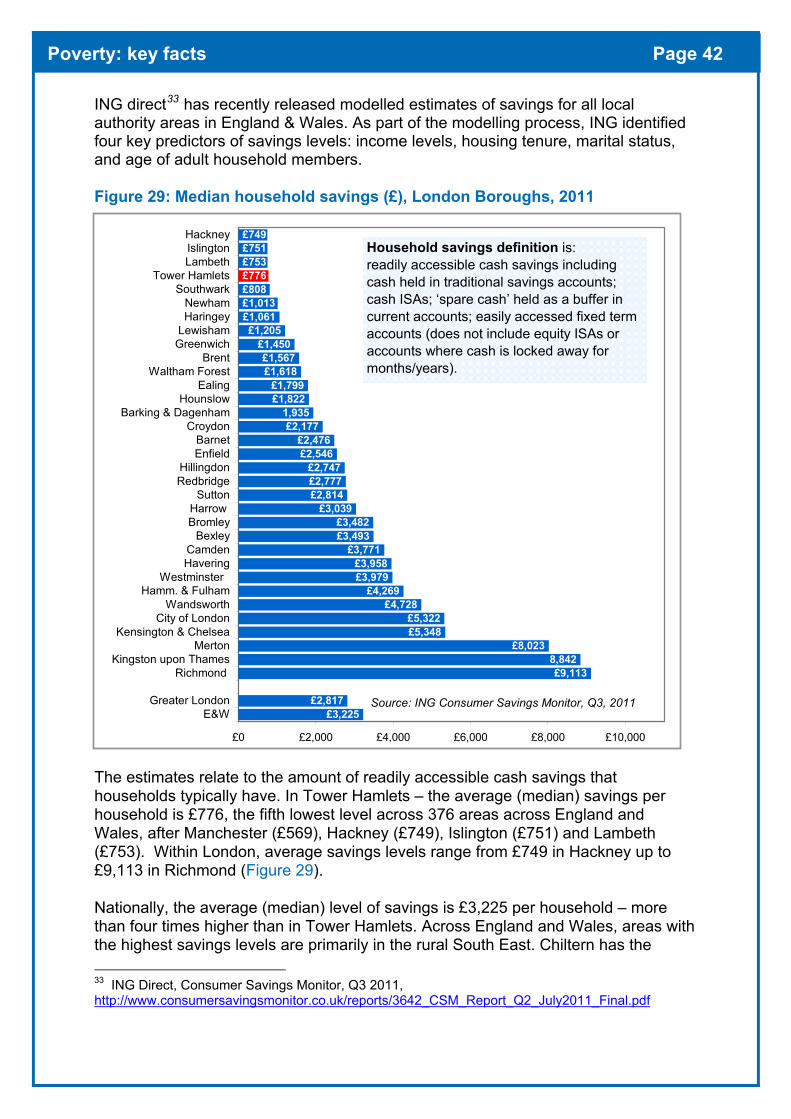
Poverty: key facts Page 42
ING direct33 has recently released modelled estimates of savings for all local authority areas in England & Wales. As part of the modelling process, ING identified four key predictors of savings levels: income levels, housing tenure, marital status, and age of adult household members.
Figure 29: Median household savings (£), London Boroughs, 2011
The estimates relate to the amount of readily accessible cash savings that households typically have. In Tower Hamlets – the average (median) savings per household is £776, the fifth lowest level across 376 areas across England and Wales, after Manchester (£569), Hackney (£749), Islington (£751) and Lambeth (£753). Within London, average savings levels range from £749 in Hackney up to £9,113 in Richmond (Figure 29).
Nationally, the average (median) level of savings is £3,225 per household – more than four times higher than in Tower Hamlets. Across England and Wales, areas with the highest savings levels are primarily in the rural South East. Chiltern has the
33 ING Direct, Consumer Savings Monitor, Q3 2011, http://www.consumersavingsmonitor.co.uk/reports/3642_CSM_Report_Q2_July2011_Final.pdf
£3,225£2,817
£9,1138,842
£8,023£5,348£5,322
£4,728£4,269
£3,979£3,958
£3,771£3,493£3,482
£3,039£2,814£2,777£2,747
£2,546£2,476
£2,1771,935
£1,822£1,799
£1,618£1,567
£1,450£1,205
£1,061£1,013£808£776£753£751£749
£0 £2,000 £4,000 £6,000 £8,000 £10,000
E&WGreater London
Richmond Kingston upon Thames
MertonKensington & Chelsea
City of LondonWandsworth
Hamm. & FulhamWestminster
HaveringCamden
BexleyBromleyHarrow
SuttonRedbridgeHillingdon
EnfieldBarnet
CroydonBarking & Dagenham
HounslowEaling
Waltham ForestBrent
GreenwichLewishamHaringeyNewham
SouthwarkTower Hamlets
LambethIslingtonHackney
Source: ING Consumer Savings Monitor, Q3, 2011
Household savings definition is: readily accessible cash savings including cash held in traditional savings accounts; cash ISAs; ‘spare cash’ held as a buffer in current accounts; easily accessed fixed term accounts (does not include equity ISAs or accounts where cash is locked away for months/years).
Poverty: key facts Page 43
highest level of all areas - at £15,712 – more than twenty times higher than the Tower Hamlets average.
The data are limited in that they only provide one summary statistic per local authority; the £776 figure for Tower Hamlets is a median statistic so tells us that half of households have savings levels above this level and half have savings levels below (including those who have no savings at all). What is unknown is the proportion of households with no savings at all (which is 26 per cent nationally), or indeed, the proportion with high levels of savings.
Nevertheless, the data confirm that Tower Hamlets households typically have a far smaller safety net than households elsewhere. The considerable disparities in savings provision across London figures are broadly consistent with the patterns of financial vulnerability shown by the Experian financial capability data.
Further information The Corporate Research Unit has produced a more in-depth analysis of the Experian Financial Capability data for Tower Hamlets. This analysis is summarised in Research Briefing 2011-07: Financial Capability data which is available on request.
The GLA has made the full Experian datasets available for London Boroughs on the GLA datastore website: http://data.london.gov.uk/datastore/package/financial-capability-and-child-poverty
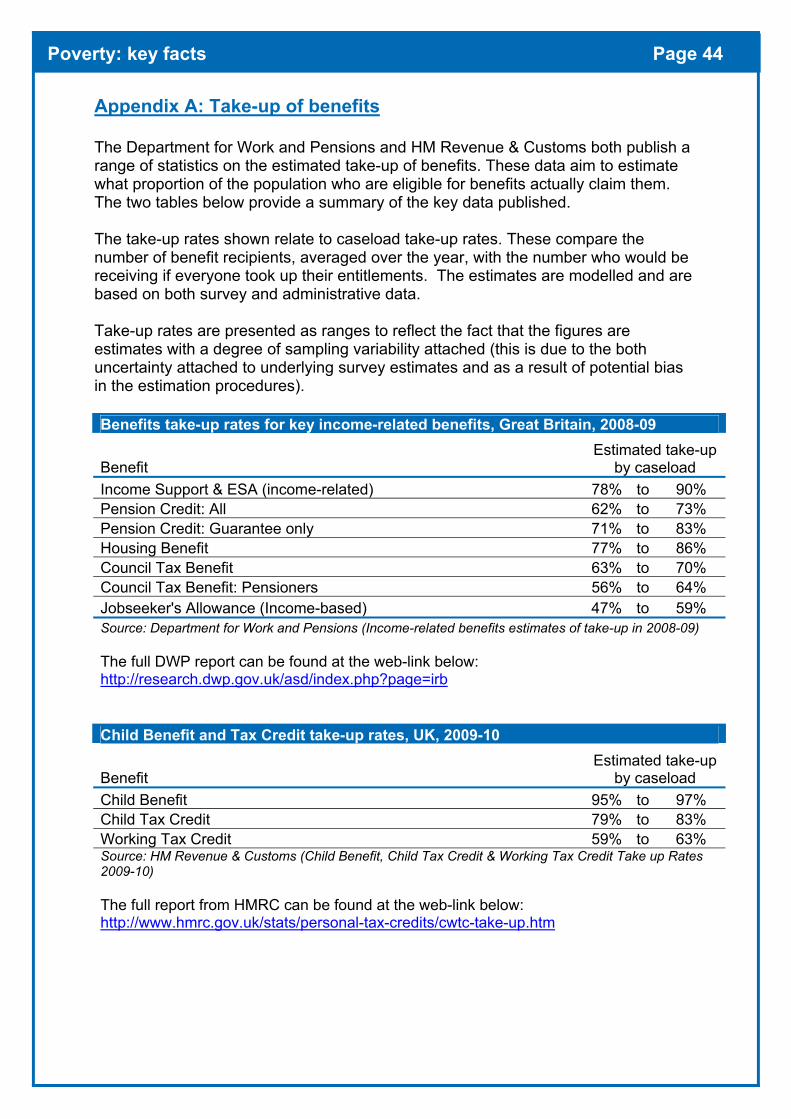
Poverty: key facts Page 44
Appendix A: Take-up of benefits
The Department for Work and Pensions and HM Revenue & Customs both publish a range of statistics on the estimated take-up of benefits. These data aim to estimate what proportion of the population who are eligible for benefits actually claim them. The two tables below provide a summary of the key data published.
The take-up rates shown relate to caseload take-up rates. These compare the number of benefit recipients, averaged over the year, with the number who would be receiving if everyone took up their entitlements. The estimates are modelled and are based on both survey and administrative data.
Take-up rates are presented as ranges to reflect the fact that the figures are estimates with a degree of sampling variability attached (this is due to the both uncertainty attached to underlying survey estimates and as a result of potential bias in the estimation procedures).
Benefits take-up rates for key income-related benefits, Great Britain, 2008-09
Benefit Estimated take-up
by caseload Income Support & ESA (income-related) 78% to 90%Pension Credit: All 62% to 73% Pension Credit: Guarantee only 71% to 83% Housing Benefit 77% to 86% Council Tax Benefit 63% to 70% Council Tax Benefit: Pensioners 56% to 64% Jobseeker's Allowance (Income-based) 47% to 59% Source: Department for Work and Pensions (Income-related benefits estimates of take-up in 2008-09)
The full DWP report can be found at the web-link below: http://research.dwp.gov.uk/asd/index.php?page=irb
Child Benefit and Tax Credit take-up rates, UK, 2009-10
Benefit Estimated take-up
by caseload Child Benefit 95% to 97% Child Tax Credit 79% to 83% Working Tax Credit 59% to 63% Source: HM Revenue & Customs (Child Benefit, Child Tax Credit & Working Tax Credit Take up Rates 2009-10)
The full report from HMRC can be found at the web-link below: http://www.hmrc.gov.uk/stats/personal-tax-credits/cwtc-take-up.htm
Poverty: key facts Page 45
Appendix B: Further Information
Corporate Research Unit This Briefing was produced by the Council’s Corporate Research Unit which is based in the Chief Executive’s Directorate. Research briefings provide timely and in-depth analysis of data about Tower Hamlets and are designed to improve the use and sharing of data across the Partnership.
Briefings can be downloaded from the Tower Hamlets Borough statistics web pages.
Readers can contact the research team via email: [email protected]
Disclaimer for Public information:The London Borough of Tower Hamlets is committed to the highest standard and quality of information and every reasonable attempt has been made to present accurate information. However, the information in this publication has been provided for information purposes only and the London Borough of Tower Hamlets gives no warranty, express or implied, as to the accuracy, timeliness or decency of the information and accepts no liability for any loss, damage or inconvenience howsoever arising, caused by, or as a result of, reliance upon such information.
Crown Copyright material is reproduced with the permission of the Controller of HMSO.