port of olympia: from extraction economy to sustainable growth
TRANSCRIPT

New Directions: From Extraction Economy to Sustainable GrowthPublic Service Strategy Examples
Economic Development (import new spending)
Tourism Promotion & Parks/Beautification
1) Restore Deschutes Estuary,2) Passenger Ferry to Seattle3) Public transit to recreation areas4) Help create model sustainable city
Economic Development & Climate Change Mitigation(increase Thurston County resident purchasing power, while reducing emissions)
Reduce Household Energy Costs 1) Grants/subsidies for householdenergy efficiency retrofits and renewable energy installations
Climate Change Mitigation & Economic Development
Public Transit 1) Ferry to Seattle 2) Public transit to recreation areas
Climate Change Adaptation Conserve and improve Ecosystemservices
Smart growth, local food, conservation, forest and wetland protection
* Consider how strategies feed off of one another = Positive Triple Bottom Line Feedback Loops

Present OperationsFinances
Fracking Proppant Imports
Logging Exports and Local Effects
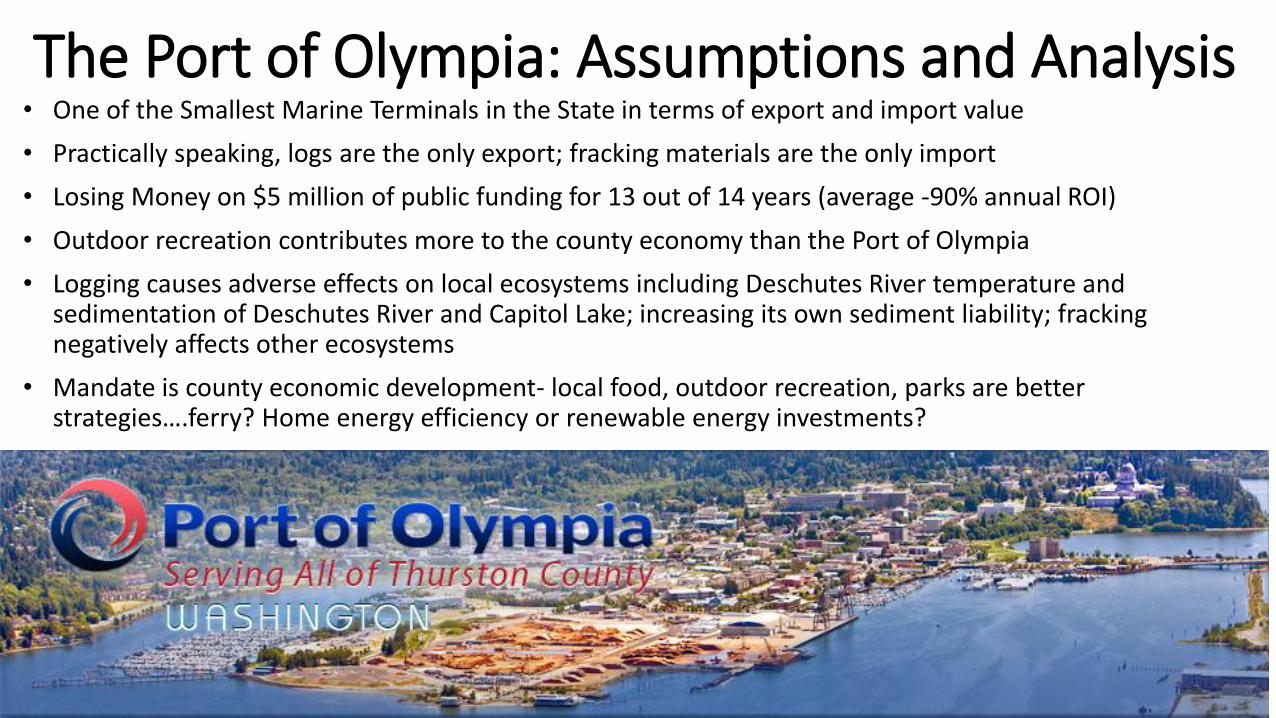
The Port of Olympia: Assumptions and Analysis • One of the Smallest Marine Terminals in the State in terms of export and import value
• Practically speaking, logs are the only export; fracking materials are the only import
• Losing Money on $5 million of public funding for 13 out of 14 years (average -90% annual ROI)
• Outdoor recreation contributes more to the county economy than the Port of Olympia
• Logging causes adverse effects on local ecosystems including Deschutes River temperature and sedimentation of Deschutes River and Capitol Lake; increasing its own sediment liability; fracking negatively affects other ecosystems
• Mandate is county economic development- local food, outdoor recreation, parks are better strategies….ferry? Home energy efficiency or renewable energy investments?

• Public funding has been the #1 source of revenue for 8 out of 12 years; 2nd for the other 4 years (I understand many ports loose money-but what is normal?)
• Return on Investment from a fiscal standpoint is abysmal
• To the Port’s credit it has, in recent years, become less dependent on the public funding, but still around 25%
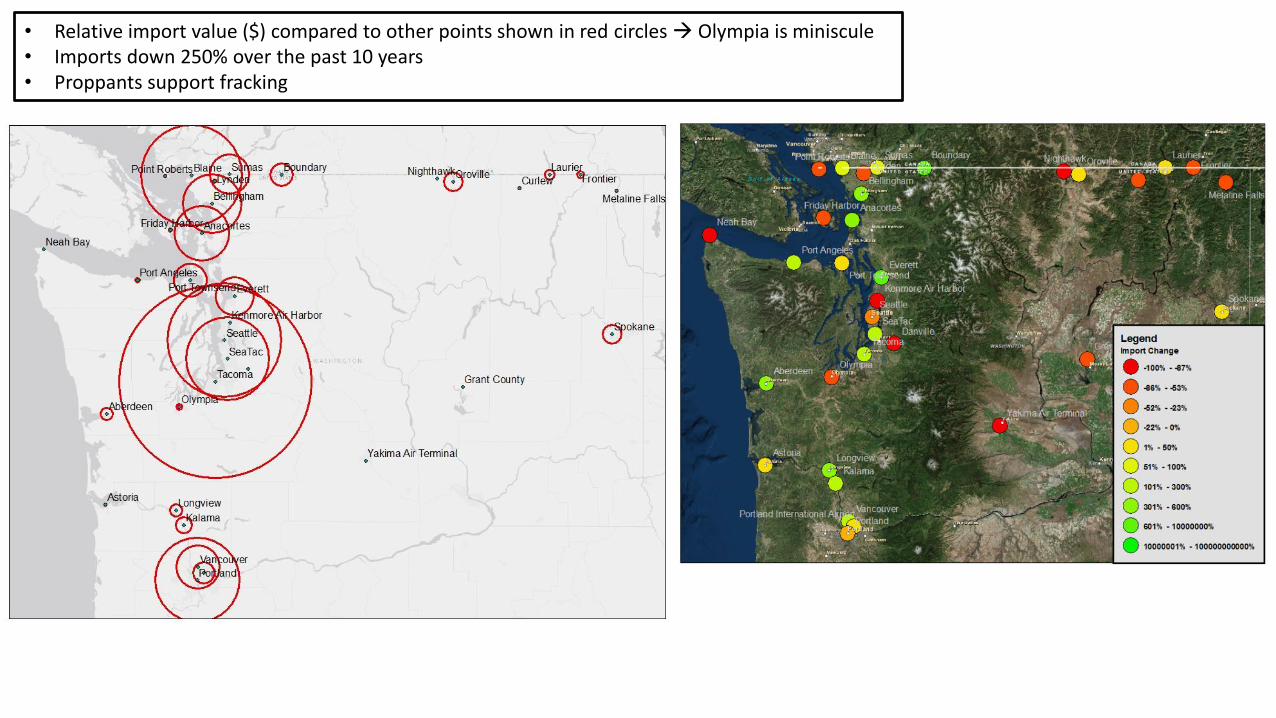
• Relative import value ($) compared to other points shown in red circles Olympia is miniscule • Imports down 250% over the past 10 years • Proppants support fracking
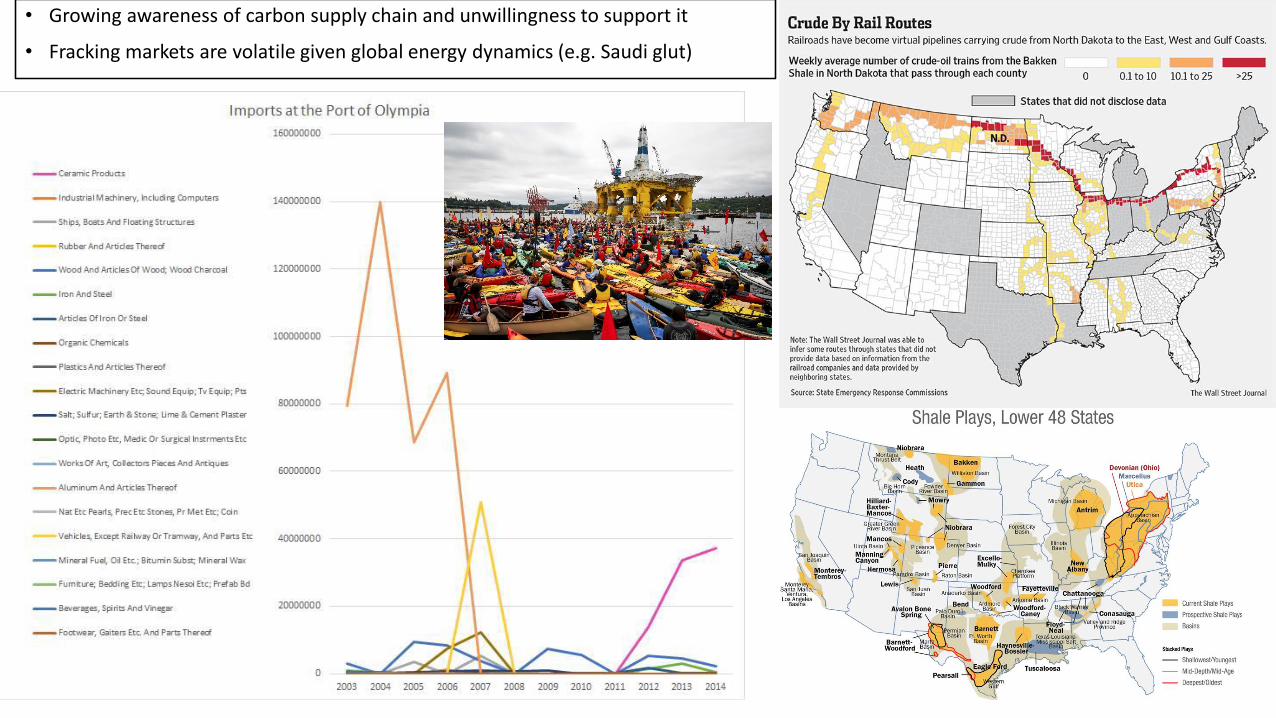
• Growing awareness of carbon supply chain and unwillingness to support it
• Fracking markets are volatile given global energy dynamics (e.g. Saudi glut)
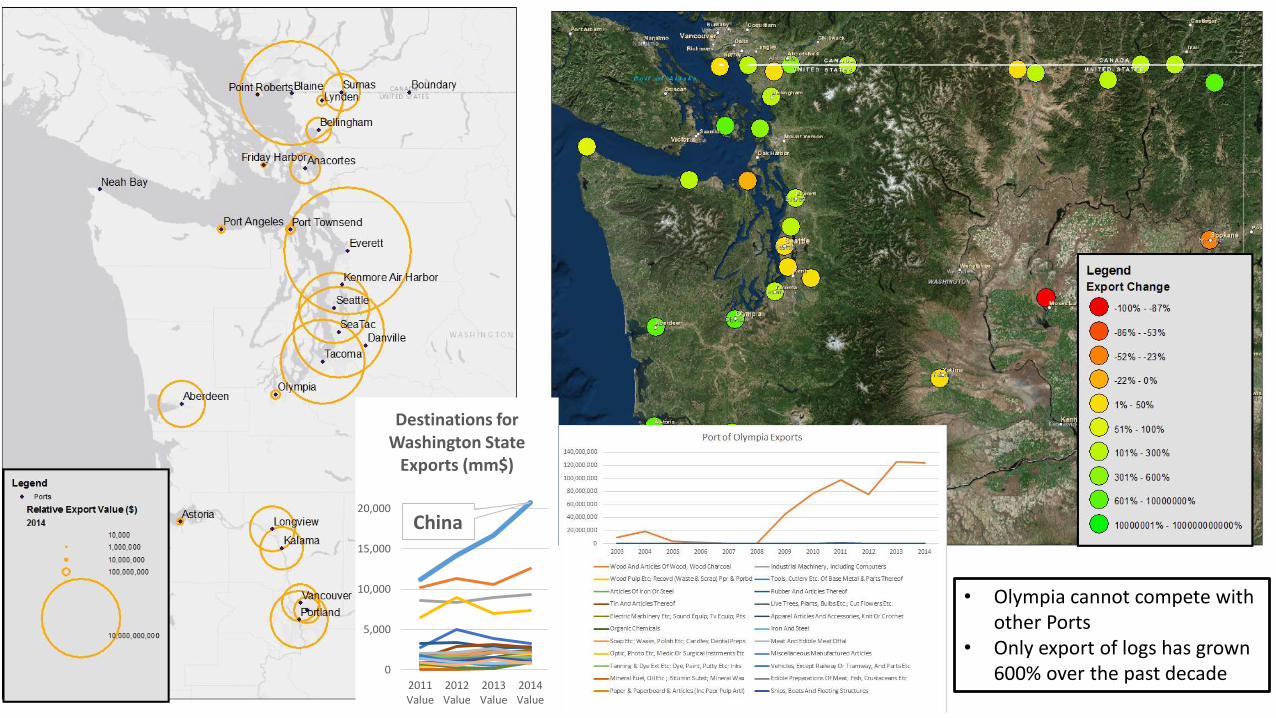
• Olympia cannot compete with other Ports
• Only export of logs has grown 600% over the past decade
China
0
5,000
10,000
15,000
20,000
2011Value
2012Value
2013Value
2014Value
Destinations for Washington State
Exports (mm$)
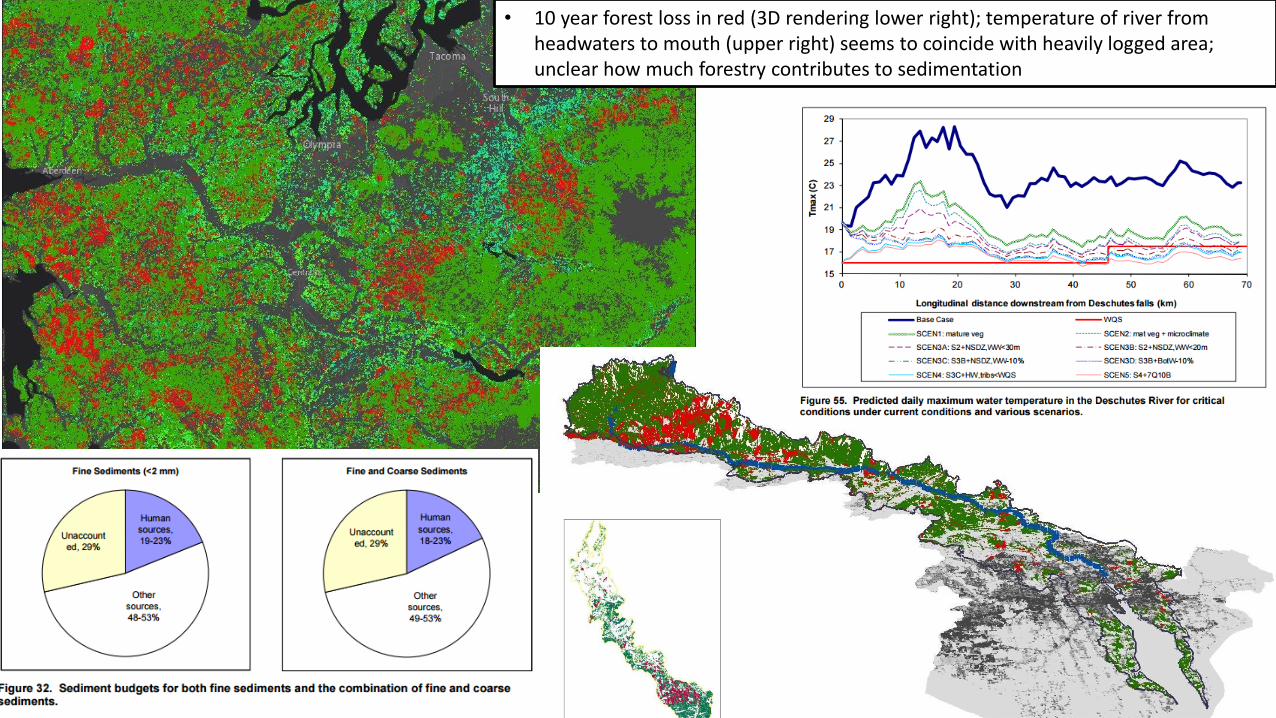
• 10 year forest loss in red (3D rendering lower right); temperature of river from headwaters to mouth (upper right) seems to coincide with heavily logged area; unclear how much forestry contributes to sedimentation

• 1992-2001 forestry activity in the Deschutes watershed; the graph on the left shows loss (left bar) and regrowth (right bar)
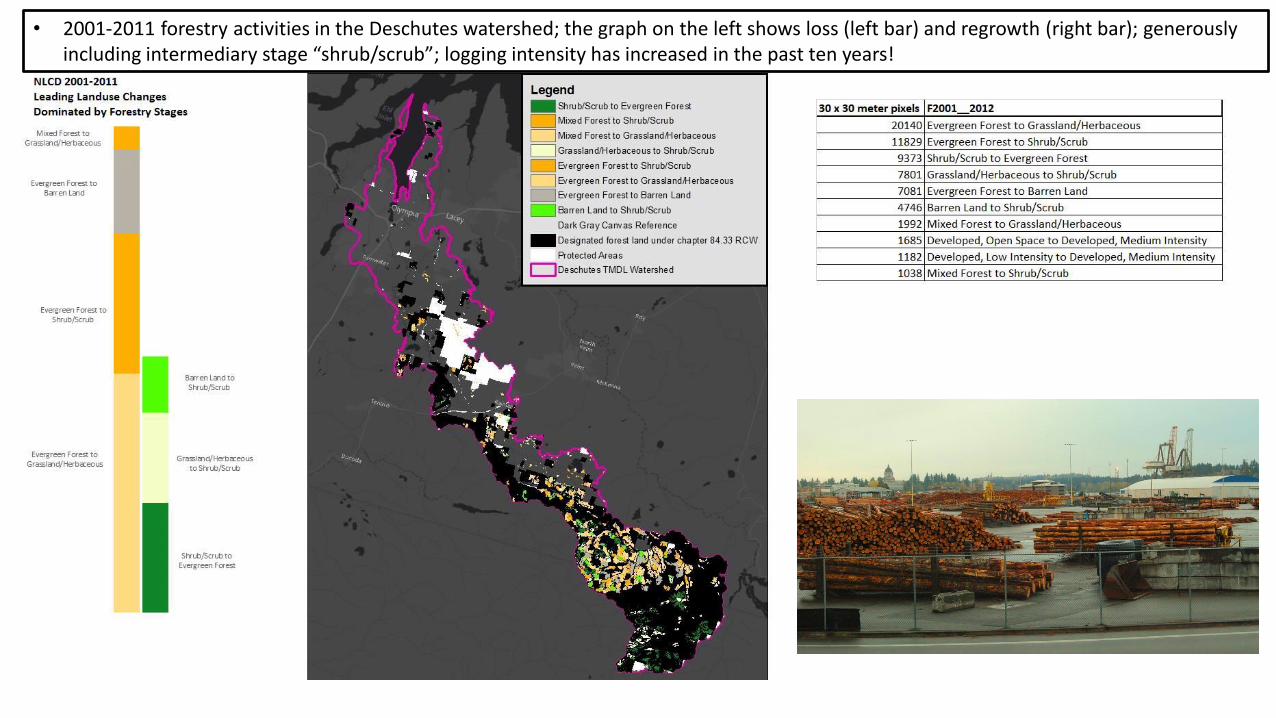
• 2001-2011 forestry activities in the Deschutes watershed; the graph on the left shows loss (left bar) and regrowth (right bar); generously including intermediary stage “shrub/scrub”; logging intensity has increased in the past ten years!

CIVILIAN AIRCRAFT, ENGINES,
AND PARTS53%
Other21%
SOYBEANS, NESOI6%
PETROL OIL BITUM MINERAL (NT CRUD) ETC NT BIO3%
PASS VEH SPK-IG INT COM RCPR P ENG >1500 NOV2%
WHEAT AND MESLIN, NESOI2%
CORN (MAIZE), OTHER THAN SEED CORN2%
LT OILS, PREPS GT=70% PETROLEUM/BITUM NT BIOD
1%CONIFEROUS WOOD IN THE ROUGH, NOT
TREATED
1%
AIRPLANE & OT A/C, UNLADEN WEIGHT > 15,000 KG
1%
APPLES, FRESH1%
ULTRASONIC SCANNING APPARATUS1%
POTATOES, PREPARED ETC., NO VINEGAR ETC., FRO1%
FLOURS AND MEALS OF SOYBEANS1%
SILICON CONTAIN BY WT NT < 99.99% OF SILICON
1%
FORAGE PRODUCTS NESOI (HAY, CLOVER, VETCHES,
1%DIAMONDS, NONINDUSTRIAL, WORKED
0%
FERROUS WASTE & SCRAP NESOI0%
PASS VEH SPK-IG INT COM RCPR P ENG > 3000 CC0%
ALUMINUM ALLOY RECT PLATES ETC, OVER .2 MM TH
0%
CHERRIES, FRESH, NESOI0%
MLK & CRM,CNTD,SWT,POWDR,GRAN/SOLIDS,NOV
1.5%0%
CONIFEROUS WOOD SAWN, SLICED ETC, OVER 6 MM T
0% SELF-PROPELLED WORKS TRUCKS AND FORKLIFTS, NE
0%NONELECTRICAL ARTICLES OF GRAPHITE OR
CARBON0%
PETROLEUM COKE, CALCINED0%
Value of Timber as an Export of Washington State
• Logs are more valuable as trees for the ecosystem services: flood risk reduction, river/estuary restoration, recreation, wildlife recovery
• Losing 2.3 Nisqually NWR worth of area per year out of the Port of Olympia

New Directions: From Extraction Economy to Sustainable GrowthPublic Service Strategy Examples
Economic Development (import new spending)
Tourism Promotion & Parks/Beautification
1) Restore Deschutes Estuary,2) Passenger Ferry to Seattle3) Public transit to recreation areas4) Help create model sustainable city
Economic Development & Climate Change Mitigation(increase Thurston County resident purchasing power, while reducing emissions)
Reduce Household Energy Costs 1) Grants/subsidies for householdenergy efficiency retrofits and renewable energy installations
Climate Change Mitigation & Economic Development
Public Transit 1) Ferry to Seattle 2) Public transit to recreation areas
Climate Change Adaptation Conserve and improve Ecosystemservices
Smart growth, local food, conservation, forest and wetland protection
* Consider how strategies feed off of one another = Positive Triple Bottom Line Feedback Loops
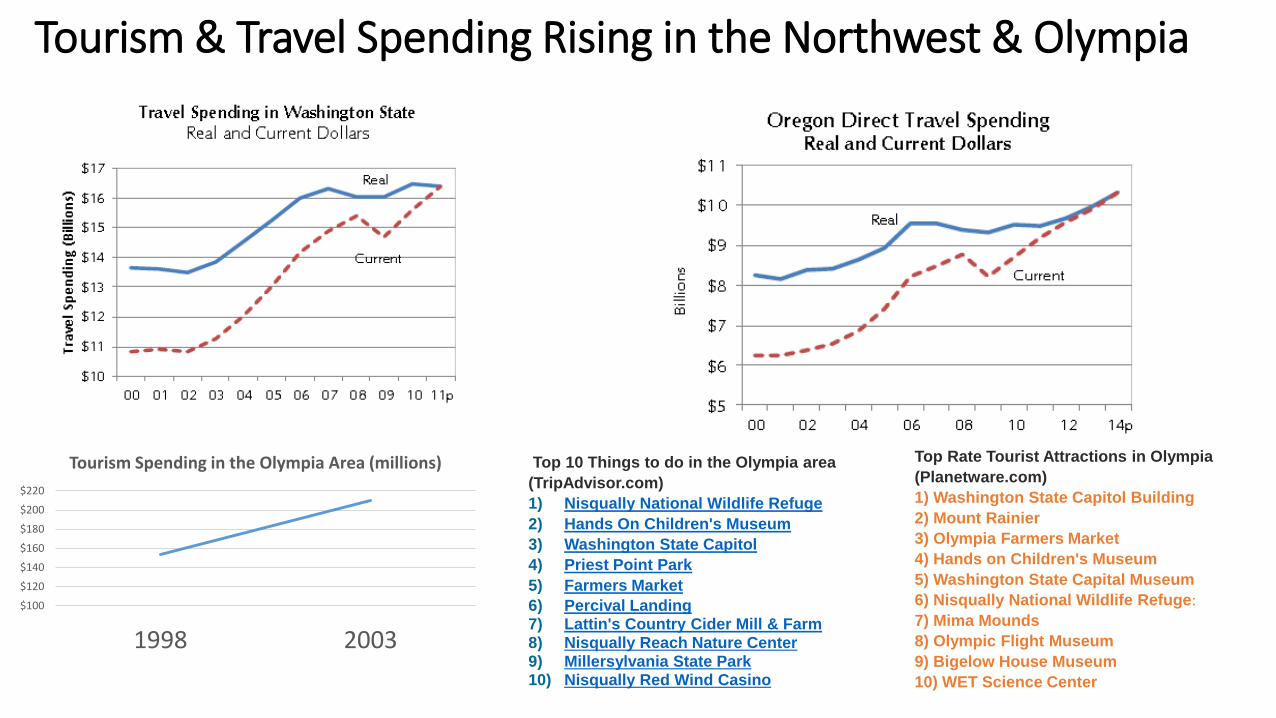
Tourism & Travel Spending Rising in the Northwest & Olympia
$100
$120
$140
$160
$180
$200
$220
1998 2003
Tourism Spending in the Olympia Area (millions) Top Rate Tourist Attractions in Olympia
(Planetware.com)
1) Washington State Capitol Building
2) Mount Rainier
3) Olympia Farmers Market
4) Hands on Children's Museum
5) Washington State Capital Museum
6) Nisqually National Wildlife Refuge:
7) Mima Mounds
8) Olympic Flight Museum
9) Bigelow House Museum
10) WET Science Center
Top 10 Things to do in the Olympia area
(TripAdvisor.com)
1) Nisqually National Wildlife Refuge
2) Hands On Children's Museum
3) Washington State Capitol
4) Priest Point Park
5) Farmers Market
6) Percival Landing7) Lattin's Country Cider Mill & Farm8) Nisqually Reach Nature Center9) Millersylvania State Park10) Nisqually Red Wind Casino

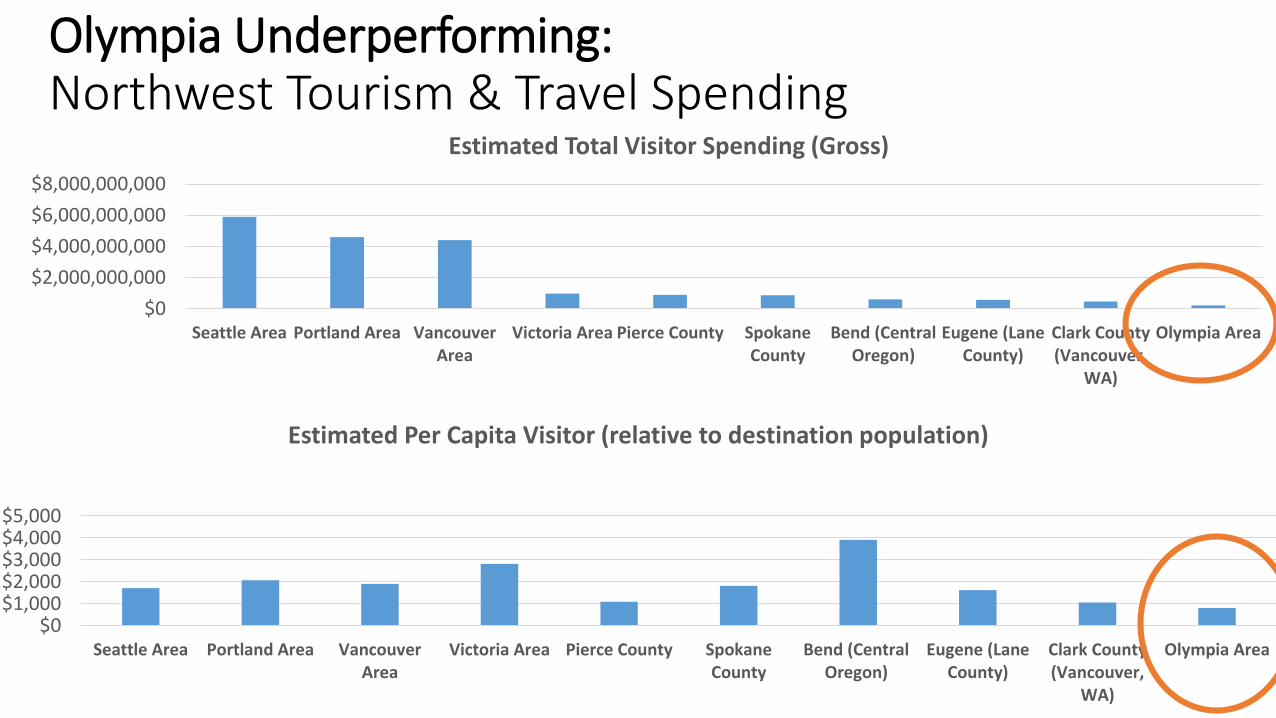
Olympia Underperforming:Northwest Tourism & Travel Spending
$0
$2,000,000,000
$4,000,000,000
$6,000,000,000
$8,000,000,000
Seattle Area Portland Area VancouverArea
Victoria Area Pierce County SpokaneCounty
Bend (CentralOregon)
Eugene (LaneCounty)
Clark County(Vancouver,
WA)
Olympia Area
Estimated Total Visitor Spending (Gross)
$0$1,000$2,000$3,000$4,000$5,000
Seattle Area Portland Area VancouverArea
Victoria Area Pierce County SpokaneCounty
Bend (CentralOregon)
Eugene (LaneCounty)
Clark County(Vancouver,
WA)
Olympia Area
Estimated Per Capita Visitor (relative to destination population)
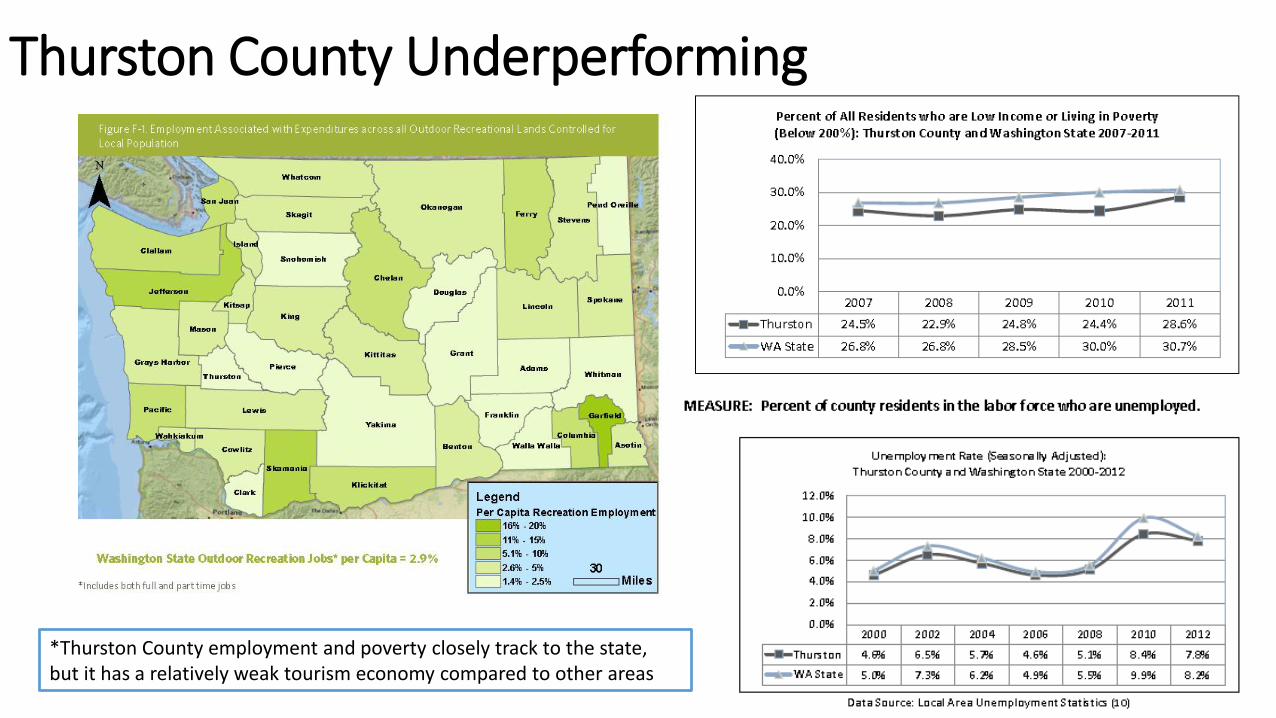
Thurston County Underperforming
*Thurston County employment and poverty closely track to the state, but it has a relatively weak tourism economy compared to other areas

*The lowest wages in the county are in tourism dependent sectors (accommodation, food services, and retail); those sectors are top employment sectors for the outdoor recreation economy
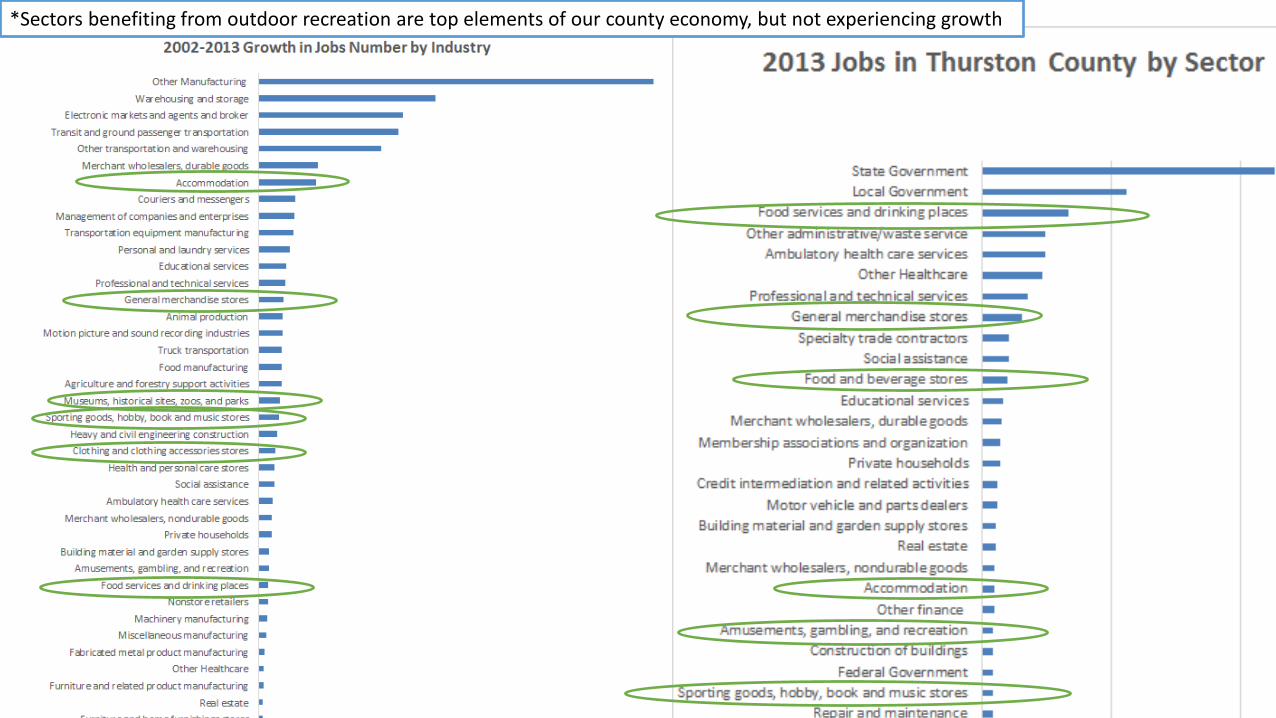
*Sectors benefiting from outdoor recreation are top elements of our county economy, but not experiencing growth
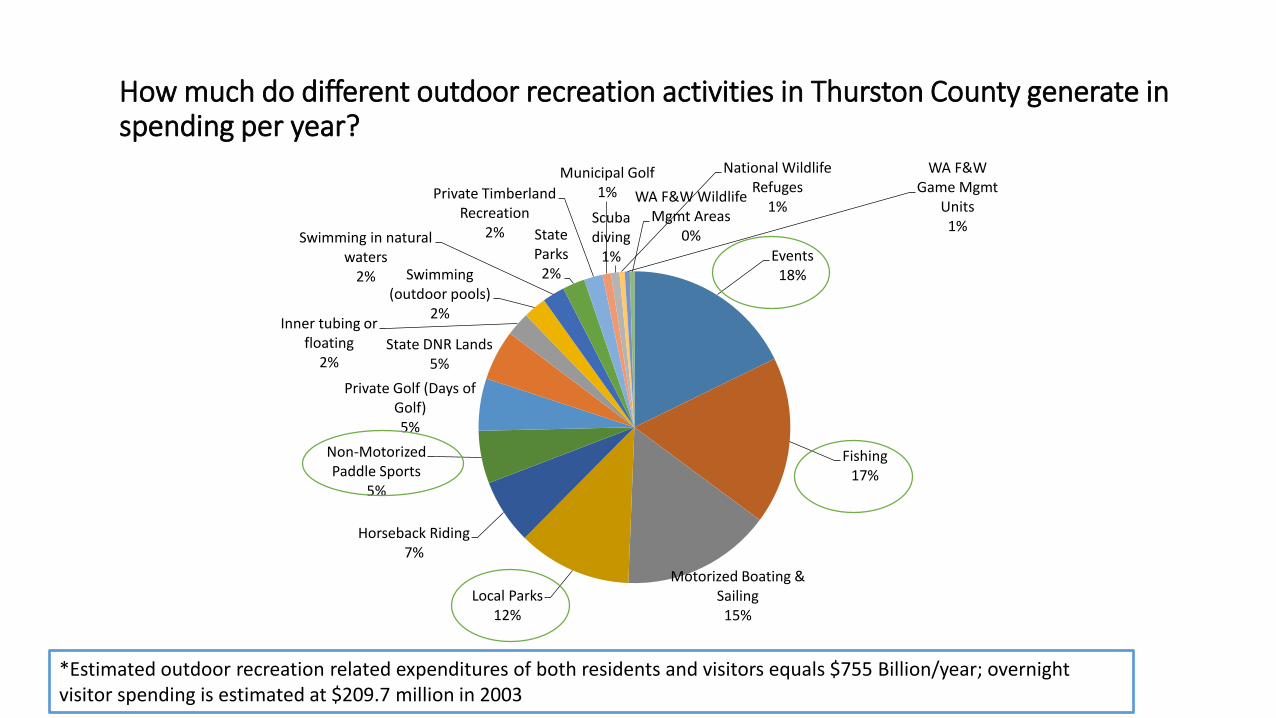
How much do different outdoor recreation activities in Thurston County generate in spending per year?
Events18%
Fishing17%
Motorized Boating & Sailing 15%
Local Parks12%
Horseback Riding 7%
Non-Motorized Paddle Sports
5%
Private Golf (Days of Golf) 5%
State DNR Lands 5%
Inner tubing or floating
2%
Swimming (outdoor pools)
2%
Swimming in natural waters
2%
State Parks
2%
Private Timberland Recreation
2%
Municipal Golf1%
Scuba diving
1%
National Wildlife Refuges
1%
WA F&W Game Mgmt
Units 1%
WA F&W Wildlife Mgmt Areas
0%
*Estimated outdoor recreation related expenditures of both residents and visitors equals $755 Billion/year; overnight visitor spending is estimated at $209.7 million in 2003

*Public Waters attract more out of state visitor spending than all Federal Lands (National Parks, Forests, Wildlife Refugres Corps of Engineers and BLM lands)! Fishing alone attracts nearly as much spending as all the national parks

Charleston, SC• Population 120,000
(=Olympia+Tumwater+Lacey)• Tourism Economy = $3 billion • (14x Olympia Area)
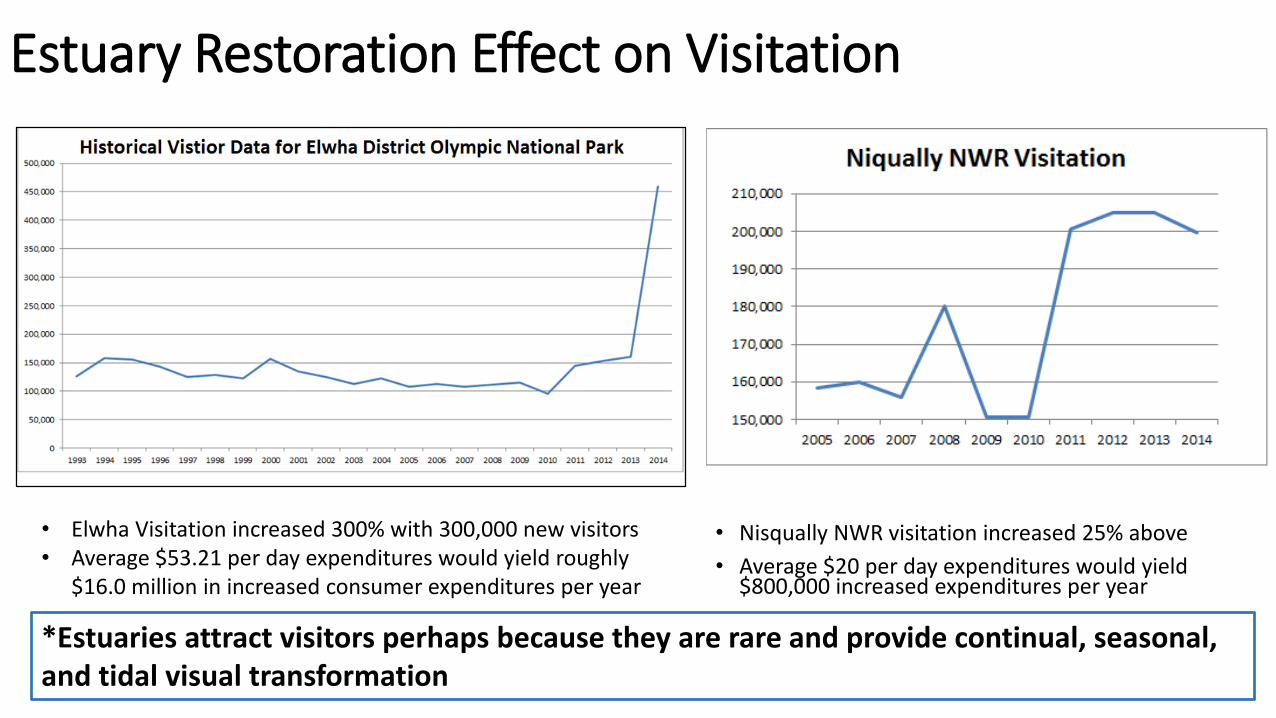
Estuary Restoration Effect on Visitation
• Elwha Visitation increased 300% with 300,000 new visitors• Average $53.21 per day expenditures would yield roughly
$16.0 million in increased consumer expenditures per year
• Nisqually NWR visitation increased 25% above
• Average $20 per day expenditures would yield $800,000 increased expenditures per year
*Estuaries attract visitors perhaps because they are rare and provide continual, seasonal, and tidal visual transformation
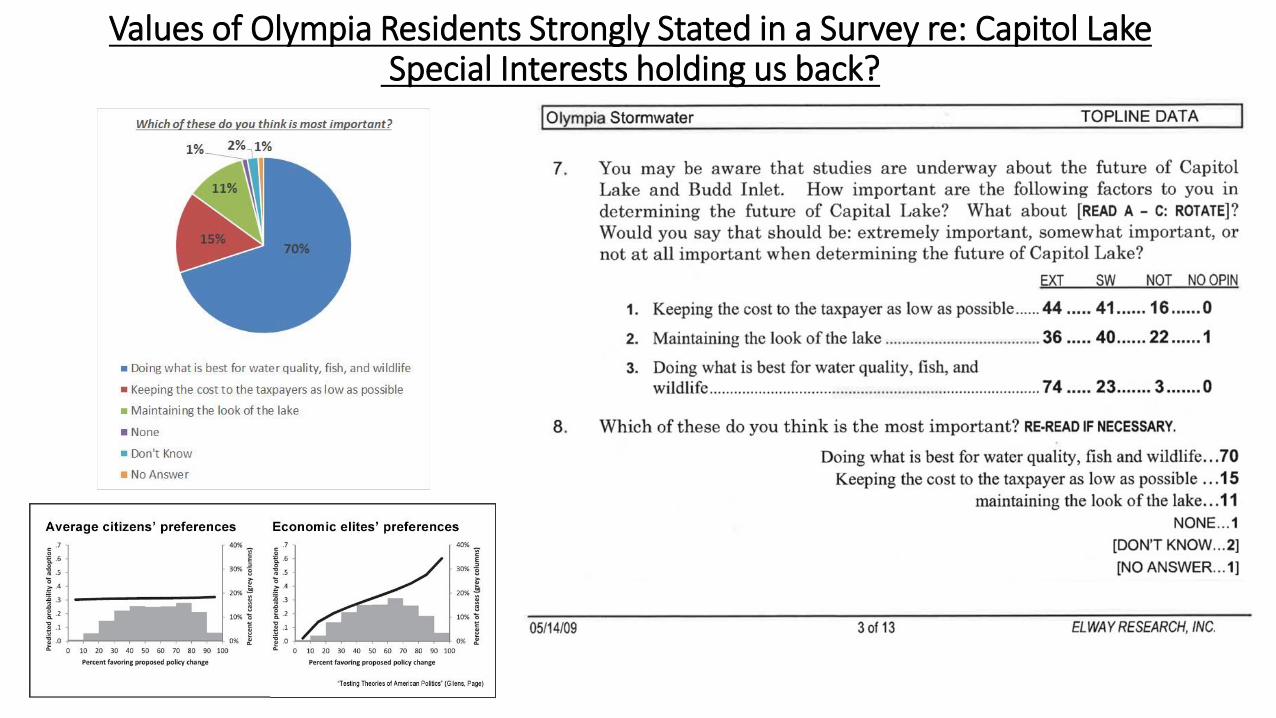
Values of Olympia Residents Strongly Stated in a Survey re: Capitol LakeSpecial Interests holding us back?

• Park acquisition strategy can be anthropocentric (left) where we see “park deserts” where dense populations (red) outside of a sensible walking distance buffer (light green) from public lands (green); or an ecological priority approach (right) where undeveloped land next to protected ecosystems can be identified
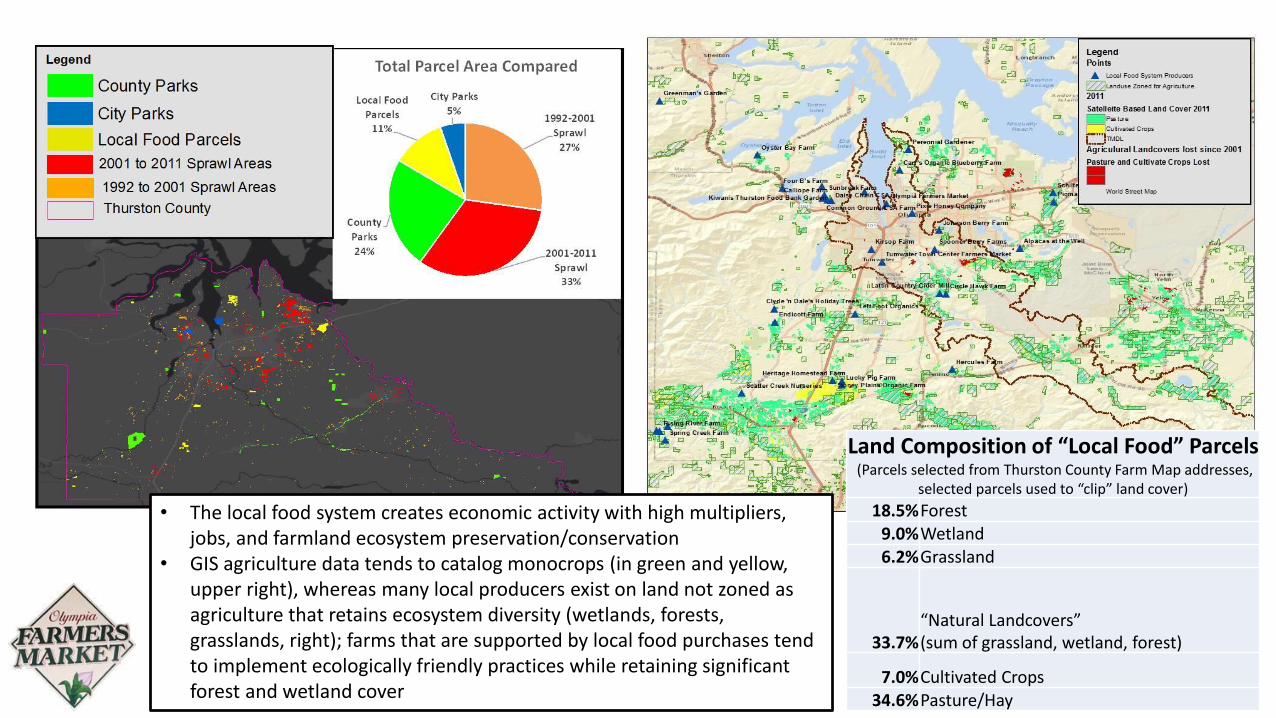
Land Composition of “Local Food” Parcels(Parcels selected from Thurston County Farm Map addresses,
selected parcels used to “clip” land cover)
18.5%Forest9.0%Wetland6.2%Grassland
33.7%“Natural Landcovers” (sum of grassland, wetland, forest)
7.0%Cultivated Crops34.6%Pasture/Hay
• The local food system creates economic activity with high multipliers, jobs, and farmland ecosystem preservation/conservation
• GIS agriculture data tends to catalog monocrops (in green and yellow, upper right), whereas many local producers exist on land not zoned as agriculture that retains ecosystem diversity (wetlands, forests, grasslands, right); farms that are supported by local food purchases tend to implement ecologically friendly practices while retaining significant forest and wetland cover

• Port funding from the public is $5million; making up s 1.5% of our local property tax burden; or about $40 or a median household (below)
• Thurston Climate Action Team surveyed the county showing theoretical willingness to pay for a County level climate adaptation/mitigation actions
• Could the Port be an effective manager of these actions?
• Mitigation ideas: subsidize home insulation improvements, renewable energy
• Adaptation ideas: flood risk reduction by conserving favorable land covers/restoring the estuary