popular annual financial report 2008
DESCRIPTION
For the year ended December 31, 2008TRANSCRIPT

once gray. now green.
2008 popular annualfinancial report
northeast ohioregional sewer district
NORTHEAST OHIO REGIONAL SEWER DISTRICTO U R M I S S I O NWe will serve our customers by leading effective wastewater and stormwater management that protects the health and environment of our region while enhancing quality of life.
3900 Euclid Avenue | Cleveland, OH 44115 | 216.881.2560also available online: www.neorsd.org/annual08
3 Letter from the Executive Director
4 Profile of the District
5 District Officials
6 Major Achievements and Initiatives
8 Communities Served by the District
9 District Service Area Map
10 Historical Number of Customer Accounts
10 Annual Metered Billing Quantities
11 Largest Customers of the District
12 Revenues and Expenses
13 Financial Highlights
14 Investment Policy
15 Revenues, Expenses, and Changes in Net Assets
16 Capital Assets and Outstanding Debt
17 Capital Asset Statistics
18 Sewage Service Rates
19 Miscellaneous Operating Statistics
TABLE OFCONTENTS
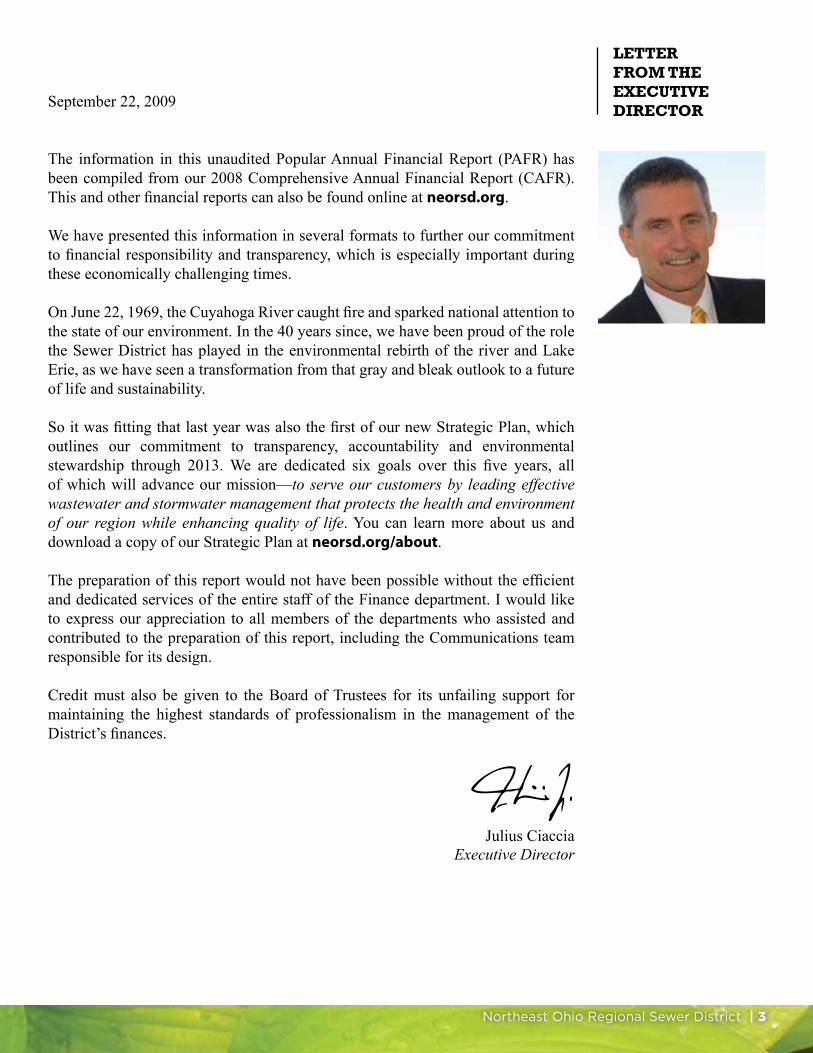
September 22, 2009
The information in this unaudited Popular Annual Financial Report (PAFR) has been compiled from our 2008 Comprehensive Annual Financial Report (CAFR). This and other financial reports can also be found online at neorsd.org.
We have presented this information in several formats to further our commitment to financial responsibility and transparency, which is especially important during these economically challenging times.
On June 22, 1969, the Cuyahoga River caught fire and sparked national attention to the state of our environment. In the 40 years since, we have been proud of the role the Sewer District has played in the environmental rebirth of the river and Lake Erie, as we have seen a transformation from that gray and bleak outlook to a future of life and sustainability.
So it was fitting that last year was also the first of our new Strategic Plan, which outlines our commitment to transparency, accountability and environmental stewardship through 2013. We are dedicated six goals over this five years, all of which will advance our mission—to serve our customers by leading effective wastewater and stormwater management that protects the health and environment of our region while enhancing quality of life. You can learn more about us and download a copy of our Strategic Plan at neorsd.org/about.
The preparation of this report would not have been possible without the efficient and dedicated services of the entire staff of the Finance department. I would like to express our appreciation to all members of the departments who assisted and contributed to the preparation of this report, including the Communications team responsible for its design.
Credit must also be given to the Board of Trustees for its unfailing support for maintaining the highest standards of professionalism in the management of the District’s finances.
Julius CiacciaExecutive Director
LETTERFROM THEEXECUTIVEDIRECTOR
Northeast Ohio Regional Sewer District | 3
4 | 40 years of progress along the Cuyahoga River
PROFILE OFTHE DISTRICT
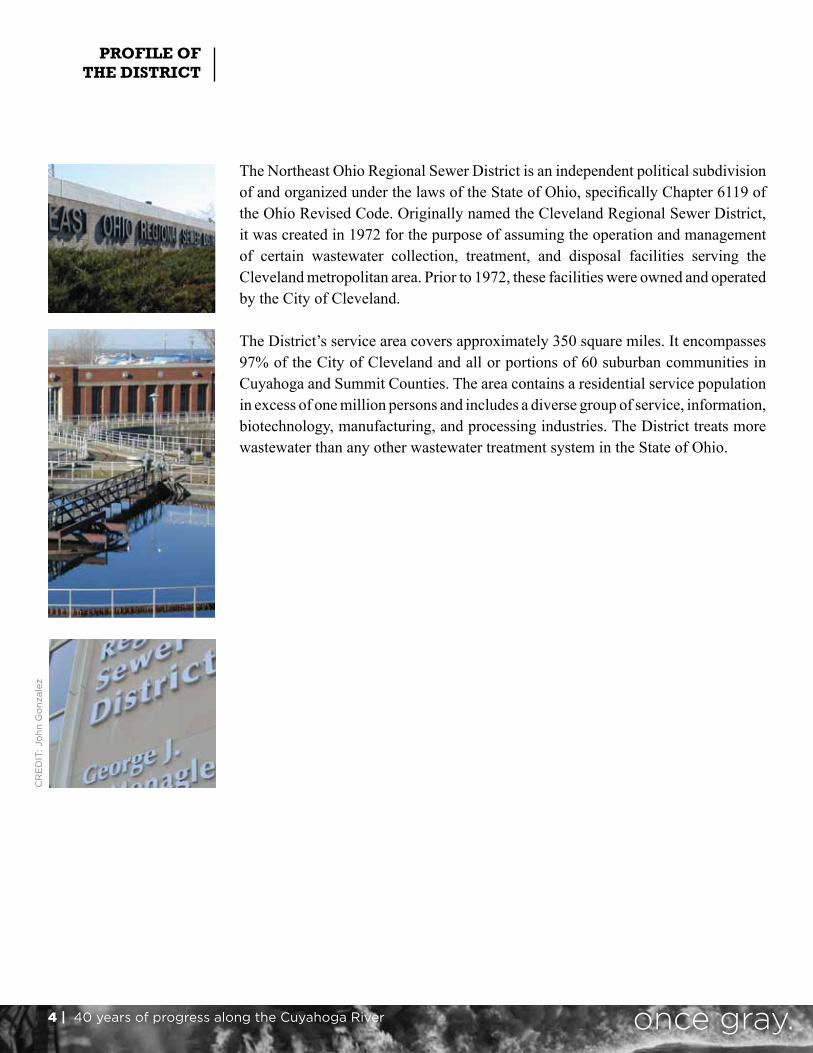
The Northeast Ohio Regional Sewer District is an independent political subdivision of and organized under the laws of the State of Ohio, specifically Chapter 6119 of the Ohio Revised Code. Originally named the Cleveland Regional Sewer District, it was created in 1972 for the purpose of assuming the operation and management of certain wastewater collection, treatment, and disposal facilities serving the Cleveland metropolitan area. Prior to 1972, these facilities were owned and operated by the City of Cleveland.
The District’s service area covers approximately 350 square miles. It encompasses 97% of the City of Cleveland and all or portions of 60 suburban communities in Cuyahoga and Summit Counties. The area contains a residential service population in excess of one million persons and includes a diverse group of service, information, biotechnology, manufacturing, and processing industries. The District treats more wastewater than any other wastewater treatment system in the State of Ohio.
CR
ED
IT: J
ohn
Go
nzal
ez

Northeast Ohio Regional Sewer District | 5
DISTRICTOFFICIALS
2008 Board of Trustees
Senior Staff
(l. to r.) Mayor Gary W. Starr Anthony D. Liberatore, Jr. Mayor Dean E. DePiero, Secretary Darnell Brown, President
Mayor Thomas J. Longo, Vice President Ronald D. Sulik Sheila J. Kelly See our 2009 Board members and profiles at neorsd.org/board
Kellie RotunnoDirector of
Engineering & Construction
David McNeeleyDirector of Operations
& Maintenance
Douglas DykesDirector of
Human Resources
Humberto SanchezDirector of
Information Technology
Jennifer DemmerleDirector of Finance
Marlene SundheimerDirector of Law
Constance HaqqDirector of
Administration & External Affairs
Frank GreenlandDirector of Watershed Programs
Julius CiacciaExecutive Director
F. Michael BucciDeputy
Executive Director
6 | 40 years of progress along the Cuyahoga River
ENVIRONMENTALSTEWARDSHIP|FISCALRESPONSIBILITY|FINANCIALTRANSPARENCY
2009-2013 Strategic Plan aligns priorities with new vision
In 2008, Executive Director Julius Ciaccia, along with the District’s leadership team, developed a plan to chart the organization’s direction for the next five years. The 2009-2013 Strategic Plan focuses the organization on greater service to our customers, stressing accountability, transparency, and environmental stewardship.
As we declare in our mission statement: We will serve out customers by leading effective wastewater and stormwater management that protects the health and environment of our region while enhancing quality of life. Our vision is to be the leading environmental organization that sustainably manages our region’s water resources to protect public health and promote economic development. The full five-year plan can be downloaded online at www.neorsd.org/about.
New program aimed at improving management of Capital Improvement Plan’s data, resources
During 2008, the District initiated a project to procure the services of a professional program manager to implement the 2009-2013 Capital Plan. Program Management will help the District manage and implement its nearly $1 billion capital improvement program and the associated available funds. The primary goal of Program Management is to improve the District’s efforts in providing an efficient and cost-effective management of information, data, and resources to better manage and implement its Capital Improvement Program. You can download the complete Capital Improvement Plan from our website at www.neorsd.org/cip.
Proposed 30-Year Combined Sewer Overflow (CSO) Program
To date, the District has invested approximately $415 million on capital improvement projects for CSO control. Additional investments at District wastewater treatment plants and the construction of interceptors and associated intercommunity relief sewers projects, at a cost of approximately $475 million, have resulted in further reductions of CSO volume. In March 2005, the District Board approved a 30-year schedule to design and construct a $1.6 billion CSO Long Term Control Plan (LTCP) to limit pollution caused by CSOs. The CSO LTCP calls for the construction of 103 miles of tunnels and connecting sewers throughout 65 construction projects and is designed to reduce targeted annual CSO discharges by 88 percent within 20 years after construction. As of December 2008, the District estimates the CSO LTCP to cost $2.3 billion considering escalation.
MAJOR ACHIEVEMENTS
AND INITIATIVESfor the year 2008
Safety, performance, reporting earn awards in 2008
During 2008 and 2009, the District’s three treatment plants received awards for the previous years’ performance from the National Association of Clean Water Agencies. Our Southerly, Easterly, and Westerly plants earned back-to-back (2007, 2008) Peak Performance Silver Awards, recognizing facilities with one or fewer National Pollutant Discharge Elimination System permit violations in a year.
The Ohio Water Environment Association (OWEA) presented two Safety Awards to District departments—our Easterly facility, and our Collection Systems staff—in 2008 for their high safety standards and sound practices.
For the 13th consecutive year, the Government Finance Officers Association of the United States and Canada awarded a Certificate of Achievement for Excellence in Financial Reporting for our 2007 Comprehensive Annual Financial Report. The GFOA also awarded its Distinguished Budget Presentation Award to the District for the second year in a row.
Northeast Ohio Regional Sewer District | 7
ENVIRONMENTALSTEWARDSHIP|FISCALRESPONSIBILITY|FINANCIALTRANSPARENCY
Community outreach, meetings increase as stormwater management program evolves
In 2008, the District procured services to help develop a Stormwater Management Program. The District’s Court Order required the District to “develop a detailed integrated capital improvement plan for regional management of wastewater collection and storm drainage”. The District has focused on the regional wastewater portion of this mandate, investing more than $2.3 billion since its inception on wastewater-related projects.
To address the regional stormwater portion of this mandate, the District is currently engaged in a Regional Stormwater Management Implementation Project. This project is designed to outline the steps necessary for the District to assume responsibility for regional stormwater management, which will help the region better manage stormwater-related problems such as flooding, erosion, and nonpoint source pollution. The District is currently discussing the details of the proposed regional stormwater management program with its member communities. Pending Board of Trustee approval of the proposed program, implementation is currently planned for mid-2010.
Renewable-energy facility will reduce emissions, conserve resources u
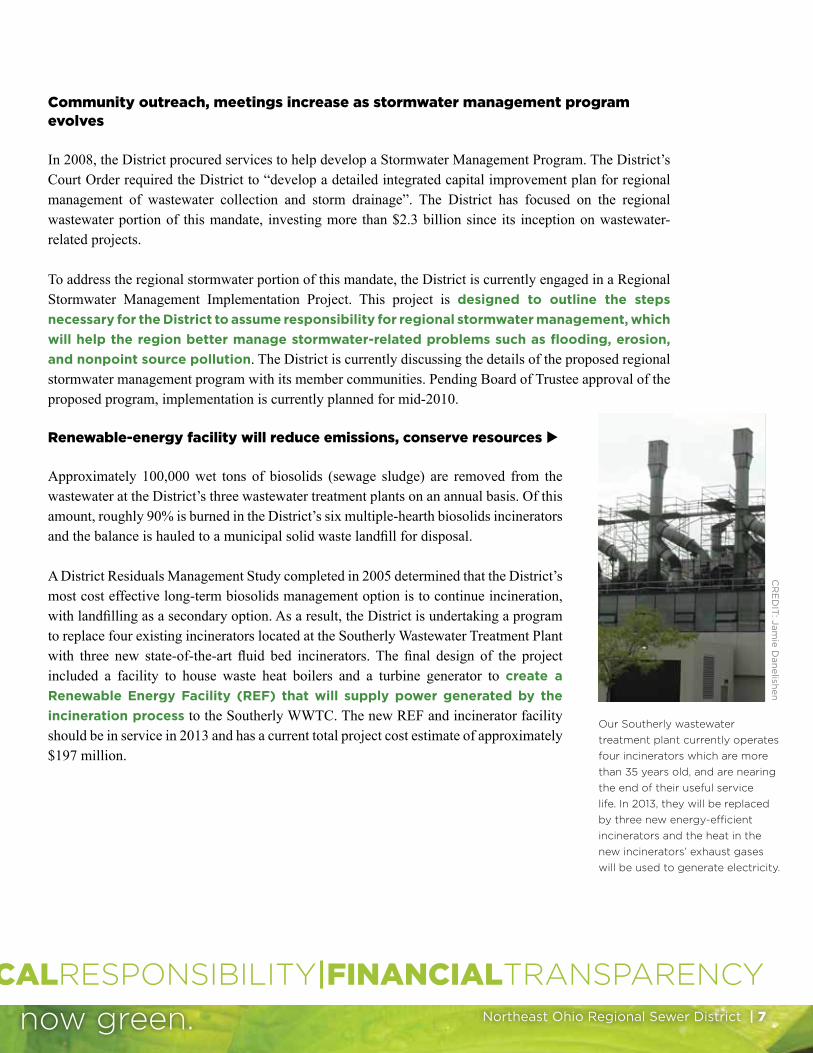
Approximately 100,000 wet tons of biosolids (sewage sludge) are removed from the wastewater at the District’s three wastewater treatment plants on an annual basis. Of this amount, roughly 90% is burned in the District’s six multiple-hearth biosolids incinerators and the balance is hauled to a municipal solid waste landfill for disposal.
A District Residuals Management Study completed in 2005 determined that the District’s most cost effective long-term biosolids management option is to continue incineration, with landfilling as a secondary option. As a result, the District is undertaking a program to replace four existing incinerators located at the Southerly Wastewater Treatment Plant with three new state-of-the-art fluid bed incinerators. The final design of the project included a facility to house waste heat boilers and a turbine generator to create a Renewable Energy Facility (REF) that will supply power generated by the incineration process to the Southerly WWTC. The new REF and incinerator facility should be in service in 2013 and has a current total project cost estimate of approximately $197 million.
Our Southerly wastewater treatment plant currently operates four incinerators which are more than 35 years old, and are nearing the end of their useful service life. In 2013, they will be replaced by three new energy-efficient incinerators and the heat in the new incinerators’ exhaust gases will be used to generate electricity.
CR
ED
IT: Jamie D
anelishen
8 | 40 years of progress along the Cuyahoga River
COMMUNITIES SERVED By THE DISTRICT AND ESTIMATED POPULATION SERVEDDecember 31, 2008NORTHEAST OHIO REGIONAL SEWER DISTRICT
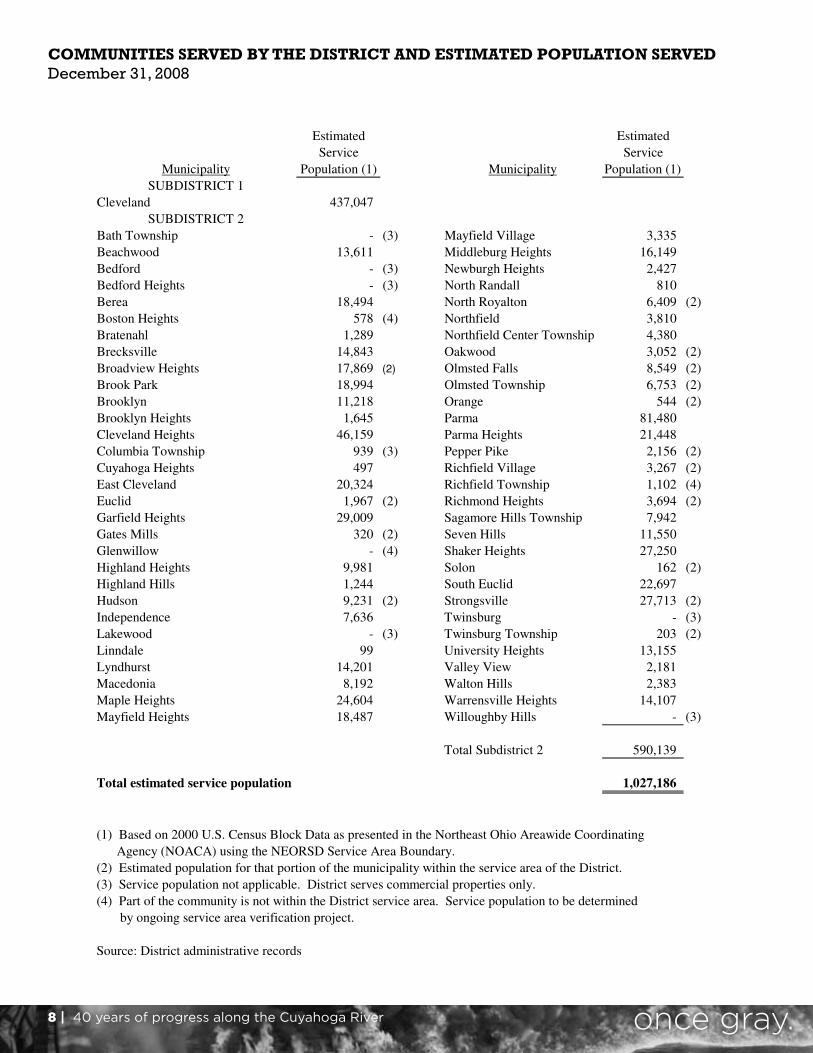
COMMUNITIES SERVED BY THE DISTRICT AND
ESTIMATED POPULATION SERVED
DECEMBER 31, 2008
Estimated Estimated
Service Service
Municipality Population (1) Municipality Population (1)
SUBDISTRICT 1
Cleveland 437,047
SUBDISTRICT 2
Bath Township - (3) Mayfield Village 3,335
Beachwood 13,611 Middleburg Heights 16,149
Bedford - (3) Newburgh Heights 2,427
Bedford Heights - (3) North Randall 810
Berea 18,494 North Royalton 6,409 (2)
Boston Heights 578 (4) Northfield 3,810
Bratenahl 1,289 Northfield Center Township 4,380
Brecksville 14,843 Oakwood 3,052 (2)
Broadview Heights 17,869 (2) Olmsted Falls 8,549 (2)
Brook Park 18,994 Olmsted Township 6,753 (2)
Brooklyn 11,218 Orange 544 (2)
Brooklyn Heights 1,645 Parma 81,480
Cleveland Heights 46,159 Parma Heights 21,448
Columbia Township 939 (3) Pepper Pike 2,156 (2)
Cuyahoga Heights 497 Richfield Village 3,267 (2)
East Cleveland 20,324 Richfield Township 1,102 (4)
Euclid 1,967 (2) Richmond Heights 3,694 (2)
Garfield Heights 29,009 Sagamore Hills Township 7,942
Gates Mills 320 (2) Seven Hills 11,550
Glenwillow - (4) Shaker Heights 27,250
Highland Heights 9,981 Solon 162 (2)
Highland Hills 1,244 South Euclid 22,697
Hudson 9,231 (2) Strongsville 27,713 (2)
Independence 7,636 Twinsburg - (3)
Lakewood - (3) Twinsburg Township 203 (2)
Linndale 99 University Heights 13,155
Lyndhurst 14,201 Valley View 2,181
Macedonia 8,192 Walton Hills 2,383
Maple Heights 24,604 Warrensville Heights 14,107
Mayfield Heights 18,487 Willoughby Hills - (3)
Total Subdistrict 2 590,139
Total estimated service population 1,027,186
(1) Based on 2000 U.S. Census Block Data as presented in the Northeast Ohio Areawide Coordinating
Agency (NOACA) using the NEORSD Service Area Boundary.
(2) Estimated population for that portion of the municipality within the service area of the District.
(3) Service population not applicable. District serves commercial properties only.
(4) Part of the community is not within the District service area. Service population to be determined
by ongoing service area verification project.
Source: District administrative records
58
Northeast Ohio Regional Sewer District | 9
PEPPER PIKE
WOODMERE
BATH TOWNSHIP
MAYFIELDHEIGHTS
BAY VILLAGE
WESTLAKE
NORTH OLMSTED
ROCKY RIVER
LAKEWOOD
FAIRVIEWPARK
BROOK PARK
COLUMBIATOWNSHIP
STRONGSVILLE
LIVERPOOLTOWNSHIP
NORTH ROYALTON
BRUNSWICK
BRUNSWICK HILLS TOWNSHIP
HINCKLEYTOWNSHIP
BROADVIEWHEIGHTS
BRECKSVILLE
RICHFIELDTWP.
RICHFIELD VILLAGE
PENINSULA
BOSTONTOWNSHIP BOSTON
HEIGHTS
HUDSON
MACEDONIA
TWINSBURG TOWNSHIP
TWINSBURG
OAKWOODWALTON
HILLS
BEDFORD
MAPLE HEIGHTS BEDFORDHEIGHTS
SOLON
SAGAMOREHILLS
INDEPENDENCE
PARMA SEVENHILLS
VALLEYVIEWMIDDLEBURG
HEIGHTSBEREA
OLMSTEDTOWNSHIP
BROOKLYNLINNDALE
GARFIELDHEIGHTS
CUYAHOGA HEIGHTSNEWBURGH HEIGHTS
CLEVELAND
SHAKER HEIGHTS
BEACHWOOD
UNIVERSITYHEIGHTS
ORANGE
MORELAND HILLS
LYNDHURST
HIGHLANDHEIGHTS
MAYFIELD
EUCLID
WICKLIFFE
WILLOUGHBY HILLS
GATES MILLS
HUNTINGVALLEY
PARMAHEIGHTS
Lake Erie
OLMSTEDFALLS
BROOKLYNHEIGHTS
HIGHLANDHILLS
WARRENSVILLEHEIGHTS
RICHMONDHEIGHTS
BENTLEYVILLE
GLENWILLOW
EASTCLEVELAND
NORTH RANDALL
CLEVELANDHEIGHTS
SOUTHEUCLID
NORTHFIELDCENTER TWP.
NORTHFIELDVILLAGE
RICHFIELDTWP.
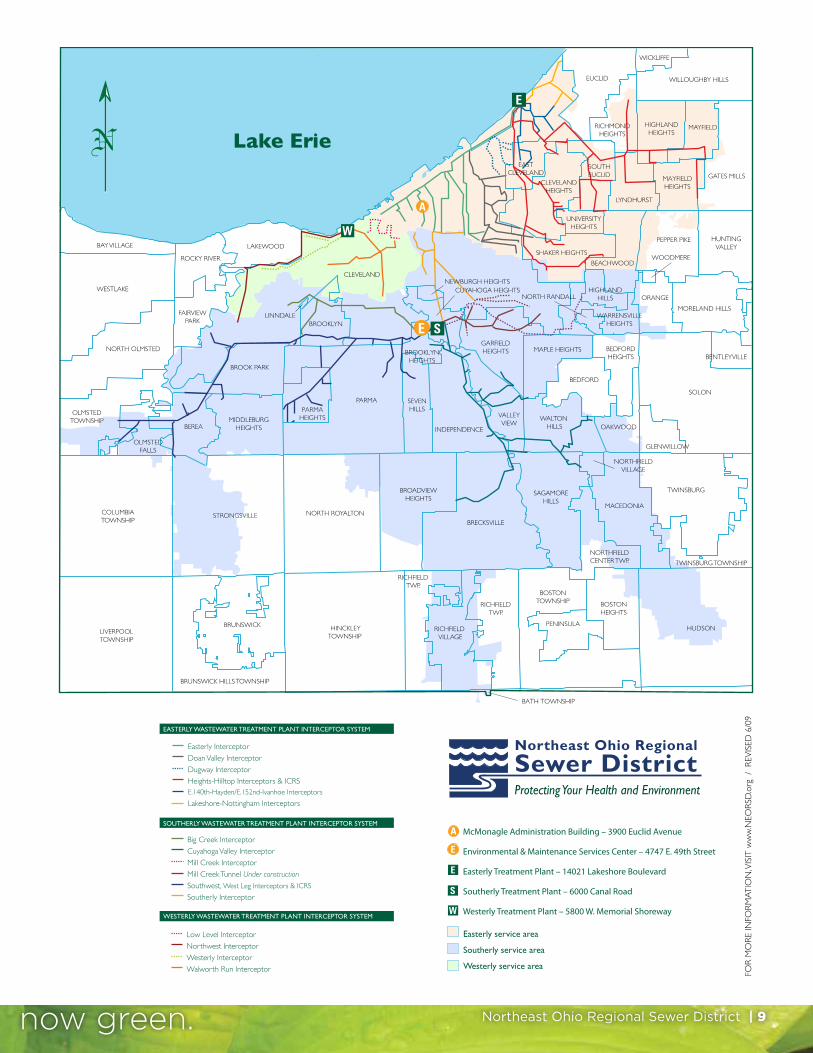
McMonagle Administration Building – 3900 Euclid Avenue
Environmental & Maintenance Services Center – 4747 E. 49th Street
Easterly Treatment Plant – 14021 Lakeshore Boulevard
Southerly Treatment Plant – 6000 Canal Road
Westerly Treatment Plant – 5800 W. Memorial Shoreway
Easterly Interceptor
Doan Valley Interceptor
Dugway Interceptor
Heights-Hilltop Interceptors & ICRSE.140th-Hayden/E.152nd-Ivanhoe Interceptors
Lakeshore-Nottingham Interceptors
Big Creek Interceptor
Cuyahoga Valley Interceptor
Mill Creek Interceptor
Mill Creek Tunnel Under construction
Southwest, West Leg Interceptors & ICRS
Southerly Interceptor
Low Level Interceptor
Northwest Interceptor
Westerly Interceptor
Walworth Run Interceptor
WESTERLY WASTEWATER TREATMENT PLANT INTERCEPTOR SYSTEM
SOUTHERLY WASTEWATER TREATMENT PLANT INTERCEPTOR SYSTEM
EASTERLY WASTEWATER TREATMENT PLANT INTERCEPTOR SYSTEM
Easterly service area
Southerly service area
Westerly service area
FOR
MO
RE IN
FORM
ATIO
N, V
ISIT
ww
w.N
EORS
D.o
rg /
REV
ISED
6/0
9
10 | 40 years of progress along the Cuyahoga River
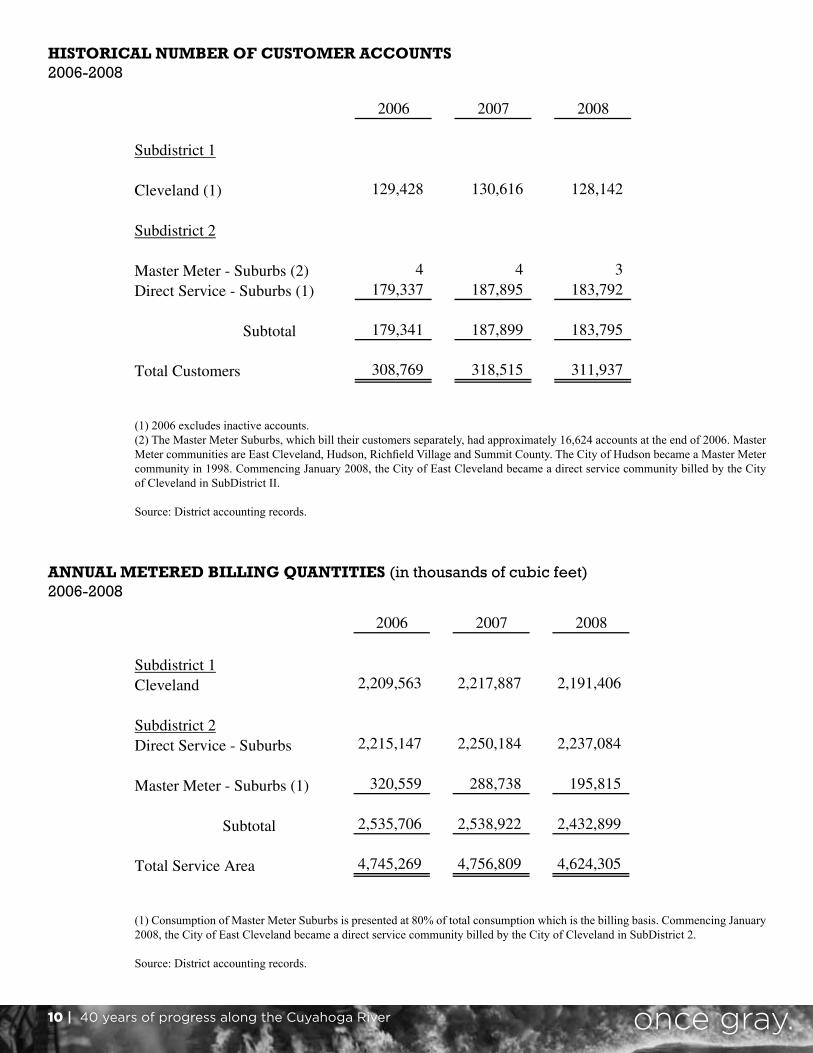
HISTORICAL NUMBER OF CUSTOMER ACCOUNTS2006-2008
ANNUAL METERED BILLINg qUANTITIES (in thousands of cubic feet)2006-2008
2003 2004 2005 2006 2007 2008
132,541 137,746 133,054 129,428 130,616 128,142
4 4 4 4 4 3
175,652 175,293 179,035 179,337 187,895 183,792
175,656 175,297 179,039 179,341 187,899 183,795
308,197 313,043 312,093 308,769 318,515 311,937
75
NORTHEAST OHIO REGIONAL SEWER DISTRICT
HISTORICAL NUMBER OF CUSTOMER ACCOUNTS
LAST TEN YEARS
1999 2000 2001 2002
Subdistrict 1
Cleveland (1) 136,234 132,801 136,332 133,611
Subdistrict 2
Master Meter - Suburbs (2) 4 4 4 4
Direct Service - Suburbs (1) 170,032 171,712 174,264 175,194
Subtotal 170,036 171,716 174,268 175,198
Total Customers 306,270 304,517 310,600 308,809
(1) 2000 through 2006 exclude inactive accounts.
(2) The Master Meter Suburbs, which bill their customers separately, had approximately
16,624 accounts at the end of 2006. Master Meter communities are East Cleveland,
Hudson, Richfield Village and Summit County. The City of Hudson became a
Master Meter community in 1998. Commencing January 2008, the City of East Cleveland
became a direct service community billed by the City of Cleveland in SubDistrict II.
Source: District accounting records.
74
2003 2004 2005 2006 2007 2008
2,495,126 2,379,632 2,370,567 2,209,563 2,217,887 2,191,406
2,287,825 2,241,819 2,288,026 (3) 2,215,147 2,250,184 2,237,084
311,185 309,366 311,109 320,559 288,738 195,815
2,599,010 2,551,185 2,599,135 2,535,706 2,538,922 2,432,899
5,094,136 4,930,817 4,969,702 4,745,269 4,756,809 4,624,305
77
NORTHEAST OHIO REGIONAL SEWER DISTRICT
ANNUAL METERED BILLING QUANTITIES
LAST TEN YEARS
(IN THOUSANDS OF CUBIC FEET)
1999 2000 2001 2002
Subdistrict 1
Cleveland 2,919,241 2,815,865 2,665,282 (3) 2,662,602
Subdistrict 2
Direct Service - Suburbs 2,553,481 2,427,096 2,387,609 2,231,962
Master Meter - Suburbs (1) 312,566 (2) 357,254 289,805 296,942
Subtotal 2,866,047 2,784,350 2,677,414 2,528,904
Total Service Area 5,785,288 5,600,215 5,342,696 5,191,506
(1) Consumption of Master Meter Suburbs is presented at 80% of total
consumption which is the billing basis. Commencing January 2008, the City
of East Cleveland became a direct service community billed by the City
of Cleveland in SubDistrict 2.
(2) 1999 includes the City of Hudson for the first time. Although Hudson joined
the District in late 1998, they did not receive sewer bills and they were not
included on the District billing roster until 1999.
(3) Restated 2005 and 2001 for consumption adjustment.
Source: District accounting records.
76
(1) 2006 excludes inactive accounts.(2) The Master Meter Suburbs, which bill their customers separately, had approximately 16,624 accounts at the end of 2006. Master Meter communities are East Cleveland, Hudson, Richfield Village and Summit County. The City of Hudson became a Master Meter community in 1998. Commencing January 2008, the City of East Cleveland became a direct service community billed by the City of Cleveland in SubDistrict II.
Source: District accounting records.
(1) Consumption of Master Meter Suburbs is presented at 80% of total consumption which is the billing basis. Commencing January 2008, the City of East Cleveland became a direct service community billed by the City of Cleveland in SubDistrict 2.
Source: District accounting records.
Northeast Ohio Regional Sewer District | 11
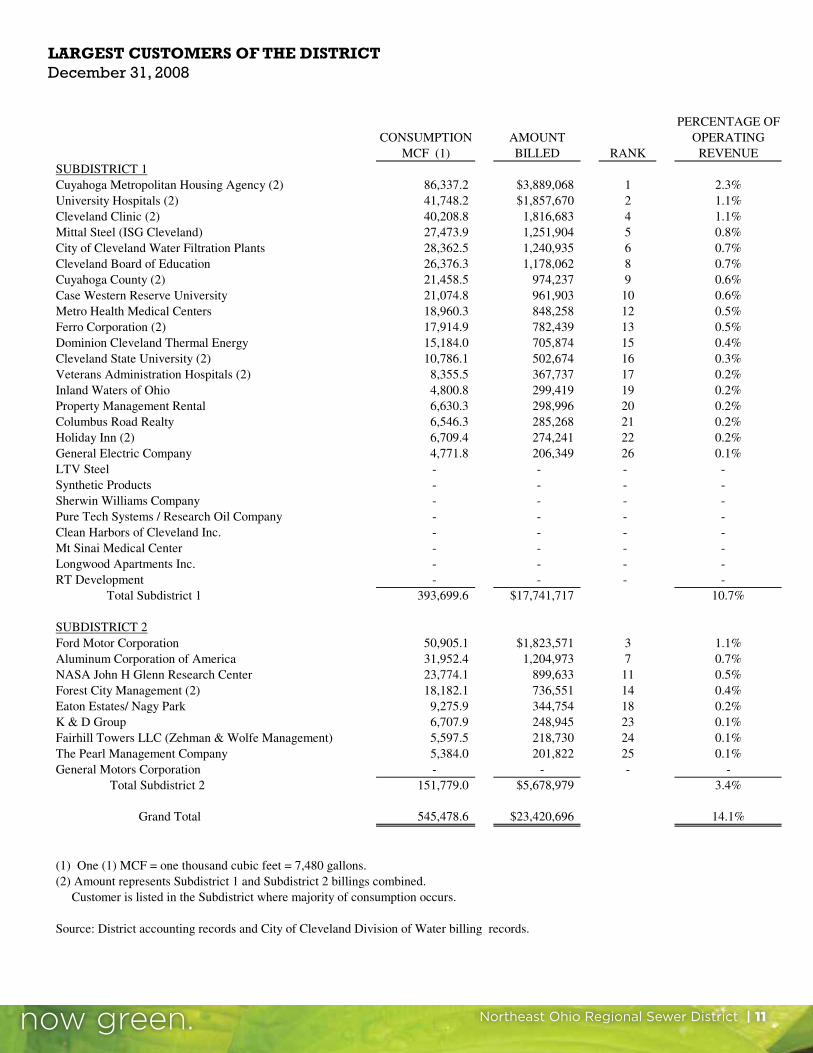
LARgEST CUSTOMERS OF THE DISTRICTDecember 31, 2008
NORTHEAST OHIO REGIONAL SEWER DISTRICT
LARGEST CUSTOMERS OF THE DISTRICT
AS OF DECEMBER 31, 2008
and NINE YEARS PRIOR
2008
PERCENTAGE OF
CONSUMPTION AMOUNT OPERATING
MCF (1) BILLED RANK REVENUE
SUBDISTRICT 1
Cuyahoga Metropolitan Housing Agency (2) 86,337.2 $3,889,068 1 2.3%
University Hospitals (2) 41,748.2 $1,857,670 2 1.1%
Cleveland Clinic (2) 40,208.8 1,816,683 4 1.1%
Mittal Steel (ISG Cleveland) 27,473.9 1,251,904 5 0.8%
City of Cleveland Water Filtration Plants 28,362.5 1,240,935 6 0.7%
Cleveland Board of Education 26,376.3 1,178,062 8 0.7%
Cuyahoga County (2) 21,458.5 974,237 9 0.6%
Case Western Reserve University 21,074.8 961,903 10 0.6%
Metro Health Medical Centers 18,960.3 848,258 12 0.5%
Ferro Corporation (2) 17,914.9 782,439 13 0.5%
Dominion Cleveland Thermal Energy 15,184.0 705,874 15 0.4%
Cleveland State University (2) 10,786.1 502,674 16 0.3%
Veterans Administration Hospitals (2) 8,355.5 367,737 17 0.2%
Inland Waters of Ohio 4,800.8 299,419 19 0.2%
Property Management Rental 6,630.3 298,996 20 0.2%
Columbus Road Realty 6,546.3 285,268 21 0.2%
Holiday Inn (2) 6,709.4 274,241 22 0.2%
General Electric Company 4,771.8 206,349 26 0.1%
LTV Steel - - - -
Synthetic Products - - - -
Sherwin Williams Company - - - -
Pure Tech Systems / Research Oil Company - - - -
Clean Harbors of Cleveland Inc. - - - -
Mt Sinai Medical Center - - - -
Longwood Apartments Inc. - - - -
RT Development - - - -
Total Subdistrict 1 393,699.6 $17,741,717 10.7%
SUBDISTRICT 2
Ford Motor Corporation 50,905.1 $1,823,571 3 1.1%
Aluminum Corporation of America 31,952.4 1,204,973 7 0.7%
NASA John H Glenn Research Center 23,774.1 899,633 11 0.5%
Forest City Management (2) 18,182.1 736,551 14 0.4%
Eaton Estates/ Nagy Park 9,275.9 344,754 18 0.2%
K & D Group 6,707.9 248,945 23 0.1%
Fairhill Towers LLC (Zehman & Wolfe Management) 5,597.5 218,730 24 0.1%
The Pearl Management Company 5,384.0 201,822 25 0.1%
General Motors Corporation - - - -
Total Subdistrict 2 151,779.0 $5,678,979 3.4%
Grand Total 545,478.6 $23,420,696 14.1%
(1) One (1) MCF = one thousand cubic feet = 7,480 gallons.
(2) Amount represents Subdistrict 1 and Subdistrict 2 billings combined.
Customer is listed in the Subdistrict where majority of consumption occurs.
Source: District accounting records and City of Cleveland Division of Water billing records.
60
12 | 40 years of progress along the Cuyahoga River
REVENUES (in thousands)
NORTHEAST OHIO REGIONAL SEWER DISTRICT
Management’s Discussion and Analysis
Condensed Statements of Revenues, Expenses and Changes in Net Assets
For the years ended December 31, (In Thousands)
Change
2008 2007 Amount %
Change in net assets 19,648 20,361 (713) (3.5%)
Net assets at beginning of year 1,260,299 1,239,938 20,361 1.6%
Net assets at end of year $1,279,947 $1,260,299 $19,648 1.6%
Operating revenue consists of user charges for sewage service fees based on water consumption. Operating expenses reflect the cost of providing these services. For the year ended December 31, 2008: Operating revenue increased by $7,102,943 (4.5%) compared to 2007. The increase was due mainly
to higher billing rates in 2008. Non-operating revenue increased by $29,142 (0.18%). Non-operating revenue consists of interest
income, non-operating grants, and the change in fair value of investments. Interest income decreased by $702,589 (5.7%) due to lower interest rates on available balances for investment. The decrease in fair value of investments for 2008 was $824,991 (26.2%) lower in 2007. This decrease is expected to continue due to the recession. Non-operating grant revenue increased $1,556,722 (4,448.6%) due to the receipt of funds for Water Resource Sponsorship program in 2008.
Operating expenses increased $7,695,986 (6.0%) compared to 2007. Main components of operating expenses increased as follows:
• Salaries and Wages increased $1,377,736 (4.1%)
• Utilities increased $1,739,589 (9.2%) due to increase usage and higher rates.
• Professional and Contractual expenses increased $3,918,742 (26.5%) due mainly to an adjustment to construction in progress account related to costs of studies initially capitalized that needed to be reclass to operating expenses in accordance with GASB Statement No. 51.
Non-operating expenses increased $149,829 (0.58%). Interest expense increased by $173,553 (0.8%). Losses on equipment disposals decreased $287,912 (61.5%) due mainly to disposals of obsolete equipment parts in 2007. Non-operating grant expense increased $264,188 (28.1%) due to expenses for West Creek Restoration project.
The following table on the next page summarizes the changes in revenues and expenses for the District between 2007 and 2006.
7
EXPENSES (in thousands)
NORTHEAST OHIO REGIONAL SEWER DISTRICT
Management’s Discussion and Analysis
Condensed Statements of Revenues, Expenses and Changes in Net Assets
For the years ended December 31, (In Thousands)
Change
2008 2007 Amount %
Change in net assets 19,648 20,361 (713) (3.5%)
Net assets at beginning of year 1,260,299 1,239,938 20,361 1.6%
Net assets at end of year $1,279,947 $1,260,299 $19,648 1.6%
Operating revenue consists of user charges for sewage service fees based on water consumption. Operating expenses reflect the cost of providing these services. For the year ended December 31, 2008: Operating revenue increased by $7,102,943 (4.5%) compared to 2007. The increase was due mainly
to higher billing rates in 2008. Non-operating revenue increased by $29,142 (0.18%). Non-operating revenue consists of interest
income, non-operating grants, and the change in fair value of investments. Interest income decreased by $702,589 (5.7%) due to lower interest rates on available balances for investment. The decrease in fair value of investments for 2008 was $824,991 (26.2%) lower in 2007. This decrease is expected to continue due to the recession. Non-operating grant revenue increased $1,556,722 (4,448.6%) due to the receipt of funds for Water Resource Sponsorship program in 2008.
Operating expenses increased $7,695,986 (6.0%) compared to 2007. Main components of operating expenses increased as follows:
• Salaries and Wages increased $1,377,736 (4.1%)
• Utilities increased $1,739,589 (9.2%) due to increase usage and higher rates.
• Professional and Contractual expenses increased $3,918,742 (26.5%) due mainly to an adjustment to construction in progress account related to costs of studies initially capitalized that needed to be reclass to operating expenses in accordance with GASB Statement No. 51.
Non-operating expenses increased $149,829 (0.58%). Interest expense increased by $173,553 (0.8%). Losses on equipment disposals decreased $287,912 (61.5%) due mainly to disposals of obsolete equipment parts in 2007. Non-operating grant expense increased $264,188 (28.1%) due to expenses for West Creek Restoration project.
The following table on the next page summarizes the changes in revenues and expenses for the District between 2007 and 2006.
7
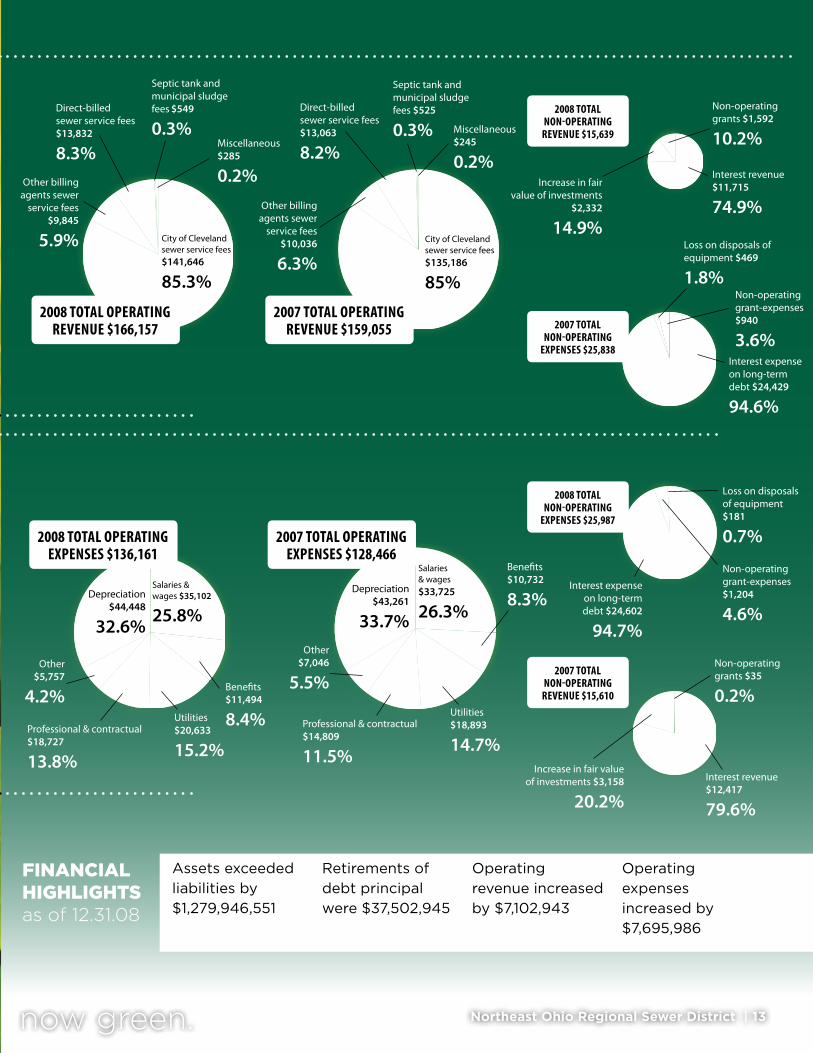
FINANCIALHIGHLIGHTSas of 12.31.08
Assets exceeded liabilities by $1,279,946,551
Retirements of debt principal were $37,502,945
Operating revenue increased by $7,102,943
Operating expenses increased by $7,695,986
Northeast Ohio Regional Sewer District | 13
2007 total operating revenue $159,055
City of Cleveland sewer service fees $135,186
85%
Other billing agents sewer
service fees $10,036
6.3%
Direct-billed sewer service fees $13,063
8.2%
Septic tank and municipal sludge fees $525
0.3% Miscellaneous $245
0.2%
2008 total operating revenue $166,157
City of Cleveland sewer service fees $141,646
85.3%
Other billing agents sewer
service fees $9,845
5.9%
Direct-billed sewer service fees $13,832
8.3%
Septic tank and municipal sludge fees $549
0.3%Miscellaneous $285
0.2%
2008 total operating eXpenSeS $136,161
Salaries & wages $35,102
25.8%
Benefits $11,494
8.4%Utilities $20,633
15.2%Professional & contractual $18,727
13.8%
Other $5,757
4.2%
Depreciation $44,448
32.6%
2007 total operating eXpenSeS $128,466
Salaries & wages $33,725
26.3%
Benefits $10,732
8.3%
Utilities $18,893
14.7%Professional & contractual $14,809
11.5%
Other $7,046
5.5%
Depreciation $43,261
33.7%
Interest expense on long-term debt $24,429
94.6%
Loss on disposals of equipment $469
1.8%
2007 total non-operating
eXpenSeS $25,838
Non-operating grant-expenses $940
3.6%
Interest expense on long-term debt $24,602
94.7%
Loss on disposals of equipment $181
0.7%
2008 total non-operating
eXpenSeS $25,987
Non-operating grant-expenses $1,204
4.6%
2007 total non-operating
revenue $15,610
Interest revenue $12,417
79.6%
Increase in fair value of investments $3,158
20.2%
Non-operating grants $35
0.2%
2008 total non-operating
revenue $15,639
Interest revenue $11,715
74.9%Increase in fair
value of investments $2,332
14.9%
Non-operating grants $1,592
10.2%
14 | 40 years of progress along the Cuyahoga River
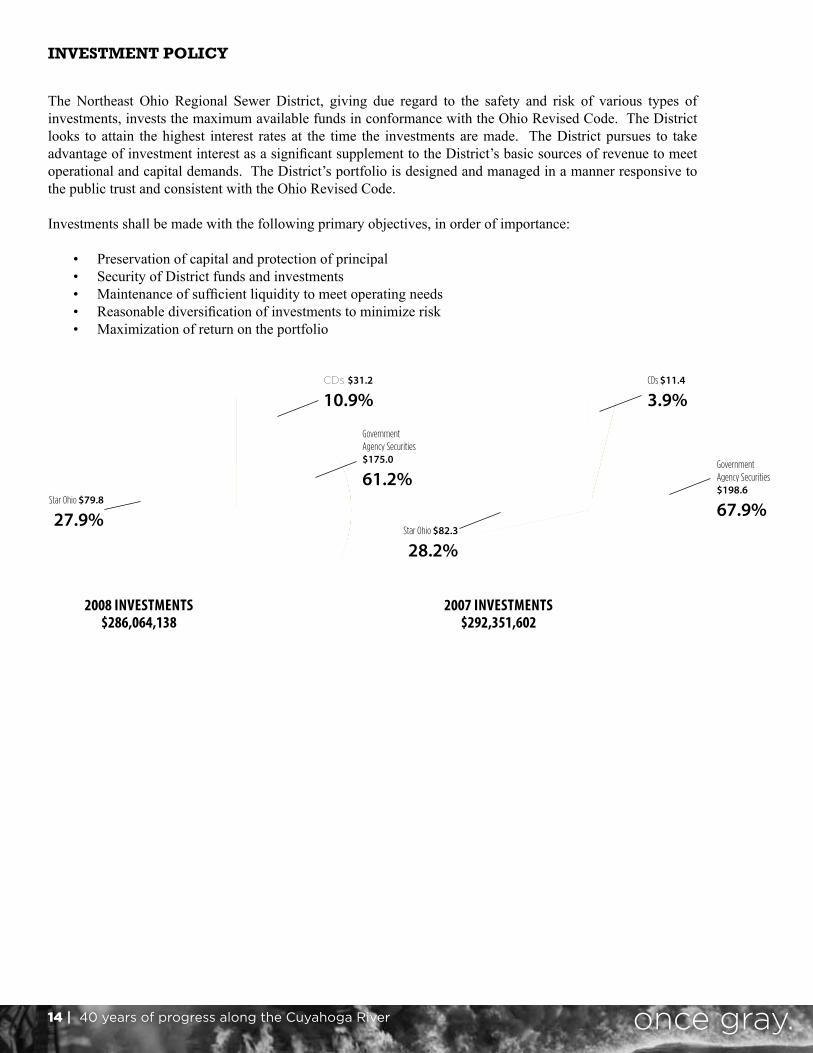
INVESTMENT POLICy
The Northeast Ohio Regional Sewer District, giving due regard to the safety and risk of various types of investments, invests the maximum available funds in conformance with the Ohio Revised Code. The District looks to attain the highest interest rates at the time the investments are made. The District pursues to take advantage of investment interest as a significant supplement to the District’s basic sources of revenue to meet operational and capital demands. The District’s portfolio is designed and managed in a manner responsive to the public trust and consistent with the Ohio Revised Code.
Investments shall be made with the following primary objectives, in order of importance:
• Preservation of capital and protection of principal• Security of District funds and investments • Maintenance of sufficient liquidity to meet operating needs• Reasonable diversification of investments to minimize risk• Maximization of return on the portfolio
Star Ohio $79.8
27.9%
CDs $31.2
10.9%
Government Agency Securities $175.0
61.2%
Star Ohio $82.3
28.2%
Government Agency Securities $198.6
67.9%
CDs $11.4
3.9%
2008 inveStMentS $286,064,138
2007 inveStMentS $292,351,602

Northeast Ohio Regional Sewer District | 15
REVENUES, EXPENSES, AND CHANgES IN NET ASSETS (budget to actual)For the year ended December 31, 2008
NORTHEAST OHIO REGIONAL SEWER DISTRICT
Supplementary Information
Schedule of Revenues, Expenses and Changes in Net Assets-Budget to Actual
For the year ended December 31, 2008
Variance
with Final Budget Original Final Positive Budget Budget Actual (Negative)
Revenues: User Charges: Billed $ 167,298,635 $ 167,298,635 $ 161,494,785 $ (5,803,850) Unbilled - - 3,828,996 3,828,996 Other Revenues 2,207,217 2,207,217 833,463 (1,373,754)
Total Revenues 169,505,852 169,505,852 166,157,244 (3,348,608)
Expenses: Salaries and Wages 36,298,076 36,298,076 35,102,015 1,196,061 Benefits 11,709,540 11,709,540 11,493,925 215,615 Power 10,654,010 10,654,010 11,101,067 (447,057) Materials and Supplies 4,401,097 4,401,097 4,261,239 139,858 Collection Fees 6,000,000 6,000,000 5,435,973 564,027 Gas 7,577,800 7,577,800 7,801,361 (223,561) Chemicals 1,679,329 1,679,329 1,268,036 411,293 Repairs and Maintenance 3,692,159 3,692,159 3,036,704 655,455 Solids Handling 2,663,426 2,663,426 861,768 1,801,658 Water 1,223,568 1,223,568 1,021,701 201,867 Professional Services 5,343,750 5,343,750 8,991,475 (3,647,725) Insurance 1,105,000 1,105,000 1,097,763 7,237 Judgments and Awards 100,000 100,000 18,812 81,188 Other Operating Expenses 3,829,043 3,829,043 3,739,637 89,406 Capitalized Construction Costs (3,494,734) (3,494,734) (3,518,438) 23,704 Depreciation 46,000,000 46,000,000 44,448,564 1,551,436
Total Operating Expenses 138,782,064 138,782,064 136,161,602 2,620,462
Excess of Revenues Over Operating Expenses $ 30,723,788 $ 30,723,788 $ 29,995,642 $ (728,146)
44

16 | 40 years of progress along the Cuyahoga River
CAPITAL ASSETS AND OUTSTANDINg DEBTNORTHEAST OHIO REGIONAL SEWER DISTRICT
Management’s Discussion and Analysis
Capital Assets
At the end of 2008, the District had $1,493,782,987 invested in capital assets. This amount represents a net increase of approximately $8.1 million, or 0.6% over 2007. Refer to Notes 2 and 5 to the audited financial statements for more detailed information on capital assets.
Capital Assets at December 31,
(Net of Depreciation, in Thousands)
Change
2008 2007 Amount %
Land $8,950 $8,950 $0 0%
Construction in Progress 194,457 184,276 10,181 5.6%
Interceptor Sewer Lines 776,495 764,732 11,763 1.6%
Buildings, structures and improvements 368,730 377,308 (8,578) (2.3%)
Sewage treatment and other equipment 145,151 150,427 (5,276) (3.5%)
Totals $1,493,783 $1,485,693 $8,090 0.6%
Major additions in 2008, at cost included: Mill Creek Tunnel $1,300 Southerly/Westerly Interceptors Relining, Replacement and Hydraulics 7,579 Southerly Incineration Improvements Design 3,149 Westerly Interceptor Box Culvert 1,521 Easterly Interceptor Hydra Improvements 2,190 Second Stage Aeration Tank Rehab 4,753 Easterly Affluent Screw Pumps Rehab 1,674 Heights/Hilltop Operational Evaluation Project 1,954 Easterly Final Clarifier Rehab 1,206 Southerly Second State Settling Tank Rehab 4,476 Manhole Rehabilitation 1,052 Roof Renovations-Southerly/EMSC/PSTN 1,361 MCI Repair/Vista Branch Design 1,219 Big Creek Improv Trestle #2 Replacement 2,805 Flats East Bank Project 2,439 $38,678
10
NORTHEAST OHIO REGIONAL SEWER DISTRICT
Management’s Discussion and Analysis
Debt Administration
At December 31, 2008 the District had total debt outstanding of $595,064,591 compared to $603,361,142 at December 31, 2007. This represents a decrease of $8,296,551. Loans from the Ohio Water Development Authority Water Pollution Control Loan Fund decreased $1,182,251; total debt retirements were $37,502,945. The carrying value of the long-term portion of debt at December 31, 2008 was $564,606,888 and the fair value of the long-term debt was $562,806,201. At December 31, 2007 the District had total debt outstanding of $603,361,142 compared to $481,874,602 at December 31, 2006. This represents an increase of $121,486,540. In 2007, loans from the Ohio Water Development Authority Water Pollution Control Loan Fund increased $485,093; total debt retirements were $31,076,641. The carrying value of the long-term portion of debt at December 31, 2007 was $572,365,514 and the fair value of the long-term debt was $575,670,008. This information should be read in conjunction with Note 6 to the audited financial statements for more detailed information on long-term debt.
Outstanding Debt at December 31,
(In Thousands)
2008 2007 2006
Revenue Bonds $177,985 $184,905 $63,525
Ohio Water Development Authority Loans 0 194 573
Water Pollution Control Loans Payable 417,080 418,262 417,777
Total Debt $595,065 $603,361 $481,875
Economic Factors
In February, 2007 the District’s Board of Trustees approved a schedule of rate increases for the five years 2007 through 2011. Effective March 1, 2007, rates charged to District customers increased 9.7 percent to $30.85 per mcf for City of Cleveland customers, and 7.7 percent to $35.10 per mcf for the suburban customers. Effective January 1, 2008, rates charged to District customers increased 9.8 percent to $33.85 per mcf for City of Cleveland customers, and 7.9 percent to $37.85 for the suburban customers. The rates are scheduled to increase similarly on January 1 of each year, for years 2007 through 2011. Increasingly stringent federal regulations and remaining legal obligations are key factors that led to the increases. A rate study of a projected five-year period concluded that the need to finance $707 million in federally mandated capital projects between 2008 and 2012, combined with the repayment of existing debt service for past projects and an anticipated decrease in billed consumption, necessitated the rate increases. Contacting the District’s Financial Management
This financial report is designed to provide a general overview of the District’s finances for all interested parties. Questions and requests for additional information regarding this report should be addressed to the Director of Finance, Northeast Ohio Regional Sewer District, 3900 Euclid Avenue, Cleveland, Ohio 44115, or by telephone at (216) 881-6600.
12

Northeast Ohio Regional Sewer District | 17
CAPITAL ASSET STATISTICS2006-2008
NORTHEAST OHIO REGIONAL SEWER DISTRICT
CAPITAL ASSET STATISTICS
LAST TEN YEARS
1999 2000 2001
Number of Buildings
Operations
Southerly Plant 36 36 36
Easterly Plant 17 17 17
Westerly Plant 17 16 16
Outlying Pump Buildings 6 6 6
Total Operations 76 75 75
Administration
District Administration 2 2 2
Environmental Maintenance and Services Center 3 4 4
Total Offices 5 6 6
Total Buildings 81 81 81
Miles of Interceptor Sewers Installed Annually* 2.88 3.25 3.18
Number of Outlying Systems
Sewage Collection System
Interceptor Sewers & Tunnels 20 20 20
Inter-Community Relief Sewers 13 13 17
Automated Regulators 29 29 29
Pumping Stations 7 7 7
Force Mains 2 3 3
Total Sewage Collection System 71 72 76
Support Facilities
Floatables Control Sites 0 5 5
Biofilter Odor Control Sites 5 5 5
Rain Gauge Sites 25 25 25
Lakeview Dam 1 1 1
Total Support Facilities 31 36 36
Total Outlying Systems 102 108 112
Acres of Land
Operations
Southerly Plant 311.2 311.2 311.2
Easterly Plant 77.7 77.7 77.7
Westerly Plant 13.4 13.4 14.5
Administration
District Administration 1.5 1.5 1.5
Environmental Maintenance and Services Center 14.7 14.7 14.7
Total Acres, Operations and Administration 418.5 418.5 419.6
*Total interceptor sewers are in excess of 200 miles.
Source: District accounting and engineering records.
70
2002 2003 2004 2005 2006 2007 2008
36 36 35 36 36 36 38
16 18 18 18 18 18 18
17 17 17 17 16 16 16
6 6 5 5 5 5 5
75 77 75 76 75 75 77
2 2 1 1 1 1 1
4 4 4 4 4 4 4
6 6 5 5 5 5 5
81 83 80 81 80 80 82
0 3.75 0.53 5.04 3.52 0.89 0.99
21 21 21 21 21 21 21
17 17 18 21 24 24 24
27 27 25 25 25 25 25
7 7 6 6 6 6 6
3 3 3 3 3 3 3
75 75 73 76 79 79 79
5 5 5 10 10 10 10
5 5 7 8 8 8 8
25 25 25 25 25 25 25
1 1 1 1 1 1 1
36 36 38 44 44 44 44
111 111 111 120 123 123 123
311.2 311.2 311.2 311.2 311.2 311.2 311.2
77.7 77.7 77.7 77.7 77.7 77.7 77.7
14.5 14.5 14.5 14.5 14.5 14.5 14.5
1.5 1.5 2.6 2.6 2.6 2.6 2.6
14.7 14.7 14.7 14.7 14.7 14.7 14.7
419.6 419.6 420.7 420.7 420.7 420.7 420.7
71
18 | 40 years of progress along the Cuyahoga River
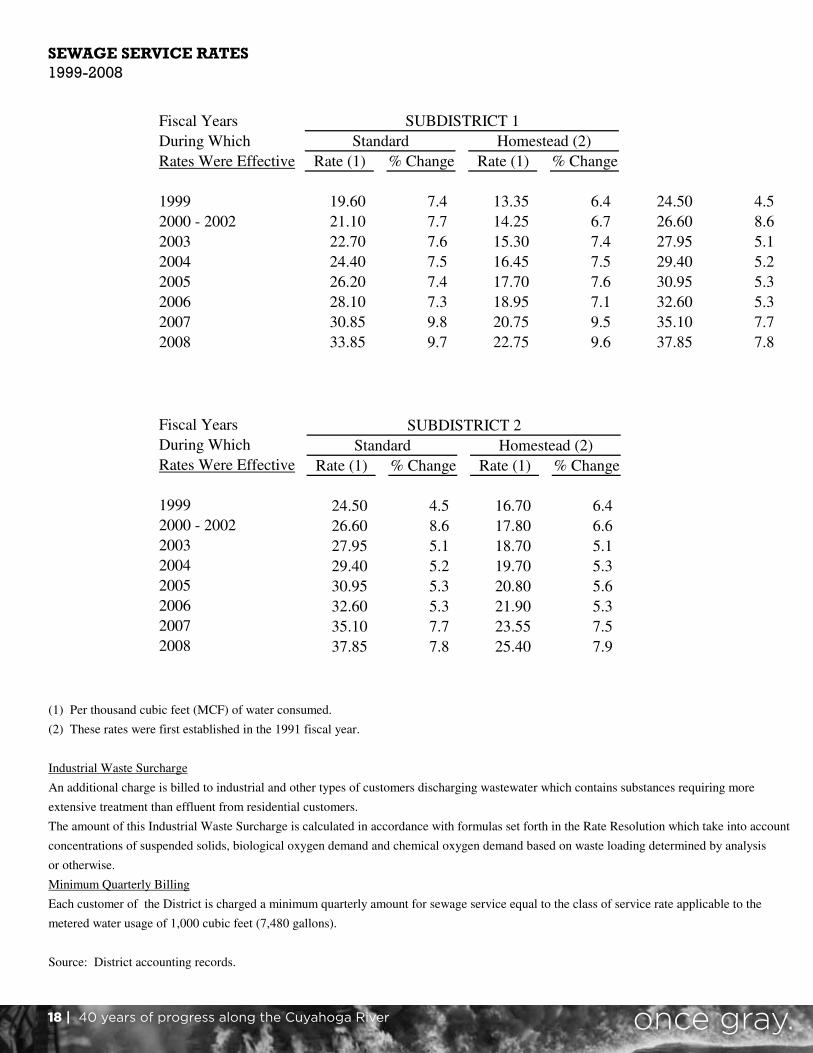
SEwAgE SERVICE RATES1999-2008
NORTHEAST OHIO REGIONAL SEWER DISTRICT
SEWAGE SERVICE RATES
RATE HISTORY - LAST TEN YEARS
Fiscal Years SUBDISTRICT 1 SUBDISTRICT 2
During Which Standard Homestead (2) Standard Homestead (2)
Rates Were Effective Rate (1) % Change Rate (1) % Change Rate (1) % Change Rate (1) % Change
1999 19.60 7.4 13.35 6.4 24.50 4.5 16.70 6.4
2000 - 2002 21.10 7.7 14.25 6.7 26.60 8.6 17.80 6.6
2003 22.70 7.6 15.30 7.4 27.95 5.1 18.70 5.1
2004 24.40 7.5 16.45 7.5 29.40 5.2 19.70 5.3
2005 26.20 7.4 17.70 7.6 30.95 5.3 20.80 5.6
2006 28.10 7.3 18.95 7.1 32.60 5.3 21.90 5.3
2007 30.85 9.8 20.75 9.5 35.10 7.7 23.55 7.5
2008 33.85 9.7 22.75 9.6 37.85 7.8 25.40 7.9
(1) Per thousand cubic feet (MCF) of water consumed.
(2) These rates were first established in the 1991 fiscal year.
Industrial Waste Surcharge
An additional charge is billed to industrial and other types of customers discharging wastewater which contains substances requiring more
extensive treatment than effluent from residential customers.
The amount of this Industrial Waste Surcharge is calculated in accordance with formulas set forth in the Rate Resolution which take into account
concentrations of suspended solids, biological oxygen demand and chemical oxygen demand based on waste loading determined by analysis
or otherwise.
Minimum Quarterly Billing
Each customer of the District is charged a minimum quarterly amount for sewage service equal to the class of service rate applicable to the
metered water usage of 1,000 cubic feet (7,480 gallons).
Source: District accounting records.
80
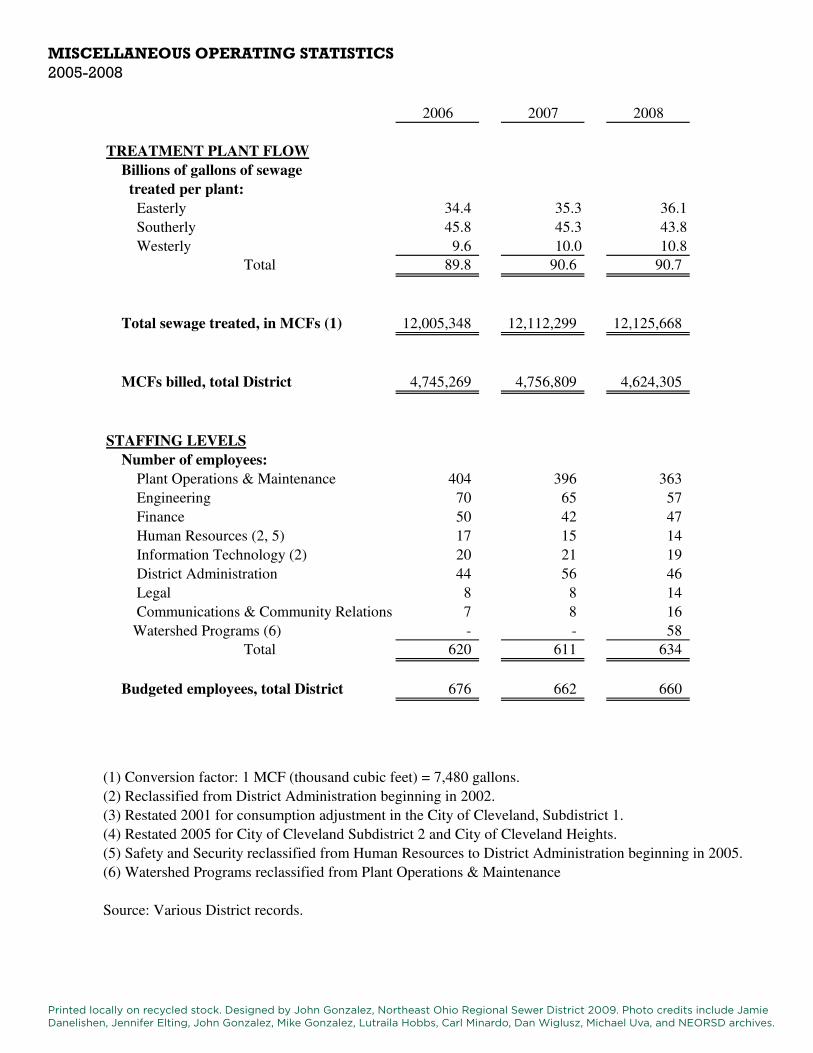
MISCELLANEOUS OPERATINg STATISTICS2005-2008
NORTHEAST OHIO REGIONAL SEWER DISTRICT
MISCELLANEOUS OPERATING STATISTICS
LAST TEN YEARS
1999 2000 2001 2002
TREATMENT PLANT FLOW
Billions of gallons of sewage
treated per plant:
Easterly 38.0 40.9 36.7 37.3
Southerly 40.0 39.2 38.9 37.2
Westerly 11.4 12.0 11.1 10.4
Total 89.4 92.1 86.7 84.9
Total sewage treated, in MCFs (1) 11,951,872 12,312,834 11,590,909 11,350,267
MCFs billed, total District 5,785,288 5,600,215 5,342,696 (3) 5,191,506
STAFFING LEVELS
Number of employees:
Plant Operations & Maintenance 435 420 400 382
Engineering 46 45 48 54
Finance 38 35 35 48
Human Resources (2, 5) - - - 41
Information Technology (2) - - - 19
District Administration 66 73 76 20
Legal 9 9 10 9
Communications & Community Relations - - - -
Watershed Programs (6) - - - -
Total 594 582 569 573
Budgeted employees, total District 620 625 595 634
(1) Conversion factor: 1 MCF (thousand cubic feet) = 7,480 gallons.
(2) Reclassified from District Administration beginning in 2002.
(3) Restated 2001 for consumption adjustment in the City of Cleveland, Subdistrict 1.
(4) Restated 2005 for City of Cleveland Subdistrict 2 and City of Cleveland Heights.
(5) Safety and Security reclassified from Human Resources to District Administration beginning in 2005.
(6) Watershed Programs reclassified from Plant Operations & Maintenance
Source: Various District records.
66
2003 2004 2005 2006 2007 2008
40.4 40.6 38.4 34.4 35.3 36.1
43.1 44.2 46.6 45.8 45.3 43.8
11.0 10.5 10.4 9.6 10.0 10.8
94.5 95.3 95.4 89.8 90.6 90.7
12,633,690 12,740,642 12,754,011 12,005,348 12,112,299 12,125,668
5,094,136 4,930,817 4,969,948 (4) 4,745,269 4,756,809 4,624,305
383 404 412 404 396 363
61 66 66 70 65 57
49 50 49 50 42 47
44 47 21 17 15 14
20 18 19 20 21 19
18 17 43 44 56 46
8 8 9 8 8 14
- - 4 7 8 16
- - - - - 58
583 610 623 620 611 634
637 677 672 676 662 660
67
NORTHEAST OHIO REGIONAL SEWER DISTRICT
MISCELLANEOUS OPERATING STATISTICS
LAST TEN YEARS
1999 2000 2001 2002
TREATMENT PLANT FLOW
Billions of gallons of sewage
treated per plant:
Easterly 38.0 40.9 36.7 37.3
Southerly 40.0 39.2 38.9 37.2
Westerly 11.4 12.0 11.1 10.4
Total 89.4 92.1 86.7 84.9
Total sewage treated, in MCFs (1) 11,951,872 12,312,834 11,590,909 11,350,267
MCFs billed, total District 5,785,288 5,600,215 5,342,696 (3) 5,191,506
STAFFING LEVELS
Number of employees:
Plant Operations & Maintenance 435 420 400 382
Engineering 46 45 48 54
Finance 38 35 35 48
Human Resources (2, 5) - - - 41
Information Technology (2) - - - 19
District Administration 66 73 76 20
Legal 9 9 10 9
Communications & Community Relations - - - -
Watershed Programs (6) - - - -
Total 594 582 569 573
Budgeted employees, total District 620 625 595 634
(1) Conversion factor: 1 MCF (thousand cubic feet) = 7,480 gallons.
(2) Reclassified from District Administration beginning in 2002.
(3) Restated 2001 for consumption adjustment in the City of Cleveland, Subdistrict 1.
(4) Restated 2005 for City of Cleveland Subdistrict 2 and City of Cleveland Heights.
(5) Safety and Security reclassified from Human Resources to District Administration beginning in 2005.
(6) Watershed Programs reclassified from Plant Operations & Maintenance
Source: Various District records.
66Printed locally on recycled stock. Designed by John Gonzalez, Northeast Ohio Regional Sewer District 2009. Photo credits include Jamie Danelishen, Jennifer Elting, John Gonzalez, Mike Gonzalez, Lutraila Hobbs, Carl Minardo, Dan Wiglusz, Michael Uva, and NEORSD archives.

once gray. now green.
2008 popular annualfinancial report
northeast ohioregional sewer district
NORTHEAST OHIO REGIONAL SEWER DISTRICTO U R M I S S I O NWe will serve our customers by leading effective wastewater and stormwater management that protects the health and environment of our region while enhancing quality of life.
3900 Euclid Avenue | Cleveland, OH 44115 | 216.881.2560also available online: www.neorsd.org/annual08