popular annual financial report - portland, oregon
TRANSCRIPT
Popular Annual Financial Report
City of Portland, Oregon
FOR THE YEAR ENDED
JUNE 30, 2019
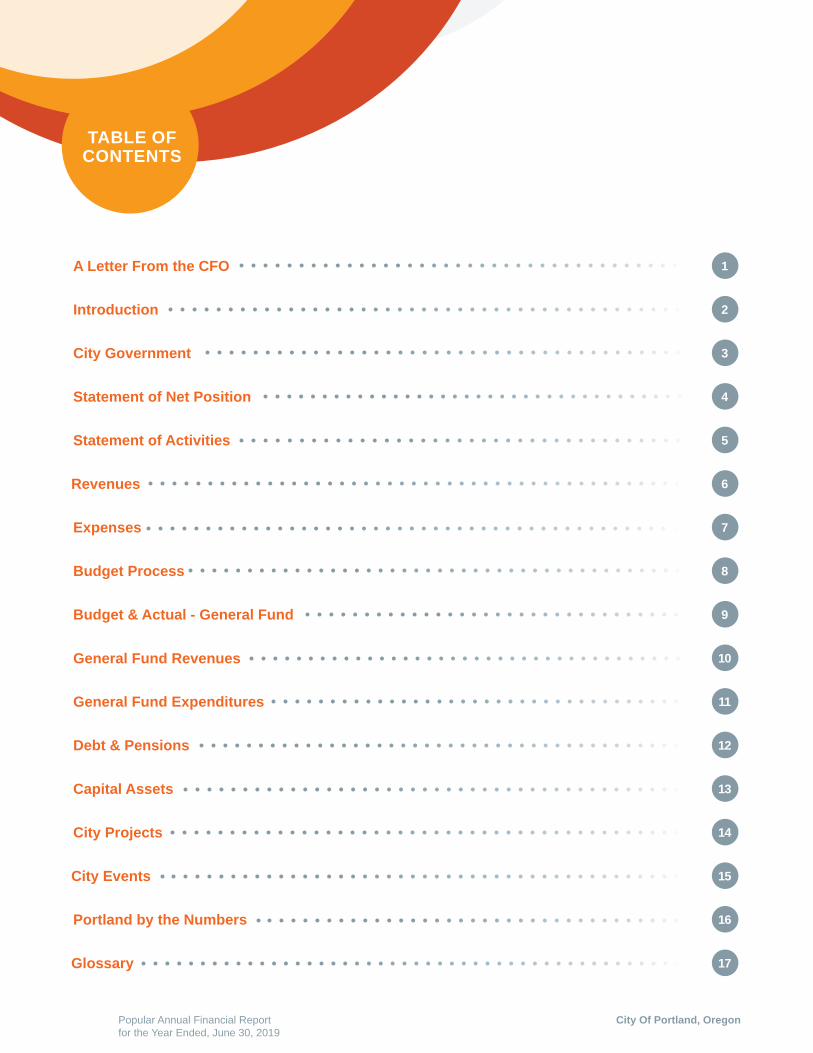
TABLE OF CONTENTS
City Of Portland, OregonPopular Annual Financial Report for the Year Ended, June 30, 2019
A Letter From the CFO
Introduction
City Government
Statement of Net Position
Statement of Activities
Expenses
Budget Process
Budget & Actual - General Fund
General Fund Revenues
General Fund Expenditures
Debt & Pensions
1
2
3
4
5
6
7
8
9
10
11
Capital Assets
City Projects
City Events
Portland by the Numbers
Glossary
12
13
14
15
16
17
Revenues
1
LETTER FROM THE CFO
City Of Portland, Oregon Popular Annual Financial Report for the Year Ended, June 30, 2019
Greetings:
We are pleased to present to you the City of Portland’s (the City) Popular Annual Financial Report (PAFR) for the year ended June 30, 2019. This report is intended to increase awareness of the financial operations of the City. As such, this report is written in a user-friendly manner that will summarize and communicate the City’s financial condition. In addition to providing information on City finances and operations, this report also helps demonstrate what makes Portland a great place to live and work.
While the current financial condition of the City is strong, there are near-term and longer-term financial obligations that will need to be monitored and managed. The City is currently facing several funding challenges, including increasing affordable housing and homeless service needs, labor costs, pension funding requirements, asset management needs, and legacy liabilities. We are working to address these challenges through strategic and consistent investment in the City’s capital assets, infrastructure, and the funding of reserves, which is critical to ensuring the City’s long-term fiscal health.
The PAFR summarizes and condenses the financial activities of the City of Portland governmental and business-type activities and derives its information from the Comprehensive Annual Financial Report (CAFR) for the fiscal year ended June 30, 2019. The CAFR was prepared in conformance with Generally Accepted Accounting Principles (GAAP) and includes financial statements audited by the City’s independent auditors. Unlike the CAFR, the PAFR is un-audited and presented on a non-GAAP basis. This means that it contains condensed financial information and does not provide all of the necessary financial statements and note disclosures required by GAAP for governmental entities. We invite you to review the City’s audited CAFR which includes detailed information on the City’s finances.
We hope you enjoy reading this report and find it both interesting and useful for your understanding of the City’s finances.
Sincerely,
Michelle R. Kirby, CPA
Interim Chief Financial Officer
To view the City’s Full Comprehensive Annual Financial Report (CAFR) and Popular Annual Financial Report (PAFR) please visit: https://www.portlandoregon.gov/omf/51731
Printed copies are available upon request. Please find our contact information on the back cover of this report.
City of Portland, OregonPopular Annual Financial Report for the Year Ended, June 30, 2019
2
INTRODUCTION
The City comprises an area of approximately 145 square miles in northwest Oregon. With a population estimated over 653,000, Portland is the 25th largest city in the United States. Since
2010, Portland population has grown 11.9 percent.
Located astride the Willamette River at its confluence with the Columbia River, the City is the center of commerce, industry, transportation, finance and services for a metropolitan area of almost 2.5 million people. Portland’s economy is driven by several fast-growing industries: high tech, manufacturing, and healthcare.
The climate of the area is marked by warm, dry summers and mild-to-chilly, rainy winters. This climate is ideal for growing roses for more than a century, Portland has been known as the “City of Roses.”
The City was incorporated in 1851 and is a home rule charter city. The City Charter is the basic law under which the City operates and can be amended only by a vote of the people. In 1913, a modified commission form of government was created, which is rare for cities as large as Portland.
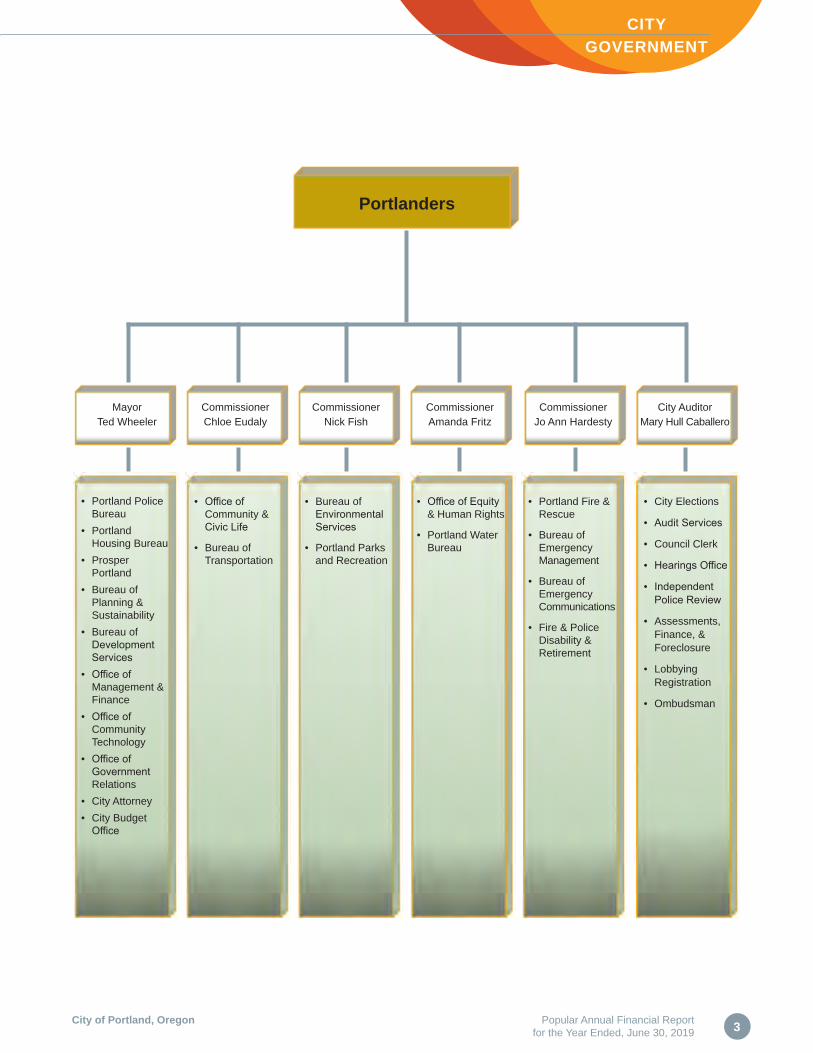
The Mayor and four commissioners act as legislators and administrators. They are responsible for enacting City laws, enforcing City laws, and administering bureaus under their supervision. The Mayor assigns the bureaus to each commissioner. They are elected at-large to four-year terms.
The City Auditor is also elected and required by Charter to be a Certified Public Accountant, Certified Internal Auditor, or Certified Management Accountant. The Auditor is accountable directly to the voters of Portland and is responsible for the management of the annual financial audit of the City, as required by the City Charter.
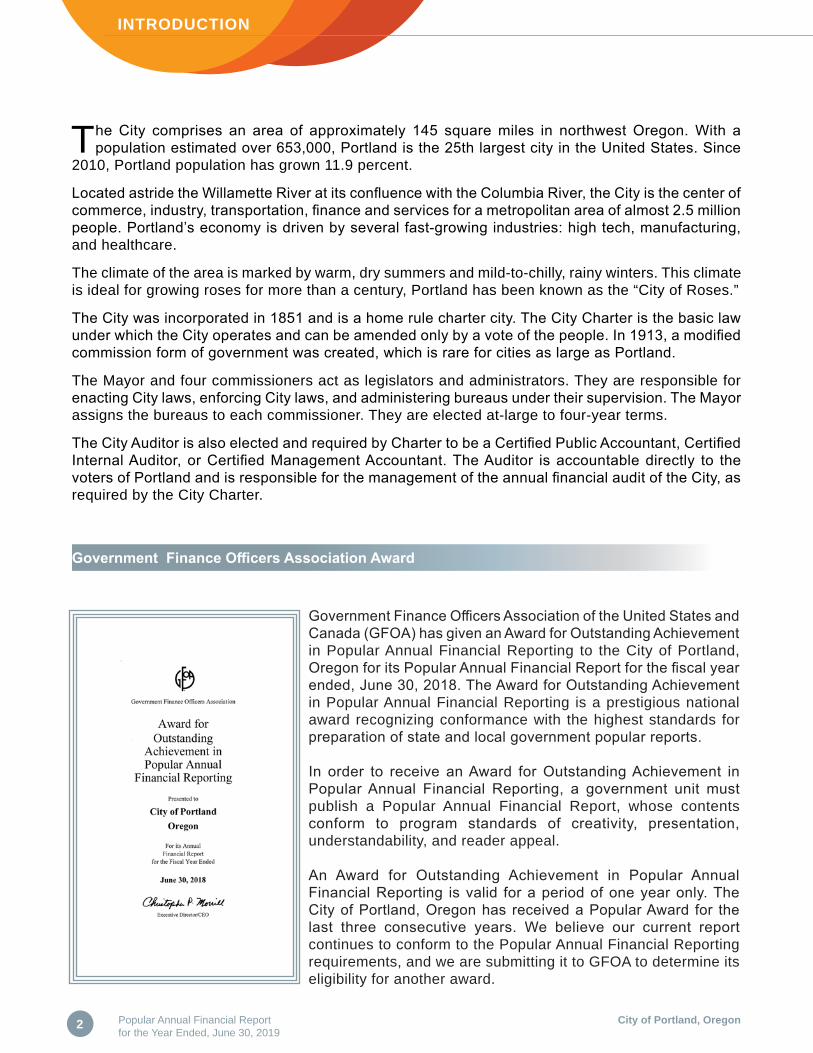
Government Finance Officers Association of the United States and Canada (GFOA) has given an Award for Outstanding Achievement in Popular Annual Financial Reporting to the City of Portland, Oregon for its Popular Annual Financial Report for the fiscal year ended, June 30, 2018. The Award for Outstanding Achievement in Popular Annual Financial Reporting is a prestigious national award recognizing conformance with the highest standards for preparation of state and local government popular reports.
In order to receive an Award for Outstanding Achievement in Popular Annual Financial Reporting, a government unit must publish a Popular Annual Financial Report, whose contents conform to program standards of creativity, presentation, understandability, and reader appeal.
An Award for Outstanding Achievement in Popular Annual Financial Reporting is valid for a period of one year only. The City of Portland, Oregon has received a Popular Award for the last three consecutive years. We believe our current report continues to conform to the Popular Annual Financial Reporting requirements, and we are submitting it to GFOA to determine its eligibility for another award.
Government Finance Officers Association Award
3
CITY GOVERNMENT
City of Portland, Oregon Popular Annual Financial Report for the Year Ended, June 30, 2019
MayorTed Wheeler
CommissionerChloe Eudaly
CommissionerNick Fish
CommissionerAmanda Fritz
CommissionerJo Ann Hardesty
City AuditorMary Hull Caballero
• City Elections
• Audit Services
• Council Clerk
• Hearings Office
• Independent Police Review
• Assessments, Finance, & Foreclosure
• Lobbying Registration
• Ombudsman
• Portland Police Bureau
• Portland Housing Bureau
• Prosper Portland
• Bureau of Planning & Sustainability
• Bureau of Development Services
• Office of Management & Finance
• Office of Community Technology
• Office of Government Relations
• City Attorney• City Budget
Office
• Office of Community & Civic Life
• Bureau of Transportation
• Bureau of Environmental Services
• Portland Parks and Recreation
• Office of Equity & Human Rights
• Portland Water Bureau
• Portland Fire & Rescue
• Bureau of Emergency Management
• Bureau of Emergency Communications
• Fire & Police Disability & Retirement
Portlanders

City of Portland, OregonPopular Annual Financial Report for the Year Ended, June 30, 2019
4
STATEMENT OF NET POSITION
It was formerly called the “Balance Sheet” and, while the name of this report has changed to the “Statement of Net Position,” the accounting equation has also undergone a slight transformation:
Assets + Deferred Outflows - Liabilities - Deferred Inflows = Net Position. The statement reflects the overall financial position of the organization at a given moment in time, much like a snapshot; and may serve as a useful gauge of a government’s financial health.
In the case of the City, assets and deferred outflows of resources for the total primary government exceeded liabilities and deferred inflows of resources by $1.3 billion (Net Position) at the close of the fiscal year (FY) 2019, this is an overall increase of $249.1 million or 23.8% over FY 2018 as a result of a decrease of $61.8 million in the net position of the governmental activities and an increase of $311.0 million in net position of the business-type activities. The change in Net Position is further discussed on the next page.
For the Years Ended June 30, (dollars in thousands - $000's)
FY 2019 FY 2018 FY 2017
Current and other assets $2,075,633 $1,990,969 $1,649,050Capital assets 6,949,166 6,639,857 6,575,490
Total assets 9,024,800 8,630,826 8,224,540
Deferred outflow of resources 577,778 502,965 740,885
Long-term liabilities outstanding 7,514,186 7,312,988 7,355,259Other liabilities 559,472 489,366 454,494
Total liabilities 8,073,658 7,802,354 7,809,753
Deferred inflow of resources 232,274 283,915 210,495
Total net position $1,296,645 $1,047,522 $945,177
Total Primary Government
$1,296,645$1,047,522
$945,177
FY 2019 FY 2018 FY 2017
Total Net Position
$200,000
$400,000
$600,000
$800,000
$1,000,000
$1,200,000
$1,400,000
5City of Portland, Oregon Popular Annual Financial Report for the Year Ended, June 30, 2019
STATEMENT OF ACTIVITIES
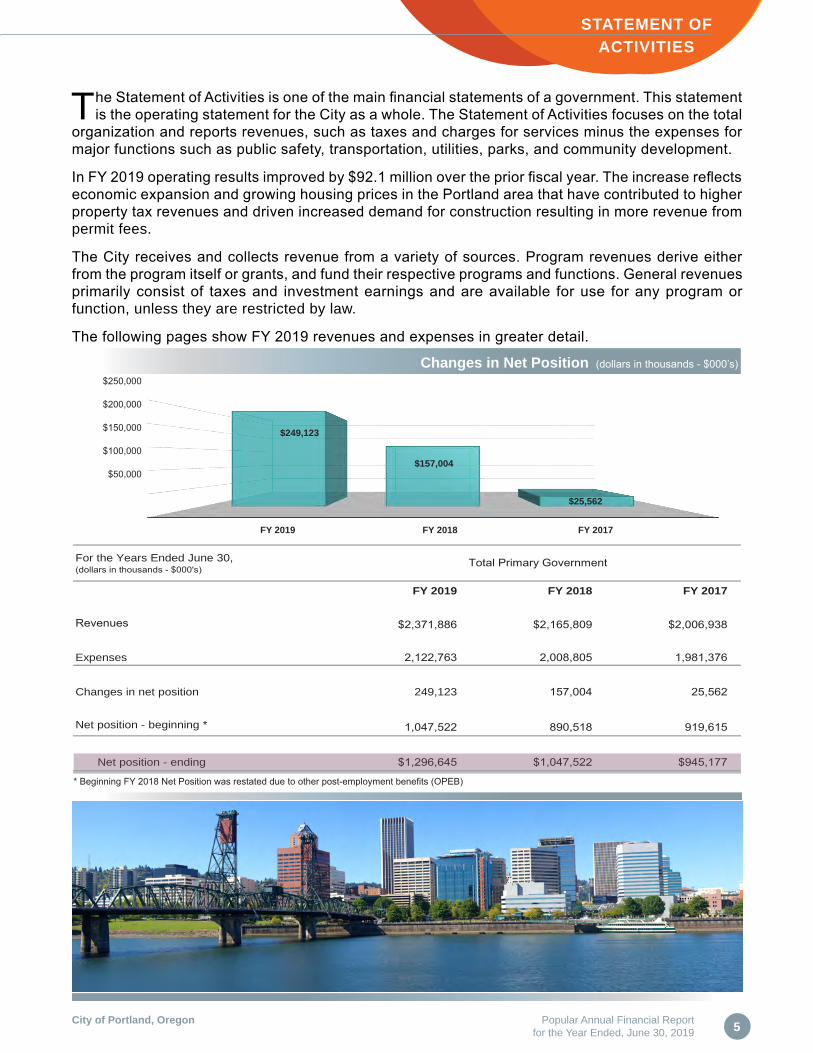
For the Years Ended June 30, (dollars in thousands - $000's)
FY 2019 FY 2018 FY 2017
Revenues $2,371,886 $2,165,809 $2,006,938
Expenses 2,122,763 2,008,805 1,981,376
Changes in net position 249,123 157,004 25,562
Net position - beginning * 1,047,522 890,518 919,615
Net position - ending $1,296,645 $1,047,522 $945,177
Total Primary Government
The Statement of Activities is one of the main financial statements of a government. This statement is the operating statement for the City as a whole. The Statement of Activities focuses on the total
organization and reports revenues, such as taxes and charges for services minus the expenses for major functions such as public safety, transportation, utilities, parks, and community development.
In FY 2019 operating results improved by $92.1 million over the prior fiscal year. The increase reflects economic expansion and growing housing prices in the Portland area that have contributed to higher property tax revenues and driven increased demand for construction resulting in more revenue from permit fees.
The City receives and collects revenue from a variety of sources. Program revenues derive either from the program itself or grants, and fund their respective programs and functions. General revenues primarily consist of taxes and investment earnings and are available for use for any program or function, unless they are restricted by law.
The following pages show FY 2019 revenues and expenses in greater detail.
* Beginning FY 2018 Net Position was restated due to other post-employment benefits (OPEB)
Changes in Net Position (dollars in thousands - $000’s)
FY 2019 FY 2018 FY 2017
$50,000
$100,000
$150,000
$200,000
$250,000
$249,123
$157,004
$25,562
City of Portland, OregonPopular Annual Financial Report for the Year Ended, June 30, 2019
6
REVENUES
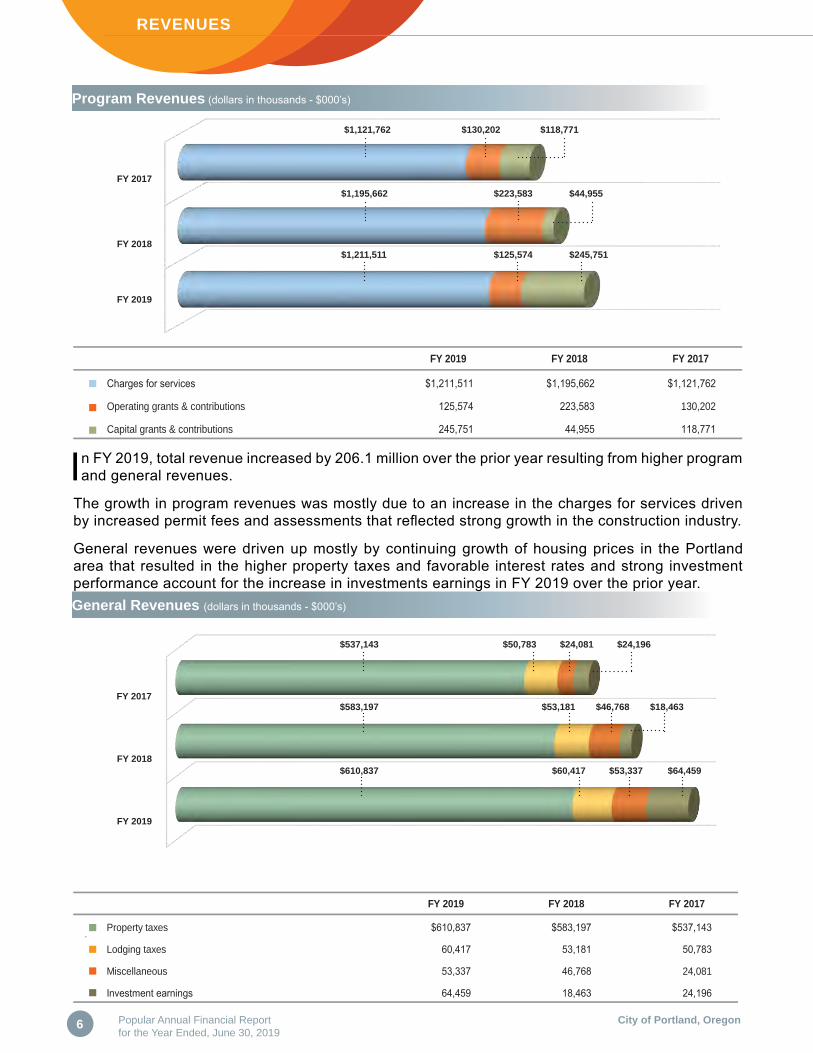
Program Revenues (dollars in thousands - $000’s)
General Revenues (dollars in thousands - $000’s)
In FY 2019, total revenue increased by 206.1 million over the prior year resulting from higher program and general revenues.
The growth in program revenues was mostly due to an increase in the charges for services driven by increased permit fees and assessments that reflected strong growth in the construction industry.
General revenues were driven up mostly by continuing growth of housing prices in the Portland area that resulted in the higher property taxes and favorable interest rates and strong investment performance account for the increase in investments earnings in FY 2019 over the prior year.
FY 2017
FY 2018
FY 2019
$1,121,762 $130,202 $118,771
FY 2019 FY 2018 FY 2017
Charges for services $1,211,511 $1,195,662 $1,121,762
Operating grants & contributions 125,574 223,583 130,202
Capital grants & contributions 245,751 44,955 118,771
$1,195,662 $223,583 $44,955
$1,211,511 $125,574 $245,751
FY 2017
FY 2018
FY 2019
$537,143 $50,783 $24,081 $24,196
$583,197 $53,181 $46,768 $18,463
$610,837 $60,417 $53,337 $64,459
FY 2019 FY 2018 FY 2017
Property taxes $610,837 $583,197 $537,143
Lodging taxes 60,417 53,181 50,783
Miscellaneous 53,337 46,768 24,081
Investment earnings 64,459 18,463 24,196
7
EXPENSES
City of Portland, Oregon Popular Annual Financial Report for the Year Ended, June 30, 2019
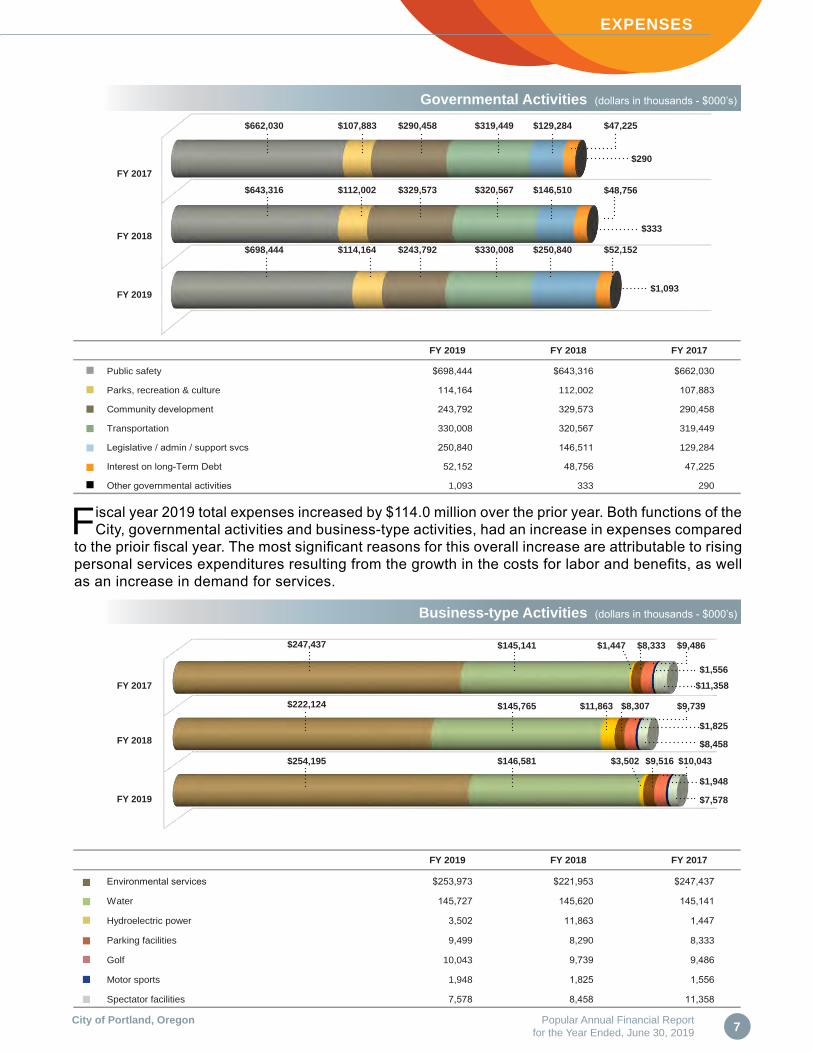
Fiscal year 2019 total expenses increased by $114.0 million over the prior year. Both functions of the City, governmental activities and business-type activities, had an increase in expenses compared
to the prioir fiscal year. The most significant reasons for this overall increase are attributable to rising personal services expenditures resulting from the growth in the costs for labor and benefits, as well as an increase in demand for services.
Governmental Activities (dollars in thousands - $000’s)
Business-type Activities (dollars in thousands - $000’s)
FY 2019 FY 2018 FY 2017
Public safety $698,444 $643,316 $662,030
Parks, recreation & culture 114,164 112,002 107,883
Community development 243,792 329,573 290,458
Transportation 330,008 320,567 319,449
Legislative / admin / support svcs 250,840 146,511 129,284
Interest on long-Term Debt 52,152 48,756 47,225
Other governmental activities 1,093 333 290
FY 2017
FY 2018
FY 2019
$662,030 $107,883 $290,458 $319,449 $129,284 $47,225
$643,316 $112,002 $329,573 $320,567 $146,510 $48,756
$698,444 $114,164 $243,792 $330,008 $250,840 $52,152
FY 2019 FY 2018 FY 2017
Environmental services $253,973 $221,953 $247,437
Water 145,727 145,620 145,141
Hydroelectric power 3,502 11,863 1,447
Parking facilities 9,499 8,290 8,333
Golf 10,043 9,739 9,486
Motor sports 1,948 1,825 1,556
Spectator facilities 7,578 8,458 11,358
$247,437 $145,141 $1,447 $9,486
$1,556$11,358
$222,124 $145,765 $11,863 $9,739
$1,825
$8,458
$254,195 $146,581 $3,502 $10,043
$1,948
$7,578
FY 2017
FY 2018
FY 2019
$8,333
$8,307
$9,516
$290
$333
$1,093
City of Portland, OregonPopular Annual Financial Report for the Year Ended, June 30, 2019
8
BUDGET PROCESS
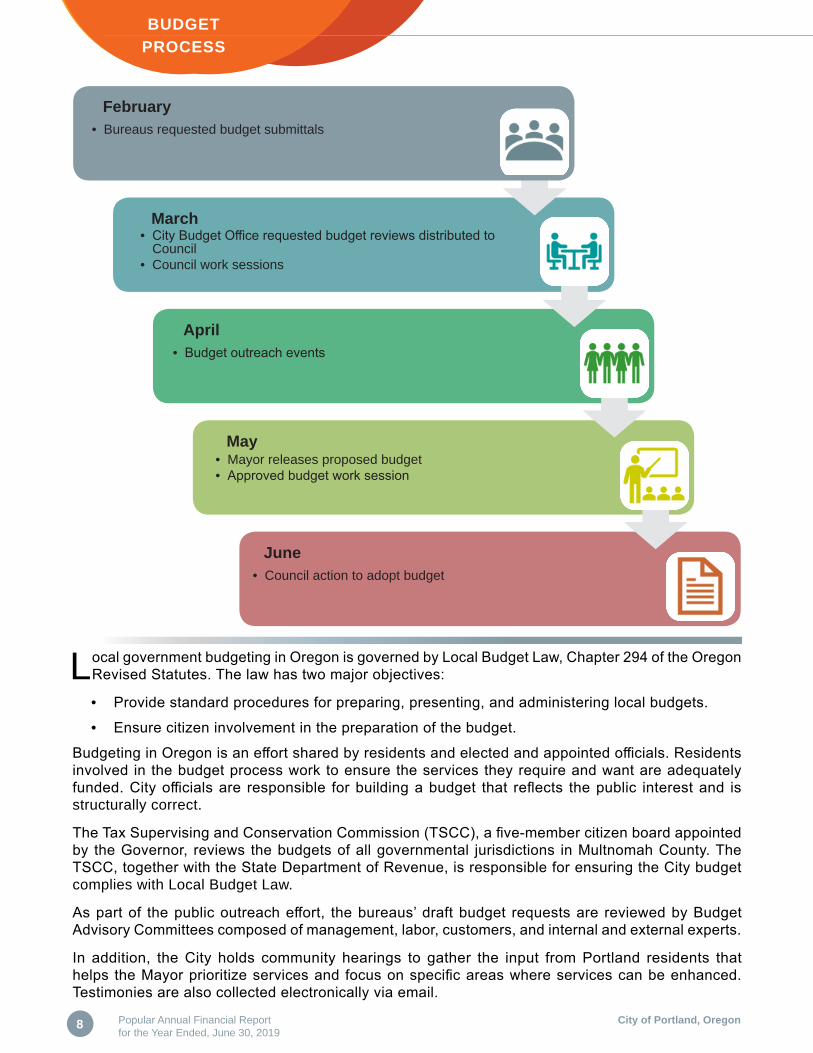
Local government budgeting in Oregon is governed by Local Budget Law, Chapter 294 of the Oregon Revised Statutes. The law has two major objectives:
• Provide standard procedures for preparing, presenting, and administering local budgets.
• Ensure citizen involvement in the preparation of the budget.
Budgeting in Oregon is an effort shared by residents and elected and appointed officials. Residents involved in the budget process work to ensure the services they require and want are adequately funded. City officials are responsible for building a budget that reflects the public interest and is structurally correct.
The Tax Supervising and Conservation Commission (TSCC), a five-member citizen board appointed by the Governor, reviews the budgets of all governmental jurisdictions in Multnomah County. The TSCC, together with the State Department of Revenue, is responsible for ensuring the City budget complies with Local Budget Law.
As part of the public outreach effort, the bureaus’ draft budget requests are reviewed by Budget Advisory Committees composed of management, labor, customers, and internal and external experts.
In addition, the City holds community hearings to gather the input from Portland residents that helps the Mayor prioritize services and focus on specific areas where services can be enhanced. Testimonies are also collected electronically via email.
February• Bureaus requested budget submittals
March• City Budget Office requested budget reviews distributed to
Council• Council work sessions
April• Budget outreach events
May• Mayor releases proposed budget• Approved budget work session
June• Council action to adopt budget
9City of Portland, Oregon Popular Annual Financial Report for the Year Ended, June 30, 2019
BUDGET & ACTUAL GENERAL FUND
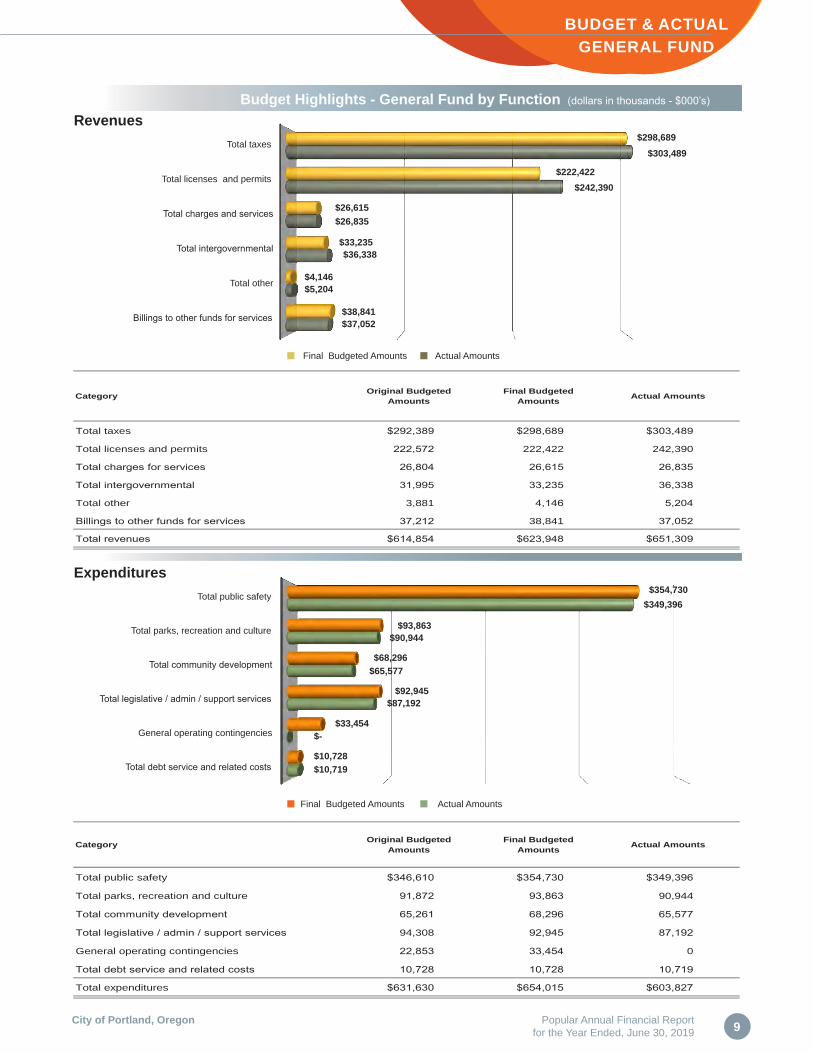
Budget Highlights - General Fund by Function (dollars in thousands - $000’s)
Category Original Budgeted Amounts
Final Budgeted Amounts Actual Amounts
Total taxes $292,389 $298,689 $303,489
Total licenses and permits 222,572 222,422 242,390
Total charges for services 26,804 26,615 26,835
Total intergovernmental 31,995 33,235 36,338
Total other 3,881 4,146 5,204
Billings to other funds for services 37,212 38,841 37,052
Total revenues $614,854 $623,948 $651,309
Category Original Budgeted Amounts
Final Budgeted Amounts Actual Amounts
Total public safety $346,610 $354,730 $349,396
Total parks, recreation and culture 91,872 93,863 90,944
Total community development 65,261 68,296 65,577
Total legislative / admin / support services 94,308 92,945 87,192
General operating contingencies 22,853 33,454 0
Total debt service and related costs 10,728 10,728 10,719
Total expenditures $631,630 $654,015 $603,827
RevenuesTotal taxes
Total licenses and permits
Total charges and services
Total intergovernmental
Total other
Billings to other funds for services
$298,689$303,489
$222,422$242,390
$26,615$26,835
$33,235$36,338
$4,146$5,204
$38,841$37,052
Final Budgeted Amounts Actual Amounts
ExpendituresTotal public safety
Total parks, recreation and culture
Total legislative / admin / support services
Total community development
General operating contingencies
Total debt service and related costs
$354,730$349,396
$93,863$90,944
$68,296$65,577
$92,945$87,192
$33,454$-
$10,728$10,719
Final Budgeted Amounts Actual Amounts
City of Portland, OregonPopular Annual Financial Report for the Year Ended, June 30, 2019
10
GENERAL FUND REVENUES
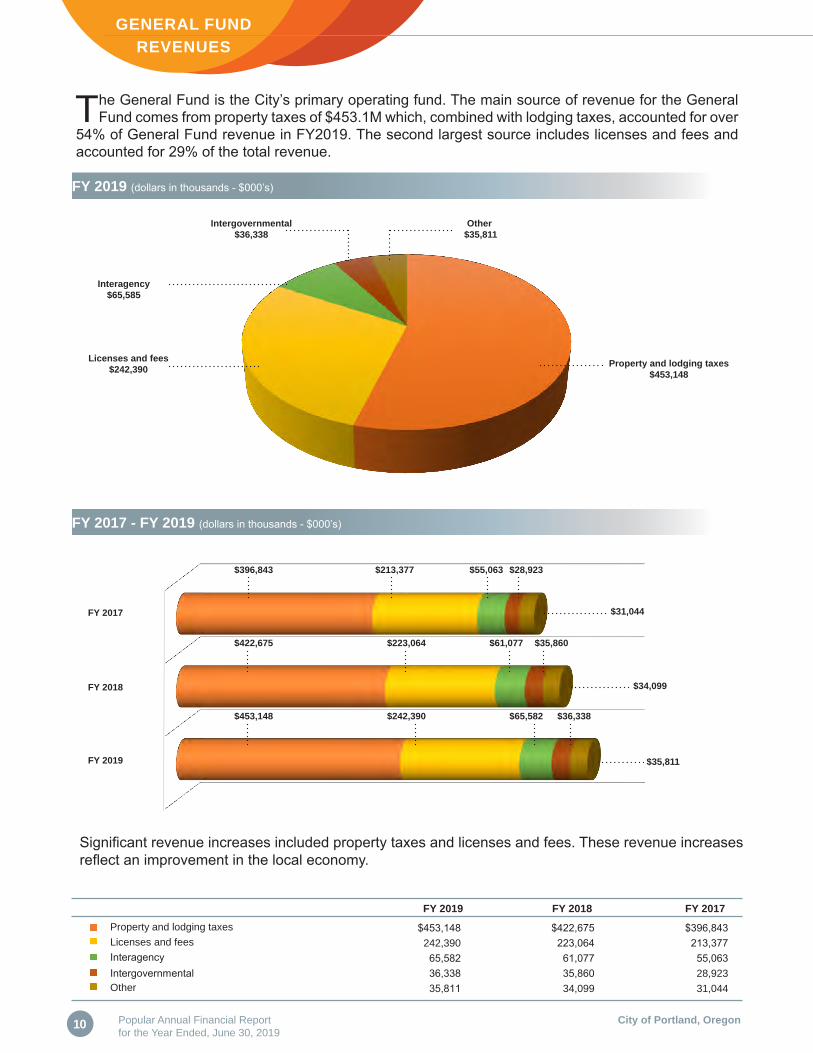
The General Fund is the City’s primary operating fund. The main source of revenue for the General Fund comes from property taxes of $453.1M which, combined with lodging taxes, accounted for over
54% of General Fund revenue in FY2019. The second largest source includes licenses and fees and accounted for 29% of the total revenue.
Significant revenue increases included property taxes and licenses and fees. These revenue increases reflect an improvement in the local economy.
Licenses and fees$242,390
Interagency$65,585
Intergovernmental$36,338
Other $35,811
FY 2017
FY 2018
FY 2019
$396,843
$422,675
$453,148
$213,377
$223,064
$242,390
$55,063
$61,077
$65,582
$28,923
$35,860
$36,338
$31,044
$34,099
$35,811
Property and lodging taxes $453,148 $422,675 $396,843Licenses and fees 242,390 223,064 213,377Interagency 65,582 61,077 55,063Intergovernmental 36,338 35,860 28,923Other 35,811 34,099 31,044
FY 2019 FY 2018 FY 2017
Property and lodging taxes $453,148
FY 2019 (dollars in thousands - $000’s)
FY 2017 - FY 2019 (dollars in thousands - $000’s)
11
GENERAL FUND EXPENDITURES
City of Portland, Oregon Popular Annual Financial Report for the Year Ended, June 30, 2019
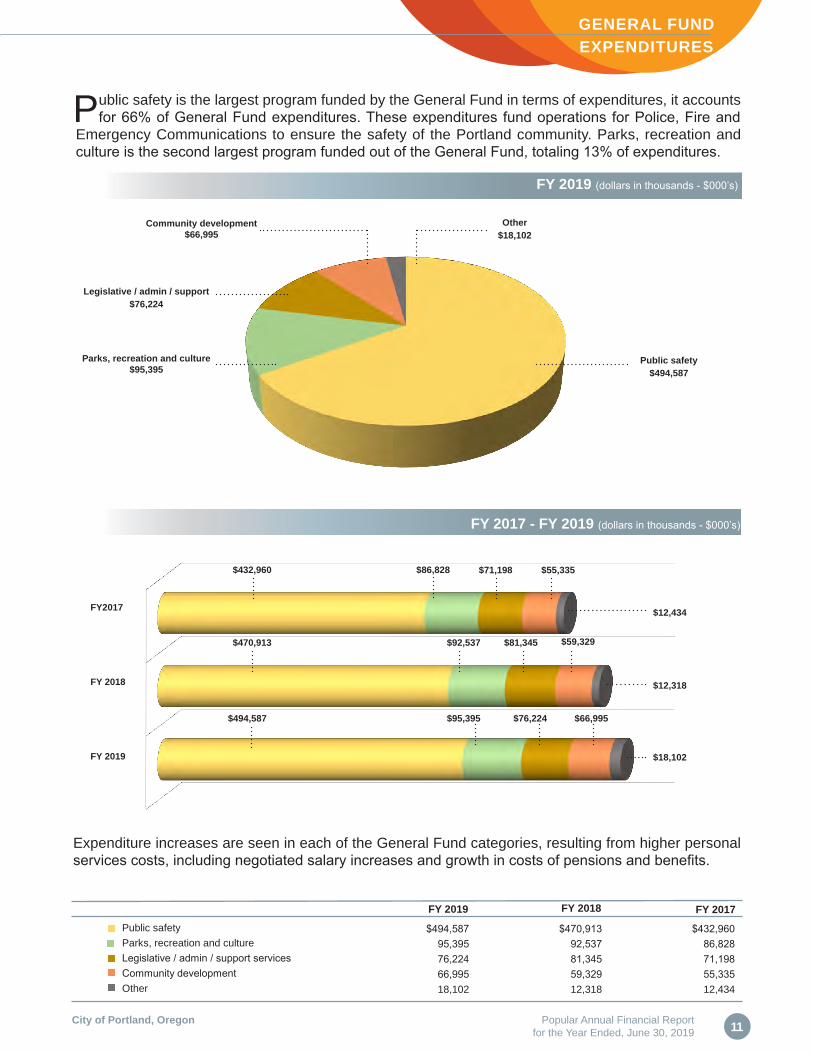
Expenditure increases are seen in each of the General Fund categories, resulting from higher personal services costs, including negotiated salary increases and growth in costs of pensions and benefits.
Public safety is the largest program funded by the General Fund in terms of expenditures, it accounts for 66% of General Fund expenditures. These expenditures fund operations for Police, Fire and
Emergency Communications to ensure the safety of the Portland community. Parks, recreation and culture is the second largest program funded out of the General Fund, totaling 13% of expenditures.
$432,960 $86,828 $71,198 $55,335
$12,434
$470,913 $92,537 $81,345 $59,329
$12,318
$95,395 $76,224 $66,995
$18,102
Public safety$494,587
Legislative / admin / support $76,224
Other $18,102
FY2017
FY 2018
FY 2019
Public safety $494,587 $470,913 $432,960Parks, recreation and culture 95,395 92,537 86,828Legislative / admin / support services 76,224 81,345 71,198Community development 66,995 59,329 55,335Other 18,102 12,318 12,434
Parks, recreation and culture$95,395
FY 2019 FY 2018 FY 2017
Community development $66,995
FY 2017 - FY 2019 (dollars in thousands - $000’s)
FY 2019 (dollars in thousands - $000’s)
$494,587
City of Portland, OregonPopular Annual Financial Report for the Year Ended, June 30, 2019
12
DEBT & PENSIONS
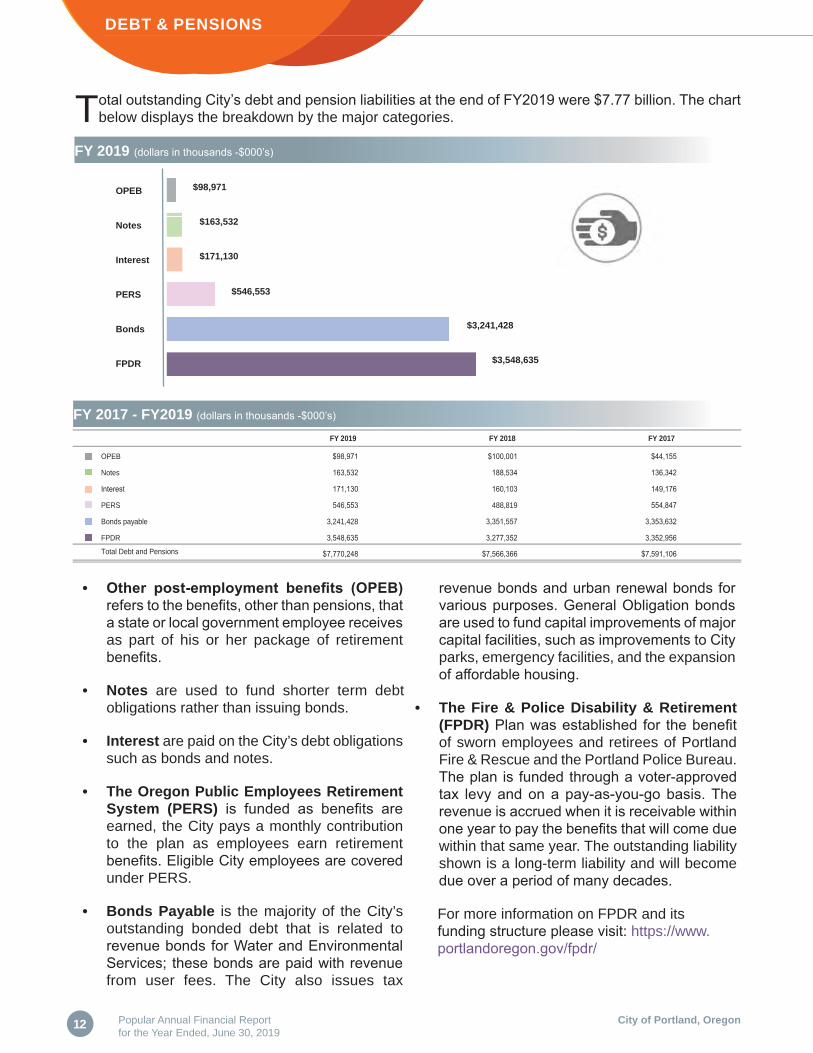
Total outstanding City’s debt and pension liabilities at the end of FY2019 were $7.77 billion. The chart below displays the breakdown by the major categories.
FY 2019 FY 2018 FY 2017
OPEB $98,971 $100,001 $44,155
Notes 163,532 188,534 136,342
Interest 171,130 160,103 149,176
PERS 546,553 488,819 554,847
Bonds payable 3,241,428 3,351,557 3,353,632
FPDR 3,548,635 3,277,352 3,352,956
Total Debt and Pensions $7,770,248 $7,566,366 $7,591,106
revenue bonds and urban renewal bonds for various purposes. General Obligation bonds are used to fund capital improvements of major capital facilities, such as improvements to City parks, emergency facilities, and the expansion of affordable housing.
• The Fire & Police Disability & Retirement (FPDR) Plan was established for the benefit of sworn employees and retirees of Portland Fire & Rescue and the Portland Police Bureau. The plan is funded through a voter-approved tax levy and on a pay-as-you-go basis. The revenue is accrued when it is receivable within one year to pay the benefits that will come due within that same year. The outstanding liability shown is a long-term liability and will become due over a period of many decades.
For more information on FPDR and its funding structure please visit: https://www.portlandoregon.gov/fpdr/
OPEB $98,971
$546,553
$171,130
$3,241,428
$3,548,635
• Other post-employment benefits (OPEB) refers to the benefits, other than pensions, that a state or local government employee receives as part of his or her package of retirement benefits.
• Notes are used to fund shorter term debt obligations rather than issuing bonds.
• Interest are paid on the City’s debt obligations such as bonds and notes.
• The Oregon Public Employees Retirement System (PERS) is funded as benefits are earned, the City pays a monthly contribution to the plan as employees earn retirement benefits. Eligible City employees are covered under PERS.
• Bonds Payable is the majority of the City’s outstanding bonded debt that is related to revenue bonds for Water and Environmental Services; these bonds are paid with revenue from user fees. The City also issues tax
$163,532
FY 2019 (dollars in thousands -$000’s)
FY 2017 - FY2019 (dollars in thousands -$000’s)
Interest
Notes
PERS
Bonds
FPDR
13City of Portland, Oregon Popular Annual Financial Report for the Year Ended, June 30, 2019
CAPITAL ASSETS
13
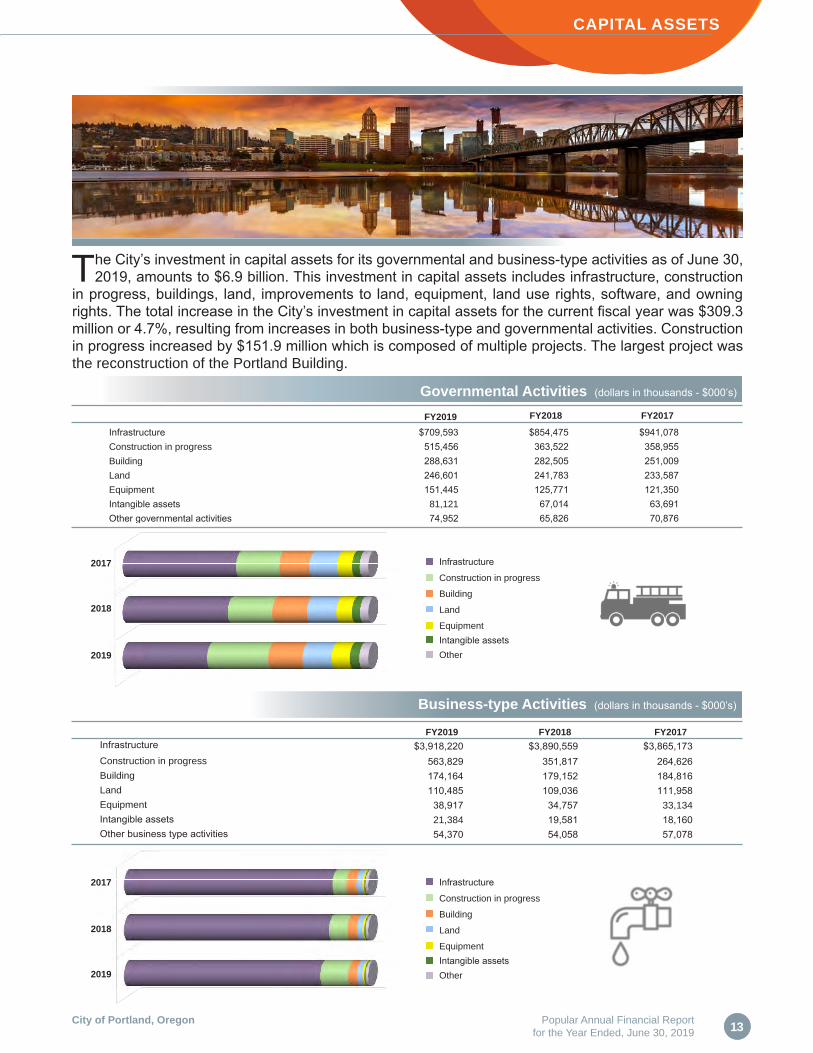
The City’s investment in capital assets for its governmental and business-type activities as of June 30, 2019, amounts to $6.9 billion. This investment in capital assets includes infrastructure, construction
in progress, buildings, land, improvements to land, equipment, land use rights, software, and owning rights. The total increase in the City’s investment in capital assets for the current fiscal year was $309.3 million or 4.7%, resulting from increases in both business-type and governmental activities. Construction in progress increased by $151.9 million which is composed of multiple projects. The largest project was the reconstruction of the Portland Building.
Infrastructure $3,918,220 $3,890,559 $3,865,173Construction in progress 563,829 351,817 264,626 Building 174,164 179,152 184,816 Land 110,485 109,036 111,958 Equipment 38,917 34,757 33,134 Intangible assets 21,384 19,581 18,160 Other business type activities 54,370 54,058 57,078
Infrastructure $709,593 $854,475 $941,078Construction in progress 515,456 363,522 358,955 Building 288,631 282,505 251,009 Land 246,601 241,783 233,587 Equipment 151,445 125,771 121,350 Intangible assets 81,121 67,014 63,691 Other governmental activities 74,952 65,826 70,876
2018
2019
2017
2017
2019
2018
FY2017
FY2017FY2018
FY2018FY2019
FY2019
Infrastructure
Construction in progress
Land
Intangible assetsOther
Building
Equipment
Infrastructure
Construction in progress
Land
Intangible assetsOther
Building
Equipment
Business-type Activities (dollars in thousands - $000’s)
Governmental Activities (dollars in thousands - $000’s)
City of Portland, OregonPopular Annual Financial Report for the Year Ended, June 30, 2019
14
CITY PROJECTS
Land Improvements
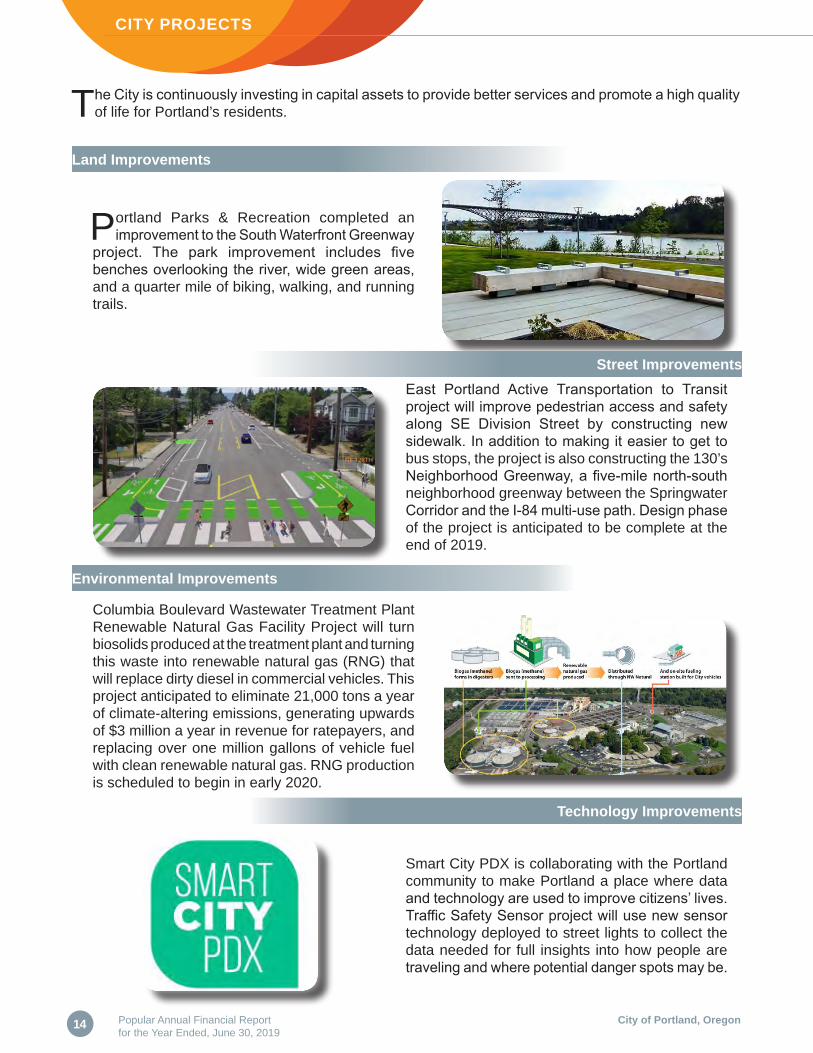
Portland Parks & Recreation completed an improvement to the South Waterfront Greenway
project. The park improvement includes five benches overlooking the river, wide green areas, and a quarter mile of biking, walking, and running trails.
East Portland Active Transportation to Transit project will improve pedestrian access and safety along SE Division Street by constructing new sidewalk. In addition to making it easier to get to bus stops, the project is also constructing the 130’s Neighborhood Greenway, a five-mile north-south neighborhood greenway between the Springwater Corridor and the I-84 multi-use path. Design phase of the project is anticipated to be complete at the end of 2019.
Street Improvements
Environmental Improvements
Columbia Boulevard Wastewater Treatment Plant Renewable Natural Gas Facility Project will turn biosolids produced at the treatment plant and turning this waste into renewable natural gas (RNG) that will replace dirty diesel in commercial vehicles. This project anticipated to eliminate 21,000 tons a year of climate-altering emissions, generating upwards of $3 million a year in revenue for ratepayers, and replacing over one million gallons of vehicle fuel with clean renewable natural gas. RNG production is scheduled to begin in early 2020.
Technology Improvements
Smart City PDX is collaborating with the Portland community to make Portland a place where data and technology are used to improve citizens’ lives. Traffic Safety Sensor project will use new sensor technology deployed to street lights to collect the data needed for full insights into how people are traveling and where potential danger spots may be.
The City is continuously investing in capital assets to provide better services and promote a high quality of life for Portland’s residents.

15
CITY EVENTS
City of Portland, Oregon Popular Annual Financial Report for the Year Ended, June 30, 2019
Whether you enjoy the arts or outdoor events, Portland has something to offer everyone. Listen to summer concerts at the Oregon Zoo, run a marathon, or participate in one of cultural annual
festivals and parades.
Oregon Zoo Summer Concerts is outdoor concert series that brings world class artists for a night of music and nature from June to September.
Portland Rose Festival is the largest festival in the City celebrated annually at end of May and beginning of June. This event includes Grand Floral Parade, Starlight Parade, Junior parade, Rose Festival Fleet Week (ships from U.S. Navy, U.S. Coast Guard and Royal Canadian Navy), along with several other activities.
Waterfront Blues Festival is the celebration of blues, soul, funk, and rhythm & blues. The Festival weekend is filled with amazing performances across four stages, food, vendors, river boat cruises, and much more.
Portland Marathon is an annual race event which takes place on the first Sunday of October. It’s been held annually since 1972 and is one of the longest-running consecutive marathons in the United States.
Cultural Festivals are held throughout the year. Families can celebrate and learn about other cultures, taste new foods, and take part in dancing, singing, and other entertainment.
Oregon Zoo Summer Concerts
Portland Rose Festival
Waterfront Blues Festival
Portland Marathon
Cultural Festivals

City of Portland, OregonPopular Annual Financial Report for the Year Ended, June 30, 2019
16
PORTLAND BY THE NUMBERS
16
Top Property Taxpayers(1) (assessed valuation, dollars in thousands)
Port of Portland 632,685$ Alaska Airlines Inc 487,260 Portland General Electric Co 399,732 Centurylink 394,638 Pacificorp (PP&L) 356,135 Weston Investment Co LLC 267,518 AT&T, Inc 244,586 Southwest Airlines Co 232,663 Comcast Corporation 197,228 Capref Lloyd Center LLC 188,069
Top Employers in the City(2) (number of employees)
Intel Corporation 20,600Providence Health & Services 18,885Oregon Health & Science University 17,556Nike Inc. 12,000Legacy Health System 11,404Kaiser Foundation Health Plan of NW 11,243Fred Meyer 9,777City of Portland 7,376Portland Public Schools 6,500Beaverton School District 5,458
UNEMPLOYMENT RATE 2019 3.5% 2018 3.7% 2017 3.8%
PORTLAND PUBLIC SCHOOLS ENROLLMENT 2019 49,478 2018 49,550 2017 49,557
PER CAPITA PERSONAL INCOME 2019 N/A* 2018 53,751 2017 51,576
MEDIAN HOUSING VALUE 2019 $422,500 2018 $378,600 2017 $352,700
POPULATION 2019 653,115 2018 648,630 2017 643,136
*N/A: Data is not available for this fiscal year.
(1) Multnomah County Division of Assessment and Taxation. (2) Portland Business Journal; Lists; Portland Metro Area’s Largest Employers 2019
17City of Portland, Oregon Popular Annual Financial Report for the Year Ended, June 30, 2019
GLOSSARY
• Assets - What the City owns.• Business-Type Activities - Activities financed through fees charged to users of services. Includes
Bureau of Environmental Services, Water, Parking Facilities, and other non-major business-type activities
• Capital Assets - Tangible or intangible non-financial assets that have an initial useful life of more than one year and are used in providing services to the City’s members.
• Deferred Inflow of Resources - An acquisition of net position by the government that is applicable to a future reporting period.
• Deferred Outflow of Resources - A consumption of net position by the government that is applicable to a future reporting period.
• Expenditures - the cost of goods and services, which include public consumption and public investment, and transfer payments consisting of income transfers (pensions, social benefits) and capital transfer.
• Expenses - Money spent or cost incurred representing the cost of providing services to the community.• Final Budgeted Amounts – Amounts from the budget amended by ordinances, typically during a
Budget Monitoring Process, by City Council throughout the fiscal year.• Generally Accepted Accounting Principles (GAAP) - A collection of commonly followed accounting
rules and standards for financial reporting.• General Fund - The primary operating fund of the City. It supports the day-to-day operations of many
of the core City services.• Governmental Accounting Standards Board (GASB) - A source of GAAP used by state and local
governments in the United States.• Governmental Activities - Activities generally financed through taxes and intergovernmental
revenues. Includes primary governmental functions like public safety, transportation, community development, and general government.
• Liabilities - What the City owes.• Net Position - The residual of all other financial statement elements in a statement of net position;
i.e., the difference between assets, liabilities, deferred outflows of resources, and deferred inflows of resources.
• OPEB - Other post-employment benefits (OPEB) refers to the benefits, other than pensions, that a state or local government employee receives as part of his or her package of retirement benefits.
• Original Budgeted Amounts - Amounts from the adopted budget from which the City operates during the fiscal year.
• PERS - Public Employees Retirement System under which eligible City employees are covered. • Revenue - Income generated from normal business activities such as property taxes, lodging taxes,
licenses and fees, charges for services, grants, and other sources.
*all icons provided by freepik.com
City Of Portland, Oregon
Bureau of Revenue & Financial ServicesAccounting Division
1120 SW 5th Avenue, Suite 1040Portland, OR 97204
Phone: 503-823-5288