popular annual financial report - civicplus
TRANSCRIPT
P O P U L A R A N N U A L
F I N A N C I A L R E P O R T
F O R F I S C A L Y E A R E N D E D
S E P T E M B E R 3 0 , 2 0 1 9
C I T Y O F P L A N O , T E X A S

Popular Annual Financial Report
SEPTEMBER 30, 2019
Prepared by: Accounting Division
Director of Finance – Denise Tacke Controller – Allison Friloux
The Popular Annual Financial Report (PAFR) is intended to summarize and simplify the statistical, economic and financial information contained in the 2019 Comprehensive Annual Financial Report (CAFR). The CAFR was prepared in conformance with generally accepted accounting principles (GAAP) and was independently audited by Weaver and Tidwell, L.L.P. The PAFR, while unaudited, provides a brief analysis of where the City’s revenues come from and where the dollars are spent as well as trends and local economy. It is presented as a means of increasing public awareness about the City’s financial condition through a more user-friendly presentation. Most of the detailed information in this report refers to our operating accounts, not all of the individual funds and component unit funds. For a more detailed, GAAP basis, full disclosure review of the individual funds and component unit financial statements, please refer to the City’s CAFR that is accessible through the City’s website: https://www.plano.gov/ArchiveCenter/ViewFile/Item/7197

City Government 2019
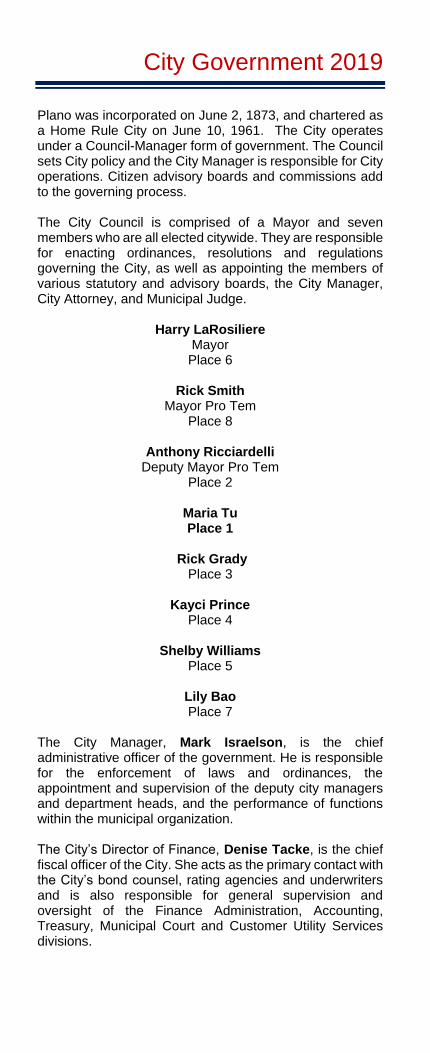
Plano was incorporated on June 2, 1873, and chartered as a Home Rule City on June 10, 1961. The City operates under a Council-Manager form of government. The Council sets City policy and the City Manager is responsible for City operations. Citizen advisory boards and commissions add to the governing process.
The City Council is comprised of a Mayor and seven members who are all elected citywide. They are responsible for enacting ordinances, resolutions and regulations governing the City, as well as appointing the members of various statutory and advisory boards, the City Manager, City Attorney, and Municipal Judge.
Harry LaRosiliere Mayor Place 6
Rick Smith Mayor Pro Tem
Place 8
Anthony Ricciardelli Deputy Mayor Pro Tem
Place 2
Maria Tu Place 1
Rick Grady Place 3
Kayci Prince Place 4
Shelby Williams Place 5
Lily Bao Place 7
The City Manager, Mark Israelson, is the chief administrative officer of the government. He is responsible for the enforcement of laws and ordinances, the appointment and supervision of the deputy city managers and department heads, and the performance of functions within the municipal organization.
The City’s Director of Finance, Denise Tacke, is the chief fiscal officer of the City. She acts as the primary contact with the City’s bond counsel, rating agencies and underwriters and is also responsible for general supervision and oversight of the Finance Administration, Accounting, Treasury, Municipal Court and Customer Utility Services divisions.
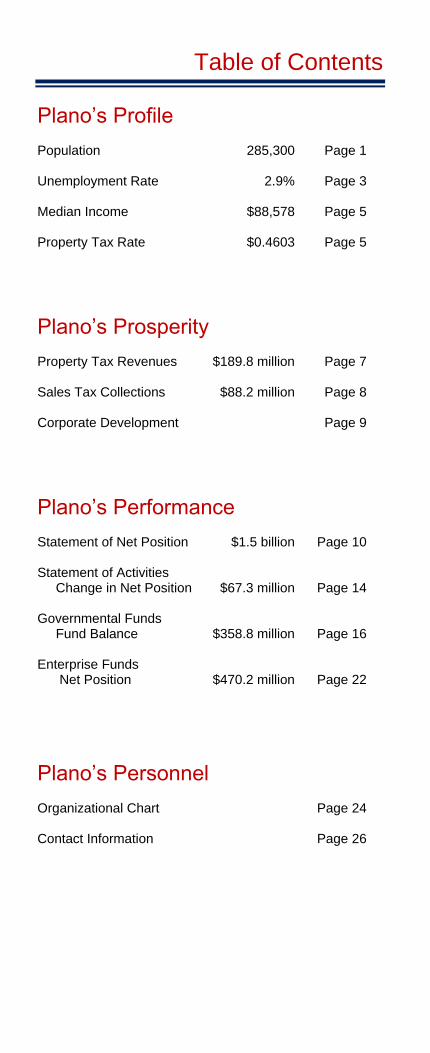
Table of Contents
Plano’s Profile
Population 285,300 Page 1
Unemployment Rate 2.9% Page 3
Median Income $88,578 Page 5
Property Tax Rate $0.4603 Page 5
Plano’s Prosperity
Property Tax Revenues $189.8 million Page 7
Sales Tax Collections $88.2 million Page 8
Corporate Development Page 9
Plano’s Performance
Statement of Net Position $1.5 billion Page 10
Statement of Activities Change in Net Position $67.3 million Page 14
Governmental Funds Fund Balance $358.8 million Page 16
Enterprise Funds Net Position $470.2 million Page 22
Plano’s Personnel
Organizational Chart Page 24
Contact Information Page 26
Plano’s Profile
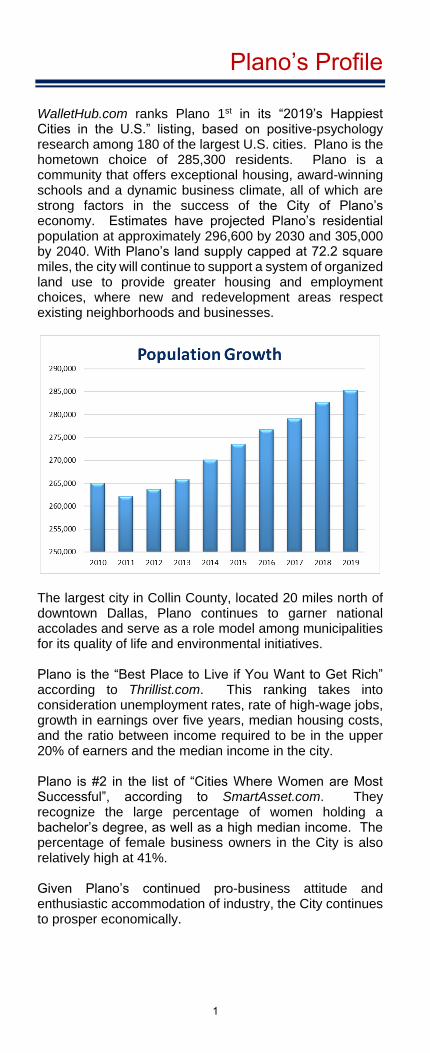
WalletHub.com ranks Plano 1st in its “2019’s Happiest Cities in the U.S.” listing, based on positive-psychology research among 180 of the largest U.S. cities. Plano is the hometown choice of 285,300 residents. Plano is a community that offers exceptional housing, award-winning schools and a dynamic business climate, all of which are strong factors in the success of the City of Plano’s economy. Estimates have projected Plano’s residential population at approximately 296,600 by 2030 and 305,000 by 2040. With Plano’s land supply capped at 72.2 square miles, the city will continue to support a system of organized land use to provide greater housing and employment choices, where new and redevelopment areas respect existing neighborhoods and businesses.
The largest city in Collin County, located 20 miles north of downtown Dallas, Plano continues to garner national accolades and serve as a role model among municipalities for its quality of life and environmental initiatives.
Plano is the “Best Place to Live if You Want to Get Rich” according to Thrillist.com. This ranking takes into consideration unemployment rates, rate of high-wage jobs, growth in earnings over five years, median housing costs, and the ratio between income required to be in the upper 20% of earners and the median income in the city.
Plano is #2 in the list of “Cities Where Women are Most Successful”, according to SmartAsset.com. They recognize the large percentage of women holding a bachelor’s degree, as well as a high median income. The percentage of female business owners in the City is also relatively high at 41%.
Given Plano’s continued pro-business attitude and enthusiastic accommodation of industry, the City continues to prosper economically.
1
Plano’s Profile
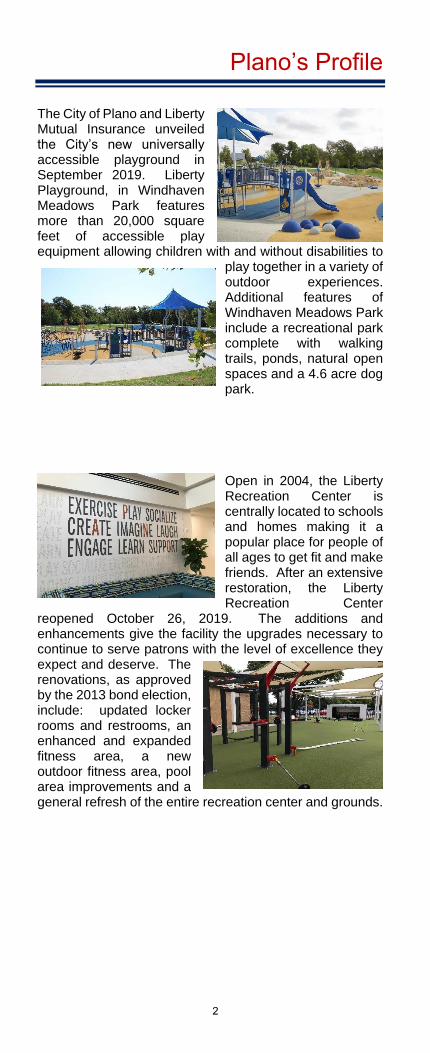
The City of Plano and Liberty Mutual Insurance unveiled the City’s new universally accessible playground in September 2019. Liberty Playground, in Windhaven Meadows Park features more than 20,000 square feet of accessible play equipment allowing children with and without disabilities to
play together in a variety of outdoor experiences. Additional features of Windhaven Meadows Park include a recreational park complete with walking trails, ponds, natural open spaces and a 4.6 acre dog park.
Open in 2004, the Liberty Recreation Center is centrally located to schools and homes making it a popular place for people of all ages to get fit and make friends. After an extensive restoration, the Liberty Recreation Center
reopened October 26, 2019. The additions and enhancements give the facility the upgrades necessary to continue to serve patrons with the level of excellence they expect and deserve. The renovations, as approved by the 2013 bond election, include: updated locker rooms and restrooms, an enhanced and expanded fitness area, a new outdoor fitness area, pool area improvements and a general refresh of the entire recreation center and grounds.
2
Plano’s Profile
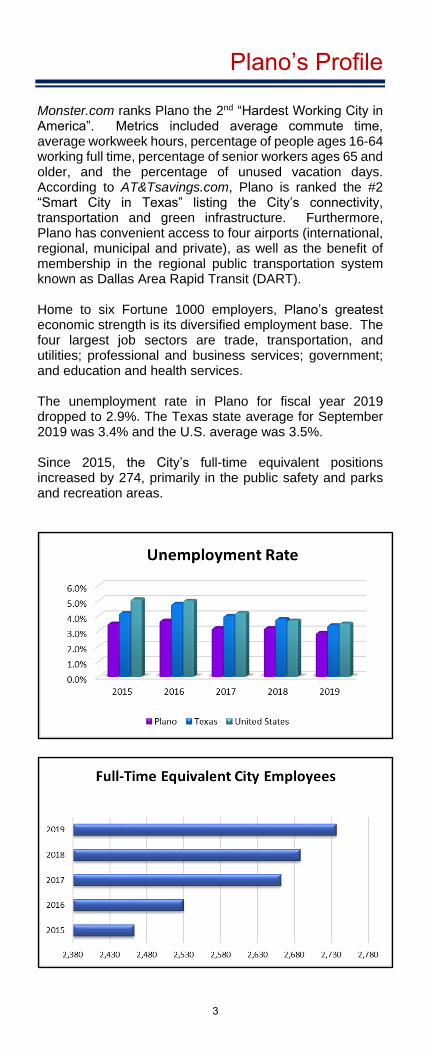
Monster.com ranks Plano the 2nd “Hardest Working City in America”. Metrics included average commute time, average workweek hours, percentage of people ages 16-64 working full time, percentage of senior workers ages 65 and older, and the percentage of unused vacation days. According to AT&Tsavings.com, Plano is ranked the #2 “Smart City in Texas” listing the City’s connectivity, transportation and green infrastructure. Furthermore, Plano has convenient access to four airports (international, regional, municipal and private), as well as the benefit of membership in the regional public transportation system known as Dallas Area Rapid Transit (DART). Home to six Fortune 1000 employers, Plano’s greatest economic strength is its diversified employment base. The four largest job sectors are trade, transportation, and utilities; professional and business services; government; and education and health services. The unemployment rate in Plano for fiscal year 2019 dropped to 2.9%. The Texas state average for September 2019 was 3.4% and the U.S. average was 3.5%. Since 2015, the City’s full-time equivalent positions increased by 274, primarily in the public safety and parks and recreation areas.
3

Plano’s Profile
Contributing to the low levels of unemployment, Plano has been fortunate to have some of the nation’s largest and most recognized corporate employers make Plano their home. The principal employers within the City claim 17.8% of the total City employment, which equates to 29,186 employees.
Plano is ranked #5 for the “2019 Best Cities to Live in America” according to Niche.com. Cities were ranked based upon amenities, cost of living, crime rates, education, employment, housing and weather.
Industry Composition
4
Plano’s Profile
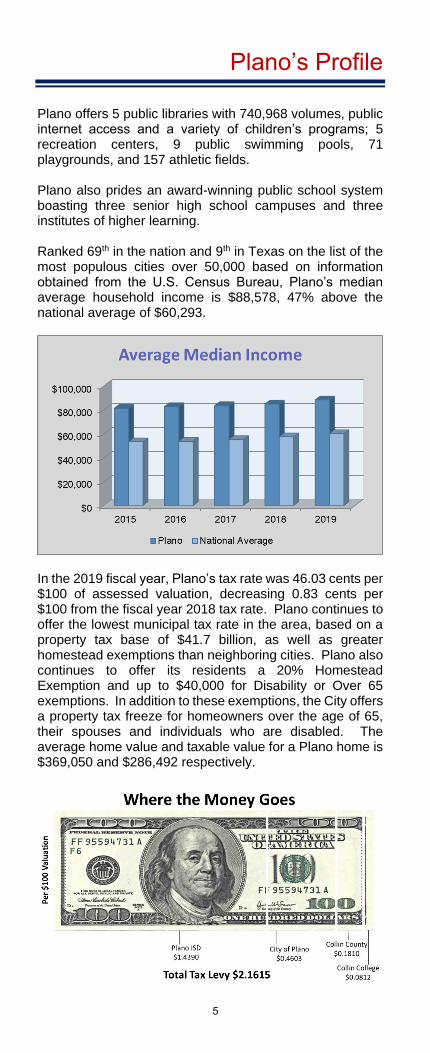
Plano offers 5 public libraries with 740,968 volumes, public internet access and a variety of children’s programs; 5 recreation centers, 9 public swimming pools, 71 playgrounds, and 157 athletic fields. Plano also prides an award-winning public school system boasting three senior high school campuses and three institutes of higher learning. Ranked 69th in the nation and 9th in Texas on the list of the most populous cities over 50,000 based on information obtained from the U.S. Census Bureau, Plano’s median average household income is $88,578, 47% above the national average of $60,293.
In the 2019 fiscal year, Plano’s tax rate was 46.03 cents per $100 of assessed valuation, decreasing 0.83 cents per $100 from the fiscal year 2018 tax rate. Plano continues to offer the lowest municipal tax rate in the area, based on a property tax base of $41.7 billion, as well as greater homestead exemptions than neighboring cities. Plano also continues to offer its residents a 20% Homestead Exemption and up to $40,000 for Disability or Over 65 exemptions. In addition to these exemptions, the City offers a property tax freeze for homeowners over the age of 65, their spouses and individuals who are disabled. The average home value and taxable value for a Plano home is $369,050 and $286,492 respectively.
5
Yelp names Plano 4th on its list of
“Top US Destinations for Food
Lovers”, looking at ratings, reviews,
cuisine diversity and percentage of
food photos to reveal where Yelpers
love to eat right now.
WalletHub.com ranks Plano as the
4th “Best Place to Raise a Family”,
comparing 180 U.S. cities across key
factors such as quality of local schools,
health-care systems, affordability and
access to family amenities.
The City of Plano’s Fire EMS was
awarded the Mission: Lifeline Gold
Plus Award from the American Heart
Association in September 2019. This
program is designed to showcase
Emergency Medical Service
organizations across the nation for
excellent heart attack care.
6
Plano’s Prosperity
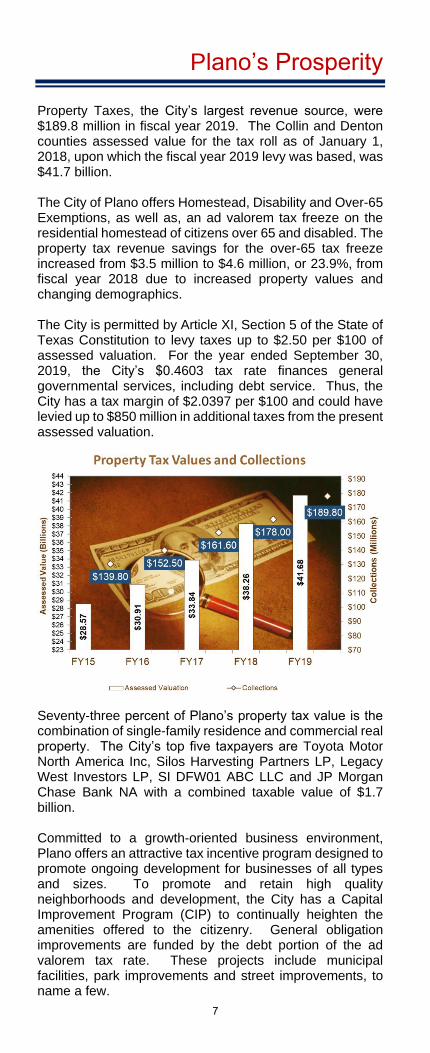
Property Taxes, the City’s largest revenue source, were $189.8 million in fiscal year 2019. The Collin and Denton counties assessed value for the tax roll as of January 1, 2018, upon which the fiscal year 2019 levy was based, was $41.7 billion. The City of Plano offers Homestead, Disability and Over-65 Exemptions, as well as, an ad valorem tax freeze on the residential homestead of citizens over 65 and disabled. The property tax revenue savings for the over-65 tax freeze increased from $3.5 million to $4.6 million, or 23.9%, from fiscal year 2018 due to increased property values and changing demographics. The City is permitted by Article XI, Section 5 of the State of Texas Constitution to levy taxes up to $2.50 per $100 of assessed valuation. For the year ended September 30, 2019, the City’s $0.4603 tax rate finances general governmental services, including debt service. Thus, the City has a tax margin of $2.0397 per $100 and could have levied up to $850 million in additional taxes from the present assessed valuation.
Seventy-three percent of Plano’s property tax value is the combination of single-family residence and commercial real property. The City’s top five taxpayers are Toyota Motor North America Inc, Silos Harvesting Partners LP, Legacy West Investors LP, SI DFW01 ABC LLC and JP Morgan Chase Bank NA with a combined taxable value of $1.7 billion. Committed to a growth-oriented business environment, Plano offers an attractive tax incentive program designed to promote ongoing development for businesses of all types and sizes. To promote and retain high quality neighborhoods and development, the City has a Capital Improvement Program (CIP) to continually heighten the amenities offered to the citizenry. General obligation improvements are funded by the debt portion of the ad valorem tax rate. These projects include municipal facilities, park improvements and street improvements, to name a few.
7

Plano’s Prosperity .
In 2019, the City had $1.6 billion invested in a broad range of capital assets. The major additions to capital outlay that offered enhancements to the quality of life in Plano include:
Sales tax collections, the City’s second largest revenue source, were $88.2 million in fiscal year 2019, an increase of 3.1% from the prior fiscal year. The City of Plano’s local portion of 1% of the 8.25% sales tax is used to fund the City’s general expenses. The sales tax collections are produced primarily from Plano’s sizeable retail base, including numerous shopping centers, hundreds of specialty shops and boutiques and major retailers throughout the city.
8
Plano’s Prosperity
To amplify its corporate development, the City of Plano offers tax abatements for new commercial or industrial business construction or facility expansion, as well as business personal property tax associated with real property. The tax abatement applies to the value of new improvements. Numerous companies have significantly expanded since moving to Plano due to the tax abatements, further contributing to the City’s growth. In 2019, through continued pro-business attitude and enthusiastic accommodation of industry, the City’s commercial development continued to prosper in the existing technology and retail industry as well as the healthcare industry. Home to many corporate giants, such as Toyota Motor North America, J.C. Penney, Bank of America, Liberty Mutual Insurance Co., Ericsson, JP Morgan Chase, Frito-Lay, McAfee, Medical City Plano, Capital One Finance and Keurig Dr Pepper, the City of Plano has been fortunate over the past two decades to have numerous corporate citizens make Plano their home. With one of the lowest property tax rates in the state of Texas, companies locating to Plano boost their bottom line while offering a high quality of life for employees. An abridged list of the 2019 highlights for business relocations and expansions include:
ADDITIONS / RELOCATIONS / EXPANSIONS * JP Morgan Chase * Spaces * Masergy * Mitel * Aimbridge Hospitality * Cognizant Technology Solutions * Toyota Motor Credit * Critical Start * DENSO * Healthcare Associates of Texas * SML RFID * NuZee (dba Coffee Blenders) * Pelitas * Lifeblue * Newmark Knight Frank * CDW * Fundbox * European Wax Center * USAA * Ribbon Communications * Splunk
9

Plano’s Performance
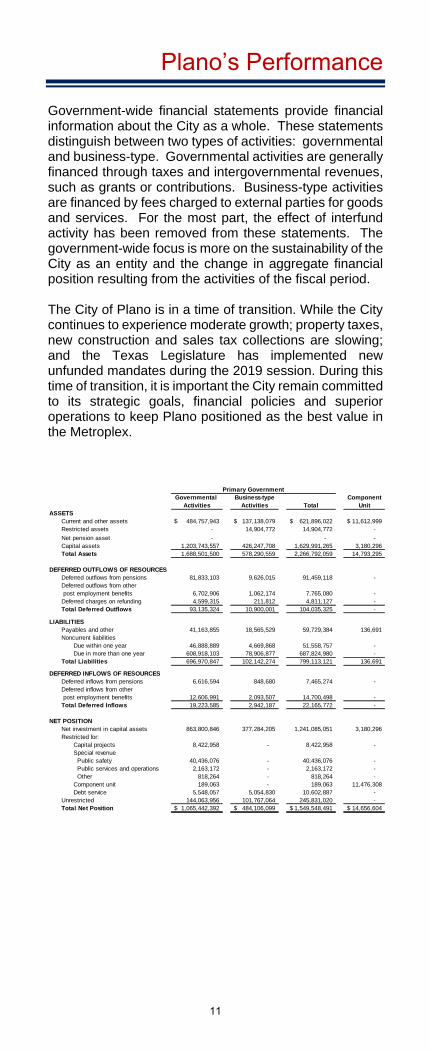
The Statement of Net Position, as of September 30, 2019, presents a government-wide financial analysis of all the City of Plano’s assets, deferred outflows, liabilities and deferred inflows with the difference reported as net position. Net position may serve over time as a useful indication of the City’s financial position. It is a snapshot of the City’s entire resources and obligations, or net worth, at the close of the fiscal year. The City of Plano’s combined net position was $1.55 billion as of September 30, 2019, which consists of $1.07 billion in governmental activities and $484 million in business-type activities. Plano’s combined net position has increased $67.3 million or 4.5% over the prior year. The three components of net position are:
Net investment in capital assets represents the City’s capital assets, net of accumulated depreciation, reduced by the outstanding balances of bonds that are attributable to the acquisition, construction, or improvement of those assets.
Restricted net position represents external restrictions imposed by creditors, grantors, contributors, or regulations of other governments and restrictions imposed by law through constitutional provisions or enabling legislation.
Unrestricted net position represents net assets that may be used to meet the City’s ongoing obligations to citizens and creditors.
10
Plano’s Performance
Government-wide financial statements provide financial information about the City as a whole. These statements distinguish between two types of activities: governmental and business-type. Governmental activities are generally financed through taxes and intergovernmental revenues, such as grants or contributions. Business-type activities are financed by fees charged to external parties for goods and services. For the most part, the effect of interfund activity has been removed from these statements. The government-wide focus is more on the sustainability of the City as an entity and the change in aggregate financial position resulting from the activities of the fiscal period. The City of Plano is in a time of transition. While the City continues to experience moderate growth; property taxes, new construction and sales tax collections are slowing; and the Texas Legislature has implemented new unfunded mandates during the 2019 session. During this time of transition, it is important the City remain committed to its strategic goals, financial policies and superior operations to keep Plano positioned as the best value in the Metroplex.
Governmental Business-type Component
Activities Activities Total Unit
ASSETS
Current and other assets 484,757,943$ 137,138,079$ 621,896,022$ 11,612,999$
Restricted assets - 14,904,772 14,904,772 -
Net pension asset - - -
Capital assets 1,203,743,557 426,247,708 1,629,991,265 3,180,296
Total Assets 1,688,501,500 578,290,559 2,266,792,059 14,793,295
DEFERRED OUTFLOWS OF RESOURCES
Deferred outflows from pensions 81,833,103 9,626,015 91,459,118 -
Deferred outflows from other
post employment benefits 6,702,906 1,062,174 7,765,080 -
Deferred charges on refunding 4,599,315 211,812 4,811,127 -
Total Deferred Outflows 93,135,324 10,900,001 104,035,325 -
LIABILITIES
Payables and other 41,163,855 18,565,529 59,729,384 136,691
Noncurrent liabilities
Due within one year 46,888,889 4,669,868 51,558,757 -
Due in more than one year 608,918,103 78,906,877 687,824,980 -
Total Liabilities 696,970,847 102,142,274 799,113,121 136,691
DEFERRED INFLOWS OF RESOURCES
Deferred inflows from pensions 6,616,594 848,680 7,465,274 -
Deferred inflows from other
post employment benefits 12,606,991 2,093,507 14,700,498 -
Total Deferred Inflows 19,223,585 2,942,187 22,165,772 -
NET POSITION
Net investment in capital assets 863,800,846 377,284,205 1,241,085,051 3,180,296
Restricted for:
Capital projects 8,422,958 - 8,422,958 -
Special revenue
Public safety 40,436,076 - 40,436,076 -
Public services and operations 2,163,172 - 2,163,172 -
Other 818,264 - 818,264 -
Component unit 189,063 - 189,063 11,476,308
Debt service 5,548,057 5,054,830 10,602,887 -
Unrestricted 144,063,956 101,767,064 245,831,020 -
Total Net Position 1,065,442,392$ 484,106,099$ 1,549,548,491$ 14,656,604$
Primary Government
11
Plano’s Performance
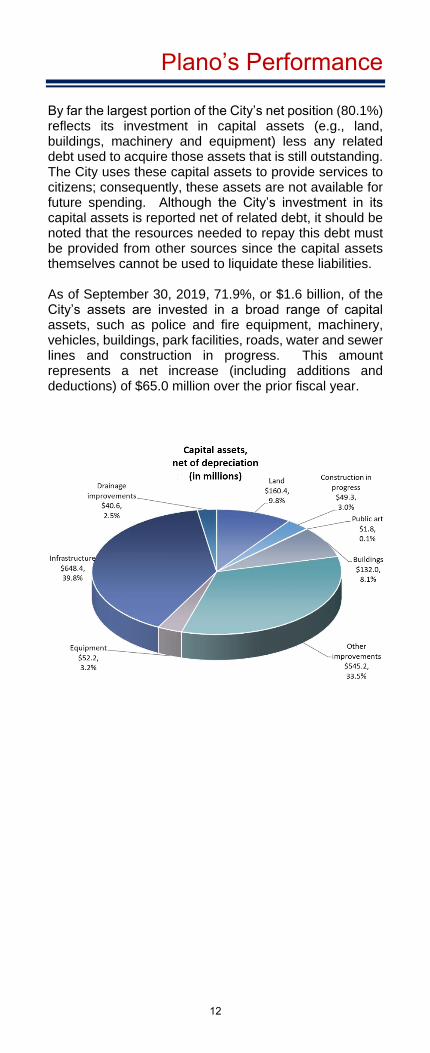
By far the largest portion of the City’s net position (80.1%) reflects its investment in capital assets (e.g., land, buildings, machinery and equipment) less any related debt used to acquire those assets that is still outstanding. The City uses these capital assets to provide services to citizens; consequently, these assets are not available for future spending. Although the City’s investment in its capital assets is reported net of related debt, it should be noted that the resources needed to repay this debt must be provided from other sources since the capital assets themselves cannot be used to liquidate these liabilities.
As of September 30, 2019, 71.9%, or $1.6 billion, of the City’s assets are invested in a broad range of capital assets, such as police and fire equipment, machinery, vehicles, buildings, park facilities, roads, water and sewer lines and construction in progress. This amount represents a net increase (including additions and deductions) of $65.0 million over the prior fiscal year.
12
Plano’s Performance
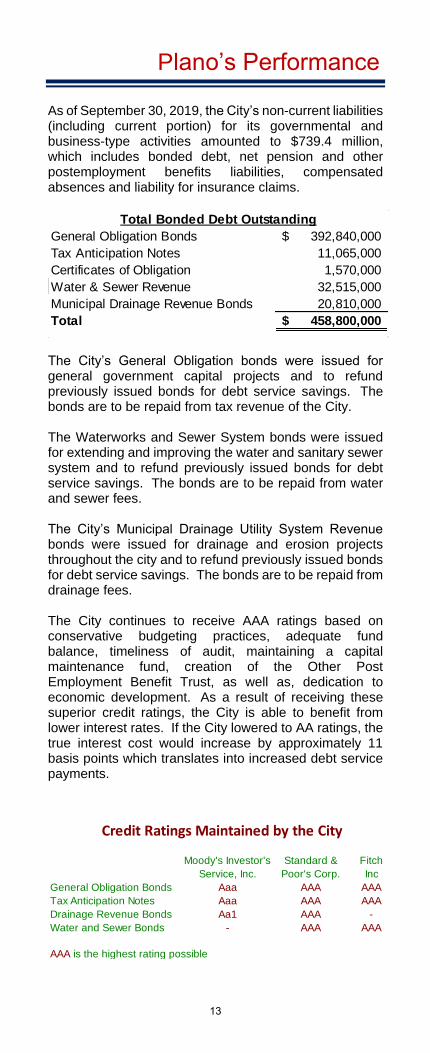
As of September 30, 2019, the City’s non-current liabilities (including current portion) for its governmental and business-type activities amounted to $739.4 million, which includes bonded debt, net pension and other postemployment benefits liabilities, compensated absences and liability for insurance claims.
The City’s General Obligation bonds were issued for general government capital projects and to refund previously issued bonds for debt service savings. The bonds are to be repaid from tax revenue of the City. The Waterworks and Sewer System bonds were issued for extending and improving the water and sanitary sewer system and to refund previously issued bonds for debt service savings. The bonds are to be repaid from water and sewer fees. The City’s Municipal Drainage Utility System Revenue bonds were issued for drainage and erosion projects throughout the city and to refund previously issued bonds for debt service savings. The bonds are to be repaid from drainage fees. The City continues to receive AAA ratings based on conservative budgeting practices, adequate fund balance, timeliness of audit, maintaining a capital maintenance fund, creation of the Other Post Employment Benefit Trust, as well as, dedication to economic development. As a result of receiving these superior credit ratings, the City is able to benefit from lower interest rates. If the City lowered to AA ratings, the true interest cost would increase by approximately 11 basis points which translates into increased debt service payments.
General Obligation Bonds 392,840,000$
Tax Anticipation Notes 11,065,000
Certificates of Obligation 1,570,000
Water & Sewer Revenue 32,515,000
Municipal Drainage Revenue Bonds 20,810,000
Total 458,800,000$
Total Bonded Debt Outstanding
Moody's Investor's Standard & Fitch
Service, Inc. Poor's Corp. Inc
General Obligation Bonds Aaa AAA AAA
Tax Anticipation Notes Aaa AAA AAA
Drainage Revenue Bonds Aa1 AAA -
Water and Sewer Bonds - AAA AAA
AAA is the highest rating possible
Credit Ratings Maintained by the City
13
Plano’s Performance
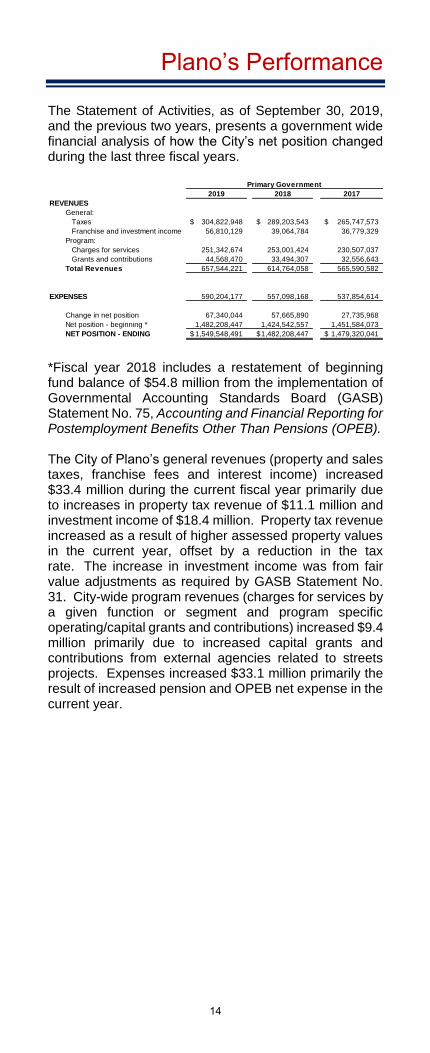
The Statement of Activities, as of September 30, 2019, and the previous two years, presents a government wide financial analysis of how the City’s net position changed during the last three fiscal years.
*Fiscal year 2018 includes a restatement of beginning fund balance of $54.8 million from the implementation of Governmental Accounting Standards Board (GASB) Statement No. 75, Accounting and Financial Reporting for Postemployment Benefits Other Than Pensions (OPEB). The City of Plano’s general revenues (property and sales taxes, franchise fees and interest income) increased $33.4 million during the current fiscal year primarily due to increases in property tax revenue of $11.1 million and investment income of $18.4 million. Property tax revenue increased as a result of higher assessed property values in the current year, offset by a reduction in the tax rate. The increase in investment income was from fair value adjustments as required by GASB Statement No. 31. City-wide program revenues (charges for services by a given function or segment and program specific operating/capital grants and contributions) increased $9.4 million primarily due to increased capital grants and contributions from external agencies related to streets projects. Expenses increased $33.1 million primarily the result of increased pension and OPEB net expense in the current year.
2019 2018 2017
REVENUES
General:
Taxes 304,822,948$ 289,203,543$ 265,747,573$
Franchise and investment income 56,810,129 39,064,784 36,779,329
Program:
Charges for services 251,342,674 253,001,424 230,507,037
Grants and contributions 44,568,470 33,494,307 32,556,643
Total Revenues 657,544,221 614,764,058 565,590,582
EXPENSES 590,204,177 557,098,168 537,854,614
Change in net position 67,340,044 57,665,890 27,735,968
Net position - beginning * 1,482,208,447 1,424,542,557 1,451,584,073
NET POSITION - ENDING 1,549,548,491$ 1,482,208,447$ 1,479,320,041$
Primary Government
14
Plano’s Performance
15

Plano’s Performance
Governmental Funds
The fund financial statements in the CAFR provide detailed information about the City’s major funds. The non-major funds are combined in a separate column. The City’s two types of funds are governmental and proprietary. The majority of the City’s basic services, such as police, fire, libraries, development, public services and operations, public works, technology services and general administration are reported in governmental funds. Property taxes, sales taxes and franchise fees finance most of these activities. Governmental funds focus on how money flows into and out of those funds and the balances left at year end that are available for spending. The City of Plano maintains twenty-four individual governmental funds. As of September 30, 2019, the City of Plano’s governmental funds reported a combined ending fund balance of $358.8 million, an increase of $31.1 million in comparison to the prior fiscal year. The General Fund, the chief operating fund of a state or local government, is the most significant of the City’s governmental funds.
General Fund Balance Sheet
2019 2018
ASSETS
Cash and cash equivalents 4,345,079$ 12,604,837$
Investments 57,629,567 41,437,343
Receivables (net of allowance for uncollectibles)
Taxes 15,688,480 15,342,104
Accounts 1,269,131 1,656,072
Accrued interest 327,296 158,019
Due from other funds 631,609 1,046,573
Due from other governments 1,040,482 658,874
Inventories 127,665 116,045
Prepaid items and other assets 315,961 336,093
Total assets 81,375,270$ 73,355,960$
LIABILITIES, DEFERRED INFLOWS AND FUND BALANCES
Liabilities:
Accounts payable 2,989,101$ 3,113,928$
Accrued liabilities 10,197,393 9,220,851
Unearned revenue 203,900 228,097
Due to other funds 451,769 -
Due to other governments 211,599 211,599
Total liabilities 14,053,762 12,774,475
Deferred inflows of resources:
Unavailable revenue 8,641,455 8,367,961
Fund Balance:
Nonspendable:
Prepaid items and inventories 443,626 452,138
Notes receivable
General government 857,144 117,523
Administrative services 256,169 275,089
Police 591,259 397,680
Fire 491,920 447,643
Libraries 90,060 172,395
Development 1,605,069 1,460,957
Public services and operations 96,540 25,108
Parks and recreation 1,073,697 1,120,841
Public works 194,654 1,116,644
Other purposes 260,037 264,164
Unassigned 52,719,878 46,363,342
Total fund balance 58,680,053 52,213,524
81,375,270$ 73,355,960$ Total liabilities, deferred inflows and
fund balance
16
Plano’s Performance
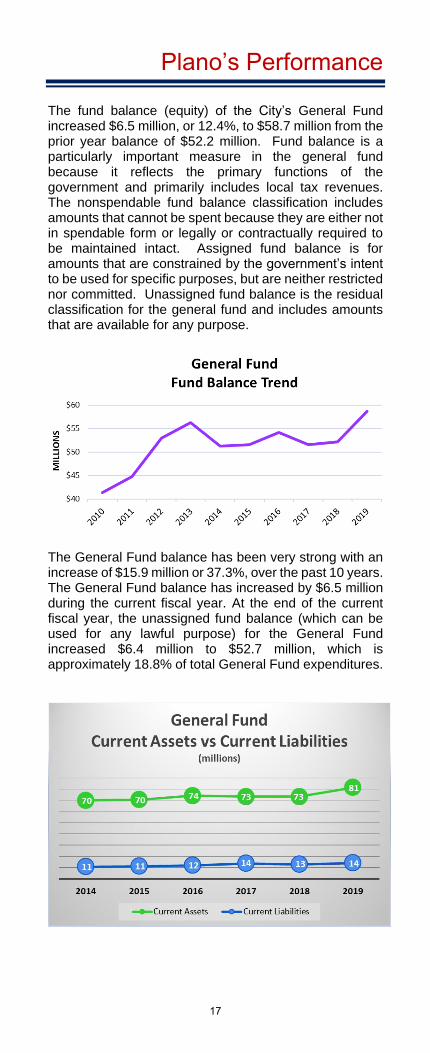
The fund balance (equity) of the City’s General Fund increased $6.5 million, or 12.4%, to $58.7 million from the prior year balance of $52.2 million. Fund balance is a particularly important measure in the general fund because it reflects the primary functions of the government and primarily includes local tax revenues. The nonspendable fund balance classification includes amounts that cannot be spent because they are either not in spendable form or legally or contractually required to be maintained intact. Assigned fund balance is for amounts that are constrained by the government’s intent to be used for specific purposes, but are neither restricted nor committed. Unassigned fund balance is the residual classification for the general fund and includes amounts that are available for any purpose.
The General Fund balance has been very strong with an increase of $15.9 million or 37.3%, over the past 10 years. The General Fund balance has increased by $6.5 million during the current fiscal year. At the end of the current fiscal year, the unassigned fund balance (which can be used for any lawful purpose) for the General Fund increased $6.4 million to $52.7 million, which is approximately 18.8% of total General Fund expenditures.
17
Plano’s Performance
General Fund Revenues and Expenditures
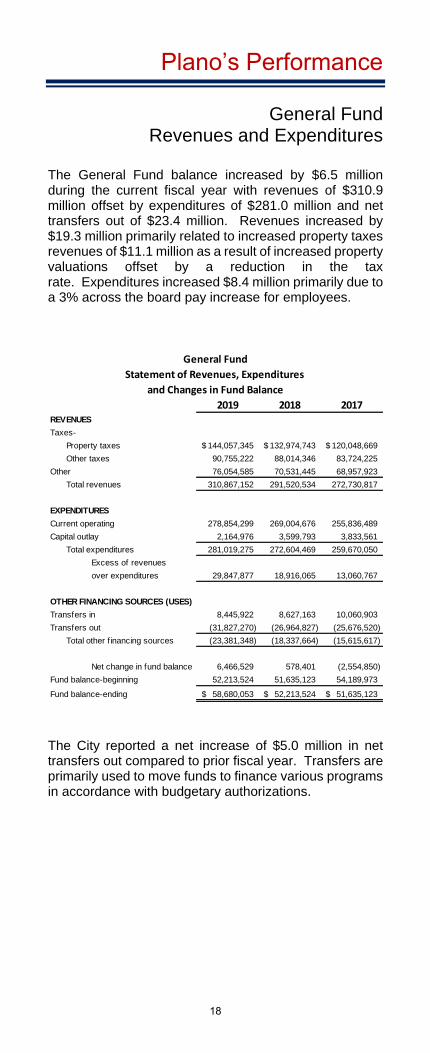
The General Fund balance increased by $6.5 million during the current fiscal year with revenues of $310.9 million offset by expenditures of $281.0 million and net transfers out of $23.4 million. Revenues increased by $19.3 million primarily related to increased property taxes revenues of $11.1 million as a result of increased property valuations offset by a reduction in the tax rate. Expenditures increased $8.4 million primarily due to a 3% across the board pay increase for employees.
The City reported a net increase of $5.0 million in net transfers out compared to prior fiscal year. Transfers are primarily used to move funds to finance various programs in accordance with budgetary authorizations.
2019 2018 2017REVENUES
Taxes-
Property taxes 144,057,345$ 132,974,743$ 120,048,669$
Other taxes 90,755,222 88,014,346 83,724,225
Other 76,054,585 70,531,445 68,957,923
Total revenues 310,867,152 291,520,534 272,730,817
EXPENDITURES
Current operating 278,854,299 269,004,676 255,836,489
Capital outlay 2,164,976 3,599,793 3,833,561
Total expenditures 281,019,275 272,604,469 259,670,050
Excess of revenues
over expenditures 29,847,877 18,916,065 13,060,767
OTHER FINANCING SOURCES (USES)
Transfers in 8,445,922 8,627,163 10,060,903
Transfers out (31,827,270) (26,964,827) (25,676,520)
Total other f inancing sources (23,381,348) (18,337,664) (15,615,617)
Net change in fund balance 6,466,529 578,401 (2,554,850)
Fund balance-beginning 52,213,524 51,635,123 54,189,973
Fund balance-ending 58,680,053$ 52,213,524$ 51,635,123$
General Fund
Statement of Revenues, Expenditures
and Changes in Fund Balance
18
Plano’s Performance
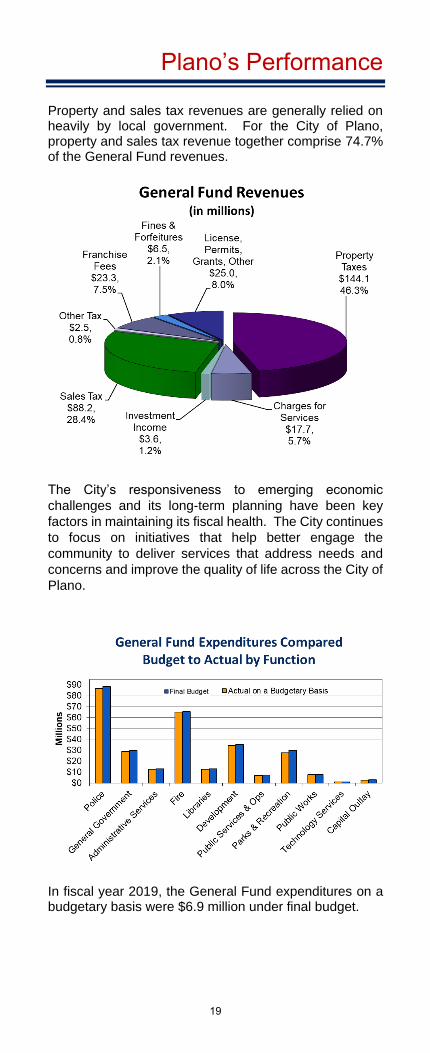
Property and sales tax revenues are generally relied on heavily by local government. For the City of Plano, property and sales tax revenue together comprise 74.7% of the General Fund revenues.
The City’s responsiveness to emerging economic
challenges and its long-term planning have been key
factors in maintaining its fiscal health. The City continues
to focus on initiatives that help better engage the
community to deliver services that address needs and
concerns and improve the quality of life across the City of
Plano.
In fiscal year 2019, the General Fund expenditures on a budgetary basis were $6.9 million under final budget.
19
Plano’s Performance
General Fund Revenues and Expenditures
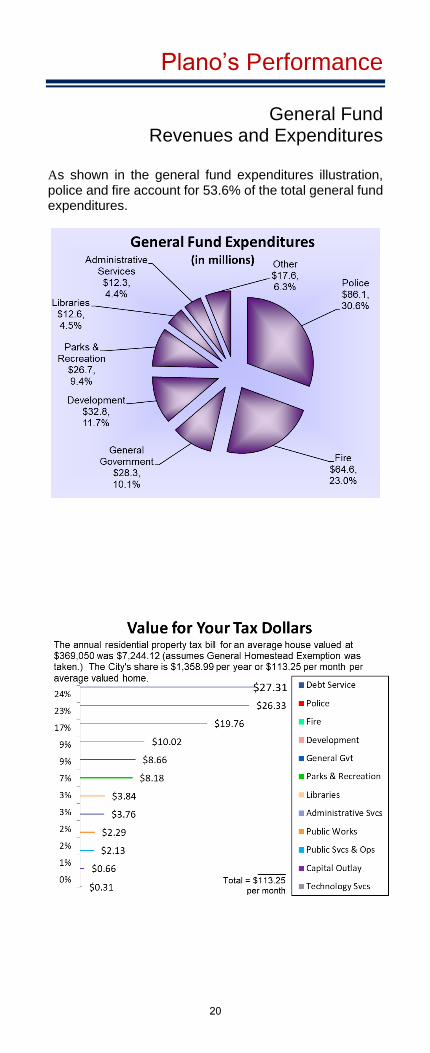
As shown in the general fund expenditures illustration, police and fire account for 53.6% of the total general fund expenditures.
20
Plano’s Performance
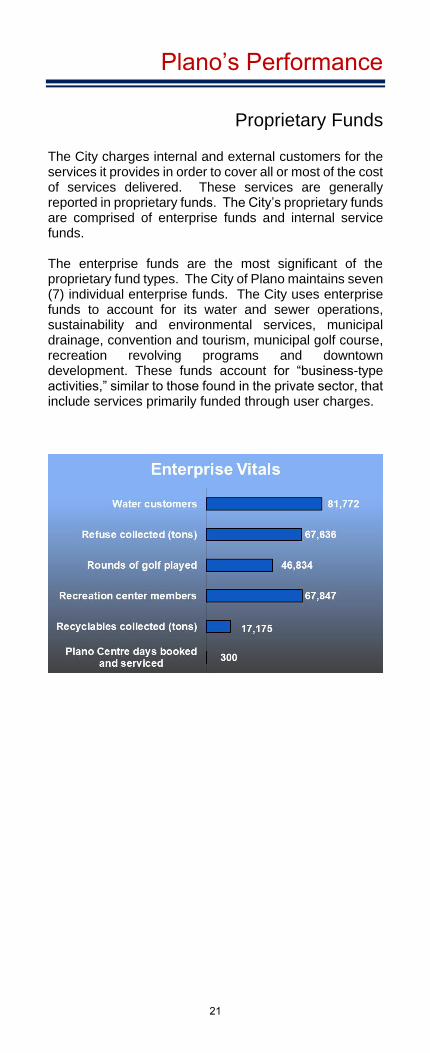
Proprietary Funds
The City charges internal and external customers for the services it provides in order to cover all or most of the cost of services delivered. These services are generally reported in proprietary funds. The City’s proprietary funds are comprised of enterprise funds and internal service funds. The enterprise funds are the most significant of the proprietary fund types. The City of Plano maintains seven (7) individual enterprise funds. The City uses enterprise funds to account for its water and sewer operations, sustainability and environmental services, municipal drainage, convention and tourism, municipal golf course, recreation revolving programs and downtown development. These funds account for “business-type activities,” similar to those found in the private sector, that include services primarily funded through user charges.
21
Plano’s Performance
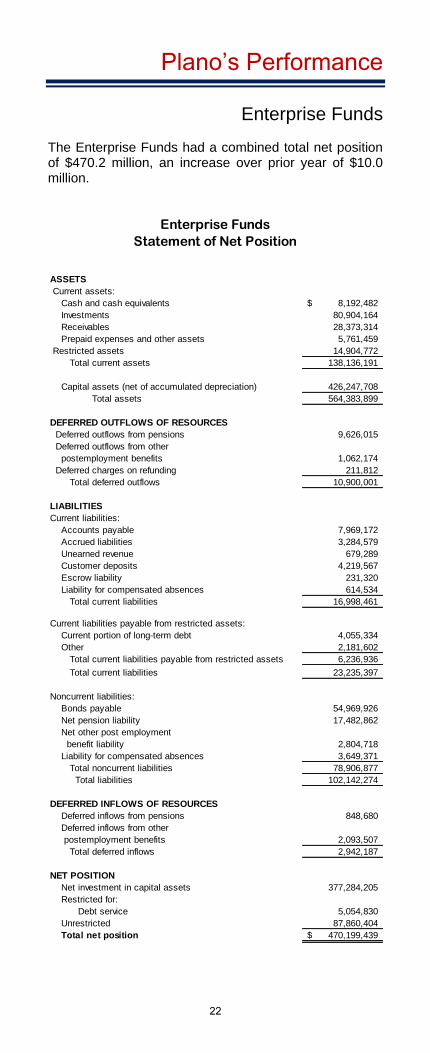
Enterprise Funds The Enterprise Funds had a combined total net position of $470.2 million, an increase over prior year of $10.0 million.
ASSETS
Current assets:
Cash and cash equivalents 8,192,482$
Investments 80,904,164
Receivables 28,373,314
Prepaid expenses and other assets 5,761,459
Restricted assets 14,904,772
Total current assets 138,136,191
Capital assets (net of accumulated depreciation) 426,247,708
Total assets 564,383,899
DEFERRED OUTFLOWS OF RESOURCES
Deferred outflows from pensions 9,626,015
Deferred outflows from other
postemployment benefits 1,062,174
Deferred charges on refunding 211,812
Total deferred outflows 10,900,001
LIABILITIES
Current liabilities:
Accounts payable 7,969,172
Accrued liabilities 3,284,579
Unearned revenue 679,289
Customer deposits 4,219,567
Escrow liability 231,320
Liability for compensated absences 614,534
Total current liabilities 16,998,461
Current liabilities payable from restricted assets:
Current portion of long-term debt 4,055,334
Other 2,181,602
Total current liabilities payable from restricted assets 6,236,936
Total current liabilities 23,235,397
Noncurrent liabilities:
Bonds payable 54,969,926
Net pension liability 17,482,862
Net other post employment
benefit liability 2,804,718
Liability for compensated absences 3,649,371
Total noncurrent liabilities 78,906,877
Total liabilities 102,142,274
DEFERRED INFLOWS OF RESOURCES
Deferred inflows from pensions 848,680
Deferred inflows from other
postemployment benefits 2,093,507
Total deferred inflows 2,942,187
NET POSITION
Net investment in capital assets 377,284,205
Restricted for:
Debt service 5,054,830
Unrestricted 87,860,404
Total net position 470,199,439$
Enterprise Funds
Statement of Net Position
22

Plano’s Performance
Enterprise funds had combined net income of $16.1 million and contributions from developers of $6.1 million offset by net transfers out of $12.2 million. Compared to prior year, a decrease in operating revenues of $1.8 million was primarily attributed to less water consumption as the result of more rainfall in the current year offset by revenue increases in sustainability and environmental services miscellaneous charges. Operating expenses increased by $8.9 million primarily due to increases in contractual services, including water supply and waste water treatment.
23

Organization Chart
24
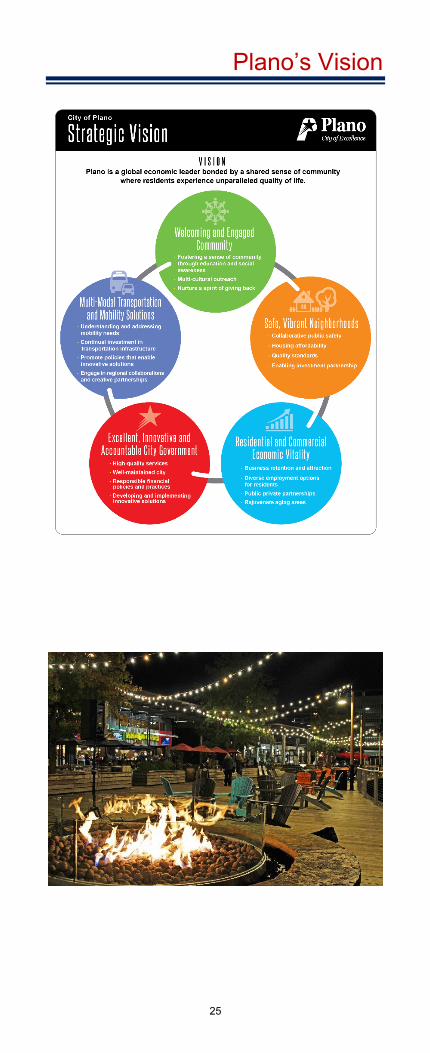
Plano’s Vision
25

Plano’s Personnel
Administrative Offices
Main Number 972-941-7000
City Manager 972-941-7121
City Secretary 972-941-7120
Accounting 972-941-5221
Animal Services 972-769-4360
Budget/Research 972-941-7194
Building Inspections (Main Office) 972-941-7140
Customer/Utility Services (Main Office) 972-941-7105
Davis Library 972-208-8000
Economic Development 972-208-8300
Emergency Management 972-769-4824
Engineering 972-941-7152
Environmental Waste Services 972-769-4150
Finance 972-941-7135
Fire 972-941-7159
Governmental Relations 972-941-5113
Haggard Library 972-769-4250
Harrington Library 972-941-7175
Health 972-941-7143
Human Resources 972-941-7115
Legal 972-941-7545
Library Administration 972-769-4208
Communications & Media Relations 972-941-7131
Municipal Court 972-941-2199
Municipal Reference Library 972-769-4428
Neighborhood Services 972-208-8510
Park Planning 972-941-7235
Parks & Recreation Administration 972-941-7255
Parks & Recreation (Main Number) 972-941-7250
Parr Library 972-769-4300
Planning 972-941-7151
Plano Event Center 972-941-5840
Plano Television Network 972-941-7131
Police (Non-Emergency) 972-424-5678
Procurement & Project Management 972-941-7557
Property Standards 972-208-8150
Public Safety Communications 972-941-7930
Public Works 972-769-4140
Records Management 972-941-5196
Risk Management 972-941-5660
Schimelpfenig Library 972-769-4200
Senior Recreation Center 972-941-7155
Treasury 972-941-7312
Utility Operations 972-769-4160
Visit Plano 800-81-PLANO
Volunteer Resource Group 972-941-7114
Websites
www.Plano.gov
www.VisitPlano.com
www.PlanoTexas.org
26