popular annual financial report - san jac college popular-annual-financial... · information...
TRANSCRIPT

Popular Annual Financial Report(Fiscal Year Ending August 31, 2013)Pasadena, Texas

26
20
13 R
ep
ort
to
th
e C
om
mu
nit
ypopular annual financial report
recognition
Government Finance Officers Association AwardThe Government Finance Officers Association of the United States and Canada (GFOA) has given an Award for Outstanding Achievement in Popular Annual Financial Reporting to San Jacinto Community College District for its Popular Annual Financial Report for the fiscal year ended August 31, 2012. The Award for Outstanding Achievement in Popular Annual Financial Reporting is a prestigious national award recognizing conformance with the highest standards for preparation of state and local government popular reports.
In order to receive an Award for Outstanding Achievement in Popular Annual Financial Reporting, a government unit must publish a Popular Annual Financial Report, whose contents conform to program standards of creativity, presentation, understandability, and reader appeal.
An Award for Outstanding Achievement in Popular Annual Financial Reporting is valid for a period of one year only. San Jacinto Community College District has received this prestigious award for the last three consecutive years. We believe our current report continues to conform to the Popular Annual Financial Reporting requirements, and we are submitting it to GFOA.
Note: The College’s PAFR and CAFR are available at the College’s website at www.sanjac.edu/annual-financial-reports.

27
20
13 R
ep
ort
to
th
e C
om
mu
nit
y
popular annual financial report
Financial ReviewThe following is an overview of the College’s financial operations for the fiscal year ended August 31, 2013 (FY 2013). Most of the information contained within this Popular Annual Financial Report (PAFR) is extracted from the financial information contained within the FY 2013 Comprehensive Annual Financial Report (CAFR). The CAFR is a more detailed and complete financial presentation prepared in conformance with Generally Accepted Accounting Principles (GAAP) and was audited by the College’s independent auditors, receiving an unmodified opinion. An unmodified opinion is given when an auditor can state that the financial statements are accurately and fairly presented. While the financial data in this PAFR conforms to GAAP, the statistical, economic, and demographic data is taken from various sources and is unaudited. The College’s CAFR is available on the College’s website at www.sanjac.edu/annual-financial-reports.
Financial Highlights: Assets, Liabilities and Net PositionThe College’s financial position in FY 2013 continues to remain strong with total assets of $572 million, total liabilities of $355 million, and total net position of $216 million. The following is prepared from the College’s Statement of Net Position and provides a summary of its assets, liabilities, and net position for the years ended August 31:
august 31
(in thousands)
2013 2012 2011
Current Assets1 $ 103,610 $ 119,522 $ 76,660
Noncurrent Assets 2
Capital Assets, Net of Depreciation 361,794 326,940 236,471
Other 106,659 129,653 266,704
Total Assets 3 572,063 576,115 579,835
Current Liabilities4 55,891 54,059 57,051
Noncurrent Liabilities5 299,541 309,704 318,602
Total Liabilities6 355,432 363,763 375,653
Net Position
Invested in Capital Assets, Net of Related Debt7 135,105 130,942 121,440
Expendable – Restricted8 5,251 3,197 4,199
Unrestricted9 76,275 78,213 78,543
total net position10 $ 216,631 $ 212,352 $ 204,182
1 current assets: The value of all assets that are reasonably expected to be converted into cash within one year in the normal course of business.
2 noncurrent assets: An asset which is not easily converted to cash or not expected to become cash within the next year.
3 total assets: The sum of all cash, investments, equipment, receivables, intangibles, and any other items of value owned by the College.
4 current liabilities: The sum of all money owed by the institution and due within one year.
5 noncurrent liabilities: The sum of all money owed by the institution not due to be paid within the next year.
6 total liabilities: The sum of the College’s long-term debt, current liabilities, and irregular or miscellaneous expenses.
7 invested in capital assets, net of related debt: The difference between assets, deferred outflows, deferred inflows and liabilities that consist of capital assets.
8 expendable - restricted: Resources that are constrained for a particular purpose.
9 unrestricted: Resources considered usable for any purpose.
10 total net position: The excess value of the College’s total assets less its total liabilities.

28
20
13 R
ep
ort
to
th
e C
om
mu
nit
ypopular annual financial report
assetsTotal assets decreased $4.1 million during 2013, a 0.07% decrease. Capital assets11 increased by $34.9 million related to the on-going construction projects.
The College’s current ratio12 decreased to 1.85 in 2013 from 2.21 in 2012 due to longer term investments carried in FY 2013.
liabilitiesTotal liabilities decreased by $8.3 million in 2013, a 2.3% decrease. This is primarily due to a decrease in bonds payable of $10.96 million.
net positionTotal net position increased by $4.3 million during 2013, a 2.0% increase.
Assets, Liabilities, and Net Position(in millions)
2013 2012 2011
$100
$200
$300
$400
$500
$600
$700
Total Assets
Total Liabilities
Total Net Assets
11 capital assets: An asset that has an expected life of more than two years, a cost of $5,000 or more, and that is not bought and sold in the usual course of
business. Land, buildings, and equipment are examples of capital assets.
12 current ratio: A measure of the College’s ability to meet its short-term obligations. The current ratio is calculated by dividing current assets by current liabilities.

29
20
13 R
ep
ort
to
th
e C
om
mu
nit
y
popular annual financial report
The following is a summary prepared from the College’s Statement of Revenues, Expenses, and Changes in Net Position for years ended August 31:
(in thousands)
operating revenues13 2013 2012 2011
Student Tuition and Fees, Net of Allowances, and Discounts $ 37,525 $ 32,746 $ 34,233
Federal Grants and Contracts 7,366 8,322 7,913
State Grants and Contracts 2,932 4,824 4,495
Non-Government Grants and Contracts 1,817 1,260 1,470
Sales and Services of Educational and Non-Educational Activities 1,322 1,510 1,124
Auxiliary Enterprises, Net of Discounts 3,872 3,895 3,923
General Operating Revenues 2 1 2
total operating revenues 54,836 52,558 53,160
operating expenses14
Instruction 70,339 64,118 68,296
Public Service 5,208 4,343 3,702
Academic Support 13,772 12,750 12,620
Student Services 13,740 12,453 13,471
Institutional Support 34,962 33,560 31,638
Operation and Maintenance Of Plant 17,298 17,168 15,487
Scholarships and Fellowships 40,616 45,304 42,060
Auxiliary Enterprises 4,012 3,980 4,125
Depreciation 13,107 9,627 7,798
total operating expenses 213,054 203,303 199,197
operating loss (158,218) (150,745) (146,037)
non-operating revenues(expenses)15
State Appropriations 45,888 42,513 47,123
Maintenance Ad Valorem Taxes 48,245 43,476 43,432
Debt Service Ad Valorem Taxes 25,381 25,173 21,374
Federal Revenue, Non-Operating 51,797 56,053 51,385
Investment Income (Net of Investment Expenses) 369 942 1,100
Interest on Capital Related Debt (9,183) (9,135) (12,144)
Other Non-Operating Revenues (Expenses) - (107) (355)
total non-operating revenues, net 162,497 158,915 151,915
increase in net position 4,279 8,170 5,878
net position, beginning of Year 212,352 204,182 198,304
net position, end of Year 216,631 $ 212,352 $ 204,182
13 operating revenues: The results of exchange transactions with those who purchase, use, or directly benefit from the goods or services of the College.
14 operating expenses: An expense incurred in carrying out an organization’s day-to-day activities.
15 non - operating revenue/expenses: Non-operating revenues are derived from non-exchange transactions or those that are not reported as operating activities.
Non-operating revenues consist of the following categories: state appropriations, taxes levied by the college, investment income not restricted to a specific
program, and other non-operating, non-capital revenues. Federal grant revenues related to the Federal Title IV programs are considered non-operating revenue.
Non-Operating expense is primarily the interest expense related to capital debt.

30
20
13 R
ep
ort
to
th
e C
om
mu
nit
ypopular annual financial report
Where Does the Money Come From? Community colleges in Texas have three primary sources of revenue – tuition and fees, state appropriations, and ad valorem taxes.
Fiscal Year 2013 Compared to 2012• Tuition and fee revenue (before the allowance for
scholarships and discounts) increased by $8.1 million in 2013 to $59.5 million from $51.4 million in 2012. This increase is the result of consistent enrollment and increases in semester credit hour tuition rates and general service fee. Tuition and fee amounts include academic contract training and workforce development instructional activities.
• State appropriations are based on enrollment measured by contact hours. Contact hours were stable for 2013 and 2012 at 11.9 million and 12.3 million, respectively. The State appropriation per contact hour increased to $3.10 for 2013 from $2.94 in 2012.
• Total ad valorem tax revenue increased by $5.0 million to $73.6 million in 2013 from $68.6 million in 2012 due to increases in taxable assessed valuations. The College’s tax rate for maintenance and operations per $100 valuation increased to 12.1571 cents for 2012 from 11.8688. The debt service tax rate decreased to 6.4031 cents in 2013 from 6.6914 cents to offset the decrease in debt service payment requirements. The College’s total tax rate remained consistent at 18.5602 per $100 valuation.
Sources of Funds for Fiscal Years 2013 and 2012 (in thousands)
Auxilary Enterprises, Net of Discounts
Sales and Services of Educational and Non-Educational Activities
Non-Governmental Grants and Contracts
Federal Grants and Contracts
Student Tuition and Fees, Net of Scholarship, Allowances, and Discounts
General Operating Revenues
State Appropriations
Maintenance Ad Valorem Taxes
Debt Service Ad Valorem Taxes
Federal Revenue, Non-Operating
Investment Income (Net of Investment Expenses)
2013
2012
State Grants and Contracts
10,000 20,000 30,000 40,000 50,000 60,000
Sources of Revenue (in thousands)
Tuition and Fees $37,525 / 17%
State Appropriations $45,888 / 20%
Maintenance Ad Valorem Taxes $48,245 / 21%
Debt Service Ad Valorem $25,381 / 11%
Federal Revenue, Non-operating $51,797 / 23%
Federal, State, and Local Grants - Operating $12,115 / 5%
Other $5,565 / 3%

31
20
13 R
ep
ort
to
th
e C
om
mu
nit
y
What is the Money Used For?Expenses represent the cost of personnel, goods, and services used or acquired by the College in providing its service to the public. Expenses are classified and reported by functional category.
Fiscal Year 2013 Compared to 2012• Scholarships and Fellowships decreased by $4.7
million, attributable primarily to decreases in payments to Federal Title IV recipients for direct loans and grant programs.
• Auxiliary enterprises remained relatively unchanged at $4 million, and depreciation increased by $3.5 million due to new buildings that were placed in service in 2013.
• Interest on capital related debt remained unchanged at $9.1 million.
• Operating expenses increased by $9.7 million largely due to paying an increased share of state benefits, merit pay adjustments, technology investments, and contractual obligations.
Uses of funds for Fiscal Years 2013 and 2012 (in thousands)
Institutional Support
Student Services
Academic Support
Instruction
Operation and Maintenance of Plant
Scholarships and Fellowships
Auxiliary Enterprises
Depreciation
Interest on Capital Related Debt
Other Non-Operational Expenses
2013
2012
Public Service
20,000 40,000 60,000 80,000
Expenses by Functional Classification
(in thousands)
Instruction $70,339 / 32%
Public Service $5,208 / 2%
Academic Support $13,772 / 6%
Student Services $13,740 / 6%
Institutional Support $34,962 / 16%
Operation and Maintenance of Plant $17,298 / 8%
Scholarships and Fellowships $40,616 / 18%
Auxiliary Enterprises $4,012 / 2%
Depreciation $13,107 / 6%
Non-Operating $9,183 / 4%
popular annual financial report
32
20
13 R
ep
ort
to
th
e C
om
mu
nit
y
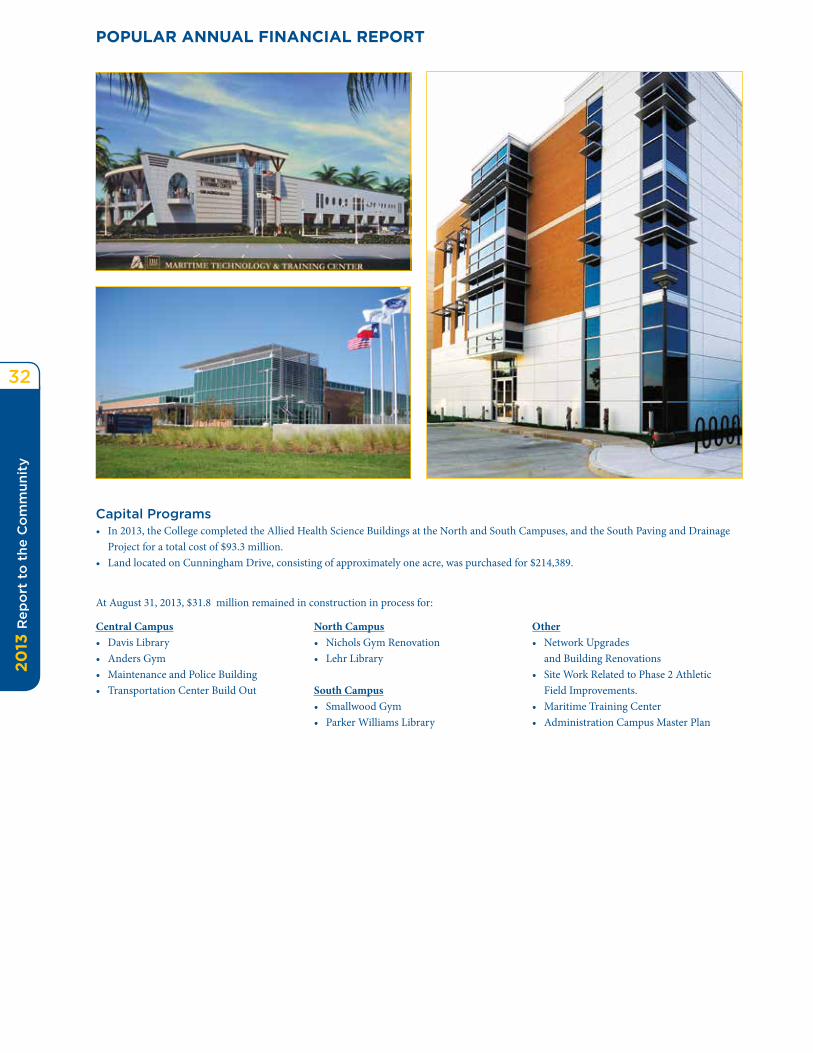
Capital Programs• In 2013, the College completed the Allied Health Science Buildings at the North and South Campuses, and the South Paving and Drainage
Project for a total cost of $93.3 million. • Land located on Cunningham Drive, consisting of approximately one acre, was purchased for $214,389.
At August 31, 2013, $31.8 million remained in construction in process for:
Central Campus• Davis Library• Anders Gym• Maintenance and Police Building• Transportation Center Build Out
North Campus• Nichols Gym Renovation• Lehr Library
South Campus• Smallwood Gym• Parker Williams Library
Other• Network Upgrades
and Building Renovations• Site Work Related to Phase 2 Athletic
Field Improvements. • Maritime Training Center• Administration Campus Master Plan
popular annual financial report

San Jac is the beginning of a new future for me. It’s the
base building block for the rest of my educating career
for becoming a Medical Laboratory Technician and a
Marine Biologist. I am extremely grateful for San Jac.
- Lisa Paggeot, student

An equal opportunity institution