polynomial functions day 1 and 2
DESCRIPTION
Polynomial Functions Day 1 and 2. Polynomial Functions. Do now: Find the Range of yesterday’s exit ticket problem!. Exit Ticket: Start homework: Do not lose handout-hmwk #5. Objectives: Given a polynomial (many number) function, determine from the graph what degree is - PowerPoint PPT PresentationTRANSCRIPT

Polynomial FunctionsDay 1 and 2

Polynomial Functions
• Do now: Find the
Range of yesterday’s exit ticket problem!
• Exit Ticket: Start homework:
• Do not lose handout-
hmwk #5
• Objectives: Given a polynomial (many number) function, determine from the graph what degree is
• Find the “zeros” from the graph or the equation, in order to recognize equations of same degree

Polynomial Functions (day 2)
• Do now: Write the
TWO fundamental Rules of Algebra you (memorized?!)
• learned from yesterday’s powerpoint….!
• Exit Ticket:
• Sketch an exponential GROWTH function
• Objectives: Given a polynomial (many number) function, determine from the graph what degree is
• Find the “zeros” from the graph or the equation, in order to recognize equations of same degree

Just a few definitions Polynomial function
a function with one or more terms
Ex) 2x5 – 5x3 – 10x + 9, because it has 4 terms.Ex) 7x4 + 6x2 + x has 3 terms
Degree the highest exponent power that is in a term
Ex) 5 x3 has a degree of “3”Ex) 10x6 has a degree of “6”
Highest Degree Highest degree that is in a polynomial. When you are asked for the degree of a polynomial, you are being asked for the highest degree.
Ex) 2x5 – 5x3 – 10x + 9 has a highest degree of 5Ex) 7x4 + 6x2 + x has a highest degree of 4
Polynomial Functions
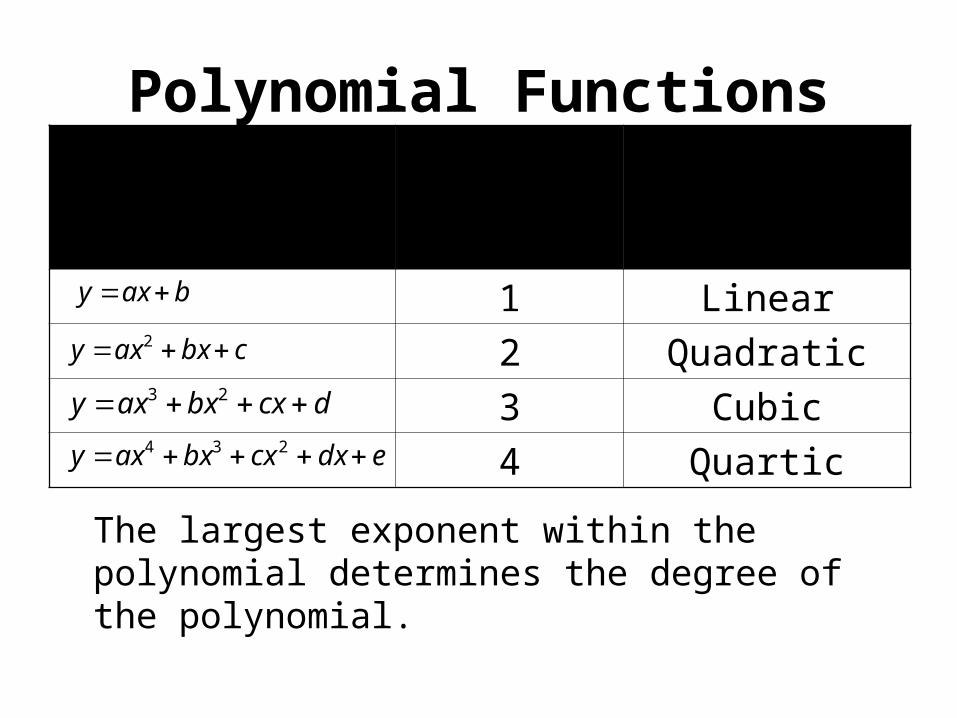
The largest exponent within the polynomial determines the degree of the polynomial.
Polynomial Function in
General Form
Degree Name of Function
1 Linear
2 Quadratic
3 Cubic
4 Quarticedxcxbxaxy 234
dcxbxaxy 23
cbxaxy 2
baxy
Fundamental Theorem of Algebra:
• Degree of the polynomial is the same as the number of “ups” and “downs” of its graph…
• Try the examples in notes.

Leading Coefficient
The leading coefficient is the coefficient of the first term in a polynomial when the terms are written in descending order by degrees.
For example, the cubic function f(x) = -2x3 + x2 – 5x – 10 has a leading
coefficient of -2. This will play an important role in it’s graph…

2nd Fundamental Theorem of Algebra:
The number of zeros that a polynomial function has is equal to that function’s degree.

Explore Polynomials
Linear Function
Quadratic Function
Cubic Function
Quartic Function
-10 -8 -6 -4 -2 2 4 6 8 10
-10
-8
-6
-4
-2
2
4
6
8
10
-10 -8 -6 -4 -2 2 4 6 8 10
-10
-8
-6
-4
-2
2
4
6
8
10
-10 -8 -6 -4 -2 2 4 6 8 10
-10
-8
-6
-4
-2
2
4
6
8
10
-5 -4 -3 -2 -1 1 2 3 4 5 6 7 8 9 10
-60-55-50-45-40-35-30-25-20-15-10-5
510

Cubic PolynomialsLet’s look at the two graphs and let’s discuss the questions below.
1. How can you check to see if both graphs are functions?
3. What is the end behaviour for each graph?
4. Which graph do you think has a positive leading coeffient? Why?
5. Which graph do you think has a negative leading coefficient? Why?
2. How many x-intercepts do graphs A & B have?
Graph B
Graph A
-10 -8 -6 -4 -2 2 4 6 8 10
-10
-8
-6
-4
-2
2
4
6
8
10
-10 -8 -6 -4 -2 2 4 6 8 10
-10
-8
-6
-4
-2
2
4
6
8
10

Cubic PolynomialsEquationEquation
Factored form & Factored form & Standard formStandard form
X-InterceptsX-Intercepts Sign of Sign of Leading Leading
CoefficientCoefficient
End End BehaviourBehaviour
Domain and RangeDomain and Range
Factoredy=(x+1)(x+4)(x-2)
Standardy=x3+3x2-6x-8
-4, -1, 2 Positive
As x, y and
x-,
y-
Domain
{x| x Є R}
Range
{y| y Є R}
Factoredy=-(x+1)(x+4)(x-2)
Standardy=-x3-3x2+6x+8
-4, -1, 2 Negative
As x, y- and
x-, y
Domain
{x| x Є R}
Range
{y| y Є R}
The following chart shows the properties of the graphs on the left.
-5 -4 -3 -2 -1 1 2 3 4 5
-12
-10
-8
-6
-4
-2
2
4
6
8
10
12
-5 -4 -3 -2 -1 1 2 3 4 5
-12
-10
-8
-6
-4
-2
2
4
6
8
10
12

Cubic PolynomialsEquationEquation
Factored form & Factored form & Standard formStandard form
X-InterceptsX-Intercepts Sign of Sign of Leading Leading
CoefficientCoefficient
End End BehaviourBehaviour
Domain and RangeDomain and Range
Factoredy=(x+3)2(x-1)
Standardy=x3+5x2+3x-9
-3, 1 Positive
As x, y and
x-,
y-
Domain
{x| x Є R}
Range
{y| y Є R}
Factoredy=-(x+3)2(x-1)
Standardy=-x3-5x2-3x+9
-3, 1 Negative
As x, y- and
x-, y
Domain
{x| x Є R}
Range
{y| y Є R}
The following chart shows the properties of the graphs on the left.
-5 -4 -3 -2 -1 1 2 3 4 5
-12
-10
-8
-6
-4
-2
2
4
6
8
10
12
-5 -4 -3 -2 -1 1 2 3 4 5
-12
-10
-8
-6
-4
-2
2
4
6
8
10
12

Cubic PolynomialsEquationEquation
Factored form & Factored form & Standard formStandard form
X-InterceptsX-Intercepts Sign of Sign of Leading Leading
CoefficientCoefficient
End End BehaviourBehaviour
Domain and RangeDomain and Range
Factoredy=(x-2)3
Standardy=x3-6x2+12x-8
2 Positive
As x, y and
x-, y-
Domain
{x| x Є R}
Range
{y| y Є R}
Factoredy=-(x-2)3
Standardy=-x3+6x2-12x+8
2 Negative
As x, y- and
x-, y
Domain
{x| x Є R}
Range
{y| y Є R}
The following chart shows the properties of the graphs on the left.
-5 -4 -3 -2 -1 1 2 3 4 5
-12
-10
-8
-6
-4
-2
2
4
6
8
10
12
-5 -4 -3 -2 -1 1 2 3 4 5
-12
-10
-8
-6
-4
-2
2
4
6
8
10
12

Quartic PolynomialsLook at the two graphs and discuss the questions given below.
1. How can you check to see if both graphs are functions?
3. What is the end behaviour for each graph?
4. Which graph do you think has a positive leading coeffient? Why?
5. Which graph do you think has a negative leading coefficient? Why?
2. How many x-intercepts do graphs A & B have?
Graph BGraph A
-5 -4 -3 -2 -1 1 2 3 4 5
-14
-12
-10
-8
-6
-4
-2
2
4
6
8
10
-5 -4 -3 -2 -1 1 2 3 4 5
-10
-8
-6
-4
-2
2
4
6
8
10
12
14

Quartic Polynomials
EquationEquation
Factored form & Standard Factored form & Standard formform
X-X-InterceptsIntercepts
Sign of Sign of Leading Leading
CoefficientCoefficient
End End BehaviourBehaviour
Domain and RangeDomain and Range
Factoredy=(x-3)(x-1)(x+1)(x+2)
Standardy=x4-x3-7x2+x+6
-2,-1,1,3 Positive
As x, y and
x-, y
Domain
{x| x Є R}
Range
{y| y Є R,
y ≥ -12.95}
Factoredy=-(x-3)(x-1)(x+1)(x+2)
Standardy=-x4+x3+7x2-x-6
-2,-1,1,3 Negative
As x, y- and
x-, y-
Domain
{x| x Є R}
Range
{y| y Є R,
y ≤ 12.95}
The following chart shows the properties of the graphs on the left.
-10 -8 -6 -4 -2 2 4 6 8 10
-10
-8
-6
-4
-2
2
4
6
8
10
12
14
-10 -8 -6 -4 -2 2 4 6 8 10
-14
-12
-10
-8
-6
-4
-2
2
4
6
8
10

Quartic Polynomials
EquationEquation
Factored form & Standard Factored form & Standard formform
X-X-InterceptsIntercepts
Sign of Sign of Leading Leading
CoefficientCoefficient
End End BehaviourBehaviour
Domain and RangeDomain and Range
Factoredy=(x-4)2(x-1)(x+1)
Standardy=x4-8x3+15x2+8x-16
-1,1,4 Positive
As x, y and
x-, y
Domain
{x| x Є R}
Range
{y| y Є R,
y ≥ -16.95}
Factoredy=-(x-4)2(x-1)(x+1)
Standardy=-x4+8x3-15x2-8x+16
-1,1,4 Negative
As x, y- and
x-, y-
Domain
{x| x Є R}
Range
{y| y Є R,
y ≤ 16.95}
The following chart shows the properties of the graphs on the left.
-5 -4 -3 -2 -1 1 2 3 4 5
-15
-12
-9
-6
-3
3
6
9
12
15
18
-5 -4 -3 -2 -1 1 2 3 4 5
-18
-15
-12
-9
-6
-3
3
6
9
12
15

Quartic Polynomials
EquationEquation
Factored form & Standard Factored form & Standard formform
X-X-InterceptsIntercepts
Sign of Sign of Leading Leading
CoefficientCoefficient
End End BehaviourBehaviour
Domain and RangeDomain and Range
Factoredy=(x+2)3(x-1)
Standardy=x4+5x3+6x2-4x-8
-2,1 Positive
As x, y and
x-, y
Domain
{x| x Є R}
Range
{y| y Є R,
y ≥ -8.54}
Factoredy=-(x+2)3(x-1)
Standardy=-x4-5x3-6x2+4x+8
-2,1 Negative
As x, y- and
x-, y-
Domain
{x| x Є R}
Range
{y| y Є R,
y ≤ 8.54}
The following chart shows the properties of the graphs on the left.
-5 -4 -3 -2 -1 1 2 3 4 5
-10
-8
-6
-4
-2
2
4
6
8
10
-5 -4 -3 -2 -1 1 2 3 4 5
-10
-8
-6
-4
-2
2
4
6
8
10

Quartic Polynomials
EquationEquation
Factored form & Standard Factored form & Standard formform
X-X-InterceptsIntercepts
Sign of Sign of Leading Leading
CoefficientCoefficient
End End BehaviourBehaviour
Domain and RangeDomain and Range
Factoredy=(x-3)4
Standardy=x4-12x3+54x2-108x+81
3 Positive
As x, y and
x-, y
Domain
{x| x Є R}
Range
{y| y Є R,
y ≥ 0}
Factoredy=-(x-3)4
Standardy=-x4+12x3-54x2+108x-81
3 Negative
As x, y- and
x-, y-
Domain
{x| x Є R}
Range
{y| y Є R,
y ≤ 0}
The following chart shows the properties of the graphs on the left.
-5 -4 -3 -2 -1 1 2 3 4 5
-10
-8
-6
-4
-2
2
4
6
8
10
-5 -4 -3 -2 -1 1 2 3 4 5
-10
-8
-6
-4
-2
2
4
6
8
10
Polynomial Functions
• Did we accomplish our objectives?
• Any Questions?
• Objectives: Given a polynomial (many number) function, determine from the graph what degree is
• Find the “zeros” from the graph or the equation, in order to recognize equations of same degree