polynomial and rational functions · polynomial and 2 rational functions 2.1 quadratic functions...
TRANSCRIPT

2Polynomial andRational Functions
2.1 Quadratic Functions and Models
2.2 Polynomial Functions of Higher Degree
2.3 Polynomial and Synthetic Division
2.4 Complex Numbers
2.5 Zeros of Polynomial Functions
2.6 Rational Functions
2.7 Nonlinear Inequalities
In Mathematics
Functions defined by polynomial expressions
are called polynomial functions, and
functions defined by rational expressions
are called rational functions.
In Real Life
Polynomial and rational functions are
often used to model real-life phenomena.
For instance, you can model the per capita
cigarette consumption in the United States
with a polynomial function. You can use
the model to determine whether the
addition of cigarette warnings affected
consumption. (See Exercise 85, page 134.)
IN CAREERS
There are many careers that use polynomial and rational functions. Several are listed below.
Mic
hael
New
man
/Pho
toEd
it
• Architect Exercise 82, page 134
• ForesterExercise 103, page 148
• ChemistExample 80, page 192
• Safety EngineerExercise 78, page 203
125

The Graph of a Quadratic Function
In this and the next section, you will study the graphs of polynomial functions. InSection 1.6, you were introduced to the following basic functions.
Linear function
Constant function
Squaring function
These functions are examples of polynomial functions.
Polynomial functions are classified by degree. For instance, a constant functionwith has degree 0, and a linear function with has
degree 1. In this section, you will study second-degree polynomial functions, which arecalled quadratic functions.
For instance, each of the following functions is a quadratic function.
Note that the squaring function is a simple quadratic function that has degree 2.
The graph of a quadratic function is a special type of “U”-shaped curve called aparabola. Parabolas occur in many real-life applications—especially those involvingreflective properties of satellite dishes and flashlight reflectors. You will study theseproperties in Section 10.2.
m�x� � �x � 2��x � 1�
k�x� � �3x2 � 4
h�x� � 9 �14 x2
g�x� � 2�x � 1�2 � 3
f �x� � x2 � 6x � 2
a � 0f�x� � ax � bc � 0f�x� � c
f �x� � x2
f �x� � c
f �x� � ax � b
126 Chapter 2 Polynomial and Rational Functions
2.1 QUADRATIC FUNCTIONS AND MODELS
What you should learn
• Analyze graphs of quadratic functions.
• Write quadratic functions in standard form and use the results to sketch graphs of functions.
• Find minimum and maximum values of quadratic functions in real-life applications.
Why you should learn it
Quadratic functions can be used tomodel data to analyze consumerbehavior. For instance, in Exercise 79on page 134, you will use a quadraticfunction to model the revenue earnedfrom manufacturing handheld videogames.
Definition of Polynomial Function
Let be a nonnegative integer and let be real numberswith The function given by
is called a polynomial function of x with degree n.
f �x� � anxn � an�1xn�1 � . . . � a2x2 � a1x � a0
an � 0.an�1, . . . , a2, a1, a0an,n
Definition of Quadratic Function
Let and be real numbers with The function given by
Quadratic function
is called a quadratic function.
f �x� � ax2 � bx � c
a � 0.ca, b,
© J
ohn
Henl
ey/C
orbi
s
Section 2.1 Quadratic Functions and Models 127
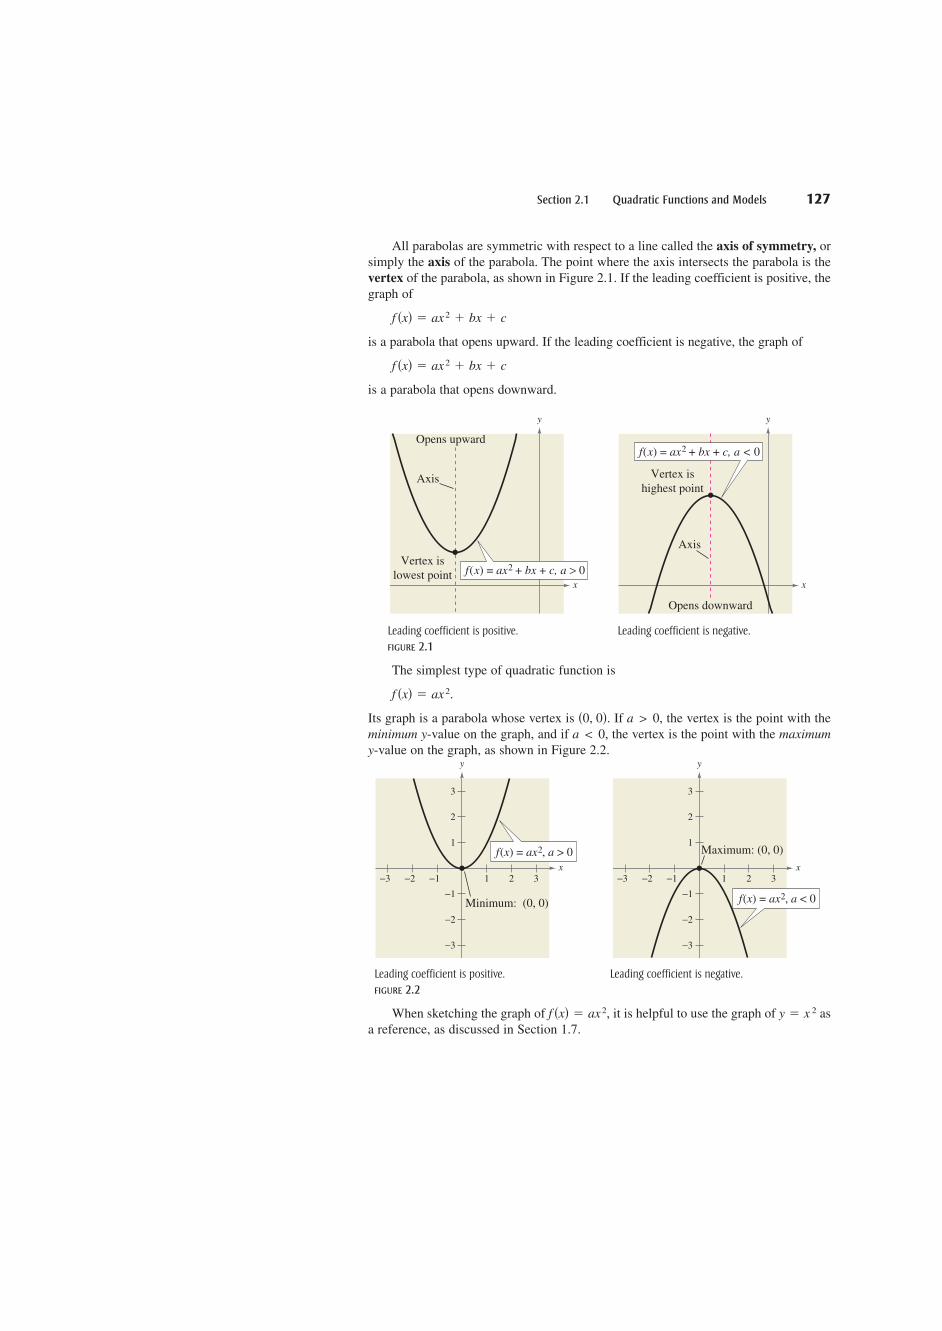
All parabolas are symmetric with respect to a line called the axis of symmetry, orsimply the axis of the parabola. The point where the axis intersects the parabola is thevertex of the parabola, as shown in Figure 2.1. If the leading coefficient is positive, thegraph of
is a parabola that opens upward. If the leading coefficient is negative, the graph of
is a parabola that opens downward.
Leading coefficient is positive. Leading coefficient is negative.
FIGURE 2.1
The simplest type of quadratic function is
Its graph is a parabola whose vertex is If the vertex is the point with theminimum -value on the graph, and if the vertex is the point with the maximum-value on the graph, as shown in Figure 2.2.
Leading coefficient is positive. Leading coefficient is negative.
FIGURE 2.2
When sketching the graph of it is helpful to use the graph of asa reference, as discussed in Section 1.7.
y � x 2f �x� � ax2,
x
f x ax a( ) = , < 02
Maximum: (0, 0)
−3 −2 −1 1 2 3
−3
−2
−1
1
2
3
y
x
f x ax a( ) = , > 02
Minimum: (0, 0)
−3 −2 −1 1 2 3
−3
−2
−1
1
2
3
yy
a < 0,ya > 0,�0, 0�.
f �x� � ax2.
x
Opens downward
Vertex ishighest point
Axis
f x ax bx c, a <( ) = + + 02
y
Opens upward
Vertex islowest point
Axis
x
f x ax bx c, a( ) = + + 02 >
y
f �x� � ax2 � bx � c
f �x� � ax2 � bx � c

Sketching Graphs of Quadratic Functions
a. Compare the graphs of and
b. Compare the graphs of and
Solution
a. Compared with each output of “shrinks” by a factor of creatingthe broader parabola shown in Figure 2.3.
b. Compared with each output of “stretches” by a factor of 2,creating the narrower parabola shown in Figure 2.4.
FIGURE 2.3 FIGURE 2.4
Now try Exercise 13.
In Example 1, note that the coefficient determines how widely the parabola givenby opens. If is small, the parabola opens more widely than if is large.
Recall from Section 1.7 that the graphs of and are rigid transformations of the graph of For instance, inFigure 2.5, notice how the graph of can be transformed to produce the graphs of
and
Reflection in x-axis followed by Left shift of two units followed by
an upward shift of one unit a downward shift of three units
FIGURE 2.5
x
y = x2
g(x) = (x + 2)2 − 3
−4 −3 −1 1 2
3
2
1
−2
−3(−2, −3)
y
x−2 2
−1
−2
2
y x= 2
(0, 1)
y
f(x) = −x2 + 1
g�x� � �x � 2�2 � 3.f �x� � �x2 � 1y � x2
y � f �x�.y � �f �x�y � f ��x�,y � f �x� ± c,y � f �x ± c�,�a��a�f �x� � ax2
a
x−2 −1 1 2
1
2
3
4
y x= 2
g x x( ) = 2 2y
x−2 −1 1 2
1
2
3
4
y x= 2
f x x( ) = 13
2
y
g�x� � 2x2y � x2,
13,f �x� �
13x2y � x2,
g�x� � 2x2.y � x2
f �x� �13x2.y � x2
Example 1
128 Chapter 2 Polynomial and Rational Functions
You can review the techniquesfor shifting, reflecting, andstretching graphs in Section 1.7.
Section 2.1 Quadratic Functions and Models 129
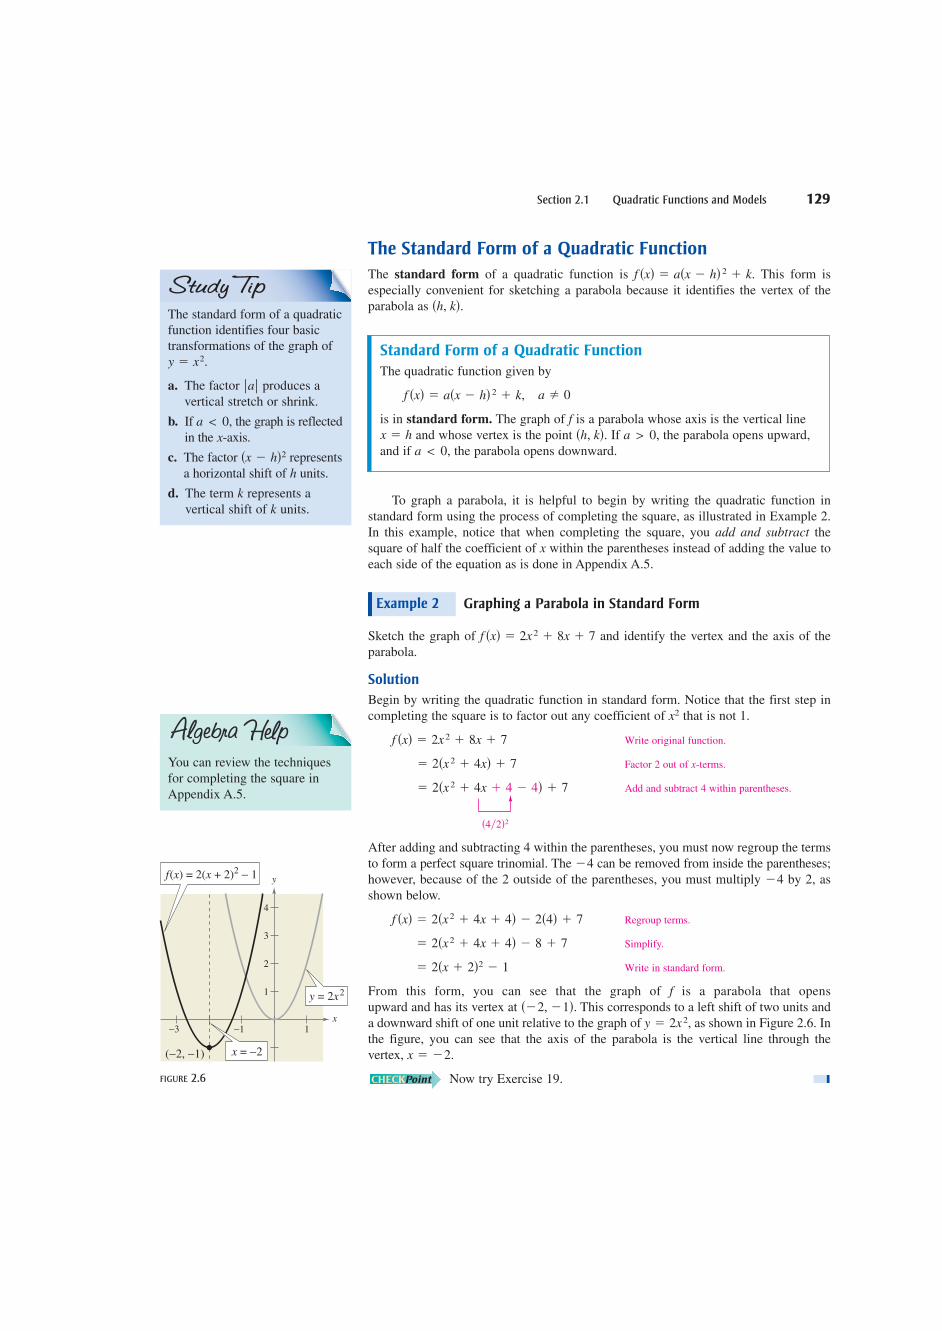
The Standard Form of a Quadratic Function
The standard form of a quadratic function is This form is especially convenient for sketching a parabola because it identifies the vertex of theparabola as
To graph a parabola, it is helpful to begin by writing the quadratic function in standard form using the process of completing the square, as illustrated in Example 2.In this example, notice that when completing the square, you add and subtract thesquare of half the coefficient of within the parentheses instead of adding the value toeach side of the equation as is done in Appendix A.5.
Graphing a Parabola in Standard Form
Sketch the graph of and identify the vertex and the axis of theparabola.
Solution
Begin by writing the quadratic function in standard form. Notice that the first step incompleting the square is to factor out any coefficient of that is not 1.
Write original function.
Factor 2 out of -terms.
Add and subtract 4 within parentheses.
After adding and subtracting 4 within the parentheses, you must now regroup the termsto form a perfect square trinomial. The can be removed from inside the parentheses;however, because of the 2 outside of the parentheses, you must multiply by 2, asshown below.
Regroup terms.
Simplify.
Write in standard form.
From this form, you can see that the graph of is a parabola that opensupward and has its vertex at This corresponds to a left shift of two units anda downward shift of one unit relative to the graph of as shown in Figure 2.6. Inthe figure, you can see that the axis of the parabola is the vertical line through the vertex,
Now try Exercise 19.
x � �2.
y � 2x2,��2, �1�.
f
� 2�x � 2�2 � 1
� 2�x2 � 4x � 4� � 8 � 7
f �x� � 2�x2 � 4x � 4� � 2�4� � 7
�4�4
�4�2�2
� 2�x2 � 4x � 4 � 4� � 7
x� 2�x2 � 4x� � 7
f �x� � 2x2 � 8x � 7
x2
f �x� � 2x2 � 8x � 7
Example 2
x
�h, k�.
f �x� � a�x � h�2 � k.
Standard Form of a Quadratic Function
The quadratic function given by
is in standard form. The graph of is a parabola whose axis is the vertical lineand whose vertex is the point If the parabola opens upward,
and if the parabola opens downward.a < 0,a > 0,�h, k�.x � h
f
a � 0f �x� � a�x � h�2 � k,
The standard form of a quadraticfunction identifies four basictransformations of the graph of
a. The factor produces avertical stretch or shrink.
b. If the graph is reflectedin the -axis.
c. The factor representsa horizontal shift of units.
d. The term represents avertical shift of units.k
k
h�x � h�2
xa < 0,
�a�y � x2.
x−3 −1 1
1
2
3
4
y x= 2 2
f x x( ) = 2( + 2) 12 −
( 2, 1)− − x = 2−
y
FIGURE 2.6
You can review the techniquesfor completing the square inAppendix A.5.

To find the -intercepts of the graph of you must solve theequation If does not factor, you can use theQuadratic Formula to find the -intercepts. Remember, however, that a parabola maynot have -intercepts.
Finding the Vertex and x-Intercepts of a Parabola
Sketch the graph of and identify the vertex and -intercepts.
Solution
Write original function.
Factor out of -terms.
Add and subtract 9 within parentheses.
Regroup terms.
Write in standard form.
From this form, you can see that is a parabola that opens downward with vertex The -intercepts of the graph are determined as follows.
Factor out
Factor.
Set 1st factor equal to 0.
Set 2nd factor equal to 0.
So, the -intercepts are and as shown in Figure 2.7.
Now try Exercise 25.
Writing the Equation of a Parabola
Write the standard form of the equation of the parabola whose vertex is and thatpasses through the point
Solution
Because the vertex of the parabola is at the equation has the form
Substitute for and in standard form.
Because the parabola passes through the point it follows that So,
Write in standard form.
Substitute 3 for and for
Simplify.
Subtract 2 from each side.
Divide each side by 4.
The equation in standard form is The graph of is shown inFigure 2.8.
Now try Exercise 47.
ff �x� � �2�x � 1�2 � 2.
�2 � a.
�8 � 4a
�6 � 4a � 2
f �x�.�6x�6 � a�3 � 1�2 � 2
f�x� � a�x � 1�2 � 2
f �3� � �6.�3, �6�,
khf �x� � a�x � 1�2 � 2.
�h, k� � �1, 2�,
�3, �6�.�1, 2�
Example 4
�4, 0�,�2, 0�x
x � 4x � 4 � 0
x � 2x � 2 � 0
��x � 2��x � 4� � 0
�1.��x2 � 6x � 8� � 0
x�3, 1�.f
� ��x � 3�2 � 1
� ��x2 � 6x � 9� � ��9� � 8
��6�2�2
� ��x2 � 6x � 9 � 9� � 8
x�1� ��x2 � 6x� � 8
f �x� � �x2 � 6x � 8
xf �x�� �x2 � 6x � 8
Example 3
xx
ax2 � bx � cax2 � bx � c � 0.f �x� � ax2 � bx � c,x
130 Chapter 2 Polynomial and Rational Functions
x−1 1 3 5
−3
−2
−4
−1
1
2(3, 1)
(2, 0) (4, 0)
y
f(x) = − (x − 3)2 + 1
y = −x2
FIGURE 2.7
(1, 2)
(3, −6)
−2−4 4 6
2
y = f(x)
x
y
FIGURE 2.8
You can review the techniquesfor using the Quadratic Formulain Appendix A.5.

Section 2.1 Quadratic Functions and Models 131
Finding Minimum and Maximum Values
Many applications involve finding the maximum or minimum value of a quadratic function. By completing the square of the quadratic function youcan rewrite the function in standard form (see Exercise 95).
Standard form
So, the vertex of the graph of is which implies the following.�� b2a
, f�� b2a��,f
f�x� � a�x �b
2a�2
� �c �b2
4a�
f�x� � ax2 � bx � c,
The Maximum Height of a Baseball
A baseball is hit at a point 3 feet above the ground at a velocity of 100 feet per secondand at an angle of with respect to the ground. The path of the baseball is given bythe function where is the height of the baseball (infeet) and is the horizontal distance from home plate (in feet). What is the maximumheight reached by the baseball?
xf �x�f �x� � �0.0032x2 � x � 3,
45�
Example 5
Algebraic Solution
For this quadratic function, you have
which implies that and Becausethe function has a maximum when
So, you can conclude that the baseball reaches its maximum height when it is feet from home plate,where is
At this distance, the maximum height is
Now try Exercise 75.
� 81.125 feet.
f�156.25� � �0.0032�156.25�2 � 156.25 � 3
� 156.25 feet.
� �1
2��0.0032�
x � �b
2a
xx
x � �b��2a�.a < 0,b � 1.a � �0.0032
� �0.0032x2 � x � 3
f�x� � ax2 � bx � c
Graphical Solution
Use a graphing utility to graph
so that you can see the important features of the parabola. Use the maximum feature (see Figure 2.9) or the zoom and trace features(see Figure 2.10) of the graphing utility to approximate the maximum height on the graph to be feet at
FIGURE 2.9 FIGURE 2.10
159.51152.2681
81.3
00 400
100y = −0.0032x2 + x + 3
x � 156.25.y � 81.125
y � �0.0032x2 � x � 3
Minimum and Maximum Values of Quadratic Functions
Consider the function with vertex
1. If has a minimum at The minimum value is
2. If has a maximum at The maximum value is f �� b2a�.x � �
b2a
.fa < 0,
f �� b2a�.x � �
b2a
.fa > 0,
�� b2a
, f �� b2a��.f �x� � ax2 � bx � c
132 Chapter 2 Polynomial and Rational Functions
EXERCISES See www.CalcChat.com for worked-out solutions to odd-numbered exercises.2.1VOCABULARY: Fill in the blanks.
1. Linear, constant, and squaring functions are examples of ________ functions.2. A polynomial function of degree and leading coefficient is a function of the form
where is a ________ ________ and are ________ numbers.
3. A ________ function is a second-degree polynomial function, and its graph is called a ________.
4. The graph of a quadratic function is symmetric about its ________.
5. If the graph of a quadratic function opens upward, then its leading coefficient is ________ and the vertex of the graph is a ________.
6. If the graph of a quadratic function opens downward, then its leading coefficient is ________ and the vertex of the graph is a ________.
SKILLS AND APPLICATIONS
a0a1,an�1, . . . ,an,n�an � 0�f �x� � anxn � an�1xn�1 � . . . � a1x � a0
ann
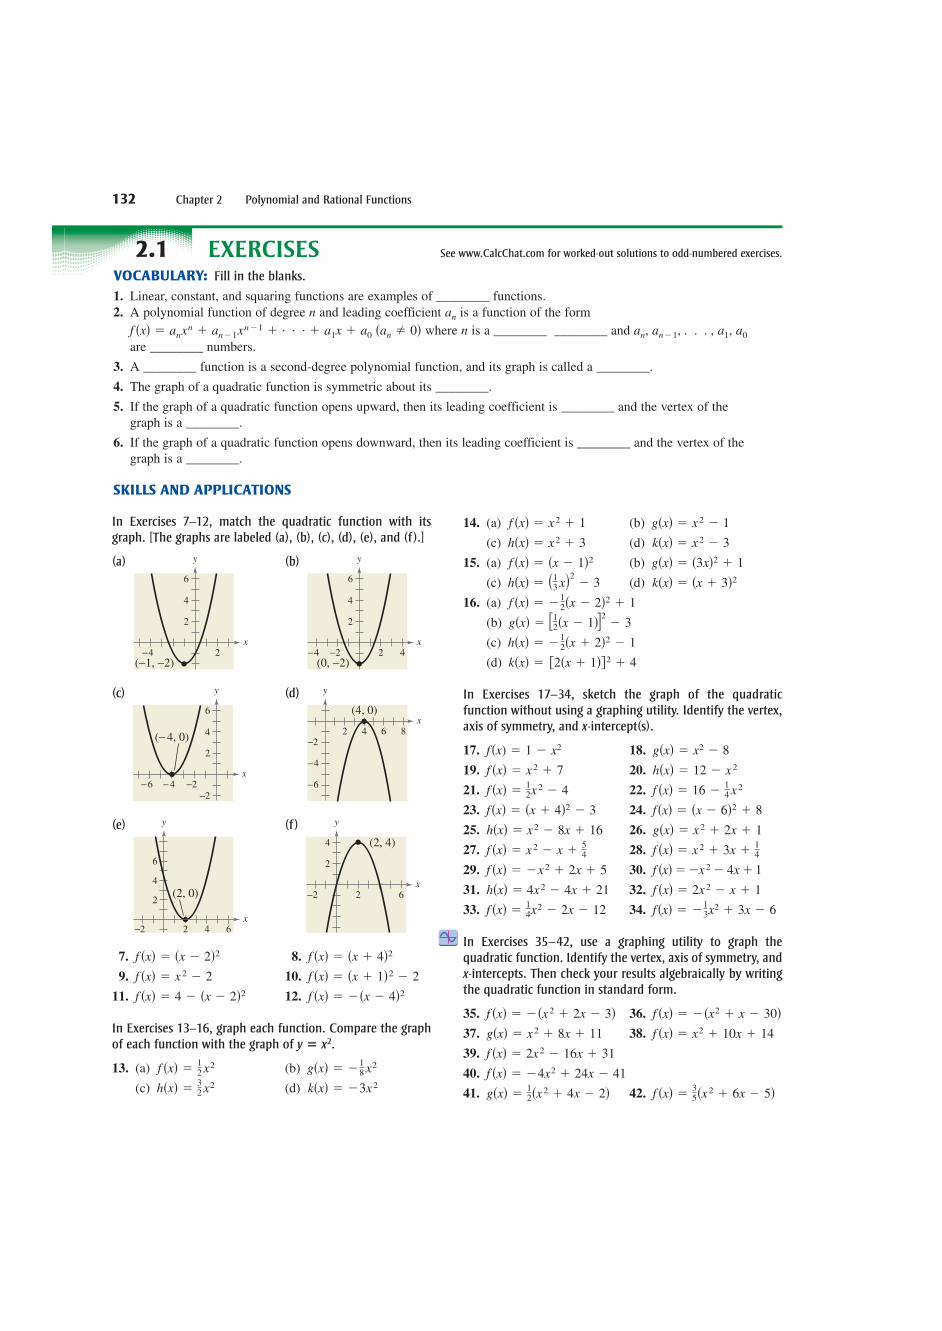
In Exercises 7–12, match the quadratic function with itsgraph. [The graphs are labeled (a), (b), (c), (d), (e), and (f ).]
(a) (b)
(c) (d)
(e) (f )
7. 8.
9. 10.
11. 12.
In Exercises 13–16, graph each function. Compare the graphof each function with the graph of
13. (a) (b)
(c) (d)
14. (a) (b)
(c) (d)
15. (a) (b)
(c) (d)
16. (a)
(b)
(c)
(d)
In Exercises 17–34, sketch the graph of the quadratic function without using a graphing utility. Identify the vertex,axis of symmetry, and -intercept(s).
17. 18.
19. 20.
21. 22.
23. 24.
25. 26.
27. 28.
29. 30.
31. 32.
33. 34.
In Exercises 35–42, use a graphing utility to graph the quadratic function. Identify the vertex, axis of symmetry, and-intercepts. Then check your results algebraically by writing
the quadratic function in standard form.
35. 36.
37. 38.
39.
40.
41. 42. f �x� �35�x2 � 6x � 5�g�x� �
12�x2 � 4x � 2�
f �x� � �4x2 � 24x � 41
f �x� � 2x2 � 16x � 31
f �x� � x2 � 10x � 14g�x� � x2 � 8x � 11
f �x� � ��x2 � x � 30�f �x� � ��x2 � 2x � 3�
x
f�x� � �13x2 � 3x � 6f �x� �
14x2 � 2x � 12
f �x� � 2x2 � x � 1h�x� � 4x2 � 4x � 21
f �x���x2 � 4x � 1f �x� � �x2 � 2x � 5
f �x� � x2 � 3x �14f �x� � x2 � x �
54
g�x� � x2 � 2x � 1h�x� � x2 � 8x � 16
f�x� � �x � 6�2 � 8f�x� � �x � 4�2 � 3
f �x� � 16 �14 x2f �x� �
12x2 � 4
h�x� � 12 � x2f �x� � x2 � 7
g�x� � x2 � 8f�x) � 1 � x2
x
k�x� � 2�x � 1�2 � 4
h�x� � �12�x � 2�2 � 1
g�x� � 12�x � 1�2 � 3
f �x� � �12�x � 2�2 � 1
k�x� � �x � 3�2h�x� � �13 x�2 � 3
g�x� � �3x�2 � 1f �x� � �x � 1�2k�x� � x2 � 3h�x� � x2 � 3
g�x� � x2 � 1f �x� � x2 � 1
k�x� � �3x2h�x� �32 x2
g�x� � �18 x2f �x� �
12 x2
y � x2.
f �x� � ��x � 4�2f �x� � 4 � �x � 2�2f �x� � �x � 1�2 � 2f �x� � x2 � 2
f �x� � �x � 4�2f �x� � �x � 2�2
x
(2, 4)
2−2 6
2
4
y
x
(2, 0)
2−2 4 6
2
6
4
y
x(4, 0)
2 4 6 8−2
−4
−6
y
x
(− 4, 0)
−2−2
−6 − 4
2
4
6
y
x
(0, −2)2−2 4−4
2
4
6
y
x
(−1, −2)2−4
2
4
6
y

Section 2.1 Quadratic Functions and Models 133
In Exercises 43–46, write an equation for the parabola instandard form.
43. 44.
45. 46.
In Exercises 47–56, write the standard form of the equationof the parabola that has the indicated vertex and whosegraph passes through the given point.
47. Vertex: point:
48. Vertex: point:
49. Vertex: point:
50. Vertex: point:
51. Vertex: point:
52. Vertex: point:
53. Vertex: point:
54. Vertex: point:
55. Vertex: point:
56. Vertex: point:
GRAPHICAL REASONING In Exercises 57 and 58, determine the -intercept(s) of the graph visually. Then findthe -intercept(s) algebraically to confirm your results.
57. 58.
In Exercises 59–64, use a graphing utility to graph the quadratic function. Find the -intercepts of the graph andcompare them with the solutions of the corresponding quadratic equation when
59. 60.
61. 62.
63. 64.
In Exercises 65–70, find two quadratic functions, one thatopens upward and one that opens downward, whose graphshave the given -intercepts. (There are many correct answers.)
65. 66.
67. 68.
69. 70.
In Exercises 71– 74, find two positive real numbers whoseproduct is a maximum.
71. The sum is 110. 72. The sum is
73. The sum of the first and twice the second is 24.
74. The sum of the first and three times the second is 42.
75. PATH OF A DIVER The path of a diver is given by
where is the height (in feet) and is the horizontaldistance from the end of the diving board (in feet). Whatis the maximum height of the diver?
76. HEIGHT OF A BALL The height (in feet) of a puntedfootball is given by
where is the horizontal distance (in feet) from thepoint at which the ball is punted.
(a) How high is the ball when it is punted?
(b) What is the maximum height of the punt?
(c) How long is the punt?
77. MINIMUM COST A manufacturer of lighting fixtureshas daily production costs of where is the total cost (in dollars) and is the number of units produced. How many fixtures shouldbe produced each day to yield a minimum cost?
78. MAXIMUM PROFIT The profit (in hundreds of dollars) that a company makes depends on theamount (in hundreds of dollars) the company spends on advertising according to the model
What expenditure for advertising will yield a maximum profit?P � 230 � 20x � 0.5x2.
x
P
xCC � 800 � 10x � 0.25x2,
x
y � �16
2025x2 �
95
x � 1.5
y
xy
y � �4
9x2 �
24
9x � 12
S.
��52, 0�, �2, 0���3, 0�, ��1
2, 0��4, 0�, �8, 0��0, 0�, �10, 0���5, 0�, �5, 0���1, 0�, �3, 0�
x
f �x�� 710�x2 � 12x � 45�f �x� � 2x2 � 7x � 30
f �x� � x2 � 8x � 20f �x� � x2 � 9x � 18
f �x� � �2x2 � 10xf �x� � x2 � 4x
f�x� � 0.
x
x−4
−4
−6 2
2
−2
y
x
−4
−4
−8
8
y
y � 2x2 � 5x � 3y � x2 � 4x � 5
xx
�6110, 3
2��6, 6�;��7
2, �163 ���5
2, 0�;��2, 4��52, �
34�;
��2, 0���14, 3
2�;��1, 0���2, �2�;
�7, 15��5, 12�;�0, 2��2, 3�;��1, 14��1, �2�;�2, 3��4, �1�;�0, 9���2, 5�;
x
(2, 0)
(3, 2)
−2 42 6
2
4
6
8
y
x(−3, 0)
(−1, 0)
(−2, 2)
−4−6
−6
2
2
y
x
(−2, −1)
(0, 3)
−4−6 2
2
6
y
x
(−1, 4)
(−3, 0)
(1, 0)
−2
−2
−4
−4
2
2
y

134 Chapter 2 Polynomial and Rational Functions
79. MAXIMUM REVENUE The total revenue earned (inthousands of dollars) from manufacturing handheldvideo games is given by
where is the price per unit (in dollars).
(a) Find the revenues when the price per unit is $20,$25, and $30.
(b) Find the unit price that will yield a maximum revenue. What is the maximum revenue? Explainyour results.
80. MAXIMUM REVENUE The total revenue earned perday (in dollars) from a pet-sitting service is given by
where is the price chargedper pet (in dollars).
(a) Find the revenues when the price per pet is $4, $6,and $8.
(b) Find the price that will yield a maximum revenue.What is the maximum revenue? Explain your results.
81. NUMERICAL, GRAPHICAL, AND ANALYTICALANALYSIS A rancher has 200 feet of fencing toenclose two adjacent rectangular corrals (see figure).
(a) Write the area of the corrals as a function of
(b) Create a table showing possible values of and thecorresponding areas of the corral. Use the table toestimate the dimensions that will produce the maximum enclosed area.
(c) Use a graphing utility to graph the area function.Use the graph to approximate the dimensions thatwill produce the maximum enclosed area.
(d) Write the area function in standard form to findanalytically the dimensions that will produce themaximum area.
(e) Compare your results from parts (b), (c), and (d).
82. GEOMETRY An indoor physical fitness room consistsof a rectangular region with a semicircle on each end.The perimeter of the room is to be a 200-meter single-lane running track.
(a) Draw a diagram that illustrates the problem. Let and represent the length and width of the rectangular region, respectively.
(b) Determine the radius of each semicircular end ofthe room. Determine the distance, in terms of around the inside edge of each semicircular part ofthe track.
(c) Use the result of part (b) to write an equation, interms of and for the distance traveled in one laparound the track. Solve for
(d) Use the result of part (c) to write the area ofthe rectangular region as a function of What dimen-sions will produce a rectangle of maximum area?
83. MAXIMUM REVENUE A small theater has a seatingcapacity of 2000. When the ticket price is $20,attendance is 1500. For each $1 decrease in price,attendance increases by 100.
(a) Write the revenue of the theater as a function ofticket price
(b) What ticket price will yield a maximum revenue?What is the maximum revenue?
84. MAXIMUM AREA A Norman window is constructedby adjoining a semicircle to the top of an ordinary rectangular window (see figure). The perimeter of thewindow is 16 feet.
(a) Write the area of the window as a function of
(b) What dimensions will produce a window of maximum area?
85. GRAPHICAL ANALYSIS From 1950 through 2005,the per capita consumption of cigarettes byAmericans (age 18 and older) can be modeled by
whereis the year, with corresponding to 1950.(Source: Tobacco Outlook Report)
(a) Use a graphing utility to graph the model.
(b) Use the graph of the model to approximate themaximum average annual consumption. Beginningin 1966, all cigarette packages were required by lawto carry a health warning. Do you think the warninghad any effect? Explain.
(c) In 2005, the U.S. population (age 18 and over) was296,329,000. Of those, about 59,858,458 weresmokers. What was the average annual cigaretteconsumption per smoker in 2005? What was theaverage daily cigarette consumption per smoker?
t � 0t0 � t � 55,C � 3565.0 � 60.30t � 1.783t2,
C
x.A
x2 y
x
x.R
x.A
y.y,x
y,
yx
x
x.A
xx
y
pR�p� � �12p2 � 150p,
R
p
R�p� � �25p2 � 1200p
R

Section 2.1 Quadratic Functions and Models 135
86. DATA ANALYSIS: SALES The sales (in billions ofdollars) for Harley-Davidson from 2000 through 2007are shown in the table. (Source: U.S. Harley-Davidson, Inc.)
(a) Use a graphing utility to create a scatter plot of the data. Let represent the year, with corresponding to 2000.
(b) Use the regression feature of the graphing utility tofind a quadratic model for the data.
(c) Use the graphing utility to graph the model in thesame viewing window as the scatter plot. How welldoes the model fit the data?
(d) Use the trace feature of the graphing utility toapproximate the year in which the sales for Harley-Davidson were the greatest.
(e) Verify your answer to part (d) algebraically.
(f) Use the model to predict the sales for Harley-Davidson in 2010.
EXPLORATION
TRUE OR FALSE? In Exercises 87–90, determine whetherthe statement is true or false. Justify your answer.
87. The function given by has no -intercepts.
88. The graphs of andhave the same axis of
symmetry.
89. The graph of a quadratic function with a negative leadingcoefficient will have a maximum value at its vertex.
90. The graph of a quadratic function with a positive leadingcoefficient will have a minimum value at its vertex.
THINK ABOUT IT In Exercises 91–94, find the values of such that the function has the given maximum or minimum value.
91. Maximum value: 25
92. Maximum value: 48
93. Minimum value: 10
94. Minimum value:
95. Write the quadratic function
in standard form to verify that the vertex occurs at
97. GRAPHICAL ANALYSIS
(a) Graph for 0.5, 1 and 2.How does changing the value of affect the graph?
(b) Graph for 2, and 4.How does changing the value of affect the graph?
(c) Graph for 2, and 4.How does changing the value of affect the graph?
98. Describe the sequence of transformation from to given that and (Assume and are positive.)
99. Is it possible for a quadratic equation to have only one -intercept? Explain.
100. Assume that the function given by
has two real zeros. Show that the -coordinate of thevertex of the graph is the average of the zeros of (Hint: Use the Quadratic Formula.)
PROJECT: HEIGHT OF A BASKETBALL To work anextended application analyzing the height of a basketballafter it has been dropped, visit this text’s website at academic.cengage.com.
f.x
a � 0f �x� � ax2 � bx � c,
x
kh,a,g�x� � a�x � h�2 � k.f�x� � x2
gf
k�2,k � �4,y � x2 � k
h�2,h � �4,y � �x � h�2
a�0.5,�1,a � �2,y � ax2
�� b2a
, f �� b2a��.
f �x� � ax2 � bx � c
�50f�x� � x2 � bx � 25;
f�x� � x2 � bx � 26;
f�x� � �x2 � bx � 16;
f�x� � �x2 � bx � 75;
b
g�x� � 12x2 � 30x � 1f �x� � �4x2 � 10x � 7
xf �x� � �12x2 � 1
x � 0x
y
Year Sales, y
2000
2001
2002
2003
2004
2005
2006
2007
2.91
3.36
4.09
4.62
5.02
5.34
5.80
5.73
96. CAPSTONE The profit (in millions of dollars) fora recreational vehicle retailer is modeled by a quadraticfunction of the form
where represents the year. If you were president ofthe company, which of the models below would youprefer? Explain your reasoning.
(a) is positive and
(b) is positive and
(c) is negative and
(d) is negative and t � �b��2a�.a
�b��2a� � t.a
t � �b��2a�.a
�b��2a� � t.a
t
P � at2 � bt � c
P

136 Chapter 2 Polynomial and Rational Functions
Graphs of Polynomial Functions
In this section, you will study basic features of the graphs of polynomial functions. Thefirst feature is that the graph of a polynomial function is continuous. Essentially, thismeans that the graph of a polynomial function has no breaks, holes, or gaps, as shownin Figure 2.11(a). The graph shown in Figure 2.11(b) is an example of a piecewise-defined function that is not continuous.
(a) Polynomial functions have (b) Functions with graphs thatcontinuous graphs. are not continuous are not
polynomial functions.
FIGURE 2.11
The second feature is that the graph of a polynomial function has only smooth,rounded turns, as shown in Figure 2.12. A polynomial function cannot have a sharp turn.For instance, the function given by which has a sharp turn at the point as shown in Figure 2.13, is not a polynomial function.
Polynomial functions have graphs Graphs of polynomial functions
with smooth, rounded turns. cannot have sharp turns.
FIGURE 2.12 FIGURE 2.13
The graphs of polynomial functions of degree greater than 2 are more difficult toanalyze than the graphs of polynomials of degree 0, 1, or 2. However, using the featurespresented in this section, coupled with your knowledge of point plotting, intercepts, andsymmetry, you should be able to make reasonably accurate sketches by hand.
x−4 −3 −2 −1 1 2 3 4
−2
2
3
4
5
6f(x) = ⎢x⎟
(0, 0)
y
x
y
�0, 0�,f �x� � �x�,
x
y
x
y
2.2 POLYNOMIAL FUNCTIONS OF HIGHER DEGREE
What you should learn
• Use transformations to sketchgraphs of polynomial functions.
• Use the Leading Coefficient Test to determine the end behavior ofgraphs of polynomial functions.
• Find and use zeros of polynomialfunctions as sketching aids.
• Use the Intermediate ValueTheorem to help locate zeros of polynomial functions.
Why you should learn it
You can use polynomial functions toanalyze business situations such ashow revenue is related to advertisingexpenses, as discussed in Exercise 104on page 148.
Bill
Aron
/Pho
toEd
it, In
c.

Section 2.2 Polynomial Functions of Higher Degree 137
The polynomial functions that have the simplest graphs are monomials of the formwhere is an integer greater than zero. From Figure 2.14, you can see that
when is even, the graph is similar to the graph of and when is odd, thegraph is similar to the graph of Moreover, the greater the value of the flatter the graph near the origin. Polynomial functions of the form are oftenreferred to as power functions.
(a) If n is even, the graph of (b) If n is odd, the graph of touches the axis at the x-intercept. crosses the axis at the x-intercept.
FIGURE 2.14
Sketching Transformations of Polynomial Functions
Sketch the graph of each function.
a. b.
Solution
a. Because the degree of is odd, its graph is similar to the graph of In Figure 2.15, note that the negative coefficient has the effect of reflecting the graphin the -axis.
b. The graph of as shown in Figure 2.16, is a left shift by one unit ofthe graph of
FIGURE 2.15 FIGURE 2.16
Now try Exercise 17.
x
h(x) = (x + 1)
(−2, 1) (0, 1)
(−1, 0)
−2 −1 1
4
3
2
1
y
x
(1, −1)
f(x) = −x5
(−1, 1)
−1 1
−1
1
y
y � x4.h�x� � �x � 1�4,
x
y � x3.f �x� � �x5
h�x� � �x � 1�4f �x� � �x5
Example 1
y � xny � xn
(1, 1)
(−1, −1)
x−1 1
−1
1y = x 5y = x 3
y
x
(−1, 1)(1, 1)
−1 1
1
2
y = x
y = x
2
4
y
f �x� � xnn,f �x� � x3.
nf �x� � x2,nnf �x� � xn,
You can review the techniquesfor shifting, reflecting, andstretching graphs in Section 1.7.
For power functions given byif is even, then
the graph of the function issymmetric with respect to the -axis, and if is odd, then
the graph of the function issymmetric with respect to theorigin.
ny
nf �x� � xn,
138 Chapter 2 Polynomial and Rational Functions
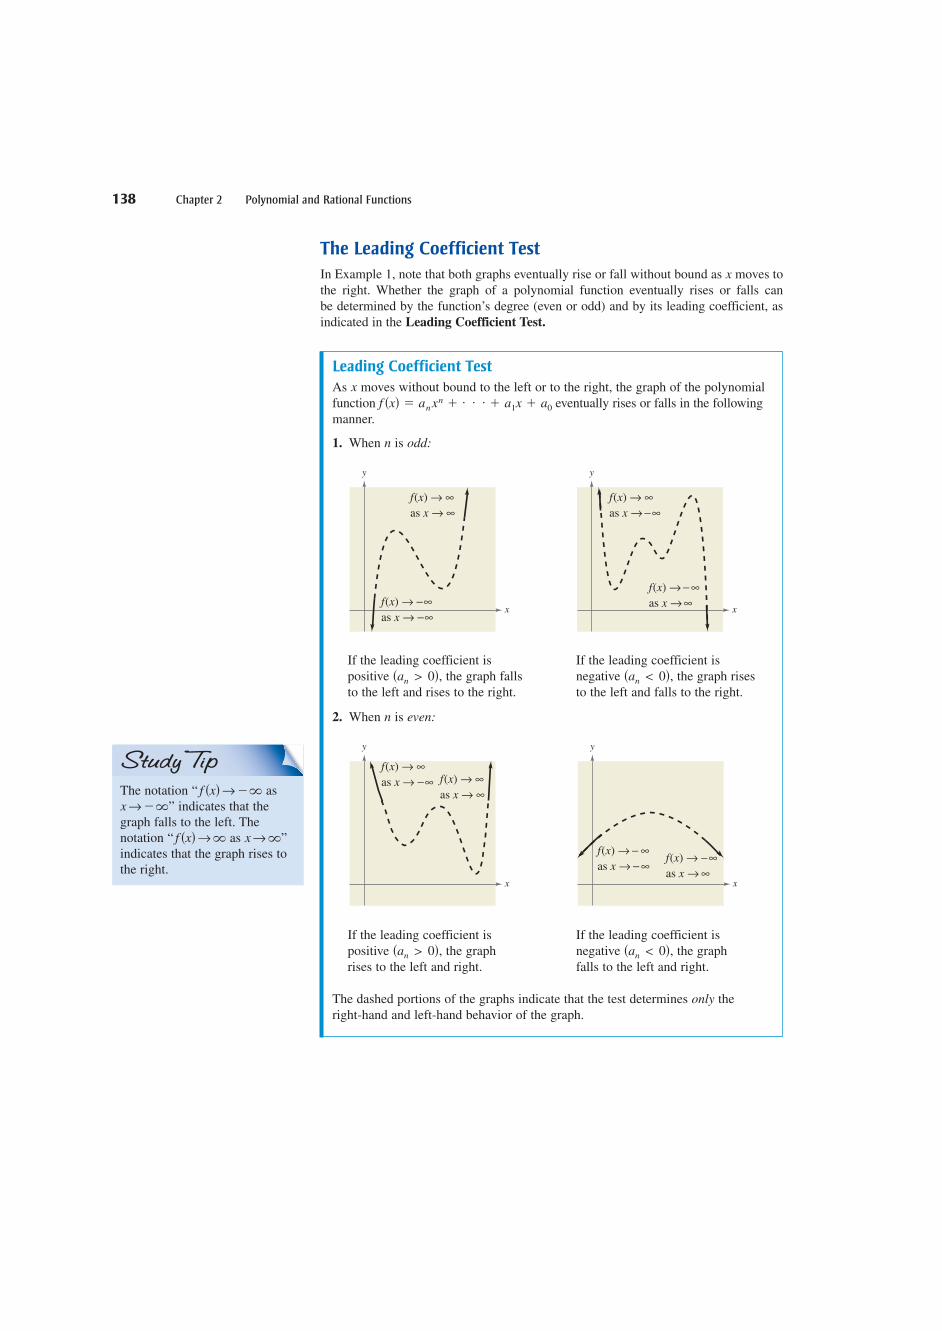
The Leading Coefficient Test
In Example 1, note that both graphs eventually rise or fall without bound as moves tothe right. Whether the graph of a polynomial function eventually rises or falls can be determined by the function’s degree (even or odd) and by its leading coefficient, asindicated in the Leading Coefficient Test.
x
Leading Coefficient Test
As moves without bound to the left or to the right, the graph of the polynomialfunction eventually rises or falls in the followingmanner.
1. When is odd:
2. When is even:
The dashed portions of the graphs indicate that the test determines only theright-hand and left-hand behavior of the graph.
x
f(x) → − ∞as x → − ∞
f(x) → −∞as x → ∞
y
x
f(x) → ∞as x → −∞ f(x) → ∞
as x → ∞
y
n
x
f(x) → ∞as x → −∞
f(x) → − ∞as x → ∞
y
x
f(x) → ∞as x → ∞
f(x) → −∞as x → −∞
y
n
f �x� � anxn � . . . � a1x � a0
x
If the leading coefficient ispositive the graph fallsto the left and rises to the right.
�an > 0�,If the leading coefficient isnegative the graph risesto the left and falls to the right.
�an < 0�,
If the leading coefficient ispositive the graphrises to the left and right.
�an > 0�,If the leading coefficient isnegative the graphfalls to the left and right.
�an < 0�,
The notation “ as” indicates that the
graph falls to the left. Thenotation “ as ”indicates that the graph rises tothe right.
x →�f �x�→�
x → ��f �x�→ ��

Applying the Leading Coefficient Test
Describe the right-hand and left-hand behavior of the graph of each function.
a. b. c.
Solution
a. Because the degree is odd and the leading coefficient is negative, the graph rises tothe left and falls to the right, as shown in Figure 2.17.
b. Because the degree is even and the leading coefficient is positive, the graph rises tothe left and right, as shown in Figure 2.18.
c. Because the degree is odd and the leading coefficient is positive, the graph falls tothe left and rises to the right, as shown in Figure 2.19.
FIGURE 2.17 FIGURE 2.18 FIGURE 2.19
Now try Exercise 23.
In Example 2, note that the Leading Coefficient Test tells you only whether thegraph eventually rises or falls to the right or left. Other characteristics of the graph, such as intercepts and minimum and maximum points, must be determined byother tests.
Zeros of Polynomial Functions
It can be shown that for a polynomial function of degree the following statementsare true.
1. The function has, at most, real zeros. (You will study this result in detail in thediscussion of the Fundamental Theorem of Algebra in Section 2.5.)
2. The graph of has, at most, turning points. (Turning points, also called relative minima or relative maxima, are points at which the graph changes fromincreasing to decreasing or vice versa.)
Finding the zeros of polynomial functions is one of the most important problemsin algebra. There is a strong interplay between graphical and algebraic approaches tothis problem. Sometimes you can use information about the graph of a function to helpfind its zeros, and in other cases you can use information about the zeros of a functionto help sketch its graph. Finding zeros of polynomial functions is closely related to factoring and finding -intercepts.x
n � 1f
nf
n,f
x−2 2
−2
−1
1
2
yf(x) = x5 − x
x
y
4−4
4
6
f(x) = x4 − 5x2 + 4
−3 −1 1 3x
1
2
3
yf(x) = −x3 + 4x
f �x� � x5 � xf �x� � x4 � 5x2 � 4f �x� � �x3 � 4x
Example 2
Remember that the zeros of afunction of are the -valuesfor which the function is zero.
xx
WARNING / CAUTIONA polynomial function is written in standard form if itsterms are written in descendingorder of exponents from left to right. Before applying theLeading Coefficient Test to apolynomial function, it is a good idea to make sure that thepolynomial function is writtenin standard form.
Section 2.2 Polynomial Functions of Higher Degree 139

140 Chapter 2 Polynomial and Rational Functions
In Example 3, note that because the exponent is greater than 1, the factor yields the repeated zero Because the exponent is even, the graph touches the -axis at as shown in Figure 2.20.x � 0,x
x � 0.�2x2
Real Zeros of Polynomial Functions
If is a polynomial function and is a real number, the following statements areequivalent.
1. is a zero of the function
2. is a solution of the polynomial equation
3. is a factor of the polynomial
4. is an -intercept of the graph of f.x�a, 0�
f �x�.�x � a�
f �x� � 0.x � a
f.x � a
af
Finding the Zeros of a Polynomial Function
Find all real zeros of
Then determine the number of turning points of the graph of the function.
f (x) � �2x4 � 2x2.
Example 3
Algebraic Solution
To find the real zeros of the function, set equal to zeroand solve for
Set equal to 0.
Factor completely.
So, the real zeros are and Becausethe function is a fourth-degree polynomial, the graph of canhave at most turning points.
Now try Exercise 35.
4 � 1 � 3f
x � �1.x � 1,x � 0,
�2x2�x � 1��x � 1� � 0
�2x2�x2 � 1� � 0
f �x��2x4 � 2x2 � 0
x.f �x�
Graphical Solution
Use a graphing utility to graph In Figure2.20, the graph appears to have zeros at and
Use the zero or root feature, or the zoom and tracefeatures, of the graphing utility to verify these zeros. So, thereal zeros are and From the figure,you can see that the graph has three turning points. This isconsistent with the fact that a fourth-degree polynomial canhave at most three turning points.
FIGURE 2.20
−2
3−3
2
y = −2x4 + 2x2
x � �1.x � 1,x � 0,
��1, 0�.�1, 0�,�0, 0�,
y � �2x4 � 2x2.
Remove commonmonomial factor.
To do Example 3 algebraically,you need to be able to completely factor polynomials.You can review the techniquesfor factoring in Appendix A.3.
Repeated Zeros
A factor yields a repeated zero of multiplicity
1. If is odd, the graph crosses the -axis at
2. If is even, the graph touches the -axis (but does not cross the -axis)at x � a.
xxk
x � a.xk
k.x � ak > 1,�x � a�k,
To graph polynomial functions, you can use the fact that a polynomial function canchange signs only at its zeros. Between two consecutive zeros, a polynomial must beentirely positive or entirely negative. (This follows from the Intermediate ValueTheorem, which you will study later in this section.) This means that when the realzeros of a polynomial function are put in order, they divide the real number line intointervals in which the function has no sign changes. These resulting intervals are testintervals in which a representative -value in the interval is chosen to determine if thevalue of the polynomial function is positive (the graph lies above the -axis) or negative (the graph lies below the -axis).
Sketching the Graph of a Polynomial Function
Sketch the graph of
Solution
1. Apply the Leading Coefficient Test. Because the leading coefficient is positive andthe degree is even, you know that the graph eventually rises to the left and to theright (see Figure 2.21).
2. Find the Zeros of the Polynomial. By factoring asyou can see that the zeros of are and (both of odd
multiplicity). So, the -intercepts occur at and Add these points to yourgraph, as shown in Figure 2.21.
3. Plot a Few Additional Points. Use the zeros of the polynomial to find the test intervals. In each test interval, choose a representative -value and evaluate the polynomial function, as shown in the table.
4. Draw the Graph. Draw a continuous curve through the points, as shown in Figure2.22. Because both zeros are of odd multiplicity, you know that the graph shouldcross the -axis at and
FIGURE 2.21 FIGURE 2.22
Now try Exercise 75.
x
y
−1−2−3−4 2 3 4−1
3
4
5
6
7
f(x) = 3x4 − 4x3
x(0, 0)
Up to rightUp to left
, 043 ))
y
−4 −3 −2 −1 1 2 3 4
7
6
5
4
2
3
−1
x �43.x � 0x
x
�43, 0�.�0, 0�x
x �43x � 0ff �x�� x3�3x � 4�,
f �x� � 3x4 � 4x3
f �x� � 3x4 � 4x3.
Example 4
xx
x
Test intervalRepresentative
x-valueValue of f Sign
Point ongraph
���, 0� �1 f��1� � 7 Positive ��1, 7�
�0, 43� 1 f�1� � �1 Negative �1, �1�
�43, �� 1.5 f�1.5� � 1.6875 Positive �1.5, 1.6875�
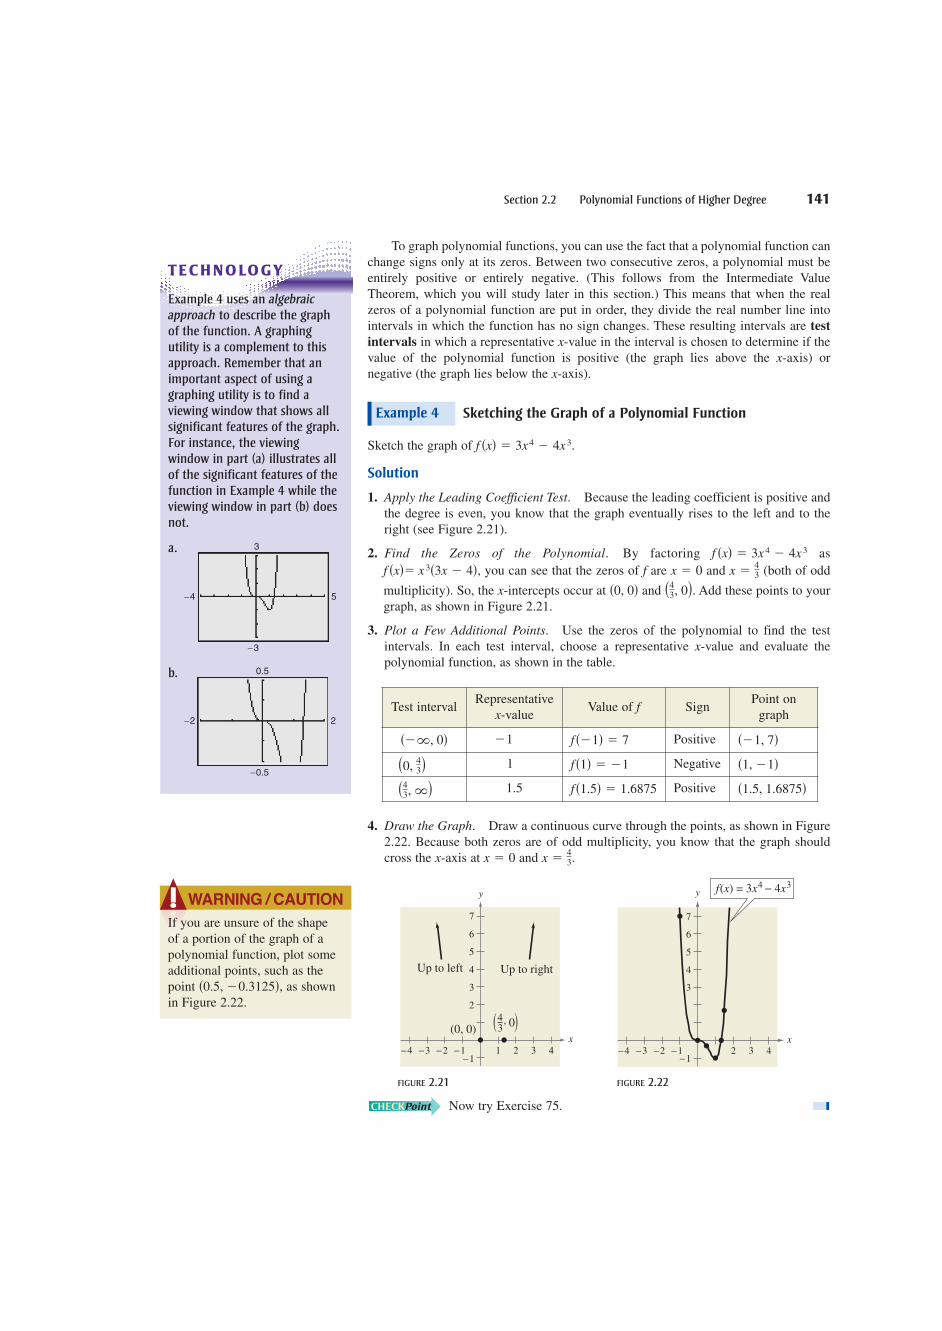
TECHNOLOGY
Example 4 uses an algebraicapproach to describe the graphof the function. A graphing utility is a complement to thisapproach. Remember that animportant aspect of using agraphing utility is to find aviewing window that shows allsignificant features of the graph.For instance, the viewing window in part (a) illustrates allof the significant features of thefunction in Example 4 while theviewing window in part (b) doesnot.
a.
b.
−2 2
−0.5
0.5
−4 5
−3
3
WARNING / CAUTIONIf you are unsure of the shapeof a portion of the graph of apolynomial function, plot someadditional points, such as thepoint as shownin Figure 2.22.
�0.5, �0.3125�,
Section 2.2 Polynomial Functions of Higher Degree 141

142 Chapter 2 Polynomial and Rational Functions
Sketching the Graph of a Polynomial Function
Sketch the graph of
Solution
1. Apply the Leading Coefficient Test. Because the leading coefficient is negative andthe degree is odd, you know that the graph eventually rises to the left and falls to theright (see Figure 2.23).
2. Find the Zeros of the Polynomial. By factoring
you can see that the zeros of are (odd multiplicity) and (even
multiplicity). So, the -intercepts occur at and Add these points to yourgraph, as shown in Figure 2.23.
3. Plot a Few Additional Points. Use the zeros of the polynomial to find the test intervals. In each test interval, choose a representative -value and evaluatethe polynomial function, as shown in the table.
4. Draw the Graph. Draw a continuous curve through the points, as shown in Figure2.24. As indicated by the multiplicities of the zeros, the graph crosses the -axis at
but does not cross the -axis at
FIGURE 2.23 FIGURE 2.24
Now try Exercise 77.
1
x−4 −2 −1−3 3 4
f x x x x( ) = 2 + 6− −3 2 92
−2
−1
y
Down to rightUp to left
−2
2
4
6
3
5
x(0, 0)
−4 −2 −1−1
−3 2 31 4
, 032( )
y
�32, 0�.x�0, 0�x
x
�32, 0�.�0, 0�x
x �32x � 0f
� �12x�2x � 3�2
� �12x�4x2 � 12x � 9�
f �x� � �2x3 � 6x2 �92 x
f �x� � �2x3 � 6x2 �92x.
Example 5
Test intervalRepresentative
x-valueValue of f Sign
Point ongraph
���, 0� �0.5 f��0.5� � 4 Positive ��0.5, 4�
�0, 32� 0.5 f�0.5� � �1 Negative �0.5, �1�
�32, �� 2 f�2� � �1 Negative �2, �1�
Observe in Example 5 that thesign of is positive to the leftof and negative to the right ofthe zero Similarly, thesign of is negative to theleft and to the right of the zero
This suggests that if thezero of a polynomial function isof odd multiplicity, then the signof changes from one side ofthe zero to the other side. If thezero is of even multiplicity, thenthe sign of does not changefrom one side of the zero to theother side.
f �x�
f �x�
x �32.
f �x�x � 0.
f �x�

The Intermediate Value Theorem
The next theorem, called the Intermediate Value Theorem, illustrates the existence ofreal zeros of polynomial functions. This theorem implies that if and are two points on the graph of a polynomial function such that then for anynumber between and there must be a number between and such that
(See Figure 2.25.)
FIGURE 2.25
The Intermediate Value Theorem helps you locate the real zeros of a polynomialfunction in the following way. If you can find a value at which a polynomialfunction is positive, and another value at which it is negative, you can concludethat the function has at least one real zero between these two values. For example, thefunction given by is negative when and positive when
Therefore, it follows from the Intermediate Value Theorem that must have areal zero somewhere between and as shown in Figure 2.26.
FIGURE 2.26
By continuing this line of reasoning, you can approximate any real zeros of a polynomial function to any desired accuracy. This concept is further demonstrated inExample 6.
x
f has a zerobetween
2 and 1.− −
f x x x( ) = + + 13 2
( 2, 3)− −
( 1, 1)−
f( 2) = 3− −
f( 1) = 1−
−2 21
−2
−3
−1
y
�1,�2fx � �1.
x � �2f �x� � x3 � x2 � 1
x � bx � a
x
f c d( ) =
f b( )
f a( )
a c b
y
f �c� � d.bacf �b�f �a�d
f �a� � f �b�,�b, f �b���a, f �a��
Intermediate Value Theorem
Let and be real numbers such that If is a polynomial function suchthat then, in the interval takes on every value between and f �b�.
f �a�fa, b,f �a� � f �b�,fa < b.ba
Section 2.2 Polynomial Functions of Higher Degree 143

144 Chapter 2 Polynomial and Rational Functions
Approximating a Zero of a Polynomial Function
Use the Intermediate Value Theorem to approximate the real zero of
Solution
Begin by computing a few function values, as follows.
Because is negative and is positive, you can apply the Intermediate ValueTheorem to conclude that the function has a zero between and 0. To pinpoint thiszero more closely, divide the interval into tenths and evaluate the function ateach point. When you do this, you will find that
and
So, must have a zero between and as shown in Figure 2.27. For a moreaccurate approximation, compute function values between and andapply the Intermediate Value Theorem again. By continuing this process, you canapproximate this zero to any desired accuracy.
Now try Exercise 93.
f ��0.7�f ��0.8��0.7,�0.8f
f ��0.7� � 0.167.f ��0.8� � �0.152
�1, 0�1
f �0�f ��1�
f �x� � x3 � x2 � 1.
Example 6
x f�x�
�2 �11
�1 �1
0 1
1 1
TECHNOLOGY
You can use the table feature of a graphing utility to approximate thezeros of a polynomial function. For instance, for the function given by
create a table that shows the function values for , asshown in the first table at the right. Scroll through the table lookingfor consecutive function values that differ in sign. From the table, you can see that and differ in sign. So, you can conclude from the Intermediate Value Theorem that the function has a zerobetween 0 and 1. You can adjust your table to show function valuesfor using increments of 0.1, as shown in the second tableat the right. By scrolling through the table you can see that and
differ in sign. So, the function has a zero between 0.8 and 0.9. If you repeat this process several times, you should obtain as the zero of the function. Use the zero or root feature of a graphingutility to confirm this result.
x y 0.806f�0.9�
f�0.8�0 � x � 1
f �1�f�0�
�20 � x � 20
f �x� � �2x3 � 3x2 � 3
x
f has a zero
and 0.7.between 0.8−
−
−1 1 2
−1
2
f x x x( ) = + 13 2−
( 1, 1)− −
(0, 1)(1, 1)
y
FIGURE 2.27

Section 2.2 Polynomial Functions of Higher Degree 145
EXERCISES See www.CalcChat.com for worked-out solutions to odd-numbered exercises.2.2VOCABULARY: Fill in the blanks.
1. The graphs of all polynomial functions are ________, which means that the graphs have no breaks, holes, or gaps.
2. The ________ ________ ________ is used to determine the left-hand and right-hand behavior of the graph of a polynomial function.
3. Polynomial functions of the form ________ are often referred to as power functions.
4. A polynomial function of degree has at most ________ real zeros and at most ________ turning points.
5. If is a zero of a polynomial function then the following three statements are true.
(a) is a ________ of the polynomial equation
(b) ________ is a factor of the polynomial
(c) is an ________ of the graph of
6. If a real zero of a polynomial function is of even multiplicity, then the graph of ________ the -axis at and if it is of odd multiplicity, then the graph of ________ the -axis at
7. A polynomial function is written in ________ form if its terms are written in descending order of exponents from left to right.
8. The ________ ________ Theorem states that if is a polynomial function such that then, in the interval takes on every value between and
SKILLS AND APPLICATIONS
f �b�.f �a�fa, b,f �a� � f �b�,f
x � a.xfx � a,xf
f.�a, 0�f �x�.
f �x� � 0.x � a
f,x � a
n
f�x� �
In Exercises 9–16, match the polynomial function with itsgraph. [The graphs are labeled (a), (b), (c), (d), (e), (f ), (g),and (h).]
(a) (b)
(c) (d)
(e) (f )
(g) (h)
9. 10.
11. 12.
13. 14.
15. 16.
In Exercises 17–20, sketch the graph of and eachtransformation.
17.
(a) (b)
(c) (d)
18.
(a) (b)
(c) (d)
19.
(a) (b)
(c) (d)
(e) (f) f�x� � �12 x�4 � 2f�x� � �2x�4 � 1
f �x� �12�x � 1�4f �x� � 4 � x4
f �x� � x4 � 3f �x� � �x � 3�4y � x4
f �x� � �12�x � 1�5f �x� � 1 �
12x5
f �x� � x5 � 1f �x� � �x � 1�5y � x5
f �x� � �x � 4�3 � 4f �x� � �14x3
f �x� � x3 � 4f �x� � �x � 4�3y � x3
y � xn
f �x� �15x5 � 2x3 �
95xf �x� � x4 � 2x3
f �x� � �13x3 � x2 �
43f �x� � �
14x4 � 3x2
f �x� � 2x3 � 3x � 1f �x� � �2x2 � 5x
f �x� � x2 � 4xf �x� � �2x � 3
x2
−4
4
−4−2
y
x62
−4
−2−2
y
x42−4
−4
−2
4
y
x84−8
−8
−4−4
8
y
x42−4
−2
6
4
2
y
x84−8
−8
−4−4
8
4
y
x84−8 −4
8
y
x8−8
−8
−4
y

146 Chapter 2 Polynomial and Rational Functions
20.
(a) (b)
(c) (d)
(e) (f)
In Exercises 21–30, describe the right-hand and left-handbehavior of the graph of the polynomial function.
21. 22.
23. 24.
25.
26.
27.
28.
29.
30.
GRAPHICAL ANALYSIS In Exercises 31–34, use a graphingutility to graph the functions and in the same viewing window. Zoom out sufficiently far to show that theright-hand and left-hand behaviors of and appear identical.
31.
32.
33.
34.
In Exercises 35–50, (a) find all the real zeros of thepolynomial function, (b) determine the multiplicity of eachzero and the number of turning points of the graph of thefunction, and (c) use a graphing utility to graph the functionand verify your answers.
35. 36.
37. 38.
39. 40.
41. 42.
43. 44.
45. 46.
47. 48.
49.
50.
GRAPHICAL ANALYSIS In Exercises 51–54, (a) use agraphing utility to graph the function, (b) use the graph toapproximate any -intercepts of the graph, (c) set andsolve the resulting equation, and (d) compare the results ofpart (c) with any -intercepts of the graph.
51.
52.
53. 54.
In Exercises 55– 64, find a polynomial function that has thegiven zeros. (There are many correct answers.)
55. 56.
57. 58.
59. 60.
61. 62.
63. 64.
In Exercises 65–74, find a polynomial of degree that has thegiven zero(s). (There are many correct answers.)
Zero(s) Degree
65.
66.
67.
68.
69.
70.
71.
72.
73.
74.
In Exercises 75–88, sketch the graph of the function by (a) applying the Leading Coefficient Test, (b) finding the zerosof the polynomial, (c) plotting sufficient solution points, and(d) drawing a continuous curve through the points.
75. 76.
77.
78.
79. 80.
81.
82.
83. 84.
85. 86.
87.
88.
In Exercises 89–92, use a graphing utility to graph thefunction. Use the zero or root feature to approximate the realzeros of the function. Then determine the multiplicity of eachzero.
89. 90.
91.
92. h�x� �15�x � 2�2�3x � 5�2
g�x� �15�x � 1�2�x � 3��2x � 9�
f �x� �14x4 � 2x2f �x� � x3 � 16x
g�x� �110�x � 1�2�x � 3�3
g�t� � �14�t � 2�2�t � 2�2
h�x� �13x3�x � 4�2f �x� � x2�x � 4�
f �x� � �48x2 � 3x4f �x� � �5x2 � x3
f �x� � �4x3 � 4x2 � 15x
f �x� � 3x3 � 15x2 � 18x
f �x� � 8 � x3f �x� � x3 � 2x2
g�x� � �x2 � 10x � 16
f �t� �14�t 2 � 2t � 15�
g�x� � x4 � 9x2f �x� � x3 � 25x
n � 5x � �1, 4, 7, 8
n � 5x � 0, �4
n � 4x � �4, �1, 3, 6
n � 4x � �5, 1, 2
n � 3x � 9
n � 3x � 0, 3, � 3
n � 3x � �2, 4, 7
n � 3x � �5, 0, 1
n � 2x � �12, �6
n � 2x � �3
n
2, 4 � 5, 4 � 51 � 3, 1 � 3
�2, �1, 0, 1, 24, �3, 3, 0
0, 1, 100, �4, �5
�4, 52, �6
0, �70, 8
y �14x3�x2 � 9�y � x5 � 5x3 � 4x
y � 4x3 � 4x2 � 8x � 8
y � 4x3 � 20x2 � 25x
x
y � 0x
f�x� � x3 � 4x2 � 25x � 100
g�x� � x3 � 3x2 � 4x � 12
f�x� � 2x4 � 2x2 � 40f�x� � 3x4 � 9x2 � 6
f�x� � x5 � x3 � 6xg�t� � t 5 � 6t 3 � 9t
f�x� � x4 � x3 � 30x2f �t� � t3 � 8t2 � 16t
g�x� � 5x�x2 � 2x � 1�f�x� � 3x3 � 12x2 � 3x
f �x� �12x2 �
52x �
32f �x� �
13 x2 �
13 x �
23
f�x� � x2 � 10x � 25h�t� � t 2 � 6t � 9
f�x� � 81 � x2f�x� � x2 � 36
g�x� � 3x4f�x� � 3x4 � 6x2,
g�x� � �x4f �x� � ��x4 � 4x3 � 16x�,g�x� � �
13x3f�x� � �
13�x3 � 3x � 2�,
g�x� � 3x3f �x� � 3x3 � 9x � 1,
gf
gf
f�s� � �78�s3 � 5s2 � 7s � 1�
h �t� � �34�t2 � 3t � 6�
f �x� � �3x4 � 2x � 5��4f �x� � 6 � 2x � 4x2 � 5x3
f �x� � 4x5 � 7x � 6.5
f �x� � �2.1x5 � 4x3 � 2
h�x� � 1 � x6g �x� � 5 �72x � 3x2
f �x� � 2x2 � 3x � 1f �x� �15x3 � 4x
f�x� � �2x�6 � 1f�x� � �14 x�6 � 2
f �x� � �14x6 � 1f �x� � x6 � 5
f �x� � �x � 2�6 � 4f �x� � �18x6
y � x6

In Exercises 93–96, use the Intermediate Value Theorem andthe table feature of a graphing utility to find intervals oneunit in length in which the polynomial function is guaranteedto have a zero. Adjust the table to approximate the zeros of the function. Use the zero or root feature of the graphing utility to verify your results.
93.
94.
95.
96.
97. NUMERICAL AND GRAPHICAL ANALYSIS An openbox is to be made from a square piece of material,36 inches on a side, by cutting equal squares with sidesof length from the corners and turning up the sides(see figure).
(a) Write a function that represents the volume ofthe box.
(b) Determine the domain of the function.
(c) Use a graphing utility to create a table that showsbox heights and the corresponding volumes Use the table to estimate the dimensions that will produce a maximum volume.
(d) Use a graphing utility to graph and use the graphto estimate the value of for which is maximum. Compare your result with that of part (c).
98. MAXIMUM VOLUME An open box with locking tabsis to be made from a square piece of material 24 incheson a side. This is to be done by cutting equal squaresfrom the corners and folding along the dashed linesshown in the figure.
(a) Write a function that represents the volume ofthe box.
(b) Determine the domain of the function
(c) Sketch a graph of the function and estimate thevalue of for which is maximum.
99. CONSTRUCTION A roofing contractor is fabricatinggutters from 12-inch aluminum sheeting. The contractorplans to use an aluminum siding folding press to create the gutter by creasing equal lengths for the sidewalls (see figure).
(a) Let represent the height of the sidewall of the gutter. Write a function that represents the cross-sectional area of the gutter.
(b) The length of the aluminum sheeting is 16 feet.Write a function that represents the volume ofone run of gutter in terms of
(c) Determine the domain of the function in part (b).
(d) Use a graphing utility to create a table that showssidewall heights and the corresponding volumes
Use the table to estimate the dimensions thatwill produce a maximum volume.
(e) Use a graphing utility to graph Use the graph toestimate the value of for which is a maximum. Compare your result with that of part (d).
(f) Would the value of change if the aluminum sheeting were of different lengths? Explain.
100. CONSTRUCTION An industrial propane tank isformed by adjoining two hemispheres to the ends of aright circular cylinder. The length of the cylindricalportion of the tank is four times the radius of the hemispherical components (see figure).
(a) Write a function that represents the total volume of the tank in terms of
(b) Find the domain of the function.
(c) Use a graphing utility to graph the function.
(d) The total volume of the tank is to be 120 cubic feet.Use the graph from part (c) to estimate the radiusand length of the cylindrical portion of the tank.
r.V
r
4r
x
V�x�xV.
V.x
x.V
Ax
x 12 − 2x x
V�x�x
V.
V�x�
x x x xx x
24 in
.
24 in.
V�x�xV
V.x
V�x�
x x
x
36 2− x
x
h �x� � x4 � 10x2 � 3
g�x� � 3x4 � 4x3 � 3
f �x� � 0.11x3 � 2.07x2 � 9.81x � 6.88
f �x� � x3 � 3x2 � 3
Section 2.2 Polynomial Functions of Higher Degree 147

148 Chapter 2 Polynomial and Rational Functions
101. REVENUE The total revenues (in millions of dollars) for Krispy Kreme from 2000 through 2007 areshown in the table.
A model that represents these data is given by
where represents the year, with corresponding to 2000. (Source: Krispy Kreme)
(a) Use a graphing utility to create a scatter plot of thedata. Then graph the model in the same viewingwindow.
(b) How well does the model fit the data?
(c) Use a graphing utility to approximate any relativeextrema of the model over its domain.
(d) Use a graphing utility to approximate the intervalsover which the revenue for Krispy Kreme wasincreasing and decreasing over its domain.
(e) Use the results of parts (c) and (d) to write a shortparagraph about Krispy Kreme’s revenue duringthis time period.
102. REVENUE The total revenues (in millions of dollars) for Papa John’s International from 2000through 2007 are shown in the table.
A model that represents these data is given by
where represents the year, with corresponding to 2000. (Source: Papa John’sInternational)
(a) Use a graphing utility to create a scatter plot of thedata. Then graph the model in the same viewingwindow.
(b) How well does the model fit the data?
(c) Use a graphing utility to approximate any relativeextrema of the model over its domain.
(d) Use a graphing utility to approximate the intervalsover which the revenue for Papa John’s Internationalwas increasing and decreasing over its domain.
(e) Use the results of parts (c) and (d) to write a shortparagraph about the revenue for Papa John’sInternational during this time period.
103. TREE GROWTH The growth of a red oak tree isapproximated by the function
where is the height of the tree (in feet) and is its age (in years).
(a) Use a graphing utility to graph the function. (Hint:Use a viewing window in which and
(b) Estimate the age of the tree when it is growingmost rapidly. This point is called the point ofdiminishing returns because the increase in sizewill be less with each additional year.
(c) Using calculus, the point of diminishing returnscan also be found by finding the vertex of theparabola given by
Find the vertex of this parabola.
(d) Compare your results from parts (b) and (c).
104. REVENUE The total revenue (in millions ofdollars) for a company is related to its advertisingexpense by the function
where is the amount spent on advertising (in tens ofthousands of dollars). Use the graph of this function,shown in the figure on the next page, to estimate thepoint on the graph at which the function is increasingmost rapidly. This point is called the point of diminishing returns because any expense above thisamount will yield less return per dollar invested inadvertising.
x
0 � x � 400R �1
100,000��x3 � 600x 2�,
R
y � �0.009t2 � 0.274t � 0.458.
�5 � y � 60.)�10 � x � 45
�2 � t � 34�tG
G � �0.003t 3 � 0.137t2 � 0.458t � 0.839
t � 0t0 � t � 7,R � �0.5635t4 � 9.019t3 � 40.20t2 � 49.0t � 947,
R
t � 0t0 � t � 7,R � 3.0711t4 � 42.803t3 � 160.59t2 � 62.6t � 307,
R
Year Revenue, R
2000
2001
2002
2003
2004
2005
2006
2007
300.7
394.4
491.5
665.6
707.8
543.4
461.2
429.3
Year Revenue, R
2000
2001
2002
2003
2004
2005
2006
2007
944.7
971.2
946.2
917.4
942.4
968.8
1001.6
1063.6

FIGURE FOR 104
EXPLORATION
TRUE OR FALSE? In Exercises 105–107, determinewhether the statement is true or false. Justify your answer.
105. A fifth-degree polynomial can have five turning pointsin its graph.
106. It is possible for a sixth-degree polynomial to haveonly one solution.
107. The graph of the function given by
rises to the left and falls to the right.
109. GRAPHICAL REASONING Sketch a graph of thefunction given by Explain how the graph ofeach function differs (if it does) from the graph ofeach function Determine whether is odd, even, orneither.
(a) (b)
(c) (d)
(e) (f)
(g) (h)
110. THINK ABOUT IT For each function, identify thedegree of the function and whether the degree of thefunction is even or odd. Identify the leading coefficient and whether the leading coefficient is positive or negative. Use a graphing utility to grapheach function. Describe the relationship between thedegree of the function and the sign of the leading coef-ficient of the function and the right-hand and left-handbehavior of the graph of the function.
(a)
(b)
(c)
(d)
(e)
(f)
(g)
111. THINK ABOUT IT Sketch the graph of each polyno-mial function. Then count the number of zeros of thefunction and the numbers of relative minima and relative maxima. Compare these numbers with thedegree of the polynomial. What do you observe?
(a) (b)
(c)
112. Explore the transformations of the form
(a) Use a graphing utility to graph the functionsand
Determine whether the graphs are increasing ordecreasing. Explain.
(b) Will the graph of always be increasing ordecreasing? If so, is this behavior determined by
or Explain.
(c) Use a graphing utility to graph the function givenby Use the graphand the result of part (b) to determine whether can be written in the form
Explain.a�x � h�5 � k.H�x� �H
H�x� � x5 � 3x3 � 2x � 1.
k?a, h,
g
y2 �35�x � 2�5 � 3.y1 � �
13�x � 2�5 � 1
g�x� � a�x � h�5 � k.
f�x� � x5 � 16x
f�x� � x4 � 10x2 � 9f�x� � �x3 � 9x
f�x� � x2 � 3x � 2
f�x� � x4 � 3x2 � 2x � 1
f�x� � 2x2 � 3x � 4
f�x� � �x3 � 5x � 2
f�x� � �2x5 � x2 � 5x � 3
f�x� � 2x5 � 2x2 � 5x � 1
f�x� � x3 � 2x2 � x � 1
g�x� � � f � f ��x�g�x� � f �x3�4�g�x� �
12 f �x�g�x� � f �12x�
g�x� � �f�x�g�x� � f ��x�g�x� � f �x � 2�g�x� � f �x� � 2
gf.g
f �x� � x4.
f�x� � 2 � x � x2 � x3 � x4 � x5 � x6 � x7
Advertising expense(in tens of thousands of dollars)
Rev
enue
(in
mill
ions
of
dolla
rs)
x100 200 300 400
100150
50
200250300350
R
Section 2.2 Polynomial Functions of Higher Degree 149
108. CAPSTONE For each graph, describe a polynomialfunction that could represent the graph. (Indicate thedegree of the function and the sign of its leadingcoefficient.)
(a) (b)
(c) (d)
x
y
x
y
x
y
x
y

150 Chapter 2 Polynomial and Rational Functions
Long Division of Polynomials
In this section, you will study two procedures for dividing polynomials. Theseprocedures are especially valuable in factoring and finding the zeros of polynomialfunctions. To begin, suppose you are given the graph of
Notice that a zero of occurs at as shown in Figure 2.28. Because is a zeroof you know that is a factor of This means that there exists a second-degree polynomial such that
To find you can use long division, as illustrated in Example 1.
Long Division of Polynomials
Divide by and use the result to factor the polynomialcompletely.
Solution
Think
Think
Think
Multiply:
Subtract.
Multiply:
Subtract.
Multiply:
Subtract.
From this division, you can conclude that
and by factoring the quadratic you have
Note that this factorization agrees with the graph shown in Figure 2.28 in that the three-intercepts occur at and
Now try Exercise 11.
x �23.x � 2, x �
12,x
6x3 � 19x2 � 16x � 4 � �x � 2��2x � 1��3x � 2�.
6x2 � 7x � 2,
6x3 � 19x2 � 16x � 4 � �x � 2��6x2 � 7x � 2�
0
2�x � 2�. 2x � 4
2x � 4
�7x�x � 2�. �7x2 � 14x
�7x2 � 16x
6x2�x � 2�. 6x3 � 12x2
x � 2 ) 6x3 � 19x2 � 16x � 4
6x2 � 7x � 2
2xx
� 2.
�7x2
x� �7x.
6x3
x� 6x2.
x � 2,6x3 � 19x2 � 16x � 4
Example 1
q�x�,
f�x� � �x � 2� q�x�.
q�x�f�x�.�x � 2�f,
x � 2x � 2,f
f�x� � 6x3 � 19x2 � 16x � 4.
2.3 POLYNOMIAL AND SYNTHETIC DIVISION
What you should learn
• Use long division to divide polynomials by other polynomials.
• Use synthetic division to dividepolynomials by binomials of theform
• Use the Remainder Theorem andthe Factor Theorem.
Why you should learn it
Synthetic division can help you evaluate polynomial functions. Forinstance, in Exercise 85 on page 157,you will use synthetic division todetermine the amount donated tosupport higher education in theUnited States in 2010.
�x � k�.
x
( ), 0
( ), 0(2, 0)
2
1
3
2
y
1 3
−1
−2
−3
1
f(x) = 6x3 − 19x2 + 16x − 4
FIGURE 2.28
MBI
/Ala
my

Section 2.3 Polynomial and Synthetic Division 151
In Example 1, is a factor of the polynomial and thelong division process produces a remainder of zero. Often, long division will producea nonzero remainder. For instance, if you divide by you obtain thefollowing.
Quotient
Divisor Dividend
Remainder
In fractional form, you can write this result as follows.
RemainderDividend
Quotient
Divisor Divisor
This implies that
Multiply each side by
which illustrates the following theorem, called the Division Algorithm.
The Division Algorithm can also be written as
In the Division Algorithm, the rational expression is improper because thedegree of is greater than or equal to the degree of On the other hand, the rational expression is proper because the degree of is less thanthe degree of d�x�.
r�x�r�x��d�x�d�x�.f �x�
f �x��d�x�
f �x�d�x�
� q�x� �r�x�d�x�
.
�x � 1�.x2 � 3x � 5 � �x � 1�(x � 2� � 3
x2 � 3x � 5
x � 1� x � 2 �
3
x � 1
3
2x � 2
2x � 5
x2 � x
x � 1 ) x2 � 3x � 5
x � 2
x � 1,x2 � 3x � 5
6x3 � 19x2 � 16x � 4,x � 2
The Division Algorithm
If and are polynomials such that and the degree of is lessthan or equal to the degree of there exist unique polynomials and such that
Dividend Quotient
Divisor Remainder
where or the degree of is less than the degree of If the remainderis zero, divides evenly into f �x�.d�x�r�x�
d�x�.r�x�r�x� � 0
f �x� � d�x�q�x� � r�x�
r�x�q�x�f �x�,d�x�d�x� � 0,d�x�f �x�

152 Chapter 2 Polynomial and Rational Functions
Before you apply the Division Algorithm, follow these steps.
1. Write the dividend and divisor in descending powers of the variable.
2. Insert placeholders with zero coefficients for missing powers of the variable.
Long Division of Polynomials
Divide by
Solution
Because there is no -term or -term in the dividend, you need to line up thesubtraction by using zero coefficients (or leaving spaces) for the missing terms.
So, divides evenly into and you can write
Now try Exercise 17.
You can check the result of Example 2 by multiplying.
Long Division of Polynomials
Divide by
Solution
Begin by writing the dividend and divisor in descending powers of
Note that the first subtraction eliminated two terms from the dividend. When this happens, the quotient skips a term. You can write the result as
Now try Exercise 23.
2x4 � 4x3 � 5x2 � 3x � 2
x2 � 2x � 3� 2x2 � 1 �
x � 1
x2 � 2x � 3.
x � 1
x2 � 2x � 3
x2 � 3x � 2
2x4 � 4x3 � 6x2
x2 � 2x � 3 ) 2x4 � 4x3 � 5x2 � 3x � 2
2x2 � 1
x.
2x � 3 � x2.�5x2 � 2 � 3x � 2x4 � 4x3
Example 3
�x � 1��x2 � x � 1� � x3 � x2 � x � x2 � x � 1 � x3 � 1
x � 1.x3 � 1
x � 1� x2 � x � 1,
x3 � 1,x � 1
0
x � 1
x � 1
x2 � x
x2 � 0x
x3 � x2
x � 1 ) x3 � 0x2 � 0x � 1
x2 � x � 1
xx2
x � 1.x3 � 1
Example 2
You can check a long divisionproblem by multiplying. Youcan review the techniques formultiplying polynomials inAppendix A.3.
k a b c d
ka
a r Remainder
Coefficients of quotient
Coefficients of dividend
Synthetic Division
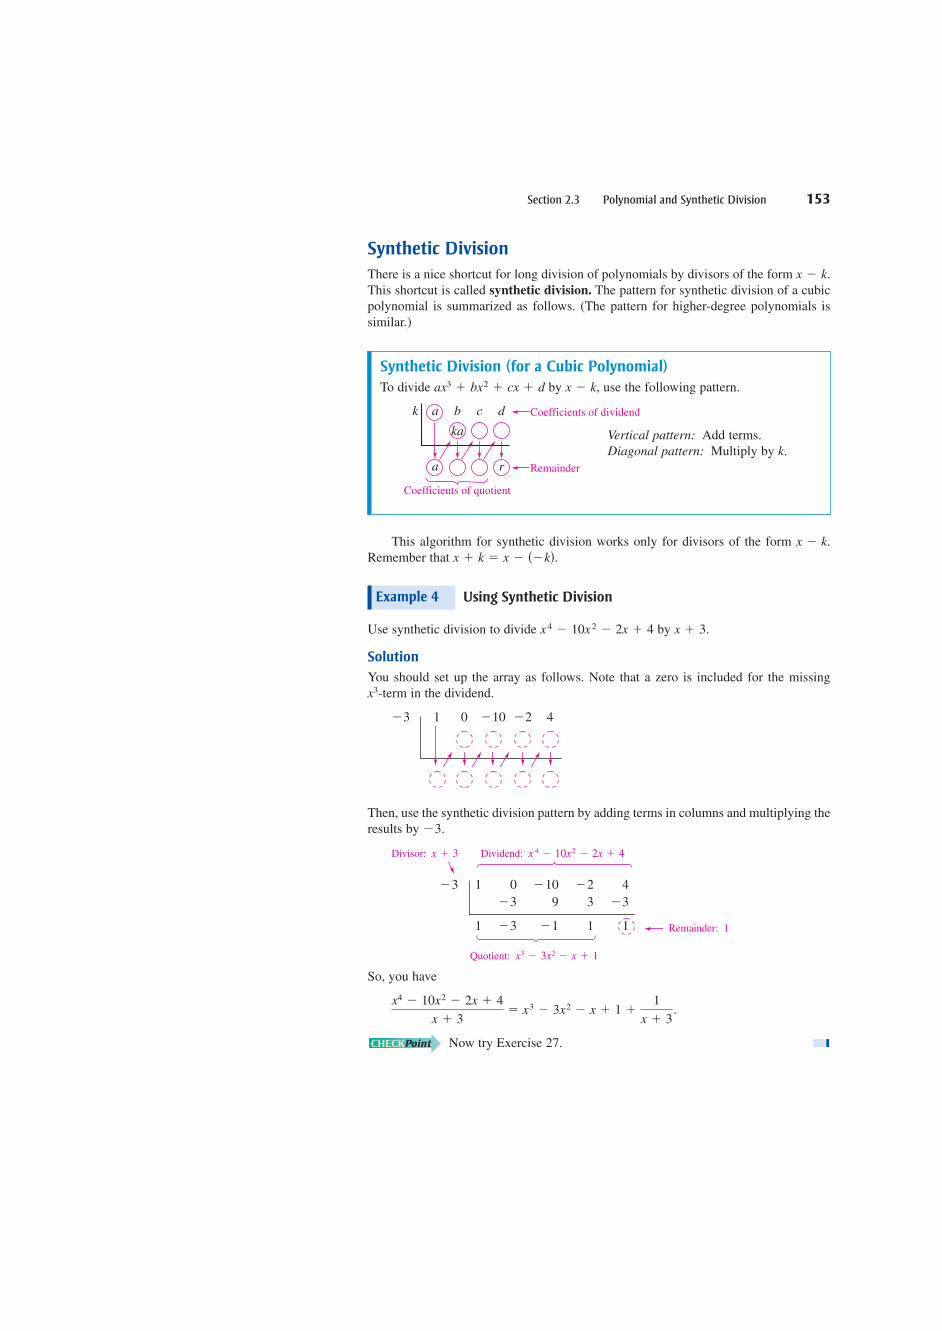
There is a nice shortcut for long division of polynomials by divisors of the form This shortcut is called synthetic division. The pattern for synthetic division of a cubicpolynomial is summarized as follows. (The pattern for higher-degree polynomials issimilar.)
This algorithm for synthetic division works only for divisors of the form Remember that
Using Synthetic Division
Use synthetic division to divide by
Solution
You should set up the array as follows. Note that a zero is included for the missing -term in the dividend.
1 0 4
Then, use the synthetic division pattern by adding terms in columns and multiplying theresults by
Divisor: Dividend:
Quotient:
So, you have
Now try Exercise 27.
x4 � 10x2 � 2x � 4
x � 3� x3 � 3x2 � x � 1 �
1
x � 3.
x3 � 3x2 � x � 1
�3 1
1
0�3
�3
�109
�1
�23
1
4�3
1
x 4 � 10x2 � 2x � 4x � 3
�3.
�2�10�3
x3
x � 3.x4 � 10x2 � 2x � 4
Example 4
x � k � x � ��k�.x � k.
x � k.
Synthetic Division (for a Cubic Polynomial)
To divide by use the following pattern.
Vertical pattern: Add terms.Diagonal pattern: Multiply by k.
x � k,ax3 � bx2 � cx � d
Remainder: 1
Section 2.3 Polynomial and Synthetic Division 153

154 Chapter 2 Polynomial and Rational Functions
The Remainder and Factor Theorems
The remainder obtained in the synthetic division process has an importantinterpretation, as described in the Remainder Theorem.
For a proof of the Remainder Theorem, see Proofs in Mathematics on page 211.The Remainder Theorem tells you that synthetic division can be used to evaluate a
polynomial function. That is, to evaluate a polynomial function when divideby The remainder will be as illustrated in Example 5.
Using the Remainder Theorem
Use the Remainder Theorem to evaluate the following function at
Solution
Using synthetic division, you obtain the following.
Because the remainder is you can conclude that
This means that is a point on the graph of You can check this by substituting in the original function.
Check
Now try Exercise 55.
Another important theorem is the Factor Theorem, stated below. This theoremstates that you can test to see whether a polynomial has as a factor by evaluatingthe polynomial at If the result is 0, is a factor.
For a proof of the Factor Theorem, see Proofs in Mathematics on page 211.
�x � k�x � k.�x � k�
� 3��8� � 8�4� � 10 � 7 � �9
f ��2� � 3��2�3 � 8��2�2 � 5��2� � 7
x � �2f.��2, �9�
r � f �k�f ��2� � �9.
r � �9,
�2 3
3
8�6
2
5�4
1
�7�2
�9
f �x� � 3x3 � 8x2 � 5x � 7
x � �2.
Example 5
f �k�,x � k.f �x�x � k,f �x�
The Remainder Theorem
If a polynomial is divided by the remainder is
r � f �k�.
x � k,f �x�
The Factor Theorem
A polynomial has a factor if and only if f �k� � 0.�x � k�f �x�

Factoring a Polynomial: Repeated Division
Show that and are factors of Then find the remaining factors of f �x�.
f�x� � 2x4 � 7x3 � 4x2 � 27x � 18.�x � 3��x � 2�
Example 6
Algebraic Solution
Using synthetic division with the factor you obtain the following.
Take the result of this division and perform synthetic division againusing the factor
Because the resulting quadratic expression factors as
the complete factorization of is
Now try Exercise 67.
f�x� � �x � 2��x � 3��2x � 3��x � 1�.
f �x�
2x2 � 5x � 3 � �2x � 3��x � 1�
2x2 � 5x � 3
�3 2
2
11�6
5
18�15
3
9�9
0
�x � 3�.
2 2
2
74
11
�422
18
�2736
9
�1818
0
�x � 2�,
0 remainder, so and is a factor.�x � 3�
f ��3� � 0
0 remainder, so and is a factor.�x � 2�
f �2� � 0
Graphical Solution
From the graph of you can see that there are four -intercepts (see Figure2.29). These occur at and
(Check this algebraically.) This implies thatand are factors of
Note that and are equivalent
factors because they both yield the same zero,
FIGURE 2.29
x−4 −1 1 3 4
10
20
30
40
−20
−30
−40
y
(2, 0)
(−1, 0)(−3, 0)
32( (− , 0
f(x) = 2x4 + 7x3 − 4x2 − 27x − 18
x � �32.
�2x � 3��x �32�f�x�.
�x � 2��x � 1�,�x �32�,�x � 3�,
x � 2.x � �1,x � �
32,x � �3,
xf�x� � 2x4 � 7x3 � 4x2 � 27x � 18,
Uses of the Remainder in Synthetic Division
The remainder obtained in the synthetic division of by provides thefollowing information.
1. The remainder gives the value of at That is,
2. If is a factor of
3. If is an -intercept of the graph of f.xr � 0, �k, 0�
f �x�.r � 0, �x � k�
r � f �k�.x � k.fr
x � k,f �x�r,
Note in Example 6 that the complete factorization of implies that has fourreal zeros: and This is confirmed by the graphof which is shown in the Figure 2.29.f,
x � �1.x � �32,x � �3,x � 2,
ff�x�
Throughout this text, the importance of developing several problem-solving strategies is emphasized. In the exercises for this section, try using more than one strategy to solve several of the exercises. For instance, if you find that dividesevenly into (with no remainder), try sketching the graph of You should find that
is an -intercept of the graph.x�k, 0�f.f �x�
x � k
Section 2.3 Polynomial and Synthetic Division 155
156 Chapter 2 Polynomial and Rational Functions
EXERCISES See www.CalcChat.com for worked-out solutions to odd-numbered exercises.2.3VOCABULARY1. Two forms of the Division Algorithm are shown below. Identify and label each term or function.
In Exercises 2–6, fill in the blanks.
2. The rational expression is called ________ if the degree of the numerator is greater than or equal to that of the denominator, and is called ________ if the degree of the numerator is less than that of the denominator.
3. In the Division Algorithm, the rational expression is ________ because the degree of is greater than orequal to the degree of
4. An alternative method to long division of polynomials is called ________ ________, in which the divisor must be of the form
5. The ________ Theorem states that a polynomial has a factor if and only if
6. The ________ Theorem states that if a polynomial is divided by the remainder is
SKILLS AND APPLICATIONS
r � f �k�.x � k,f �x�f �k� � 0.�x � k�f �x�
x � k.
d�x�.f�x�f�x��d�x�
p�x��q�x�
f �x�d�x� � q�x� �
r�x�d�x�f �x� � d�x�q�x� � r�x�
ANALYTICAL ANALYSIS In Exercises 7 and 8, use longdivision to verify that
7.
8.
GRAPHICAL ANALYSIS In Exercises 9 and 10, (a) use agraphing utility to graph the two equations in the same view-ing window, (b) use the graphs to verify that the expressions are equivalent, and (c) use long division to verify the resultsalgebraically.
9.
10.
In Exercises 11–26, use long division to divide.
11.
12.
13.
14.
15.
16.
17. 18.
19. 20.
21. 22.
23.
24.
25. 26.
In Exercises 27– 46, use synthetic division to divide.
27.
28.
29.
30.
31.
32.
33.
34.
35.
36.
37. 38.
39. 40.
41. 42.
43. 44.
45.
46.3x3 � 4x2 � 5
x �32
4x3 � 16x2 � 23x � 15
x �12
5 � 3x � 2x2 � x3
x � 1
180x � x4
x � 6
�3x4
x � 2
�3x4
x � 2
x3 � 729x � 9
x3 � 512
x � 8
x5 � 13x4 � 120x � 80
x � 3
10x4 � 50x3 � 800
x � 6
�5x3 � 6x � 8� �x � 2��5x3 � 6x2 � 8� �x � 4��3x3 � 16x2 � 72� �x � 6���x3 � 75x � 250� �x � 10��9x3 � 16x � 18x2 � 32� �x � 2��4x3 � 9x � 8x2 � 18� �x � 2��2x3 � 14x2 � 20x � 7� �x � 6��6x3 � 7x2 � x � 26� �x � 3��5x3 � 18x2 � 7x � 6� �x � 3��3x3 � 17x2 � 15x � 25� �x � 5�
2x3 � 4x2 � 15x � 5
�x � 1�2x4
�x � 1�3
�5x3 � 16 � 20x � x4� �x2 � x � 3�
�3x � 2x3 � 9 � 8x2� �x2 � 1��x5 � 7� �x3 � 1��x3 � 9� �x2 � 1��8x � 5� �2x � 1��7x � 3� �x � 2��x3 � 125� �x � 5��x3 � 27� �x � 3�
�x3 � 4x2 � 3x � 12� �x � 3��x4 � 5x3 � 6x2 � x � 2� �x � 2��6x3 � 16x2 � 17x � 6� �3x � 2��4x3 � 7x2 � 11x � 5� �4x � 5��5x2 � 17x � 12� �x � 4��2x2 � 10x � 12� �x � 3�
y2 � x2 �1
x2 � 1y1 �
x4 � x2 � 1x2 � 1
,
y2 � x � 1 �2
x � 3y1 �
x2 � 2x � 1x � 3
,
y2 � x2 � 8 �39
x2 � 5y1 �
x4 � 3x2 � 1
x2 � 5,
y2 � x � 2 �4
x � 2y1 �
x2
x � 2,
y1 � y2.
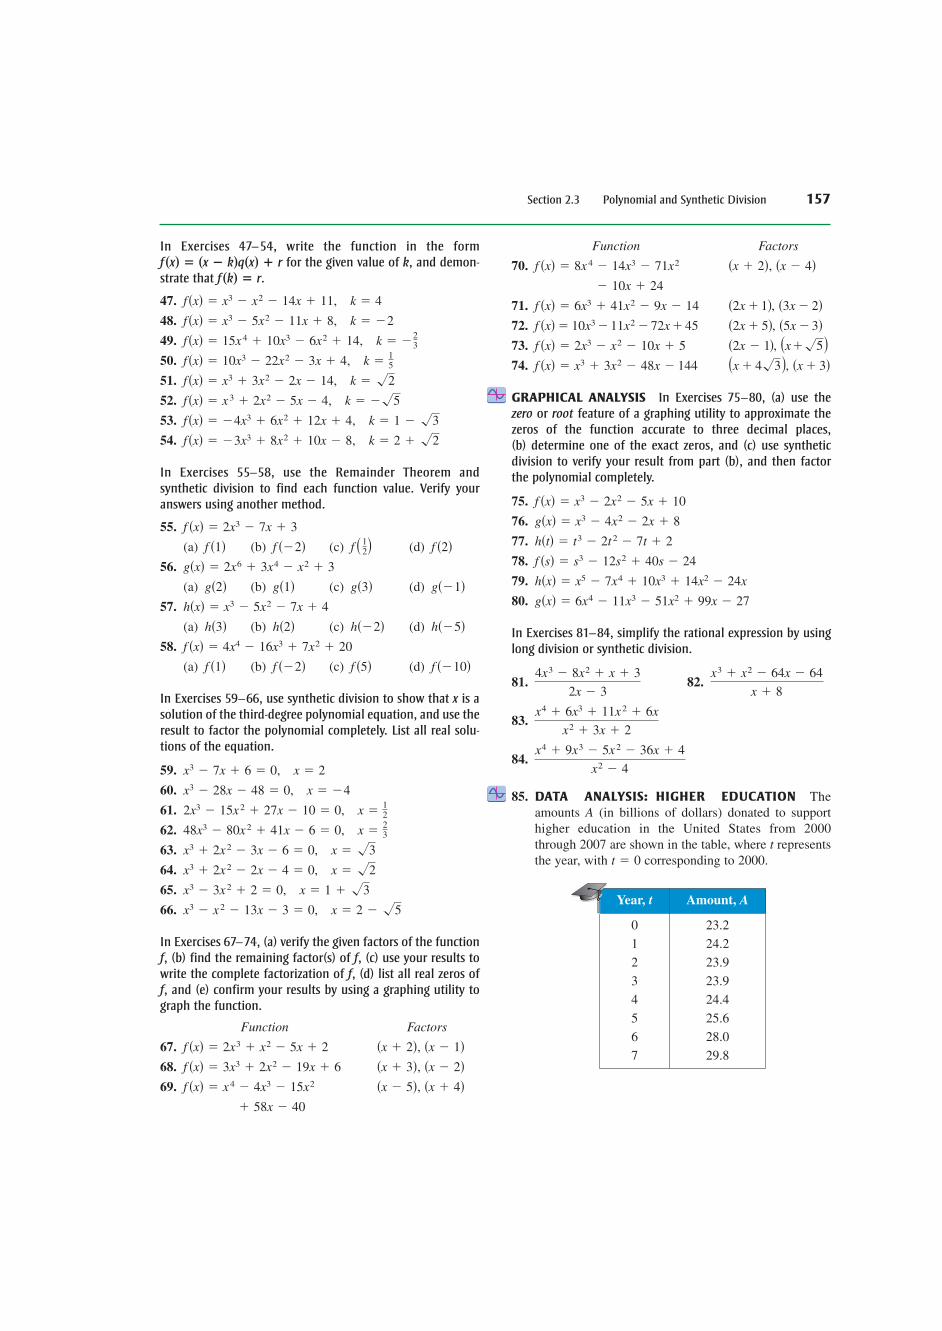
Section 2.3 Polynomial and Synthetic Division 157
In Exercises 47–54, write the function in the formfor the given value of and demon-
strate that
47.
48.
49.
50.
51.
52.
53.
54.
In Exercises 55–58, use the Remainder Theorem and synthetic division to find each function value. Verify youranswers using another method.
55.
(a) (b) (c) (d)
56.
(a) (b) (c) (d)
57.
(a) (b) (c) (d)
58.
(a) (b) (c) (d)
In Exercises 59–66, use synthetic division to show that is asolution of the third-degree polynomial equation, and use theresult to factor the polynomial completely. List all real solu-tions of the equation.
59.
60.
61.
62.
63.
64.
65.
66.
In Exercises 67–74, (a) verify the given factors of the function(b) find the remaining factor(s) of (c) use your results to
write the complete factorization of (d) list all real zeros ofand (e) confirm your results by using a graphing utility to
graph the function.
Function Factors
67.
68.
69.
Function Factors
70.
71.
72.
73.
74.
GRAPHICAL ANALYSIS In Exercises 75–80, (a) use thezero or root feature of a graphing utility to approximate thezeros of the function accurate to three decimal places, (b) determine one of the exact zeros, and (c) use syntheticdivision to verify your result from part (b), and then factorthe polynomial completely.
75.
76.
77.
78.
79.
80.
In Exercises 81–84, simplify the rational expression by usinglong division or synthetic division.
81. 82.
83.
84.
85. DATA ANALYSIS: HIGHER EDUCATION Theamounts (in billions of dollars) donated to supporthigher education in the United States from 2000through 2007 are shown in the table, where representsthe year, with corresponding to 2000.t � 0
t
A
x4 � 9x3 � 5x2 � 36x � 4
x2 � 4
x4 � 6x3 � 11x2 � 6x
x2 � 3x � 2
x3 � x2 � 64x � 64
x � 8
4x3 � 8x2 � x � 3
2x � 3
g�x� � 6x4 � 11x3 � 51x2 � 99x � 27
h�x� � x5 � 7x4 � 10x3 � 14x2 � 24x
f �s� � s3 � 12s2 � 40s � 24
h�t� � t3 � 2t2 � 7t � 2
g�x� � x3 � 4x2 � 2x � 8
f �x� � x3 � 2x2 � 5x � 10
�x � 3��x � 4 3�,f �x� � x3 � 3x2 � 48x � 144
�x� 5��2x � 1�,f �x� � 2x3 � x2 � 10x � 5
�5x � 3��2x � 5�,f �x�� 10x3 � 11x2 � 72x � 45
�3x � 2��2x � 1�,f �x� � 6x3 � 41x2 � 9x � 14
� 10x � 24
�x � 4��x � 2�,f �x� � 8x4 � 14x3 � 71x2
� 58x � 40
�x � 4��x � 5�,f �x� � x4 � 4x3 � 15x2
�x � 2��x � 3�,f �x� � 3x3 � 2x2 � 19x � 6
�x � 1��x � 2�,f �x� � 2x3 � x2 � 5x � 2
f,f,f,f,
x � 2 � 5x3 � x2 � 13x � 3 � 0,
x � 1 � 3x3 � 3x2 � 2 � 0,
x � 2x3 � 2x2 � 2x � 4 � 0,
x � 3x3 � 2x2 � 3x � 6 � 0,
x �2348x3 � 80x2 � 41x � 6 � 0,
x �122x3 � 15x2 � 27x � 10 � 0,
x � �4x3 � 28x � 48 � 0,
x � 2x3 � 7x � 6 � 0,
x
f ��10�f �5�f ��2�f �1�f �x� � 4x4 � 16x3 � 7x2 � 20
h��5�h��2�h�2�h�3�h�x� � x3 � 5x2 � 7x � 4
g��1�g�3�g�1�g�2�g�x� � 2x6 � 3x4 � x2 � 3
f �2�f � 12�f ��2�f �1�
f �x� � 2x3 � 7x � 3
k � 2 � 2f�x� � �3x3 � 8x2 � 10x � 8,
k � 1 � 3f�x� � �4x3 � 6x2 � 12x � 4,
k � � 5f�x� � x3 � 2x2 � 5x � 4,
k � 2f�x� � x3 � 3x2 � 2x � 14,
k �15f�x� � 10x3 � 22x2 � 3x � 4,
k � �23f�x� � 15x4 � 10x3 � 6x2 � 14,
k � �2f�x� � x3 � 5x2 � 11x � 8,
k � 4f�x� � x3 � x2 � 14x � 11,
f�k� � r.k,f�x� � �x � k�q�x� � r
Year, t Amount, A
0
1
2
3
4
5
6
7
23.2
24.2
23.9
23.9
24.4
25.6
28.0
29.8

158 Chapter 2 Polynomial and Rational Functions
(a) Use a graphing utility to create a scatter plot of thedata.
(b) Use the regression feature of the graphing utility tofind a cubic model for the data. Graph the model inthe same viewing window as the scatter plot.
(c) Use the model to create a table of estimated valuesof Compare the model with the original data.
(d) Use synthetic division to evaluate the model for theyear 2010. Even though the model is relativelyaccurate for estimating the given data, would youuse this model to predict the amount donated tohigher education in the future? Explain.
86. DATA ANALYSIS: HEALTH CARE The amounts (in billions of dollars) of national health care expendi-tures in the United States from 2000 through 2007 areshown in the table, where represents the year, with
corresponding to 2000.
(a) Use a graphing utility to create a scatter plot of thedata.
(b) Use the regression feature of the graphing utility tofind a cubic model for the data. Graph the model inthe same viewing window as the scatter plot.
(c) Use the model to create a table of estimated valuesof Compare the model with the original data.
(d) Use synthetic division to evaluate the model for theyear 2010.
EXPLORATION
TRUE OR FALSE? In Exercises 87–89, determine whetherthe statement is true or false. Justify your answer.
87. If is a factor of some polynomial function then is a zero of
88. is a factor of the polynomial
89. The rational expression
is improper.
90. Use the form to create a cubicfunction that (a) passes through the point and risesto the right, and (b) passes through the point and falls to the right. (There are many correct answers.)
THINK ABOUT IT In Exercises 91 and 92, perform thedivision by assuming that is a positive integer.
91. 92.
93. WRITING Briefly explain what it means for a divisorto divide evenly into a dividend.
94. WRITING Briefly explain how to check polynomialdivision, and justify your reasoning. Give an example.
EXPLORATION In Exercises 95 and 96, find the constant such that the denominator will divide evenly into the numerator.
95. 96.
97. THINK ABOUT IT Find the value of such thatis a factor of
98. THINK ABOUT IT Find the value of such thatis a factor of
99. WRITING Complete each polynomial division.Write a brief description of the pattern that you obtain,and use your result to find a formula for the polynomial division Create anumerical example to test your formula.
(a) (b)
(c)x4 � 1x � 1
� �
x3 � 1x � 1
� �x2 � 1x � 1
� �
�xn � 1���x � 1�.
x3 � kx2 � 2kx � 12.x � 3k
x3 � kx2 � 2kx � 8.x � 4k
x5 � 2x2 � x � c
x � 2
x3 � 4x2 � 3x � c
x � 5
c
x3n � 3x2n � 5xn � 6
xn � 2
x3n � 9x2n � 27xn � 27
xn � 3
n
��3, 1��2, 5�
f �x� � �x � k�q�x� � r
x3 � 2x2 � 13x � 10x2 � 4x � 12
6x6 � x5 � 92x4 � 45x3 � 184x2 � 4x � 48.
�2x � 1�f.4
7
f,�7x � 4�
A.
t � 0t
A
A.
Year, t Amount, A
0
1
2
3
4
5
6
7
30.5
32.2
34.2
38.0
42.7
47.9
52.7
57.6
100. CAPSTONE Consider the division
where
(a) What is the remainder when Explain.
(b) If it is necessary to find it is easier to evaluate the function directly or to use syntheticdivision? Explain.
f �2�,k � �3?
f�x� � �x � 3)2�x � 3��x � 1�3.
f�x� �x � k�

Section 2.4 Complex Numbers 159
The Imaginary Unit iYou have learned that some quadratic equations have no real solutions. For instance, thequadratic equation has no real solution because there is no real number thatcan be squared to produce To overcome this deficiency, mathematicians created an expanded system of numbers using the imaginary unit i, defined as
Imaginary unit
where By adding real numbers to real multiples of this imaginary unit, the setof complex numbers is obtained. Each complex number can be written in the standard form For instance, the standard form of the complex number
is because
In the standard form the real number is called the real part of the complexnumber and the number (where is a real number) is called the imaginarypart of the complex number.
The set of real numbers is a subset of the set of complex numbers, as shown in Figure2.30. This is true because every real number can be written as a complex number using
That is, for every real number you can write
FIGURE 2.30
Realnumbers
Imaginarynumbers
Complexnumbers
a � a � 0i.a,b � 0.a
bbia � bi,aa � bi,
�5 � �9 � �5 � 32��1� � �5 � 3 �1 � �5 � 3i.
�5 � 3i�5 � �9a � bi.
i2 � �1.
i � �1
�1.xx2 � 1 � 0
2.4 COMPLEX NUMBERS
What you should learn
• Use the imaginary unit i to writecomplex numbers.
• Add, subtract, and multiply complexnumbers.
• Use complex conjugates to write thequotient of two complex numbers instandard form.
• Find complex solutions of quadraticequations.
Why you should learn it
You can use complex numbers tomodel and solve real-life problems inelectronics. For instance, in Exercise89 on page 165, you will learn how touse complex numbers to find theimpedance of an electrical circuit.
Definition of a Complex Number
If and are real numbers, the number is a complex number, and it issaid to be written in standard form. If the number is a realnumber. If the number is called an imaginary number. A numberof the form where is called a pure imaginary number.b � 0,bi,
a � bib � 0,a � bi � ab � 0,
a � biba
Equality of Complex Numbers
Two complex numbers and written in standard form, are equal toeach other
Equality of two complex numbers
if and only if and b � d.a � c
a � bi � c � di
c � di,a � bi
© R
icha
rd M
egna
/Fun
dam
enta
l Pho
togr
aphs

160 Chapter 2 Polynomial and Rational Functions
Operations with Complex Numbers
To add (or subtract) two complex numbers, you add (or subtract) the real and imaginaryparts of the numbers separately.
The additive identity in the complex number system is zero (the same as in thereal number system). Furthermore, the additive inverse of the complex number is
Additive inverse
So, you have
Adding and Subtracting Complex Numbers
a. Remove parentheses.
Group like terms.
Write in standard form.
b. Remove parentheses.
Group like terms.
Simplify.
Write in standard form.
c.
d.
Now try Exercise 21.
Note in Examples 1(b) and 1(d) that the sum of two complex numbers can be a realnumber.
� 0
� 0 � 0i
� �3 � 4 � 7� � �2i � i � i�
�3 � 2i� � �4 � i� � �7 � i� � 3 � 2i � 4 � i � 7 � i
� �5i
� 0 � 5i
� �2 � 2� � �3i � 3i � 5i�
3i � ��2 � 3i� � �2 � 5i� � 3i � 2 � 3i � 2 � 5i
� �3
� �3 � 0
� �1 � 4� � �2i � 2i�
(1 � 2i) � �4 � 2i� � 1 � 2i � 4 � 2i
� 5 � i
� (4 � 1) � (7i � 6i)
�4 � 7i� � �1 � 6i� � 4 � 7i � 1 � 6i
Example 1
�a � bi� � ��a � bi� � 0 � 0i � 0.
�(a � bi) � �a � bi.
a � bi
Addition and Subtraction of Complex Numbers
If and are two complex numbers written in standard form, theirsum and difference are defined as follows.
Sum:
Difference: �a � bi� � �c � di� � �a � c� � �b � d�i
�a � bi� � �c � di� � �a � c� � �b � d�i
c � dia � bi

Section 2.4 Complex Numbers 161
Many of the properties of real numbers are valid for complex numbers as well.Here are some examples.
Associative Properties of Addition and Multiplication
Commutative Properties of Addition and Multiplication
Distributive Property of Multiplication Over Addition
Notice below how these properties are used when two complex numbers are multiplied.
Distributive Property
Distributive Property
Commutative Property
Associative Property
Rather than trying to memorize this multiplication rule, you should simply rememberhow the Distributive Property is used to multiply two complex numbers.
Multiplying Complex Numbers
a. Distributive Property
Simplify.
b. Distributive Property
Distributive Property
Group like terms.
Write in standard form.
c. Distributive Property
Distributive Property
Simplify.
Write in standard form.
d. Square of a binomial
Distributive Property
Distributive Property
Simplify.
Write in standard form.
Now try Exercise 31.
� 5 � 12i
� 9 � 12i � 4
i2 � �1� 9 � 6i � 6i � 4��1�
� 9 � 6i � 6i � 4i2
� 3�3 � 2i� � 2i�3 � 2i�
�3 � 2i�2 � �3 � 2i��3 � 2i�
� 13
� 9 � 4
i2 � �1� 9 � 6i � 6i � 4��1�
� 9 � 6i � 6i � 4i2
(3 � 2i)(3 � 2i) � 3�3 � 2i� � 2i�3 � 2i�
� 11 � 2i
� �8 � 3� � �6i � 4i�
i2 � �1� 8 � 6i � 4i � 3��1�
� 8 � 6i � 4i � 3i2
�2 � i��4 � 3i� � 2�4 � 3i� � i�4 � 3i�
� �8 � 12i
4��2 � 3i� � 4��2� � 4�3i�
Example 2
� �ac � bd� � �ad � bc�i
� ac � bd � �ad �i � �bc�i
i2 � �1� ac � �ad �i � �bc�i � �bd ���1�
� ac � �ad�i � �bc�i � �bd�i2
�a � bi��c � di� � a�c � di� � bi�c � di�
The procedure described above is similar to multiplying twopolynomials and combining liketerms, as in the FOIL Methodshown in Appendix A.3. Forinstance, you can use the FOILMethod to multiply the two complex numbers from Example 2(b).
F O I L
�2 � i��4 � 3i�� 8 � 6i � 4i � 3i2

162 Chapter 2 Polynomial and Rational Functions
Complex Conjugates
Notice in Example 2(c) that the product of two complex numbers can be a real number. This occurs with pairs of complex numbers of the form and called complex conjugates.
Multiplying Conjugates
Multiply each complex number by its complex conjugate.
a. b.
Solution
a. The complex conjugate of is
b. The complex conjugate of is
Now try Exercise 41.
To write the quotient of and in standard form, where and are notboth zero, multiply the numerator and denominator by the complex conjugate of thedenominator to obtain
Standard form
Writing a Quotient of Complex Numbers in Standard Form
Expand.
Simplify.
Write in standard form.
Now try Exercise 53.
�1
10�
4
5i
�2 � 16i
20
i2 � �1�8 � 6 � 16i
16 � 4
�8 � 4i � 12i � 6i2
16 � 4i2
2 � 3i
4 � 2i�
2 � 3i
4 � 2i�4 � 2i
4 � 2i�
Example 4
��ac � bd� � �bc � ad�i
c2 � d2.
a � bi
c � di�
a � bi
c � di �c � di
c � di�
dcc � dia � bi
� 25� 16 � 9��1�� 16 � 9i2�4 � 3i��4 � 3i� � 42 � �3i�24 � 3i.4 � 3i
� 2� 1 � ��1��1 � i��1 � i� � 12 � i2
1 � i.1 � i
4 � 3i1 � i
Example 3
� a2 � b2
� a2 � b2��1�
�a � bi��a � bi�� a2 � abi � abi � b2i2
a � bi,a � bi
Note that when you multiply thenumerator and denominator of aquotient of complex numbers by
you are actually multiplying thequotient by a form of 1. You are not changing the originalexpression, you are only creatingan expression that is equivalentto the original expression.
c � dic � di
You can compare complex conjugates with the method forrationalizing denominators inAppendix A.2.
Multiply numerator and denominator bycomplex conjugate of denominator.

Section 2.4 Complex Numbers 163
Complex Solutions of Quadratic Equations
When using the Quadratic Formula to solve a quadratic equation, you often obtain aresult such as which you know is not a real number. By factoring out you can write this number in standard form.
The number is called the principal square root of
Writing Complex Numbers in Standard Form
a.
b.
c.
Now try Exercise 63.
Complex Solutions of a Quadratic Equation
Solve (a) and (b)
Solution
a. Write original equation.
Subtract 4 from each side.
Extract square roots.
b. Write original equation.
Quadratic Formula
Simplify.
Write in standard form.
Write in standard form.
Now try Exercise 69.
�1
3± 14
3i
�56�2 ± 2 14 i
6
�2 ± �56
6
x ����2� ± ��2�2 � 4�3��5�
2�3�
3x2 � 2x � 5 � 0
x � ±2i
x2 � �4
x2 � 4 � 0
3x2 � 2x � 5 � 0.x2 � 4 � 0
Example 6
� �2 � 2 3 i
� 1 � 2 3 i � 3��1�
� ��1�2 � 2 3 i � � 3 �2�i2�
��1 � �3 �2 � ��1 � 3 i�2 �48 � �27 � 48 i � 27 i � 4 3 i � 3 3 i � 3 i
�3 �12 � 3 i 12 i � 36 i2 � 6��1� � �6
Example 5
�3. 3 i
�3 � 3��1� � 3 �1 � 3 i
i � �1, �3,
Principal Square Root of a Negative Number
If is a positive number, the principal square root of the negative number is defined as
�a � ai.
�aa
You can review the techniquesfor using the Quadratic Formulain Appendix A.5.
WARNING / CAUTIONThe definition of principalsquare root uses the rule
for and This rule is not valid if both and are negative. For example,
whereas
To avoid problems with squareroots of negative numbers,be sure to convert complex numbers to standard form before multiplying.
��5���5� � 25 � 5.
� 5i2 � �5
� 25i2
� 5i 5 i
�5 �5 � 5��1� 5��1�
bab < 0.a > 0
ab � a b

164 Chapter 2 Polynomial and Rational Functions
EXERCISES See www.CalcChat.com for worked-out solutions to odd-numbered exercises.2.4VOCABULARY1. Match the type of complex number with its definition.
(a) Real number (i)
(b) Imaginary number (ii)
(c) Pure imaginary number (iii)
In Exercises 2–4, fill in the blanks.
2. The imaginary unit is defined as ________, where ________.
3. If is a positive number, the ________ ________ root of the negative number is defined as
4. The numbers and are called ________ ________, and their product is a real number
SKILLS AND APPLICATIONS
a2 � b2.a � bia � bi
�a � a i.�aa
i2 �i �i
b � 0a � bi,
b � 0a � 0,a � bi,
b � 0a � 0,a � bi,
In Exercises 5– 8, find real numbers and such that theequation is true.
5. 6.
7.
8.
In Exercises 9–20, write the complex number in standardform.
9. 10.
11. 12.13. 14.
15. 14 16. 75
17. 18.19. 20.
In Exercises 21–30, perform the addition or subtraction andwrite the result in standard form.
21. 22.
23. 24.
25.
26.
27.
28.
29.
30.
In Exercises 31– 40, perform the operation and write theresult in standard form.
31. 32.
33. 34.
35.
36.
37. 38.
39. 40.
In Exercises 41– 48, write the complex conjugate of the complex number. Then multiply the number by its complexconjugate.
41. 42.
43. 44.
45. 46.47. 48.
In Exercises 49–58, write the quotient in standard form.
49. 50.
51. 52.
53. 54.
55. 56.
57. 58.
In Exercises 59–62, perform the operation and write theresult in standard form.
59.
60.
61.
62.1 � i
i�
3
4 � i
i
3 � 2i�
2i
3 � 8i
2i
2 � i�
5
2 � i
2
1 � i�
3
1 � i
5i
�2 � 3i�23i
�4 � 5i�2
8 � 16i
2i
9 � 4i
i
6 � 7i
1 � 2i
5 � i
5 � i
13
1 � i
2
4 � 5i
�14
2i
3
i
1 � 8 6
�15 �20
�3 � 2 i�1 � 5 i
8 � 10i9 � 2i
�1 � 2i�2 � �1 � 2i�2�2 � 3i�2 � �2 � 3i�2�5 � 4i�2�6 � 7i�2
� 3 � 15 i�� 3 � 15 i�� 14 � 10 i�� 14 � 10 i�
�8i�9 � 4i�12i�1 � 9i��7 � 2i��3 � 5i��1 � i��3 � 2i�
�1.6 � 3.2i� � ��5.8 � 4.3i��� 3
2 �52i� � � 5
3 �113 i�
25 � ��10 � 11i� � 15i
13i � �14 � 7i��8 � �18 � � �4 � 3 2 i���2 � �8 � � �5 � �50 �
�3 � 2i� � �6 � 13i��9 � i� � �8 � i��13 � 2i�� ��5 � 6i��7 � i� � �3 � 4i�
�0.0049 �0.09
�4i2 � 2i�10i � i2
�4 �80
1 � �82 � �27
5 � �368 � �25
�a � 6� � 2bi � 6 � 5i
�a � 1� � �b � 3�i � 5 � 8i
a � bi � 13 � 4ia � bi � �12 � 7i
ba

Section 2.4 Complex Numbers 165
In Exercises 63–68, write the complex number in standardform.
63. 64.
65. 66.
67. 68.
In Exercises 69–78, use the Quadratic Formula to solve thequadratic equation.
69. 70.
71. 72.
73. 74.
75. 76.
77. 78.
In Exercises 79–88, simplify the complex number and writeit in standard form.
79. 80.
81. 82.
83. 84.
85. 86.
87. 88.
89. IMPEDANCE The opposition to current in an electricalcircuit is called its impedance. The impedance in aparallel circuit with two pathways satisfies the equation
where is the impedance (in ohms) of pathway 1 andis the impedance of pathway 2.
(a) The impedance of each pathway in a parallel circuitis found by adding the impedances of all compo-nents in the pathway. Use the table to find and
(b) Find the impedance
90. Cube each complex number.
(a) 2 (b) (c)
91. Raise each complex number to the fourth power.
(a) 2 (b) (c) (d)
92. Write each of the powers of as or
(a) (b) (c) (d)
EXPLORATION
TRUE OR FALSE? In Exercises 93–96, determine whetherthe statement is true or false. Justify your answer.
93. There is no complex number that is equal to its complexconjugate.
94. is a solution of
95.
96. The sum of two complex numbers is always a realnumber.
97. PATTERN RECOGNITION Complete the following.
What pattern do you see? Write a brief description ofhow you would find raised to any positive integerpower.
99. ERROR ANALYSIS Describe the error.
100. PROOF Prove that the complex conjugate of theproduct of two complex numbers and
is the product of their complex conjugates.
101. PROOF Prove that the complex conjugate of the sumof two complex numbers and is thesum of their complex conjugates.
a2 � b2ia1 � b1i
a2 � b2ia1 � b1i
�6 �6 � ��6���6� � 36 � 6
i
i12 � �i11 � �i10 � �i9 � �i8 � �i7 � �i6 � �i5 � �
i4 � 1i3 � �ii2 � �1i1 � i
i44 � i150 � i74 � i109 � i61 � �1
x4 � x2 � 14 � 56.�i 6
i 67i 50i 25i 40
�1.i, �i, 1,i
�2i2i�2
�1 � 3 i�1 � 3 i
20 Ω
10 Ω
16 Ω
9 Ω
1 2
z.
z2.z1
z2
z1
1z
�1z1
�1z2
z
��i�6�3i�4
1
�2i �31
i 3
� �2 �6� �72 �3��i�3�14i 5
4i 2 � 2i3�6i 3 � i 2
4.5x2 � 3x � 12 � 01.4x2 � 2x � 10 � 0
78 x2 �
34x �
516 � 03
2 x2 � 6x � 9 � 0
16t2 � 4t � 3 � 04x2 � 16x � 15 � 0
9x2 � 6x � 37 � 04x2 � 16x � 17 � 0
x2 � 6x � 10 � 0x2 � 2x � 2 � 0
�2 � �6�2�3 � �5��7 � �10�� �75�2� �15�2 �5 �10 �6 �2
Resistor Inductor Capacitor
SymbolaΩ bΩ cΩ
Impedance a bi �ci
98. CAPSTONE Consider the functions
and
(a) Without graphing either function, determinewhether the graph of and the graph of have -intercepts. Explain your reasoning.
(b) Solve and
(c) Explain how the zeros of and are related towhether their graphs have -intercepts.
(d) For the function make ageneral statement about how and affectwhether the graph of has -intercepts, andwhether the zeros of are real or complex.f
xfkh,a,
f �x� � a�x � h�2 � k,
xgf
g�x� � 0.f�x� � 0
xgf
g�x� � �2�x � 3�2 � 4.f�x� � 2�x � 3�2 � 4

166 Chapter 2 Polynomial and Rational Functions
2.5 ZEROS OF POLYNOMIAL FUNCTIONS
What you should learn
• Use the Fundamental Theorem ofAlgebra to determine the number of zeros of polynomial functions.
• Find rational zeros of polynomialfunctions.
• Find conjugate pairs of complexzeros.
• Find zeros of polynomials by factoring.
• Use Descartes’s Rule of Signs andthe Upper and Lower Bound Rulesto find zeros of polynomials.
Why you should learn it
Finding zeros of polynomial functionsis an important part of solving real-lifeproblems. For instance, in Exercise120 on page 179, the zeros of a polynomial function can help youanalyze the attendance at women’scollege basketball games.
The Fundamental Theorem of Algebra
You know that an th-degree polynomial can have at most real zeros. In the complexnumber system, this statement can be improved. That is, in the complex number system,every th-degree polynomial function has precisely zeros. This important result isderived from the Fundamental Theorem of Algebra, first proved by the Germanmathematician Carl Friedrich Gauss (1777–1855).
Using the Fundamental Theorem of Algebra and the equivalence of zeros and factors,you obtain the Linear Factorization Theorem.
For a proof of the Linear Factorization Theorem, see Proofs in Mathematics on page 212.
Note that the Fundamental Theorem of Algebra and the Linear FactorizationTheorem tell you only that the zeros or factors of a polynomial exist, not how to findthem. Such theorems are called existence theorems. Remember that the zeros of apolynomial function can be real or complex, and they may be repeated.
Zeros of Polynomial Functions
a. The first-degree polynomial has exactly one zero:
b. Counting multiplicity, the second-degree polynomial function
has exactly two zeros: and (This is called a repeated zero.)
c. The third-degree polynomial function
has exactly three zeros: and
d. The fourth-degree polynomial function
has exactly four zeros: and
Now try Exercise 9.
x � �i.x � i,x � �1,x � 1,
f �x� � x4 � 1 � �x � 1��x � 1��x � i��x � i�
x � �2i.x � 0, x � 2i,
f �x� � x3 � 4x � x�x2 � 4� � x�x � 2i��x � 2i�
x � 3.x � 3
f �x� � x2 � 6x � 9 � �x � 3��x � 3�
x � 2.f �x� � x � 2
Example 1
n
nn
nn
The Fundamental Theorem of Algebra
If is a polynomial of degree where then has at least one zero inthe complex number system.
fn > 0,n,f �x�
Linear Factorization Theorem
If is a polynomial of degree where then has precisely linear factors
where are complex numbers.c1, c2, . . . , cn
f �x� � an�x � c1��x � c2� . . . �x � cn�
nfn > 0,n,f �x�
Recall that in order to find thezeros of a function set equal to 0 and solve the resultingequation for For instance, thefunction in Example 1(a) has azero at because
x � 2.
x � 2 � 0
x � 2
x.
f �x�f �x�,
Examples 1(b), 1(c), and 1(d)involve factoring polynomials.You can review the techniquesfor factoring polynomials inAppendix A.3.

Section 2.5 Zeros of Polynomial Functions 167
The Rational Zero Test
The Rational Zero Test relates the possible rational zeros of a polynomial (having integer coefficients) to the leading coefficient and to the constant term of thepolynomial.
To use the Rational Zero Test, you should first list all rational numbers whosenumerators are factors of the constant term and whose denominators are factors of theleading coefficient.
Having formed this list of possible rational zeros, use a trial-and-error method to determine which, if any, are actual zeros of the polynomial. Note that when the leadingcoefficient is 1, the possible rational zeros are simply the factors of the constant term.
Rational Zero Test with Leading Coefficient of 1
Find the rational zeros of
Solution
Because the leading coefficient is 1, the possible rational zeros are the factors ofthe constant term. By testing these possible zeros, you can see that neither works.
So, you can conclude that the given polynomial has no rational zeros. Note from thegraph of in Figure 2.31 that does have one real zero between and 0. However, bythe Rational Zero Test, you know that this real zero is not a rational number.
Now try Exercise 15.
�1ff
� �1
f ��1� � ��1�3 � ��1� � 1
� 3
f �1� � �1�3 � 1 � 1
±1,
f �x� � x3 � x � 1.
Example 2
Possible rational zeros �factors of constant term
factors of leading coefficient
−3 −2 21 3x
−3
−2
−1
1
2
3
f(x) = x3 + x + 1y
FIGURE 2.31
The Rational Zero Test
If the polynomial has integer coefficients, every rational zero of has the form
where and have no common factors other than 1, and
q � a factor of the leading coefficient an.
p � a factor of the constant term a0
qp
Rational zero �p
q
fa1x � a0f �x� � anxn � an�1xn�1 � . . . � a2 x 2 �
Text not available due to copyrightrestrictions

168 Chapter 2 Polynomial and Rational Functions
Rational Zero Test with Leading Coefficient of 1
Find the rational zeros of
Solution
Because the leading coefficient is 1, the possible rational zeros are the factors of theconstant term.
Possible rational zeros:
By applying synthetic division successively, you can determine that and are the only two rational zeros.
So, factors as
Because the factor produces no real zeros, you can conclude that andare the only real zeros of which is verified in Figure 2.32.
FIGURE 2.32
Now try Exercise 19.
If the leading coefficient of a polynomial is not 1, the list of possible rational zeroscan increase dramatically. In such cases, the search can be shortened in several ways:(1) a programmable calculator can be used to speed up the calculations; (2) a graph,drawn either by hand or with a graphing utility, can give a good estimate of the locations of the zeros; (3) the Intermediate Value Theorem along with a table generatedby a graphing utility can give approximations of zeros; and (4) synthetic division canbe used to test the possible rational zeros.
Finding the first zero is often the most difficult part. After that, the search is simplified by working with the lower-degree polynomial obtained in synthetic division,as shown in Example 3.
−4 −2 6x
6
4
−6
8
−8
( 1, 0)− (2, 0)
8−6−8
f x x x x x( ) = + 3 64 3 2− − −
y
f,x � 2x � �1�x2 � 3�
f �x� � �x � 1��x � 2��x2 � 3�.
f �x�
2 1
1
�2
2
0
3
0
3
�6
6
0
�1 1
1
�1
�1
�2
1
2
3
�3
�3
�6
�6
6
0
x � 2x � �1
±1, ±2, ±3, ±6
f �x� � x4 � x3 � x2 � 3x � 6.
Example 3
0 remainder, so is a zero.x � �1
0 remainder, so is a zero.x � 2
When the list of possible rationalzeros is small, as in Example 2,it may be quicker to test thezeros by evaluating the function.When the list of possible rational zeros is large, as inExample 3, it may be quicker to use a different approach totest the zeros, such as using synthetic division or sketching a graph.
You can review the techniquesfor synthetic division in Section 2.3.

Using the Rational Zero Test
Find the rational zeros of
Solution
The leading coefficient is 2 and the constant term is 3.
Possible rational zeros:
By synthetic division, you can determine that is a rational zero.
So, factors as
and you can conclude that the rational zeros of are and
Now try Exercise 25.
Recall from Section 2.2 that if is a zero of the polynomial function thenis a solution of the polynomial equation
Solving a Polynomial Equation
Find all the real solutions of
Solution
The leading coefficient is and the constant term is
Possible rational solutions:
With so many possibilities (32, in fact), it is worth your time to stop and sketch a graph.From Figure 2.33, it looks like three reasonable solutions would be and Testing these by synthetic division shows that is the only rational solution. So, you have
Using the Quadratic Formula for the second factor, you find that the two additionalsolutions are irrational numbers.
and
Now try Exercise 31.
x ��5 � 265
20� 0.5639
x ��5 � 265
20� �1.0639
�x � 2���10x2 � 5x � 6� � 0.
x � 2x � 2.x �
12,x � �
65,
Factors of �12
Factors of �10�
±1, ±2, ±3, ±4, ±6, ±12
±1, ±2, ±5, ±10
�12.�10
�10x3 � 15x2 � 16x � 12 � 0.
Example 5
f �x� � 0.x � af,x � a
x � �3.x �12,x � 1,f
� �x � 1��2x � 1��x � 3�
f �x� � �x � 1��2x2 � 5x � 3�
f �x�
1 2
2
3
2
5
�8
5
�3
3
�3
0
x � 1
Factors of 3
Factors of 2�
±1, ±3
±1, ±2� ±1, ±3, ±
1
2, ±
3
2
f �x� � 2x3 � 3x2 � 8x � 3.
Example 4
x
f x x x x( ) = 10 + 15 + 16 12− −3 2
1
15
5
−10
10
−5
y
FIGURE 2.33
You can review the techniquesfor using the Quadratic Formulain Appendix A.5.
Section 2.5 Zeros of Polynomial Functions 169
Remember that when you try to find the rational zeros of apolynomial function with manypossible rational zeros, as inExample 4, you must use trialand error. There is no quickalgebraic method to determinewhich of the possibilities is anactual zero; however, sketchinga graph may be helpful.
170 Chapter 2 Polynomial and Rational Functions
Conjugate Pairs
In Examples 1(c) and 1(d), note that the pairs of complex zeros are conjugates. Thatis, they are of the form and
Be sure you see that this result is true only if the polynomial function has realcoefficients. For instance, the result applies to the function given by butnot to the function given by
Finding a Polynomial with Given Zeros
Find a fourth-degree polynomial function with real coefficients that has andas zeros.
Solution
Because is a zero and the polynomial is stated to have real coefficients, you know thatthe conjugate must also be a zero. So, from the Linear Factorization Theorem,can be written as
For simplicity, let to obtain
Now try Exercise 45.
Factoring a Polynomial
The Linear Factorization Theorem shows that you can write any th-degree polynomialas the product of linear factors.
However, this result includes the possibility that some of the values of are complex.The following theorem says that even if you do not want to get involved with “complexfactors,” you can still write as the product of linear and/or quadratic factors. For aproof of this theorem, see Proofs in Mathematics on page 212.
f �x�
ci
f �x� � an�x � c1��x � c2��x � c3� . . . �x � cn�
nn
� x4 � 2x3 � 10x2 � 18x � 9.
f �x� � �x2 � 2x � 1��x2 � 9�
a � 1
f �x� � a�x � 1��x � 1��x � 3i��x � 3i�.
f �x��3i3i
3i�1,�1,
Example 6
g�x� � x � i.x2 � 1f �x� �
a � bi.a � bi
Factors of a Polynomial
Every polynomial of degree with real coefficients can be written as theproduct of linear and quadratic factors with real coefficients, where the quadraticfactors have no real zeros.
n > 0
Complex Zeros Occur in Conjugate Pairs
Let be a polynomial function that has real coefficients. If whereis a zero of the function, the conjugate is also a zero of the function.a � bib � 0,
a � bi,f �x�

A quadratic factor with no real zeros is said to be prime or irreducible over the reals. Be sure you see that this is not the same as being irreducible over the rationals. For example, the quadratic is irreducible over the reals (and therefore over the rationals). On the other hand, the quadratic
is irreducible over the rationals but reducible over the reals.x2 � 2 � �x � 2 ��x � 2 �
x2 � 1 � �x � i��x � i�
Finding the Zeros of a Polynomial Function
Find all the zeros of given that is a zero of f.1 � 3if �x� � x4 � 3x3 � 6x2 � 2x � 60
Example 7
In Example 7, if you were not told that is a zero of you could still find all zeros of the function by using synthetic division to find the real zeros and 3.Then you could factor the polynomial as Finally, byusing the Quadratic Formula, you could determine that the zeros are
and x � 1 � 3i.x � 1 � 3i,x � 3,x � �2,
�x � 2��x � 3��x2 � 2x � 10�.�2
f,1 � 3i
You can review the techniquesfor polynomial long division inSection 2.3.
Algebraic Solution
Because complex zeros occur in conjugate pairs, you know thatis also a zero of This means that both
and
are factors of Multiplying these two factors produces
Using long division, you can divide into to obtainthe following.
So, you have
and you can conclude that the zeros of are and
Now try Exercise 55.
x � �2.x � 3,x � 1 � 3i,x � 1 � 3i,f
� �x2 � 2x � 10��x � 3��x � 2�
f �x� � �x2 � 2x � 10��x2 � x � 6�
0
�6x2 � 12x � 60
�6x2 � 12x � 60
�x3 � 2x2 � 10x
�x3 � 4x2 � 2x
x4 � 2x3 � 10x2
x2 � 2x � 10 ) x4 � 3x3 � 6x2 � 2x � 60
x2 � x � 6
fx2 � 2x � 10
� x2 � 2x � 10.
� �x � 1�2 � 9i2
x � �1 � 3i�x � �1 � 3i� � �x � 1� � 3i�x � 1� � 3i
f.
x � �1 � 3i�x � �1 � 3i�
f.1 � 3i
Graphical Solution
Because complex zeros always occur in conjugatepairs, you know that is also a zero of Becausethe polynomial is a fourth-degree polynomial, youknow that there are at most two other zeros of the function. Use a graphing utility to graph
as shown in Figure 2.34.
FIGURE 2.34
You can see that and 3 appear to be zeros of thegraph of the function. Use the zero or root feature orthe zoom and trace features of the graphing utility toconfirm that and are zeros of the graph.So, you can conclude that the zeros of are
and x � �2.x � 3,x � 1 � 3i,x � 1 � 3i,f
x � 3x � �2
�2
−80
−4 5
80
y = x4 − 3x3 + 6x2 + 2x − 60
y � x4 � 3x3 � 6x2 � 2x � 60
f.1 � 3i
Section 2.5 Zeros of Polynomial Functions 171

172 Chapter 2 Polynomial and Rational Functions
Example 8 shows how to find all the zeros of a polynomial function, includingcomplex zeros.
Finding the Zeros of a Polynomial Function
Write as the product of linear factors, and list all ofits zeros.
Solution
The possible rational zeros are and Synthetic division produces the following.
So, you have
You can factor as and by factoring as
you obtain
which gives the following five zeros of
and
From the graph of shown in Figure 2.35, you can see that the real zeros are the onlyones that appear as -intercepts. Note that is a repeated zero.
Now try Exercise 77.
x � 1xf
x � �2ix � 2i,x � �2,x � 1,x � 1,
f.
f �x� � �x � 1��x � 1��x � 2��x � 2i��x � 2i�
� �x � 2i��x � 2i�
x2 � ��4� � �x � �4 ��x � �4 �x2 � 4�x � 1��x2 � 4�,x3 � x2 � 4x � 4
� �x � 1��x � 2��x3 � x2 � 4x � 4�.
f �x� � x5 � x3 � 2x2 � 12x � 8
�2 1
1
1
�2
�1
2
2
4
4
�8
�4
�8
8
0
1 1
1
0
1
1
1
1
2
2
2
4
�12
4
�8
8
�8
0
±8.±1, ±2, ±4,
f �x� � x5 � x3 � 2x2 � 12x � 8
Example 8
1 is a zero.
is a zero.�2
In Example 8, the fifth-degreepolynomial function has threereal zeros. In such cases, youcan use the zoom and tracefeatures or the zero or rootfeature of a graphing utility toapproximate the real zeros. Youcan then use these real zeros todetermine the complex zerosalgebraically.
−4 2 4x
y
5
10
(−2, 0) (1, 0)
f(x) = x5 + x3 + 2x2 −12x + 8
FIGURE 2.35
TECHNOLOGY
You can use the table feature of agraphing utility to help you determinewhich of the possible rational zeros arezeros of the polynomial in Example 8.The table should be set to ask mode.Then enter each of the possible rationalzeros in the table. When you do this,you will see that there are two rationalzeros, and 1, as shown at the right.�2

Other Tests for Zeros of Polynomials
You know that an th-degree polynomial function can have at most real zeros. Ofcourse, many th-degree polynomials do not have that many real zeros. For instance,
has no real zeros, and has only one real zero. The following theorem, called Descartes’s Rule of Signs, sheds more light on the numberof real zeros of a polynomial.
A variation in sign means that two consecutive coefficients have opposite signs.When using Descartes’s Rule of Signs, a zero of multiplicity should be counted
as zeros. For instance, the polynomial has two variations in sign, and sohas either two positive or no positive real zeros. Because
you can see that the two positive real zeros are of multiplicity 2.
Using Descartes’s Rule of Signs
Describe the possible real zeros of
Solution
The original polynomial has three variations in sign.
to to
to
The polynomial
has no variations in sign. So, from Descartes’s Rule of Signs, the polynomialhas either three positive real zeros or one positive real
zero, and has no negative real zeros. From the graph in Figure 2.36, you can see that the function has only one real zero, at .
Now try Exercise 87.
x � 1
f �x� � 3x3 � 5x2 � 6x � 4
� �3x3 � 5x2 � 6x � 4
f ��x� � 3��x�3 � 5��x�2 � 6��x� � 4
��
f �x� � 3x3 � 5x2 � 6x � 4
����
f �x� � 3x3 � 5x2 � 6x � 4.
Example 9
x � 1
�x � 1��x � 1��x � 2�x3 � 3x � 2 �
x3 � 3x � 2kk
f �x� � x3 � 1f �x� � x2 � 1n
nn
Descartes’s Rule of Signs
Let be a polynomial with realcoefficients and
1. The number of positive real zeros of is either equal to the number of variations in sign of or less than that number by an even integer.
2. The number of negative real zeros of is either equal to the number of variations in sign of or less than that number by an even integer.f ��x�
f
f �x�f
a0 � 0.f (x) � anxn � an�1x
n�1 � . . . � a2x2 � a1x � a0
−3 −2 −1 2 3x
y
−3
−2
−1
1
2
3
f(x) = 3x3 − 5x2 + 6x − 4
FIGURE 2.36
Section 2.5 Zeros of Polynomial Functions 173

174 Chapter 2 Polynomial and Rational Functions
Another test for zeros of a polynomial function is related to the sign pattern in thelast row of the synthetic division array. This test can give you an upper or lower boundof the real zeros of A real number is an upper bound for the real zeros of if no zeros are greater than Similarly, is a lower bound if no real zeros of are lessthan
Finding the Zeros of a Polynomial Function
Find the real zeros of
Solution
The possible real zeros are as follows.
The original polynomial has three variations in sign. The polynomial
has no variations in sign. As a result of these two findings, you can apply Descartes’sRule of Signs to conclude that there are three positive real zeros or one positive real zero,and no negative zeros. Trying produces the following.
So, is not a zero, but because the last row has all positive entries, you know thatis an upper bound for the real zeros. So, you can restrict the search to zeros
between 0 and 1. By trial and error, you can determine that is a zero. So,
Because has no real zeros, it follows that is the only real zero.
Now try Exercise 95.
x �236x2 � 3
f �x� � �x �2
3��6x2 � 3�.
x �23
x � 1x � 1
1 6
6
�4
6
2
3
2
5
�2
5
3
x � 1
� �6x3 � 4x2 � 3x � 2
f ��x� � 6��x�3 � 4��x�2 � 3��x� � 2
f �x�
� ±1, ±1
2, ±
1
3, ±
1
6, ±
2
3, ±2
Factors of 2
Factors of 6�
±1, ±2
±1, ±2, ±3, ±6
f �x� � 6x3 � 4x2 � 3x � 2.
Example 10
b.fbb.
fbf.
Upper and Lower Bound Rules
Let be a polynomial with real coefficients and a positive leading coefficient.Suppose is divided by using synthetic division.
1. If and each number in the last row is either positive or zero, is anupper bound for the real zeros of
2. If and the numbers in the last row are alternately positive and negative(zero entries count as positive or negative), is a lower bound for the realzeros of f.
cc < 0
f.cc > 0
x � c,f�x�f �x�

Before concluding this section, here are two additional hints that can help you findthe real zeros of a polynomial.
1. If the terms of have a common monomial factor, it should be factored out beforeapplying the tests in this section. For instance, by writing
you can see that is a zero of and that the remaining zeros can be obtained byanalyzing the cubic factor.
2. If you are able to find all but two zeros of you can always use the QuadraticFormula on the remaining quadratic factor. For instance, if you succeeded in writing
you can apply the Quadratic Formula to to conclude that the tworemaining zeros are and
Using a Polynomial Model
You are designing candle-making kits. Each kit contains 25 cubic inches of candle waxand a mold for making a pyramid-shaped candle. You want the height of the candle tobe 2 inches less than the length of each side of the candle’s square base. What shouldthe dimensions of your candle mold be?
Solution
The volume of a pyramid is where is the area of the base and is the height. The area of the base is and the height is So, the volume of the pyramid is Substituting 25 for the volume yields the following.
Substitute 25 for
Multiply each side by 3.
Write in general form.
The possible rational solutions are Use synthetic division to test some of the possible solutions. Note that in this case,it makes sense to test only positive -values. Using synthetic division, you can determinethat is a solution.
The other two solutions, which satisfy are imaginary and can be discarded. You can conclude that the base of the candle mold should be 5 inches by 5 inches and the height of the mold should be inches.
Now try Exercise 115.
5 � 2 � 3
x2 � 3x � 15 � 0,
5 1
1
�2
5
3
0
15
15
�75
75
0
x � 5x
±75.±25,±15,±5,±3,x � ±1,
0 � x3 � 2x2 � 75
75 � x3 � 2x2
V.25 �13
x2�x � 2�
V �13 x2�x � 2�.
�x � 2�.x2hBV �
13 Bh,
Example 11
x � 2 � 5.x � 2 � 5x2 � 4x � 1
� x�x � 1��x2 � 4x � 1�
f �x� � x4 � 5x3 � 3x2 � x
f �x�,
fx � 0
� x�x3 � 5x2 � 3x � 1�
f �x� � x4 � 5x3 � 3x2 � x
f �x�
Section 2.5 Zeros of Polynomial Functions 175

176 Chapter 2 Polynomial and Rational Functions
EXERCISES See www.CalcChat.com for worked-out solutions to odd-numbered exercises.2.5VOCABULARY: Fill in the blanks.
1. The ________ ________ of ________ states that if is a polynomial of degree then has at least one zero in the complex number system.
2. The ________ ________ ________ states that if is a polynomial of degree then has precisely linear factors, where are complex numbers.
3. The test that gives a list of the possible rational zeros of a polynomial function is called the ________ ________ Test.
4. If is a complex zero of a polynomial with real coefficients, then so is its ________,
5. Every polynomial of degree with real coefficients can be written as the product of ________ and ________ factors with real coefficients, where the ________ factors have no real zeros.
6. A quadratic factor that cannot be factored further as a product of linear factors containing real numbers is said to be ________ over the ________.
7. The theorem that can be used to determine the possible numbers of positive real zeros and negative real zeros of a function is called ________ ________ of ________.
8. A real number is a(n) ________ bound for the real zeros of if no real zeros are less than and is a(n) ________ bound if no real zeros are greater than
SKILLS AND APPLICATIONS
b.b,fb
n > 0
a � bi.a � bi
c1, c2, . . . , cnf �x� � an�x � c1��x � c2� . . . �x � cn�,nfn �n > 0�,f �x�
fn �n > 0�,f �x�
In Exercises 9–14, find all the zeros of the function.
9.
10.
11.
12.
13.
14.
In Exercises 15–18, use the Rational Zero Test to listall possible rational zeros of Verify that the zeros of shownon the graph are contained in the list.
15.
16.
17.
18.
In Exercises 19–28, find all the rational zeros of the function.
19.
20.
21.
22.
23.
24.
25.
26.
27.
28. f �x� � 2x4 � 15x3 � 23x2 � 15x � 25
f �x� � 9x4 � 9x3 � 58x2 � 4x � 24
f �x� � 3x3 � 19x2 � 33x � 9
C�x� � 2x3 � 3x2 � 1
p�x� � x3 � 9x2 � 27x � 27
h�t� � t3 � 8t 2 � 13t � 6
h�x� � x3 � 9x2 � 20x � 12
g�x� � x3 � 4x2 � x � 4
f �x� � x3 � 7x � 6
f �x� � x3 � 6x2 � 11x � 6
x
y
−2 3
−6
2
4
f �x� � 4x5 � 8x4 � 5x3 � 10x 2 � x � 2
x
y
2 4 6
−40−48
f �x� � 2x4 � 17x3 � 35x 2 � 9x � 45
x
y
−1 1 3 5−6
369
18
f �x� � x3 � 4x 2 � 4x � 16
−1 1 2
−4
2
4
6
x
y
f �x� � x3 � 2x 2 � x � 2
ff.
h�t� � �t � 3��t � 2��t � 3i��t � 3i�f �x� � �x � 6��x � i��x � i�f �x� � �x � 5��x � 8�2g�x) � �x � 2��x � 4�3f �x� � x2�x � 3��x2 � 1�f �x� � x�x � 6�2

Section 2.5 Zeros of Polynomial Functions 177
In Exercises 29–32, find all real solutions of the polynomialequation.
29.
30.
31.
32.
In Exercises 33–36, (a) list the possible rational zeros of (b) sketch the graph of so that some of the possible zeros inpart (a) can be disregarded, and then (c) determine all realzeros of
33.
34.
35.
36.
In Exercises 37– 40, (a) list the possible rational zeros of (b) use a graphing utility to graph so that some of thepossible zeros in part (a) can be disregarded, and then (c) determine all real zeros of
37.
38.
39.
40.
GRAPHICAL ANALYSIS In Exercises 41– 44, (a) use thezero or root feature of a graphing utility to approximate thezeros of the function accurate to three decimal places, (b)determine one of the exact zeros (use synthetic division toverify your result), and (c) factor the polynomial completely.
41. 42.
43.
44.
In Exercises 45–50, find a polynomial function with real coefficients that has the given zeros. (There are many correctanswers.)
45. 46.
47. 48.
49. 50.
In Exercises 51–54, write the polynomial (a) as the product offactors that are irreducible over the rationals, (b) as the product of linear and quadratic factors that are irreducibleover the reals, and (c) in completely factored form.
51.
52.(Hint: One factor is )
53.(Hint: One factor is )
54.(Hint: One factor is )
In Exercises 55– 62, use the given zero to find all the zeros ofthe function.
Function Zero
55.
56.
57.
58.
59.
60.
61.
62.
In Exercises 63–80, find all the zeros of the function andwrite the polynomial as a product of linear factors.
63. 64.
65. 66.
67. 68.
69.
70.
71.
72.
73.
74.
75.
76.
77.
78.
79.
80.
In Exercises 81–86, find all the zeros of the function. Whenthere is an extended list of possible rational zeros, use agraphing utility to graph the function in order to discard anyrational zeros that are obviously not zeros of the function.
81.
82.
83.
84.
85.
86. g�x� � x5 � 8x4 � 28x3 � 56x2 � 64x � 32
f �x� � 2x4 � 5x3 � 4x2 � 5x � 2
f �x� � 9x3 � 15x2 � 11x � 5
f �x� � 16x3 � 20x2 � 4x � 15
f �s� � 2s3 � 5s2 � 12s � 5
f �x� � x3 � 24x2 � 214x � 740
f �x� � x4 � 29x2 � 100
f �x� � x4 � 10x2 � 9
h�x� � x4 � 6x3 � 10x2 � 6x � 9
g�x� � x4 � 4x3 � 8x2 � 16x � 16
g�x� � 2x3 � x2 � 8x � 21
f �x� � 5x3 � 9x2 � 28x � 6
h�x� � x3 � 9x2 � 27x � 35
h�x� � x3 � x � 6
f �x� � x3 � x2 � x � 39
g�x� � x3 � 3x2 � x � 5
h(x) � x3 � 3x2 � 4x � 2
f �z� � z2 � 2z � 2
f �y� � y4 � 256f �x� � x4 � 16
g�x� � x2 � 10x � 17h�x� � x2 � 2x � 17
f �x� � x2 � x � 56f �x� � x2 � 36
�1 � 3if �x� � x3 � 4x2 � 14x � 20
�3 � 2 if �x�� x4 � 3x3 � 5x2 � 21x � 22
1 � 3 ih �x� � 3x3 � 4x2 � 8x � 8
�3 � ig �x� � 4x3 � 23x2 � 34x � 10
5 � 2ig �x� � x3 � 7x2 � x � 87
5if �x� � 2x4 � x3 � 49x2 � 25x � 25
3if �x� � 2x3 � 3x2 � 18x � 27
2if �x� � x3 � x2 � 4x � 4
x2 � 4.f �x� � x4 � 3x3 � x2 � 12x � 20
x2 � 2x � 2.f �x� � x4 � 4x3 � 5x2 � 2x � 6
x2 � 6.f �x� � x4 � 2x3 � 3x2 � 12x � 18
f �x� � x 4 � 6x2 � 27
�5, �5, 1 � 3 i23, �1, 3 � 2 i
5, 3 � 2i2, 5 � i
4, �3i1, 5i
g�x� � 6x4 � 11x3 � 51x2 � 99x � 27
h�x� � x5 � 7x4 � 10x3 � 14x2 � 24x
P�t� � t 4 � 7t 2 � 12f �x� � x4 � 3x2 � 2
f �x� � 4x3 � 7x2 � 11x � 18
f �x� � 32x3 � 52x2 � 17x � 3
f �x� � 4x4 � 17x2 � 4
f �x� � �2x4 � 13x3 � 21x2 � 2x � 8
f.
ff,
f �x� � 4x3 � 12x2 � x � 15
f �x� � �4x3 � 15x2 � 8x � 3
f �x� � �3x3 � 20x2 � 36x � 16
f �x� � x3 � x2 � 4x � 4
f.
ff,
x5 � x4 � 3x3 � 5x2 � 2x � 0
2y4 � 3y3 � 16y2 � 15y � 4 � 0
x4 � 13x 2 � 12x � 0
z4 � z3 � z2 � 3z � 6 � 0

178 Chapter 2 Polynomial and Rational Functions
In Exercises 87–94, use Descartes’s Rule of Signs to determine the possible numbers of positive and negativezeros of the function.
87. 88.
89. 90.
91.
92.
93.
94.
In Exercises 95–98, use synthetic division to verify the upperand lower bounds of the real zeros of
95.
(a) Upper: (b) Lower:
96.
(a) Upper: (b) Lower:
97.
(a) Upper: (b) Lower:
98.
(a) Upper: (b) Lower:
In Exercises 99–102, find all the real zeros of the function.
99.
100.
101.
102.
In Exercises 103–106, find all the rational zeros of the polynomial function.
103.
104.
105.
106.
In Exercises 107–110, match the cubic function with thenumbers of rational and irrational zeros.
(a) Rational zeros: 0; irrational zeros: 1
(b) Rational zeros: 3; irrational zeros: 0
(c) Rational zeros: 1; irrational zeros: 2
(d) Rational zeros: 1; irrational zeros: 0
107. 108.
109. 110.
111. GEOMETRY An open box is to be made from arectangular piece of material, 15 centimeters by 9 centimeters, by cutting equal squares from the corners and turning up the sides.
(a) Let represent the length of the sides of thesquares removed. Draw a diagram showing thesquares removed from the original piece of materialand the resulting dimensions of the open box.
(b) Use the diagram to write the volume of the boxas a function of Determine the domain of thefunction.
(c) Sketch the graph of the function and approximatethe dimensions of the box that will yield a maximum volume.
(d) Find values of such that Which of thesevalues is a physical impossibility in the constructionof the box? Explain.
112. GEOMETRY A rectangular package to be sent by adelivery service (see figure) can have a maximumcombined length and girth (perimeter of a cross section) of 120 inches.
(a) Write a function that represents the volume ofthe package.
(b) Use a graphing utility to graph the function andapproximate the dimensions of the package thatwill yield a maximum volume.
(c) Find values of such that Which ofthese values is a physical impossibility in theconstruction of the package? Explain.
113. ADVERTISING COST A company that producesMP3 players estimates that the profit (in dollars) forselling a particular model is given by
where is the advertising expense (in tens of thousands of dollars). Using this model, find the smaller of two advertising amounts that will yield aprofit of $2,500,000.
114. ADVERTISING COST A company that manufacturesbicycles estimates that the profit (in dollars) for selling a particular model is given by
where is the advertising expense (in tens of thousands of dollars). Using this model, find the smaller of two advertising amounts that will yield aprofit of $800,000.
x
0 � x � 50P � �45x3 � 2500x2 � 275,000,
P
x
0 � x � 60P � �76x3 � 4830x2 � 320,000,
P
V � 13,500.x
V�x�
y
x
x
V � 56.x
x.V
x
f �x� � x3 � 2xf �x� � x3 � x
f �x� � x3 � 2f �x� � x3 � 1
f�z� � z3 �116 z2 �
12z �
13 �
16�6z3�11z2 �3z � 2�
f �x� � x3 �14 x2 � x �
14 �
14�4x3 � x2 � 4x � 1�
f�x�� x3�32 x2 �
232 x � 6 �
12�2x3�3x2 �23x �12�
P�x� � x4 �254 x 2 � 9 �
14�4x4 � 25x2 � 36�
g�x� � 3x3 � 2x2 � 15x � 10
f �y� � 4y3 � 3y2 � 8y � 6
f �z� � 12z3 � 4z2 � 27z � 9
f �x� � 4x3 � 3x � 1
x � �4x � 3
f �x� � 2x4 � 8x � 3
x � �3x � 5
f �x� � x4 � 4x3 � 16x � 16
x � �1x � 4
f �x� � x3 � 4x2 � 1
x � �4x � 1
f �x� � x3 � 3x2 � 2x � 1
f.
f �x� � 3x3 � 2x2 � x � 3
f �x� � �5x3 � x 2 � x � 5
f �x� � 4x3 � 3x2 � 2x � 1
g�x� � 5x5 � 10x
h�x� � 2x4 � 3x � 2h�x� � 2x3 � 3x2 � 1
h�x� � 4x2 � 8x � 3g�x� � 2x3 � 3x2 � 3

115. GEOMETRY A bulk food storage bin with dimensions2 feet by 3 feet by 4 feet needs to be increased in size tohold five times as much food as the current bin. (Assumeeach dimension is increased by the same amount.)
(a) Write a function that represents the volume ofthe new bin.
(b) Find the dimensions of the new bin.
116. GEOMETRY A manufacturer wants to enlarge anexisting manufacturing facility such that the total floorarea is 1.5 times that of the current facility. The floorarea of the current facility is rectangular and measures250 feet by 160 feet. The manufacturer wants toincrease each dimension by the same amount.
(a) Write a function that represents the new floor area
(b) Find the dimensions of the new floor.
(c) Another alternative is to increase the currentfloor’s length by an amount that is twice anincrease in the floor’s width. The total floor area is1.5 times that of the current facility. Repeat parts(a) and (b) using these criteria.
117. COST The ordering and transportation cost (inthousands of dollars) for the components used in manufacturing a product is given by
where is the order size (in hundreds). In calculus, itcan be shown that the cost is a minimum when
Use a calculator to approximate the optimal order sizeto the nearest hundred units.
118. HEIGHT OF A BASEBALL A baseball is thrownupward from a height of 6 feet with an initial velocityof 48 feet per second, and its height (in feet) is
where is the time (in seconds). You are told the ballreaches a height of 64 feet. Is this possible?
119. PROFIT The demand equation for a certain productis where is the unit price (indollars) of the product and is the number of units produced and sold. The cost equation for the product is
where is the total cost (in dollars) and is the number of units produced. Thetotal profit obtained by producing and selling units is
You are working in the marketing department of the company that producesthis product, and you are asked to determine a price that will yield a profit of 9 million dollars. Is this possible? Explain.
120. ATHLETICS The attendance (in millions) atNCAA women’s college basketball games for theyears 2000 through 2007 is shown in the table.(Source: National Collegiate Athletic Association,Indianapolis, IN)
(a) Use a graphing utility to create a scatter plot of thedata. Let represent the year, with corresponding to 2000.
(b) Use the regression feature of the graphing utilityto find a quartic model for the data.
(c) Graph the model and the scatter plot in the sameviewing window. How well does the model fit thedata?
(d) According to the model in part (b), in what year(s)was the attendance at least 10 million?
(e) According to the model, will the attendance continue to increase? Explain.
EXPLORATION
TRUE OR FALSE? In Exercises 121 and 122, decidewhether the statement is true or false. Justify your answer.
121. It is possible for a third-degree polynomial functionwith integer coefficients to have no real zeros.
122. If is a zero of the function given by
then must also be a zero of
THINK ABOUT IT In Exercises 123–128, determine (if possible) the zeros of the function if the function has zerosat and
123. 124.
125. 126.
127. 128. g�x� � f ��x�g�x� � 3 � f �x�g�x� � f �2x�g�x� � f �x � 5�g�x� � 3f �x�g�x� � �f �x�
x � r3.x � r2,x � r1,fg
f.x � i
f �x� � x3 �ix2 � ix � 1
x � �i
t � 0t
A
p
P � R � C � xp � C.x
xCC � 80x � 150,000,
xpp � 140 � 0.0001x,
t
h�t� � �16t2 � 48t � 6, 0 � t � 3
h
3x3 � 40x 2 � 2400x � 36,000 � 0.
x
x � 1C � 100�200
x2�
x
x � 30�,
C
A.
V
Year Attendance, A
2000
2001
2002
2003
2004
2005
2006
2007
8.7
8.8
9.5
10.2
10.0
9.9
9.9
10.9
Section 2.5 Zeros of Polynomial Functions 179

180 Chapter 2 Polynomial and Rational Functions
129. THINK ABOUT IT A third-degree polynomial function has real zeros and 3, and its leadingcoefficient is negative. Write an equation for Sketchthe graph of How many different polynomialfunctions are possible for
131. THINK ABOUT IT Sketch the graph of a fifth-degreepolynomial function whose leading coefficient is positive and that has a zero at of multiplicity 2.
132. WRITING Compile a list of all the various techniques for factoring a polynomial that have beencovered so far in the text. Give an example illustratingeach technique, and write a paragraph discussing whenthe use of each technique is appropriate.
133. THINK ABOUT IT Let be a quartic polynomial with leading coefficient and
Write an equation for
134. THINK ABOUT IT Let be a cubic polynomial with leading coefficient and
Write an equation for
In Exercises 135 and 136, the graph of a cubic polynomialfunction is shown. It is known that one of the zerosis Write an equation for
135. 136.
137. Use the information in the table to answer each question.
(a) What are the three real zeros of the polynomialfunction
(b) What can be said about the behavior of the graphof at
(c) What is the least possible degree of Explain.Can the degree of ever be odd? Explain.
(d) Is the leading coefficient of positive or negative?Explain.
(e) Write an equation for (There are many correctanswers.)
(f) Sketch a graph of the equation you wrote inpart (e).
138. (a) Find a quadratic function (with integer coefficients) that has as zeros. Assume that
is a positive integer.
(b) Find a quadratic function (with integer coefficients) that has as zeros. Assume that
is a positive integer.
139. GRAPHICAL REASONING The graph of one of the following functions is shown below. Identify the function shown in the graph. Explain why each of theothers is not the correct function. Use a graphing utility to verify your result.
(a)
(b)
(c)
(d)
2 4
–40
–30
–20
10
x
y
k �x� � �x � 1)�x � 2��x � 3.5�h �x� � �x � 2)�x � 3.5��x2 � 1�g �x� � �x � 2)�x � 3.5�f �x� � x2�x � 2)�x � 3.5�
ba ± bi
f
b± bi
f
f.
f
ff ?
x � 1?f
f ?
x
y
−2 1 2
−3
1
x
y
−1 1 2 3−1
−2
−3
1
2
f.1 � i.y � f�x�
f.f�2� � f�i� � 0.a � �1
y � f�x�f.f�i� � f�2i� � 0.
a � 1y � f�x�
x � 3
f ?f.
f.
12,�2,f
130. CAPSTONE Use a graphing utility to graph thefunction given by for differentvalues of Find values of such that the zeros of satisfy the specified characteristics. (Some parts donot have unique answers.)
(a) Four real zeros
(b) Two real zeros, each of multiplicity 2
(c) Two real zeros and two complex zeros
(d) Four complex zeros
(e) Will the answers to parts (a) through (d) changefor the function where
(f) Will the answers to parts (a) through (d) changefor the function where g�x) � f�2x�?g,
g�x) � f�x � 2�?g,
fkk.f �x� � x4 � 4x2 � k
Interval Value of f �x�
���, �2� Positive
��2, 1� Negative
�1, 4� Negative
�4, �� Positive
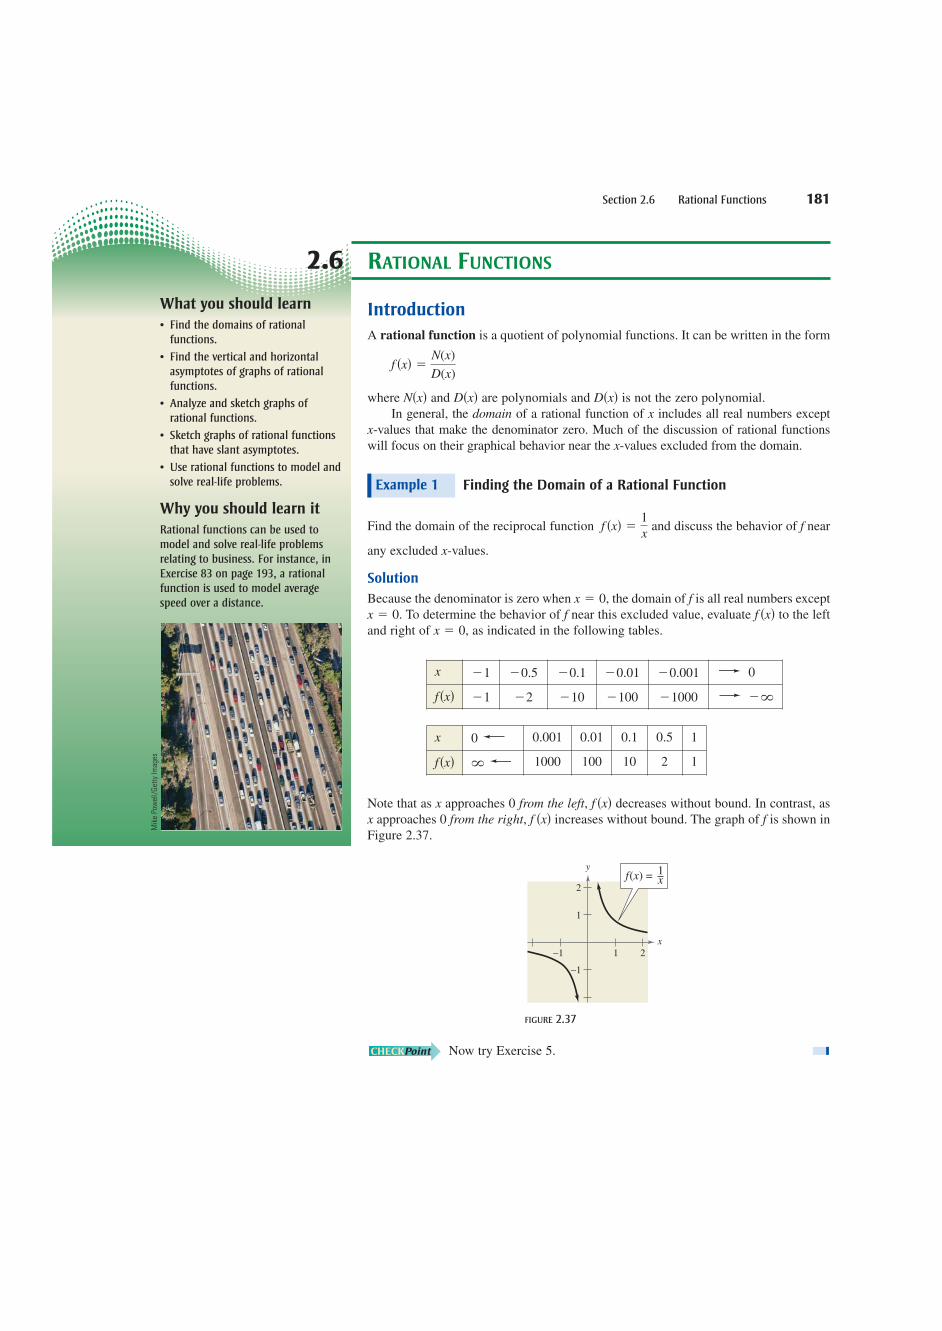
Section 2.6 Rational Functions 181
Introduction
A rational function is a quotient of polynomial functions. It can be written in the form
where and are polynomials and is not the zero polynomial.In general, the domain of a rational function of includes all real numbers except
-values that make the denominator zero. Much of the discussion of rational functionswill focus on their graphical behavior near the -values excluded from the domain.
Finding the Domain of a Rational Function
Find the domain of the reciprocal function and discuss the behavior of near
any excluded -values.
Solution
Because the denominator is zero when the domain of is all real numbers exceptTo determine the behavior of near this excluded value, evaluate to the left
and right of as indicated in the following tables.
Note that as approaches 0 from the left, decreases without bound. In contrast, asapproaches 0 from the right, increases without bound. The graph of is shown in
Figure 2.37.
FIGURE 2.37
Now try Exercise 5.
x−1 1 2
1
2
−1
f x( ) = 1x
y
ff �x�xf �x�x
x � 0,f �x�fx � 0.
fx � 0,
x
ff �x� �1x
Example 1
xx
xD�x�D�x�N�x�
f �x� �N(x)
D(x)
2.6 RATIONAL FUNCTIONS
x �1 �0.5 �0.1 �0.01 �0.001 0
f�x� �1 �2 �10 �100 �1000 ��
x 0 0.001 0.01 0.1 0.5 1
f�x� � 1000 100 10 2 1
What you should learn
• Find the domains of rational functions.
• Find the vertical and horizontalasymptotes of graphs of rationalfunctions.
• Analyze and sketch graphs of rational functions.
• Sketch graphs of rational functionsthat have slant asymptotes.
• Use rational functions to model andsolve real-life problems.
Why you should learn it
Rational functions can be used tomodel and solve real-life problemsrelating to business. For instance, inExercise 83 on page 193, a rationalfunction is used to model averagespeed over a distance.
Mik
e Po
wel
l/Get
ty Im
ages

182 Chapter 2 Polynomial and Rational Functions
Vertical and Horizontal Asymptotes
In Example 1, the behavior of near is denoted as follows.
as as
decreases without bound increases without boundas approaches 0 from the left. as approaches 0 from the right.
The line is a vertical asymptote of the graph of as shown in Figure 2.38. Fromthis figure, you can see that the graph of also has a horizontal asymptote—the line
This means that the values of approach zero as increases or decreases
without bound.
0 as 0 as
approaches 0 as approaches 0 as decreases without bound. increases without bound.
Eventually (as or ), the distance between the horizontalasymptote and the points on the graph must approach zero. Figure 2.39 shows the vertical and horizontal asymptotes of the graphs of three rational functions.
The graphs of in Figure 2.38 and in Figure 2.39(a) are
hyperbolas. You will study hyperbolas in Section 10.4.
f �x� �2x � 1x � 1
f �x� �1x
��x�x
xf �x�xf �x�
�xf �x���xf �x�
xf �x� �1
xy � 0.
ff,x � 0
xxf �x�f �x�
0�x�f �x�0�x��f �x�
x � 0f
x
f(x) = 1x
−1−2 1 2
1
2
−1 Horizontalasymptote:
y = 0
Verticalasymptote:
x = 0
y
FIGURE 2.38
Definitions of Vertical and Horizontal Asymptotes
1. The line is a vertical asymptote of the graph of if
or
as either from the right or from the left.
2. The line is a horizontal asymptote of the graph of if
as or ��.x�x
bf �x�
fy � b
a,x
��f �x��f �x�
fx � a
x
f(x) = 2x + 1x + 1
Horizontalasymptote:
y = 2
Verticalasymptote:
x = −1
−2−3 1
1
3
4
y
−1
2
(a)
FIGURE 2.39
x−2 −1 1 2
1
3
2
f(x) = 4x + 12
Horizontalasymptote:
y = 0
y
(b)
x32−1
2
3
4Vertical
asymptote:x = 1
Horizontalasymptote:
y = 0
y
1
f (x) = 2(x − 1)2
(c)

Section 2.6 Rational Functions 183
Finding Vertical and Horizontal Asymptotes
Find all vertical and horizontal asymptotes of the graph of each rational function.
a. b.
Solution
a. For this rational function, the degree of the numerator is equal to the degree of the denominator. The leading coefficient of the numerator is 2 and the leading coefficient of the denominator is 1, so the graph has the line as a horizontalasymptote. To find any vertical asymptotes, set the denominator equal to zero andsolve the resulting equation for
Set denominator equal to zero.
Factor.
Set 1st factor equal to 0.
Set 2nd factor equal to 0.
This equation has two real solutions, and so the graph has the linesand as vertical asymptotes. The graph of the function is shown in
Figure 2.40.
b. For this rational function, the degree of the numerator is equal to the degree of the denominator. The leading coefficient of both the numerator and denominator is1, so the graph has the line as a horizontal asymptote. To find any verticalasymptotes, first factor the numerator and denominator as follows.
By setting the denominator (of the simplified function) equal to zero, you candetermine that the graph has the line as a vertical asymptote.
Now try Exercise 13.
x � 3x � 3
f �x� �x2 � x � 2x2 � x � 6
��x � 1��x � 2��x � 2��x � 3� �
x � 1x � 3
, x � �2
y � 1
x � 1x � �1x � 1,x � �1
x � 1x � 1 � 0
x � �1x � 1 � 0
�x � 1��x � 1� � 0
x2 � 1 � 0
x.
y � 2
f �x� �x2 � x � 2x2 � x � 6
f �x� �2x2
x2 � 1
Example 2
Vertical and Horizontal Asymptotes of a Rational Function
Let be the rational function given by
where and have no common factors.
1. The graph of has vertical asymptotes at the zeros of
2. The graph of has one or no horizontal asymptote determined by comparingthe degrees of and
a. If the graph of has the line (the -axis) as a horizontalasymptote.
b. If the graph of has the line (ratio of the leading
coefficients) as a horizontal asymptote.
c. If the graph of has no horizontal asymptote.fn > m,
y �an
bm
fn � m,
xy � 0fn < m,
D�x�.N�x�f
D�x�.f
D�x�N�x�
f �x� �N�x�D�x�
�anxn � an�1x
n�1 � . . . � a1x � a0
bmxm � bm�1xm�1 � . . . � b1x � b0
f
Verticalasymptote:
x = −1
Horizontalasymptote: y = 2
Verticalasymptote:
x = 1
x
y
4
3
2
1
−2−3−4 2 3 4
2x2
x2 − 1f (x) =
1−1
FIGURE 2.40
You can review the techniquesfor factoring in Appendix A.3.

184 Chapter 2 Polynomial and Rational Functions
Analyzing Graphs of Rational Functions
To sketch the graph of a rational function, use the following guidelines.
The concept of test intervals from Section 2.2 can be extended to graphing ofrational functions. To do this, use the fact that a rational function can change signs onlyat its zeros and its undefined values (the -values for which its denominator is zero).Between two consecutive zeros of the numerator and the denominator, a rational function must be entirely positive or entirely negative. This means that when the zerosof the numerator and the denominator of a rational function are put in order, they dividethe real number line into test intervals in which the function has no sign changes. A representative -value is chosen to determine if the value of the rational function is positive (the graph lies above the -axis) or negative (the graph lies below the -axis).xx
x
x
Guidelines for Analyzing Graphs of Rational Functions
Let where and are polynomials.
1. Simplify if possible.
2. Find and plot the -intercept (if any) by evaluating
3. Find the zeros of the numerator (if any) by solving the equation Then plot the corresponding -intercepts.
4. Find the zeros of the denominator (if any) by solving the equation Then sketch the corresponding vertical asymptotes.
5. Find and sketch the horizontal asymptote (if any) by using the rule for findingthe horizontal asymptote of a rational function.
6. Plot at least one point between and one point beyond each -intercept and vertical asymptote.
7. Use smooth curves to complete the graph between and beyond the verticalasymptotes.
x
D�x� � 0.
xN�x� � 0.
f �0�.y
f,
D�x�N�x�f �x� �N�x�D�x�
,
TECHNOLOGY
Some graphing utilities have difficulty graphing rational functions that havevertical asymptotes. Often, the utility will connect parts of the graph that are not supposed to be connected. For instance, the top screen on the right shows the graph of
Notice that the graph should consist of two unconnected portions—one to the left of and the other to the right of To eliminate this problem, you can try changing the mode of the graphing utility to dot mode. The problem with this is that the graph is then represented as a collection of dots (as shown in the bottom screen on the right) rather than as a smooth curve.
−5
−5
5
5x � 2.x � 2
f �x� �1
x � 2.
−5
−5
5
5
You may also want to test for symmetry when graphingrational functions, especially forsimple rational functions. Recallfrom Section 1.6 that the graphof the reciprocal function
is symmetric with respect to theorigin.
f �x� �1
x
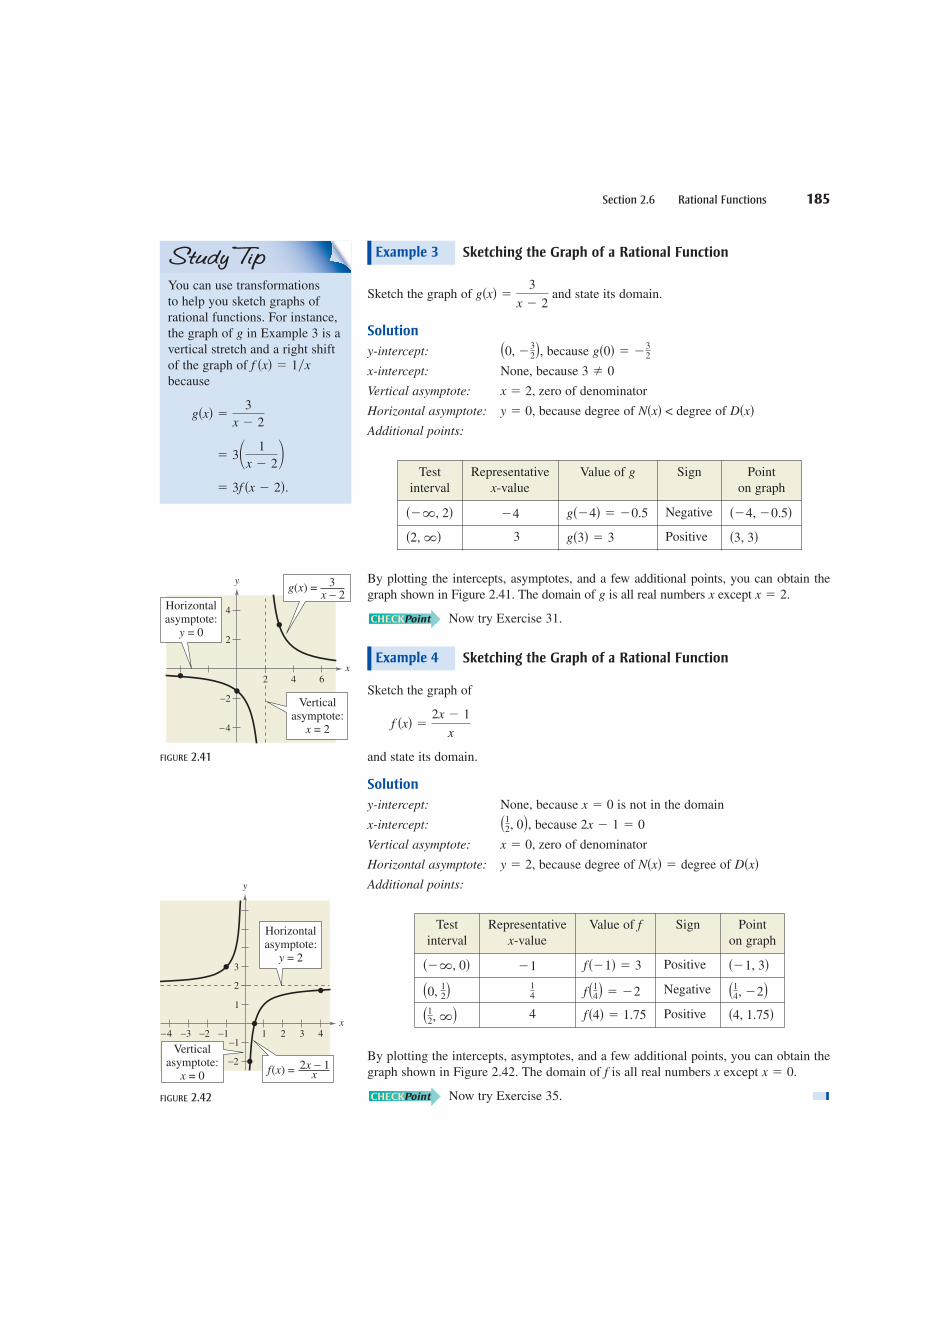
Section 2.6 Rational Functions 185
Sketching the Graph of a Rational Function
Sketch the graph of and state its domain.
Solution
y-intercept: because
x-intercept: None, because
Vertical asymptote: zero of denominator
Horizontal asymptote: because degree of degree of
Additional points:
By plotting the intercepts, asymptotes, and a few additional points, you can obtain thegraph shown in Figure 2.41. The domain of is all real numbers except
Now try Exercise 31.
Sketching the Graph of a Rational Function
Sketch the graph of
and state its domain.
Solution
y-intercept: None, because is not in the domain
x-intercept: because
Vertical asymptote: zero of denominator
Horizontal asymptote: because degree of degree of
Additional points:
By plotting the intercepts, asymptotes, and a few additional points, you can obtain thegraph shown in Figure 2.42. The domain of is all real numbers except
Now try Exercise 35.
x � 0.xf
D�x�N�x� �y � 2,
x � 0,
2x � 1 � 0�12, 0�,x � 0
f �x� �2x � 1
x
Example 4
x � 2.xg
D�x�N�x� <y � 0,
x � 2,
3 � 0
g�0� � �32�0, �
32�,
g�x� �3
x � 2
Example 3
Testinterval
Representativex-value
Value of g Sign Pointon graph
���, 2� �4 g��4� � �0.5 Negative ��4, �0.5�
�2, �� 3 g�3� � 3 Positive �3, 3�
Testinterval
Representativex-value
Value of f Sign Pointon graph
���, 0� �1 f��1� � 3 Positive ��1, 3�
�0, 12� 1
4 f�14� � �2 Negative �14, �2��12, �� 4 f�4� � 1.75 Positive �4, 1.75�
You can use transformations to help you sketch graphs ofrational functions. For instance,the graph of in Example 3 is avertical stretch and a right shiftof the graph of because
� 3f �x � 2�.
� 3� 1x � 2�
g�x� �3
x � 2
f �x� � 1�x
g
4 6
2
4
−2
−4
x
Verticalasymptote:
x = 2
Horizontalasymptote:
y = 0
g(x) =x − 2
3y
2
FIGURE 2.41
3
3 4
1
1 2−1
−1
−2
−4 −3 −2x
f x( ) = x2 1x −
Horizontalasymptote:
= 2y
Verticalasymptote:
= 0x
y
2
FIGURE 2.42

186 Chapter 2 Polynomial and Rational Functions
Sketching the Graph of a Rational Function
Sketch the graph of
Solution
Factoring the denominator, you have
y-intercept: because
x-intercept:
Vertical asymptotes: zeros of denominator
Horizontal asymptote: because degree of degree of
Additional points:
The graph is shown in Figure 2.43.
Now try Exercise 39.
A Rational Function with Common Factors
Sketch the graph of
Solution
By factoring the numerator and denominator, you have
y-intercept: because
x-intercept: because
Vertical asymptote: zero of (simplified) denominator
Horizontal asymptote: because degree of degree of
Additional points:
The graph is shown in Figure 2.44. Notice that there is a hole in the graph at because the function is not defined when
Now try Exercise 45.
x � 3.x � 3,
D�x�N�x��y � 1,
x � �1,
f ��3� � 0��3, 0�,f �0� � 3�0, 3�,
f �x� �x2 � 9
x2 � 2x � 3��x � 3��x � 3��x � 3��x � 1�
�x � 3
x � 1, x � 3.
f �x� � �x2 � 9���x2 � 2x � 3�.
Example 6
D�x�N�x� <y � 0,
x � 2,x � �1,
�0, 0�f �0� � 0�0, 0�,
f �x� �x
�x � 1��x � 2�.
f �x� � x��x2 � x � 2�.
Example 5
Testinterval
Representativex-value
Value of f Sign Pointon graph
���, �1� �3 f��3� � �0.3 Negative ��3, �0.3�
��1, 0� �0.5 f ��0.5� � 0.4 Positive ��0.5, 0.4�
�0, 2� 1 f�1� � �0.5 Negative �1, �0.5�
�2, �� 3 f�3� � 0.75 Positive �3, 0.75�
Testinterval
Representativex-value
Value of f Sign Pointon graph
���, �3� �4 f��4� � 0.33 Positive ��4, 0.33�
��3, �1� �2 f��2� � �1 Negative ��2, �1�
��1, �� 2 f�2� � 1.67 Positive �2, 1.67�
3
−3
−2
−1
−
1
2
3
x
Verticalasymptote:
x = 2
Verticalasymptote:
x = −1
Horizontalasymptote:
y = 0
f(x) =x2 − x − 2
x
y
1 2
FIGURE 2.43
y
x
x2 − 9x2 − 2x − 3
f(x) =
Horizontalasymptote:
y = 1
−3−4 1 2 3 4 5 6
2
3
−2
−3
−4
−5
Verticalasymptote:
x = −1
1
−1
FIGURE 2.44 Hole at x � 3
WARNING / CAUTIONIf you are unsure of the shapeof a portion of the graph of arational function, plot someadditional points. Also note that when the numerator and the denominator of a rationalfunction have a common factor,the graph of the function has ahole at the zero of the commonfactor (see Example 6).

Section 2.6 Rational Functions 187
Slant Asymptotes
Consider a rational function whose denominator is of degree 1 or greater. If the degreeof the numerator is exactly one more than the degree of the denominator, the graph ofthe function has a slant (or oblique) asymptote. For example, the graph of
has a slant asymptote, as shown in Figure 2.45. To find the equation of a slant asymptote,use long division. For instance, by dividing into you obtain
Slant asymptote
As increases or decreases without bound, the remainder term approaches0, so the graph of approaches the line as shown in Figure 2.45.
A Rational Function with a Slant Asymptote
Sketch the graph of
Solution
Factoring the numerator as allows you to recognize the -intercepts. Using long division
allows you to recognize that the line is a slant asymptote of the graph.
y-intercept: because
x-intercepts: and
Vertical asymptote: zero of denominator
Slant asymptote:
Additional points:
The graph is shown in Figure 2.46.
Now try Exercise 65.
y � x
x � 1,
�2, 0���1, 0�
f �0� � 2�0, 2�,
y � x
f �x� �x2 � x � 2
x � 1� x �
2
x � 1
x�x � 2��x � 1�
f �x� �x2 � x � 2
x � 1.
Example 7
y � x � 2,f2��x � 1�x
�y � x � 2�
� x � 2 �2
x � 1.f �x� �
x2 � x
x � 1
x2 � x,x � 1
f �x� �x2 � x
x � 1
Testinterval
Representativex-value
Value of f Sign Pointon graph
���, �1� �2 f��2� � �1.33 Negative ��2, �1.33�
��1, 1� 0.5 f �0.5� � 4.5 Positive �0.5, 4.5�
�1, 2� 1.5 f �1.5� � �2.5 Negative �1.5, �2.5�
�2, �� 3 f�3� � 2 Positive �3, 2�
x
y = x − 2
Slantasymptote:
Verticalasymptote:
= 1x −
yf x( ) =
x + 1x x2 −
−2−4−6−8 2 4 6 8−2
−4
FIGURE 2.45
4
4
5
5
3
3
2
−2
−2
−3
−3x
Verticalasymptote:
x = 1
Slantasymptote:
y = x
f(x) =x − 1
x2 − x − 2
y
11
FIGURE 2.46

Applications
There are many examples of asymptotic behavior in real life. For instance, Example 8shows how a vertical asymptote can be used to analyze the cost of removing pollutantsfrom smokestack emissions.
Cost-Benefit Model
A utility company burns coal to generate electricity. The cost (in dollars) of removing% of the smokestack pollutants is given by
for You are a member of a state legislature considering a law that wouldrequire utility companies to remove 90% of the pollutants from their smokestack emissions. The current law requires 85% removal. How much additional cost would theutility company incur as a result of the new law?
0 � p < 100.
C �80,000p100 � p
pC
Example 8
188 Chapter 2 Polynomial and Rational Functions
Algebraic Solution
Because the current law requires 85% removal, the current cost tothe utility company is
Evaluate when
If the new law increases the percent removal to 90%, the cost will be
Evaluate when
So, the new law would require the utility company to spend an additional
Now try Exercise 77.
Subtract 85% removal costfrom 90% removal cost.720,000 � 453,333 � $266,667.
p � 90.C� $720,000.C �80,000(90)
100 � 90
p � 85.C� $453,333.C �80,000(85)
100 � 85
Graphical Solution
Use a graphing utility to graph the function
using a viewing window similar to that shown inFigure 2.47. Note that the graph has a vertical asymptoteat Then use the trace or value featureto approximate the values of when and
You should obtain the following values.
When
When
So, the new law would require the utility company tospend an additional
FIGURE 2.47
12000
80,000x100 − x
y1 =1,200,000
720,000 � 453,333 � $266,667.
x � 90, y1 � 720,000.
x � 85, y1 � 453,333.
x � 90.x � 85y1
x � 100.
y1 �80,000
100 � x

Section 2.6 Rational Functions 189
Finding a Minimum Area
A rectangular page is designed to contain 48 square inches of print. The margins at thetop and bottom of the page are each 1 inch deep. The margins on each side are incheswide. What should the dimensions of the page be so that the least amount of paper is used?
112
Example 9 1 in.
1 in.
11 in.211 in.2y
x
FIGURE 2.48
Graphical Solution
Let be the area to be minimized. From Figure 2.48, you canwrite
The printed area inside the margins is modeled by orTo find the minimum area, rewrite the equation for
in terms of just one variable by substituting for
The graph of this rational function is shown in Figure 2.49.Because represents the width of the printed area, you needconsider only the portion of the graph for which is positive.Using a graphing utility, you can approximate the minimumvalue of to occur when inches. The correspondingvalue of is inches. So, the dimensions should be
by
FIGURE 2.49
Now try Exercise 81.
00
24
A =(x + 3)(48 + 2x)
x , x > 0
200
y � 2 � 7.6 inches.x � 3 � 11.5 inches
48�8.5 � 5.6yx � 8.5A
xx
x > 0��x � 3��48 � 2x�
x,
A � �x � 3��48
x� 2�
y.48�xAy � 48�x.
48 � xy
A � �x � 3��y � 2�.
A
Numerical Solution
Let be the area to be minimized. From Figure 2.48, you canwrite
The printed area inside the margins is modeled by orTo find the minimum area, rewrite the equation for
in terms of just one variable by substituting for
Use the table feature of a graphing utility to create a table ofvalues for the function
beginning at From the table, you can see that the minimum value of occurs when is somewhere between 8and 9, as shown in Figure 2.50. To approximate the minimumvalue of to one decimal place, change the table so that itstarts at and increases by 0.1. The minimum value of occurs when as shown in Figure 2.51. The corresponding value of is inches. So, thedimensions should be inches by inches.
FIGURE 2.50 FIGURE 2.51
y � 2 � 7.6x � 3 � 11.548�8.5 � 5.6y
x � 8.5,y1x � 8
y1
xy1
x � 1.
y1 ��x � 3��48 � 2x�
x
��x � 3��48 � 2x�
x, x > 0
A � �x � 3��48x
� 2�y.48�xA
y � 48�x.48 � xy
A � �x � 3�� y � 2�.
A
If you go on to take a course in calculus, you will learn an analytic technique forfinding the exact value of that produces a minimum area. In this case, that value isx � 6 2 � 8.485.
x
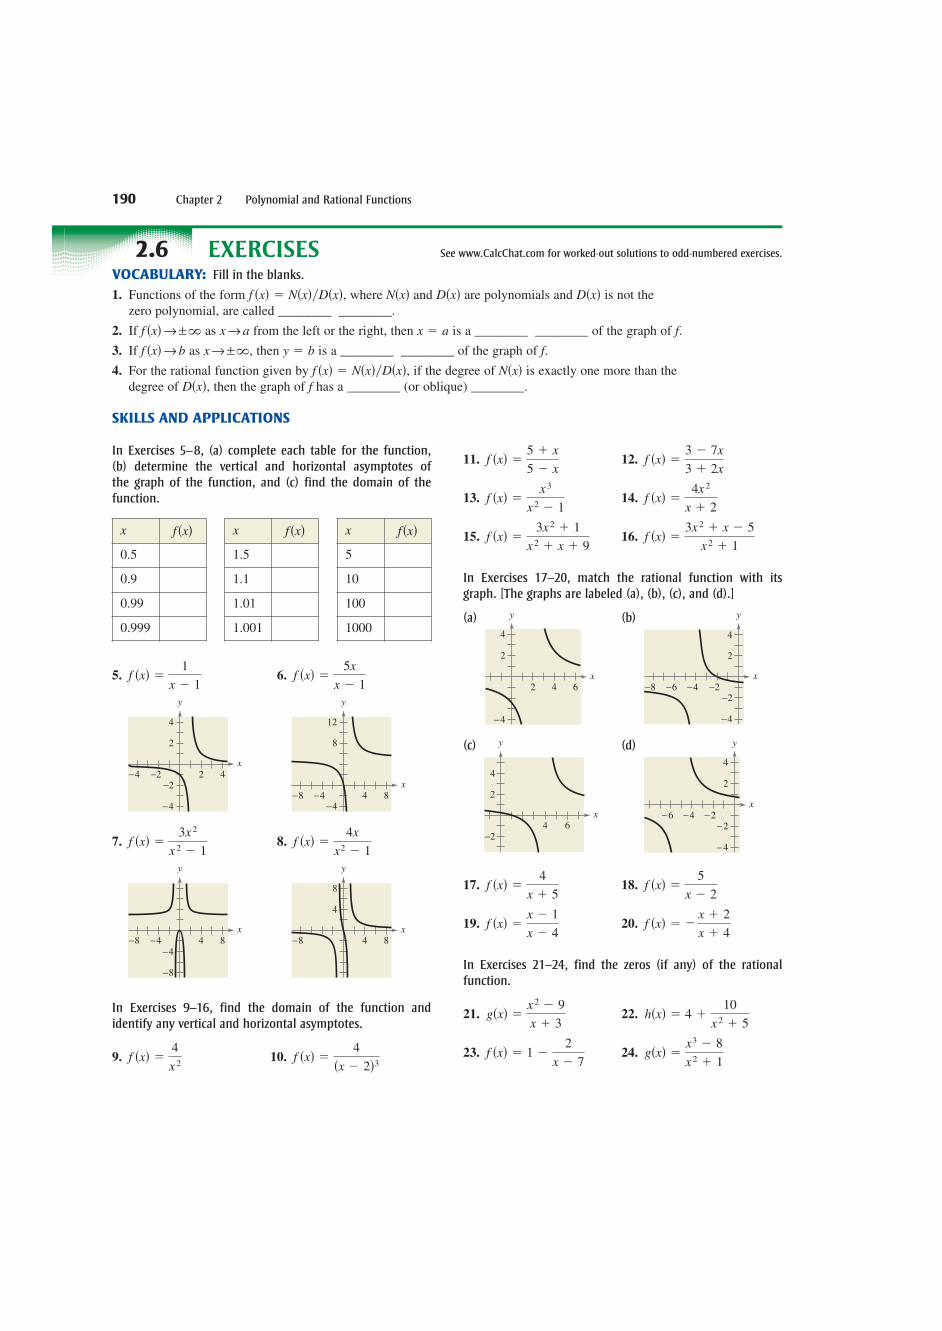
190 Chapter 2 Polynomial and Rational Functions
EXERCISES See www.CalcChat.com for worked-out solutions to odd-numbered exercises.2.6VOCABULARY: Fill in the blanks.
1. Functions of the form where and are polynomials and is not the zero polynomial, are called ________ ________.
2. If as from the left or the right, then is a ________ ________ of the graph of
3. If as then is a ________ ________ of the graph of
4. For the rational function given by if the degree of is exactly one more than the degree of then the graph of has a ________ (or oblique) ________.
SKILLS AND APPLICATIONS
fD�x�,N�x�f �x� � N�x��D�x�,
f.y � bx → ±�,f �x�→ b
f.x � ax → af �x�→ ±�
D�x�D�x�N�x�f �x� � N�x��D�x�,
In Exercises 5–8, (a) complete each table for the function, (b) determine the vertical and horizontal asymptotes of the graph of the function, and (c) find the domain of thefunction.
5. 6.
7. 8.
In Exercises 9–16, find the domain of the function andidentify any vertical and horizontal asymptotes.
9. 10.
11. 12.
13. 14.
15. 16.
In Exercises 17–20, match the rational function with itsgraph. [The graphs are labeled (a), (b), (c), and (d).]
(a) (b)
(c) (d)
17. 18.
19. 20.
In Exercises 21–24, find the zeros (if any) of the rational function.
21. 22.
23. 24. g�x� �x3 � 8
x2 � 1f �x� � 1 �
2
x � 7
h�x� � 4 �10
x2 � 5g�x� �
x2 � 9
x � 3
f �x� � �x � 2
x � 4f �x� �
x � 1
x � 4
f �x� �5
x � 2f �x� �
4
x � 5
x
y
−2−4−6−2
−4
2
4
x
4
2
−264
y
x
4
2
−2
−4
−2−4−6−8
y
x
y
2 4 6
−4
2
4
f �x� �3x2 � x � 5
x2 � 1f �x� �
3x2 � 1
x2 � x � 9
f �x� �4x2
x � 2f �x� �
x3
x2 � 1
f �x� �3 � 7x
3 � 2xf �x� �
5 � x
5 � x
f �x� �4
�x � 2�3f �x� �
4
x2
x4
4
−8 8
8
y
x4−4
−4−8
−8
8
y
f �x� �4x
x2 � 1f �x� �
3x2
x2 � 1
x−8
−4−4 4 8
8
12
y
x−4
−4
−2 2 4−2
2
4
y
f �x� �5x
x � 1f �x� �
1
x � 1
x f�x�
0.5
0.9
0.99
0.999
x f�x�
1.5
1.1
1.01
1.001
x f�x�
5
10
100
1000

Section 2.6 Rational Functions 191
In Exercises 25–30, find the domain of the function and iden-tify any vertical and horizontal asymptotes.
25. 26.
27. 28.
29. 30.
In Exercises 31–50, (a) state the domain of the function, (b)identify all intercepts, (c) find any vertical and horizontalasymptotes, and (d) plot additional solution points as neededto sketch the graph of the rational function.
31. 32.
33. 34.
35. 36.
37. 38.
39. 40.
41. 42.
43.
44.
45. 46.
47. 48.
49. 50.
ANALYTICAL, NUMERICAL, AND GRAPHICAL ANALYSISIn Exercises 51–54, do the following.
(a) Determine the domains of and
(b) Simplify and find any vertical asymptotes of the graphof
(c) Compare the functions by completing the table.
(d) Use a graphing utility to graph and in the sameviewing window.
(e) Explain why the graphing utility may not show thedifference in the domains of and
51.
52.
53.
54.
In Exercises 55–68, (a) state the domain of the function, (b) identify all intercepts, (c) identify any vertical and slantasymptotes, and (d) plot additional solution points as neededto sketch the graph of the rational function.
55. 56.
57. 58.
59. 60.
61. 62.
63. 64.
65. 66. f �x� �2x2 � 5x � 5
x � 2f �x� �
x2 � x � 1
x � 1
g�x� �x3
2x2 � 8f �x� �
x3
x2 � 4
f �x� �x2
3x � 1f �t� � �
t2 � 1
t � 5
h�x� �x2
x � 1g�x� �
x2 � 1x
f �x� �1 � x2
xf �x� �
2x2 � 1x
g�x� �x2 � 5
xh�x� �
x2 � 9
x
g�x� �2
x � 4f �x� �
2x � 6
x2 � 7x � 12,
g�x� �1
xf �x� �
x � 2
x2 � 2x,
g�x� � xf �x� �x2�x � 2�x2 � 2x
,
g�x� � x � 1f �x� �x2 � 1
x � 1,
g.f
gf
f.f
g.f
f �x� �x2 � 36x � 6
f �t� �t2 � 1t � 1
f �x� �3x2 � 8x � 42x2 � 3x � 2
f �x� �2x2 � 5x � 22x2 � x � 6
f �x� �5�x � 4�
x2 � x � 12f �x� �
x2 � 3xx2 � x � 6
f �x� �x2 � x � 2
x3 � 2x2 � 5x � 6
f �x� �2x2 � 5x � 3
x3 � 2x2 � x � 2
g�x� �x2 � 2x � 8
x2 � 9h�x� �
x2 � 5x � 4x2 � 4
f �x� � �1
�x � 2�2g�s� �
4s
s2 � 4
f �t� �1 � 2t
tf �x� �
x2
x2 � 9
P�x� �1 � 3x
1 � xC�x� �
7 � 2x
2 � x
g�x� �1
6 � xh�x� �
�1
x � 4
f �x� �1
x � 3f �x� �
1
x � 2
f �x� �6x2 � 11x � 36x2 � 7x � 3
f �x� �x2 � 3x � 42x2 � x � 1
f �x� �x2 � 4
x2 � 3x � 2f �x� �
x2 � 25x2 � 4x � 5
f �x� �x � 1x2 � 1
f �x� �x � 4
x2 � 16 x �3 �2 �1.5 �1 �0.5 0 1
f�x�
g�x�
x �1 0 1 1.5 2 2.5 3
f�x�
g�x�
x �0.5 0 0.5 1 1.5 2 3
f�x�
g�x�
x 0 1 2 3 4 5 6
f�x�
g�x�

192 Chapter 2 Polynomial and Rational Functions
67.
68.
In Exercises 69–72, use a graphing utility to graph therational function. Give the domain of the function and identify any asymptotes. Then zoom out sufficiently far sothat the graph appears as a line. Identify the line.
69. 70.
71. 72.
GRAPHICAL REASONING In Exercises 73–76, (a) use thegraph to determine any -intercepts of the graph of therational function and (b) set and solve the resultingequation to confirm your result in part (a).
73. 74.
75. 76.
77. POLLUTION The cost (in millions of dollars) ofremoving of the industrial and municipal pollutantsdischarged into a river is given by
(a) Use a graphing utility to graph the cost function.
(b) Find the costs of removing 10%, 40%, and 75% ofthe pollutants.
(c) According to this model, would it be possible toremove 100% of the pollutants? Explain.
78. RECYCLING In a pilot project, a rural township isgiven recycling bins for separating and storingrecyclable products. The cost (in dollars) of supplyingbins to of the population is given by
(a) Use a graphing utility to graph the cost function.
(b) Find the costs of supplying bins to 15%, 50%, and90% of the population.
(c) According to this model, would it be possible tosupply bins to 100% of the residents? Explain.
79. POPULATION GROWTH The game commissionintroduces 100 deer into newly acquired state gamelands. The population of the herd is modeled by
where is the time in years (see figure).
(a) Find the populations when and
(b) What is the limiting size of the herd as time increases?
80. CONCENTRATION OF A MIXTURE A 1000-liter tankcontains 50 liters of a 25% brine solution. You add
liters of a 75% brine solution to the tank.
(a) Show that the concentration , the proportion ofbrine to total solution, in the final mixture is
(b) Determine the domain of the function based on thephysical constraints of the problem.
(c) Sketch a graph of the concentration function.
(d) As the tank is filled, what happens to the rate atwhich the concentration of brine is increasing?What percent does the concentration of brineappear to approach?
C �3x � 50
4�x � 50�.
C
x
t � 25.t � 10,t � 5,
Time (in years)
Dee
r po
pula
tion
t50 100 150 200
200
400
600
800
1000
1200
1400
N
t
t � 0N �20�5 � 3t�1 � 0.04t
,
N
0 � p < 100.C �25,000p
100 � p ,
p%C
0 � p < 100.C �255p
100 � p ,
p%C
x−8 −4
−44 8
4
8
y
x−4
−4
−2 4
2
4
y
y � x � 3 �2
xy �
1
x� x
x−2 8642
−4
2
4
6
y
x−2 864
−4
2
4
6
y
y �2x
x � 3y �
x � 1
x � 3
y � 0x
h�x� �12 � 2x � x 2
2�4 � x�g�x� �
1 � 3x2 � x3
x2
f �x� �2x2 � x
x � 1f �x� �
x2 � 5x � 8
x � 3
f �x� �2x3 � x2 � 8x � 4
x2 � 3x � 2
f �x� �2x3 � x2 � 2x � 1
x2 � 3x � 2

Section 2.6 Rational Functions 193
81. PAGE DESIGN A page that is inches wide and inches high contains 30 square inches of print. The
top and bottom margins are 1 inch deep, and the marginson each side are 2 inches wide (see figure).
(a) Write a function for the total area of the page interms of
(b) Determine the domain of the function based on thephysical constraints of the problem.
(c) Use a graphing utility to graph the area function andapproximate the page size for which the least amountof paper will be used. Verify your answer numericallyusing the table feature of the graphing utility.
82. PAGE DESIGN A rectangular page is designed to contain 64 square inches of print. The margins at the topand bottom of the page are each 1 inch deep. The margins on each side are inches wide. What shouldthe dimensions of the page be so that the least amountof paper is used?
83. AVERAGE SPEED A driver averaged 50 miles per houron the round trip between Akron, Ohio, and Columbus,Ohio, 100 miles away. The average speeds for going andreturning were and miles per hour, respectively.
(a) Show that
(b) Determine the vertical and horizontal asymptotes ofthe graph of the function.
(c) Use a graphing utility to graph the function.
(d) Complete the table.
(e) Are the results in the table what you expected?Explain.
(f) Is it possible to average 20 miles per hour in onedirection and still average 50 miles per hour on theround trip? Explain.
EXPLORATION
84. WRITING Is every rational function a polynomialfunction? Is every polynomial function a rational function? Explain.
TRUE OR FALSE? In Exercises 85–87, determine whetherthe statement is true or false. Justify your answer.
85. A polynomial can have infinitely many vertical asymptotes.
86. The graph of a rational function can never cross one ofits asymptotes.
87. The graph of a function can have a vertical asymptote, ahorizontal asymptote, and a slant asymptote.
LIBRARY OF PARENT FUNCTIONS In Exercises 88 and89, identify the rational function represented by the graph.
88. 89.
(a) (a)
(b) (b)
(c) (c)
(d) (d)
PROJECT: DEPARTMENT OF DEFENSE To work an extendedapplication analyzing the total numbers of the Department ofDefense personnel from 1980 through 2007, visit this text’swebsite at academic.cengage.com. (Data Source: U.S.Department of Defense)
f �x� �x
x2 � 1f �x� �
x � 9x2 � 4
f�x� �x
x2 � 1f �x� �
x � 4x2 � 9
f �x� �x2 � 1x2 � 1
f �x� �x2 � 4x2 � 9
f�x� �x2 � 1x2 � 1
f �x� �x2 � 9x2 � 4
x
y
−1 1 2 3
3
−4 2 4 6
−4
−6
2
4
6
x
y
y �25x
x � 25.
yx
112
x.A
x
y
1 in.
1 in.
2 in. 2 in.
yx
x 30 35 40 45 50 55 60
y
90. CAPSTONE Write a rational function that has thespecified characteristics. (There are many correct answers.)
(a) Vertical asymptote:
Horizontal asymptote:
Zero:
(b) Vertical asymptote:
Horizontal asymptote:
Zero:
(c) Vertical asymptotes:
Horizontal asymptote:
Zeros:
(d) Vertical asymptotes:
Horizontal asymptote:
Zeros: x � 3x � �2,
y � �2
x � 2x � �1,
x � �3,x � 3,
y � 2
x � 1x � �2,
x � 2
y � 0
x � �1
x � 1
y � 0
x � 2
f

Polynomial Inequalities
To solve a polynomial inequality such as you can use the fact that apolynomial can change signs only at its zeros (the -values that make the polynomialequal to zero). Between two consecutive zeros, a polynomial must be entirely positiveor entirely negative. This means that when the real zeros of a polynomial are put inorder, they divide the real number line into intervals in which the polynomial has nosign changes. These zeros are the key numbers of the inequality, and the resultingintervals are the test intervals for the inequality. For instance, the polynomial abovefactors as
and has two zeros, and These zeros divide the real number line intothree test intervals:
and (See Figure 2.52.)
So, to solve the inequality you need only test one value from each ofthese test intervals to determine whether the value satisfies the original inequality. If so,you can conclude that the interval is a solution of the inequality.
FIGURE 2.52 Three test intervals for
You can use the same basic approach to determine the test intervals for any polynomial.
x2 � 2x � 3
x−2−3−4 −1 0 1 2 3 5
Test Interval( , 1)− −
Test Interval( , 3)−1
Test Interval(3, )
4
Zero= 1x −
Zero= 3x
x2 � 2x � 3 < 0,
�3, ��.��1, 3�,���, �1�,
x � 3.x � �1
x2 � 2x � 3 � �x � 1��x � 3�
xx2 � 2x � 3 < 0,
194 Chapter 2 Polynomial and Rational Functions
2.7 NONLINEAR INEQUALITIES
What you should learn
• Solve polynomial inequalities.
• Solve rational inequalities.
• Use inequalities to model and solvereal-life problems.
Why you should learn it
Inequalities can be used to model and solve real-life problems. Forinstance, in Exercise 77 on page 202, a polynomial inequality is used tomodel school enrollment in theUnited States.
Finding Test Intervals for a Polynomial
To determine the intervals on which the values of a polynomial are entirely negative or entirely positive, use the following steps.
1. Find all real zeros of the polynomial, and arrange the zeros in increasing order(from smallest to largest). These zeros are the key numbers of the polynomial.
2. Use the key numbers of the polynomial to determine its test intervals.
3. Choose one representative -value in each test interval and evaluate the polynomial at that value. If the value of the polynomial is negative, the polynomial will have negative values for every -value in the interval. If thevalue of the polynomial is positive, the polynomial will have positive valuesfor every -value in the interval.x
x
x
Elle
n Se
nisi
/The
Imag
e W
orks

Section 2.7 Nonlinear Inequalities 195
Solving a Polynomial Inequality
Solve
Solution
By factoring the polynomial as
you can see that the key numbers are and So, the polynomial’s test intervals are
and Test intervals
In each test interval, choose a representative -value and evaluate the polynomial.
Test Interval x-Value Polynomial Value Conclusion
Positive
Negative
Positive
From this you can conclude that the inequality is satisfied for all -values in This implies that the solution of the inequality is the interval
as shown in Figure 2.53. Note that the original inequality contains a “less than”symbol. This means that the solution set does not contain the endpoints of the test interval
FIGURE 2.53
Now try Exercise 21.
As with linear inequalities, you can check the reasonableness of a solution by substituting -values into the original inequality. For instance, to check the solutionfound in Example 1, try substituting several -values from the interval into theinequality
Regardless of which -values you choose, the inequality should be satisfied.You can also use a graph to check the result of Example 1. Sketch the graph of
as shown in Figure 2.54. Notice that the graph is below the -axis on the interval
In Example 1, the polynomial inequality was given in general form (with the polynomial on one side and zero on the other). Whenever this is not the case, youshould begin the solution process by writing the inequality in general form.
��2, 3�.xy � x2 � x � 6,
x
x2 � x � 6 < 0.
��2, 3�xx
x
−6 −5 −4 −3 −2 −1 0 1 2 3 4 5 6 7
Choose = 3.( + 2)( 3) > 0
xx x
−−
Choose =( + 2)( 3) > 0
xx x
4.−
Choose =( + 2)( 3) < 0
xx x
0.−
��2, 3�.
��2, 3�,x2 � x � 6 < 0
��2, 3�.x
�4�2 � �4� � 6 � 6x � 4�3, ��
�0�2 � �0� � 6 � �6x � 0��2, 3�
��3�2 � ��3� � 6 � 6x � �3���, �2�
x
�3, ��.��2, 3�,���, �2�,
x � 3.x � �2
x2 � x � 6 � �x � 2��x � 3�
x2 � x � 6 < 0.
Example 1
You can review the techniquesfor factoring polynomials inAppendix A.3.
x2 51−1 4
2
1
−6
−7
−2
−3
−3−4
y x x= 62 − −
y
FIGURE 2.54

Solving a Polynomial Inequality
Solve 4x2 � 5x > 6.
Example 3
Solving a Polynomial Inequality
Solve
Solution
Write in general form.
Factor.
The key numbers are and and the test intervals are
and
Test Interval x-Value Polynomial Value Conclusion
Negative
Positive
Negative
Positive
From this you can conclude that the inequality is satisfied on the open intervals andSo, the solution set is as shown in Figure 2.55.
FIGURE 2.55
Now try Exercise 27.
−6
x
−5 −4 −3 −2 −1 0 1 2 3 4 5 6−7
Choose =( 4)( + 4)(2 3) > 0
xx x x
0.− −
Choose = 5.( 4)( + 4)(2 3) > 0
xx x x− −
Choose =( 4)( + 4)(2 3) < 0
xx x x
−5.− −
Choose = 2( 4)( + 4)(2 3) < 0
xx x x
.− −
��4, 32�� �4, ��,�4, ��.
��4, 32�
2�5�3 � 3�5�2 � 32�5� � 48x � 5�4, ��
2�2�3 � 3�2�2 � 32�2� � 48x � 2�32, 4�2�0�3 � 3�0�2 � 32�0� � 48x � 0��4, 3
2�2��5�3 � 3��5�2 � 32��5� � 48x � �5���, �4�
�4, ��.���, �4�, ��4, 32�, � 3
2, 4�,x � 4,x � �4, x �
32,
�x � 4��x � 4��2x � 3� > 0
2x3 � 3x2 � 32x � 48 > 0
2x3 � 3x2 � 32x > �48.
Example 2
196 Chapter 2 Polynomial and Rational Functions
Algebraic Solution
Write in general form.
Factor.
Key Numbers:
Test Intervals:
Test: Is
After testing these intervals, you can see that the polynomial is positive on the openintervals and So, the solution set
of the inequality is
Now try Exercise 23.
���, �34�� �2, ��.
�2, ��.���, �34�
4x2 � 5x � 6
�x � 2��4x � 3� > 0?
���, �34�, ��3
4, 2�, �2, ��
x � 2x � �34,
�x � 2��4x � 3� > 0
4x2 � 5x � 6 > 0
Graphical Solution
First write the polynomial inequality asThen use a graphing utility to graph
In Figure 2.56, you can see that the graph is abovethe -axis when is less than or when is greater than 2. So, you
can graphically approximate the solution set to be
FIGURE 2.56
−10
−2 3
6
(2, 0)− , 034( (
y = 4x2 − 5x − 6
���, �34�� �2, ��.
x�34xx
y � 4x2 � 5x � 6.4x2 � 5x � 6 > 0.
4x2 � 5x > 6

Section 2.7 Nonlinear Inequalities 197
When solving a polynomial inequality, be sure you have accounted for theparticular type of inequality symbol given in the inequality. For instance, in Example 3,note that the original inequality contained a “greater than” symbol and the solution consisted of two open intervals. If the original inequality had been
the solution would have consisted of the intervals and Each of the polynomial inequalities in Examples 1, 2, and 3 has a solution set that
consists of a single interval or the union of two intervals. When solving the exercisesfor this section, watch for unusual solution sets, as illustrated in Example 4.
Unusual Solution Sets
a. The solution set of the following inequality consists of the entire set of real numbers, In other words, the value of the quadratic is positive for every real value of
b. The solution set of the following inequality consists of the single real number because the quadratic has only one key number, and it is theonly value that satisfies the inequality.
c. The solution set of the following inequality is empty. In other words, the quadraticis not less than zero for any value of
d. The solution set of the following inequality consists of all real numbers except In interval notation, this solution set can be written as
Now try Exercise 29.
x2 � 4x � 4 > 0
���, 2�� �2, ��.x � 2.
x2 � 3x � 5 < 0
x.x2 � 3x � 5
x2 � 2x � 1 � 0
x � �1,x2 � 2x � 1��1�,
x2 � 2x � 4 > 0
x.x2 � 2x � 4���, ��.
Example 4
2, ��.���, �34
4x2 � 5x � 6
You may find it easier to determine the sign of a polynomial from its factoredform. For instance, in Example 3, if the test value is substituted into the factored form
you can see that the sign pattern of the factors is
which yields a negative result. Try using the factored forms of the polynomials todetermine the signs of the polynomials in the test intervals of the other examples in this section.
� � �� � �
�x � 2��4x � 3�
x � 1

Rational Inequalities
The concepts of key numbers and test intervals can be extended to rational inequalities.To do this, use the fact that the value of a rational expression can change sign only atits zeros (the -values for which its numerator is zero) and its undefined values (the-values for which its denominator is zero). These two types of numbers make up the
key numbers of a rational inequality. When solving a rational inequality, begin by writing the inequality in general form with the rational expression on the left and zeroon the right.
Solving a Rational Inequality
Solve
Solution
Write original inequality.
Write in general form.
Find the LCD and subtract fractions.
Simplify.
Key numbers: Zeros and undefined values of rational expression
Test intervals:
Test: Is
After testing these intervals, as shown in Figure 2.57, you can see that the inequality is
satisfied on the open intervals and Moreover, because
when you can conclude that the solution set consists of all real numbers in theintervals (Be sure to use a closed interval to indicate that can equal8.)
FIGURE 2.57
Now try Exercise 45.
x
4 5 6 7 8 9
Choose = 6.x
> 0
Choose = 9.xChoose = 4.x
< 0< 0−x + 8x − 5
−x + 8x − 5
−x + 8x − 5
x���, 5�� 8, ��.x � 8,
�x � 8
x � 5� 0�8, ��.(��, 5)
�x � 8
x � 5� 0?
���, 5�, �5, 8�, �8, ��
x � 5, x � 8
�x � 8
x � 5� 0
2x � 7 � 3x � 15
x � 5� 0
2x � 7
x � 5� 3 � 0
2x � 7
x � 5� 3
2x � 7
x � 5� 3.
Example 5
xx
198 Chapter 2 Polynomial and Rational Functions
In Example 5, if you write 3 asyou should be able to see that
the LCD (least common denom-inator) is So, you can rewrite the generalform as
which simplifies as shown.
2x � 7x � 5
�3�x � 5�
x � 5� 0,
�x � 5��1� � x � 5.
31,

Section 2.7 Nonlinear Inequalities 199
Applications
One common application of inequalities comes from business and involves profit,revenue, and cost. The formula that relates these three quantities is
Increasing the Profit for a Product
The marketing department of a calculator manufacturer has determined that the demandfor a new model of calculator is
Demand equation
where is the price per calculator (in dollars) and represents the number of calculators sold. (If this model is accurate, no one would be willing to pay $100 for thecalculator. At the other extreme, the company couldn’t sell more than 10 million calculators.) The revenue for selling calculators is
Revenue equation
as shown in Figure 2.58. The total cost of producing calculators is $10 per calculatorplus a development cost of $2,500,000. So, the total cost is
Cost equation
What price should the company charge per calculator to obtain a profit of at least$190,000,000?
Solution
VerbalModel:
Equation:
To answer the question, solve the inequality
When you write the inequality in general form, find the key numbers and the test intervals, and then test a value in each test interval, you can find the solution to be
as shown in Figure 2.59. Substituting the -values in the original price equation showsthat prices of
will yield a profit of at least $190,000,000.
Now try Exercise 75.
$45.00 � p � $65.00
x
3,500,000 � x � 5,500,000
�0.00001x2 � 90x � 2,500,000 � 190,000,000.
P � 190,000,000
P � �0.00001x2 � 90x � 2,500,000
P � 100x � 0.00001x2 � �10x � 2,500,000�
P � R � C
Cost�Revenue�Profit
C � 10x � 2,500,000.
x
� x�100 � 0.00001x�R � xp
x
xp
0 � x � 10,000,000p � 100 � 0.00001x,
Example 6
P � R � C.
Cost�Revenue�Profit
Number of units sold(in millions)
Prof
it (i
n m
illio
ns o
f do
llars
)
0 2 4 6 8 10
x
P
−100
−50
0
50
100
150
200
Calculators
FIGURE 2.59
Number of units sold(in millions)
Rev
enue
(in
mill
ions
of
dolla
rs)
0 2 4 6 8x
R
10
50
100
150
200
250
Calculators
FIGURE 2.58

Another common application of inequalities is finding the domain of an expression that involves a square root, as shown in Example 7.
Finding the Domain of an Expression
Find the domain of 64 � 4x2.
Example 7
To analyze a test interval, choose a representative -value in the interval and evaluatethe expression at that value. For instance, in Example 7, if you substitute any numberfrom the interval into the expression you will obtain a nonnega-tive number under the radical symbol that simplifies to a real number. If you substitute any number from the intervals and you will obtain a complex number. It might be helpful to draw a visual representation of the intervals, as shown inFigure 2.61.
�4, ��,���, �4�
64 � 4x2,�4, 4
x
200 Chapter 2 Polynomial and Rational Functions
Algebraic Solution
Remember that the domain of an expression is the set of all -valuesfor which the expression is defined. Because is defined(has real values) only if is nonnegative, the domain isgiven by
Write in general form.
Divide each side by 4.
Write in factored form.
So, the inequality has two key numbers: and You canuse these two numbers to test the inequality as follows.
Key numbers:
Test intervals:
Test: For what values of x is
A test shows that the inequality is satisfied in the closed intervalSo, the domain of the expression is the interval
Now try Exercise 59.
�4, 4. 64 � 4x2�4, 4.
64 � 4x2 � 0?
���, �4�, ��4, 4�, �4, ��
x � �4, x � 4
x � 4.x � �4
�4 � x��4 � x� � 0
16 � x2 � 0
64 � 4x2 � 0
64 � 4x2 ≥ 0.64 � 4x2
64 � 4x2x
Graphical Solution
Begin by sketching the graph of the equationas shown in Figure 2.60. From the
graph, you can determine that the -values extend fromto 4 (including and 4). So, the domain of the
expression is the interval
FIGURE 2.60
−2−4−6 2 4 6−2
2
4
6
10
x
y
64 − 4x2y =
�4, 4. 64 � 4x2�4�4
xy � 64 � 4x2,
−4 4
NonnegativeRadicand
ComplexNumber
ComplexNumber
FIGURE 2.61
Profit Analysis Consider the relationship
described on page 199. Write a paragraph discussing why it might be beneficial tosolve if you owned a business. Use the situation described in Example 6 toillustrate your reasoning.
P < 0
P � R � C
CLASSROOM DISCUSSION

Section 2.7 Nonlinear Inequalities 201
EXERCISES See www.CalcChat.com for worked-out solutions to odd-numbered exercises.2.7VOCABULARY: Fill in the blanks.
1. Between two consecutive zeros, a polynomial must be entirely ________ or entirely ________.
2. To solve a polynomial inequality, find the ________ numbers of the polynomial, and use these numbersto create ________ ________ for the inequality.
3. The key numbers of a rational expression are its ________ and its ________ ________.
4. The formula that relates cost, revenue, and profit is ________.
SKILLS AND APPLICATIONS
In Exercises 5–8, determine whether each value of is a solution of the inequality.
Inequality Values
5. (a) (b)
(c) (d)
6. (a) (b)
(c) (d)
7. (a) (b)
(c) (d)
8. (a) (b)
(c) (d)
In Exercises 9–12, find the key numbers of the expression.
9. 10.
11. 12.
In Exercises 13–30, solve the inequality and graph thesolution on the real number line.
13. 14.
15. 16.
17. 18.
19. 20.
21.
22.
23.
24.
25.
26.
27.
28.
29.
30.
In Exercises 31–36, solve the inequality and write thesolution set in interval notation.
31. 32.
33. 34.
35. 36.
GRAPHICAL ANALYSIS In Exercises 37–40, use a graphingutility to graph the equation. Use the graph to approximatethe values of that satisfy each inequality.
Equation Inequalities
37. (a) (b)
38. (a) (b)
39. (a) (b)
40. (a) (b)
In Exercises 41–54, solve the inequality and graph thesolution on the real number line.
41. 42.
43. 44.
45. 46.
47. 48.
49. 50.
51.
52.
53.
54.3x
x � 1�
x
x � 4� 3
3
x � 1�
2x
x � 1> �1
x2 � x � 6
x� 0
x2 � 2x
x2 � 9� 0
1
x�
1
x � 3
1
x � 3�
9
4x � 3
5
x � 6>
3
x � 2
2
x � 5>
1
x � 3
x � 12
x � 2� 3 � 0
x � 6
x � 1� 2 < 0
5 � 7x
1 � 2x� 4
3x � 5
x � 5� 0
x2 � 1
x< 0
4x � 1
x> 0
y � 36y � 0y � x3 � x2 � 16x � 16
y � 6y � 0y �18x3 �
12x
y � 7y � 0y �12x2 � 2x � 1
y � 3y � 0y � �x2 � 2x � 3
x
x4�x � 3� � 0�x � 1�2�x � 2�3 � 0
2x3 � x4 � 0x3 � 4x � 0
4x3 � 12x2 > 04x3 � 6x2 < 0
x2 � 3x � 8 > 0
4x2 � 4x � 1 � 0
2x3 � 13x2 � 8x � 46 � 6
x3 � 3x2 � x > �3
x3 � 2x2 � 4x � 8 � 0
x2 � 3x � 18 > 0
�2x2 � 6x � 15 � 0
3x2 � 11x > 20
x2 > 2x � 8
x2 � 2x � 3 < 0
x2 � 2x > 3x2 � x < 6
x2 � 6x � 9 < 16x2 � 4x � 4 � 9
�x � 3�2 � 1�x � 2�2 � 25
x2 � 16x2 < 9
x
x � 2�
2
x � 11
x � 5� 1
9x3 � 25x23x2 � x � 2
x � 3x � 0
x � �1x � �2
x �92x � �
92
x � 4x � 5
x � �3x � �4
x � 0x � 5x2 � x � 12 � 0
x � �5x �32
x � 0x � 3x2 � 3 < 0
x
x � 2x � 4
� 3
3x2
x2 � 4< 1

202 Chapter 2 Polynomial and Rational Functions
GRAPHICAL ANALYSIS In Exercises 55–58, use a graphingutility to graph the equation. Use the graph to approximatethe values of that satisfy each inequality.
Equation Inequalities
55. (a) (b)
56. (a) (b)
57. (a) (b)
58. (a) (b)
In Exercises 59–64, find the domain of in the expression.Use a graphing utility to verify your result.
59. 60.61. 62.
63. 64.
In Exercises 65–70, solve the inequality. (Round your answersto two decimal places.)
65.
66.
67.
68.
69. 70.
HEIGHT OF A PROJECTILE In Exercises 71 and 72, usethe position equation where represents the height of an object (in feet), represents theinitial velocity of the object (in feet per second), representsthe initial height of the object (in feet), and represents thetime (in seconds).
71. A projectile is fired straight upward from ground levelwith an initial velocity of 160 feet per second.
(a) At what instant will it be back at ground level?
(b) When will the height exceed 384 feet?
72. A projectile is fired straight upward from ground levelwith an initial velocity of 128 feet per second.
(a) At what instant will it be back at ground level?
(b) When will the height be less than 128 feet?
73. GEOMETRY A rectangular playing field with aperimeter of 100 meters is to have an area of at least 500 square meters. Within what bounds must the lengthof the rectangle lie?
74. GEOMETRY A rectangular parking lot with a perimeterof 440 feet is to have an area of at least 8000 square feet.Within what bounds must the length of the rectangle lie?
75. COST, REVENUE, AND PROFIT The revenue andcost equations for a product are and where and are measuredin dollars and represents the number of units sold.How many units must be sold to obtain a profit of atleast $750,000? What is the price per unit?
76. COST, REVENUE, AND PROFIT The revenue andcost equations for a product are
and
where and are measured in dollars and representsthe number of units sold. How many units must be soldto obtain a profit of at least $1,650,000? What is theprice per unit?
77. SCHOOL ENROLLMENT The numbers (in millions)of students enrolled in schools in the United States from1995 through 2006 are shown in the table. (Source:U.S. Census Bureau)
(a) Use a graphing utility to create a scatter plot of the data. Let represent the year, with corresponding to 1995.
(b) Use the regression feature of a graphing utility tofind a quartic model for the data.
(c) Graph the model and the scatter plot in the sameviewing window. How well does the model fit thedata?
(d) According to the model, during what range of yearswill the number of students enrolled in schoolsexceed 74 million?
(e) Is the model valid for long-term predictions of student enrollment in schools? Explain.
t � 5t
N
xCR
C � 12x � 150,000R � x�50 � 0.0002x�
xCRC � 30x � 250,000,
R � x�75 � 0.0005x�
�s0 � 0�
�s0 � 0�
ts0
v0
ss � �16t2 � v0t � s0,
2
3.1x � 3.7> 5.8
1
2.3x � 5.2> 3.4
1.2x2 � 4.8x � 3.1 < 5.3
�0.5x2 � 12.5x � 1.6 > 0
�1.3x2 � 3.78 > 2.12
0.4x2 � 5.26 < 10.2
x
x2 � 9 xx2 � 2x � 35
81 � 4x2 x2 � 9x � 20
x2 � 4 4 � x2
x
y � 0y � 1y �5x
x2 � 4
y � 2y � 1y �2x2
x2 � 4
y � 8y � 0y �2�x � 2�
x � 1
y � 6y � 0y �3x
x � 2
x
Year Number, N
1995
1996
1997
1998
1999
2000
2001
2002
2003
2004
2005
2006
69.8
70.3
72.0
72.1
72.4
72.2
73.1
74.0
74.9
75.5
75.8
75.2

Section 2.7 Nonlinear Inequalities 203
78. SAFE LOAD The maximum safe load uniformlydistributed over a one-foot section of a two-inch-widewooden beam is approximated by the model
where is the depth of thebeam.
(a) Evaluate the model for and Use the results to create a bar
graph.
(b) Determine the minimum depth of the beam that will safely support a load of 2000 pounds.
79. RESISTORS When two resistors of resistances andare connected in parallel (see figure), the total resist-
ance satisfies the equation
Find for a parallel circuit in which ohms andmust be at least 1 ohm.
80. TEACHER SALARIES The mean salaries (in thousandsof dollars) of classroom teachers in the United Statesfrom 2000 through 2007 are shown in the table.
A model that approximates these data is given by
where represents the year, with corresponding to2000. (Source: Educational Research Service,Arlington, VA)
(a) Use a graphing utility to create a scatter plot of thedata. Then graph the model in the same viewingwindow.
(b) How well does the model fit the data? Explain.
(c) According to the model, in what year will the salaryfor classroom teachers exceed $60,000?
(d) Is the model valid for long-term predictions ofclassroom teacher salaries? Explain.
EXPLORATION
TRUE OR FALSE? In Exercises 81 and 82, determinewhether the statement is true or false. Justify your answer.
81. The zeros of the polynomial divide the real number line into four test intervals.
82. The solution set of the inequality isthe entire set of real numbers.
In Exercises 83–86, (a) find the interval(s) for such that the equation has at least one real solution and (b) write a conjecture about the interval(s) based on the values of thecoefficients.
83. 84.
85. 86.
87. GRAPHICAL ANALYSIS You can use a graphing utility to verify the results in Example 4. For instance,the graph of is shown below. Noticethat the -values are greater than 0 for all values of as stated in Example 4(a). Use the graphing utility to graph and
Explain how you can use the graphs toverify the results of parts (b), (c), and (d) of Example 4.
−2
−9 9
10
y � x2 � 4x � 4.y � x2 � 3x � 5,y � x2 � 2x � 1,
x,yy � x2 � 2x � 4
2x2 � bx � 5 � 03x2 � bx � 10 � 0
x2 � bx � 4 � 0x2 � bx � 4 � 0
b
32x2 � 3x � 6 � 0
x3 �2x2 �11x � 12 � 0
t � 0t
S �42.6 � 1.95t
1 � 0.06t
S
E+
_ R1 R2
RR2 � 2R1
1
R�
1
R1
�1
R2
.
RR2
R1
d � 12.d � 10,d � 8,d � 6,d � 4,
dLoad � 168.5d2 � 472.1,
Year Salary, S
2000
2001
2002
2003
2004
2005
2006
2007
42.2
43.7
43.8
45.0
45.6
45.9
48.2
49.388. CAPSTONE Consider the polynomial
and the real number line shown below.
(a) Identify the points on the line at which thepolynomial is zero.
(b) In each of the three subintervals of the line, writethe sign of each factor and the sign of the product.
(c) At what -values does the polynomial changesigns?
x
a bx
�x � a��x � b�

204 Chapter 2 Polynomial and Rational Functions
CHAPTER SUMMARY2What Did You Learn? Explanation/Examples Review
Exercises
Sec
tio
n 2
.3Sec
tio
n2
.4Sec
tio
n 2
.2Sec
tio
n 2
.1
Analyze graphs of quadratic functions (p. 126).
Write quadratic functions in standard form and use the resultsto sketch graphs of functions (p. 129).
Find minimum and maximumvalues of quadratic functions inreal-life applications (p. 131).
Use transformations to sketch graphsof polynomial functions (p. 136).
Use the Leading Coefficient Testto determine the end behavior ofgraphs of polynomial functions(p. 138).
Find and use zeros of polynomialfunctions as sketching aids (p. 139).
Use the Intermediate ValueTheorem to help locate zeros ofpolynomial functions (p. 143).
Use long division to divide poly-nomials by other polynomials (p. 150).
Use synthetic division to dividepolynomials by binomials of theform (p. 153).
Use the Remainder Theorem andthe Factor Theorem (p. 154).
Use the imaginary unit to writecomplex numbers (p. 159).
i
�x � k�
Let and be real numbers with The functiongiven by is called a quadratic function.Its graph is a “U-shaped” curve called a parabola.
The quadratic function is instandard form. The graph of is a parabola whose axis is thevertical line and whose vertex is If theparabola opens upward. If the parabola opens downward.
Consider with vertex
If has a minimum at If has amaximum at
The graph of a polynomial function is continuous (nobreaks, holes, or gaps) and has only smooth, rounded turns.
Consider the graph of When is odd: If the graph falls to the left andrises to the right. If the graph rises to the left andfalls to the right.When is even: If the graph rises to the left andright. If the graph falls to the left and right.
If is a polynomial function and is a real number, the following are equivalent: (1) is a zero of (2) is a solution of the equation (3) is a factorof and (4) is an -intercept of the graph of
Let and be real numbers such that If is a polynomial function such that then, in
takes on every value between and
The Remainder Theorem: If a polynomial is dividedby the remainder is The Factor Theorem: A polynomial has a factor
if and only if
If and are real numbers, is a complex number. Twocomplex numbers and written in standardform, are equal to each other if and only if and b � d.a � c
c � di,a � bia � biba
f�k� � 0.�x � k�f�x�
r � f�k�.x � k,f �x�
f�b�.f �a�fa, b,f �a� � f�b�,
fa < b.ba
f.x�a, 0�f�x�,�x � a�f�x� � 0,
x � af,x � aaf
an < 0,an > 0,n
an < 0,an > 0,n
f�x� � anxn � . . . � a1x � a0.
x � �b��2a�.fa < 0,x � �b��2a�.fa > 0,
�� b2a
, f � b2a��.f�x� � ax2 � bx � c
a < 0,a > 0,�h, k�.x � h
fa � 0,f�x� � a�x � h�2 � k,
f�x� � ax2 � bx � ca � 0.cb,a, 1, 2
3–20
21–24
25–30
31–34
35–44
45– 48
49–54
55–60
61–66
67–70
Dividend Quotient Remainder
Divisor Divisorx2 � 3x � 5
x � 1� x � 2 �
3x � 1
Divisor: Dividend:
Remainder: 1
Quotient: x3 � 3x2 � x � 1
�3 1
1
0�3
�3
�109
�1
�23
1
4�3
1
x4 � 10x2 � 2x � 4x � 3

Chapter Summary 205
What Did You Learn? Explanation/Examples ReviewExercises
Sec
tio
n 2
.6Sec
tio
n 2
.7Sec
tio
n 2
.5Sec
tio
n 2
.4
Add, subtract, and multiply complex numbers (p. 160).
Use complex conjugates to writethe quotient of two complex numbers in standard form (p. 162).
Find complex solutions of quadratic equations (p. 163).
Use the Fundamental Theorem ofAlgebra to find the number of zerosof polynomial functions (p. 166).
Find rational zeros of polynomialfunctions (p. 167), and conjugatepairs of complex zeros (p. 170).
Find zeros of polynomials by factoring (p. 170).
Use Descartes’s Rule of Signs (p. 173) and the Upper and Lower Bound Rules (p. 174) tofind zeros of polynomials.
Find the domains (p. 181), andvertical and horizontal asymptotes(p. 182) of rational functions.
Analyze and sketch graphs ofrational functions (p. 184) includingfunctions with slant asymptotes (p. 187).
Use rational functions to model andsolve real-life problems (p. 188).
Solve polynomial (p. 194) andrational inequalities (p. 198).
Use inequalities to model andsolve real-life problems (p. 199).
Sum:
Difference:
The numbers and are complex conjugates.To write in standard form, multiply thenumerator and denominator by
If is a positive number, the principal square root of thenegative number is defined as
The Fundamental Theorem of AlgebraIf is a polynomial of degree where then hasat least one zero in the complex number system.
The Rational Zero Test relates the possible rational zeros ofa polynomial to the leading coefficient and to the constantterm of the polynomial. Let be a polynomial functionthat has real coefficients. If is a zero of thefunction, the conjugate is also a zero of the function.
Every polynomial of degree with real coefficients can bewritten as the product of linear and quadratic factors with realcoefficients, where the quadratic factors have no real zeros.
Descartes’s Rule of SignsLet bea polynomial with real coefficients and
1. The number of positive real zeros of is either equal tothe number of variations in sign of or less than thatnumber by an even integer.
2. The number of negative real zeros of is either equal tothe number of variations in sign of or less thanthat number by an even integer.
The domain of a rational function of includes all realnumbers except -values that make the denominator zero.The line is a vertical asymptote of the graph of if
or as either from the right orfrom the left. The line is a horizontal asymptote ofthe graph of if as or
Consider a rational function whose denominator is ofdegree 1 or greater. If the degree of the numerator is exactlyone more than the degree of the denominator, the graph ofthe function has a slant asymptote.
A rational function can be used to model the cost of removinga given percent of smokestack pollutants at a utility companythat burns coal. (See Example 8.)
Use the concepts of key numbers and test intervals to solveboth polynomial and rational inequalities.
A common application of inequalities involves profit revenue and cost (See Example 6.)C.R,
P,
x → ��.x →�.f �x�→ bfy � b
x → a,f�x�→ ��f�x�→�fx � a
xx
f��x�f
f�x�f
a0 � 0.f �x� � anxn � an�1x
n�1 � . . . � a2x2 � a1x � a0
n > 0
a � bia � bi �b � 0�f�x�
fn > 0,n,f�x�
�a � ai.�a
a
c � di.�a � bi���c � di�
a � bia � bi
�a � bi� � �c � di� � �a � c� � �b � d�i�a � bi� � �c � di� � �a � c� � �b � d�i 71–78
79–82
83–86
87–92
93–102
103–110
111–114
115–122
123–138
139–142
143–150
151, 152

In Exercises 1 and 2, graph each function. Compare thegraph of each function with the graph of
1. (a)
(b)
(c)
(d)
2. (a)
(b)
(c)
(d)
In Exercises 3–14, write the quadratic function in standardform and sketch its graph. Identify the vertex, axis ofsymmetry, and -intercept(s).
3.
4.
5.
6.
7.
8.
9.
10.
11.
12.
13.
14.
In Exercises 15–20, write the standard form of the equationof the parabola that has the indicated vertex and whosegraph passes through the given point.
15. 16.
17. Vertex: point:
18. Vertex: point:
19. Vertex: point:
20. Vertex: point:
21. GEOMETRY The perimeter of a rectangle is 1000 meters.
(a) Draw a diagram that gives a visual representation ofthe problem. Label the length and width as and respectively.
(b) Write as a function of Use the result to write thearea as a function of
(c) Of all possible rectangles with perimeters of 1000 meters, find the dimensions of the one withthe maximum area.
22. MAXIMUM REVENUE The total revenue earned (indollars) from producing a gift box of candles is given by
where is the price per unit (in dollars).
(a) Find the revenues when the prices per box are $20,$25, and $30.
(b) Find the unit price that will yield a maximum revenue. What is the maximum revenue? Explainyour results.
23. MINIMUM COST A soft-drink manufacturer has dailyproduction costs of
where is the total cost (in dollars) and is the numberof units produced. How many units should be producedeach day to yield a minimum cost?
24. SOCIOLOGY The average age of the groom at a firstmarriage for a given age of the bride can beapproximated by the model
where is the age of the groom and is the age of thebride. Sketch a graph of the model. For what age of thebride is the average age of the groom 26? (Source:U.S. Census Bureau)
In Exercises 25–30, sketch the graphs of andthe transformation.
25.
26.
27.
28.
29.
30. f �x� �12x5 � 3y � x5,
f �x� � �x � 5�5y � x5,
f �x� � 2�x � 8�4y � x4,
f �x� � 6 � x4y � x4,
f �x� � �4x3y � x3,
f �x� � ��x � 2�3y � x3,
y � xn2.2
xy
20 � x � 25y � �0.107x2 � 5.68x � 48.5,
xC
C � 70,000 � 120x � 0.055x2
p
R�p� � �10p2 � 800p
R
x.x.y
y,x
�14, 45��3, 3�;��9
2, �114 ���3
2, 0�;��1, 6��2, 3�;�2, �3��1, �4�;
x−2 2 4 6
2
6
(2, 2)
(0, 3)
y
x4 8
2
−2
−4
−6
(4, 1)
(2, −1)
y
f �x� �12�6x2 � 24x � 22�
f �x� �13�x2 � 5x � 4�
f �x� � 4x2 � 4x � 5
h�x� � x2 � 5x � 4
f �x� � x2 � 6x � 1
h�x� � 4x2 � 4x � 13
f �x�� x2 � 8x � 12
f�t� � �2t2 � 4t � 1
h�x� � 3 � 4x � x2
f �x� � x2 � 8x � 10
f �x� � 6x � x2
g�x� � x2 � 2x
x
k�x� �12x2 � 1
h�x� � �x � 3�2g�x� � 4 � x2
f �x� � x 2 � 4
k�x� � �x � 2�2h�x� � x 2 � 2
g�x� � �2x2
f �x� � 2x2
y � x2.2.1
206 Chapter 2 Polynomial and Rational Functions
REVIEW EXERCISES See www.CalcChat.com for worked-out solutions to odd-numbered exercises.2

Review Exercises 207
In Exercises 31–34, describe the right-hand and left-handbehavior of the graph of the polynomial function.
31.
32.
33.
34.
In Exercises 35–40, find all the real zeros of the polynomialfunction. Determine the multiplicity of each zero and thenumber of turning points of the graph of the function. Use agraphing utility to verify your answers.
35. 36.
37. 38.
39. 40.
In Exercises 41– 44, sketch the graph of the function by (a)applying the Leading Coefficient Test, (b) finding the zeros ofthe polynomial, (c) plotting sufficient solution points, and (d)drawing a continuous curve through the points.
41.
42.
43.
44.
In Exercises 45–48, (a) use the Intermediate Value Theoremand the table feature of a graphing utility to find intervalsone unit in length in which the polynomial function is guaranteed to have a zero. (b) Adjust the table to approximate the zeros of the function. Use the zero or rootfeature of the graphing utility to verify your results.
45.
46.
47.
48.
In Exercises 49–54, use long division to divide.
49. 50.
51.
52.
53.
54.
In Exercises 55–58, use synthetic division to divide.
55. 56.
57.
58.
In Exercises 59 and 60, use synthetic division to determinewhether the given values of are zeros of the function.
59.
(a) (b) (c) (d)
60.
(a) (b) (c) (d)
In Exercises 61 and 62, use the Remainder Theorem and synthetic division to find each function value.
61.
(a) (b)
62.
(a) (b)
In Exercises 63–66, (a) verify the given factor(s) of the function (b) find the remaining factors of (c) use yourresults to write the complete factorization of (d) list all realzeros of and (e) confirm your results by using a graphingutility to graph the function.
Function Factor(s)
63.
64.
65.
66.
In Exercises 67–70, write the complex number in standard form.
67. 68.
69. 70.
In Exercises 71–78, perform the operation and write theresult in standard form.
71.
72.
73. 74.
75. 76.
77.
78. �4 � 7i�2 � �4 � 7i�2(8 � 5i�2
i�6 � i��3 � 2i��10 � 8i��2 � 3i��1 � 6i��5 � 2i�7i�11 � 9i�
� 2
2� 2
2i� � � 2
2� 2
2i�
�7 � 5i� � ��4 � 2i�
�5i � i2i2 � 3i
5 � �498 � �100
2.4
�x � 2��x � 5�f �x�� x4 � 11x3 � 41x2 � 61x � 30
�x � 2��x � 3�f �x�� x4 � 4x3 � 7x2 � 22x � 24
�x � 6�f �x� � 2x3 � 11x2 � 21x � 90
�x � 4�f �x� � x3 � 4x2 � 25x � 28
f,f,
f,f,
g� 2 �g��4�g�t� � 2t5 � 5t4 � 8t � 20
f ��1�f ��3�f �x� � x4 � 10x3 � 24x2 � 20x � 44
x � �1x �23x � �4x � 4
f �x� � 3x3 � 8x2 � 20x � 16
x � 1x � 0x �34x � �1
f �x� � 20x4 � 9x3 � 14x2 � 3x
x
5x3 � 33x2 � 50x � 8x � 4
2x3 � 25x2 � 66x � 48
x � 8
0.1x3 � 0.3x2 � 0.5
x � 5
6x4 � 4x3 � 27x 2 � 18x
x � 2
6x4 � 10x3 � 13x2 � 5x � 2
2x2 � 1
x4 � 3x3 � 4x2 � 6x � 3
x2 � 2
3x4
x2 � 1
5x3 � 21x2 � 25x � 4
x2 � 5x � 1
4x � 7
3x � 2
30x2 � 3x � 8
5x � 3
2.3
f �x� � 7x4 � 3x3 � 8x2 � 2
f �x� � x4 � 5x � 1
f �x� � 0.25x3 � 3.65x � 6.12
f �x� � 3x3 � x2 � 3
h�x� � 3x2 � x4
f �x� � x�x3 � x2 � 5x � 3�g�x� � 2x3 � 4x2
f �x� � �x3 � x2 � 2
g�x�� x4 � x3 � 12x2f �x� � �18x3 � 12x2
f �x� � x3 � 8x2f�t� � t3 � 3t
f �x� � x�x � 3�2f �x� � 3x2 � 20x � 32
h�x� � �x7 � 8x2 � 8x
g�x� �34�x4 � 3x2 � 2�
f �x� �12 x3 � 2x
f �x� � �2x2 � 5x � 12

208 Chapter 2 Polynomial and Rational Functions
In Exercises 79 and 80, write the quotient in standard form.
79. 80.
In Exercises 81 and 82, perform the operation and write theresult in standard form.
81. 82.
In Exercises 83–86, find all solutions of the equation.
83. 84.
85. 86.
In Exercises 87–92, find all the zeros of the function.
87.
88.
89.
90.
91.
92.
In Exercises 93 and 94, use the Rational Zero Test to list allpossible rational zeros of
93.
94.
In Exercises 95–100, find all the rational zeros of the function.
95.
96.
97.
98.
99.
100.
In Exercises 101 and 102, find a polynomial function withreal coefficients that has the given zeros. (There are manycorrect answers.)
101. 102.
In Exercises 103–106, use the given zero to find all the zerosof the function.
Function Zero
103.
104.
105.
106.
In Exercises 107–110, find all the zeros of the function andwrite the polynomial as a product of linear factors.
107.
108.
109.
110.
In Exercises 111 and 112, use Descartes’s Rule of Signs todetermine the possible numbers of positive and negativezeros of the function.
111.
112.
In Exercises 113 and 114, use synthetic division to verify theupper and lower bounds of the real zeros of
113.
(a) Upper: (b) Lower:
114.
(a) Upper: (b) Lower:
In Exercises 115–118, find the domain of the rationalfunction.
115. 116.
117. 118.
In Exercises 119–122, identify any vertical or horizontalasymptotes.
119. 120.
121. 122.
In Exercises 123–134, (a) state the domain of the function, (b) identify all intercepts, (c) find any vertical and horizontalasymptotes, and (d) plot additional solution points as needed to sketch the graph of the rational function.
123. 124.
125. 126.
127. 128.
129. 130. h�x� �9
�x � 3�2f �x� �
x
x2 � 1
f �x� �2x
x2 � 4p�x� �
5x2
4x2 � 1
h�x� �x � 4
x � 7g�x� �
2 � x
1 � x
f �x� �4
xf �x� �
�3
2x2
h�x� �x3 � 4x2
x2 � 3x � 2h�x� �
5x � 20x2 � 2x � 24
f �x� �2x2 � 5x � 3
x2 � 2f �x� �
4x � 3
f �x� �x2 � x � 2
x2 � 4f �x� �
8x2 � 10x � 24
f �x� �4x3
2 � 5xf �x� �
3xx � 10
2.6
x � �4x � 8
f �x� � 2x3 � 5x2 � 14x � 8
x � �14x � 1
f �x� � 4x3 � 3x2 � 4x � 3
f.
h�x� � �2x5 � 4x3 � 2x2 � 5
g�x� � 5x3 � 3x2 � 6x � 9
f �x� � x4 � 8x3 � 8x2 � 72x � 153
g�x� � x4 � 4x3 � 3x2 � 40x � 208
g�x� � x3 � 7x2 � 36
f �x� � x3 � 4x2 � 5x
1 � if �x�� 4x4 � 11x3 � 14x2 � 6x
2 � ig�x�� 2x4 � 3x3 � 13x2 � 37x � 15
�4ih �x� � �x3 � 2x2 � 16x � 32
if �x� � x3 � 4x2 � x � 4
1 � 2i�3,2, 3 i4,23,
f �x� � 25x4 � 25x3 � 154x2 � 4x � 24
f �x� � x4 � x3 � 11x2 � x � 12
f �x� � x3 � 9x2 � 24x � 20
f �x� � x3 � 10x2 � 17x � 8
f �x� � 4x3 � 27x2 � 11x � 42
f �x� � x3 � 3x2 � 28x � 60
f �x� � 3x4 � 4x3 � 5x2 � 8
f �x� � �4x3 � 8x 2 � 3x � 15
f.
f �x� � �x � 8��x � 5�2�x � 3 � i��x � 3 � i�f �x� � �x � 4��x � 6��x � 2i��x � 2i�f �x� � x3 � 10x
f �x� � x2 � 11x � 18
f �x� � �x � 4��x � 9�2f �x� � 4x�x � 3�2
2.5
6x2 � 3x � 27 � 0x2 � 2x � 10 � 0
2 � 8x2 � 05x2 � 2 � 0
1
2 � i�
5
1 � 4i
4
2 � 3i�
2
1 � i
8 � 5i
i
6 � i
4 � i
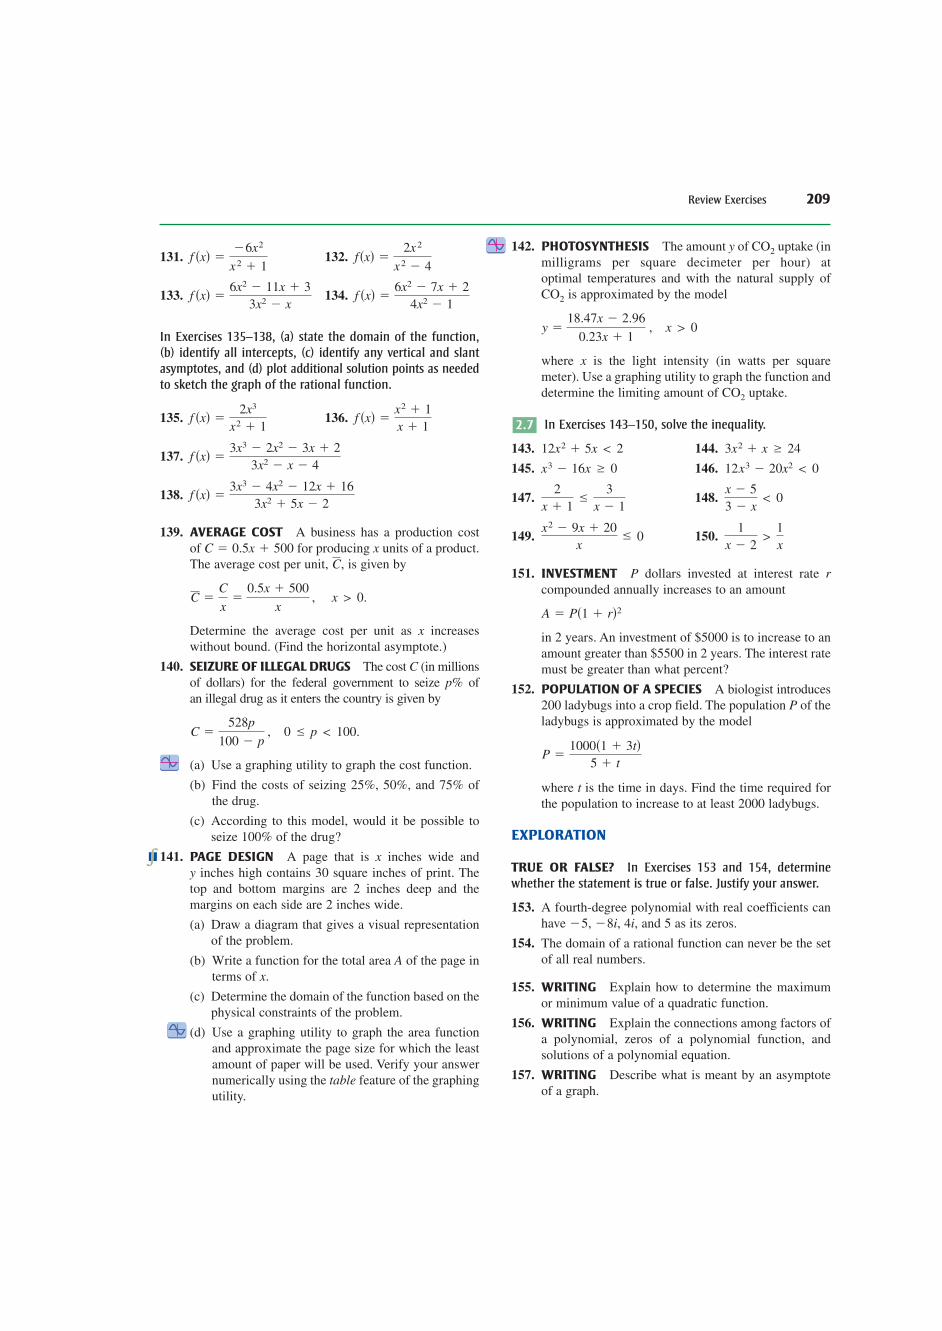
Review Exercises 209
131. 132.
133. 134.
In Exercises 135–138, (a) state the domain of the function, (b) identify all intercepts, (c) identify any vertical and slantasymptotes, and (d) plot additional solution points as neededto sketch the graph of the rational function.
135. 136.
137.
138.
139. AVERAGE COST A business has a production cost of for producing units of a product.The average cost per unit, is given by
Determine the average cost per unit as increaseswithout bound. (Find the horizontal asymptote.)
140. SEIZURE OF ILLEGAL DRUGS The cost (in millionsof dollars) for the federal government to seize of an illegal drug as it enters the country is given by
(a) Use a graphing utility to graph the cost function.
(b) Find the costs of seizing 25%, 50%, and 75% ofthe drug.
(c) According to this model, would it be possible toseize 100% of the drug?
141. PAGE DESIGN A page that is inches wide and inches high contains 30 square inches of print. The
top and bottom margins are 2 inches deep and the margins on each side are 2 inches wide.
(a) Draw a diagram that gives a visual representationof the problem.
(b) Write a function for the total area of the page interms of
(c) Determine the domain of the function based on thephysical constraints of the problem.
(d) Use a graphing utility to graph the area functionand approximate the page size for which the leastamount of paper will be used. Verify your answernumerically using the table feature of the graphingutility.
142. PHOTOSYNTHESIS The amount of uptake (inmilligrams per square decimeter per hour) at optimal temperatures and with the natural supply of
is approximated by the model
where is the light intensity (in watts per squaremeter). Use a graphing utility to graph the function anddetermine the limiting amount of uptake.
In Exercises 143–150, solve the inequality.
143. 144.
145. 146.
147. 148.
149. 150.
151. INVESTMENT dollars invested at interest rate compounded annually increases to an amount
in 2 years. An investment of $5000 is to increase to anamount greater than $5500 in 2 years. The interest ratemust be greater than what percent?
152. POPULATION OF A SPECIES A biologist introduces200 ladybugs into a crop field. The population of theladybugs is approximated by the model
where is the time in days. Find the time required forthe population to increase to at least 2000 ladybugs.
EXPLORATION
TRUE OR FALSE? In Exercises 153 and 154, determinewhether the statement is true or false. Justify your answer.
153. A fourth-degree polynomial with real coefficients canhave and 5 as its zeros.
154. The domain of a rational function can never be the setof all real numbers.
155. WRITING Explain how to determine the maximumor minimum value of a quadratic function.
156. WRITING Explain the connections among factors ofa polynomial, zeros of a polynomial function, andsolutions of a polynomial equation.
157. WRITING Describe what is meant by an asymptoteof a graph.
4i,�8i,�5,
t
P �1000�1 � 3t�
5 � t
P
A � P�1 � r�2
rP
1x � 2
>1x
x2 � 9x � 20x
� 0
x � 53 � x
< 02
x � 1�
3x � 1
12x3 � 20x2 < 0x3 � 16x � 0
3x2 � x � 2412x2 � 5x < 2
2.7
CO2
x
x > 0y �18.47x � 2.96
0.23x � 1,
CO2
CO2y
x.A
yx
0 � p < 100.C �528p
100 � p,
p%C
x
x > 0.C �C
x�
0.5x � 500
x,
C,xC � 0.5x � 500
f �x� �3x3 � 4x2 � 12x � 16
3x2 � 5x � 2
f �x� �3x3 � 2x2 � 3x � 2
3x2 � x � 4
f �x� �x2 � 1x � 1
f �x� �2x3
x2 � 1
f �x� �6x2 � 7x � 2
4x2 � 1f �x� �
6x2 � 11x � 33x2 � x
f�x� �2x2
x2 � 4f �x� �
�6x2
x2 � 1

210 Chapter 2 Polynomial and Rational Functions
CHAPTER TEST See www.CalcChat.com for worked-out solutions to odd-numbered exercises.2Take this test as you would take a test in class. When you are finished, check your workagainst the answers given in the back of the book.
1. Describe how the graph of differs from the graph of
(a) (b)
2. Find an equation of the parabola shown in the figure at the left.
3. The path of a ball is given by where is the height (in feet)of the ball and is the horizontal distance (in feet) from where the ball was thrown.
(a) Find the maximum height of the ball.
(b) Which number determines the height at which the ball was thrown? Doeschanging this value change the coordinates of the maximum height of the ball?Explain.
4. Determine the right-hand and left-hand behavior of the graph of the functionThen sketch its graph.
5. Divide using long division. 6. Divide using synthetic division.
7. Use synthetic division to show that is a zero of the function given by
Use the result to factor the polynomial function completely and list all the real zerosof the function.
8. Perform each operation and write the result in standard form.
(a) (b)
9. Write the quotient in standard form:
In Exercises 10 and 11, find a polynomial function with real coefficients that has thegiven zeros. (There are many correct answers.)
10. 11.
In Exercises 12 and 13, find all the zeros of the function.
12. 13.
In Exercises 14–16, identify any intercepts and asymptotes of the graph of the function.Then sketch a graph of the function.
14. 15. 16.
In Exercises 17 and 18, solve the inequality. Sketch the solution set on the real numberline.
17. 18.2
x�
1
x � 62x2 � 5x > 12
g�x� �x2 � 2
x � 1f �x� �
2x2 � 5x � 12x2 � 16
h�x� �4
x2� 1
f �x� � x4 � 9x2 � 22x � 24f �x� � 3x3 � 14x2 � 7x � 10
1 � 3 i, 2, 20, 3, 2 � i
5
2 � i.
�2 � 3 i��2 � 3 i�10i � �3 � �25 �
f �x� � 2x3 � 5x 2 � 6x � 15.
x �52
2x4 � 5x2 � 3
x � 2
3x3 � 4x � 1
x2 � 1
h �t� � �34t5 � 2t2.
xyy � �
120 x2 � 3x � 5,
g�x� � �x �32�2g�x� � 2 � x2
f �x� � x2.g
x−2−4
−4
2 4 6 8
24
6
−6
(0, 3)
(3, −6)
y
FIGURE FOR 2