plant-endophyte interplay protects tomato against a virulent verticillium dahliae
DESCRIPTION
A ThesisPresented toThe Faculty of Graduate StudiesofThe University of GuelphbyHAKEEM OLALEKAN SHITTUTRANSCRIPT
PLANT-ENDOPHYTE INTERPLAY PROTECTS TOMATO AGAINST A
VIRULENT VERTICILLIUM DAHLIAE
A Thesis
Presented to
The Faculty of Graduate Studies
of
The University of Guelph
by
HAKEEM OLALEKAN SHITTU
In partial fulfilment of requirements
for the degree of
Doctor of Philosophy
April, 2010
© Hakeem Olalekan Shittu, 2010
ABSTRACT
PLANT-ENDOPHYTE INTERPLAY PROTECTS TOMATO AGAINST A
VIRULENT VERTICILLIUM DAHLIAE
Hakeem Olalekan Shittu Advisor
University of Guelph, 2010 Professor E. J. Robb
When tomato Craigella is infected with Verticillium dahliae Dvd-E6 (Dvd-E6), a tolerant
state is induced with substantial pathogen load, but few symptoms. Unexpectedly, these
plants are more robust and taller with Dvd-E6 behaving as an endophyte. Some
endophytes can protect plants from virulent pathogens. This research was undertaken to
improve understanding of the cellular and molecular nature of Verticillium tolerance in
tomato, especially whether infection by Dvd-E6 can protect Craigella from virulent V.
dahliae, race 1 (Vd1). To permit mixed infection experiments a restriction fragment
length polymorphism (RFLP)-based assay was developed and used for differentiating
Dvd-E6 from Vd1, when present in mixed infections. The results suggested that
protection involves molecular interplay between Dvd-E6 and Vd1 in susceptible
Craigella (CS) tomatoes, resulting in restricted Vd1 colonization. Further studies showed
a dramatic reduction of Vd1 spores and mycelia. To examine genetic changes that
account for these biological changes, a customized DNA chip (TVR) was used to analyze
defense gene mRNA levels. The defense gene response was categorized into four groups.
Group 1 was characterized by strong induction of defense genes followed by suppression.
However, Vd1-induced gene suppression was blocked by Dvd-E6 in mixed infections.

These genes included some transcription factors and PR proteins such as class IV
chitinases and beta glucanases which are known to target fungal spores and mycelia.
Experiments also were repeated with a Craigella resistant (CR) isoline containing a fully
active Ve locus (Ve1+ and Ve2
+). The biological results showed that the presence of the
Ve1+ allele resulted in restricted Vd1 colonization and, in a mixed infection with Dvd-E6,
Vd1 was completely eliminated from the plant stem. Surprisingly, there was no
significant increase in defense gene mRNAs. Rather, elevated basal levels of defense
gene products appeared sufficient to combat pathogen attack. To investigate functional
effects of the genetic changes observed, an inducible RNAi knockdown vector for a
defense gene (TUS15G8) with unknown function (pMW4-TUS15G8) as well as the Ve2
resistance gene (pMW-Ve2) was prepared as a initial step for future transformation
analyses. Taken together the results reveal intriguing but complex biological and
molecular changes in mixed infections, which remain a basis for future experiments and
potential agricultural benefits.
i
ACKNOWLEDGEMENTS
First, I wish to extend my profound gratitude to my advisor, Dr. Jane. E. Robb,
for her great tolerance, advice and encouragement throughout my Ph. D. program. I really
appreciate her untiring efforts in reading my manuscript to attain a professional standard.
I shall remain grateful to Dr. Ross N. Nazar for his training assistance and constructive
criticism of my work to bring the best out of me. He has opened my eyes towards critical
thinking of scientific research. His contributions towards my manuscript are also
appreciated. Special thanks to my advisory committee member, Dr. Greg Boland, who
also supported me with various scientific suggestions, advice and for taking time to
meticulously go over my dissertation.
Special thanks to Ms. Barbara Lee, who was my first teacher in the laboratory. I
am grateful to Ms. Jing Zhang for her technical assistance with microarray
hybridizations. I extend my appreciation to all my past and present laboratory colleagues,
especially Danve M. Castroverde, for their assistance during the course of my program. I
thank all the members of the Department of Molecular and Cellular Biology, University
of Guelph.
I am highly indebted to my beloved friends: Dr. Bamidele Adekunle, Grand
master Omar Abdool, Kamran Haq & Lorraine, Dr. Muhammad Attiq Rehman & Javeria,
Dr. Akym Assani, Oyediran’s family, Momina Mir, Dr. Juan Carlos Juárez Ayala,
Jeremiah Saringe, Dr. Yanfen J. Jiang, Dr. Latifa Ziani, Kathy Hanneson, Eric & Gale
Maginnis.
I am highly indebted to Canadian Commonwealth Scholarship and Fellowship
Plan for financial backing throughout my Ph.D. program. Special thanks are extended to
Natural Sciences and Engineering Research Council (NSERC), Canada for the financial
support from my advisors in completing my program. Special thanks to my home
institution, University of Benin, Nigeria for the training leave granted to me.
Finally, great appreciation to my dad, mum, step mum, siblings, loved ones and
all friends back home in Nigeria for their continuous prayers and well wishes for me. To
God Almighty be the Glory.

ii
TABLE OF CONTENTS
ABSTRACT .................................................................................................................... i
ACKNOWLEDGEMENTS ................................................................................................. i
TABLE OF CONTENTS .................................................................................................... ii
LIST OF TABLES ............................................................................................................ vii
LIST OF FIGURES ......................................................................................................... viii
ABBREVIATIONS ........................................................................................................... xi
CHAPTER 1 : General Introduction ....................................................................................1
1.1 Introduction ............................................................................................................1
1.2 Verticillium wilts ...................................................................................................3
1.2.1 Verticillium spp. ..............................................................................................3
1.2.2 Host plants ......................................................................................................5
1.2.3 Tomato as a host and model plant ..................................................................6
1.2.4 The Verticillium disease cycle ........................................................................8
1.2.5 Symptomology and epidemiology ................................................................10
1.2.6 Economic importance and disease management ..........................................12
1.3 Verticillium spp./host plant interactions ..............................................................14
1.3.1 Mechanism of Verticillium pathogenicity ....................................................14
1.3.2 Mechanism of plant defense against Verticillium spp. infection ..................16
1.4 Plant disease tolerance .........................................................................................18
1.4.1 Verticillium wilts and the nature of tolerance ...............................................20
1.4.2 Measurement of plant disease tolerance .......................................................22
1.5 Molecular techniques and plant disease ..............................................................23
1.5.1 Quantitative diagnostic tools ........................................................................23
1.5.2 Analyses of gene expression .........................................................................25

iii
1.5.3 Functional genomics and plant disease ........................................................28
1.6 Thesis overview ...................................................................................................31
CHAPTER 2 : Mixed Verticillium spp. Interactions in Tomato’, ......................................36
2.1 Introduction ..........................................................................................................36
2.2 Materials and methods .........................................................................................38
2.2.1 Pathogens ......................................................................................................38
2.2.2 Plants ............................................................................................................39
2.2.3 Plant inoculation and symptom scoring ........................................................39
2.2.4 Preparation of Verticillium genomic DNAs .................................................40
2.2.5 Quantification of fungal DNA in infected plant tissues ...............................41
2.2.6 DNA sequence analyses ...............................................................................43
2.2.7 cDNA labeling and microarray analysis .......................................................43
2.2.8 Quantitative RT-PCR analyses .....................................................................44
2.3 Results..................................................................................................................46
2.3.1 Amounts of fungal DNA in infected plants ..................................................46
2.3.2 Can Dvd-E6 colonization protect Craigella tomatoes? ................................49
2.3.3 How was the Verticillium isolates differentiated in mixed infections ..........53
2.3.4 Does order of inoculation matter? ................................................................57
2.3.5 Does cross-protection occur in the root? ......................................................61
2.3.6 How does the Dvd-E6 isolate restrict colonization by Vd1? ........................63
2.3.7 Is Dvd-E6-induced Verticillium protection in tomato range
restricted? ......................................................................................................68
2.4 Discussion ............................................................................................................71
CHAPTER 3 : Spore Levels in Mixed Verticillium Infections of Tomato ........................75
3.1 Introduction ..........................................................................................................75
3.2 Materials and methods .........................................................................................76
iv
3.2.1 Pathogens and plants ....................................................................................76
3.2.2 Plant infection and sampling ........................................................................76
3.2.3 Spore levels in infected plant tissues ............................................................77
3.2.4 Determination of spore viability ...................................................................77
3.2.5 Quantification of fungal and spore DNA .....................................................78
3.3 Results..................................................................................................................78
3.3.1 Preparation of spores from tissue macerates ................................................78
3.3.2 Disease assessment of infected plants ..........................................................80
3.3.3 Levels of sporulation in mixed infections ....................................................82
3.3.4 Relative amounts of Verticillium spore DNA in mixed infections ...............83
3.3.5 Are isolate Vd1 spores viable? .....................................................................85
3.3.6 What constitutes the fungal biomass? ..........................................................86
3.4 Discussion ............................................................................................................88
CHAPTER 4 : Defence Gene Responses in Mixed Infections with V. dahliae race
1 and Dvd-E6 Isolates ..............................................................................94
4.1 Introduction ..........................................................................................................94
4.2 Materials and methods .........................................................................................95
4.2.1 Pathogens and plants ....................................................................................95
4.2.2 Plant infection and symptom expression scoring .........................................95
4.2.3 Quantification of fungal DNA in infected plant tissues ...............................96
4.2.4 Microarray analyses ......................................................................................96
4.2.5 Quantitative RT-PCR analyses ...................................................................100
4.3 Results................................................................................................................100
4.3.1 Disease scores in V. dahliae infected CS tomatoes ....................................100
4.3.2 Amount of fungal DNA in V. dahliae infected CS tomatoes .....................102
4.3.3 Genetic changes in CS/Verticillium dahliae interactions ...........................103
v
4.3.4 Characteristics changes in defense gene responses ....................................109
4.3.5 Comparison of mRNA levels using alternate assays ..................................127
4.3.6 Effect of the Ve1 gene on Craigella/Verticillium interactions ....................128
4.3.7 Effect of the Ve1+ allele on the defense gene responses ............................131
4.4 Discussion ..........................................................................................................139
CHAPTER 5 : Altered Defense Gene Expression by RNAi Knockdown .......................151
5.1 Introduction ........................................................................................................151
5.2 Materials and methods .......................................................................................152
5.2.1 Ethanol inducible RNAi vector construction ..............................................152
5.2.2 Agrobacterium-mediated tomato transformation .......................................156
5.2.3 Assay for plasmid DNA .............................................................................162
5.2.4 Assay for plasmid-derived RNA ................................................................163
5.3 Results................................................................................................................163
5.3.1 Preparation of inducible RNAi knockdown vectors ...................................163
5.3.2 Preparation of transgenic plants .................................................................169
5.3.3 Detection of plasmid DNA in transformed tomato ....................................173
5.3.4 Induction of RNAi in transformed tomato .................................................174
5.4 Discussion ..........................................................................................................176
CHAPTER 6 : General Conclusions ................................................................................179
6.1 Conclusions........................................................................................................179
6.2 Agricultural potentials .......................................................................................184
6.3 Further technological advances .........................................................................186
BIBLIOGRAPHY ............................................................................................................188
APPENDIX I: List of Primers Used For This Thesis Research ......................................213
APPENDIX II: Conversion Factors .................................................................................214

vi
(A) Conversion from Vd1 or Vaa standard curve values to ng fungal DNA/g
plant tissue .........................................................................................................214
(B) Correction factor for the short Vd1 DNA restriction fragment .........................214
(C) Conversion factor for calculating number of spores/ml/g plant tissue ..............215
APPENDIX III: Raw Data for Calculating Vd1 and Vaa Standard Curves ....................216
APPENDIX IV: Log2 Ratios of CS Defence Genes ........................................................218

vii
LIST OF TABLES
Table 2-1: Expression of resistance and defense genes in CS tomato infected with
Vd1 or Dvd-E6 at 6 dpi .................................................................................... 68
Table 4-1: Antagonistic effect of Vd1 and Dvd-E6 isolates on beta carotene
hydroxylase gene expression. ......................................................................... 111
Table 4-2: List of Group 1 defense genes in CS tomato .................................................. 113
Table 4-3: List of Group 2 defense genes in CS tomato .................................................. 118
Table 4-4: List of Group 3 defense genes in CS tomato .................................................. 123
Table 4-5: List of Group 4 defense genes in CS tomato .................................................. 126
Table 4-6: Comparison of mRNA levels using alternative assays ................................... 128
Table 4-7: Group 1 defense gene mRNA levels in CR tomato ........................................ 134
Table 4-8: Group 2 defense gene mRNA levels in CR tomato ........................................ 136
Table 4-9: Group 3 defense gene mRNA levels in CR tomato ........................................ 138
Table 4-10: Group 4 defense gene mRNA levels in CR tomato ........................................ 139
Table 5-1: List of primers used for PCR amplifications for the construction and
characterization of TUS15G8 and Ve2 RNAi vectors .................................... 156
Table 5-2: Hormones for tomato transformation ............................................................. 161
Table 5-3: YEP media composition for tomato transformation ....................................... 161
Table 5-4: MSO composition ........................................................................................... 161
Table 5-5: Media for tomato transformation .................................................................... 162
viii
LIST OF FIGURES
Figure 1-1: Symptoms and characteristics of plant pathogenic Verticillium spp. ............... 12
Figure 2-1: Standard curves for quantifying amounts of Verticillium DNA in
infected plants ................................................................................................... 49
Figure 2-2: Symptom expression in Vd1-infected CS tomatoes protected by
previous Dvd-E6 inoculation. ........................................................................... 51
Figure 2-3: Comparison of symptoms and levels of Vd1 DNA during colonization
of CS tomatoes by Dvd-E6 and/or Vd1 ............................................................ 52
Figure 2-4: Comparisons of the intra- and intergenic sequences in the rRNAs of
Vd1 and Dvd-E6. .............................................................................................. 55
Figure 2-5: Differentiation and quantification of Verticillium isolates by PCR-based
assays. ............................................................................................................... 56
Figure 2-6: Comparison of symptoms and levels of V. dahliae DNA in dual
infections to determine whether order of infection matters. ............................. 59
Figure 2-7: Comparison of relative levels of Dvd-E6 (E6) and Vd1 in tomato stems
with dual infections. ......................................................................................... 61
Figure 2-8: Comparison of relative levels of Dvd-E6 (E6) and Vd1 in tomato roots
with dual infections. ......................................................................................... 62
Figure 2-9: In vitro experiments with Verticillium dahliae isolates Dvd-E6 and
Vd1. .................................................................................................................. 64
Figure 2-10: Global analyses of genetic changes in Verticillium Dvd-E6-infected
tomato. .............................................................................................................. 67
Figure 2-11: Comparison of symptoms and levels of Vd1 and Vaa DNA in CS
tomato simultaneously infected with Dvd-E6. ................................................. 70
Figure 3-1: Maceration of infected plant tissue ................................................................... 80
Figure 3-2: Disease scores in tomatoes with mixed Verticillium infections. ...................... 82
Figure 3-3: Hemacytometer spore counts in Verticillium/Craigella interactions. ............... 83
Figure 3-4: Relative amounts of Vd1 and E6 spore DNA when present in mixed
infections in CS tomatoes. ................................................................................ 85
Figure 3-5: Spore viability in Craigella/Verticillium pathosystems. ................................... 86

ix
Figure 3-6: Relative amounts of mycelia and spore DNA in tomatoes infected with
Vd1 and/or Dvd-E6. ......................................................................................... 88
Figure 4-1: Disease scores in Verticillium infected tomatoes. .......................................... 101
Figure 4-2: Relative amount of Vd1 and Dvd-E6 DNA in mixed infections of
tomato ............................................................................................................. 103
Figure 4-3: RNA quality check using 28S/18S rRNA ratio .............................................. 104
Figure 4-4: Changes in mRNA levels in Verticillium-infected tomato. ............................ 106
Figure 4-5: Cluster analysis of defence gene mRNA levels in CS/Verticillium
interactions ..................................................................................................... 108
Figure 4-6: Group 1 defense gene response profiles in Verticillium infected tomato. ...... 112
Figure 4-7: Group 2 defense gene response profiles in Verticillium infected tomato. ...... 116
Figure 4-8: Similarity between symptom expression and Group 2 defense gene
response profiles in CS-Verticillium interactions. .......................................... 117
Figure 4-9: Group 3 defense gene response profiles in Verticillium infected tomato. ...... 121
Figure 4-10: Similarity between total amount of fungal DNA and Group 3 defense
gene response profiles in CS-Verticillium interactions. ................................. 122
Figure 4-11: Group 4 defense gene response profiles in Verticillium infected tomato. ...... 125
Figure 4-12: Similarity between amount of Dvd-E6 DNA and Group 4 defense gene
response profiles in CS-Verticillium interactions. .......................................... 126
Figure 4-13: Symptom expression in CR/Verticillium interactions .................................... 130
Figure 4-14: Amounts of fungal DNA in CR tomatoes infected by V. dahliae rac1
and/or Dvd-E6. ............................................................................................... 131
Figure 4-15: Cluster analysis of defence gene mRNA levels in CR/Verticillium
interactions. .................................................................................................... 133
Figure 5-1: pMW4, an ethanol-inducible RNAi vector. ................................................... 154
Figure 5-2: Relative locations of PCR primers used to characterize the TUS15G8
and Ve2 RNAi constructs. .............................................................................. 157
Figure 5-3: Preparation of TUS15G8 and Ve2 partial gene fragments for RNAi
production. ...................................................................................................... 165
Figure 5-4: Confirmation of TUS15G8 and Ve2 gene inserts by PCR amplification. ...... 168
x
Figure 5-5: Restriction enzyme digestion of pMW4TUS15G8 constructs. ...................... 169
Figure 5-6: Screening transformed A. tumefaciens EH105 for pMW4-TUS15G8
DNA. .............................................................................................................. 170
Figure 5-7: Various stages in the Agrobacterium-mediated tomato transformation
using cotyledon explants. ............................................................................... 172
Figure 5-8: PCR-based assays for contamination by A. tumefaciens in transformed
tomato. ............................................................................................................ 173
Figure 5-9: Assay for pMW4TUS15G8 DNA in transgenic tomato ................................. 174
Figure 5-10: Expression of endogenous and plasmid-derived TUS15G8 gene RNA in
transgenic CS tomato. ..................................................................................... 176

xi
ABBREVIATIONS
BAP Benzylamino purine
CDK Cyclin-dependent kinase
CR cv Craigella resistant
CR/Dvd-E6 Tolerant relationship
CR/Vd1 Incompatible interaction/ resistant relationship
CS cv Craigella susceptible
CS//Dvd-E6/Vd1 Endophyte-induced protection interaction
CS/Dvd-E6 Tolerant relationship
CS/Vd1 Compatible interaction/ susceptible relationship
CTAB Hexadecyl trimethyl ammonium bromide
ctl Control
dpi Days-post-inoculation
DRM dark-resting-mycelium
Dvd-E6 Verticillium dahliae isolate Dvd-E6
EST Expressed sequence tag
GSS genome survey sequences
xii
hpi hour post inoculation
IAA Indole acetic acid
IC internal control
ihpRNA intron-spliced hairpin RNA
ITS Internal transcribed spacer
MMLV Moloney murine leukemia virus
MS Murashige and Skoog
MS* Microsclerotia
NAA Naphthalene acetic acid
NASAB Nucleic acid sequence amplification-based
PDA Potato dextrose agar
PR Pathogenesis related
PTGS Post-transcriptional gene silencing
QTL Quantitative trait locus
RAPD Random amplification of polymorphic DNA
RFLP Restriction fragment length polymorphism
SSH Subtraction suppressive hybridization

xiii
TVR Tomato-Verticillium Response
Vaa Verticillium albo-atrum
Vd1 Verticillium dahliae race 1
VCG Vegetative compatibility grouping
YEP Yeast extracts peptone

CHAPTER 1: General Introduction
1
CHAPTER 1: General Introduction
1.1 Introduction
Verticillium wilt (tracheomycosis) is a vascular wilt disease of plants. Like other
vascular wilt diseases, they are highly destructive, causing great damage to many
important cultivated and wild type crop species (Wilhelm, 1981; Subbarao et al., 1995).
Generally, fungal vascular wilt diseases are caused by species of three genera, namely;
Verticillium, Fusarium and Ophiostoma (Agrios, 2005) but the greatest number of these
diseases in higher plants is caused by Verticillium and Fusarium spp. (Green, 1981).
Verticillium spp. possess many unusual features. They have wide host range and their
propagules can persist in infected soil for many years. The way in which Verticillium spp.
infect the host plant is also different from many pathogens since they do not produce
appressoria; rather hyphae penetrate the vascular system directly through the root cap or
at wounds and remain in the xylem vessels where they usually cause observable disease
symptoms in the host plant. The pathogen never penetrates host cells, remaining in the
xylem vessels until the plant is moribund (Robb, 2000; Beckman, 1987).
When Verticillium spp. infect host plants, three types of relationships;
susceptibility, tolerance and resistance, can be obtained. A host plant is susceptible when
there are both high levels of symptoms and amounts of fungus. A tolerant response is
characterized by low levels of symptoms, while the amounts of fungus in the plant are
high. A resistant response is characterized by both low levels of symptoms and amounts
of fungus in the plant. The manner in which plants resist Verticillium spp. is another
interesting feature of the disease. In most hosts, such as alfalfa and potato, resistance is
polygenic; however, dominant single-gene resistance is found in tomato, cotton,

CHAPTER 1: General Introduction
2
sunflower and potato (Kawchuk et al., 2001; Jansky et al., 2004; Lynch et al., 1997) but
it is unknown whether resistance against Verticillium spp. follows the gene-for-gene
concept. Also, there is no development of a hypersensitive response commonly
associated with resistance to many plant diseases (Pedley and Martin, 2003).
Despite some of these interesting features of Verticillium wilts, remarkably little
knowledge is available about the molecular basis of the Verticillium-plant interaction and
how hosts combat or tolerate the pathogen. Tolerance to plant disease is the ability of the
plant to withstand the severity of the disease without a severe loss in yield or quality
(Schafer, 1971). We are still in the pioneering stage of understanding Verticillium
infections (Fradin and Thomma, 2006).
This Ph.D. research was undertaken with a view towards seeking a better
understanding of the cellular and molecular basis of Verticillium tolerance in tomato in
relation to its protective strategy. It is hoped that the knowledge gained from this research
could also improve understanding of other vascular wilt pathogen/host interactions. The
present study was completed in three successive phases. The first phase was an
exploratory phase where fundamental biological questions about tolerance were asked,
especially with respect to the endophytic properties of a V. dahliae isolate, called Dvd-
E6, in tomato. Phase two was centered on defense gene expression in different
Craigella/Verticillium interactions. In the last phase of this study, RNA interference
(RNAi) vectors were developed, which will be used to probe the function(s) of some
selected defence-related genes (Tanksley, 1992; Gillaspy et al., 1993; Tanksley, 1993).
This chapter gives a brief discussion of the nature of Verticillium wilts; the
causative agents, the host plants, the disease cycle, symptomology, epidemiology,

CHAPTER 1: General Introduction
3
pathogenicity, economic importance and disease management. This is followed by a
review of tolerance and some techniques that could be employed to study tolerance.
Finally, there is an overview of the entire thesis work.
1.2 Verticillium wilts
1.2.1 Verticillium spp.
The genus Verticillium Nees includes some of the world’s major plant pathogens.
The genus Verticillium was classified based on its distinguishing morphological
characteristics, ―verticillate conidiophores.‖ More than 50 species have been described
that are classified taxonomically based on characteristics such as type and size of
reproductive spores and survival structures and, where appropriate, type of host (Isaac,
1967); these include Verticillium spp. that parasitize insects, nematodes and other fungi
and, in particular, dicotyledonous plants (Schippers and Gams, 1979). Many members of
the genus are even nonpathogenic (Robb, 2000). There has been much controversy about
the nomenclature and classification of Verticillium spp. (Pegg and Brady, 2002). After
revision of the original genus, there are now six plant pathogenic Verticillium spp.
although Karapapa and coworkers have proposed a potential seventh species (Karapapa
et al., 1997). The plant pathogenic Verticillium spp. now include: (i) V. albo-atrum
Reinke & Berthold (1879), which covers the majority of isolates producing only dark-
resting-mycelium (DRM) as its resting structures, (ii) V. dahliae Klebahn (1913), which
includes all isolates that produce only microsclerotia (MS*) as its resting structures, (iii)
V. nigrescens Pethybridge and (iv) V. nubilum Pethybridge (1919), that together include
all species that produce only chlamydospores (v) V. tricorpus Isaac (1953), that includes
species that produce MS*, DRM and chlamydospores (hence the prefix ―tri‖) and (vi) V.
CHAPTER 1: General Introduction
4
theobromae (Turconi) Mason & Hughes in Hughes (1951) for the minor wilt
pathogens/saprophytes. The non-wilt pathogen that produces pale brown resting-
mycelium that is associated with fruit rots of banana has also been included in V.
theobromae (Barbara and Clewes, 2003; Isaac, 1967). (vii) V. longisporum comb. nov
refers to the species recently proposed by Karapapa et al., (1997). V. longisporum isolates
have relatively long conidia that infect hosts in the Brassicaceae family; this group was
formerly placed into a subgroup of V. dahlia (referred to as var longisporium). Members
of this group often lose some of these distinguishing characteristics after prolonged
maintenance in culture or when placed in inappropriate medium (Messner et al., 1996).
Most agricultural losses are caused by V. albo-atrum and V. dahliae (Agrios, 2005;
Schnathorst, 1981). The single most important characteristic for separating these two
species as biologically distinct and also determining their geographic distribution is the
temperature difference for growth and survival for the microsclerotia and dark resting
mycelia types of Verticillium (Pegg and Brady, 2002). V. albo-atrum grows best at 20 to
25 oC, whereas V. dahliae prefers somewhat higher temperatures, 25 to 28
oC (Agrios,
2005). A temperature greater than 28 oC becomes unfavorable for all pathogenic species
and results in reduced growth rate, sporulation and spore viability (Robb, 2000).
Verticillium spp. also can be differentiated at the species level using PCR-based assays
that utilize small differences in the internal transcribed spacer (ITS) region base sequence
of the ribosomal gene (Carder and Barbara, 1999; Nazar et al., 1991; Williams et al.,
1992; Li et al., 1994; Robb et al., 1993; Robb and Nazar, 1996). Further differentiation of
V. dahliae and V. albo-atrum using restriction fragment length polymorphisms (RFLPs)
also have been reported (Okoli et al., 1994).

CHAPTER 1: General Introduction
5
These plant pathogenic Verticillium spp. have been subdivided further based on
host specificity, vegetative compatibility grouping (VGC), pathotype, geographical origin
and unique molecular groupings. For example, V. albo-atrum has two distinct subgroups
based on host specificity; lucerne (alfalfa) and non-lucerne isolates (Heale and Isaac,
1963). Based on the sequence of the ITS regions of the rRNA gene, V. albo-atrum also
has been sub-divided further into V. albo-atrum 1 (group 1) and V. albo-atrum 2 (group
2) (Robb et al., 1993; Morton et al., 1995). These divisions have been supported using
molecular markers such as RFLPs (Carder and Barbara, 1999), random amplification of
polymorphic DNA (RAPDs) (Mahuku and Platt, 2002), ITS and the intergenic sequences
of the ribosomal RNA (rRNA) gene (Morton et al., 1995). Currently, there are three
operational taxonomic units (OTU) for V. albo-atrum: (i) Grp1 isolates pathogenic on
lucerne, (ii) Grp1 isolates pathogenic on all other hosts but non-pathogenic on lucerne,
and (iii) Grp 2 isolates (Barbara and Clewes, 2003). V. dahliae exists in two categories:
haploid and amphihaploid isolates (both with long conidia). Among the haploid group,
there have been also several sub-groupings based on geographical origin, host specificity
(Okoli et al., 1994), pathotype (Pérez-Artés et al., 2000) and VGC (Dobinson et al.,
1998).
1.2.2 Host plants
More than 200 species of plants in several families can be attacked by Verticillium
spp. (Agrios, 2005). Most are dicotyledonous, although there have been some reports of
monocotyledonous plants as true hosts of Verticillium pathogens (Sherrod and Elliot,
1967). Hosts include most vegetables (e.g. artichoke, eggplant, pepper, potato and
tomato), fruits (e.g. grape, olive and strawberry), flowers (e.g. chrysanthemum and
CHAPTER 1: General Introduction
6
roses), oilseed crops (e.g. sunflower), fibre crops (e.g. cotton and flax) and woody
perennials (e.g. peach, maple and elm) (Schnathorst, 1981; Domsch et al., 1980; Pegg
and Brady, 2002; Fradin and Thomma, 2006). Verticillium spp. also have been reported
to parasitize nematodes (Kerry and Bourne, 1996).
1.2.3 Tomato as a host and model plant
The commercial tomato is one of the most popular fleshy fruits in the world. It
belongs to a species most frequently referred to as Lycopersicon esculentum Miller. The
correct Latin name has been a bone of contention in the scientific world and the issue has
not been resolved fully. The alternative names Solanum lycopersicum L., or Lycopersicon
lycopersicum (L.) Karsten have also appeared in the literature. Lycopersicon is a
relatively small genus within the extremely large and diverse family, Solanaceae,
comprising more than 90 genera (Bohs and Olmstead, 1997). The origin of tomato also is
not clear. It was believed to have been introduced to the Andean regions of Peru, Chile
and Equador and, from there, was taken to Europe, but the precise locality from which it
came and when it first arrived are still matters of speculation (Schaible et al., 1951).
Apart from the commercial value of tomato, it also has served as a suitable well-
established reproducible model organism for the study of many biological processes. It
was selected as a family reference among the 2800 species of Solanaceae for genome
sequencing (Mueller et al., 2005). It is a diploid species with a moderate genome size of
950 Mb organized into 35,000 genes on a haploid set of 12 chromosomes (Van der
Hoeven et al., 2002; Arumuganathan and Earle, 1991). The number of public databases
that contain high quality nucleotide sequences, expressed sequence tags (EST) (Van der
Hoeven et al., 2002) and genome survey sequences (GSS) containing biological
CHAPTER 1: General Introduction
7
information on tomato is rapidly growing (Tanksley et al., 1992). Tomato offers several
characteristics that enable studies of plant development, fruit ripening and investigation
of many plant-pathogen interactions that affect economically important plants. Useful
properties include its moderately sized genome (950 Mb) and availability of high density
genetic maps (Peterson et al., 1998; Tanksley, 1992), efficient binary transformation
procedures (An et al., 1986), tolerance to inbreeding (Van der Hoeven et al., 2002),
availability of quantitative trait locus (QTL) information (Frary et al., 2000) and
informative ripening mutants (Giovannoni, 2007). In addition to these diverse genetic
resources available in tomato, a public cDNA-based microarray has also been developed
for tomato which contains more than 8600 verified unigene sequences (Alba, 2004;
Giovannoni, 2007).
Tomato as a model organism has been used in molecular, cellular and physiological
studies to investigate fleshy fruit development and ripening (Gillaspy, 1993; Wilkinson,
1995), and tolerance to salinity (Zhang and Blumwald, 2001). Systemin, a primary signal
molecule was first isolated from tomato (McGurl et al., 1992). More so, in the area of
plant pathology, with the use of tomato as a model plant, our understanding of plant-
pathogen interactions has been greatly increased. Tomato Pto resistance gene that
mediates resistance against Pseudomonas syringae pv tomato through the interaction with
the Avr genes (AvrPto or AvrPtoB) was the first plant gene ever cloned that exhibited the
gene-for gene concept of plant disease resistance (Dixon et al., 1996; Scofield et al.,
1996). Many cellular and molecular studies to understand plant-pathogen interactions
(Scofield et al., 2010), and resistance genes (Dixon et al., 1996) have been investigated
using tomato as a model plant.
CHAPTER 1: General Introduction
8
Tomato is a suitable host for Verticillium spp. Like other vascular pathogens,
Verticillium spp. colonize tomato in a cyclical systemic pattern with peaks between 2-4
and 12-15 days-post-inoculation (dpi) for Vaa (Heinz et al., 1998) or 2-4 and 8-10 dpi by
Vd1 (Chen et al., 2004), followed by fungal elimination after each peak. In tomato, the
dominant Ve disease resistance gene confers resistance against Verticillium pathogens.
The molecular nature of resistance in tomato against Verticillium spp. is unique due to the
fact that the Ve genes from tomato are two closely linked inverted genes (Ve1 and Ve2)
that putatively encode cell surface-like receptors, which independently confer resistance
to Vaa race 1 in potato (Kawchuk et al., 2001), although current evidence suggests that
this may not be the case in tomato. Only the Ve1 gene, not Ve2 confers resistance in
tomato against Vd1 and Vaa (Fradin et al., 2009). Ve genes were identified in 1932 in a
L. esculentum accession called Peru Wild. Ve resistance was introduced into other
cultivars of tomato through traditional breeding and the first resistant varieties were
released in the 1950s (Schaible et al., 1951). Today, most of the commercial varieties of
tomato worldwide carry the Ve genes which provide resistance against Vaa and Vd1, but
not against V. dahliae race 2 (Robinson et al., 1957; Hall and Kimble, 1972).
1.2.4 The Verticillium disease cycle
The life cycle of pathogenic Verticillium spp. can be divided into dormant, parasitic
and saprophytic stages. The dormant stage comprises inhibition and germination of
resting structures in soil. The parasitic stage comprises penetration of roots, colonization
of the root cortex and endodermis and movement to the xylem, colonization of the xylem
of stems and leaves, symptom expression and, finally, death of the host. The saprophytic
stage is the formation of resting structures in the dead host (Schnathorst, 1981).

CHAPTER 1: General Introduction
9
The formation of resting structures known as microsclerotia is a critical factor in
the survival, distribution and epidemiology of the disease (Pegg, 1981). In the dormant
phase, conidia and microsclerotia present in infested soil are inhibited from germinating
because of mycostasis or microbiostasis (Huisman, 1982). The resting structure can
survive in a state of dormancy for years. V. dahliae has been recorded to survive up to 14
years in field conditions (Wilhelm, 1955). Reversal of inhibition of resting structures
from germination is non-host specific. The inhibition can be reversed when
microsclerotia come in contact with root exudates released in the rhizosphere of a host
plant (e.g. tomato) or a non-host plant (e.g. wheat). The exudates serve as a rich source of
carbon and nitrogen (Huisman, 1982). Verticillium spp. enter the parasitic phase when it
penetrates the host through wounds or at the root cap, root hairs or branch roots. Inside
the root, the cortex is colonized (Bishop and Cooper, 1983). Penetration is usually
intercellular. Hyphae enter the cortex directly without forming appressoria. From the
cortex, the hyphae penetrate the endodermis and invade the xylem vessels where conidia
are formed. These conidia are released to travel upward in the transpiration stream until
trapped in pit cavities or at vessel end walls, where they germinate into new hyphae and
penetrate adjacent vessel elements to continue colonization and increase infection
(Schnathorst, 1981). Studies have shown that the rate of conidia formation in the host
plant correlates with the aggressiveness of the strain, with heavily conidiating
Verticillium strains being more aggressive (Schnathorst, 1963). At this stage, the host
plant starts to develop symptoms. It is at this stage of symptom development in the host
that susceptibility or resistance is determined (Beckman, 1987). Unlike other vascular
pathogens such as Fusarium spp. and Ceratocystis spp., Verticillium spp. remain in the

CHAPTER 1: General Introduction
10
xylem vessels until the plant is moribund (Robb, 2000; Beckman 1987). At this stage, the
fungus enters a saprophytic stage and forms microsclerotial resting structures which are
returned to the soil when the plant dies and decomposes.
1.2.5 Symptomology and epidemiology
The symptoms of Verticillium wilts are similar to the wilts caused by Fusarium
spp. or other vascular wilt pathogens (Agrios, 2005). The symptoms generally can be
grouped into external visible symptoms, and internal or microscopic symptoms. The
external visible symptoms range from stunting, leaf epinasty, abscission, and the
development of distinctive foliar symptoms such as flaccidity (wilt), chlorosis, followed
by necrosis of successive branches, to abrupt collapse and death of the entire plant. The
internal symptoms may include vascular browning (deposition of melanin-like
compounds on the wall of xylems vessels and neighboring parenchyma cells), tyloses,
xylem parenchyma hyperplasia, supernumary xylem differentiation, deposition of gels
and gums in the xylem, suberization of vessel pits, stimulation of phenol synthesis in
specific stellar cells, permanent opening of stomata (Pegg, 1981), as well as anthocyanin
accumulation (Veronese et al., 2003), pathogen-mediated reductions in net
photosynthesis, transpiration and increased leaf temperature leading to premature foliage
senescence and, finally, yield loss (Bowden et al., 1990). Alteration of the flowering
processes has been observed also as a symptom of Verticillium infection in some plants,
including pepper (Capsicum spp.) (Goicoechea et al., 2001) and Arabidopsis thaliana
(Veronese et al., 2003). Vd1 infection accelerated the induction of flowering in the A.
thaliana ecotype BI-1, whereas there was no flowering observed in the mock-inoculated
control plants. Many Verticillium spp. isolates can cause a wide variety of symptoms on
CHAPTER 1: General Introduction
11
different host plants (Subbarao et al., 1995), whereas others are host specialized (Bhat
and Subbarao, 1999). As a result of the varying symptoms in different hosts, there are no
particular symptoms that belong to all plants infected by this fungus (Fradin and
Thomma, 2006). Figure 1-1 depicts different species of Verticillium as well as some of
the symptoms of Vd1-infected tomato.
When Verticillium wilt first appears in a field, it is always mild and local. The
attacks become successively more severe and widespread in subsequent years as the
inoculum builds up and new, more virulent strains of the fungus appear until the crop is
devastated by the pathogen or discontinued or replaced with resistant varieties by the
farmer (Agrios, 2005). Factors affecting the epidemiology of diseases caused by
Verticillium spp. include: inoculum density, strains of the pathogen, crop cultivars,
suppressive and conducive soils, nutritional status of the soil, soil type, soil and air
temperature, interactions with other pathogens, movement of propagules by wind, water,
machines and animals, prevalence of weed hosts, extent of rainfall and irrigation, and
plant densities (Schnathorst, 1981).

CHAPTER 1: General Introduction
12
Figure 1-1: Symptoms and characteristics of plant pathogenic Verticillium spp.
Tomato infected with V. dahliae race 1 showing various symptoms: (A) leaf showing
chlorosis (B) leaf showing wilting (C) leaves showing necrosis (D) leaf showing V-
shaped necrosis (E) plant showing stunted growth (F) Verticillate conidiophores of
Verticillium spp. (G) Culture of V. dahliae, isolate Dvd-E6. (H) Culture of V. dahliae
race 1. (I) Culture of V. albo-atrum. Panel F was kindly provided by Dr. Jane Robb of the
Department of Molecular and Cellular Biology, University of Guelph, Guelph.
1.2.6 Economic importance and disease management
Verticillium wilts are highly destructive vascular diseases of plants that occur
worldwide, but are most important in temperate regions. In fact, virtually all
agriculturally significant plant species, with the exception of grasses, are susceptible to

CHAPTER 1: General Introduction
13
infection, causing billions of dollars in yield loss annually (Powelson and Rowe, 1993).
In North America, Verticillium wilt has been ranked as the most important disease of
both seed and commercial crops, and the second greatest constraint on potato tuber yield
(Powelson and Rowe, 1993).
In general, the disease is difficult to control as a result of the broad host range, the
long survivability of the microsclerotial resting structure of the pathogen, its growth
within the confinement of the vascular tissues of the host plant, and the cyclical systemic
nature of colonization within the vascular system of the plant. All these factors combined,
render chemical and cultural attempts at protection of plants against Verticillium wilt
ineffective or impractical (Robinson et al., 2001). Of the seven plant pathogenic
Verticillium spp., V. dahliae appears to be the most difficult to control. Its ability to
persist for years in various tissues of many hosts and in soil makes it more difficult to
control (Wilhelm, 1955). The resting structures of Verticillium spp. provide the initial
inocula; therefore, they serve as desirable targets for Verticillium spp. control (Hawke
and Lazarovits, 1994). Management strategies that can reduce the inoculum level include
physical methods (application of heat and solarization), chemical methods (soil
fumigation), cultural practices (crop rotation), biological control (the use of bacterial and
fungal antagonists), and legislation and quarantine (Pegg and Brady, 2002; Ben-Yephet
and Frank, 1989; Corsini et al., 1988). Also, removal of plants once diagnosed with
Verticillium wilt is currently one of the most effective means of disease control (Fradin
and Thomma, 2006). However, collectively, these strategies have been met with little
success. Currently, the most effective way to prevent Verticillium disease is the breeding
of resistant cultivars.
CHAPTER 1: General Introduction
14
1.3 Verticillium spp./host plant interactions
When Verticillium spp. infect tomato, three types of pathogenic relationships are
possible; susceptibility, resistance or tolerance. In the susceptible relationship, symptom
level and the amount of fungus are high, while in the resistant relationship both symptom
level and amount of fungus remain low. The tolerant relationship has low symptom levels
but high amounts of fungus. The type of relationship that will result is determined by the
cellular interactions between the host plant and the pathogen occurring in the stem (Chen
et al., 2004).
1.3.1 Mechanism of Verticillium pathogenicity
The mechanism by which Verticillium spp. induce symptoms in a susceptible host
plant has been an issue addressed by many research studies and has provoked much
scientific controversy for decades. The lifestyle of Verticillium spp. is unusual in that, in
the plant, the fungi are mainly confined to the fluid environment of the xylem vessels and
exerts its effect on host physiology indirectly (Pegg and Brady, 2002). The classic debate
has been whether vascular occlusion or toxin activity causes wilting.
Vascular occlusion can result from the physical blockage of the plant xylem by
either the pathogen biomass or vessel plugging by the host (Pegg and Brady, 2002;
Fradin and Thomma, 2006). Colonization of the host xylem is effected by mycelia
growth but more rapidly by conidia carried in the xylem fluid (Tolmsoff, 1973). Street
and Cooper used a modified Scholander pressure bomb to determine the contribution of
vascular occlusion to water stress in Vd1-infected tomatoes (Street and Cooper, 1984). In
comparing vascular flow through petioles of healthy, symptomless or wilted leaves, they
found that flow was greatly reduced or completely prevented before visual signs of

CHAPTER 1: General Introduction
15
wilting in leaf laminae of infected plants, strongly supporting vascular occlusion as the
main cause of water stress in this Verticillium wilt disease. Robb and co-workers also
observed ultrastructural changes in V. dahliae infected chrysanthemum leaves before and
after wilting (Robb et al., 1975). They found that xylem vessels in the leaves contained
large amounts of fungal hyphae before wilting occurred, thereby supporting vascular
occlusion as the cause of wilting in Verticillium spp. infected plants. There are also
numerous studies that implicate vessel occlusion as the primary cause of water stress
leading to Verticillium wilt (Threlfall, 1959; Alexander and Hall, 1974; Douglas and
Machardy, 1981). Vascular occlusion as a result of vessel plugging occurs in a
susceptible host plant in an attempt to defend itself against infection by Verticillium spp.
This is attributed to blocking of the vessels by gums (Moreau et al., 1978), gels
(VanderMolen et al., 1977), tyloses and xylem vessel wall coatings (Robb et al., 1979).
Toxins can be sub-divided broadly into small molecular weight (<1000 Da) and
macromolecular weight compounds. In this model, toxic molecules as extracellular
metabolites of the pathogen are envisaged to pass through xylem pit membranes into the
leaf and other parenchyma cells and there directly affect permeability, causing cellular
dysfunctioning and death (Pegg and Brady, 2002). Some attempts have been made to
provide indirect evidence supporting the role of low molecular weight compounds in
Verticillium wilt symptom developments (Ten et al., 1981; Neumann and Dobinson,
2003). Both V. dahliae and V. albo-atrum are reported to produce phytotoxins that induce
host cell death (Pegg, 1965). In addition, symptom development attributed to toxins in
Verticillium spp. has been demonstrated in potato (Buchner et al., 1989) and tomato
(Mansoori et al., 1995) cultivars. Also, some studies show that crude elicitor preparations

CHAPTER 1: General Introduction
16
from V. dahliae can induce defense response in cotton and soybean cells supporting the
hypothesis that toxins and elicitors can act as Verticillium dahliae pathogenicity factors
(Apostol et al., 1987). However, evidence that toxins and elicitors of Verticillium spp. are
pathogenicity factors has not always been consistent and some studies appear
contradictory; so this hypothesis is generally not accepted (Fradin and Thomma, 2007;
Pegg and Brady, 2002).
1.3.2 Mechanism of plant defense against Verticillium spp. infection
Resistance to a pathogen can be measured by components such as pathogen
growth, disease symptoms and host fitness (Kover and Schaal, 2002). The best known
defense mechanism against infection by Verticillium spp. is through quantitative
resistance involving numerous genes that are expressed constitutively or induced in
response to attack by the pathogen. These genes provide the plant with defensive
structures, degradative enzymes and toxic substances that slow or restrict the colonization
of the pathogen in the host tissue and reduce the damage caused by the pathogen (Agrios,
2005). Polygenic resistance to Verticillium wilts has been identified in several plant
species such as potato (Hunter et al., 1968), cotton (Bolek et al., 2005), alfalfa and
strawberry (Simko et al., 2004). Single dominant resistant genes have also been identified
in sunflower (Jansky et al., 2004), potato (Lynch et al., 1997) and tomato species
(Kawchuk et al., 2001). In a Verticillium spp./host plant relationship, substantial amounts
of the fungus are always present in the upper part of the plant within 2-4 days of root
inoculation but, eventually, the fungus is restricted to the basal part of the plant as a result
of rapid defense responses elicited in resistant plants having the R gene, which is used for
recognition of pathogen elicitors. In susceptible plants lacking the R gene, the pathogens

CHAPTER 1: General Introduction
17
escape the defenses and are able to colonize the stem extensively (Heinz et al., 1998;
Pegg and Brady, 2002).
In a Verticillium spp.-infected resistant plant, both structural and biochemical
defence responses are deployed to restrict colonization of the pathogen. There is much
evidence supporting interplay between structural and antimicrobial defence responses
resulting in containment of fungal spread; first, conidia are trapped at vessels end walls or
bordered pits after which the release of antimicrobial molecules contribute to the
elimination of the pathogen (Bell, 1969; Pegg and Brady, 2002). The defense response
deployed by both susceptible and resistant plants is similar during Verticillium spp.
infection, but the level and timing of responses differ. (Beckman, 1987; Gold and Robb,
1995; Heinz et al., 1998; Lee et al., 1992; Lynch et al., 1997). For example, the level of
PAL enzyme activity was found to be consistently and significantly higher (about a four-
fold) in the resistant plants, compared to the susceptible plants, especially at 24 hour-
post-inoculation (hpi) with Vaa (Lee et al., 1992). Also, delayed coating response has
been reported to occur in susceptible plants during Vaa infection (Robb et al., 1987;
Robb et al., 1989). A large body of Verticillium research has been aimed at characterizing
these structural and biochemical defense responses using cotton, hop and tomato as
model plants (Robb et al., 1991; Fradin and Thomma, 2006).
Structural defenses such as suberization of the endodermis (Talboys, 1958) and
lignification of the epidermal and cortical cell walls of the root trap the fungus (Griffiths,
1971) in the prevascular stage of attack in some hosts. If the pathogen escapes the
prevascular phase and succeeds in penetrating the plant xylem vessels (i.e. vascular
stage), the plant resists fungal penetration and horizontal spread by forming other barriers
CHAPTER 1: General Introduction
18
through the deposition of suberin and other coating materials on vascular cell walls,
surrounding the trapping sites (Heinz et al., 1998). At this stage, infection commonly
results in vessel occlusion by gums, gels and other deposits secreted by the neighboring
parenchyma cells and tyloses (Benhamou, 1995). All these obstructions block movement
of the fungus and other transport through the vessel element. Pathogenesis-related (PR)
proteins such as glucanases and chitinases as well as phenyl ammonia lyase (PAL) and
phenolic compounds are also important because they contribute to the production of
phytoalexins that limit the growth of the fungus or inhibit the hydrolytic enzymes
secreted by them (Bell and Mace, 1981; Gold and Robb, 1995). Plant hormones such as
salicyclic acid (Mauch-Mani and Slusarenko, 1996), jasmonic acid (Tjamos et al., 2005)
and ethylene (Pegg and Cronshaw, 1976) also act as signaling molecules that play roles
in regulating defense responses.
1.4 Plant disease tolerance
The phenomenon of ―tolerance‖ has been recognized for over a century and has
been discussed in relation to vascular wilt diseases such as Verticillium wilts as far back
as 1922 (Bewley, 1922). There is no clear consensus on the definition of plant disease
tolerance. Many authors have considered tolerance as either endurance or an intermediate
level of resistance and, as such, defined the term from different perspectives. N.A. Cobb
in 1894 (Schafer, 1971) was the first to describe the term and he defined ―a rust enduring
wheat‖ as one which is susceptible to rust, but still able to withstand the effect of the rust
to produce a fair crop of grain under ordinary circumstance. Dropkin (1955) considered a
tolerant condition as one which could support growth and reproduction of the pathogen
but still allow the plant to grow well. Schafer (1971) considered tolerance in the same

CHAPTER 1: General Introduction
19
sense as Caldwell et al. (1958) and defined it as the ability of a plant to endure severe
disease without severe loss in yield or quality. Some authors have equated tolerance with
―symptomless‖ carriers (Pennypacker et al., 1985), while others refer to it as
―intermediate resistance‖ (Beckman and Roberts, 1995). Clarke (1984; 1986) viewed
tolerance in three ways. Tolerance of the parasite; is the relative ability of the plant to
bear the effect of the pathogen without suffering excessive disease. Tolerance of disease;
is the relative ability of the plant to endure both the primary and secondary diseases
caused by a parasite. Overall, tolerance of a plant is determined partly by tolerance of the
parasite and partly of any disease caused by the parasite (Clarke, 1984; Clarke, 1986).
Agrios defined tolerance as, enduring the effect of a pathogen infection while still
producing a good crop (Agrios, 2005). From all these definitions, it is clear that tolerance
can only be determined by comparing qualitative or/and quantitative effects between two
cultivars or crops under the same disease conditions. It follows that tolerance is a relative
concept and cannot be measured directly.
Plant disease tolerance is associated with some interesting characteristics. For
example, recent studies showed that Craigella tomatoes are tolerant to an eggplant isolate
of V. dahliae, Dvd-E6. In the Dvd-E6/Craigella interaction, there are substantial amounts
of the fungus in the plants, but few or no disease symptoms develop. Disease tolerant
plants are taller and more robust than uninfected control plants of same variety. More
importantly, the tolerant condition seems to be stable and reproducible in different
experimental trials (Chen et al., 2004; Robb et al., 2007). In other studies, tolerance also
has been reported to protect plants against other pathogens (Simms and Triplett, 1994).
These unanticipated characteristics suggest that an avirulent pathogen that incites a

CHAPTER 1: General Introduction
20
tolerant response may resemble an endophyte that lives within a host plant without
causing apparent disease symptoms. The endophytes may benefit from their host plants
by gaining mineral nutrients, protection against unfavorable environmental conditions
and/or competition from other soil microbes. Endophytes have been found in many
species of plants and also may benefit their host plants by preventing pathogenic
organisms from colonizing them (Gimenez et al., 2007). As well, there have been many
reports on their applications as potential biocontrol agents (Clay, 1990; Schulthess and
Faeth, 1998; Clay and Schardl, 2002; Gimenez et al., 2007).
1.4.1 Verticillium wilts and the nature of tolerance
Tolerance is usually considered to be a defense response resulting in reduced
Verticillium symptom expression to infection by Verticillium spp. Plant disease tolerance
depends upon the genetics of both host and pathogen. The host plant may possess
tolerance genes, which can contribute to tolerance to one or more particular pathogens.
For example, a single dominant locus, V. dahliae tolerance (VET1) gene, was found in the
C-24 ecotype of A. thaliana which confers increased tolerance to V. dahliae (Veronese et
al., 2003). In that study, plants of the Columbia ecotype, lacking the VET1 gene, were
found to be highly susceptible to V. dahliae, suggesting that the genetic basis of host
plant contributes to plant disease tolerance. Similar observations have been reported in
other plants. Soybean lines for example, with reduced sensitivity to ethylene, could
potentially exhibit enhanced disease tolerance that is durable and effective against a
broad spectrum of pathogens (Danny et al., 1993). Constitutive over expression of
protein(s) involved in plant defense mechanisms has been used as a strategy to increase
plant tolerance to fungal pathogens. For example, transgenic plants, constitutively

CHAPTER 1: General Introduction
21
expressing PR-1a genes which are the hallmarks of systemic acquired resistance,
exhibited significant tolerance in tobacco to some pathogenic fungi and oomycetes, thus
providing evidence of a function for PR genes in determining tolerance (Danny et al.,
1993). Similarly, oilseed rape plants constitutively overexpressing tomato chimeric
chitinase gene has been correlated with increased field tolerance to Brassica napus
(Grison et al., 1996). Overexpression of disease tolerance genes protects the plant by
minimizing deleterious disease symptoms and the associated yield losses. Tolerance
genes tend to remain effective over many years, and some of these genes confer tolerance
to more than one disease (Danny et al., 1993). In some plants, such as cotton, phytoalexin
accumulation also has been correlated with tolerance response (Joost et al., 1995).
Genetics of the pathogen are also important. For example, the interaction between
Craigella susceptible tomato and Vd1 results in a compatible interaction, but when the
same host interacts with Dvd-E6 (Dobinson et al., 1998), a tolerant interaction results
(Chen et al., 2004). The term ―pest-induced tolerance‖ has been suggested by Robb to
describe this type of relationship, since the presence of the pathogen induces the tolerant
state of the host (Robb, 2007). In this system, tolerance results not because of the
inability of the plant to recognize the pathogen as often assumed; rather; the plant
recognizes and responds to the presence of the pathogen by deploying some defense
responses (Robb et al., 2007). A global gene expression analysis indicated that the
reduced symptoms in tolerant plants were correlated with the suppression of genes
underlying pathogenesis, plant defense, wounding or/and senescence, notably 14-3-3
protein gene expression (Robb et al., 2007).

CHAPTER 1: General Introduction
22
1.4.2 Measurement of plant disease tolerance
The effect of tolerance has been observed and reported generally in many plants,
including cotton (Barrow, 1970), cereals (Browning et al., 1962), bean (Coyne and
Schuster, 1969), potato (Lynch et al., 1997), A.thaliana (Kover and Schaal, 2002) and
others (Schafer, 1971). More specifically, there have been periodic reports of tolerance to
Verticillium spp. in numerous host species for over 70 years (for review see; Robb,
2007). Since the time of its observation, little is known about its molecular basis because
of several challenges that made it difficult to study. Tolerance is a quantitative
phenomenon and as such is difficult to assess and quantify. There is little information
available on methods for quantification especially when dealing with vascular wilt
diseases. Also, tolerance condition is often unstable (Chen et al., 2004). A successful
study of plant disease tolerance is dependent on such factors as: a stable model system
that is reproducible, a method of quantification of the amount of fungus in the system and
a method of measuring the disease. Tolerance cannot be measured directly; it is a relative
concept (Schafer, 1971), which means that it can only be determined by comparing
similarly infected individuals, cultivars and species against one another and, also against
an uninfected control. This can only be possible if two of the following three parameters
are known or can be measured: parasite biomass, severity of disease symptoms and yield
reduction in the host (Robb, 2007). In the current study, the Craigella susceptible/Dvd-E6
pathosystem will be used as a model for the study of plant disease tolerance (Chen et al.,
2004). The amount of fungus in infected Craigella stems will be monitored using a
previously developed quantitative PCR-based assay (Robb et al., 1993; Nazar et al., 991;
Robb and Nazar, 1996), while the levels of symptom expression will be used to quantify
disease (Chen, 2004).
CHAPTER 1: General Introduction
23
1.5 Molecular techniques and plant disease
In this section, some of the techniques that can be used to study the molecular basis
of tolerance will be discussed. These can be grouped into three techniques for diagnostic
identification, analyses of gene expression and functional genomics.
1.5.1 Quantitative diagnostic tools
Diagnostics simply refers to the process of identifying a plant disease, either by the
type of symptoms expressed or by identifying the individual species, races, strains, or
isolates of the causative agent such as a virus, bacterium or fungus. Both identification
and quantification of the pathogens are necessary in most confirmatory diagnostic
studies. As stated earlier, tolerance is a quantitative trait that cannot be measured directly,
rather its measurement relies on the quantification of the amount of fungus in the plant
with the associated symptom expression and/or yield loss. Some of the methods that can
be employed in the identification and quantification of the amount of fungus in the soil or
plant can be grouped into: (i) traditional methods (ii) nucleic acid amplification-based
techniques (iii) restriction fragment length polymorphism (RFLP)-based assays and (iv)
enzyme-based detection and quantification techniques.
The traditional methods that have been used for identification and quantification of
Verticillium spp. include plating of plant parts such as stem, petiole, leaves, roots on
selective media (Pegg and Brady, 2002), light microscopy for the determination of
colonized vessels in tissue cross sections (Robb and Busch, 1974; Gold and Robb, 1995),
physical extraction of spores (Crump and Kerry, 1981), determination of the number of
colony-forming-units (cfu) in bulk samples (Pegg, 1978) and estimating the number of
infected host individuals, (Kerry and Bourne, 1996). Most of these methods are
CHAPTER 1: General Introduction
24
inaccurate, semi-quantitative, labor intensive and/or time consuming and, results may
vary from one trial to the other and, as such, they are now less commonly used.
More recently, sensitive and accurate quantitative diagnostic tools involve nucleic
acid sequence amplification-based (NASAB) methods that rely on the recognition of
specific DNA sequences such as the internal transcribed spacer regions and/or the
intergenic regions of the rRNA genes. Possible approaches include the use of the
polymerase chain reaction (PCR) (Carder and Barbara, 1991; Nazar et al., 1991;
Williams et al., 1992; Robb et al., 1993a; Robb et al., 1993b; Li et al., 1994; Schena et
al., 2005; Jordan, 2000; Hein, et al., 2001; Pongers-Willemse et al., 1998), ligation-
mediated amplification (Wu and Wallace, 1989) and transcription-based amplification
(Kwoh et al., 1989).
Another method that has been also used for differentiating pathogens in the plant
involves a restriction fragment length polymorphic (RFLP)-based assay. This technique
has been used to differentiate Vd1 and Vaa (Okoli et al., 1994). Several enzyme-based
detection and quantification diagnostic tools also are in common use. One example is the
enzyme-linked immunosorbent assay (ELISA) which has found wide applications in
plant pathology (Clark, 1981; Fitzell et al., 1980; Tsai and Erwin, 1975). This technique
has been used for the detection and quantification of the amount of Verticillium spp. in
potato (Sundaram et al., 1991). Some limitations of this technique include difficulty in
finding specific antisera for particular strains of Verticillium spp., non-specificity in
identifying all isolates of a species, and time consuming, because of the additional steps
involved in using fluorescent detection during the quantification procedures (Cullen et
al., 2005).

CHAPTER 1: General Introduction
25
1.5.2 Analyses of gene expression
One approach to the investigation of the molecular basis of tolerance is to compare
the expression of plant defense genes. To study a few genes, techniques such as reverse
transcriptase polymerase chain reaction (RT-PCR) (for review see; Bustin et al., 2006)
and real-time PCR, also called quantitative real time polymerase chain reaction (Q-
PCR/qPCR; for review see; Wong and Medrano, 2005) have found wide applications,
while subtraction suppressive hybridization (SSH) and DNA microarray hybridization
techniques offer the opportunity to compare the expression of thousands of genes.
Subtraction suppressive hybridization: is a technique that involves hybridization
of cDNA from one population (tester) to an excess of mRNA (cDNA) from another
population (driver), and then separation of the unhybridized fraction (target) from the
hybridized common sequences (Diatchenko et al., 1996). SSH has found wide
applications for studying gene expression profiles in various systems (Yang et al., 1999),
including transcriptome changes in plants challenged by pathogens or other pests
(Galbraith et al., 2004).
DNA microarray hybridization: Recent advances in the area of functional
genomics have made possible the simultaneous comparison of thousands of gene
expression profiles. A DNA microarray provides a powerful tool for screening biological
specimens for differences in the levels of mRNAs to study changes or differences in
physiological or pathological states in different systems (Murphy, 2002). A DNA
microarray or gene chip contains a matrix of up to thousands of cDNA or
oligonucleotides imprinted on a support (Bowtell, 1999). Labeled mRNA from the tissue
of interest is hybridized to its sequence compliment on the array to provide a comparative
measure of mRNA abundance in the sample. DNA microarray hybridization is a
CHAPTER 1: General Introduction
26
powerful and efficient technique to determine the expression of up to several thousand
mRNAs in a specific cell or tissue type (Kurella et al., 2001). The two types of
microarray platform commonly used are the cDNA microarray, that utilizes cloned probe
molecules corresponding to characterized expressed sequences; and oligonucleotide
microarrays, that utilize synthetic probe sequences based on database information
(Gershon, 2002). Two variations of microarray technology exist: custom-made chips,
which use a robot to spot cDNA, oligonucleotides, or PCR products on a glass slide or
membrane; and commercially produced high density arrays (Lockhart and Winzeler,
2000), such as the Affymetrix chip, Inc.; a gene chip system that uses prefabricated
oligonucleotide chips (Lausted et al., 2004). Microarray technology has a wide range of
applications and is increasingly used to investigate, diagnose, and predict molecular
events. It is used on gene expression profiling, where the expression of thousands of
genes are simultaneously monitored to study the effect of a pathogen, environmental
condition or certain developmental stages. Examples include studies on yeasts, plants and
animals (Schena et al., 1995; Kurella et al., 2001), microbial detection and genotyping
(Call et al., 2001), diagnostics (Drmanac et al., 1998), DNA sequence analyses (Peaset et
al., 1994), detection of mutations and polymorphisms (Dufva et al., 2006) and various
immunological studies (Heller et al., 1997). The technique also has been used for
comparative genomic hybridization (Pollack et al., 1999; Moran et al., 2004), SNP
detection (Hacia et al., 1999), predicting gene function and linking cell pathways (DeRisi
et al., 1997).
A microarray has been designed for tomato which contains approximately 12,000
oligonucleotide spots (Moore et al., 2002; Alba et al., 2004). Commercial tomato arrays

CHAPTER 1: General Introduction
27
such as TOM1 and TOM2 arrays are now available from the Center for Gene Expression
Profiling at the Boyce Thompson Institute (BTI) for Plant Research1. These unigenes
have been selected at random from a number of different cDNA libraries made from a
range of tissues including leaf, root, fruit, and flowers. This microarray technology has
been applied successfully to tomato for various studies. For example, it was used to study
the effects of silver leaf whitefly (McKenzie et al., 2005) on tomato; the results indicated
277 genes were up- or down-regulated in response to whitefly feeding and, based on
sequence similarity analysis, it was found that selected genes likely were involved in
developmental regulation, stress responses, wound responses and/or ethylene production.
Microarray also has been used to study the effects of the fungal toxin fusicoccin (FC) on
the tomato transcriptome; the messages were analyzed in the context of defense related
genes using a spotted microarray of 235 cDNA fragments (Frick and Sccaller, 2002). The
technique also has been used to study the genetic basis of tomato tolerance to Vd1 (Robb
et al., 2007).
Customized tomato arrays are now available for different aspects of investigative
research. Recently, a tomato-Verticillium response (TVR) custom array was developed in
our laboratory. This array contains 267 defence related genes that were selected from
previous experiments using the TOM 1 DNA microarray to compare changes in gene
expression between susceptible, resistant and tolerant reactions (Robb et al., 2009). The
TVR array has some advantages over the commercial TOM array. It allows selected
defense genes to be studied in greater detail compared to the global study of tomato
transcriptome which contains around 12,000 genes. The use of the TVR array enables
eight replications on the chip to be made which facilitates greater statistical accuracy. The
1 http://bti.cornell.edu/CGEP/CGEP.html
CHAPTER 1: General Introduction
28
reference gene, actin, as well as other key genes that play important roles in defense
responses, such as PAL and Ve genes, were included on the chip. The TVR array also
reduces the experimental cost of large scale experiments carried out on a time course
basis. In a recent study, the TVR custom array was used to investigate the behavior of
genes that determine the cellular events leading to compatible or incompatible
interactions against Vd1 in tomato (Robb et al., 2009). This is also the approach used for
the research described in this thesis.
1.5.3 Functional genomics and plant disease
In dealing with the study of plant disease tolerance, a researcher may want to
investigate the function(s) of certain gene(s) associated with a tolerant interaction. There
have been several techniques that have been applied to probe gene function(s). These
include targeted gene disruption by homologous recombination, which has been used
successfully for studying gene function in yeast (Rothstein, 1983). It has been applied
also to probe AGL5 MADS-box gene function in A. thaliana (Kempin et al., 1997). The
limitation of this technique lies in requiring a high level of homologous recombination
sequences for precision. Gene replacement is another technique that has been applied
successfully to investigate gene function in yeast and several bacteria. It involves a gene
disruption method that allows the systemic in-frame deletion of entire gene clusters (Gust
et al., 2003). The limitation of this technique for plants lies in being labour intensive as it
involves the generation of hundreds of transgenic plants (Kempin et al., 1997). Post-
transcriptional gene silencing (PTGS) through sense and antisense suppression also has
evolved as a technique for investigating gene function (Baulcombe, 1996). This
technique has been used successfully in tobacco (Brandle et al., 1995; De-Borne et al.,

CHAPTER 1: General Introduction
29
1994; Elmayan and Vaucheret, 1996), tomato (Fray and Grierson, 1993), and petunia
(Napoli et al., 1990; Van der Krol et al., 1990). Another method that has also been
applied for probing gene function includes transposon mutagenesis; a process where a
transposon and T-DNA are used to tag the coding or regulatory regions of target gene of
interest, through reporter and selectable marker genes, leading to loss- or gain-of-function
phenotypes that reflect the function of the target gene (Wilson, 1996; Martienssen, 1998;
Feldmann, 1991). Overexpression of the gene of interest, with a constitutive promoter,
such as the CMV35S promoter is another way of investigating gene function (Yi et al.,
2004). As effective as some of these silencing techniques are, essential genes like
housekeeping genes or genes required for vital biochemical processes in plants cannot be
knocked-down using these methods, as it will lead to dominant lethal phenotypes which
cannot be recovered (Martienssen, 1998).
A recent advance in post-transcriptional gene silencing is the discovery of RNA
interference. First, a double stranded RNA (dsRNA) molecule, which is introduced into a
cell, is cleaved by an enzyme called a dicer to form short fragments (small interfering
RNA [siRNA]), triggering the sequence-degradation of target mRNA which is controlled
by the RNA-induced silencing complex (RISC) (Hamilton and Baulcombe, 1999; Bass,
2000; Nishikura, 2001; Hannon, 2002; Kusaba, 2004). The trigger dsRNA could be either
exogenous from RNA-virus infection or laboratory introduced dsRNA, or endogenous
from expressed premicroRNA (Bagasra and Prilliman, 2004). RNAi was first discovered
in nematodes (Fire et al., 1998). Since its discovery, there have been a series of
advancements to improve its efficiency and maximize its use in plants. It has been found
that when the dsRNA that consists of an inverted repeat of target gene sequence is
CHAPTER 1: General Introduction
30
separated by an intron spacer, forming an intron-spliced hairpin RNA (ihpRNA), the
efficiency of the silencing effect is greatly enhanced in plants (Wesley et al., 2001; Smith
et al., 2000). It follows that, to silence a particular gene of interest; a portion of the target
gene is used to make the ihpRNA construct which is then delivered into the plant through
transformation. The number of cloning steps involved in making the ihpRNA construct
was one of the major limitations of RNAi. To overcome this problem, generic vectors
have been developed. A PCR fragment of the target gene can be inserted readily into
these vectors by conventional cloning or recombination to facilitate making ihpRNA
constructs. A recent advancement is the development of a binary RNAi vector that
provides an ethanol inducible system, so that the silencing effect can be switched on and
off (Lo et al., 2005).
The use of inducible promoter systems for RNAi offers several advantages. For
example, lethal effects resulting from the long term silencing of essential genes can be
avoided (Lo et al., 2005). Such systems also allow one to restrict silencing to specific
time periods or modulate expression to determine the response of plant to different gene
products. Inducible systems can also be used to determine whether a phenotype observed
in a transgenic plant is reversible or fixed (Garoosi et al., 2005). Several inducible
promoter systems have been developed for use in plants (Gatz, 1992; Weinmann, 1994;
Aoyama, 1997; Bohner, 1999; Martinez, 1999; Bruce, 2000; Padidam, 2003), including
tomato. These inducible promoters have been used to suppress the DET gene to improve
carotenoid and flavonoid content (Davuluri et al., 2005) and to manipulate light signal
transduction to improve fruit nutritional quality (Liu, 2004). In this study, an inducible

CHAPTER 1: General Introduction
31
RNAi system based on the alc regulon derived from Aspergillus nidulans was used as
previously described (Caddick et al., 1998; Salter et al., 1998; Lo et al., 2005).
1.6 Thesis overview
As reviewed in the preceding sections, Verticillium wilt is a vascular disease of
plants with some unusual features. It is caused by various pathogenic species of
Verticillium, notably V. dahliae and V. albo-atrum. The pathogens infect host plants
through the root tips or wounds and find their way into the xylem vessels where they
colonize in a cyclical manner, but never penetrate the host plant cells. The pathogens
remain in the xylem until the plant is moribund. The growth of the pathogens within the
vascular system and long survivability of the resting structure make disease caused by
Verticillium spp. difficult to control; the only effective method is the development of
resistant varieties. One unusual characteristic of Verticillium spp./host interactions is the
occurrence of three types of relationships caused by a single species. For example, when
V. dahliae infects Craigella tomato; susceptible, tolerant or resistant reactions can result.
Also, there is usually no development of a hypersensitive response (HR) commonly
associated with bacterial pathogens such as Pseudomonas spp., and other non-vascular
pathogens, which makes the study of vascular wilts more challenging. There have been
many reports on the biology of disease susceptibility, but we are still in the pioneering
stage of understanding resistance against Verticillium spp. (Pegg and Brady, 2002; Fradin
and Thomma, 2006). Virtually nothing is known about the underlying mechanism(s) that
governs plant disease tolerance (Robb, 2007).
Studies in our laboratory have shown that three types of relationship can be
established when V. dahliae infects Craigella tomatoes; resistant, tolerant or susceptible

CHAPTER 1: General Introduction
32
(Chen et al., 2004). In resistant plants, both the amount of pathogen and symptom
expression are low, while in susceptible plants, both are high. Tolerance is associated
with substantial amounts of pathogen but few symptoms. Low levels of disease are
expected in resistant plants, but the reason why a tolerant plant has fewer symptoms is
unclear and requires further investigation. In Craigella tomato, a tolerant state is induced
by V. dahliae Dvd-E6 (Chen et al., 2004), an isolate of eggplants (Dobinson et al., 1998).
The observation of a fungus that is pathogenic on eggplant inducing a tolerant state in
tomato was fascinating, but the reason for this was unknown. An unanticipated
characteristic of the Dvd-E6-induced tolerant relationship was that tolerant tomato plants
were taller than control uninfected plants, but the reason for the difference in height also
was unknown. In this respect, Dvd-E6 behaves like an endophyte that can induce
resistance. One of the remarkable features of many endophytes is the ability to protect
their host plants from diseases caused by virulent pathogens. Since Dvd-E6 possesses
some characteristics similar to an endophyte, it was interesting to investigate whether this
fungus could protect Craigella against virulent Verticillium spp. Despite studies of a
number of plant/endophyte interactions, the mechanisms by which endophytes induce the
tolerant state in the host plant and protect the host from virulent pathogens also remain
unclear. As a result, the Dvd-E6-protected Craigella tomato model offers attractive
features for further investigation.
With the advancement of molecular techniques, during the last decade, a better
understanding of the molecular basis of plant disease tolerance seems possible. In an
attempt to answer some of the many biological questions regarding the alternate types of
interaction, this thesis research focused on the interplay between Craigella-endophyte
CHAPTER 1: General Introduction
33
interaction that offers protection against a virulent V. dahliae and V. albo-atrum. A
recently described model system in which the Craigella cultivar was found to be tolerant
to a non-host isolate of Dvd-E6 was used (Chen et al., 2004). The thesis work was based
on three major research objectives:
a) To investigate whether V. dahliae Dvd-E6 can protect Craigella tomato from
infection by V. dahliae, race 1.
b) To study changes in the tomato defence genes as a basis for tolerance induction
and endophyte-induced protection.
c) To construct RNAi knockdown vectors for related gene functional analyses.
The results of these studies are presented in five additional chapters:
Chapter 2 entitled, ―: Mixed Verticillium spp. Interactions in Tomato’,‖ describes an
exploratory phase to characterize methods and the general features of the tolerant
interaction. A restriction fragment length polymorphism (RFLP)-based assay was
developed and used to differentiate Dvd-E6 from Vd1, when present in mixed infections.
This assay was incorporated into further investigations on the endophytic characteristics
of Dvd-E6 and its protective effect on tomato against pathogenic Vd1 and Vaa.
Measurements of symptom expression and plant height were taken, as well as the total
and relative amounts of Dvd-E6 and Vd1 DNAs when present in mixed infections. The
results indicate that colonization of the stem by Dvd-E6 resulted in restricted growth of
Vd1. However, the presence of Dvd-E6 did not offer similar protection from the effects
of Vaa. Also, the chapter provides some clues as to what the mechanism underlying this
protection might be. Further important questions were raised about both the biological
and genetic mechanisms that give rise to the protective phenomenon.

CHAPTER 1: General Introduction
34
Chapter 3 entitled, ―: Spore Levels in Mixed Verticillium Infections of Tomato‖
asks whether the levels of Vd1 spores correlate with the biology of Dvd-E6-induced
protection in Craigella. The levels of spores were studied in this research because of
previous reports that the aggressiveness of some Verticillium spp. correlates with the
amount of spores produced in the host plant. Therefore, a comparative measurement of
spore levels in the various interactions might indicate the protective strategy employed by
Dvd-E6. An experimental approach for collecting and separating fungal spores from
infected plant tissues was developed and used to study mixed infections with Dvd-E6 and
Vd1 in Craigella tomato. The results suggested that the Dvd-E6-induced protective
mechanism may inhibit both Vd1 mycelial growth and successful sporulation, but has
little or no effect on Dvd-E6; an observation that correlates significantly with the
reduction of symptom levels.
Chapter 4 entitled, ―: Defence Gene Responses in Mixed Infections ‖ takes a more
in depth view of differences in gene expression that may be related to susceptibility,
tolerance or resistance. Also, a time course study was completed to investigate changes in
tomato defense gene expression in mixed infections with Dvd-E6 and Vd1. The results
identified four major categories of defense genes (Groups 1-4) in CS tomatoes that show
differences in the expression pattern in compatible, tolerant and mixed interactions. Also,
the effect of Ve1+ allele on defense gene responses was examined in CR tomatoes.
Chapter 5 entitled, ―: Altered Defense Gene Expression by RNAi Knockdown‖
develops tools to evaluate the effects of genetic changes on tolerance and resistance as
described in Chapter 4. The preparation of inducible RNAi knockdown vectors to
investigate the functional significance of a defense response gene (TUS15G8) with

CHAPTER 1: General Introduction
35
unknown function, as well as the Ve2 gene are described. The initial trials of
Agrobacterium tumefaciens-mediated tomato transformation with pMW4-TUS15G8 and
pMW4-Ve2 are also described, together with assays for the detection and expression of
the transgene in transformed plants.
Finally, Chapter 6 summarizes the conclusions and revisits the agricultural potential
from these studies. A consideration of future directions is also included.

CHAPTER 2: Mixed Verticillium interactions in tomato
36
CHAPTER 2: Mixed Verticillium spp. Interactions in Tomato2’3,4
2.1 Introduction
When Verticillium spp. infect a host, three types of relationships are possible. In
susceptible plants symptoms and fungal levels are high while in resistant plants both are
low. The third possibility is a tolerant condition in which disease symptoms are minimal
although the plants are colonized substantially. The phenomenon of tolerance has been
associated with Verticillium spp. for decades but research on mechanisms governing the
development of the plant/Verticillium interaction has focused on the compatible and
incompatible interactions and little is known about the tolerant state (Mace et al., 1981;
Pegg and Brady, 2002; Fradin and Thomma, 2006).
Often when the tolerant state is induced the colonizing organism is referred to as an
endophytic. An ―endophyte‖ commonly is defined as a ―fungus or bacterium living
within plants without causing visible symptoms of disease‖; a ―pathogen‖ is regarded as
―a disease causing biological agent‖. Historically, plant biologists have tended to
consider these as two distinct classes of organisms but accumulating evidence suggests
that the boundaries between mutualism and parasitism are not as defined as previously
thought. Many organisms can occupy both ecological niches (Jarosz and Davelos, 1995)
depending on the genotype of the host, the genotype of the organism itself and interaction
2 Part of this chapter has been published as a journal article entitled ―Endophyte-induced Verticillium
protection in tomato is range-restricted.‖ Shittu et al., 2009. Plant Signaling and Behavior. Sections and
figures are reproduced with the permission of the publisher
3 Part of this chapter has been published as a journal article entitled ―Plant-endophyte interplay protects
tomato against a virulent Verticillium‖ Shittu et al., 2009. Planta, 229:415- 426. Sections and figures are
reproduced with the permission of the publisher.
4 Part of this chapter has been published as APS meeting abstract entitled ―A tolerant relative protects
tomato against a virulent Verticillium” Shittu et al., 2009. Phytopathology, 96: S145. Sections and figures
are reproduced with the permission of the publisher.

CHAPTER 2: Mixed Verticillium interactions in tomato
37
with the environment. Indeed, this ―dual life style‖ may be a significant factor in the
evolutionary dynamics of pathogen resistance, tolerance and susceptibility (Roy and
Kirchner, 2000).
An endophyte may benefit the host in many ways, most notably by
reducing or preventing disease caused by normally a broad range of virulent pathogens
(Jarosz and Davelos, 1995). Despite numerous reports of such relationships (Jarosz and
Davelos, 1995), the mechanisms by which endophytic strains induce the tolerant
condition in the host plant and protect the host from other more virulent pathogens are
poorly understood.
During recent studies, our laboratory has identified an isolate of V. dahliae, known
as Dvd-E6 that induces tolerance in Craigella tomatoes (Chen et al., 2004). Dvd-E6,
which originated from eggplant (Dobinson et al., 1998), initially was classified as
nonpathogenic on tomato. Subsequent studies confirmed that symptoms were minimal
during development of the Craigella//Dvd-E6 interaction but showed that substantial
colonization of the host did occur (Chen et al. 2004). Microarray analyses suggested that
genes involved in symptom development may be suppressed actively by Dvd -E6 (Robb
et al. 2007). Still another fascinating property of this tolerant system was the fact that
infected host plants tended to be taller and more robust than their uninfected counterparts
(Robb et al. 2007). In these respects, the V. dahliae isolate Dvd-E6 (Dvd-E6) appeared to
resemble an endophyte on Craigella tomatoes (Clay, 1988; Jarosz and Davelos, 1995) and
our laboratory is using it as a model system to investigate the biological and molecular
bases of plant tolerance to Verticillium spp.
As indicated above, endophytes may provide cross-protection against other virulent
pathogens (Clay, 1990; Jarosz and Davelos, 1995; Tjamos, 2000). Given the
CHAPTER 2: Mixed Verticillium interactions in tomato
38
unanticipated properties of the Dvd-E6 tomato interaction, in this chapter an attempt was
made to determine whether Dvd-E6 acts as an endophytic strain and if its presence can
protect Craigella tomatoes from wilt disease caused by virulent isolates of Vd1 and Vaa.
An important component of this question was the relative amount of each fungus in a
host plant harboring both. A simple and effective assay was developed and applied
quantitatively to distinguish the two isolates of V. dahliae in the course of dual infections
and a preliminary experiment was made of the mechanism(s) that may underlie such
protection.
2.2 Materials and methods
2.2.1 Pathogens
The Vd1 isolate used in these studies was obtained from the Provincial Horticulture
Experimental Station at Simcoe, Ontario, Canada. The V. albo-atrum (Vaa) isolate was
obtained from Richard Cooper, University of Bath, UK. The Dvd-E6 isolate was obtained
from the Agriculture and Agri-Food Canada Pest Management Research Center in
London, Ontario, Canada (Dobinson et al., 1998). These were stored axenically as
suspensions of 4x10⁷ conidia/ml in 50 % aqueous glycerol at -80C (Maniatis et al.,
1982). To obtain spores for plant inoculation, 25 l of stock culture (i.e. Vd1, Vaa or
Dvd-E6) per plate were spread onto potato dextrose agar (PDA) 4 weeks prior to
harvesting for Vd1 and Dvd-E6, while 6 weeks prior to harvesting for Vaa. The fungal
cultures were incubated in the dark at 24 C. Conidial suspensions of each isolate were
prepared (Pegg and Brady, 2002) to final concentration of 1x10⁷
spores/ml in sterile 0.5
% gelatin solution (Dobinson et al., 1996).

CHAPTER 2: Mixed Verticillium interactions in tomato
39
2.2.2 Plants
The tomato (Lycopersicon esculentum L. cv Craigella) plants, CSG CR 26 (Bishop
and Cooper, 1983), used for both susceptible and tolerant interactions lack the Ve-gene
and are completely susceptible to Vd1 and Vaa; they are referred to subsequently as CS.
Craigella seeds were obtained originally from RM Cooper, University of Bath, UK and
the isoline are maintained currently through a breeding program at the University of
Guelph. Before planting, seeds were surface sterilized in a 10 % hypochlorite solution
for 10 min, then rinsed in distilled water three times (total rinse time 1 h 30 min) and
planted in Kord cell flats (i.e. 6 seedlings / flat) containing a 3:2:1 mixture of Promix BX
(Premier Horticulture Ltee, Riviere-du-Loup, Quebec, Canada), vermiculite and Turface
mvp (Profile Products LLC, Buffalo Grove, IL, USA). Plants were grown in Percival
cabinets with a cycle of 14 h light (2.5x10³ mol photons m
-2 s
-1) at 26 C for Vd1 and E6
infected plants, while at 24 oC for Vaa infected plants and 10 h dark at 22 C for all sets
of infected plants. Application of fertilizer was done on a weekly basis with Hoagland's
solution (Hoaglund and Arnon, 1950).
2.2.3 Plant inoculation and symptom scoring
Plants were removed carefully from the flats at either the 3- or 4-leaf stage
depending on the number of inoculations required. The soil was shaken gently from the
roots which were then rinsed in distilled water and inoculated with the Vd1, Vaa or Dvd-
E6 by dipping in 1 x 10⁷ spores/ml in 0.5 % gelatin solution for 3 min (Dobinson et al.,
1996). Then, the seedlings were replanted in the Kords (i.e. 6 plants/Kord) and
thoroughly watered. Control plants were treated similarly, but the roots were dipped in
sterile 0.5 % gelatin only. All plants were maintained as described above. Symptom

CHAPTER 2: Mixed Verticillium interactions in tomato
40
ratings (i.e. disease scores) were scored relative to uninoculated control plants at 5 and 10
days post-inoculation (dpi) using a 0 to 5 scale adapted from Busch and Smith (1981) and
Stamova (2005). An abbreviated key follows: 0 - plant healthy, 0.5 - premature loss of
both cotyledons, 1.0 - yellowing and flaccidity of the first leaf, 2.0 - lower 40% of leaves
affected, 3.0 - lower 60% of leaves affected, 4 - lower 80% of leaves affected, 5 - plant
dead. Stunting (> 2.5 cm shorter than control) contributes an additional 0.5 to the disease
score of each plant. Each plant was assessed independently by two observers and scores
were averaged. Length of stem also was recorded. Differences between treatment groups
were tested by the Independent Sample T-test using SPSS 16 analysis software (SPSS
Inc., Chicago, Il, USA).
2.2.4 Preparation of Verticillium genomic DNAs
Verticillium genomic DNAs for making standard curves were prepared from 4
week old cultures of Vd1 or Vaa by extraction using the hexadecyl trimethyl ammonium
bromide (CTAB) method (Rogers and Bendich, 1985) as modified by Nazar et al., 1991.
In each case, mycelia and spore samples were ground with liquid nitrogen using a mortar
and pestle. The powder was transferred to a 4 ml tube to which 1.2 ml pre-warmed 2X
CTAB was added. The mixture was vortexed vigorously and incubated on a water bath at
65 oC for 5 min. An equal volume of chloroform-isoamyl alcohol (24:1) solution was
added to the mixture and mixed well by gentle shaking. The tube was spun with a bench
centrifuge for 2 min. The supernatant was transferred into a new 4 ml tube. One-tenth
volume of pre-warmed 10X CTAB was added and mixed well by hand. An equal volume
of chloroform-isoamyl alcohol (24:1) was added and mixed thoroughly by hand. The tube
was spun again with a bench centrifuge for 2 min. The DNA was precipitated with

CHAPTER 2: Mixed Verticillium interactions in tomato
41
ethanol containing 2 % potassium acetate, washed once with 95 % ethanol and dissolved
in 100 l double distilled water. The concentration of DNA was determined from the
absorbancy at 260 nm.
2.2.5 Quantification of fungal DNA in infected plant tissues
To determine the fungal biomass in infected plants, samples for DNA analysis were
prepared from the root or the top two-thirds of each stem after the leaves and petioles
were removed. Root and stem tissues were freeze-dried separately and pooled (i.e. 3
stems or roots/pool) prior to nucleic acid extraction. Nucleic acid was prepared from the
various root and stem samples by extraction using the sodium dodecyl sulfate (SDS)-
phenol method, as described previously (Robb and Nazar, 1996) with some
modifications. In each case, 12.5 mg of pooled (i.e. 3 plants/pool) freeze-dried stem or
root tissues were homogenized in 1 ml of SDS buffer (0.3 % SDS, 0.14 % NaCl, 0.05 M
NH4 acetate, pH 5.1) for 30 s using an Omni 1,000 homogenizer. The homogenate was
extracted with an equal volume of phenol solution (Nazar et al., 1991) and after
precipitation with 2 volumes of ethanol containing 2 % potassium acetate, the extracts
were dissolved in 200 l of double distilled water.
Total V. dahliae DNA was determined using a PCR-based assay (Hu et al., 1993;
Robb and Nazar, 1996). An internal control DNA of known concentration (0.1 pg) was
included in each reaction to allow accurate quantification of Vd1 or Vaa (Hu et al., 1993)
and detection of inhibiting compounds. The amplification reaction was conducted in 50
l of PCR buffer containing 0.2 mM bovine serum albumin, 0.2 mM of each
deoxyribonucleotide triphosphate, 12.5 pmol of each oligonucleotide primer, 5 l nucleic
acid extract plus 0.1 pg internal control DNA and one unit of Taq DNA polymerase
CHAPTER 2: Mixed Verticillium interactions in tomato
42
(Promega Corp., Madison, WI, USA). The amplification was performed in a
programmable heating block (Ericomp Co., San Diego, CA, USA) using 30 reaction
cycles consisting of a one min denaturation step at 95 C, one min annealing step at 60
C and 2 min elongation step at 72 C. Aliquots (10 l) of the final product were
analyzed electrophoretically on a 2 % agarose gel (Hu et al. 1993; Robb and Nazar
1996). This was followed by staining with ethidium bromide (10 mg/L) for 15 min and
distaining three times with water for 10 min. Images of the gels were captured under UV
light using a GelDoc 1000 documentation system (BioRad Laboratories Ltd., Hercules,
CA, USA) and the DNA bands were quantified using Molecular Analyst Software
(BioRad Laboratories Ltd.). For each sample, the ratio of fungal product to internal
control product was used to determine the amounts of total fungal DNA in plant tissues
(ngDNA/g plant tissue) from the standard curves (Hu et al. 1993; Robb and Nazar 1996).
Differences between treatment groups were tested by the Independent Sample T-test
using SPSS analysis software (SPSS Inc., Chicago, Il, USA).
To prepare Vd1 and Vaa standard curves, seven dilutions of the Verticillium
genomic DNA were prepared to give final DNA template of 0.1, 0.5, 1, 5, 10, 50 or 100
pg/PCR amplification reaction. A heterologous internal control DNA of known
concentration (0.1 pg) also was added to each PCR reaction. The PCR reaction and
capture of gel images were carried out as described above. The ratio of Verticillium DNA
PCR product (334 bp) to internal control product (231 bp) was calculated for each
dilution and these ratios were plotted against the amount of fungal DNA template used.
The standard curves were prepared using the average ratio values obtained from three
independent PCR assays.

CHAPTER 2: Mixed Verticillium interactions in tomato
43
2.2.6 DNA sequence analyses
For fungal ribosomal DNA (rDNA) sequence comparisons, DNA was extracted
from Vd1 and Dvd-E6 cultures as described in section 2.2.4. To determine rDNA
sequences, targeted DNA fragments were prepared by PCR amplification. For the
intragenic regions, primers specific for the 3' end of the 18S rRNA sequence
(5'CCGGTCCATCAGTCTCTCTG3') and the 5' end of the 25S rRNA sequence
(5'ACTCCGATGCGAGCTGTAAC3') were used to prepare a 544 bp fragment
containing the entire ITS 1, 5.8S rRNA and ITS 2 nucleotide sequences (Robb and Nazar
1996). To prepare the intergenic region, primers specific for the 3' end of the 25S rRNA
sequence (5'AGTAGCCTTGTTGTTACG3') and the 5' end of the 18S rRNA sequence
(5'TACTTAGACATGCATGGC3') were used to amplify a 2004 bp fragment
representing the entire sequence between the 3' end of the 25S rRNA and the 5' end of the
adjacent 18S rRNA gene sequence. The PCR amplified DNAs were each cloned into the
SmaI restriction site of the PTZ19R plasmid. Purified DNA was prepared for each clone
(Marchuk et al., 1991) and the sequences for the inserts were determined by automated
DNA sequence analysis (core sequencing facility, College of Biological Science,
University of Guelph).
2.2.7 cDNA labeling and microarray analysis
The RNA used for the experiment in this section was extracted by Ms. Barbara Lee.
The microarray hybridization was performed by Ms. Margaret Howes of the University
of Guelph Genomics and Microarray Laboratory. Microarray hybridizations were
performed using a commercially available tomato cDNA microarray chip (TOM1)
representing approximately 8600 unique genes (Alba et al., 2004). Total cellular RNA

CHAPTER 2: Mixed Verticillium interactions in tomato
44
was prepared from fresh pooled 10 d infected or control stem tissue as described in
section 2.2.5 and used to prepare cDNA probes by reverse transcription and indirect
labeling with aminoallyl-modified UTP and Alexa Fluor 555 and Alexa Fluor 647 dyes
from Molecular Probes Inc. (Eugene, OR, USA). The microarrays were incubated with
labeled probe at 37 oC for 16 h in DIG Easy Hyb solution from Roche Diagnostics
Canada (Laval, Quebec, Canada), supplemented with 0.45 mg/ml calf thymus DNA and
0.45 mg/ml yeast tRNA. After being washed 3 times at 50 oC in 1x SSC containing 0.1 %
SDS and rinsed once in 0.1x SSC, the slides were dried and scanned using a GenePix
4000 series microarray scanner and GenePix pro 4 software from Axon Instruments, Inc
(Foster City, CA, USA). The resulting GPR files were then imported into Gene Traffic
(DUO) 3.2 microarray management and analysis software (Iobion Informatics, LaJolla,
CA, USA) for normalization (Lowess method), filtration, statistical analysis and data
visualization. The log2 (Alexa555/Alexa647) ratios and standard deviations were
calculated for each spot and spots with greater than 2.5 fold average intensity changes
were selected for further analyses using a 2 sigma threshold (Savoie et al., 2003).
2.2.8 Quantitative RT-PCR analyses
The experiment in this section was performed by Mr. Kamran Haq as reported in
his M.Sc. thesis. All RT-PCR assays were based on cellular levels of actin mRNA that
initially were assayed using a homologous but truncated actin internal control RNA to
minimize the effect of inhibitory substances in the whole cell extracts. The internal
control RNA was prepared using a "PEP" mutagenesis strategy (Abeyrathne and Nazar,
2000). A PCR amplified fragment representing the actin gene region targeted by the
assay was cloned in pTZ19R and used as a template together with diverging primers to

CHAPTER 2: Mixed Verticillium interactions in tomato
45
prepare PCR amplified DNA with a deletion in the targeted sequence. After end group
phosphorylation, ligation, cloning and cleavage with KpnI endonuclease, the truncated
plasmid and its T7 RNA polymerase promoter were used as a template for in vitro RNA
synthesis (Tsai and Wiltbank, 1996; Freeman et al., 1999) to transcribe the sequence
homologous but truncated internal control RNAs.
For the actin-specific RT-PCR assays, 500 ng of whole cell nucleic acid extract
together with 2.5 pg of the truncated internal control RNA, 200 ng of a gene specific
reverse primer and 5 mM deoxyribonucleotide triphosphates (dNTP) were denatured for
5 min at 65 oC and cooled rapidly on ice. After the addition of reaction buffer (80 mM
KCl, 1.5 mM MgCl2, 10 mM dithiothreitol, 50 mM Tris-HCl, pH 8.3), the mixture (25
l) was incubated at 42 oC for 2 min and then with 100 u of Moloney murine leukemia
virus (MMLV) reverse transcriptase (Fermentas MBI, Burlington ON, Canada) at 37 o
C
for 60 min. After heat inactivation (75 oC) for 5 min, the samples were diluted 10 fold
and 5 l aliquots were used for PCR amplification. PCR reaction mixes (50 l) in 50
mM KCl, 1.5 mM MgCl2, 10 mM Tris-HCl (pH 9.0), containing 0.1% Triton X-100, 0.1
mg bovine serum albumin, 0.2 mM of each dNTP, 20 pmol of gene specific primers and
1 u Taq DNA polymerase were subjected to 30 reaction cycles as described above at
appropriate annealing temperatures. Aliquots (5-10 l) were fractionated on 2 % agarose
gels and, following staining with ethidium bromide, images were captured and quantified
using the GelDoc 1000 documentation system and Molecular Analyst software (BioRad
Laboratories, Hercules, CA, USA).
Assays of other mRNAs were performed by Mr. Danve Castroverde. An oligo dT
primer was substituted for reverse transcription as described above without an internal

CHAPTER 2: Mixed Verticillium interactions in tomato
46
control, but all other reaction conditions remained unchanged. Final values were
calculated relative to the actin mRNA levels.
2.3 Results
2.3.1 Amounts of fungal DNA in infected plants
In these studies, an estimate of fungal biomass was based on the levels of fungal
DNA. To allow accurate quantification of the amount of fungal DNA present in infected
plant tissues, Vd1 and Vaa standard curves were constructed. Genomic DNA was
extracted from Vd1 and Vaa cultures as described in 2.2.4. Several dilutions of the
genomic DNA were prepared to give final concentrations of 0.1, 0.5, 1, 5, 10, 50 or 100
pg/PCR amplification reaction with 0.1 pg heterologous internal control DNA in each
reaction. The use of the internal control offered several advantages which included:
serving as a baseline for accurate quantitative comparison with the fungal PCR product,
allowing the detection of inhibiting substances that might be present in the extract and
also serving as a PCR positive control against experimental failure (Hu et al. 1993; Robb
and Nazar 1996).
As illustrated in Figure 2-1 (upper panel), PCR products were analyzed
electrophoretically on a 2 % agarose gel, stained with ethidium bromide. The PCR
product of the internal control (231 bp) was shorter in size than that of Verticillium
genomic DNA (334), allowing it to be distinguished by migration distance. The ratios of
the fungal PCR product (F) to the internal control PCR product (IC) were calculated and
plotted against the amount of fungal DNA on a log-log scale. The standard curves were
prepared using the average ratio values obtained from three independent PCR assays.
Figure 2-1 shows the standard curves for Vd1 (middle panel) and Vaa (lower panel). A
CHAPTER 2: Mixed Verticillium interactions in tomato
47
direct linear relationship holds for the curves up to 10 pg. It follows that for accurate
quantification, the dilution of the template should be made in such a way to give F/IC
ratio that will be between 1-10 pg amounts of DNA on the X-axis of the curve. One-fifth
dilution of the plant extract generally was used during the course of the experiments, but
this could vary depending on the amounts of fungal DNA and inhibiting substance(s)
present in the extracts. The standard curves subsequently were used for estimating the
amount of fungal DNA content in plant extracts throughout this study. To determine the
amounts of unknown DNA, the ratio F/IC was calculated and matched to the
corresponding amount of DNA using the standard curves.

CHAPTER 2: Mixed Verticillium interactions in tomato
48
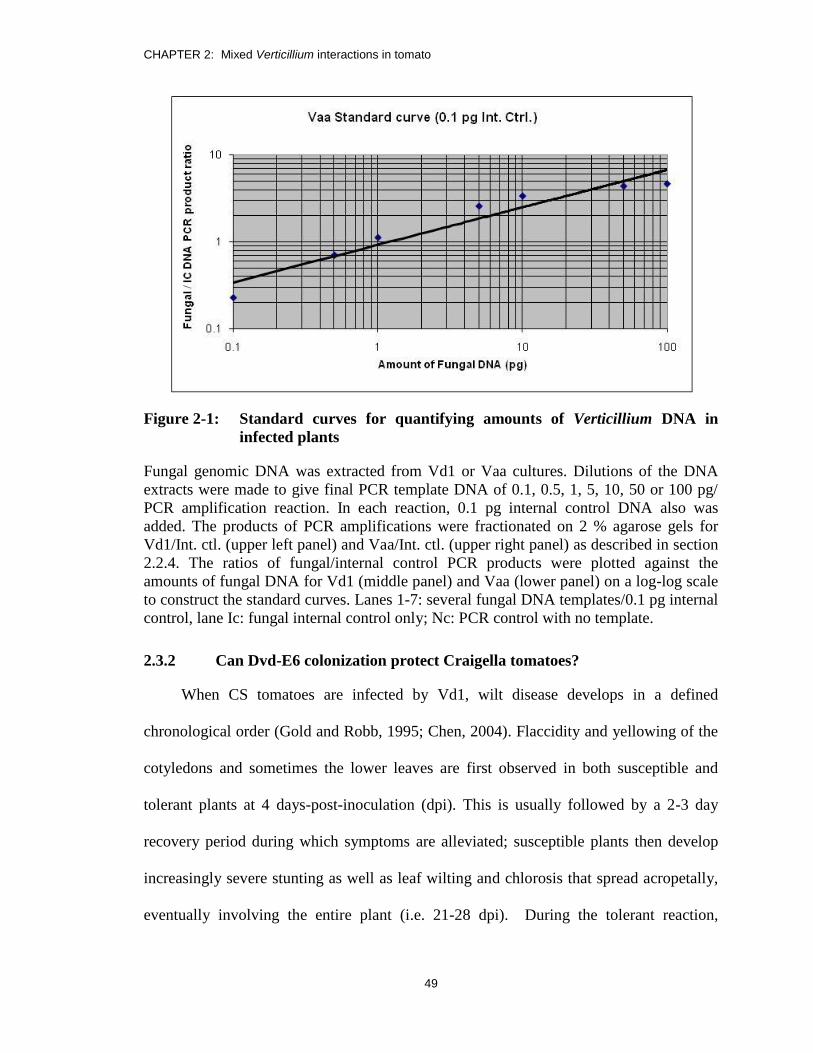
CHAPTER 2: Mixed Verticillium interactions in tomato
49
Figure 2-1: Standard curves for quantifying amounts of Verticillium DNA in
infected plants
Fungal genomic DNA was extracted from Vd1 or Vaa cultures. Dilutions of the DNA
extracts were made to give final PCR template DNA of 0.1, 0.5, 1, 5, 10, 50 or 100 pg/
PCR amplification reaction. In each reaction, 0.1 pg internal control DNA also was
added. The products of PCR amplifications were fractionated on 2 % agarose gels for
Vd1/Int. ctl. (upper left panel) and Vaa/Int. ctl. (upper right panel) as described in section
2.2.4. The ratios of fungal/internal control PCR products were plotted against the
amounts of fungal DNA for Vd1 (middle panel) and Vaa (lower panel) on a log-log scale
to construct the standard curves. Lanes 1-7: several fungal DNA templates/0.1 pg internal
control, lane Ic: fungal internal control only; Nc: PCR control with no template.
2.3.2 Can Dvd-E6 colonization protect Craigella tomatoes?
When CS tomatoes are infected by Vd1, wilt disease develops in a defined
chronological order (Gold and Robb, 1995; Chen, 2004). Flaccidity and yellowing of the
cotyledons and sometimes the lower leaves are first observed in both susceptible and
tolerant plants at 4 days-post-inoculation (dpi). This is usually followed by a 2-3 day
recovery period during which symptoms are alleviated; susceptible plants then develop
increasingly severe stunting as well as leaf wilting and chlorosis that spread acropetally,
eventually involving the entire plant (i.e. 21-28 dpi). During the tolerant reaction,

CHAPTER 2: Mixed Verticillium interactions in tomato
50
symptoms generally do not spread beyond the cotyledons or occasionally the first leaf
and, as already noted, the host becomes taller and more robust than its uninoculated CS
counterparts of the same physiological age (Robb et al., 2007).
To determine whether Dvd-E6-induced tolerance also can protect Vd1-infected CS
plants from this typical disease development, three interactions: CS//Vd1, CS//Dvd-E6
and CS//Dvd-E6/Vd1 were established (Figure 2-2). For the first two interactions,
seedlings were inoculated with either Vd1 or Dvd-E6 at the 4-leaf stage. In the case of
mixed infections, the roots were dipped in Dvd-E6 inoculum at the 3-leaf stage and re-
inoculated 4 days later (i.e. 4-leaf stage) with Vd1 inoculum. Control plants were root
dipped in gelatin solution alone. At 5 and 10 dpi, plants were scored for symptom
expression (i.e. disease scores and plant height) and the amounts of Vd1 and/or Dvd-E6
in the stems were determined (Hu et al., 1993; Robb and Nazar, 1996). Each experiment
consisted of 3 plants per sampling time for each of CS//Vd1, CS//Dvd-E6, CS//Dvd-
E6/Vd1 and the controls. The experiment was replicated 6 times.
The various interactions are illustrated at 5 dpi in Figure 2-2 (upper panel) and the
data for plant height and symptom scores at 5 and 10 dpi are summarized in the table
beneath (Figure 2-2, lower panel). The disease scores and amount of V. dahliae (Hu et al.
1993) in the stems at 5 (light gray bars) and 10 (dark gray bars) dpi are compared in
Figure 2-3, upper and lower panels, respectively. With respect to symptom expression
and levels of fungus, the present data confirm previously published values for Vd1
(susceptible) and Dvd-E6 (tolerant) infected CS plants (Chen et al., 2004; Robb et al.,
2007). As shown in Figure 2-2 and Figure 2-3 (Vd1), during a susceptible response levels
of Vd1 were high and, by 10 dpi, the plants were quite stunted and symptomatic. Despite

CHAPTER 2: Mixed Verticillium interactions in tomato
51
substantial levels of fungal DNA (69.2 ng/g plant tissue) during the tolerant response
(Figure 2-3, lower panel, E6) the plants were taller than the uninoculated control plants
(Figure 2-2, Dvd-E6 vs control) and the disease scores (Figure 2-3, upper panel, E6) were
similar to those observed in a typical incompatible interaction associated with lower
pathogen levels (Chen et al., 2004). Interestingly, plants inoculated with Dvd-E6 before
Vd1 were also taller than the controls (Figure 2-2, Dvd-E6/Vd1) and had low disease
scores but substantial amounts of Verticillium DNA in the stems (Figure 2-3, left and
right panels, respectively) similar to CS tomatoes inoculated with Dvd-E6 alone (P <
0.05). This raised the question of how much of the fungus in the CS//Dvd-E6/Vd1 plants
was actually Dvd-E6 and necessitated the development of an assay to distinguish and
quantify the individual isolates in tomato plants with dual infections.
Figure 2-2: Symptom expression in Vd1-infected CS tomatoes protected by
previous Dvd-E6 inoculation.
CS tomato seedlings were infected with Dvd-E6, Dvd-E6 followed by Vd1 or Vd1 alone
as described in section 2.2.3; uninfected plants were included as controls. The pictures in
Figure 2-2 (above) were taken at 5 dpi and show the increased height of Dvd-E6- and
Dvd-E6/Vd1-infected plants relative to controls. The table (lower) summarizes the data
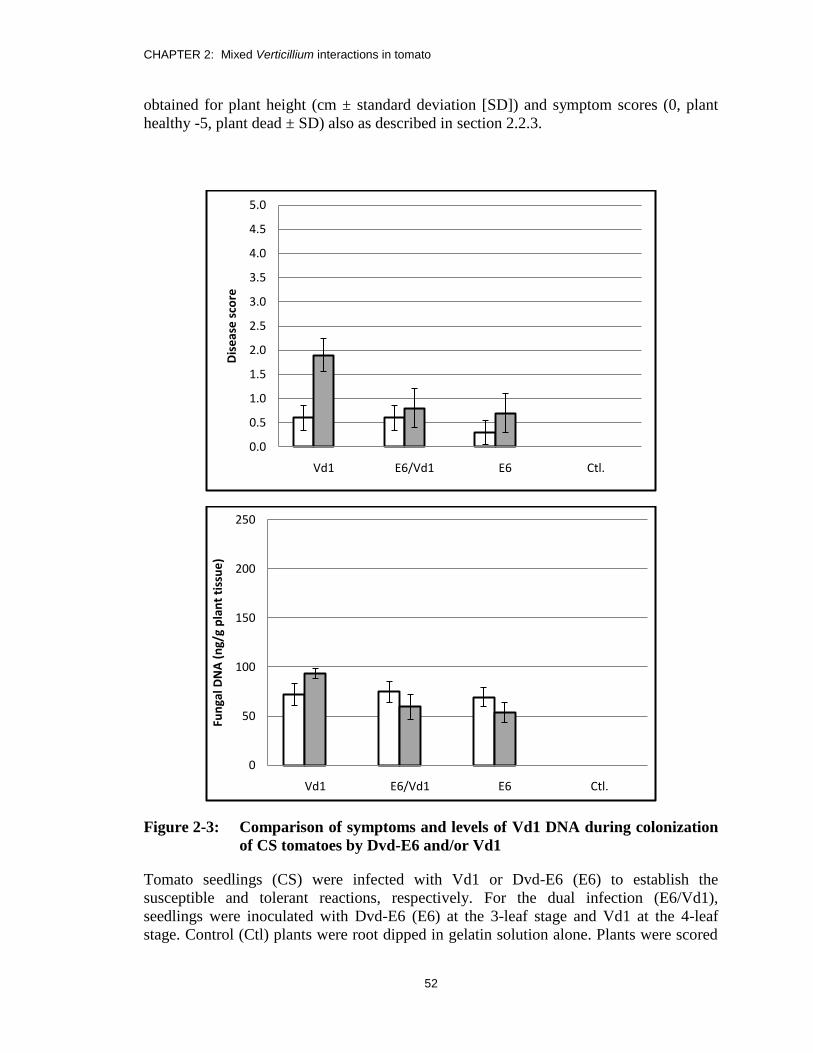
CHAPTER 2: Mixed Verticillium interactions in tomato
52
obtained for plant height (cm ± standard deviation [SD]) and symptom scores (0, plant
healthy -5, plant dead ± SD) also as described in section 2.2.3.
Figure 2-3: Comparison of symptoms and levels of Vd1 DNA during colonization
of CS tomatoes by Dvd-E6 and/or Vd1
Tomato seedlings (CS) were infected with Vd1 or Dvd-E6 (E6) to establish the
susceptible and tolerant reactions, respectively. For the dual infection (E6/Vd1),
seedlings were inoculated with Dvd-E6 (E6) at the 3-leaf stage and Vd1 at the 4-leaf
stage. Control (Ctl) plants were root dipped in gelatin solution alone. Plants were scored
0.0
0.5
1.0
1.5
2.0
2.5
3.0
3.5
4.0
4.5
5.0
Vd1 E6/Vd1 E6 Ctl.
Dis
eas
e s
core
0
50
100
150
200
250
Vd1 E6/Vd1 E6 Ctl.
Fun
gal D
NA
(n
g/g
pla
nt
tiss
ue
)
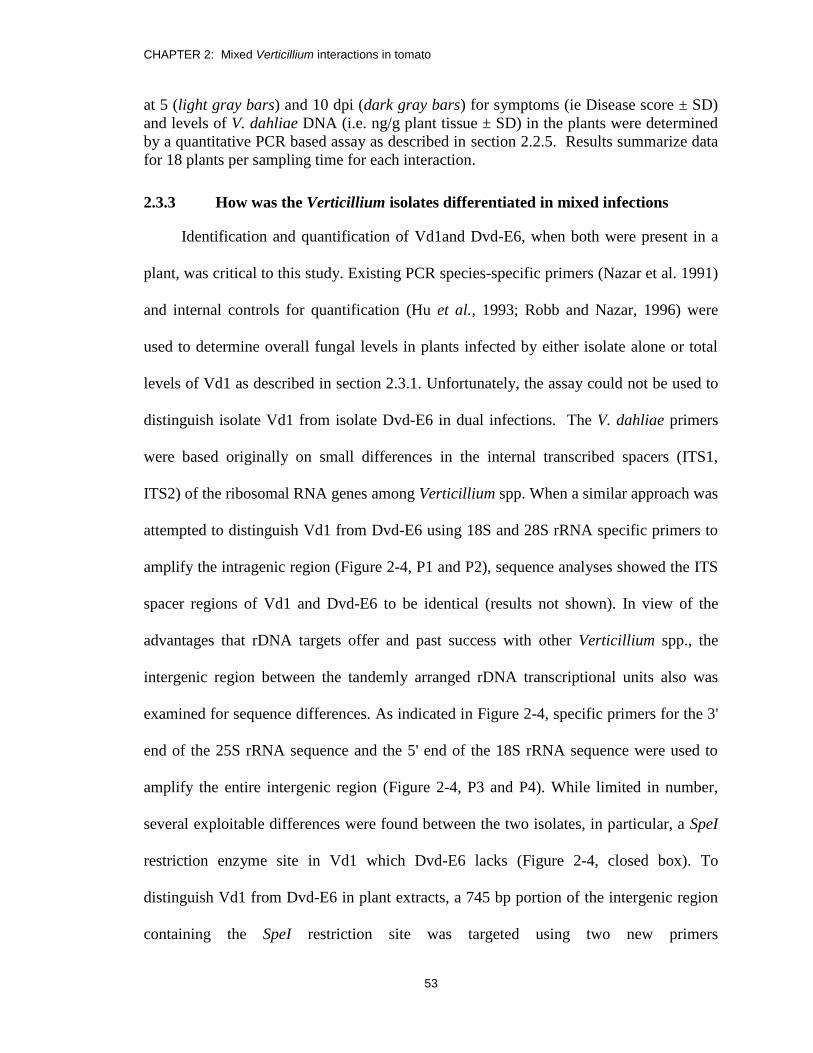
CHAPTER 2: Mixed Verticillium interactions in tomato
53
at 5 (light gray bars) and 10 dpi (dark gray bars) for symptoms (ie Disease score ± SD)
and levels of V. dahliae DNA (i.e. ng/g plant tissue ± SD) in the plants were determined
by a quantitative PCR based assay as described in section 2.2.5. Results summarize data
for 18 plants per sampling time for each interaction.
2.3.3 How was the Verticillium isolates differentiated in mixed infections
Identification and quantification of Vd1and Dvd-E6, when both were present in a
plant, was critical to this study. Existing PCR species-specific primers (Nazar et al. 1991)
and internal controls for quantification (Hu et al., 1993; Robb and Nazar, 1996) were
used to determine overall fungal levels in plants infected by either isolate alone or total
levels of Vd1 as described in section 2.3.1. Unfortunately, the assay could not be used to
distinguish isolate Vd1 from isolate Dvd-E6 in dual infections. The V. dahliae primers
were based originally on small differences in the internal transcribed spacers (ITS1,
ITS2) of the ribosomal RNA genes among Verticillium spp. When a similar approach was
attempted to distinguish Vd1 from Dvd-E6 using 18S and 28S rRNA specific primers to
amplify the intragenic region (Figure 2-4, P1 and P2), sequence analyses showed the ITS
spacer regions of Vd1 and Dvd-E6 to be identical (results not shown). In view of the
advantages that rDNA targets offer and past success with other Verticillium spp., the
intergenic region between the tandemly arranged rDNA transcriptional units also was
examined for sequence differences. As indicated in Figure 2-4, specific primers for the 3'
end of the 25S rRNA sequence and the 5' end of the 18S rRNA sequence were used to
amplify the entire intergenic region (Figure 2-4, P3 and P4). While limited in number,
several exploitable differences were found between the two isolates, in particular, a SpeI
restriction enzyme site in Vd1 which Dvd-E6 lacks (Figure 2-4, closed box). To
distinguish Vd1 from Dvd-E6 in plant extracts, a 745 bp portion of the intergenic region
containing the SpeI restriction site was targeted using two new primers

CHAPTER 2: Mixed Verticillium interactions in tomato
54
(5’GTGCACTGGAAAGAGC3’ and 5’GGCAACTCCAGTTTGG3’) for PCR
amplification (Figure 2-4, P5 and P6) and subsequent digestion with SpeI restriction
enzyme (Figure 2-5A). The digests were fractionated on 2 % agarose gels to differentiate
the two fungi by restriction fragment length polymorphism, as illustrated in Figure 2-5A
(left panel); the Dvd-E6 derived DNA remained intact (745 bp) while the Vd1 DNA was
digested and present as two separate fragments. These results are illustrated using
extracts from two typical stem samples (Figure 2-5A, right panel, lanes b and c) the
larger fragment of SpeI endonuclease digestion (640 bp) was observed easily (right panel)
and distinguishable from intact DNA. In all experiments, Vd1-derived DNA was
included as a separate sample (e.g., Figure 2-5A, right panel, lane a) to ensure complete
digestion. For quantitative analyses, gel images were captured using a Umax Astra 600P
scanner (Umax Technologies, Fremont, CA, USA) and quantified using Molecular
Analyst PC software (BioRad Laboratories Ltd.).

CHAPTER 2: Mixed Verticillium interactions in tomato
55
Figure 2-4: Comparisons of the intra- and intergenic sequences in the rRNAs of
Vd1 and Dvd-E6.
The intra- or intergenic regions were PCR amplified using 18 and 25S rRNA sequence-
specific primers (P1 and P 2 or P3 and P4, respectively) with purified fungal nuclear
DNA templates as described in section 2.2.4; the products were cloned in the pTZ19R
vector and the sequences of inserts were determined by automated dideoxy DNA
sequencing. The 1881 nucleotide intergenic sequence between the 3' end of the 25 S
rRNA and the 5' end of the downstream 18 S rRNA sequence is compared in the two
Verticillium isolates. Differences are indicated by shading and absent nucleotides are
indicated by dashes; a unique SpeI restriction site is indicated by the closed box. P1 and
P2: primers for amplifying intragenic region; P3 and P4: primers for amplifying
intergenic spacer region of both Vd1 and Dvd-E6.
CHAPTER 2: Mixed Verticillium interactions in tomato
56
Figure 2-5: Differentiation and quantification of Verticillium isolates by PCR-
based assays.
(A; left panel) For total fungal DNA measurements, plant extracts were used as templates
(lanes b and c) to PCR amplify the 18-25S intragenic region (Figure 2-4, primers P1 and
P2) in the presence of a truncated internal control template as previously described (Hu et
al. 1993). Products were fractionated on 2 % agarose gels, to differentiate the 544 bp
fungal DNA from the 391 bp internal control as indicated on the right. Purified fungal
DNA and internal control are included in lanes (a) and (d), respectively; a reaction
without template (lane e) and fragment length markers (M) also are included. (B; right
panel) To differentiate the Verticillium isolates a 745 bp portion of the 25-18S intergenic
region beginning at nucleotide 768 and ending at 1513 was amplified using primers P5
and P6 as described in Figure 2-4. The PCR amplified control or experimental DNAs
were digested with SpeI restriction enzyme that cleaves at nucleotide 873 only in the Vd1
DNA, resulting in a shorter 640 nucleotide fragment when fractionated on 2 % agarose
gels. Undigested (lanes a and c) and digested (lanes b and d) PCR amplified control
DNAs for Dvd-E6 and Vd1, respectively, are shown in the left panel together with a
reaction in the absence of template (lane e). Two typical mixed experimental samples are
shown in the right panel (lanes b and c). An undigested control (lane a) and fragment
length markers (M) also are included. The positions of the Dvd-E6 derived fragment (745
bp) and the Vd1 derived fragment (640) are included on the right.
Application of the new assay based on the intergenic region permitted a full
analysis of V. dahliae colonization when either or both species were present. The total
amount of V. dahliae DNA was determined first using species-specific primers and a
standard internal control (Figure 2-5B, lanes b and c). Subsequent digestion of PCR
products (Figure 2-5A) obtained from stem extracts of CS//Dvd E6/Vd1 plants (right
panel, lanes b and c) indicated that, on average, at 5 dpi most of the colonization by V.

CHAPTER 2: Mixed Verticillium interactions in tomato
57
dahliae was Dvd-E6 (Dvd-E6, 69.3 and Vd1, 4.20 ng per g plant tissue, respectively).
Some samples had low levels of Vd1 as shown in Figure 2-5A (right panel, lanes b and c)
but, in others, all the fungus was Dvd-E6. No Vd1 was detected in any of the stems at 10
dpi. Evidently, prior colonization by Dvd-E6 restricted the growth of Vd1 either in and/or
into the stem. These observations raised a new question, whether the phenomenon is a
property of the isolate Dvd-E6 or a consequence of the order of infection.
2.3.4 Does order of inoculation matter?
To address this question, five interactions were established. To confirm the results
of the first set of experiments and to provide a basis for comparison, the CS//Vd1,
CS//Dvd-E6 and CS//Dvd-E6/Vd1 interactions were repeated as described previously.
Two additional dual inoculation interactions were included, CS//Vd1/Dvd-E6 in which
seedlings were inoculated at the 3-leaf stage with Vd1 followed at the 4-leaf stage with
Dvd-E6 and, lastly CS//Dvd-E6+Vd1, in which seedlings were root dipped at the 4-leaf
stage in a 1:1 mixture (final concentration=107 spores/ml) of Dvd-E6 and Vd1 conidia in
gelatin solution. Again, control plants were root dipped in gelatin solution alone. At 5 and
10 dpi, plants were scored for symptom expression and samples were taken from the top
two-thirds of the stems for quantification of total fungal DNA. The roots of each
seedling also were removed and freeze dried. Each experiment comprised 3 plants per
sampling time for each of the five interactions and the control, and the experiment was
replicated four times.
The results for symptom levels (i.e. disease scores) and Vd1 DNA levels (ng/g
plant tissue) in the stems of 5 (light gray bars) and 10 dpi (dark gray bars) plants are
summarized in the left and right histograms of Figure 2-6, respectively. Although all

CHAPTER 2: Mixed Verticillium interactions in tomato
58
levels of pathogen found in the plants were somewhat higher in this set of experiments,
the results confirmed the important observations from the first set. Inoculation of
Craigella with Dvd-E6, whether alone or followed by Vd1, by 10 dpi resulted in equally
good plant growth and reduced symptoms (Figure 2-6, upper panel, E6 and E6/Vd1) in
the host (P< 0.05) even though the V. dahliae population was substantial and equivalent
(P< 0.05) (Figure 2-6, lower panel, E6 and E6/Vd1). However, when the order of the dual
infection was reversed (Figure 2-6, Vd1/E6), the plants were again stunted and both
symptom and fungal levels were higher and statistically different (P<0.05), resembling
plants infected with Vd1 alone. Clearly the order of infection does matter. What was most
interesting, however, were the results with plants inoculated with the mixed spore
suspension (Figure 2-6, Dvd-E6 + Vd1). At 10 dpi, the symptom scores for the CS//Dvd-
E6 + Vd1 interactions were statistically similar (P< 0.05) to those observed for the
CS//Dvd-E6/Vd1 and CS//Dvd-E6 interactions (Figure 2-6, upper panel) while the fungal
levels in stems were intermediate between CS//Dvd-E6 and CS//Vd1 (Figure 2.6, lower
panel). There was no fungal DNA detected in the control uninoculated plants. This
suggested that the presence of Dvd-E6 was ameliorating the effects of Vd1 colonization.

CHAPTER 2: Mixed Verticillium interactions in tomato
59
Figure 2-6: Comparison of symptoms and levels of V. dahliae DNA in dual
infections to determine whether order of infection matters.
To serve as a basis for comparison, CS//Vd1, CS//Dvd-E6 and CS//Dvd-E6/Vd1
interactions were established as previously described. In addition, seedlings were
inoculated with Vd1 at the 3-leaf stage and Dvd-E6 (E6) at the 4-leaf stage or with a
mixed inoculum (E6+Vd1) to establish the CS//Vd1/Dvd E6 and CS//Dvd-E6+Vd1
interactions, respectively. Plants were scored at 5 (light gray bars) and 10 (dark gray bars)
dpi for symptoms (i.e. disease scores ± SD; upper panel) and levels of V. dahliae DNA
(i.e. ng/g plant tissue ± SD; lower panel) in the stems. Results summarize the data for 12
plants per sampling time for each interaction.
0.0
0.5
1.0
1.5
2.0
2.5
3.0
3.5
4.0
4.5
5.0
Vd1 Vd1/E6 E6+Vd1 E6/Vd1 E6 Ctl.
Dis
eas
e s
core
0
50
100
150
200
250
Vd1 Vd1/E6 E6+Vd1 E6/Vd1 E6
Fun
gal D
NA
(n
g/g
pla
nt
tiss
ue
)
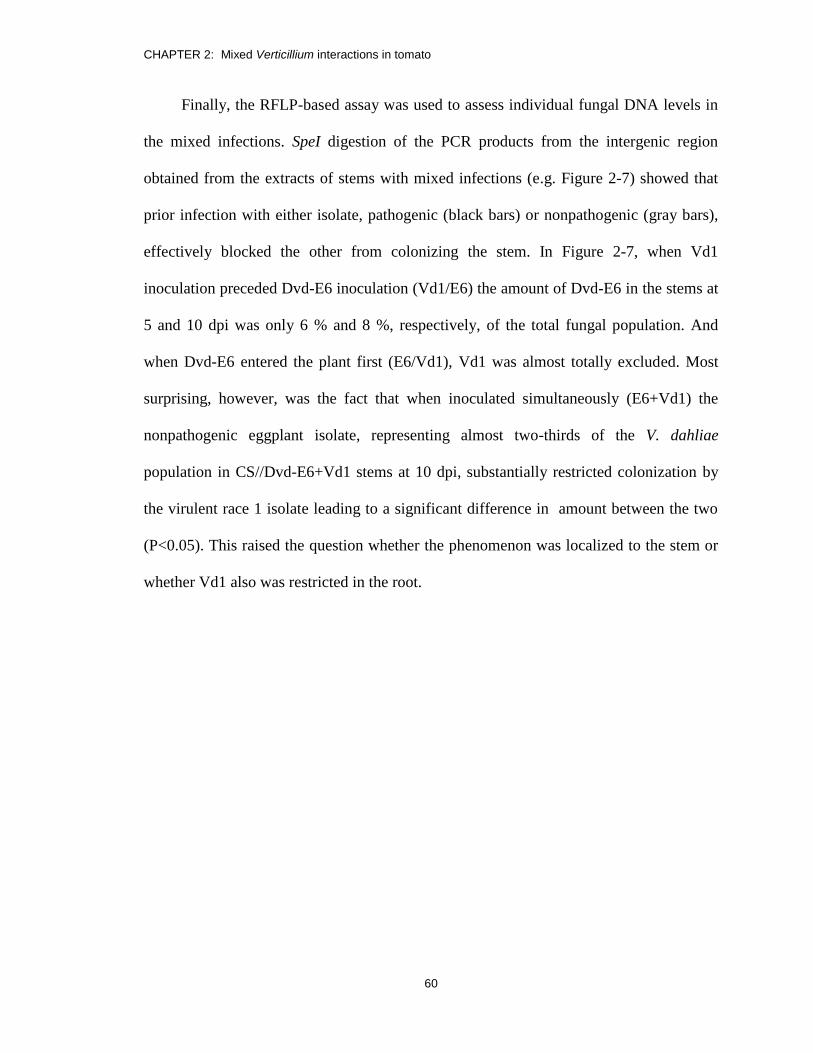
CHAPTER 2: Mixed Verticillium interactions in tomato
60
Finally, the RFLP-based assay was used to assess individual fungal DNA levels in
the mixed infections. SpeI digestion of the PCR products from the intergenic region
obtained from the extracts of stems with mixed infections (e.g. Figure 2-7) showed that
prior infection with either isolate, pathogenic (black bars) or nonpathogenic (gray bars),
effectively blocked the other from colonizing the stem. In Figure 2-7, when Vd1
inoculation preceded Dvd-E6 inoculation (Vd1/E6) the amount of Dvd-E6 in the stems at
5 and 10 dpi was only 6 % and 8 %, respectively, of the total fungal population. And
when Dvd-E6 entered the plant first (E6/Vd1), Vd1 was almost totally excluded. Most
surprising, however, was the fact that when inoculated simultaneously (E6+Vd1) the
nonpathogenic eggplant isolate, representing almost two-thirds of the V. dahliae
population in CS//Dvd-E6+Vd1 stems at 10 dpi, substantially restricted colonization by
the virulent race 1 isolate leading to a significant difference in amount between the two
(P<0.05). This raised the question whether the phenomenon was localized to the stem or
whether Vd1 also was restricted in the root.
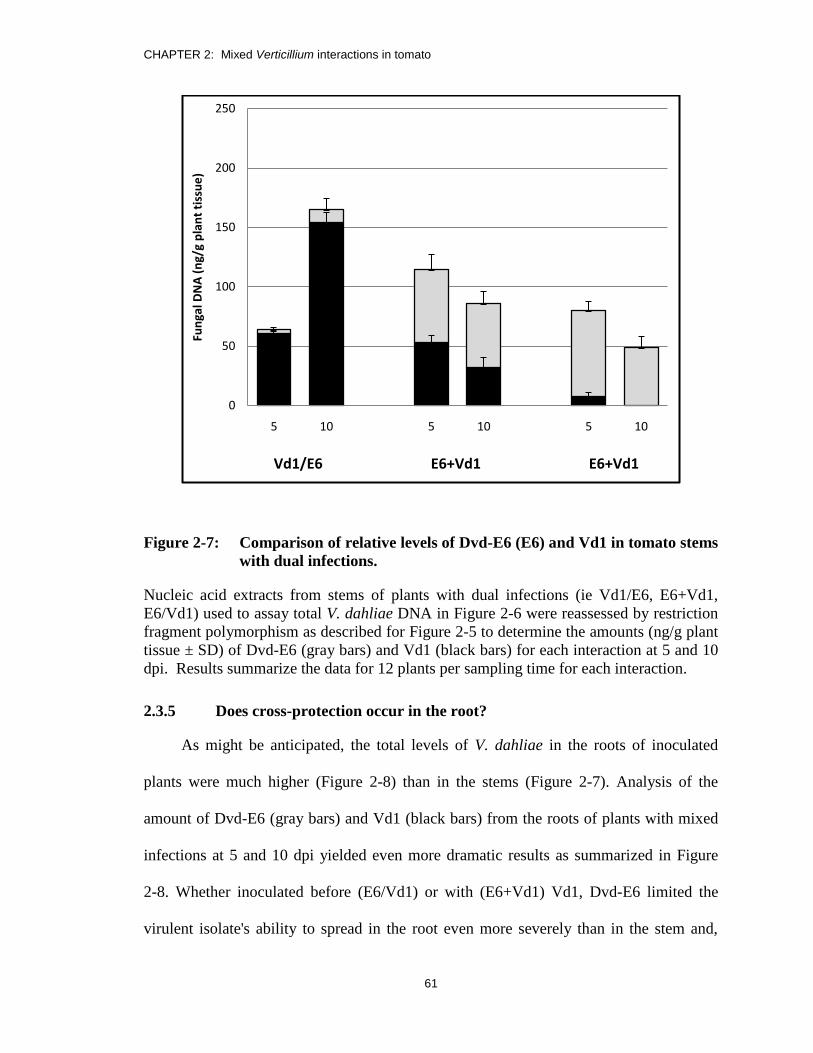
CHAPTER 2: Mixed Verticillium interactions in tomato
61
Figure 2-7: Comparison of relative levels of Dvd-E6 (E6) and Vd1 in tomato stems
with dual infections.
Nucleic acid extracts from stems of plants with dual infections (ie Vd1/E6, E6+Vd1,
E6/Vd1) used to assay total V. dahliae DNA in Figure 2-6 were reassessed by restriction
fragment polymorphism as described for Figure 2-5 to determine the amounts (ng/g plant
tissue ± SD) of Dvd-E6 (gray bars) and Vd1 (black bars) for each interaction at 5 and 10
dpi. Results summarize the data for 12 plants per sampling time for each interaction.
2.3.5 Does cross-protection occur in the root?
As might be anticipated, the total levels of V. dahliae in the roots of inoculated
plants were much higher (Figure 2-8) than in the stems (Figure 2-7). Analysis of the
amount of Dvd-E6 (gray bars) and Vd1 (black bars) from the roots of plants with mixed
infections at 5 and 10 dpi yielded even more dramatic results as summarized in Figure
2-8. Whether inoculated before (E6/Vd1) or with (E6+Vd1) Vd1, Dvd-E6 limited the
virulent isolate's ability to spread in the root even more severely than in the stem and,
0
50
100
150
200
250
5 10 5 10 5 10
Fun
gal D
NA
(n
g/g
pla
nt
tiss
ue
)
Vd1/E6 E6+Vd1 E6+Vd1
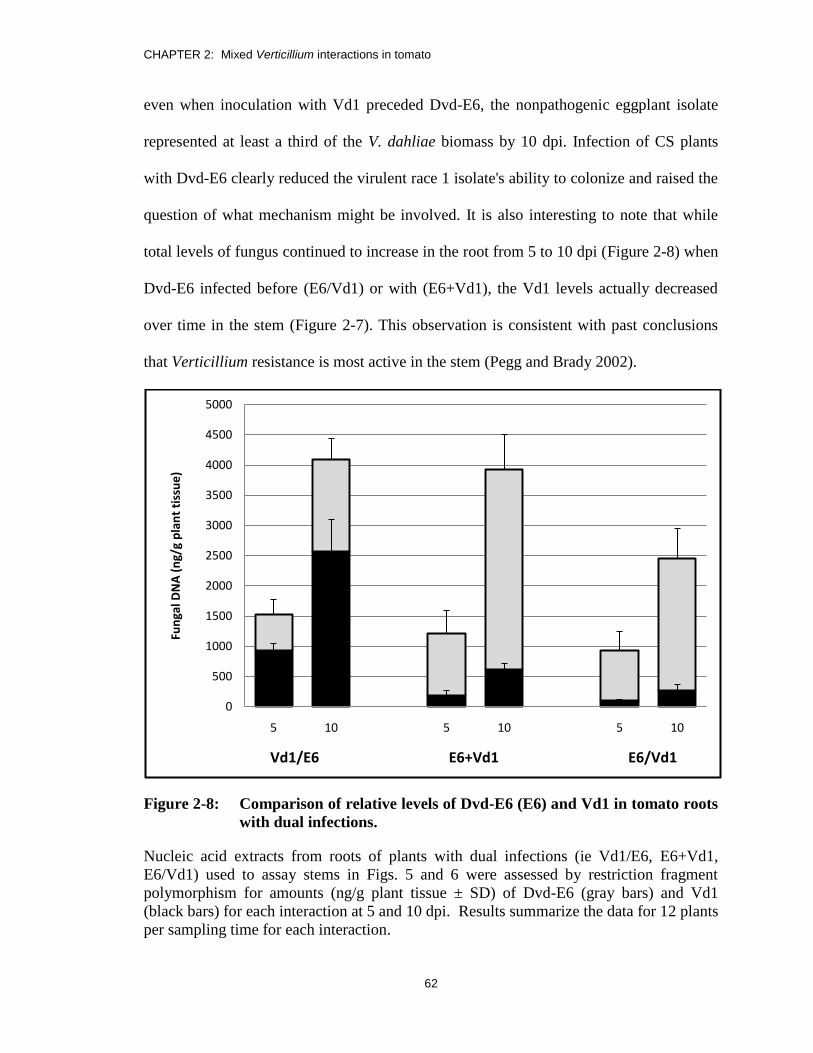
CHAPTER 2: Mixed Verticillium interactions in tomato
62
even when inoculation with Vd1 preceded Dvd-E6, the nonpathogenic eggplant isolate
represented at least a third of the V. dahliae biomass by 10 dpi. Infection of CS plants
with Dvd-E6 clearly reduced the virulent race 1 isolate's ability to colonize and raised the
question of what mechanism might be involved. It is also interesting to note that while
total levels of fungus continued to increase in the root from 5 to 10 dpi (Figure 2-8) when
Dvd-E6 infected before (E6/Vd1) or with (E6+Vd1), the Vd1 levels actually decreased
over time in the stem (Figure 2-7). This observation is consistent with past conclusions
that Verticillium resistance is most active in the stem (Pegg and Brady 2002).
Figure 2-8: Comparison of relative levels of Dvd-E6 (E6) and Vd1 in tomato roots
with dual infections.
Nucleic acid extracts from roots of plants with dual infections (ie Vd1/E6, E6+Vd1,
E6/Vd1) used to assay stems in Figs. 5 and 6 were assessed by restriction fragment
polymorphism for amounts (ng/g plant tissue ± SD) of Dvd-E6 (gray bars) and Vd1
(black bars) for each interaction at 5 and 10 dpi. Results summarize the data for 12 plants
per sampling time for each interaction.
0
500
1000
1500
2000
2500
3000
3500
4000
4500
5000
5 10 5 10 5 10
Fun
gal D
NA
(n
g/g
pla
nt
tiss
ue
)
Vd1/E6 E6+Vd1 E6/Vd1

CHAPTER 2: Mixed Verticillium interactions in tomato
63
2.3.6 How does the Dvd-E6 isolate restrict colonization by Vd1?
The simplest possible explanations for the ability of Dvd-E6 to limit growth of Vd1
in tomato were that it either outgrew Vd1 or had an inhibitory effect. In a preliminary
effort to investigate these possibilities, the ability of the two fungi to grow together on
culture plates was tested directly. Two approaches were used. In the first, the Vd1 and
Dvd-E6 spore stocks (i.e. original spore concentration = 4 x 10⁷ conidia/ml) were each
diluted twice to give a final spore concentrations of 1.3 x 10⁴ and 4 x 10
3. For each of the
dilutions, an equal volume of Dvd-E6 and Vd1 spores were mixed together and 25 l of
the mixed spores were spread onto PDA (Figure 2-9, a3) or 1/10 PDA plates. In the
second experiment, the plates were divided in half and 25 l of Dvd-E6 spore suspension
were spotted in the center of one half of the plate and 25 l of Vd1 spore suspension
(concentration = 4 x 10⁷ conidia/ml) were spotted on the other (Figure 2-9, b1). For each
experiment, corresponding control plates with Dvd-E6 or Vd1 alone also were
established (Figure 2-9, a1 and a2). All plates were then incubated in the dark at 24 C
for one week. After one week incubation, the plates were periodically scored for number,
size and distribution of colonies over a period of seven days.
As illustrated in Figure 2-9, the morphology of the two V. dahliae isolates was
quite different; Vd1 formed compact black colonies (Figure 2-9, a1) while Dvd-E6
colonies were gray and fluffy (Figure 2-9, a2). However, when the isolates were mixed
and counted on PDA plates after 7 d, colony diameters were similar, indicating similar
growth rates. Also, in the mixed culture experiment (Figure 2-9, a3 and a4) Dvd-E6
spores constituted 43 % of the original mixed population and 45 % of the colonies were
also Dvd-E6 after 7 d, suggesting that neither isolate is inhibitory to the other. This

CHAPTER 2: Mixed Verticillium interactions in tomato
64
observation was confirmed by the split plate experiment illustrated in Figure 2-9, b1 and
similar results were obtained on one-tenth PDA plates. All the data indicated that Dvd-E6
did not outgrow or inhibit Vd1, in vitro.
Figure 2-9: In vitro experiments with Verticillium dahliae isolates Dvd-E6 and
Vd1.
Aliquot of 25 µl of conidial suspension of the Vd1 (a1) or Dvd-E6 (a2) isolates or a
mixed spore suspension (a3) containing approximately equal concentrations of Vd1 and
Dvd-E6 conidia were spread onto PDA plates and grown in the dark at 24 ºC for 7d.
Panel a4 is a higher magnification of a3 showing the similar size and distribution of
colonies of both isolates. (b1) PDA plates were divided in half and 25 µl of spore
suspension of isolate Dvd-E6 were spotted on one side and Vd1 on the other, then
cultured under the same conditions as for (a).
While this observation was consistent with the necessity for plant pathogen
interplay it provided no direct evidence. Global gene expression analyses based on DNA
chips could represent an effective method to detect the presence of such an interaction.
As noted earlier, past analyses in our laboratory focused on the development of tolerance

CHAPTER 2: Mixed Verticillium interactions in tomato
65
and suggested that changes in gene expression in a tolerant response may lead to the
suppression of symptoms (Robb et al. 2007). In the present study, up-regulation of gene
expression at 10 dpi in CS plants infected with Dvd-E6 was examined in search of further
support for an interplay that may strengthen host resistance to a pathogenic Vd1.
The plants used for experiment in this section were prepared by Ms. Barbara Lee.
The microarray results were analyzed by Dr. Jane Robb, of the Department of Molecular
and Cellular Biology, University of Guelph. Gene expression was compared in extracts
from CS control and Dvd-E6 infected plants using the commercial available TOM 1
microarray (Alba et al., 2004) representing approximately 8600 tomato genes. The
microarray hybridization was completed by the University of Guelph Genomics facility.
RNA extracts from the various interactions were converted to cDNA using reverse
transcriptase. The cDNA probes were labeled indirectly with Alexa Fluor 647 and Alexa
Fluor 555 dyes as described in section 2.2.7. When CS genes with log2 changes of 1.25 or
greater (approximately 2.5 fold or greater) were selected using a sigma 2 threshold
(95.5% confidence), 120 genes were found to be upregulated significantly by Dvd-E6
infection; these are summarized in Figure 2-10 (upper panel). As found in other plant
pathosystems (Bonshtien et al., 2005) the largest groups of known upregulated genes
were the defence and signaling genes, representing 18 % and 14 %, respectively, of the
selected spots. Clearly, the host recognized and responded to challenge by the
nonpathogenic strain with significant changes in gene expression consistent with the
establishment of interplay with Dvd-E6. The table in Figure 2-10 (lower panel) lists the
most upregulated genes in Dvd-E6-infected CS tomato plants. As anticipated from the
pie chart many had unknown functions. The known genes fell into two distinct

CHAPTER 2: Mixed Verticillium interactions in tomato
66
categories: defense (PR leaf protein 6; PR protein 2) and photosynthesis (-carotene
hydroxylase, RUBISCO, glutamyl-tRNA synthase); up-regulation of these genes could
be expected to impact the hosts ability to resist a virulent pathogen attack.
In several instances, preliminary microarray analyses suggested that specific
defense genes were induced at higher levels in a tolerant interaction than in a compatible
one. Since such changes would demonstrate a beneficial interplay between the host plant
and Dvd-E6 that could act against Vd1 colonization, several of these observations were
confirmed directly by quantitative RT-PCR analyses. The experiment in this section was
performed by Mr. Danve C. M. Castroverde. The data for four genes, including the
Verticillium resistance gene, Ve2, and three defence genes encoding phenylalanine
ammonia-lyase, a cyclin dependent kinase (CDK) inhibitor (SGN-U 147736) and
chitinase IV (SGN-U 145299), are summarized in Table 2-1. Expression levels were
assessed at 6 dpi when defence genes are expected to be active (Heinz et al., 1998; Chen
et al., 2004) and normalized relative to the expression of a housekeeping gene, actin.
Clearly, all four genes were upregulated significantly in the tolerant interaction relative to
the compatible one, by two to seven folds. These results provide strong evidence that
interplay between Dvd-E6 and its host is important to the restriction of the virulent
Verticillium isolate in mixed infections. Colonization of tomatoes by the endophytic Dvd-
E6 isolate apparently induces higher expression levels of genes encoding Ve2 resistance
protein and associated defence proteins in CS tomatoes than are normally found in
compatible interactions. Since the Ve-protein provides some protection against Vd1
colonization but not against Dvd-E6 (Chen et al. 2004), the presence of Dvd-E6 in mixed

CHAPTER 2: Mixed Verticillium interactions in tomato
67
infections may well increase the host's resistance to the virulent isolate without apparent
detriment to itself.
Figure 2-10: Global analyses of genetic changes in Verticillium Dvd-E6-infected
tomato.
Tomato seedlings were infected with Dvd-E6 and RNA was extracted at 10 dpi for cDNA
microarray hybridization analyses as described in section 2.2.7 using the TOM 1
microarray (Alba et al., 2004). Data indicate changes relative to uninfected control plants.
Genes were identified using the gene list for the TOM 1 microarray and categorized using
the accompanying Sol Genomics Network database. The pie chart on the upper panel
summarizes plant genes that were upregulated during a tolerant response to Dvd-E6; the
CHAPTER 2: Mixed Verticillium interactions in tomato
68
Table on the lower panel summarizes genes with the greatest changes for 3 replicate
experiments as a log 2 ratio ± SD
Table 2-1: Expression of resistance and defense genes in CS tomato infected with
Vd1 or Dvd-E6 at 6 dpi
1 Gene expression values relative to actin mRNA level by quantitative RT-PCR
assay. 2 Dvd-E6/Vd1 mRNA levels.
2.3.7 Is Dvd-E6-induced Verticillium protection in tomato range restricted?
To test the ability of Dvd-E6 infection to protect Craigella against a more distantly
related Verticillium pathogen, dual interactions with Vaa also were examined. CS
seedlings again were inoculated at the 4-leaf stage by dipping the roots in Vd1, Dvd-E6
or Vaa conidial suspensions (1x10⁷
spores/ml in 0.5 % gelatin solution) to establish
homogeneous interactions. For dual interactions, seedlings were inoculated with Dvd-E6
spores at the 3-leaf stage and re-inoculated at the 4-leaf stage with either Vd1 or Vaa
spore suspension to establish the mixed infections. Control seedlings were root dipped in
gelatin solution alone. Plants were scored for symptom expression as described in section
2.2.3. The top two-thirds of the stems were harvested at 5 and 10 dpi for extraction and
fungal DNA assays as described in section 2.2.5.
Figure 2-11 shows the results obtained for the disease score (upper panel) and the
amount of fungal DNA (lower panel) in the various interactions. The symptoms in the
dual interactions, Dvd-E6/Vd1 plants with low disease and Dvd-E6/Vaa-infected plants
CHAPTER 2: Mixed Verticillium interactions in tomato
69
exhibiting the highest disease scores, similar to Vd1- or Vaa-infected plants. When the
amount of fungal DNA in the stems was assessed, the total fungal biomass in the dual
infections and the Dvd-E6- and Vd1-infected plants at 5 and 10 dpi was similar (light and
dark gray bars). In contrast, the amount of fungal biomass attributed to Vaa was
somewhat lower. In the mixed infections, however, most of the DNA (>90%) was of
Dvd-E6 origin (white bars). More important, the Vd1 DNA level in Dvd-E6/Vd1 plants
was substantially reduced relative to plants infected with Vd1 alone while the Vaa DNA
levels stayed about the same in both single and double infections.

CHAPTER 2: Mixed Verticillium interactions in tomato
70
Figure 2-11: Comparison of symptoms and levels of Vd1 and Vaa DNA in CS
tomato simultaneously infected with Dvd-E6.
Individual (E6, Vd1 and Vaa) and mixed (E6/Vd1 and E6/Vaa) infections were
established as previously described in section 2.2.3. Plants were scored (upper) at 5 (light
gray bars) and 10 (dark gray bars) dpi for symptoms (i.e., disease scores ± SD) or assayed
for total levels of Verticillium DNA (i.e. ng/g plant tissue ± SD) in the stems (lower). In
mixed infections, levels of each fungus also were determined (black and white bars,
respectively). Results summarize the data for 12 plants per sampling time for each
interaction.
0.0
0.5
1.0
1.5
2.0
2.5
3.0
3.5
4.0
4.5
5.0
E6 Vd1 E6/Vd1 Vaa E6/Vaa
Dis
eas
e s
core
0
50
100
150
200
250
E6 Vd1 E6/Vd1 Vd1 E6 Vaa E6/Vaa Vaa E6
Fun
gal D
NA
(n
g/g
pla
nt
tiss
ue
)
E6/Vd1 E6/Vaa
CHAPTER 2: Mixed Verticillium interactions in tomato
71
2.4 Discussion
When Verticillium spp. infect a plant three host responses can occur: resistance,
susceptibility or tolerance. Whether a plant's response to Verticillium spp. is resistant,
susceptible or tolerant depends on the interplay of plant and fungal factors and changes in
either the host (Veronese et al. 2003) or the pathogen can alter that state significantly. In
the present case, the endophytic activity of Dvd-E6 is the determinative factor. The data
presented confirm that the CS/Dvd-E6 interaction exhibits all the properties of tolerance
(Robb, 2007) including high levels of colonization by Dvd-E6, low symptom levels,
stimulation of plant growth and protection from virulent Vd1. The results obtained in this
study agree with previous work (Chen et al. 2004; Robb et al. 2007) which showed that
while Vd1 levels cycle in susceptible tomato stems (high 100-200 ng/g plant tissue, low
30-40 ng/g), Dvd-E6 levels achieve an initial (i.e. 4 dpi) intermediate range (60-100 ng/g)
that remains relatively constant during a 15 d time frame; the average fungal levels in
both susceptible and tolerant plants are substantially higher than in resistant plants (15 to
25 ng/g). Despite the extensive fungal population in Dvd-E6-infected tomato, symptom
levels are much reduced and the plants are taller and more robust than uninoculated
controls. Furthermore, as shown in the present experiments, these effects also were
observed in the CS//Dvd-E6/Vd1 interaction. Possibly, this increased vigor contributes to
the ability of the host to resist attack by other pathogens and pests; however, it seems
unlikely that such a mechanism could account for the dramatic results observed in the
present study. Inoculation of Craigella with Dvd-E6 either before or together with Vd1
essentially excludes the virulent race 1 isolate from the root and severely restricts its
growth in the stem. Even when Vd1 infects the host first, Dvd-E6 still seems able to
colonize at an equal rate in the root. Although this was not the case for Vaa, the results

CHAPTER 2: Mixed Verticillium interactions in tomato
72
demonstrate that Dvd-E6 infection was able to protect Craigella tomatoes against
colonization by, and symptom development from, Vd1 but not Vaa.
The mechanism by which Dvd-E6 protects its host from extensive Vd1 colonization
remains unclear but it does not result from a simple fungal-to-fungal interaction.
Interplay with the plant is clearly required. Previous studies suggested that tolerance
might be induced by Dvd-E6 suppression of symptom-related genes in Craigella (Robb et
al., 2007) raising the possibility that it simultaneously induces tolerance to Vd1. The
current study indicates that this is not entirely the case. The severe restriction of Vd1
colonization in the root and the stem during the CS//Dvd-E6/Vd1, and to a lesser extent
the CS//Dvd-E6+Vd1 interaction must also be a significant factor. However, in the
tolerant CS// Dvd-E6 interaction, the protective effect appears to be targeted more
directly, allowing Dvd-E6 to effectively restrict its virulent cousin, Vd1. In this context, it
may be important that both of the V. dahliae isolates from tomato are endemic to Ontario
(Dobinson, 1996) and potentially in direct competition, while Vaa from tomato is not.
Past studies often have suggested that the protective effect stems from an endophyte-
induced activation of systemic acquired resistance (SAR) in the host providing protection
against a broad range of pathogens (Tjamos et al., 2005). Endophytes that colonize plant
vascular systems have been shown to induce pathogenesis-related (PR) proteins (Van
Loon, 2006) associated with SAR or SIR responses in plants (Tjamos et al., 2005). As
illustrated in the table in Figure 2-10, Verticillium spp. can induce the expression of PR
proteins in infected tomato and this may well contribute to the ability of either isolate to
block the other from the stem and root if given a head start. However, other factors also
must be important since this does not account for the fact that in mixed inoculations (i.e.

CHAPTER 2: Mixed Verticillium interactions in tomato
73
CS//Dvd-E6+Vd1) Dvd-E6 restricts Vd1 colonization of both root and stem with almost
equal efficiency. Another possibility is that Dvd-E6 either outgrows or has inhibitory
activity against Vd1. The in vitro experiments on artificial medium indicated that Dvd-E6
did not outgrow or inhibit Vd1 in vitro, although it is still possible that the ability of one
or both fungal isolates to colonize and grow, in, into or on the surface of the root or to
exert inhibitory effects may be altered by interaction with the host.
However, as indicated in Figure 2-10, microarray analysis indicates that host gene
expression is altered substantially by colonization of the vascular system with Dvd-E6. A
more detailed examination of the most upregulated genes, tabulated in Figure 2-10,
suggests a stimulation of plant growth and a mobilization of plant defenses that act
selectively against the Vd1 isolate. For example, up-regulation of the genes for -
carotene hydroxylase, RUBISCO and glutamyl-tRNA synthase indicate an increase in
photosynthetic activity in Dvd-E6-infected plants that is likely to result in an increased
vigor and a stronger resistance response against pathogen attack as well as contributing to
an increase in plant height. PR proteins have been recognized as important contributors to
plant defense as well (Van Loon, 2006).
RT-PCR, which enables a robust analysis of gene expression, shows that infection
of CS tomatoes with Dvd-E6 significantly increases the level of mRNAs for Ve2 and
associated defense proteins relative to infection with Vd1. Since the Ve-gene is the only
gene that can be linked unequivocally with resistance to Vd1, the data strongly support
the conclusion that infection by the endophytic isolate alters host gene expression
resulting in increased resistance to colonization by the virulent Vd1. The present study
does not define the molecular mechanisms involved in establishing the interplay, and the

CHAPTER 2: Mixed Verticillium interactions in tomato
74
way the plant detects Dvd-E6 and the components of the signaling pathways leading to
establishment of the epiphytic condition remain unknown. Nevertheless, a potentially
beneficial plant-fungal interplay between Dvd-E6 and the tomato plant clearly is evident.
The experimental results presented here also provide evidence that Dvd-E6-induced
protection is restricted in range.
Isolates of Verticillium have been associated with the phenomenon of cross
protection for many years. Most of the studies have focused on the use of bacterial or
fungal antagonists of Verticillium spp. as potential biocontrol agents for wilt disease or,
conversely, the use of Verticillium spp. as antagonists to control other types of disease-
causing organisms (Tjamos et al., 2000; Pegg and Brady, 2002). However, this is the first
instance of a nonpathogenic isolate protecting a plant against a virulent relative of the
same Verticillium spp. The stability of this interaction remains an open question.
Historically, Verticillium spp. have proven adept at expanding host range by moving onto
new plant species. Possibly, this endophytic state actually represents a transition from the
original host (i.e. eggplant) to the new host (i.e. tomato) but answering this question will
require further experimentation. Whatever the case, the current interaction remains a
novel model for molecular analyses of endophytic development and how it acts to the
benefit of the host.
CHAPTER 3: Spore levels in mixed Verticillium infections of tomato
75
CHAPTER 3: Spore Levels in Mixed Verticillium Infections of Tomato
3.1 Introduction
In Chapter 2, it was shown that Craigella tomatoes can be protected from a virulent
isolate of V. dahliae race 1 (Vd1) by infection with an avirulent isolate of V. dahliae
Dvd-E6 (Dvd-E6), that restricts Vd1 colonization in the plant. The study also suggested
that the cross protection effect, demonstrated by the reduction of disease symptoms and
Vd1 DNA did not result from Dvd-E6 outgrowing or secreting antimicrobial compounds
that are toxic to Vd1. This interaction appeared to require interplay between Dvd-E6 and
the plant. The present chapter sought to investigate the biological mechanism that may
underlie such protection.
A number of structural and biochemical strategies could be proposed to increase
Vd1 resistance in the plant. An effective vascular coating response; a determinant of
pathogen distribution in the plant, is one of these strategies. It has been found that
vascular coating increased host resistance against Verticillium spp., especially in
Craigella resistant (CR) plants (Gold and Robb, 1995). Therefore, an effective vascular
coating response induced by Dvd-E6 in the plant may restrict Vd1 colonization. Also,
previous cytological studies on tolerance showed that the amount of Dvd-E6 in tolerant
interactions remain fairly constant between 6-12 dpi before a gradual reduction when
compared to Vd1, which had a highly elevated peak of fungal biomass at 10 dpi
following the cyclical period of fungal elimination (Chen et al., 2004). Such a rapid
elevation in the amount of fungus in the stem is usually attributed to sporulation in
planta. The results therefore, showed that the failure of Dvd-E6 biomass to also increase
at 10 dpi may suggest that Dvd-E6 had a characteristic mycelia lifestyle within the stem.

CHAPTER 3: Spore levels in mixed Verticillium infections of tomato
76
This observation indicates that the presence of Dvd-E6 in a mixed infection may impose
a similar response on Vd1.
There have been some reports of Verticillium spp. hyphal lysis by host hydrolytic
enzymes as a means of defense response (Pegg and Brady, 2002). Colonization of the
host xylem by Verticillium spp. is brought about by mycelia growth, but more rapidly by
conidia carried in the xylem fluid (Tolmsoff, 1973). For example, race 1 isolate of V.
dahliae colonizes the host plant by the proliferation of its mycelia which produce spores
that are released into and carried along the transpiration stream, thereby, aiding transverse
spread of the pathogen in the host plant. Therefore, any mechanism that could prevent or
inhibit sporulation and/or result in the lysis of spores or mycelia might be involved in
Vd1 protection in tomato. The study presented in this chapter examines spore levels in
the various interactions, to investigate whether colonization of stem by Dvd-E6 results in
the selective targeting of Vd1 spores and/or mycelia. In this context, the amount of Vd1
or/and Dvd-E6 in planta and also the proportion of spores to mycelium in infected plants
was examined.
3.2 Materials and methods
3.2.1 Pathogens and plants
Isolates Vd1 and Dvd-E6, of V. dahliae, represent, respectively pathogenic and
endophytic fungi, used for this experiment and were described in section 2.2.1. The
plants used for this experiment were CS as described in section 2.2.2.
3.2.2 Plant infection and sampling
CS seedlings were inoculated either with Vd1, Dvd-E6 or both by root dipping in
conidial suspension as described in section 2.2.3. Symptom expression ratings (i.e.

CHAPTER 3: Spore levels in mixed Verticillium infections of tomato
77
disease scores) were scored relative to uninoculated wounded control plants at 5 and 10
dpi using a 0 to 5 scale as described in section 2.2.3. Plant samples were collected from
the top two-thirds of the plant stems, after the petiole and leaves were removed and
pooled. Each pool contained three plants, and four pools were used for each interaction at
each sampling time. Each of the pools was chopped and divided into two; a fresh sample
for spore-related experiments and a freeze-dried sample for determination of the total and
relative amount of fungal DNA.
3.2.3 Spore levels in infected plant tissues
Samples for determining fungal spore concentration were derived from the fresh
samples as described in section 3.2.2. The cut ends of chopped stems were coated with a
high vacuum grease (Dow Corning Corporation, USA) and surface sterilized in a 10 %
hypochlorite solution for 10 min, then rinsed in autoclaved distilled water, three times
(total rinse time 30 min). To obtain a fungal spore sample, 0.15 g of the pooled plant
stems was weighed into a mortar. One milliliter of autoclaved distilled water was added
and the tissue was ground 100 times with a pestle. A hemacytometer (Neubauer-ruled
Bright Line counting chambers) was used to determine the spore count using a Nikon
Labophot microscope. Each replication was counted 5 times and three independent
replicate counts were made per sample.
3.2.4 Determination of spore viability
Samples for determining the amount of viable fungal spores were prepared as
described in section 3.2.3. From a 1 ml spore sample, 20 μl were diluted 100 fold and a
50 µl aliquot was spread onto each of 3 potato-dextrose-agar (PDA) plates containing the
antibiotic streptomycin (25 mg/ml) to eliminate bacterial contamination. All plates then

CHAPTER 3: Spore levels in mixed Verticillium infections of tomato
78
were incubated in the dark at 26 °C for one week. The plates were then scored for the
number of colonies. The remaining 980 µl of spore sample were harvested by
centrifugation at 2000 rpm for 2 min with a bench top micro centrifuge. The supernatant
was discarded and the spores were freeze-dried immediately for the subsequent
quantification of spore DNA in each macerate.
3.2.5 Quantification of fungal and spore DNA
Stem tissues were freeze-dried separately and pooled (i.e. 3 stems/pool) prior to
nucleic acid extraction. Similarly, spores from infected plant stems (i.e. 3 stems/pool)
were also freeze-dried before nucleic acid extraction. Nucleic acid was prepared from the
various stem and spore samples by extraction using the sodium dodecyl sulfate (SDS)-
phenol method, as described in section 2.2.5. The total amounts of fungal or spore DNA
(ng/g plant tissue) were determined as described in section 2.2.6. The relative amounts of
Vd1 and Dvd-E6 fungal or spore DNA in mixed infections were determined as described
in section 2.2.6.
3.3 Results
3.3.1 Preparation of spores from tissue macerates
To allow effective collection and quantification of fungal spores from macerates,
the viability of the spores has to be maintained during grinding to release them from the
plant tissues. To achieve this, two preliminary experiments were conducted. In the first
experiment to determine the optimal amount of grinding, 0.15 g from each pool of Dvd-
E6-infected plants was weighed into 5 mortars. One milliliter of autoclaved distilled
water was added to each mortar containing stem tissue and the tissue was ground 20, 40,
60, 80 or 100 times with a pestle. A similar treatment with 100 X grinding was done also
CHAPTER 3: Spore levels in mixed Verticillium infections of tomato
79
with uninfected CS plant as a control. The macerates were observed and photographed
under a light microscope. Figure 3-1A-F shows the results obtained from the various
samples. With increased grinding, remnants of plant tissue disappeared from the
suspension as spores were released. No spores were detected in control plants (Figure
3-1F).
In the second experiment to determine the effect of grinding on spore release from
infected plant tissues, 25 µl of Vd1 spore suspension (4 X 10⁷) and 1 ml autoclaved water
was added to 2 mortars along with 0.15 g uninfected stem tissue added to each of the
mortars. The tissue in the first mortar was ground 100 times with the spore suspension
(Figure 3-1G) while in the second mortar, the tissue was ground 100 X before adding the
macerate to the spore suspension (Figure 3-1H). Each of the suspensions was spread onto
PDA-streptomycin plates. There was no significant difference in the number of
colonies/plate observed between ground (91.0 + 7.0) and unground (101.3 + 13.7) spore
suspension. Also, there were no colonies observed on the control plate (tissue ground 100
X with no fungus added; Figure 3-1I).

CHAPTER 3: Spore levels in mixed Verticillium infections of tomato
80
Figure 3-1: Maceration of infected plant tissue
To determine the optimal amount of grinding, 0.15 g from the top two-thirds of Dvd-E6
infected plant stem tissues was weighed into each of 5 mortars and 1 ml autoclaved water
was added to each. The stem tissues were ground: A) 20X; B) 40X; C) 60X; D) 80X; E)
100X and F) CS infected plant was also ground 100X as a control. The macerates were
each observed and photographed under a light microscope.
To determine the effect of grinding on spore viability, 25 ul of Vd1 spore suspension (4
X 107) were added to 2 mortars and 1 ml autoclaved water added. In the first mortar, 0.15
g of the top two-thirds of an uninfected CS plant stem was ground with the spore
suspension (G), while in the second mortar; the tissue was ground before adding to the
spore suspension (H). Each of the suspensions was diluted and spread onto PDA plates.
3.3.2 Disease assessment of infected plants
To investigate the biological mechanism underlying endophyte-induced protection,
four interactions were established: CS/Vd1, CS//Vd1/Dvd-E6, CS//Dvd-E6/Vd1 and
CS//Dvd-E6. For the single infection interactions, seedlings were inoculated with either
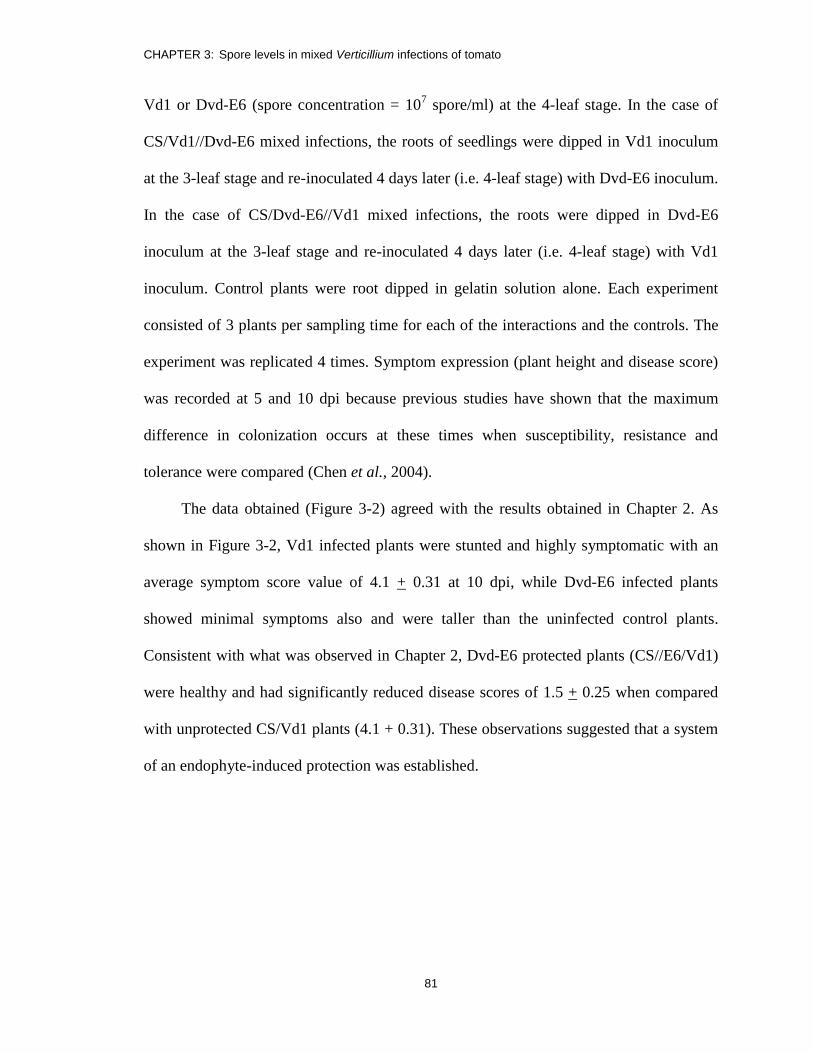
CHAPTER 3: Spore levels in mixed Verticillium infections of tomato
81
Vd1 or Dvd-E6 (spore concentration = 107 spore/ml) at the 4-leaf stage. In the case of
CS/Vd1//Dvd-E6 mixed infections, the roots of seedlings were dipped in Vd1 inoculum
at the 3-leaf stage and re-inoculated 4 days later (i.e. 4-leaf stage) with Dvd-E6 inoculum.
In the case of CS/Dvd-E6//Vd1 mixed infections, the roots were dipped in Dvd-E6
inoculum at the 3-leaf stage and re-inoculated 4 days later (i.e. 4-leaf stage) with Vd1
inoculum. Control plants were root dipped in gelatin solution alone. Each experiment
consisted of 3 plants per sampling time for each of the interactions and the controls. The
experiment was replicated 4 times. Symptom expression (plant height and disease score)
was recorded at 5 and 10 dpi because previous studies have shown that the maximum
difference in colonization occurs at these times when susceptibility, resistance and
tolerance were compared (Chen et al., 2004).
The data obtained (Figure 3-2) agreed with the results obtained in Chapter 2. As
shown in Figure 3-2, Vd1 infected plants were stunted and highly symptomatic with an
average symptom score value of 4.1 + 0.31 at 10 dpi, while Dvd-E6 infected plants
showed minimal symptoms also and were taller than the uninfected control plants.
Consistent with what was observed in Chapter 2, Dvd-E6 protected plants (CS//E6/Vd1)
were healthy and had significantly reduced disease scores of 1.5 + 0.25 when compared
with unprotected CS/Vd1 plants (4.1 + 0.31). These observations suggested that a system
of an endophyte-induced protection was established.

CHAPTER 3: Spore levels in mixed Verticillium infections of tomato
82
Figure 3-2: Disease scores in tomatoes with mixed Verticillium infections.
CS tomatoes were inoculated with Vd1, Dvd-E6 or both to establish the susceptible,
tolerant or mixed interactions as described in section 2.2.3. The picture (upper panel) was
taken at 10 dpi and shows the increased height of Dvd-E6- and Dvd-E6/Vd1-infected
plants relative to controls. The table (lower panel) summarizes the data obtained for plant
height (cm + SD) and symptom scores (0, plant healthy, 5 plant dead + SD) at 10 dpi.
Values are mean of 12 plants + SD.
3.3.3 Levels of sporulation in mixed infections
To determine whether spore production occurred in mixed infections, spore
samples were prepared (as described in section 3.2.3) for hemacytometer spore counts.
As anticipated, the results (Figure 3-3) indicate that both Vd1 and Dvd-E6 sporulate
when present alone at both sampling times, although there was a slight reduction in the
amount of spores from 5 to 10 dpi. In the mixed infections, 1.5 X 10⁷ and 1.3 X 10
7
spores also were recorded in CS/Vd1//Dvd-E6 and CS/Dvd-E6//Vd1 plants respectively,
CS/Vd1 CS//Vd1/E6 CS//E6/Vd1 CS/E6 CS/Ctl.
Plant height 6.4 + 0.66 7.6 + 0.80 10.2 + 1.17 12.2 + 0.98 11.3 + 0.47
Symptom
score
4.1 + 0.31 2.4 + 0.37 1.5 + 0.25 0.8 + 0.22 0

CHAPTER 3: Spore levels in mixed Verticillium infections of tomato
83
at 10 dpi. From the results of hemacytometer spore counts, it was evident that sporulation
did occur in mixed infections, but it was unknown whether the spores were Dvd-E6 or
Vd1, or mixed.
Figure 3-3: Hemacytometer spore counts in Verticillium/Craigella interactions.
CS tomatoes were infected with Vd1, Dvd-E6 or both to establish the CS/Vd1,
CS//Vd1/Dvd-E6, CS//Dvd-E6/Vd1 and CS/Dvd-E6 interactions. The amount of spores
was determined at 5 (white bars) and 10 (dark grey bars) dpi as described in section 3.2.3.
Results summarize data for 12 plants for each interaction + SD.
3.3.4 Relative amounts of Verticillium spore DNA in mixed infections
To determine the relative amounts of Vd1 and Dvd-E6 spores in mixed infections, a
previously developed quantitative PCR and a RFLP-based assay (section 2.3.3) were
used to determine the total and relative amounts of Vd1 and Dvd-E6 spore DNA as
described in section 3.2.5. The results (Figure 3-4) show an interesting observation. There
was a large significant difference between the number of spores produced by Vd1 and
0.0
0.5
1.0
1.5
2.0
2.5
3.0
3.5
4.0
4.5
5.0
Vd1 Vd/E6 E6/Vd E6
He
mac
y. s
po
re c
ou
nt
(X1
07
/g p
lt. t
iss.
)

CHAPTER 3: Spore levels in mixed Verticillium infections of tomato
84
Dvd-E6. Vd1 produced a high amount of spores (99 + 14.5 ng spore DNA/g plant tissue)
at both sampling times, while the amount produced by Dvd-E6 was greatly reduced; 24 +
8.9 and 8+4.2 ng spore DNA/g plant tissue at 5 and 10 dpi respectively. However, when
both isolates were present in mixed infections, there was a 77 % reduction in the amount
of Vd1 spores in the CS//Vd1/E6 plants when compared with CS/Vd1 plants. The
reduction in Vd1 spores was even more dramatic in the CS//E6/Vd1 interaction, as no
Vd1 spores were detected at 10 dpi. In the mixed infection (CS/E6//Vd1), as the amounts
of Vd1 spore decreased, there was a slight increase in the amounts of Dvd-E6 spores at
10 dpi when compared to the tolerant interaction (CS/Dvd-E6).
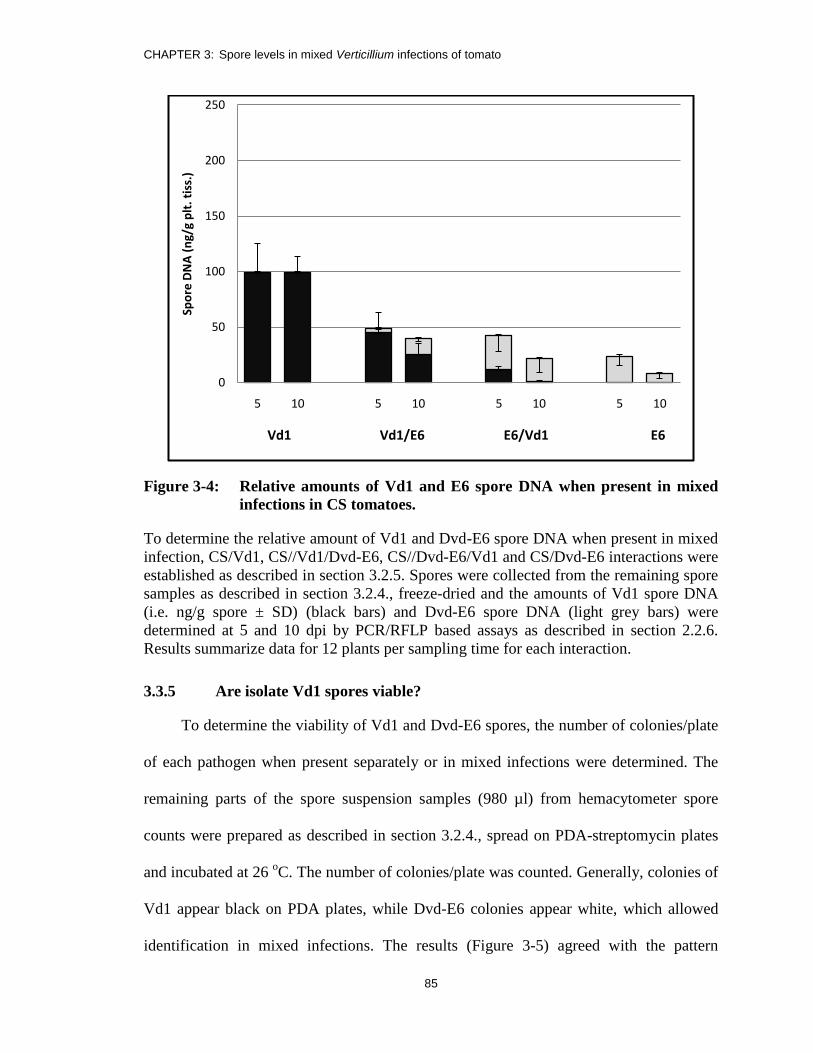
CHAPTER 3: Spore levels in mixed Verticillium infections of tomato
85
Figure 3-4: Relative amounts of Vd1 and E6 spore DNA when present in mixed
infections in CS tomatoes.
To determine the relative amount of Vd1 and Dvd-E6 spore DNA when present in mixed
infection, CS/Vd1, CS//Vd1/Dvd-E6, CS//Dvd-E6/Vd1 and CS/Dvd-E6 interactions were
established as described in section 3.2.5. Spores were collected from the remaining spore
samples as described in section 3.2.4., freeze-dried and the amounts of Vd1 spore DNA
(i.e. ng/g spore ± SD) (black bars) and Dvd-E6 spore DNA (light grey bars) were
determined at 5 and 10 dpi by PCR/RFLP based assays as described in section 2.2.6.
Results summarize data for 12 plants per sampling time for each interaction.
3.3.5 Are isolate Vd1 spores viable?
To determine the viability of Vd1 and Dvd-E6 spores, the number of colonies/plate
of each pathogen when present separately or in mixed infections were determined. The
remaining parts of the spore suspension samples (980 µl) from hemacytometer spore
counts were prepared as described in section 3.2.4., spread on PDA-streptomycin plates
and incubated at 26 oC. The number of colonies/plate was counted. Generally, colonies of
Vd1 appear black on PDA plates, while Dvd-E6 colonies appear white, which allowed
identification in mixed infections. The results (Figure 3-5) agreed with the pattern
0
50
100
150
200
250
5 10 5 10 5 10 5 10
Spo
re D
NA
(n
g/g
plt
. tis
s.)
Vd1 Vd1/E6 E6/Vd1 E6

CHAPTER 3: Spore levels in mixed Verticillium infections of tomato
86
observed in the spore DNA determination (Figure 3-4). There was a high number of Vd1
colonies/plate while Dvd-E6 had less. Consistent with the results in Figure 3-4, all the
observed colonies in the CS//E6/Vd1 interaction were DVd-E6 and no colonies were
present for Vd1 on the plates at 10 dpi.
Figure 3-5: Spore viability in Craigella/Verticillium pathosystems.
To determine the amount of viable Vd1 and Dvd-E6 spores when present in mixed
infections, spore samples used for hemacytometer spore count were prepared as described
in section 3.2.4 and plated on PDA plates containing streptomycin. The number of
colonies/plate was counted for Vd1 (black bars) and Dvd-E6 (grey bars) after one week.
Results summarize data for 12 plates for each interaction + SD.
3.3.6 What constitutes the fungal biomass?
In the context of this study, the fungal biomass is made up of mycelia and spores,
but the relative proportion of each is unknown in the various interactions of Craigella-
Verticillium plants. To determine the relative amount of mycelia to spores, total nucleic
DNA was also extracted from freeze-dried stem samples (section 3.2.2). The total and
Vd1 Vd1/E6 E6/Vd1 E6

CHAPTER 3: Spore levels in mixed Verticillium infections of tomato
87
relative amounts of fungal DNA (ng/g plant tissue) (Figure 3-6A, left upper panel) were
determined by the PCR/RFLP-based assay. The differences between the total amounts of
fungal DNA and the total amounts of spore DNA (ng/g plant tissue) provided the
estimated amounts of mycelia in the plants. Each experiment comprised a pool of three
plants per sampling time for each of the five interactions. The control and the experiment
were replicated four times.
The results (upper left panel, Figure 3-6A) show the total and relative amount of
Verticillium DNA. By calculation, the proportion of fungal mycelia to spores (Figure
3-6B, right upper panel) and the % composition of fungal biomass (Figure 3-6C, lower
panel) were determined. The results for the total and relative amount of fungus in the
plant are consistent also with what was observed in Chapter 2. As shown in Figure 3-6A
(left upper panel), the level of Vd1 was high with a corresponding high symptom rating
depicting the characteristics of the susceptible response. But, in this experiment, the
amount of Vd1 at 5 dpi was slightly higher than what was previously observed for this
interaction. Also, as anticipated from previous studies (Chen et al., 2004; section 2.3.1),
the amounts of pathogen in the CS/E6 and CS//E6/Vd1 plants were also high with low
symptom expression, showing the characteristics of a tolerant interaction. These results
show that the spore/mycelium ratio is high for Vd1 at both 5 and 10 dpi. Conversely,
Dvd-E6 was characterized by a low spore/mycelium ratio, suggesting that this isolate is
mainly mycelia in the plants (72 and 82 % mycelia at 5 and 10 dpi, respectively). The
case was different in the endophyte-induced protection interactions; where the amount of
Vd1 spores was reduced at both 5 and 10 dpi, although the spore/mycelium ratios
remained constant.
CHAPTER 3: Spore levels in mixed Verticillium infections of tomato
88
Figure 3-6: Relative amounts of mycelia and spore DNA in tomatoes infected with
Vd1 and/or Dvd-E6.
Nucleic acid extracts were prepared from the second half of the pooled plant samples
from the interactions; CS/Vd1, CS//Vd1/Dvd-E6, CS//Dvd-E6/Vd1 and CS/Dvd-E6.
PCR/RFLP based assays were used to determine the amounts of Vd1 (black bars) and
Dvd-E6 (grey bars) DNA (ng/g plant tissue) (A; left upper panel). The estimated amounts
of fungal mycelia (white spotted bars) were calculated from the differences between the
total amount of fungal DNA and spore DNA (hatched bars) (ng/g plant tissue) (B; right
upper panel). The table (C; lower panel) summarizes the % amounts of mycelia and
spores expressed in % estimated biomass. Results summarize data for 12 plates for each
interaction + SD.
3.4 Discussion
The results in this chapter provide insight to the biology underlying the protective
strategy induced by Dvd-E6 on tomato against Vd1, in relation to the amount of spores
and mycelia present in the plant. The symptom expression scores and the plant height
recorded in this study were consistent with what was observed in Chapter 2. Vd1-infected
C

CHAPTER 3: Spore levels in mixed Verticillium infections of tomato
89
plants were stunted with severe symptoms (4.1 + 0.31), while the Dvd-E6-infected plants
had fewer symptoms (0.8 + 0.22), were more robust and were taller compared to
uninfected control plants. The Dvd-E6 protected plants also had less disease symptoms
(1.5 + 0.25). These observations indicate that the protection phenomenon was established
and this could be the basis for comparing the amount of spores and mycelia in protected
and unprotected plants.
Previous findings have shown that the virulence of Verticillium spp. in a host is
related to the amount of spores produced in the xylem (Schnathorst, 1981). With this
observation, it seemed possible that the protective mechanism induced by Dvd-E6 could
be related to the level of spores in the plant. With this in mind, an attempt was made to
compare the number of spores and amount of mycelium in the various interactions.
Preliminary experiments were conducted to investigate what conditions should be used to
prepare spores from tissue macerates to maintain their viability. The results obtained in
Figure 3-1 suggest that with increased grinding, more spores were released and 100
strokes was optimum for breaking down the mycelia and plant cells to release spores
from stem tissues. The results also indicate that grinding had little or no effect on the
viability of the spores, as there was no significant difference in the number of
colonies/plate observed when the spores were ground (91.0+7.0) or not ground
(101.3+13.7). These observations from the preliminary experiments indicate that spores
can be effectively collected and quantified from infected plants.
As anticipated, the hemacytometer spore counts indicate that both Vd1 and Dvd-E6
produced spores in single infections, but the relative amounts of spores from each isolate
could not be determined by this method in the mixed infections. This necessitated the use
CHAPTER 3: Spore levels in mixed Verticillium infections of tomato
90
of a previously developed PCR/RFLP-based assay to assess the amount of spore DNA for
each isolate as an estimate of the amount of spores in the plant. The result (Figure 3-4)
shows a dramatic difference between the amounts of spores produced by the two isolates.
In the single infection, Vd1 produced large numbers of spores. The results support
previous findings, which suggested that the increased level of Vd1 colonization at 10 dpi
following the cyclical period of fungal elimination (6-8 dpi) in the susceptible response
might be related to sporulation (Chen et al., 2004). The elevated level of Vd1 spore
production at 10 dpi also may account for the high level of virulence of this isolate.
Previous studies have shown that sporulation capacity is correlated to virulence of
Verticillium spp. (Newcombe et al., 1990; Hastie and Heale, 1984). The high amounts of
spores produced by the pathogens lead to systemic colonization and symptom expression
in the host plant (Newcombe et al., 1990). However, in the mixed infection interactions,
the behavior of Vd1 spore production was different. For example, in the CS/Dvd-E6/Vd1
interaction, there was a significant reduction (87 %) in the amount of Vd1 spores relative
to the susceptible reaction at 5 dpi. There was no difference in the level of Dvd-E6 spores
in the mixed and tolerant interactions; both were low which may also account for the low
level of virulence of Dvd-E6. The observations with Verticillium spore DNA were further
confirmed by the experiment for determining the number of viable spores (Figure 3-5).
The results were consistent with those obtained for the amount of spore DNA (Figure 3-
4). The number of Vd1 colonies in the compatible interaction was far greater than those
obtained for the Dvd-E6 tolerant interaction. Also, the number of Vd1 colonies observed
was significantly reduced in both mixed infections compared with the CS/Vd1
interaction. In the CS/Dvd-E6//Vd1 interaction, no colonies grew on the PDA plates.

CHAPTER 3: Spore levels in mixed Verticillium infections of tomato
91
These results clearly suggest that the level of Vd1 spores was affected in the plant by the
presence of Dvd-E6.
The protection effect induced by Dvd-E6 could affect Vd1 spores in several ways.
One possibility was that the targeting mechanism altered the vascular environment in the
plant which inhibits Vd1 sporulation. There have been several reports on both host and
environmental influences on fungal sporulation (Bashi and Rotem, 1975; Rotem and
Cohen, 1978; Cohen and Rotem, 1969; Smith and Berry, 1974). Similarly, studies also
have shown that alteration of the environmental conditions may affect fungal sporulation
competence, the ability of a fungus to sporulate (Champe et al., 1981). Therefore, an
altered vascular environment in CS plants induced by Dvd-E6 may affect Vd1
sporulation competence or reduced sporulation, spore germination or viability. Based on
the results obtained from the viable spore count experiment (Figure 3-5), non-viability of
Vd1 spores may not be the case, as spores from the mixed infection macerates also were
viable when spread on PDA plates. Since the spore DNA result indicates a low level of
Vd1 spores in the mixed infections, this clearly ruled out the possibility of whether the
spores did not germinate in the first case.
Another possible mechanism for the protective effect may be that Vd1 produced
lots of spores in mixed infections comparable to what was observed in the Vd1-infected
tomatoes, but Dvd-E6 induced the production of some biochemical compounds by the
plant that have hydrolytic properties that destroyed the Vd1 spores. These compounds
may include defense proteins such as PR proteins (Stintzi et al., 1993), phenolic
compounds (Nicholson and Hammerschmidt, 1992) and phytoalexins such as tomatine
(Keukens et al., 1995) and rishtin (Le Floch et al., 2005). Also, earlier cytological studies
CHAPTER 3: Spore levels in mixed Verticillium infections of tomato
92
have shown that the vascular coating response in a tolerant interaction was similar to the
one observed in resistant interaction (Chen et al., 2004). The presence of Dvd-E6 may
result in a more effective vascular coating response in CS plant which prevented Vd1
colonization in the first case. This can be inferred from the results obtained from the total
and relative amounts of DNA from Verticillium spp. The population of Vd1 was small in
the mixed infections with respect to the compatible interaction (Figure 3-6, upper panel),
suggesting a reduction in Vd1 colonization. Whether a vascular coating response strategy
was involved in the protection mechanism or not will require further cytological studies.
It has been found in some fungi, such as Gibberella zeae, that both sporulation and
mycelial growth occurs simultaneously and any factor that affects one of these may also
affect the other (Huang and Cappellini, 1980). To further investigate whether the
mechanism that reduced Vd1 population in the plant in the mixed infections was specific
to spores alone or also affects mycelia, the amount of mycelia in infected plants also was
determined. This was achieved by determining the amount of DNA of the Verticillium
spp. and spore DNA (ng/g plant tissue) in infected stems as an estimate of the proportion
of conidia versus mycelia in the fungal biomass. The result showed that, in susceptible
reactions, Vd1 had a high spore/mycelium ratio which indicates that most of the fungal
biomass was in the form of viable spores rather than mycelia, in the plant. This clearly
suggests that Vd1 has a dual lifestyle; spores were constantly being produced, which gave
rise to mycelia, which gives rise to spores. The hyphae sporulate and gave rise to another
round of spores, thereby, enhancing Vd1 virulence. In contrast, Dvd-E6 had a low
spore/mycelia ratio which indicated that this isolate is more mycelia and has fewer viable
spores in the plant, either when alone or in mixed infections. This observation supports

CHAPTER 3: Spore levels in mixed Verticillium infections of tomato
93
the indirect evidence noted by Chen and coworkers that Dvd-E6 might have mainly a
mycelia lifestyle (Chen et al., 2004). In the mixed infection interactions, in spite of the
drastic reduction in Vd1 spores, the spore/mycelium ratios remain fairly constant,
suggesting that both spores and mycelia were equally affected. It therefore, follows that
the presence of Dvd-E6 in CS plants inhibits both mycelial growth and sporulation of
Vd1 or it could be that spores, mycelia, or both were lysed.
In summary, when present alone in the plant, Vd1 was characterized by the
production of numerous spores, while Dvd-E6 produced less. In the endophyte-protected
plants, there was significant reduction of Vd1 spores and mycelia, suggesting that both
were affected by a limiting mechanism. In line with the results obtained in Chapter 2, it
was hypothesized that the endophytic Dvd-E6 induces Vd1 resistance in tomato by
altering the gene expression of tomato in a manner that selectively inhibits Vd1
sporulation and mycelial growth or destroys Vd1 spores or/and mycelia, thereby,
restricting colonization of the virulent isolate. The actual genes and the nature of the
molecules that may be involved will be further examined in the next chapter.
.

CHAPTER 4: Defense gene responses in mixed Verticillium infections of tomato
94
CHAPTER 4: Defence Gene Responses in Mixed Infections with V.
dahliae race 1 and Dvd-E6 Isolates
4.1 Introduction
This chapter investigates further the genetic changes suggested in the preceding
chapters. In Chapter 2, it was shown that infection of Craigella tomatoes by an
endophytic isolate of V. dahliae, Dvd-E6 can restrict colonization by a virulent isolate of
V. dahliae, Vd1, severely, regardless of the order of infection. The data also suggested
the endophyte-induced protection requires a genetic interplay between Dvd-E6 and the
plant. The results presented in Chapter 3 further suggested that the amount of Vd1 spores
and mycelia was substantially reduced in mixed infections with Dvd-E6. Therefore, it
seems reasonable that Dvd-E6 could be inducing PR proteins in the host which restrict
Vd1 growth selectively.
Several reports have shown that colonization by endophytic bacteria can result in
induced systemic resistance (ISR). For examples, studies have shown Pseudomonas
aeruginosa 7NSK2 induces resistance in bean through ISR against gray mould (De
Meyer and Hofte, 1997). Similarly, P. fluorescens WCS417 mediates protection of
carnation against Fusarium wilt (Van Peer et al., 1991) and induces anthracnose
resistance in cucumber (Wei et al., 1991) through this mechanism. Colonization by some
endophytic bacteria also promotes production of phytoalexin (Harman et al., 2004),
accumulation of pathogenesis-related proteins (Park and Kloepper, 2000), and/or
deposition of structural barriers (Benhamou et al., 1996) contributing to resistance against
fungal infection. Several studies also have shown that endophytes that colonize plant
vascular systems do induce PR proteins (Van Loon, 2006) associated with systemic
acquired resistance (SAR) and systemic induced resistance (SIR) responses in plants

CHAPTER 4: Defense gene responses in mixed Verticillium infections of tomato
95
(Tjamos et al., 2005). The studies in this chapter represent a search for genetic changes
that could have these effects.
A customized Tomato-Verticillium Response (TVR) microarray chip (Robb et al.,
2009) was used to further examine the tomato’s regulatory responses in susceptible,
tolerant and mixed infection reactions, and to identify changes which may lead to
tolerance or endophyte induced protection. The TVR chip offers several important
advantages over the commercial TOM1 array (see section 1.5.2). The results in this
chapter indicate that CS responds to the presence of either one or both isolates when
present together, with differential expression of genes, some of which might be involved
in cross protection.
4.2 Materials and methods
4.2.1 Pathogens and plants
Vd1 and Dvd-E6 isolates that were used for these experiments were described in
section 2.2.1. The plant varieties used for these experiments were two near-isolines of
tomato, Craigella susceptible (CS; as described in section 2.2.2) and Craigella resistant
(CR), which has the Ve1 allele that confers resistance to Vd1.
4.2.2 Plant infection and symptom expression scoring
Plants for this experiment were inoculated either with Vd1, Dvd-E6 or both by root
dipping in conidial suspension as described in section 2.2.3. Symptom expression ratings
(i.e. disease scores) were scored relative to uninfected wounded control plants at 5 and 10
dpi using a 0 to 5 scale as described in section 2.2.3.

CHAPTER 4: Defense gene responses in mixed Verticillium infections of tomato
96
4.2.3 Quantification of fungal DNA in infected plant tissues
Samples for fungal DNA analysis were prepared from the top two-thirds of each
stem after the leaves and petioles were removed. Stem tissues were pooled (i.e. 3 stems /
pool), chopped and divided into two subsamples; freeze-dried and fresh, prior to nucleic
acid extraction. Nucleic acid was prepared from the various stem samples by extraction
using the sodium dodecyl sulfate (SDS)-phenol method, as described in section 2.2.5.
The total and relative amounts of fungal DNA were determined as described in section
2.2.6.
4.2.4 Microarray analyses
Whole cell nucleic acid extraction: Total cellular RNA was prepared from pooled stem
tissue from plants of the various interactions involving CS or CR with either Vd1, Dvd-
E6 or both as well as from the control plants at 5 and 10 dpi using the SDS/phenol
extraction method as described in section 2.2.4. The nucleic acid was fractionated on 1.5
% agarose gels, stained with methylene blue for 5 min and destained with distilled water
overnight. Images of the gels were captured under UV light as described in section 2.2.5.
The ratio of the 28S and 18S ribosomal RNA was used to determine RNA quality.
First-strand cDNA synthesis: Much of the technical work in this section for cDNA
synthesis, labeling, hybridization and slide scanning were conducted by Mrs. Jing Zhang
of the Genomics Facility, Department of Molecular and Cellular Biology, University of
Guelph. The quality of the cellular RNA extracted above was confirmed using the
Agilent Bioanalyzer 2100 (Agilent Technologies, Santa Clara, CA, USA). First-strand
cDNA was synthesized using Invitrogen kits following the manufacturer’s instructions.
Approximately 20 μg of total cellular RNA with 2 μl anchored oligo (dT)20 primer at a

CHAPTER 4: Defense gene responses in mixed Verticillium infections of tomato
97
concentration of 2.5 μg/ul, were mixed in a final volume of 18 μl DEPC-treated water in
a 1.5-ml RNase-free tube. The mixture was incubated at 70 oC for 5 min and then cooled
on ice for at least 1 min. For the reverse transcriptase reaction, a master mix (12 μl)
containing 6 μl of 5X first strand buffer, 1.5 μl of 0.1 M DTT, 1.5 μl of dNTP mix
(including amino-modified nucleotides), 1 μl of RNaseOUT (40 U/ μl) and SuperScript
III RT (400 U/ μl) was prepared and mixed with the denatured RNA-oligo (dT)20 mixture
to make a final volume of 30 μl. Each RT reaction was incubated at 37 oC for 1 hr. After
the incubation, 15 μl of 1N NaOH were added to each reaction and incubated at 70 oC for
10 min to terminate the RT reaction and hydrolyze the original RNA template. An aliquot
of 15 μl of 1N HCl was used to neutralize the pH. The first-strand cDNA was purified
using the SuperScript Purification System-L1014-04 (Invitrogen), following the
manufacturer’s instructions.
TVR microarray chip preparation: Microarray hybridizations were performed using a
customized TVR microarray chip (Robb et al., 2009) by the Genomics facility at the
University of Guelph. The chip represents approximately 270 tomato unique genes
involved in defense and resistance responses to Vd1. The slides were rehydrated by
facing them down over a 50 oC water bath for 10 min and then dried at 65
oC on a heating
block for 5 min. They were allowed to cool and this step was repeated 3 more times
before they were UV cross-linked, two times at 200 mJ. The slides were then washed in 1
% SDS by dipping them 10 times in sterile double-distilled water and immediately
transferred to 100 % ethanol, dipping them 5 times and then incubating them for 3 min
with shaking. The slides were finally dried by centrifugation at 200 g for 2-4 min. They
CHAPTER 4: Defense gene responses in mixed Verticillium infections of tomato
98
were stored in a light-proof box at room temperature with low humidity until use (Childs
et al., 2003).
Target cDNA labeling, microarray hybridization and data acquisition: The
Invitrogen SuperScript Plus Indirect cDNA Labeling system was used to fluorescently
label the target cDNA following the manufacturer’s instructions. To a vial of Alexa Fluor
Reactive Dye from Molecular Probes Inc. (Eugene, OR, USA), 2 μl of DMSO was added
directly to resuspend the dye with rigorous vortexing and a brief spinning to collect the
contents. For the fluorescent coupling reaction, 5 μl of 2X coupling buffer and the
DMSO/dye solution were added to the first-strand cDNA. The mixture was incubated at
room temperature in the dark for 2 hours. The Alexa Fluor 555 dye (pink color) and
Alexa Fluor 647 dye (blue color) provide the green and red signals, respectively, when
scanned. The fluorescently labeled cDNA was purified using the SuperScript Purification
System-L1014-04 (Invitrogen), following the manufacturer’s instructions. The
concentration of the labeled cDNA and dye incorporation were measured using the
NanoDrop ND-1000 spectrophotometer (Thermo Scientific, Waltham, MA, USA). Both
the labeled cDNAs (infected and control cDNAs) were combined for the hybridization
reaction.
For microarray hybridization, a mix containing 5 μl yeast tRNA at a concentration
of 10 mg/ml (Invitrogen), 5 μl calf thymus DNA at a concentration of 10 mg/ml (Sigma
Aldrich, ON, Canada) and 100 μl DIG Easy Hyb buffer (Roche, Canada) was prepared
and 60 μl were added to 10 μl of the fluorescently labeled probe. A total of 70 μl of this
mixture was incubated at 65 oC for 5 min and cooled on ice before being applied to pre-
warmed slides. A cover slip was placed on top of the slide to provide even distribution of
CHAPTER 4: Defense gene responses in mixed Verticillium infections of tomato
99
the hybridization solution and reduced evaporation. The slides were placed in a prepared
hybridization cassette, which was locked, wrapped with tape and incubated overnight at
42 oC in a hybridizer 600 chamber (Stratagene, La Jolla, CA, USA). After the overnight
hybridization, the cover slip was removed in 1X SSC at room temperature and slides
were washed three times as follows: the slides were quickly transferred to 150 ml pre-
warmed wash solution (1X SSC, 0.1 % SDS, 0.1 mMDTT added before use), incubated
at 50 oC for 10 min with occasional shaking and then transferred to another wash
solution. This step was repeated 2 more times. The slides were then rinsed in ultra-pure
1X SSC at room temperature by plunging 10-20 times. This step was repeated one more
time and then rinsed in 0.1X SSC at room temperature by plunging approximately 15
times. The slides were slowly removed from the solution and dried by centrifugation at
200 g for 6 min at room temperature.
The dry slides were then scanned using a GenePix scanner 4200A (Axon
Instruments, Inc., Foster City, CA, USA). The microarray data was processed by me
using GenePix Pro 4.0 software and analyses were performed using Gene Traffic (DUO)
v3.2 software (Iobion Informatics, La Jolla, CA, USA). Artifacts were flagged and the
data were normalized using actin as a global reference gene. Extracts from infected plants
were compared with unwounded uninfected controls. A candidate list of differentially
expressed genes was generated using the log2 (Alexa 555/Alexa 647) ratios and standard
deviations were calculated for 8 on-slide replicate arrays. A total of four biological
replicates were performed for each treatment.

CHAPTER 4: Defense gene responses in mixed Verticillium infections of tomato
100
4.2.5 Quantitative RT-PCR analyses
RT-PCR assays were performed using whole cell extracts from the various
interactions and the control plants as described in section 2.2.8. All RT-PCR assays were
normalized using the cellular levels of actin mRNA. The mRNA levels were calculated
relative to tomato actin mRNA and expressed as log2 ratios for comparisons with the
microarray data.
4.3 Results
4.3.1 Disease scores in V. dahliae infected CS tomatoes
To determine changes in the level of gene expression for tomato defense genes
which might be related to the endophyte-induced protection observed in previous
chapters, CS seedlings were infected to create five interactions: CS/Vd1, CS/Vd1//Dvd-
E6, CS/E6+Vd1, CS/E6//Vd1 and CS/E6 as described in section 2.2.3. Plants were scored
for symptom expression (i.e. disease score and plant height) at both 5 and 10 dpi as
described in section 2.2.3. Each experiment consisted of three plants per sampling time
for each of the pathological interactions and the controls. The experiment was replicated
four times.
The various interactions are illustrated in Figure 4-1 (upper panel) and the data for
plant height and symptom level at 5 (white bars) and 10 (dark grey bars) dpi are
represented in the left and right histograms, respectively, of the lower panel of Figure
4-1. With respect to plant height and symptom expression, the present results support the
data obtained in Chapters 2 and 3. As anticipated, Dvd-E6 infected plants were taller than
the uninoculated control plants, with reduced amounts of symptoms, with respect to
CS/Vd1 plants, which were stunted with high symptom score values of 3.2 and 3.5 at 5

CHAPTER 4: Defense gene responses in mixed Verticillium infections of tomato
101
and 10 dpi, respectively. The CS/Dvd-E6//Vd1 plants were as tall as the uninoculated
control plants with reduced symptom scores of 0.8 and 0.5 at 5 and 10 dpi, respectively;
hence showing the characteristics of endophyte induced protection.
Figure 4-1: Disease scores in Verticillium infected tomatoes.
CS tomatoes were inoculated with Vd1 or Dvd-E6 or both to establish the susceptible,
tolerant or mixed infection interactions, respectively. For the dual inoculations; (Dvd-
E6/Vd1), seedlings were inoculated with Dvd-E6 at the 3-leaf stage and Vd1 at the 4-leaf
stage, for the (Vd1/Dvd-E6), seedlings were inoculated with Vd1 at the 3-leaf stage and
Dvd-E6 at the 4-leaf stage, while for the (Dvd-E6+Vd1), seedlings were inoculated with
1:1 mixture (final concentration= 107 spores/ml) of Dvd-E6 and Vd1 conidia suspension
at the 4-leaf stage. Control plants were root dipped in gelatin solution alone. The picture
(upper panel) was taken at 10 dpi and shows the increased height of Dvd-E6- and Dvd-
E6/Vd1-infected plants relative to control. The histograms summarize the data obtained
for (lower left panel) plant height (cm + SD) and (lower right panel) symptom scores (0,
plant healthy, 5 plant dead + SD) at 5 (white bars) and 10 (dark grey bars) dpi. Values are
means of 12 plants.

CHAPTER 4: Defense gene responses in mixed Verticillium infections of tomato
102
4.3.2 Amount of fungal DNA in V. dahliae infected CS tomatoes
To determine the amount of Vd1 and Dvd-E6 in infected plants, total nucleic acid
was extracted from the freeze-dried pooled stems (i.e. 3 plants/pool) for each interaction;
the total amounts of fungal DNA as well as the relative amounts of specific fungal DNA
(Figure 4-2) for Vd1 (black bars) and Dvd-E6 (light grey bars) at 5 and 10 dpi were
determined. The results were consistent with those previously observed in Chapters 2 and
3. As shown in Figure 4-2, there were high amounts of V. dahliae in both the CS/Vd1 and
CS/Dvd-E6 interactions which were characteristic of susceptible and tolerant responses,
respectively. In the presence of Dvd-E6, however, there was a substantial reduction of
Vd1 DNA in the mixed infection interactions. For example, in the CS/Dvd-E6//Vd1
plants, the amount of Vd1 DNA in the stem was reduced from 13 ng/g plant tissue at 5
dpi to undetectable at 10 dpi, suggesting that infection by Dvd-E6 was able to restrict
Vd1 colonization of the stem with reduced levels of symptom expression.
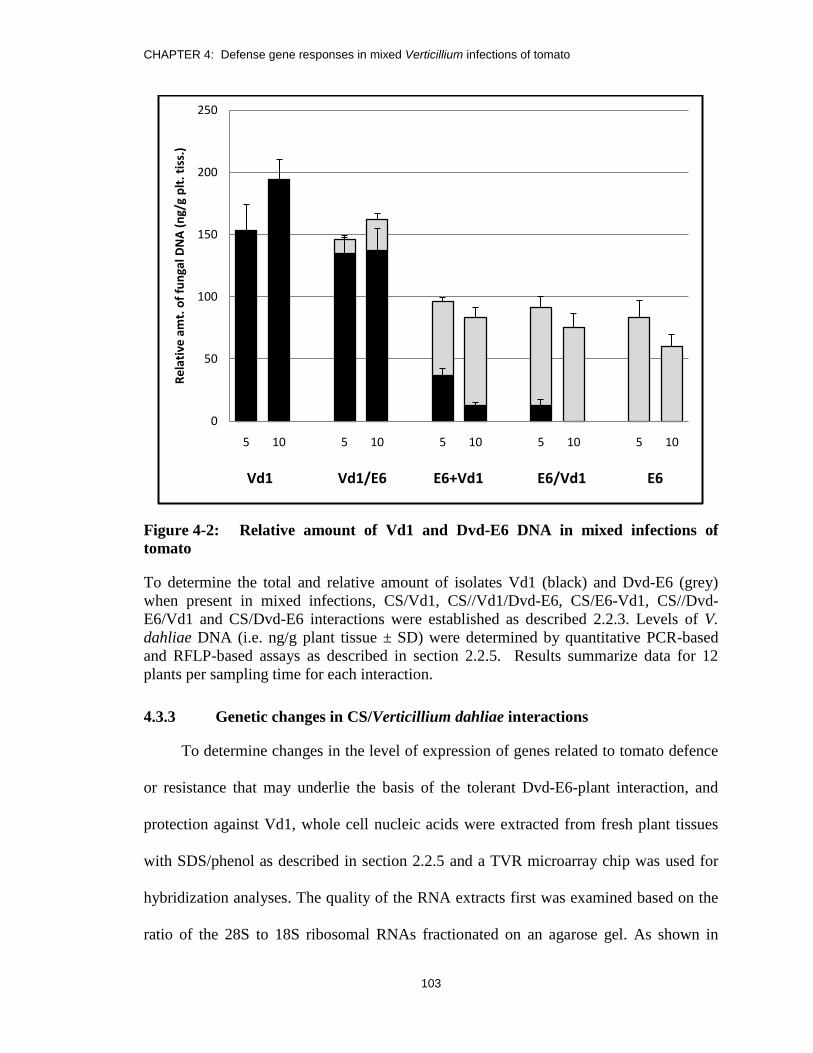
CHAPTER 4: Defense gene responses in mixed Verticillium infections of tomato
103
Figure 4-2: Relative amount of Vd1 and Dvd-E6 DNA in mixed infections of
tomato
To determine the total and relative amount of isolates Vd1 (black) and Dvd-E6 (grey)
when present in mixed infections, CS/Vd1, CS//Vd1/Dvd-E6, CS/E6-Vd1, CS//Dvd-
E6/Vd1 and CS/Dvd-E6 interactions were established as described 2.2.3. Levels of V.
dahliae DNA (i.e. ng/g plant tissue ± SD) were determined by quantitative PCR-based
and RFLP-based assays as described in section 2.2.5. Results summarize data for 12
plants per sampling time for each interaction.
4.3.3 Genetic changes in CS/Verticillium dahliae interactions
To determine changes in the level of expression of genes related to tomato defence
or resistance that may underlie the basis of the tolerant Dvd-E6-plant interaction, and
protection against Vd1, whole cell nucleic acids were extracted from fresh plant tissues
with SDS/phenol as described in section 2.2.5 and a TVR microarray chip was used for
hybridization analyses. The quality of the RNA extracts first was examined based on the
ratio of the 28S to 18S ribosomal RNAs fractionated on an agarose gel. As shown in
0
50
100
150
200
250
5 10 5 10 5 10 5 10 5 10
Re
lati
ve a
mt.
of
fun
gal D
NA
(n
g/g
plt
. tis
s.)
Vd1 Vd1/E6 E6+Vd1 E6/Vd1 E6
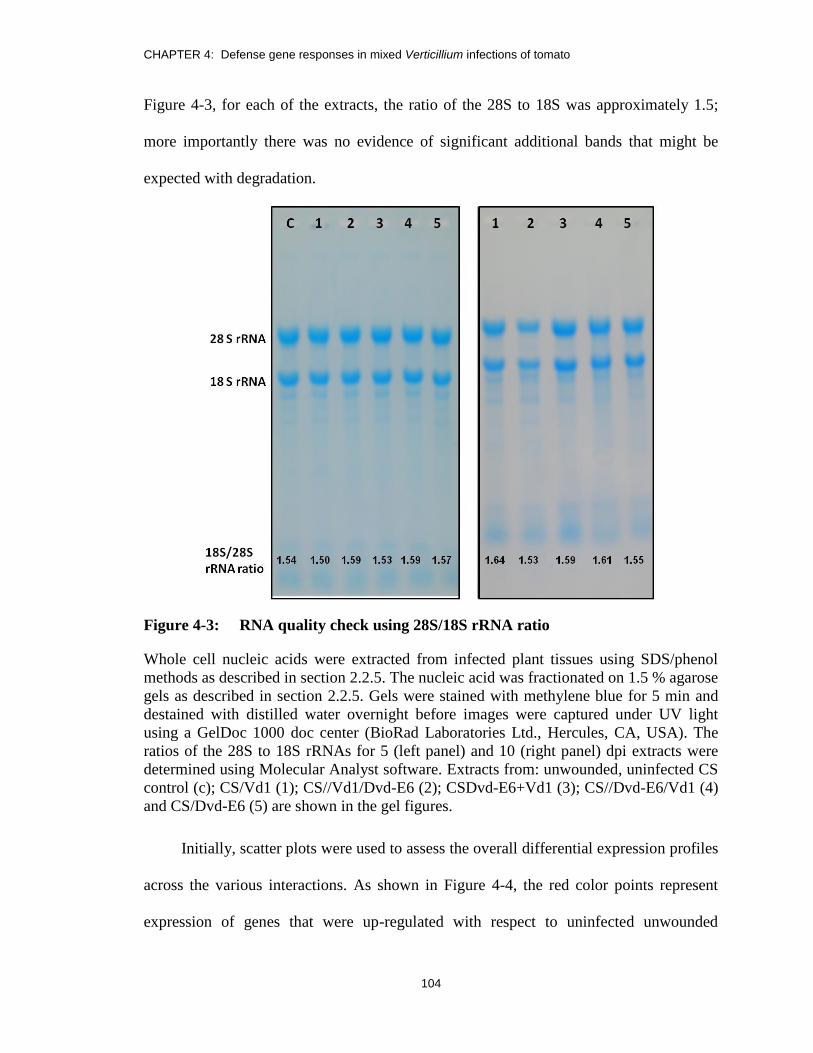
CHAPTER 4: Defense gene responses in mixed Verticillium infections of tomato
104
Figure 4-3, for each of the extracts, the ratio of the 28S to 18S was approximately 1.5;
more importantly there was no evidence of significant additional bands that might be
expected with degradation.
Figure 4-3: RNA quality check using 28S/18S rRNA ratio
Whole cell nucleic acids were extracted from infected plant tissues using SDS/phenol
methods as described in section 2.2.5. The nucleic acid was fractionated on 1.5 % agarose
gels as described in section 2.2.5. Gels were stained with methylene blue for 5 min and
destained with distilled water overnight before images were captured under UV light
using a GelDoc 1000 doc center (BioRad Laboratories Ltd., Hercules, CA, USA). The
ratios of the 28S to 18S rRNAs for 5 (left panel) and 10 (right panel) dpi extracts were
determined using Molecular Analyst software. Extracts from: unwounded, uninfected CS
control (c); CS/Vd1 (1); CS//Vd1/Dvd-E6 (2); CSDvd-E6+Vd1 (3); CS//Dvd-E6/Vd1 (4)
and CS/Dvd-E6 (5) are shown in the gel figures.
Initially, scatter plots were used to assess the overall differential expression profiles
across the various interactions. As shown in Figure 4-4, the red color points represent
expression of genes that were up-regulated with respect to uninfected unwounded
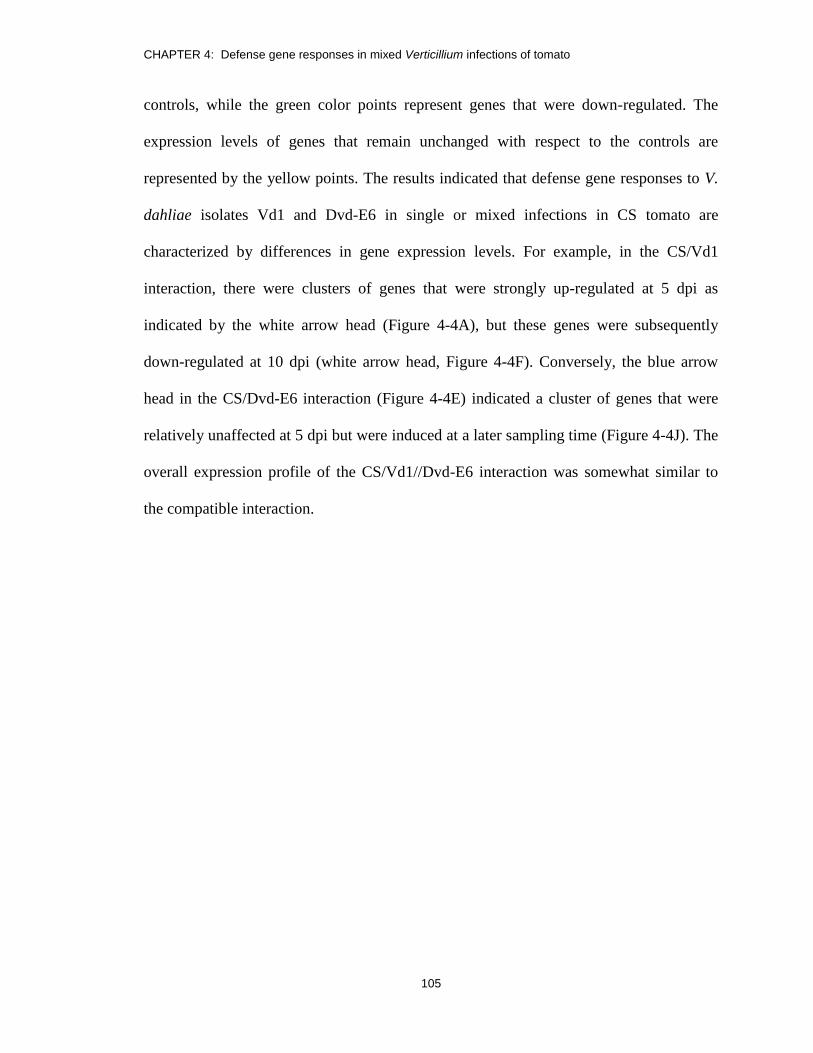
CHAPTER 4: Defense gene responses in mixed Verticillium infections of tomato
105
controls, while the green color points represent genes that were down-regulated. The
expression levels of genes that remain unchanged with respect to the controls are
represented by the yellow points. The results indicated that defense gene responses to V.
dahliae isolates Vd1 and Dvd-E6 in single or mixed infections in CS tomato are
characterized by differences in gene expression levels. For example, in the CS/Vd1
interaction, there were clusters of genes that were strongly up-regulated at 5 dpi as
indicated by the white arrow head (Figure 4-4A), but these genes were subsequently
down-regulated at 10 dpi (white arrow head, Figure 4-4F). Conversely, the blue arrow
head in the CS/Dvd-E6 interaction (Figure 4-4E) indicated a cluster of genes that were
relatively unaffected at 5 dpi but were induced at a later sampling time (Figure 4-4J). The
overall expression profile of the CS/Vd1//Dvd-E6 interaction was somewhat similar to
the compatible interaction.

CHAPTER 4: Defense gene responses in mixed Verticillium infections of tomato
106
Figure 4-4: Changes in mRNA levels in Verticillium-infected tomato.
A customized TVR chip was used for microarray hybridization of extracts shown in
Figure 4-3 as described in section 2.2.7. Images were captured using a GenePix 4000
microarray scanner and data were analyzed with GenePix Pro software. The overall
changes in mRNA levels in the various interactions as represented by log2 ratios after
being normalized with actin reference gene are summarized as scatter plots for 5 [(A)
CS/Vd1 (B) CS/Vd1//Dvd-E6 (C) CS/E6+Vd1 (D) CS/Dvd-E6//Vd1 (E) CS/Dvd-E6]
and 10 [(F) CS/Vd1 (G) CS/Vd1//Dvd-E6 (H) CS/E6+Vd1 (I) CS/Dvd-E6//Vd1 (J)
CS/Dvd-E6] dpi. White arrow heads: clusters of genes that were upregulated in A and
down-regulated in F in the CS/Vd1 interactions. Blue arrow heads: clusters of genes that
were upregulated in E and down-regulated in J in the CS/Dvd-E6 interactions.

CHAPTER 4: Defense gene responses in mixed Verticillium infections of tomato
107
To identify genes undergoing similar changes in the level of mRNA, microarray
data were imported into and further analyzed with Gene Traffic (DUO) v3.2 software
(Iobion Informatics, LaJolla, CA, USA) for hierarchical clustering. All genes were
normalized against the actin reference gene. Average values and standard deviations were
calculated from 8 replications with values from infected plants as compared with controls
expressed as log2 ratios. The cluster analysis presented on the left in Figure 4-5
summarizes the relationship for the mRNA levels of all the defence genes, with the
individual levels indicated by a color-coded matrix. The strong green fields representing
average log2 ratios of 2.0 to 5.8 indicate up-regulated genes, while the strong red fields
representing log2 ratios ranging from -2.0 to -4.8 signify significant down-regulation,
with respect to uninfected control plants. Grey to black shading indicates log2 ratios
between 2.0 and -2.0 representing slight or no changes in gene expression. The results
obtained with the cluster analyses showed that during the CS/Verticillium interactions,
many plant defence genes were up-regulated (green) but surprisingly, an even greater
number were down-regulated (red), with same demonstrating little change and a similar
portion displaying mixed changes consistent with genes that were differentially affected
by the exact nature of the Verticillium/plant interaction (mixed regulation).

CHAPTER 4: Defense gene responses in mixed Verticillium infections of tomato
108
Figure 4-5: Cluster analysis of defence gene mRNA levels in CS/Verticillium
interactions
Extracts from plants of various CS-Verticillium interactions were used for microarray
hybridization with a TVR chip. Microarray data were analyzed with Gene Traffic (DUO)
v3.2 software for hierarchical clustering of genes (rows) expressed in the various
interactions {columns: (1-1) CS/Vd1; (1-2) CS//Vd1/Dvd-E6; (1-3) CS/E6+Vd1; (1-4)
CS//Dvd-E6/Vd1; (1-5) CS/Dvd-E6; at 5 and (2-1) CS/Vd1; (2-2) CS//Vd1/Dvd-E6; (2-
3) CS/E6+Vd1; (2-4) CS//Dvd-E6/Vd1; (2-5) CS/Dvd-E6 at 10 dpi}.

CHAPTER 4: Defense gene responses in mixed Verticillium infections of tomato
109
4.3.4 Characteristics changes in defense gene responses
The cluster analyses indicated only the general direction of changes in gene
expression based on pairwise similarity between the genes; they did not examine changes
in the actual expression profiles for the various interactions. To examine possible
relationships among the various defence genes, expression profiles of individual plots
were constructed. Genes indicating at least one change with log2 ratios between -3 to +6
were selected and values below statistical accuracy (i.e. not attaining sigma 2 level) were
eliminated. The results for 160 genes were plotted on line graphs, with the log2 ratios on
the Y-axis and the various interactions identified on the X-axis at both 5 and 10 dpi
sampling times. Upon detailed examination, the expression profiles obtained could be
categorized into four major distinct groups, subsequently referred to as Group 1-4. Group
1 contained 62 genes that encode various PR proteins (PR2, PR23, P4, STH2), chitinases,
wound induced proteins, enzyme precursors, transcription factors, signaling molecules,
and several unknown proteins (Table 4-2). Group 2 contained 70 genes including
calmodulin, cytochrome P450, stress proteins, phytoene synthase, shock protein, some
PR-1 precursors, heat shock proteins and some unknown proteins (Table 4-3). Group 3 is
represented by 19 genes that encode products such as proteins for cellular scaffolding,
some signaling molecules, transferases and only one unknown protein (Table 4-4). Only
four genes are represented in group 4 (Table 4-5). In each group, four genes which are
known to be associated with the plant defense response are shown as example plots
(Figures 4-6 to 4-9). The characteristics of the various groups are discussed below.

CHAPTER 4: Defense gene responses in mixed Verticillium infections of tomato
110
Group 1 defense genes
The expression profile of this group was characterized by defense genes that were
strongly induced by Vd1 at 5 dpi, but showed suppression at 10 dpi. The mRNA levels
remained the same in the tolerant interaction at both sampling times and were lower than
the compatible interaction. For the mixed infections, Vd1 and Dvd-E6 apparently had an
antagonistic effect on the expression of most genes in this group. For example, at 5 dpi,
the beta carotene hydroxylase gene was induced as more Vd1 was present in the
interactions, correlating with a higher symptom score (Table 4-1). At 10 dpi, Vd1 gene
suppression was prevented as more Dvd-E6 was present, which also correlates with a
lower symptom score. The expression of genes in CS/Vd1 and CS//Vd1/Dvd-E6 plants
was similar; induction followed by suppression. It is characteristically interesting also
that expression of genes for the CS/Dvd-E6+Vd1 interaction always remained with little
difference between 5 and 10 dpi. Four example plots for the genes encoding; Beta-
carotene hydroxylase, class IV chitinase, a 1,3-beta-glucanase and an unknown protein
were used to illustrate the characteristics of this group (Figure 4-6). All four genes
display similar characteristic features of this group. Other defense genes in this group and
the actual log2 ratios for all the interactions are listed in Table 4-2.

CHAPTER 4: Defense gene responses in mixed Verticillium infections of tomato
111
Table 4-1: Antagonistic effect of Vd1 and Dvd-E6 isolates on beta carotene
hydroxylase gene expression.
CS seedlings were inoculated with Vd1 or Dvd-E6 to create single interactions or with
both pathogens to create mixed interactions. Disease symptoms were determined at both
5 and 10 dpi sampling times. Nucleic acid extract was made and mRNA was compared
by microarray analyses. Data were analyzed using GenePix Pro software and expressed
as Log2 ratios. The table summarizes the antagonistic effect of Vd1 and Dvd-E6 on the
mRNA levels of beta-carotene hydroxylase gene.

CHAPTER 4: Defense gene responses in mixed Verticillium infections of tomato
112
Figure 4-6: Group 1 defense gene response profiles in Verticillium infected tomato.
CS seedlings were infected with Vd1, Dvd-E6 or both to establish CS/Vd1,
CS//Vd1/Dvd-E6, CSE6+Vd1, CS//Dvd-E6/Vd1 and CS/Dvd-E6 interactions as
described in section 2.2.3. Whole cell nucleic acid was extracted from the plants at 5 and
10 dpi and used for microarray hybridization with TVR chips as described in section
2.2.7. Cluster analysis indicates four distinct gene profiles as shown in Figure 4-5. Log2
ratios of representative Group 1 defense genes were plotted against the various
interactions for 5 (white bars) and 10 (grey bars) dpi.

CHAPTER 4: Defense gene responses in mixed Verticillium infections of tomato
113
Table 4-2: List of Group 1 defense genes in CS tomato
5' Sequence1
NP24 (PR 23), salt tolerance 1.41 -0.97 0.19 -0.94 -1.62 -1.53 -2.21 -0.51 0.01 -1.75
CTV.15 4.09 2.51 1.86 1.12 1.25 0.32 1.19 2.87 3.65 -0.91
endochitinase 3 precursor 4.70 5.40 3.60 0.97 1.26 1.93 2.12 4.59 4.44 2.31
divinylether synthase 3.70 0.91 1.25 1.00 0.48 -0.06 0.08 2.37 3.56 -0.44
PR-protein STH2 5.60 3.55 7.48 2.99 2.42 2.65 3.73 6.32 6.34 3.70
class IV chitinase 4.27 1.14 1.84 1.34 0.07 -0.21 -0.09 2.28 2.60 0.30
late embryogenesis protein 5.04 3.95 1.96 0.69 -1.13 -0.91 -0.36 3.43 2.30 -1.17
mitogen-activated protein kinase NTF 3 4.71 4.02 3.78 1.48 0.97 1.14 1.75 3.78 4.26 0.75
ser/threonine protein kinase 3.11 2.32 2.14 0.20 -0.14 -0.53 -0.07 2.27 2.34 -0.08
serine acetyltransferase 4 3.44 1.17 1.50 0.91 1.41 0.92 0.88 2.17 2.54 1.28
wound induced protein 4.23 0.71 3.41 0.87 0.08 0.99 0.74 1.53 3.35 0.57
1,3 beta-glucanase basic 4.54 3.91 5.13 1.91 1.39 2.85 2.16 5.60 5.98 1.50
glycine rich protein, 16K 3.98 0.88 3.22 1.25 0.73 2.31 1.66 3.29 4.56 2.43
cytochrome c 3.12 -1.63 1.35 0.99 0.12 0.04 -0.14 1.34 2.02 -0.18
bZIP Transcription Factor 2.85 -1.48 0.31 0.48 -0.33 -0.77 -0.01 0.61 1.68 0.27
small nuclear ribonucleoprotein 1.50 -0.47 0.53 -0.82 -1.05 -0.82 -1.88 -0.19 0.70 -1.75
late embrogenesis protein homologue 4.79 2.47 1.60 0.19 -0.51 -1.00 -0.48 2.83 2.05 -1.13
RelA-SpoT-like protein RSH 4.48 3.91 1.36 0.69 -0.64 0.04 -0.95 2.11 1.97 -1.37
beta-carotene hydroxylase 3.33 2.42 1.18 0.43 -0.56 -0.21 -0.78 1.77 1.92 -0.97
MFL8.1/MFL8.1 0.57 -1.54 -1.92 -0.69 -1.39 -1.22 -2.32 -1.38 -2.13 -1.94
acyltransferase 1.16 0.85 0.72 -0.94 -1.23 -1.14 -2.26 -0.44 -0.17 -2.18
ACC oxidase, ethylene biosynthesis 3.07 -0.57 1.20 0.16 0.06 -0.49 -0.60 2.05 1.42 -0.69
F-box protein 0.94 -0.10 -0.05 -1.17 -1.45 -1.28 -2.38 -0.70 -0.25 -2.42
SA carboxymethyltransferase 5.96 5.81 5.80 2.57 1.72 3.01 2.94 4.78 6.20 1.21
TSI-1 protein 5.12 4.09 5.27 2.57 1.93 2.41 2.64 5.05 5.71 2.14
CBL interacting protein kinase 1 2.02 0.99 1.19 0.52 -0.53 0.69 -0.75 1.40 1.84 0.20
Avr/Cf9 rapidly elicited protein 2.71 -1.19 0.11 -0.41 1.05 0.58 -0.56 0.29 1.46 -0.20
PR protein 2 2.77 1.39 1.18 0.50 -0.63 -0.81 -1.51 2.75 2.29 -1.41
wound induced protein 4.25 3.01 3.14 1.60 0.26 0.94 0.85 3.54 3.06 0.86
PR leaf protein 4 (P4) 5.95 4.75 4.46 2.39 2.08 2.21 3.51 5.56 7.35 3.02
oxygen evolving complex 25.6kD protein 4.89 5.13 5.72 1.89 1.31 1.31 1.66 5.07 4.53 1.27
MA3 domain protein 5.87 5.91 6.31 2.21 1.97 2.74 3.43 6.41 6.02 2.44
acidic 26kD endochitiinase precursor 5.24 5.70 5.30 2.30 1.38 1.56 2.52 4.81 5.12 1.55
unknown protein 4.31 2.22 2.93 1.01 0.13 0.86 1.31 2.59 3.63 0.75
unknown protein 2.89 1.67 2.58 0.33 0.64 0.27 0.74 2.58 3.05 0.45
10E+V10VE10V5E5EV5E+V5VE5V 10E10EV
Average log2 Ratio

CHAPTER 4: Defense gene responses in mixed Verticillium infections of tomato
114
List of Group 1 defense genes in CS tomato (continues)
5' Sequence1
no sequence 3.80 3.67 3.42 0.08 0.15 -0.29 1.06 3.34 3.49 0.40
no sequence 3.13 -0.37 1.29 0.72 1.54 -0.08 -0.02 1.08 1.81 0.32
unknown protein 5.40 5.17 2.21 0.77 -0.81 -0.43 -0.28 3.90 2.98 -0.97
no sequence 5.36 5.21 3.12 2.64 0.12 -0.23 -0.41 4.01 3.01 -1.09
unknown protein 3.38 2.16 1.88 -0.23 -0.39 -0.68 -0.72 2.43 1.30 -0.64
no sequence 4.56 2.61 3.17 1.82 1.12 2.23 1.56 5.73 3.50 2.70
no sequence 4.06 0.84 3.58 1.45 1.03 2.48 0.39 3.33 5.10 2.21
unknown protein 1.30 -0.75 0.73 -0.61 -1.17 -0.75 -1.55 -0.08 0.77 -1.71
unknown protein 0.51 -0.03 0.03 -1.07 -1.23 -0.06 -1.63 -0.21 0.66 -1.60
unknown protein 0.99 -1.07 0.06 -0.60 0.13 -0.70 -0.96 0.10 0.83 -1.28
unknown protein 1.56 -1.29 0.12 -0.28 -0.86 -1.42 -0.83 -0.30 0.63 -1.07
unknown protein 5.47 3.66 3.03 0.38 -0.50 -0.71 -0.50 2.82 2.39 -1.31
unknown protein 3.84 3.35 2.97 1.16 -0.05 0.62 -0.36 3.25 2.52 -0.06
no sequence 2.34 -0.82 1.75 0.17 -0.22 0.72 -0.59 0.83 1.10 -0.40
unknown potein 0.75 -0.36 0.30 -0.99 -1.09 -1.18 -1.81 -0.12 0.28 -2.06
no sequence 2.63 1.37 0.70 0.15 -0.72 0.50 -0.80 2.62 2.00 -1.26
no sequence 5.44 5.52 5.25 1.94 1.18 2.47 2.16 3.57 5.33 0.75
no sequence 6.07 3.95 5.11 2.66 1.74 2.68 3.24 5.46 5.94 2.78
no sequence 5.77 5.05 5.56 2.00 1.77 2.72 3.12 5.94 5.56 2.12
no sequence 5.38 5.43 6.26 1.84 1.79 1.45 3.00 5.85 5.52 1.93
no sequence 0.25 -0.48 0.15 -1.25 -1.72 -0.11 -1.84 -0.30 -0.34 -1.53
no sequence 1.04 0.13 0.54 -0.67 -0.98 -0.53 -1.49 0.38 0.26 -1.44
no sequence 0.98 -1.72 -0.56 -1.14 -1.60 -2.02 -2.58 -0.67 0.02 -2.33
no sequence 1.50 -0.97 -0.21 -0.62 -1.04 -1.25 -1.05 0.49 1.71 -1.64
no sequence 4.13 0.81 2.25 1.02 1.99 0.52 0.83 2.74 3.54 0.39
no sequence 2.73 -0.62 -0.04 -0.55 -1.32 -1.72 -2.02 0.49 1.56 -1.96
no sequence 2.01 -1.39 -0.90 -0.85 -1.55 -2.30 -2.43 -0.11 0.94 -2.46
Average log2 Ratio
5V 5VE 5E+V 5EV 5E 10V 10VE 10E+V 10EV 10E
Nucleic acid extracts were prepared from tomatoes infected with Vd1, Dvd-E6 or both, as
well as unwounded uninfected CS controls. The levels of mRNA from infected vs control
extracts were compared by microarray analyses as described in section 4.2.4. Data were
analyzed using GenePix Pro software and expressed as Log2 ratios. The table summarizes
Group 1 defense gene average ratios of infected vs control for the interactions: (5V)
CS/Vd1; (5VE) CS//Vd1/Dvd-E6; (5E+V) CS/Dvd-E6+Vd1, (5EV) CS//Dvd-E6/Vd1;
(5E) CS/Dvd-E6 at 5 and (10V) CS/Vd1; (10VE) CS//Vd1/Dvd-E6; (10E+V) CS/Dvd-
E6+Vd1, (10EV) CS//Dvd-E6/Vd1; (10E) CS/Dvd-E6) 10 dpi. The standard deviations
of the log2 ratios are included in Appendix IV. 1
Protein encoded by defense gene.

CHAPTER 4: Defense gene responses in mixed Verticillium infections of tomato
115
Group 2 defense genes
This is the largest group among the defence gene category. The expression profiles
indicate genes that also are induced by Vd1 at 5 dpi and suppressed at 10 dpi relative to
unwounded controls. There was also suppression in the tolerant interaction relative to the
unwounded controls and there was no significant difference in mRNA levels at both
sampling times. At 10 dpi, there was suppression for the CS//Vd1/Dvd-E6 interaction
also. The major difference between Groups 1 and 2 genes was that, for the mixed
infection (CSE6+Vd1 and CS/Dvd-E6/Vd1) interactions, there was little or no significant
difference in mRNA levels at both 5 and 10 dpi. Also in this group, Dvd-E6 prevents
Vd1-induced gene suppression. Figure 4-7 shows sample plots for genes encoding: an
unknown protein, calmodulin, peroxidase and phytoene synthase 1. All four genes
displayed similar characteristic profiles. One other interesting characteristic of this group
is the similarity between the gene expression and symptom score profiles at 5 dpi, as
shown in Figure 4-8. For example, as the expression of the unknown protein was being
down-regulated from CS/Vd1 to the CS/Dvd-E6 interactions, the level of symptoms also
was reduced. Table 4-3 lists all the genes and actual log2 ratios for all the interactions in
this group.

CHAPTER 4: Defense gene responses in mixed Verticillium infections of tomato
116
Figure 4-7: Group 2 defense gene response profiles in Verticillium infected tomato.
CS seedlings were infected with Vd1, Dvd-E6 or both to establish CS/Vd1,
CS//Vd1/Dvd-E6, CSE6+Vd1, CS//Dvd-E6/Vd1 and CS/Dvd-E6 interactions as
described in section 2.2.3. Whole cell nucleic acid was extracted from the plants at 5 and
10 dpi and used for microarray hybridization with TVR chips as described in section
2.2.7. Cluster analysis indicates four distinct gene profiles as shown in Figure 4-5. Log2
ratios of representative Group 2 defense genes were plotted against the various
interactions for 5 (white bars) and 10 (grey bars) dpi.
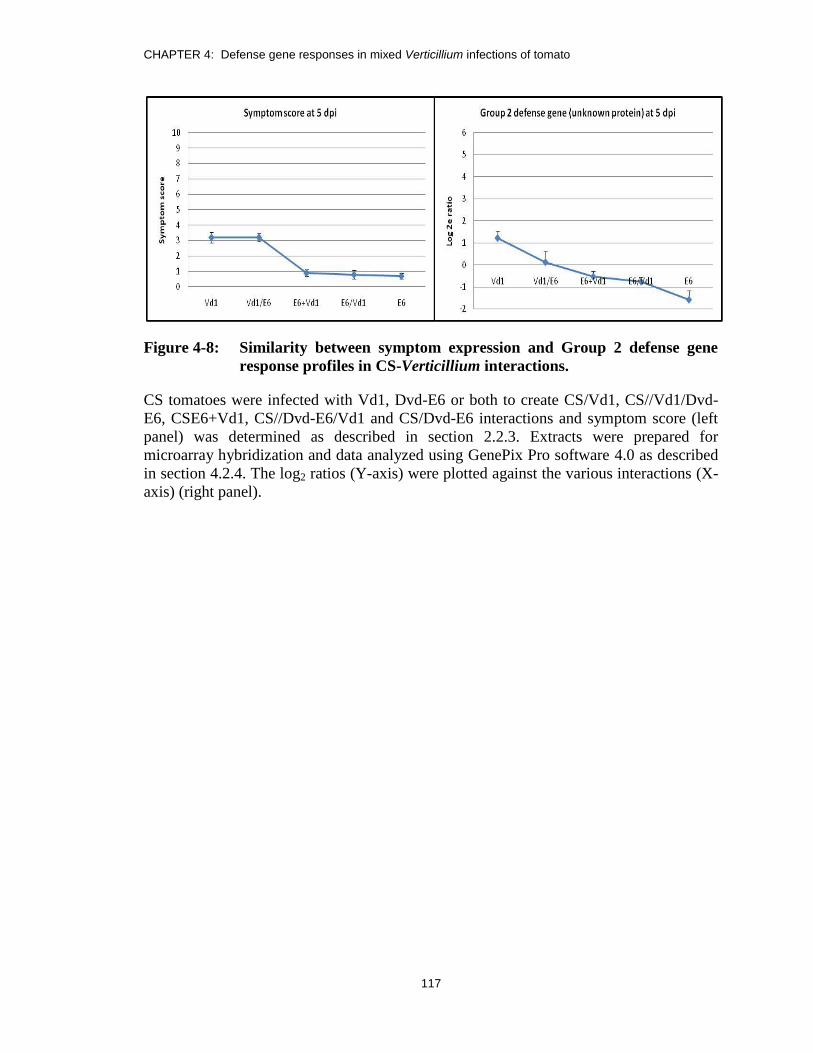
CHAPTER 4: Defense gene responses in mixed Verticillium infections of tomato
117
Figure 4-8: Similarity between symptom expression and Group 2 defense gene
response profiles in CS-Verticillium interactions.
CS tomatoes were infected with Vd1, Dvd-E6 or both to create CS/Vd1, CS//Vd1/Dvd-
E6, CSE6+Vd1, CS//Dvd-E6/Vd1 and CS/Dvd-E6 interactions and symptom score (left
panel) was determined as described in section 2.2.3. Extracts were prepared for
microarray hybridization and data analyzed using GenePix Pro software 4.0 as described
in section 4.2.4. The log2 ratios (Y-axis) were plotted against the various interactions (X-
axis) (right panel).
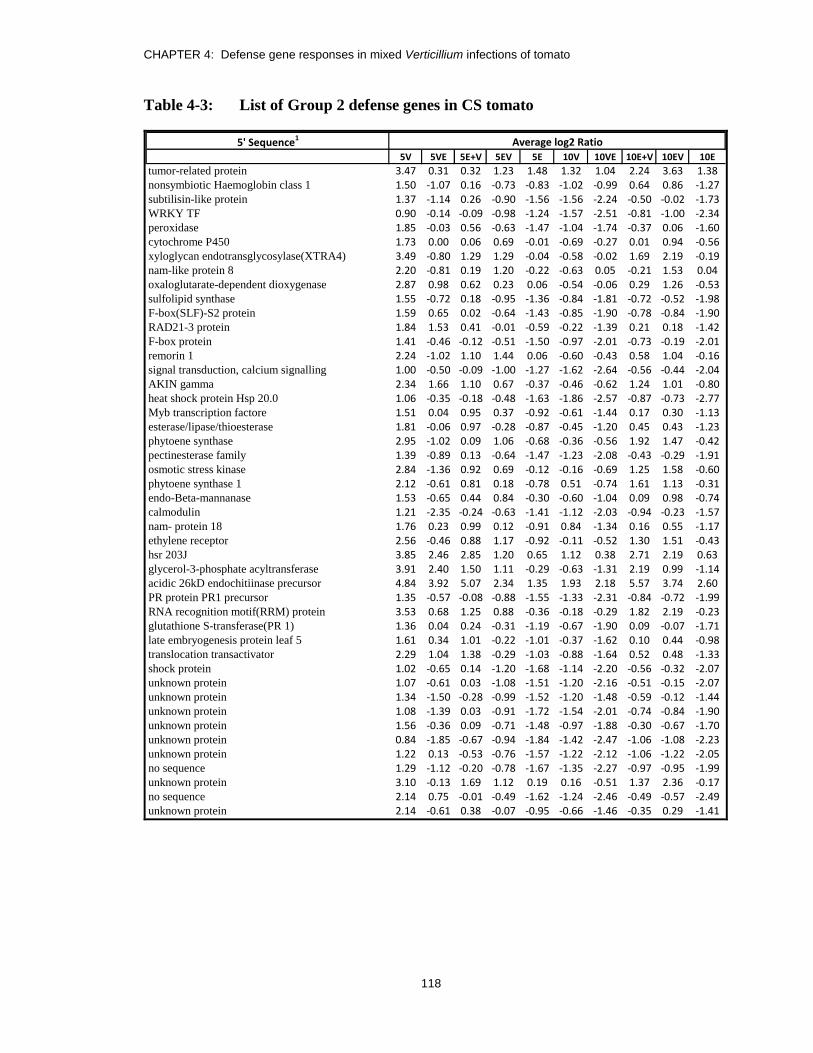
CHAPTER 4: Defense gene responses in mixed Verticillium infections of tomato
118
Table 4-3: List of Group 2 defense genes in CS tomato
5' Sequence1
tumor-related protein 3.47 0.31 0.32 1.23 1.48 1.32 1.04 2.24 3.63 1.38nonsymbiotic Haemoglobin class 1 1.50 -1.07 0.16 -0.73 -0.83 -1.02 -0.99 0.64 0.86 -1.27subtilisin-like protein 1.37 -1.14 0.26 -0.90 -1.56 -1.56 -2.24 -0.50 -0.02 -1.73WRKY TF 0.90 -0.14 -0.09 -0.98 -1.24 -1.57 -2.51 -0.81 -1.00 -2.34peroxidase 1.85 -0.03 0.56 -0.63 -1.47 -1.04 -1.74 -0.37 0.06 -1.60cytochrome P450 1.73 0.00 0.06 0.69 -0.01 -0.69 -0.27 0.01 0.94 -0.56xyloglycan endotransglycosylase(XTRA4) 3.49 -0.80 1.29 1.29 -0.04 -0.58 -0.02 1.69 2.19 -0.19nam-like protein 8 2.20 -0.81 0.19 1.20 -0.22 -0.63 0.05 -0.21 1.53 0.04oxaloglutarate-dependent dioxygenase 2.87 0.98 0.62 0.23 0.06 -0.54 -0.06 0.29 1.26 -0.53sulfolipid synthase 1.55 -0.72 0.18 -0.95 -1.36 -0.84 -1.81 -0.72 -0.52 -1.98F-box(SLF)-S2 protein 1.59 0.65 0.02 -0.64 -1.43 -0.85 -1.90 -0.78 -0.84 -1.90RAD21-3 protein 1.84 1.53 0.41 -0.01 -0.59 -0.22 -1.39 0.21 0.18 -1.42F-box protein 1.41 -0.46 -0.12 -0.51 -1.50 -0.97 -2.01 -0.73 -0.19 -2.01remorin 1 2.24 -1.02 1.10 1.44 0.06 -0.60 -0.43 0.58 1.04 -0.16signal transduction, calcium signalling 1.00 -0.50 -0.09 -1.00 -1.27 -1.62 -2.64 -0.56 -0.44 -2.04AKIN gamma 2.34 1.66 1.10 0.67 -0.37 -0.46 -0.62 1.24 1.01 -0.80heat shock protein Hsp 20.0 1.06 -0.35 -0.18 -0.48 -1.63 -1.86 -2.57 -0.87 -0.73 -2.77Myb transcription factore 1.51 0.04 0.95 0.37 -0.92 -0.61 -1.44 0.17 0.30 -1.13esterase/lipase/thioesterase 1.81 -0.06 0.97 -0.28 -0.87 -0.45 -1.20 0.45 0.43 -1.23phytoene synthase 2.95 -1.02 0.09 1.06 -0.68 -0.36 -0.56 1.92 1.47 -0.42pectinesterase family 1.39 -0.89 0.13 -0.64 -1.47 -1.23 -2.08 -0.43 -0.29 -1.91osmotic stress kinase 2.84 -1.36 0.92 0.69 -0.12 -0.16 -0.69 1.25 1.58 -0.60phytoene synthase 1 2.12 -0.61 0.81 0.18 -0.78 0.51 -0.74 1.61 1.13 -0.31endo-Beta-mannanase 1.53 -0.65 0.44 0.84 -0.30 -0.60 -1.04 0.09 0.98 -0.74calmodulin 1.21 -2.35 -0.24 -0.63 -1.41 -1.12 -2.03 -0.94 -0.23 -1.57nam- protein 18 1.76 0.23 0.99 0.12 -0.91 0.84 -1.34 0.16 0.55 -1.17ethylene receptor 2.56 -0.46 0.88 1.17 -0.92 -0.11 -0.52 1.30 1.51 -0.43hsr 203J 3.85 2.46 2.85 1.20 0.65 1.12 0.38 2.71 2.19 0.63glycerol-3-phosphate acyltransferase 3.91 2.40 1.50 1.11 -0.29 -0.63 -1.31 2.19 0.99 -1.14acidic 26kD endochitiinase precursor 4.84 3.92 5.07 2.34 1.35 1.93 2.18 5.57 3.74 2.60PR protein PR1 precursor 1.35 -0.57 -0.08 -0.88 -1.55 -1.33 -2.31 -0.84 -0.72 -1.99RNA recognition motif(RRM) protein 3.53 0.68 1.25 0.88 -0.36 -0.18 -0.29 1.82 2.19 -0.23glutathione S-transferase(PR 1) 1.36 0.04 0.24 -0.31 -1.19 -0.67 -1.90 0.09 -0.07 -1.71late embryogenesis protein leaf 5 1.61 0.34 1.01 -0.22 -1.01 -0.37 -1.62 0.10 0.44 -0.98translocation transactivator 2.29 1.04 1.38 -0.29 -1.03 -0.88 -1.64 0.52 0.48 -1.33shock protein 1.02 -0.65 0.14 -1.20 -1.68 -1.14 -2.20 -0.56 -0.32 -2.07unknown protein 1.07 -0.61 0.03 -1.08 -1.51 -1.20 -2.16 -0.51 -0.15 -2.07unknown protein 1.34 -1.50 -0.28 -0.99 -1.52 -1.20 -1.48 -0.59 -0.12 -1.44unknown protein 1.08 -1.39 0.03 -0.91 -1.72 -1.54 -2.01 -0.74 -0.84 -1.90unknown protein 1.56 -0.36 0.09 -0.71 -1.48 -0.97 -1.88 -0.30 -0.67 -1.70unknown protein 0.84 -1.85 -0.67 -0.94 -1.84 -1.42 -2.47 -1.06 -1.08 -2.23unknown protein 1.22 0.13 -0.53 -0.76 -1.57 -1.22 -2.12 -1.06 -1.22 -2.05no sequence 1.29 -1.12 -0.20 -0.78 -1.67 -1.35 -2.27 -0.97 -0.95 -1.99unknown protein 3.10 -0.13 1.69 1.12 0.19 0.16 -0.51 1.37 2.36 -0.17no sequence 2.14 0.75 -0.01 -0.49 -1.62 -1.24 -2.46 -0.49 -0.57 -2.49unknown protein 2.14 -0.61 0.38 -0.07 -0.95 -0.66 -1.46 -0.35 0.29 -1.41
5VE 5E+V 5EV 5E 10V 10VE 10E+V 10EV 10E
Average log2 Ratio
5V

CHAPTER 4: Defense gene responses in mixed Verticillium infections of tomato
119
List of Group 2 defense genes in CS tomato (continues)
5' Sequence1
no sequence 1.81 0.30 0.72 -0.68 -0.95 -0.96 -2.09 0.00 -0.44 -1.70no sequence 1.88 -0.95 1.22 0.35 -0.08 0.02 -0.63 1.37 1.13 -0.58unknown protein 1.66 0.18 0.43 -0.63 -1.12 -1.05 -2.00 -0.41 -0.59 -1.74no sequence 2.56 -1.45 0.91 -0.05 -0.92 0.33 -0.94 0.25 0.88 -0.95no hits 1.77 -1.41 0.50 0.09 -0.79 -0.65 -0.50 0.16 0.89 -0.71unknown protein 1.59 -0.23 0.65 -0.71 -1.04 -0.67 -1.39 0.34 0.99 -1.43unknown protein 1.38 -1.07 0.09 -0.76 -1.39 -1.13 -1.95 -0.48 -0.27 -1.88unknown protein 3.04 -0.28 1.41 0.54 0.71 0.35 -0.45 1.39 1.33 -0.43no sequence 1.87 -1.50 0.89 0.30 -0.70 -0.06 -0.90 0.49 1.09 -0.58no sequence 2.04 -1.15 0.82 -0.06 -1.13 0.21 -0.54 0.99 1.04 -0.46unknown protein 1.66 0.07 0.09 -0.26 -1.29 -0.51 -1.63 -0.74 -0.13 -1.63no sequence 1.85 -0.91 0.06 -0.28 -0.91 -0.90 -1.61 -0.31 0.32 -1.64no sequence 3.44 -0.90 1.88 1.35 -0.21 0.68 -0.56 1.54 1.70 -0.42no sequence 1.69 -1.06 0.08 -0.55 -1.21 -1.06 -1.90 -0.35 0.01 -1.51no sequence 1.23 -0.44 0.12 -1.08 -1.50 -1.14 -2.02 -0.70 -0.55 -1.86unknown protein 4.02 0.23 2.55 2.00 0.42 0.66 0.24 2.86 2.46 0.57no sequence 2.06 -0.57 -0.14 0.33 -0.42 -0.33 -1.06 -0.21 1.02 -0.81no sequence 2.49 -0.36 1.27 1.46 -0.23 -0.23 0.25 2.03 2.44 0.26no sequence 1.98 -0.27 1.15 0.62 -0.43 0.13 -0.88 0.50 1.16 -0.34no sequence 4.03 0.49 1.21 1.99 1.65 0.76 0.71 1.30 2.32 0.03no sequence 3.48 -0.07 1.42 1.18 1.18 0.44 1.03 3.07 3.30 0.32no sequence 1.66 0.34 0.56 -0.87 -1.18 -0.96 -1.63 -0.18 -0.06 -1.45no sequence 2.10 -1.28 0.15 0.74 -0.09 -0.42 -0.54 0.60 1.57 -0.47no sequence 2.42 -1.18 0.26 1.08 0.31 -0.25 0.38 0.95 2.56 0.40
10E
Average log2 Ratio
5V 5VE 5E+V 5EV 5E 10V 10VE 10E+V 10EV
Nucleic acid extracts were prepared from tomatoes infected with Vd1, Dvd-E6 or both, as
well as unwounded uninfected CS controls. The levels of mRNA from infected vs control
extracts were compared by microarray analyses as described in section 4.2.4. Data were
analyzed using GenePix Pro software and expressed as Log2 ratios. The table summarizes
Group 2 defense gene average ratios of infected vs control for the interactions: (5V)
CS/Vd1; (5VE) CS//Vd1/Dvd-E6; (5E+V) CS/Dvd-E6+Vd1, (5EV) CS//Dvd-E6/Vd1;
(5E) CS/Dvd-E6 at 5 and (10V) CS/Vd1; (10VE) CS//Vd1/Dvd-E6; (10E+V) CS/Dvd-
E6+Vd1, (10EV) CS//Dvd-E6/Vd1; (10E) CS/Dvd-E6) 10 dpi. The standard deviations
of the log2 ratios are included in Appendix IV. 1
Protein encoded by defense gene.

CHAPTER 4: Defense gene responses in mixed Verticillium infections of tomato
120
Group 3 defense genes
This group is characterized by profiles that suggest expression of these genes
remained more-or-less constant at 5 and 10 dpi for all interactions. Four example plots
for genes encoding: cellulose membrane-anchored protein, jasmonic acid, cell structure
protein and a dehydration responsive element binding protein were shown in Figure 4-9.
One interesting feature of this group is the resemblance of the gene expression profiles to
total amounts of fungal DNA in the plant stem at both sampling times. For example, there
was induction of the gene encoding 14-3-3 protein by Vd1, which corresponds to high
amounts of Vd1 DNA, while on the other hand; suppression of these genes by Dvd-E6
also correlates with reduced amount of Dvd-E6 (Figure 4-10). List of genes and the
actual log2 ratios for all the interactions in this group is given in Table 4-4.

CHAPTER 4: Defense gene responses in mixed Verticillium infections of tomato
121
Figure 4-9: Group 3 defense gene response profiles in Verticillium infected tomato.
CS seedlings were infected with Vd1, Dvd-E6 or both to establish CS/Vd1,
CS//Vd1/Dvd-E6, CSE6+Vd1, CS//Dvd-E6/Vd1 and CS/Dvd-E6 interactions as
described in section 2.2.3. Whole cell nucleic acid was extracted from the plants at 5 and
10 dpi and used for microarray hybridization with TVR chips as described in section
2.2.7. Cluster analysis indicates four distinct gene profiles as shown in Figure 4-5. Log2
ratios of representative Group 3 defense genes were plotted against the various
interactions for 5 (white bars) and 10 (grey bars) dpi.
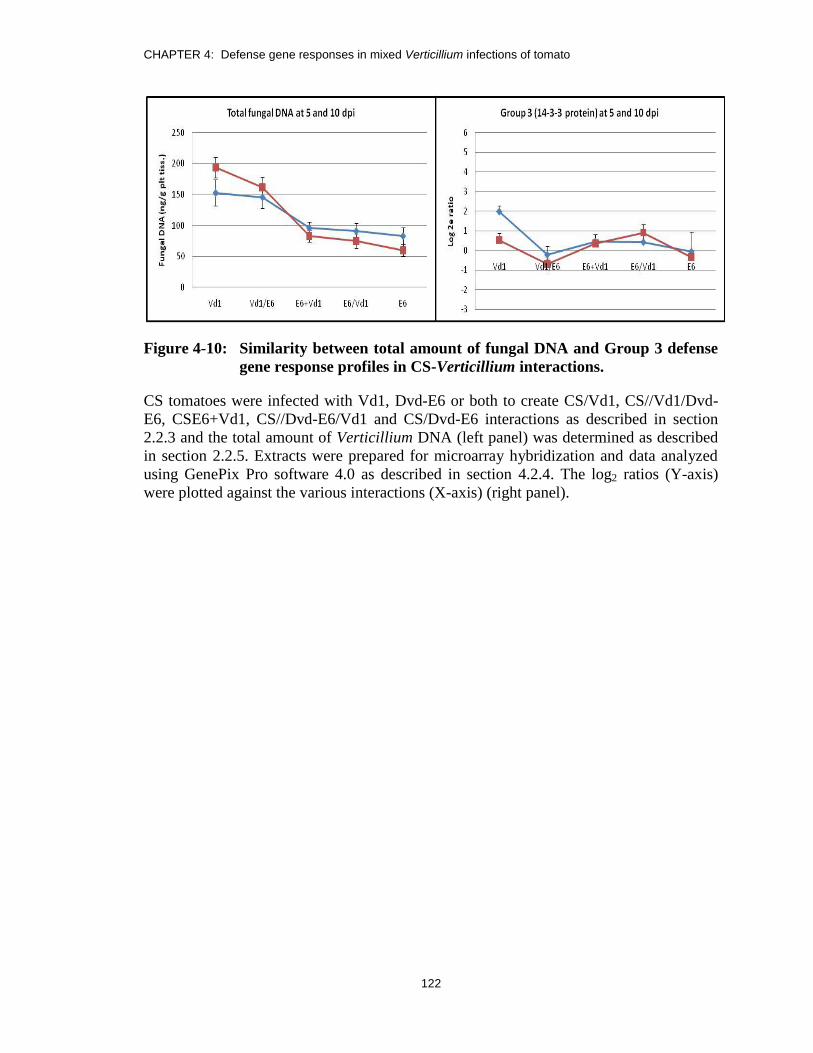
CHAPTER 4: Defense gene responses in mixed Verticillium infections of tomato
122
Figure 4-10: Similarity between total amount of fungal DNA and Group 3 defense
gene response profiles in CS-Verticillium interactions.
CS tomatoes were infected with Vd1, Dvd-E6 or both to create CS/Vd1, CS//Vd1/Dvd-
E6, CSE6+Vd1, CS//Dvd-E6/Vd1 and CS/Dvd-E6 interactions as described in section
2.2.3 and the total amount of Verticillium DNA (left panel) was determined as described
in section 2.2.5. Extracts were prepared for microarray hybridization and data analyzed
using GenePix Pro software 4.0 as described in section 4.2.4. The log2 ratios (Y-axis)
were plotted against the various interactions (X-axis) (right panel).

CHAPTER 4: Defense gene responses in mixed Verticillium infections of tomato
123
Table 4-4: List of Group 3 defense genes in CS tomato
5' Sequence1
expansin precursor -0.37 -2.70 -0.04 -0.57 -0.65 -0.24 -0.86 -0.32 -0.37 -0.66
WIZZ 1.63 -0.74 0.77 0.19 -0.19 1.05 -0.29 2.06 2.15 0.67
flavanol synthase gene family 2.83 0.41 0.96 1.18 -0.10 1.60 0.82 1.34 1.76 0.53
glycolate oxidase 0.59 -1.86 -0.43 -0.77 -1.84 -0.64 -1.90 -1.14 -1.55 -1.46
cellulase Cel3 membrane-anchored 0.65 -1.26 -0.13 -0.54 -0.99 0.15 -1.04 -0.34 -0.60 -1.14
14-3-3 protein 1.98 -0.21 0.46 0.43 -0.06 0.53 -0.68 0.36 0.91 -0.33
thiazole biosynthesis protein 0.48 -2.05 -2.72 -0.62 -1.80 -0.87 -2.45 -1.97 -2.30 -2.08
hydroxysteroid dehydrogenase/isomerase 1.77 -0.79 1.64 0.39 0.09 -0.16 -0.14 0.95 1.04 -0.58
chaperonin 0.56 -0.36 0.42 -0.59 -1.12 -0.80 -1.69 -0.76 -0.79 -1.77
cell structure, tubulin, microtubules 0.57 -2.48 0.00 -1.36 -1.65 -0.37 -1.78 -0.66 -0.70 -1.51
Ca-binding EF hand protein 0.82 -1.94 -0.45 -1.10 -1.93 -1.97 -2.49 -1.04 -1.10 -2.16
DNA cytosine methyltransferase 1.35 -1.08 -0.84 -0.17 -1.04 -0.16 -1.54 -1.00 -1.13 -1.43
dehydration responsive element binding protein 0.04 -2.22 -1.33 -1.06 -1.00 -0.74 -1.60 -0.85 -0.46 -1.27
sensory transduction histidine kinase 1.85 0.09 1.24 0.47 -0.34 0.48 -0.55 1.38 1.15 0.05
jasmonic acid 1.80 -0.88 1.18 0.86 -0.41 0.87 -0.82 0.98 0.54 -0.18
no sequence 1.83 -1.01 1.16 -0.12 -0.99 0.17 1.16 -0.40 2.60 1.39
unknown protein -0.28 -1.94 -0.55 0.36 -0.14 -0.73 -0.25 -0.05 0.49 0.04
no sequence 1.87 -0.96 0.73 1.08 0.19 -0.28 -0.34 0.31 0.94 -0.04
no sequence 1.17 0.08 0.06 0.06 -1.11 0.36 -1.57 -0.63 -1.16 -1.37
Average log2 Ratio
5V 10E+V10VE 10E5VE 10EV5E+V 5EV 5E 10V
Nucleic acid extracts were prepared from tomatoes infected with Vd1, Dvd-E6 or both, as
well as unwounded uninfected CS controls. The levels of mRNA from infected vs control
extracts were compared by microarray analyses as described in section 4.2.4. Data were
analyzed using GenePix Pro software and expressed as Log2 ratios. The table summarizes
Group 3 defense gene average ratios of infected vs control for the interactions: (5V)
CS/Vd1; (5VE) CS//Vd1/Dvd-E6; (5E+V) CS/Dvd-E6+Vd1, (5EV) CS//Dvd-E6/Vd1;
(5E) CS/Dvd-E6 at 5 and (10V) CS/Vd1; (10VE) CS//Vd1/Dvd-E6; (10E+V) CS/Dvd-
E6+Vd1, (10EV) CS//Dvd-E6/Vd1; (10E) CS/Dvd-E6) 10 dpi. The standard deviations
of the log2 ratios are included in Appendix IV. 1
Protein encoded by defense gene.
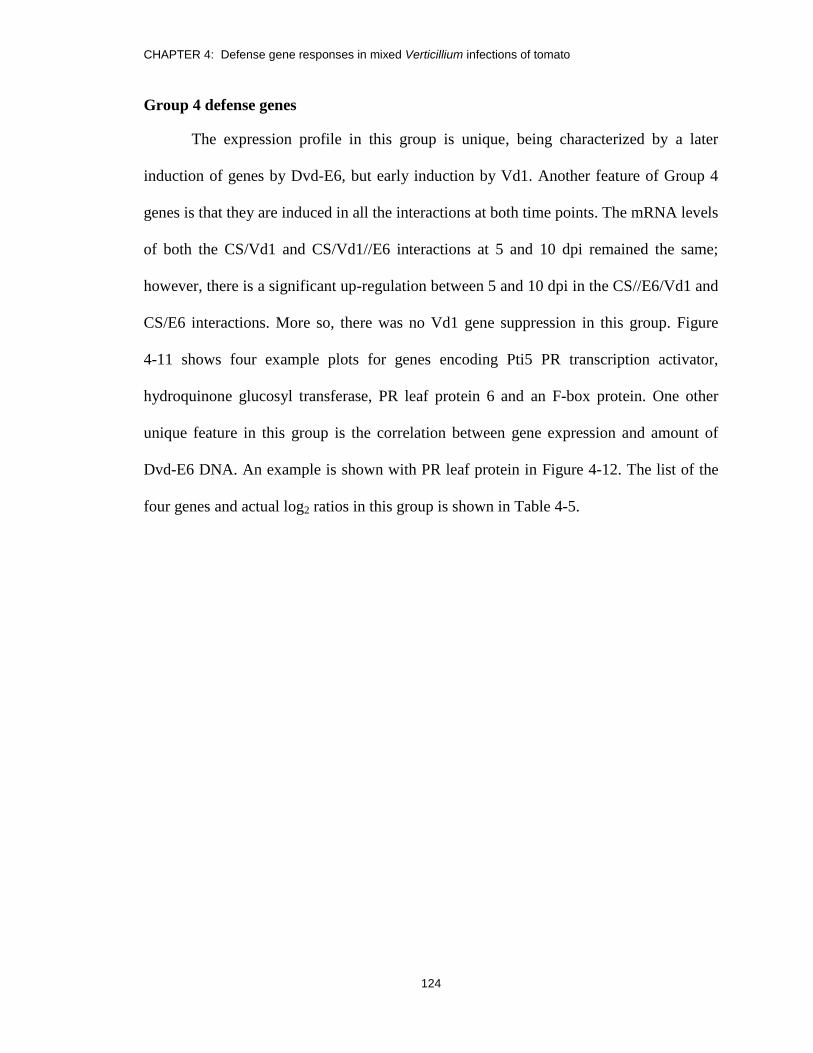
CHAPTER 4: Defense gene responses in mixed Verticillium infections of tomato
124
Group 4 defense genes
The expression profile in this group is unique, being characterized by a later
induction of genes by Dvd-E6, but early induction by Vd1. Another feature of Group 4
genes is that they are induced in all the interactions at both time points. The mRNA levels
of both the CS/Vd1 and CS/Vd1//E6 interactions at 5 and 10 dpi remained the same;
however, there is a significant up-regulation between 5 and 10 dpi in the CS//E6/Vd1 and
CS/E6 interactions. More so, there was no Vd1 gene suppression in this group. Figure
4-11 shows four example plots for genes encoding Pti5 PR transcription activator,
hydroquinone glucosyl transferase, PR leaf protein 6 and an F-box protein. One other
unique feature in this group is the correlation between gene expression and amount of
Dvd-E6 DNA. An example is shown with PR leaf protein in Figure 4-12. The list of the
four genes and actual log2 ratios in this group is shown in Table 4-5.
CHAPTER 4: Defense gene responses in mixed Verticillium infections of tomato
125
Figure 4-11: Group 4 defense gene response profiles in Verticillium infected
tomato.
CS seedlings were infected with Vd1, Dvd-E6 or both to establish CS/Vd1,
CS//Vd1/Dvd-E6, CSE6+Vd1, CS//Dvd-E6/Vd1 and CS/Dvd-E6 interactions as
described in section 2.2.3. Whole cell nucleic acid was extracted from the plants at 5 and
10 dpi and used for microarray hybridization with TVR chips as described in section
2.2.7. Cluster analysis indicates four distinct gene profiles as shown in Figure 4-5. Log2
ratios of representative Group 4 defense genes were plotted against the various
interactions for 5 (white bars) and 10 (grey bars) dpi.

CHAPTER 4: Defense gene responses in mixed Verticillium infections of tomato
126
Figure 4-12: Similarity between amount of Dvd-E6 DNA and Group 4 defense gene
response profiles in CS-Verticillium interactions.
CS tomatoes were infected with Vd1, Dvd-E6 or both to create CS/Vd1, CS//Vd1/Dvd-
E6, CSE6+Vd1, CS//Dvd-E6/Vd1 and CS/Dvd-E6 interactions as described in section
2.2.3 and the amount of Dvd-E6 DNA (left panel) was determined as described in section
2.2.5. Extracts were prepared for microarray hybridization and data analyzed using
GenePix Pro software 4.0 as described in section 4.2.4. The log2 ratios (Y-axis) were
plotted against the various interactions (X-axis) (right panel).
Table 4-5: List of Group 4 defense genes in CS tomato
5' Sequence1
Pti5, PR transcription activator 3.50 3.22 4.34 0.80 0.52 2.35 2.87 5.30 4.75 3.61
hydroquinone glucosyl transferase 3.59 2.95 4.09 0.82 1.18 2.33 2.57 6.00 4.95 2.80
PR leaf protein 6 precursor(P6), ethylene induced3.24 2.71 5.15 0.67 0.46 2.76 3.37 5.77 5.31 4.07
F-box protein (protein degradation) 0.97 -1.05 -0.50 -0.86 -1.33 -1.58 -2.32 -0.87 -0.68 -1.85
Average log2 Ratio2
5V 5VE 5E+V 5EV 5E 10V 10VE 10E+V 10EV 10E
Nucleic acid extracts were prepared from tomatoes infected with Vd1, Dvd-E6 or both, as
well as unwounded uninfected CS controls. The levels of mRNA from infected vs control
extracts were compared by microarray analyses as described in section 4.2.4. Data were
analyzed using GenePix Pro software and expressed as Log2 ratios. The table summarizes
Group 4 defense gene average ratios of infected vs control for the interactions: (5V)
CS/Vd1; (5VE) CS//Vd1/Dvd-E6; (5E+V) CS/Dvd-E6+Vd1, (5EV) CS//Dvd-E6/Vd1;
(5E) CS/Dvd-E6 at 5 and (10V) CS/Vd1; (10VE) CS//Vd1/Dvd-E6; (10E+V) CS/Dvd-
E6+Vd1, (10EV) CS//Dvd-E6/Vd1; (10E) CS/Dvd-E6) 10 dpi. The standard deviations
of the log2 ratios are included in Appendix IV. 1
Protein encoded by defense gene.
CHAPTER 4: Defense gene responses in mixed Verticillium infections of tomato
127
4.3.5 Comparison of mRNA levels using alternate assays
To confirm the results from microarray hybridization analysis, an alternate assay
was used to analyze mRNA levels of representative genes from each group of the profile
analyses. Genes encoding: 1,3-beta glucanase (Group 1), peroxidase (Group 2), 14-3-3
protein (Group 3) and PR leaf protein 6 precursor were chosen because of the roles they
are known to play in plant defense responses (Kombrink and Somssich, 1997; Grant and
Loake, 2000; Roberts, 2003; van Loon, 1999). Aliquots of the whole cell nucleic acid
extracts used for microarray hybridization were used also for RT-PCR assay as described
in section 2.2.8. The mRNA levels for the various interactions were compared by
expressing them as log2 ratios which were then compared with the results obtained by
microarray hybridization as shown in Table 4-6. The results obtained with the RT-PCR
assays agreed with the microarray data in terms of expression profiles, although not with
absolute values.

CHAPTER 4: Defense gene responses in mixed Verticillium infections of tomato
128
Table 4-6: Comparison of mRNA levels using alternative assays
CS seedlings were inoculated with Vd1 or Dvd-E6 to create various
CS/Verticillium/interactions. Nucleic acid extracts were made and mRNA levels were
compared by microarray and RT-PCR analyses. Data were analyzed and expressed as
Log2 ratios. The table summarizes the comparison between both assays. Values represent
mean of 4 biological replicates + standard deviation. (5V) CS/Vd1; (5VE) CS/Vd1//Dvd-
E6; (5E+V) CS/Dvd-E6+Vd1; (5EV): CS/Dvd-E6//Vd1; (5E) CS/Dvd-E6 at 5 dpi and
(10V) CS/Vd1; (10VE) CS/Vd1//Dvd-E6; (10E+V).Cellular CS/Dvd-E6+Vd1; (10EV):
CS/Dvd-E6//Vd1; (10E) CS/Dvd-E6 at 10 dpi.
4.3.6 Effect of the Ve1 gene on Craigella/Verticillium interactions
As noted earlier the Craigella near isolines used in this study are thought to differ
primarily in the Ve locus. Recent molecular analyses now show that this locus contains
two different Ve genes (Ve1 and Ve2) with Ve1 being defective (frame shift mutation) in
the CS isoline. As a first step in examining any effect of the Ve1 gene on the Verticillium
spp. interactions, Craigella resistant isoline was infected with Vd1 and Dvd-E6 to
establish three different interactions: CR/Vd1, CR//Dvd-E6/Vd1 and CR/Dvd-E6. As a
positive control, an interaction involving CS with Vd1 also was established. To create
CHAPTER 4: Defense gene responses in mixed Verticillium infections of tomato
129
these interactions, CR seedlings were infected at either 3- or/and 4-leaf stages as
described in section 2.2.3. Also, uninfected wounded CR and CS, as well as uninfected
unwounded CR plants were included for comparison. At 5 and 10 dpi, symptom
expression scores were recorded and the amounts of Verticillium pathogens in the plant
stems were quantified as described in section 2.2.5. For each interaction, each experiment
consisted of three plants for each sampling time; the entire experiment was replicated 4
times.
Figure 4-13 summarizes the biological changes for CR (Ve+) cultivar for the
symptom scores (upper panel) and plant height (lower panel). As anticipated, CS/Vd1
plants were stunted with high amounts of symptoms (3.1 + 0.7) at 10 dpi. The CR/Vd1
had low level of symptoms compared to the compatible interaction, suggesting that the
presence of the Ve1+ gene led to significant reduction in the level of symptoms. The
CR//Dvd-E6/Vd1 plants were shorter and had higher disease scores at 5 and 10 dpi with
respect to CR/Vd1 plants. There was no significant difference in plant height among
CR/Vd1, tolerant interactions and the control plants within the experimental time frame.

CHAPTER 4: Defense gene responses in mixed Verticillium infections of tomato
130
Figure 4-13: Symptom expression in CR/Verticillium interactions
CR tomato seedlings were infected with Vd1 and/or Dvd-E6 as described in section
2.2.3; uninfected CR and CS plants were included also as controls. The figure (upper
panel) shows the plant height (cm ± standard deviation [SD]) for the various interactions.
The table (lower panel) summarizes the symptom scores (0, plant healthy -5, plant dead ±
SD) at 5 (light gray bars) and 10 dpi (dark gray bars) as described in section 2.2.3.
Results summarize data for 12 plants per sampling time for each interaction.
The results obtained for the total and relative amounts of Vd1 and Dvd-E6 in the
plant stems are summarized in Figure 4-14. As anticipated, there were high amounts of
Vd1 in the susceptible relationship at both sampling times. The amount of fungus in the
CR/Vd1 plants was significantly lower with respect to the CS/Vd1 interaction at 10 dpi,
suggesting that the presence of the dominant Ve1+ allele resulted in restriction of Vd1
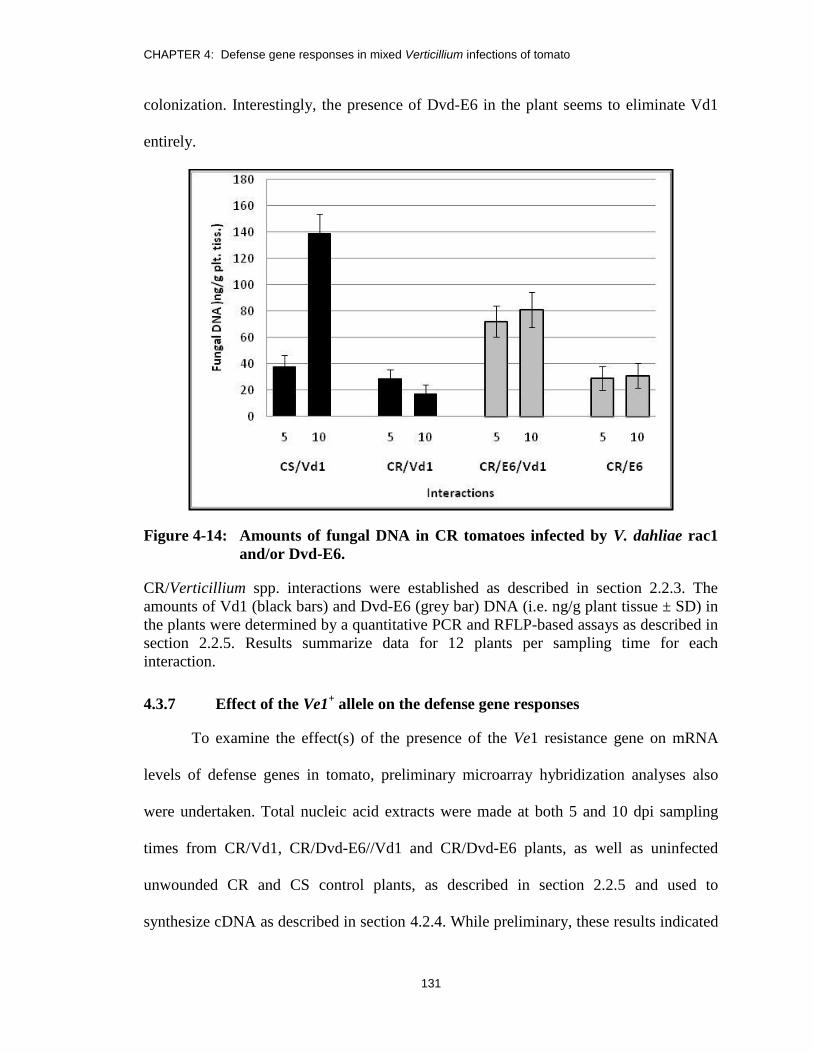
CHAPTER 4: Defense gene responses in mixed Verticillium infections of tomato
131
colonization. Interestingly, the presence of Dvd-E6 in the plant seems to eliminate Vd1
entirely.
Figure 4-14: Amounts of fungal DNA in CR tomatoes infected by V. dahliae rac1
and/or Dvd-E6.
CR/Verticillium spp. interactions were established as described in section 2.2.3. The
amounts of Vd1 (black bars) and Dvd-E6 (grey bar) DNA (i.e. ng/g plant tissue ± SD) in
the plants were determined by a quantitative PCR and RFLP-based assays as described in
section 2.2.5. Results summarize data for 12 plants per sampling time for each
interaction.
4.3.7 Effect of the Ve1+ allele on the defense gene responses
To examine the effect(s) of the presence of the Ve1 resistance gene on mRNA
levels of defense genes in tomato, preliminary microarray hybridization analyses also
were undertaken. Total nucleic acid extracts were made at both 5 and 10 dpi sampling
times from CR/Vd1, CR/Dvd-E6//Vd1 and CR/Dvd-E6 plants, as well as uninfected
unwounded CR and CS control plants, as described in section 2.2.5 and used to
synthesize cDNA as described in section 4.2.4. While preliminary, these results indicated

CHAPTER 4: Defense gene responses in mixed Verticillium infections of tomato
132
that, unlike the CS/V. dahliae interactions in which defence gene expression profiles were
categorized easily into major groups, in the CR/V. dahliae interactions, the defense gene
responses appeared more diverse. As shown in Figure 4-15, in general, the cluster
analyses indicated less intense changes and more mixed patterns of regulation. This was
partially evident with respect to the strongly up-regulated group which essentially
disappeared into several clusters of genes displaying alternative patterns of mixed
regulation. This is further evident with a detailed examination of its summaries presented
in Tables 4-7 to 4-10. For example, in Group 1 (Table 4-7), the infected to control plant
log2 ratio was as low as -4.92 + 1.48 for a late embryogenesis protein and -3.16 + 0.85 for
an unknown protein, TUS24I10 at 5 dpi. Only a few genes were induced such as the
Group 1 gene encoding a peroxidase protein with a log2 ratio of 1.49 + 0.36, or the gene
encoding an acidic endochitinase precursor (1.14 + 0.39).
The apparently reduced or possibly suppressed levels for many of the defence
gene mRNAs in infected CR plants raised the possibility that basal levels in healthy
plants actually might be significantly higher when an active Ve1 gene is present and
further induction is not necessary as the pathogens is adequately contained. To test this
possibility the levels of defense gene mRNA in CR and CS control plants were
compared. The microarray results indicated that most of the defense genes did, indeed,
show higher basal levels of expression in the CR relative to the CS isoline. For example,
in Group 1 (Table 4-7), there were large differences in the basal expression levels of the
genes encoding PR leaf protein 4 (5.13 + 1.50), bZIP (4.70 + 1.45), endochitinase
precursor (2.59 + 0.97) and class IV chitinases (4.66 + 0.69), as well as some unknown
proteins. Genes encoding ethylene receptor, endochitinase, phytoene synthase, as well as

CHAPTER 4: Defense gene responses in mixed Verticillium infections of tomato
133
some unknown proteins were among the genes that had higher basal levels in CR
tomatoes in Group 2 (Table 4-8).
Figure 4-15: Cluster analysis of defence gene mRNA levels in CR/Verticillium
interactions.
Extracts from plants of various CR-Verticillium interactions were used for microarray
hybridization with a TVR chip. Microarray data were analyzed with Gene Traffic (DUO)
v3.2 software for hierarchical clustering of genes (rows) expressed in the various
interactions {columns: (1-1) CR/Vd1; (1-2) CR//Dvd-E6/Vd1; (1-3) CR/Dvd-E6; at 5 and
(2-1) CR/Vd1; (2-2) CR//Dvd-E6/Vd1; (2-3) CR/Dvd-E6 at 10 dpi}.
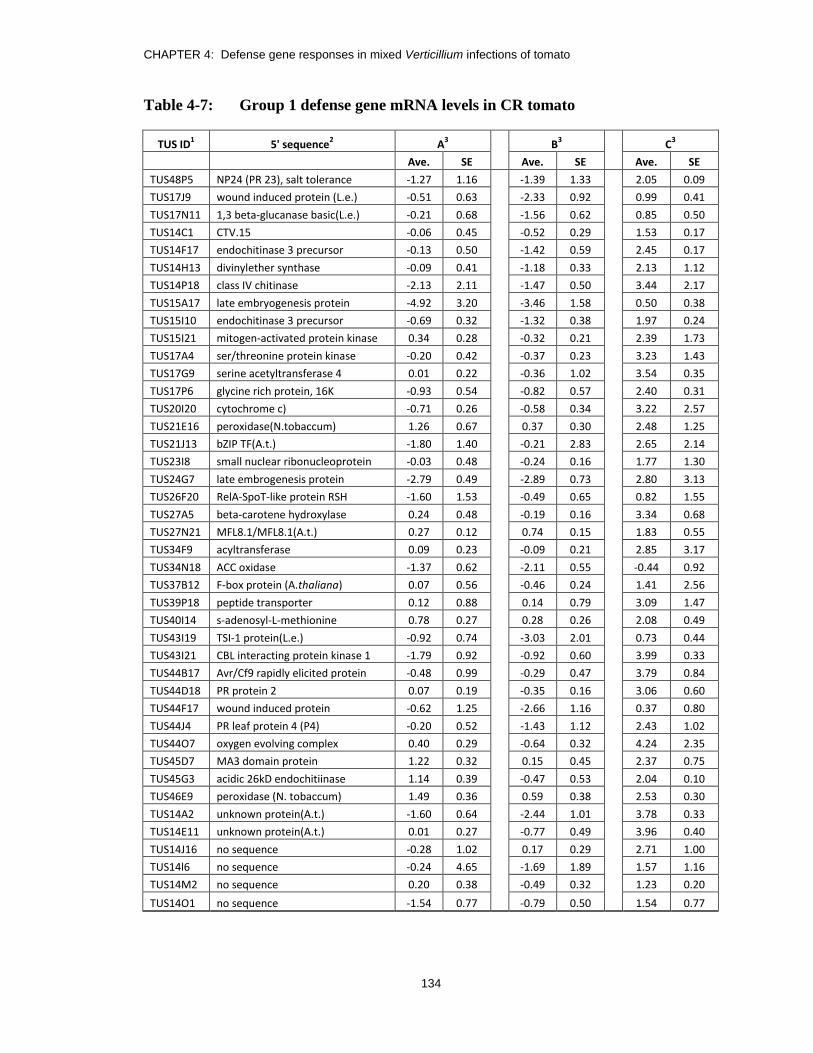
CHAPTER 4: Defense gene responses in mixed Verticillium infections of tomato
134
Table 4-7: Group 1 defense gene mRNA levels in CR tomato
TUS ID1 5' sequence
2 A
3
B3
C3
Ave. SE Ave. SE Ave. SE
TUS48P5 NP24 (PR 23), salt tolerance -1.27 1.16 -1.39 1.33 2.05 0.09
TUS17J9 wound induced protein (L.e.) -0.51 0.63 -2.33 0.92 0.99 0.41
TUS17N11 1,3 beta-glucanase basic(L.e.) -0.21 0.68 -1.56 0.62 0.85 0.50
TUS14C1 CTV.15 -0.06 0.45 -0.52 0.29 1.53 0.17
TUS14F17 endochitinase 3 precursor -0.13 0.50 -1.42 0.59 2.45 0.17
TUS14H13 divinylether synthase -0.09 0.41 -1.18 0.33 2.13 1.12
TUS14P18 class IV chitinase -2.13 2.11 -1.47 0.50 3.44 2.17
TUS15A17 late embryogenesis protein -4.92 3.20 -3.46 1.58 0.50 0.38
TUS15I10 endochitinase 3 precursor -0.69 0.32 -1.32 0.38 1.97 0.24
TUS15I21 mitogen-activated protein kinase 0.34 0.28 -0.32 0.21 2.39 1.73
TUS17A4 ser/threonine protein kinase -0.20 0.42 -0.37 0.23 3.23 1.43
TUS17G9 serine acetyltransferase 4 0.01 0.22 -0.36 1.02 3.54 0.35
TUS17P6 glycine rich protein, 16K -0.93 0.54 -0.82 0.57 2.40 0.31
TUS20I20 cytochrome c) -0.71 0.26 -0.58 0.34 3.22 2.57
TUS21E16 peroxidase(N.tobaccum) 1.26 0.67 0.37 0.30 2.48 1.25
TUS21J13 bZIP TF(A.t.) -1.80 1.40 -0.21 2.83 2.65 2.14
TUS23I8 small nuclear ribonucleoprotein -0.03 0.48 -0.24 0.16 1.77 1.30
TUS24G7 late embrogenesis protein -2.79 0.49 -2.89 0.73 2.80 3.13
TUS26F20 RelA-SpoT-like protein RSH -1.60 1.53 -0.49 0.65 0.82 1.55
TUS27A5 beta-carotene hydroxylase 0.24 0.48 -0.19 0.16 3.34 0.68
TUS27N21 MFL8.1/MFL8.1(A.t.) 0.27 0.12 0.74 0.15 1.83 0.55
TUS34F9 acyltransferase 0.09 0.23 -0.09 0.21 2.85 3.17
TUS34N18 ACC oxidase -1.37 0.62 -2.11 0.55 -0.44 0.92
TUS37B12 F-box protein (A.thaliana) 0.07 0.56 -0.46 0.24 1.41 2.56
TUS39P18 peptide transporter 0.12 0.88 0.14 0.79 3.09 1.47
TUS40I14 s-adenosyl-L-methionine 0.78 0.27 0.28 0.26 2.08 0.49
TUS43I19 TSI-1 protein(L.e.) -0.92 0.74 -3.03 2.01 0.73 0.44
TUS43I21 CBL interacting protein kinase 1 -1.79 0.92 -0.92 0.60 3.99 0.33
TUS44B17 Avr/Cf9 rapidly elicited protein -0.48 0.99 -0.29 0.47 3.79 0.84
TUS44D18 PR protein 2 0.07 0.19 -0.35 0.16 3.06 0.60
TUS44F17 wound induced protein -0.62 1.25 -2.66 1.16 0.37 0.80
TUS44J4 PR leaf protein 4 (P4) -0.20 0.52 -1.43 1.12 2.43 1.02
TUS44O7 oxygen evolving complex 0.40 0.29 -0.64 0.32 4.24 2.35
TUS45D7 MA3 domain protein 1.22 0.32 0.15 0.45 2.37 0.75
TUS45G3 acidic 26kD endochitiinase 1.14 0.39 -0.47 0.53 2.04 0.10
TUS46E9 peroxidase (N. tobaccum) 1.49 0.36 0.59 0.38 2.53 0.30
TUS14A2 unknown protein(A.t.) -1.60 0.64 -2.44 1.01 3.78 0.33
TUS14E11 unknown protein(A.t.) 0.01 0.27 -0.77 0.49 3.96 0.40
TUS14J16 no sequence -0.28 1.02 0.17 0.29 2.71 1.00
TUS14l6 no sequence -0.24 4.65 -1.69 1.89 1.57 1.16
TUS14M2 no sequence 0.20 0.38 -0.49 0.32 1.23 0.20
TUS14O1 no sequence -1.54 0.77 -0.79 0.50 1.54 0.77
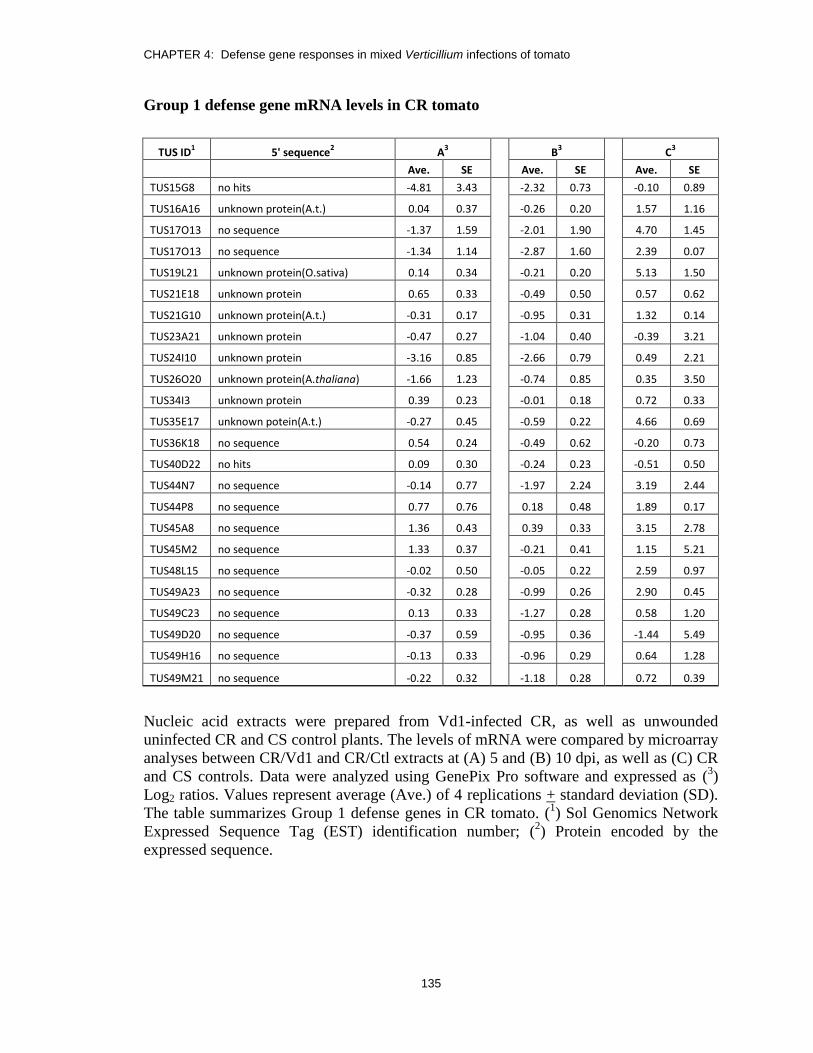
CHAPTER 4: Defense gene responses in mixed Verticillium infections of tomato
135
Group 1 defense gene mRNA levels in CR tomato
TUS ID1 5' sequence
2 A
3
B3
C3
Ave. SE Ave. SE Ave. SE
TUS15G8 no hits -4.81 3.43
-2.32 0.73
-0.10 0.89
TUS16A16 unknown protein(A.t.) 0.04 0.37 -0.26 0.20 1.57 1.16
TUS17O13 no sequence -1.37 1.59 -2.01 1.90 4.70 1.45
TUS17O13 no sequence -1.34 1.14 -2.87 1.60 2.39 0.07
TUS19L21 unknown protein(O.sativa) 0.14 0.34 -0.21 0.20 5.13 1.50
TUS21E18 unknown protein 0.65 0.33 -0.49 0.50 0.57 0.62
TUS21G10 unknown protein(A.t.) -0.31 0.17 -0.95 0.31 1.32 0.14
TUS23A21 unknown protein -0.47 0.27 -1.04 0.40 -0.39 3.21
TUS24I10 unknown protein -3.16 0.85 -2.66 0.79 0.49 2.21
TUS26O20 unknown protein(A.thaliana) -1.66 1.23 -0.74 0.85 0.35 3.50
TUS34I3 unknown protein 0.39 0.23 -0.01 0.18 0.72 0.33
TUS35E17 unknown potein(A.t.) -0.27 0.45 -0.59 0.22 4.66 0.69
TUS36K18 no sequence 0.54 0.24 -0.49 0.62 -0.20 0.73
TUS40D22 no hits 0.09 0.30 -0.24 0.23 -0.51 0.50
TUS44N7 no sequence -0.14 0.77 -1.97 2.24 3.19 2.44
TUS44P8 no sequence 0.77 0.76 0.18 0.48 1.89 0.17
TUS45A8 no sequence 1.36 0.43 0.39 0.33 3.15 2.78
TUS45M2 no sequence 1.33 0.37 -0.21 0.41 1.15 5.21
TUS48L15 no sequence -0.02 0.50 -0.05 0.22 2.59 0.97
TUS49A23 no sequence -0.32 0.28 -0.99 0.26 2.90 0.45
TUS49C23 no sequence 0.13 0.33 -1.27 0.28 0.58 1.20
TUS49D20 no sequence -0.37 0.59 -0.95 0.36 -1.44 5.49
TUS49H16 no sequence -0.13 0.33 -0.96 0.29 0.64 1.28
TUS49M21 no sequence -0.22 0.32 -1.18 0.28 0.72 0.39
Nucleic acid extracts were prepared from Vd1-infected CR, as well as unwounded
uninfected CR and CS control plants. The levels of mRNA were compared by microarray
analyses between CR/Vd1 and CR/Ctl extracts at (A) 5 and (B) 10 dpi, as well as (C) CR
and CS controls. Data were analyzed using GenePix Pro software and expressed as (3)
Log2 ratios. Values represent average (Ave.) of 4 replications + standard deviation (SD).
The table summarizes Group 1 defense genes in CR tomato. (1) Sol Genomics Network
Expressed Sequence Tag (EST) identification number; (2) Protein encoded by the
expressed sequence.
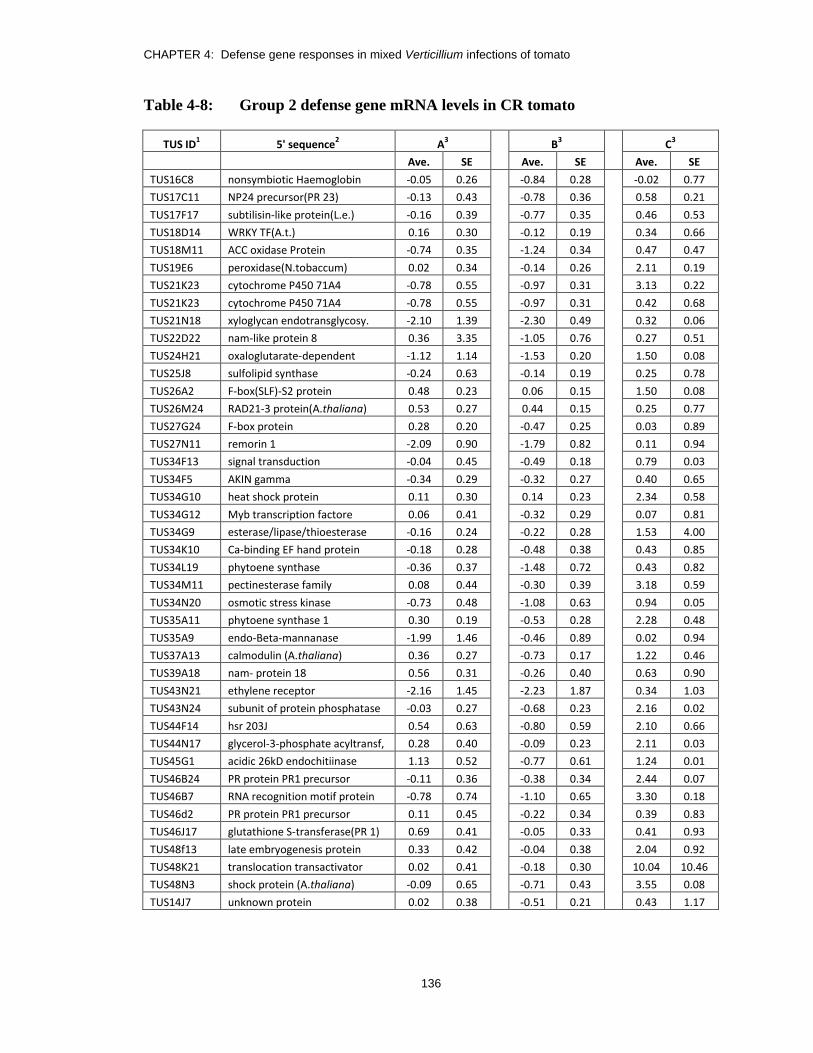
CHAPTER 4: Defense gene responses in mixed Verticillium infections of tomato
136
Table 4-8: Group 2 defense gene mRNA levels in CR tomato
TUS ID1 5' sequence
2 A
3
B3
C3
Ave. SE Ave. SE Ave. SE
TUS16C8 nonsymbiotic Haemoglobin -0.05 0.26
-0.84 0.28
-0.02 0.77
TUS17C11 NP24 precursor(PR 23) -0.13 0.43 -0.78 0.36 0.58 0.21
TUS17F17 subtilisin-like protein(L.e.) -0.16 0.39 -0.77 0.35 0.46 0.53
TUS18D14 WRKY TF(A.t.) 0.16 0.30 -0.12 0.19 0.34 0.66
TUS18M11 ACC oxidase Protein -0.74 0.35 -1.24 0.34 0.47 0.47
TUS19E6 peroxidase(N.tobaccum) 0.02 0.34 -0.14 0.26 2.11 0.19
TUS21K23 cytochrome P450 71A4 -0.78 0.55 -0.97 0.31 3.13 0.22
TUS21K23 cytochrome P450 71A4 -0.78 0.55 -0.97 0.31 0.42 0.68
TUS21N18 xyloglycan endotransglycosy. -2.10 1.39 -2.30 0.49 0.32 0.06
TUS22D22 nam-like protein 8 0.36 3.35 -1.05 0.76 0.27 0.51
TUS24H21 oxaloglutarate-dependent -1.12 1.14 -1.53 0.20 1.50 0.08
TUS25J8 sulfolipid synthase -0.24 0.63 -0.14 0.19 0.25 0.78
TUS26A2 F-box(SLF)-S2 protein 0.48 0.23 0.06 0.15 1.50 0.08
TUS26M24 RAD21-3 protein(A.thaliana) 0.53 0.27 0.44 0.15 0.25 0.77
TUS27G24 F-box protein 0.28 0.20 -0.47 0.25 0.03 0.89
TUS27N11 remorin 1 -2.09 0.90 -1.79 0.82 0.11 0.94
TUS34F13 signal transduction -0.04 0.45 -0.49 0.18 0.79 0.03
TUS34F5 AKIN gamma -0.34 0.29 -0.32 0.27 0.40 0.65
TUS34G10 heat shock protein 0.11 0.30 0.14 0.23 2.34 0.58
TUS34G12 Myb transcription factore 0.06 0.41 -0.32 0.29 0.07 0.81
TUS34G9 esterase/lipase/thioesterase -0.16 0.24 -0.22 0.28 1.53 4.00
TUS34K10 Ca-binding EF hand protein -0.18 0.28 -0.48 0.38 0.43 0.85
TUS34L19 phytoene synthase -0.36 0.37 -1.48 0.72 0.43 0.82
TUS34M11 pectinesterase family 0.08 0.44 -0.30 0.39 3.18 0.59
TUS34N20 osmotic stress kinase -0.73 0.48 -1.08 0.63 0.94 0.05
TUS35A11 phytoene synthase 1 0.30 0.19 -0.53 0.28 2.28 0.48
TUS35A9 endo-Beta-mannanase -1.99 1.46 -0.46 0.89 0.02 0.94
TUS37A13 calmodulin (A.thaliana) 0.36 0.27 -0.73 0.17 1.22 0.46
TUS39A18 nam- protein 18 0.56 0.31 -0.26 0.40 0.63 0.90
TUS43N21 ethylene receptor -2.16 1.45 -2.23 1.87 0.34 1.03
TUS43N24 subunit of protein phosphatase -0.03 0.27 -0.68 0.23 2.16 0.02
TUS44F14 hsr 203J 0.54 0.63 -0.80 0.59 2.10 0.66
TUS44N17 glycerol-3-phosphate acyltransf, 0.28 0.40 -0.09 0.23 2.11 0.03
TUS45G1 acidic 26kD endochitiinase 1.13 0.52 -0.77 0.61 1.24 0.01
TUS46B24 PR protein PR1 precursor -0.11 0.36 -0.38 0.34 2.44 0.07
TUS46B7 RNA recognition motif protein -0.78 0.74 -1.10 0.65 3.30 0.18
TUS46d2 PR protein PR1 precursor 0.11 0.45 -0.22 0.34 0.39 0.83
TUS46J17 glutathione S-transferase(PR 1) 0.69 0.41 -0.05 0.33 0.41 0.93
TUS48f13 late embryogenesis protein 0.33 0.42 -0.04 0.38 2.04 0.92
TUS48K21 translocation transactivator 0.02 0.41 -0.18 0.30 10.04 10.46
TUS48N3 shock protein (A.thaliana) -0.09 0.65 -0.71 0.43 3.55 0.08
TUS14J7 unknown protein 0.02 0.38 -0.51 0.21 0.43 1.17
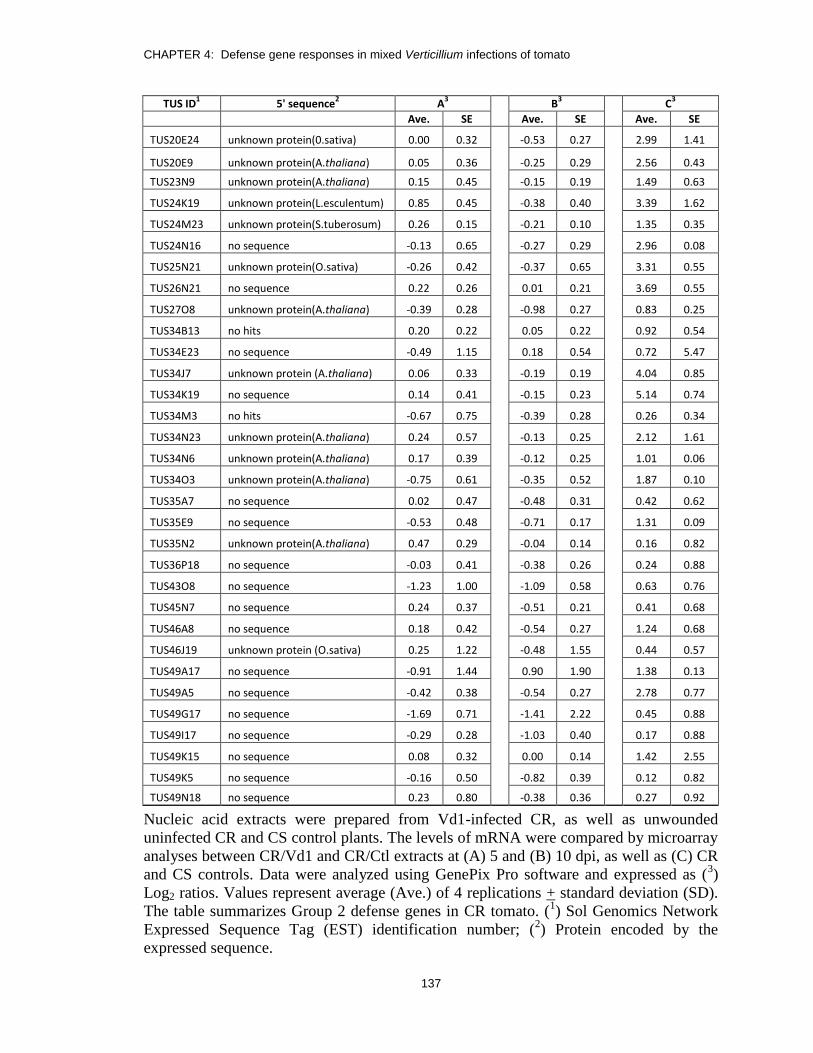
CHAPTER 4: Defense gene responses in mixed Verticillium infections of tomato
137
TUS ID1 5' sequence
2 A
3
B3
C3
Ave. SE Ave. SE Ave. SE
TUS20E24 unknown protein(0.sativa) 0.00 0.32
-0.53 0.27
2.99 1.41
TUS20E9 unknown protein(A.thaliana) 0.05 0.36 -0.25 0.29 2.56 0.43
TUS23N9 unknown protein(A.thaliana) 0.15 0.45 -0.15 0.19 1.49 0.63
TUS24K19 unknown protein(L.esculentum) 0.85 0.45 -0.38 0.40 3.39 1.62
TUS24M23 unknown protein(S.tuberosum) 0.26 0.15 -0.21 0.10 1.35 0.35
TUS24N16 no sequence -0.13 0.65 -0.27 0.29 2.96 0.08
TUS25N21 unknown protein(O.sativa) -0.26 0.42 -0.37 0.65 3.31 0.55
TUS26N21 no sequence 0.22 0.26 0.01 0.21 3.69 0.55
TUS27O8 unknown protein(A.thaliana) -0.39 0.28 -0.98 0.27 0.83 0.25
TUS34B13 no hits 0.20 0.22 0.05 0.22 0.92 0.54
TUS34E23 no sequence -0.49 1.15 0.18 0.54 0.72 5.47
TUS34J7 unknown protein (A.thaliana) 0.06 0.33 -0.19 0.19 4.04 0.85
TUS34K19 no sequence 0.14 0.41 -0.15 0.23 5.14 0.74
TUS34M3 no hits -0.67 0.75 -0.39 0.28 0.26 0.34
TUS34N23 unknown protein(A.thaliana) 0.24 0.57 -0.13 0.25 2.12 1.61
TUS34N6 unknown protein(A.thaliana) 0.17 0.39 -0.12 0.25 1.01 0.06
TUS34O3 unknown protein(A.thaliana) -0.75 0.61 -0.35 0.52 1.87 0.10
TUS35A7 no sequence 0.02 0.47 -0.48 0.31 0.42 0.62
TUS35E9 no sequence -0.53 0.48 -0.71 0.17 1.31 0.09
TUS35N2 unknown protein(A.thaliana) 0.47 0.29 -0.04 0.14 0.16 0.82
TUS36P18 no sequence -0.03 0.41 -0.38 0.26 0.24 0.88
TUS43O8 no sequence -1.23 1.00 -1.09 0.58 0.63 0.76
TUS45N7 no sequence 0.24 0.37 -0.51 0.21 0.41 0.68
TUS46A8 no sequence 0.18 0.42 -0.54 0.27 1.24 0.68
TUS46J19 unknown protein (O.sativa) 0.25 1.22 -0.48 1.55 0.44 0.57
TUS49A17 no sequence -0.91 1.44 0.90 1.90 1.38 0.13
TUS49A5 no sequence -0.42 0.38 -0.54 0.27 2.78 0.77
TUS49G17 no sequence -1.69 0.71 -1.41 2.22 0.45 0.88
TUS49I17 no sequence -0.29 0.28 -1.03 0.40 0.17 0.88
TUS49K15 no sequence 0.08 0.32 0.00 0.14 1.42 2.55
TUS49K5 no sequence -0.16 0.50 -0.82 0.39 0.12 0.82
TUS49N18 no sequence 0.23 0.80 -0.38 0.36 0.27 0.92
Nucleic acid extracts were prepared from Vd1-infected CR, as well as unwounded
uninfected CR and CS control plants. The levels of mRNA were compared by microarray
analyses between CR/Vd1 and CR/Ctl extracts at (A) 5 and (B) 10 dpi, as well as (C) CR
and CS controls. Data were analyzed using GenePix Pro software and expressed as (3)
Log2 ratios. Values represent average (Ave.) of 4 replications + standard deviation (SD).
The table summarizes Group 2 defense genes in CR tomato. (1) Sol Genomics Network
Expressed Sequence Tag (EST) identification number; (2) Protein encoded by the
expressed sequence.

CHAPTER 4: Defense gene responses in mixed Verticillium infections of tomato
138
Table 4-9: Group 3 defense gene mRNA levels in CR tomato
TUS ID1 5' sequence
2 A
3
B3
C3
Ave. SE Ave. SE Ave. SE
TUS27E21 14-3-3 protein 0.28 0.20
-0.87 0.30
0.30 0.46
TUS14K1 expansin precursor -0.06 0.32 -0.81 0.20 -0.20 0.77
TUS21M23 WIZZ(N.tobaccum) 0.33 1.07 1.37 0.54 1.26 0.53
TUS23H10 flavanol synthase gene family 1.42 0.89 0.79 0.41 1.26 0.87
TUS24L20 glycolate oxidase 1.94 0.28 0.69 0.23 1.39 0.08
TUS26E8 cellulase Cel3 membrane -0.61 0.31 -1.13 0.19 0.97 0.11
TUS27O21 thiazole biosynthesis protein 0.16 0.22 0.60 0.17 3.32 1.19
TUS27P8 hydroxysteroid dehydrogenase -0.15 0.57 -1.01 1.07 1.12 1.35
TUS28C3 chaperonin(A.thaliana) 0.72 0.29 -0.21 0.19 -0.75 0.52
TUS34G18 Calcium binding protein -0.31 0.98 -1.67 1.39 2.45 1.76
TUS34H11 calmodulin 2 0.61 0.37 0.30 0.29 0.55 0.03
TUS34J12 cell structure, tubulin 0.43 0.31 -0.82 0.22 0.55 0.03
TUS35G20 DNA cytosine methyltransferase 0.22 0.59 0.47 0.30 0.00 0.19
TUS43B9 responsive element protein 0.40 0.23 -0.42 0.22 1.55 0.42
TUS43K18 sensory transduction kinase -0.72 0.38 -0.54 0.36 2.39 0.89
TUS43N10 jasmonic acid 0.73 0.19 -0.16 0.13 1.47 0.12
TUS14J8 no hits -3.56 1.11 5.26 9.81 2.77 0.96
TUS23F2 unknown protein(A.thaliana) -0.85 0.24 -1.05 0.28 1.08 0.11
TUS34C17 no sequence -0.90 0.44 -1.51 0.59 1.08 0.11
TUS36F9 no hits 2.36 0.28 1.25 0.29 0.73 0.97
Nucleic acid extracts were prepared from Vd1-infected CR, as well as unwounded
uninfected CR and CS control plants. The levels of mRNA were compared by microarray
analyses between CR/Vd1 and CR/Ctl extracts at (A) 5 and (B) 10 dpi, as well as (C) CR
and CS controls. Data were analyzed using GenePix Pro software and expressed as (3)
Log2 ratios. Values represent average (Ave.) of 4 replications + standard deviation (SD).
The table summarizes Group 3 defense genes in CR tomato. (1) Sol Genomics Network
Expressed Sequence Tag (EST) identification number; (2) Protein encoded by the
expressed sequence.

CHAPTER 4: Defense gene responses in mixed Verticillium infections of tomato
139
Table 4-10: Group 4 defense gene mRNA levels in CR tomato
TUS ID1 5' sequence
2 A
3
B3
C3
Ave. SE Ave. SE Ave. SE
TUS43O6 Pti5, PR transcription azctivator -2.48 2.00
-2.37 1.54
3.16 1.16
TUS43O7 hydr. glucosyl transferase -0.94 0.50 -1.66 1.41 9.76 10.85
TUS43P7 PR leaf protein 6 precursor(P6) -0.87 2.10 -1.32 0.14 3.14 1.34
TUS45E3 F-box protein -0.44 0.29 0.42 0.19 1.56 1.49
Nucleic acid extracts were prepared from Vd1-infected CR, as well as unwounded
uninfected CR and CS control plants. The levels of mRNA were compared by microarray
analyses between CR/Vd1 and CR/Ctl extracts at (A) 5 and (B) 10 dpi, as well as (C) CR
and CS controls. Data were analyzed using GenePix Pro software and expressed as (3)
Log2 ratios. Values represent average (Ave.) of 4 replications + standard deviation (SD).
The table summarizes Group 1 defense genes in CR tomato. (1) Sol Genomics Network
Expressed Sequence Tag (EST) identification number; (2) Protein encoded by the
expressed sequence.
4.4 Discussion
Transcript profiling of either host or pathogen can reveal the nature and/or mode of
action of candidate virulence factors of a pathogen (Wise et al., 2007). There are many
reports of gene expression profiling for fungal/host interactions, but few studies have
investigated genetic control associated with tolerance (Robb, 2007). In this chapter, a
customized TVR microarray chip was used to examine defense gene mRNA levels in
various Craigella/Verticillium interactions with a view towards investigating responses
that may lead to tolerance induction and endophyte-induced protection, as suggested in
Chapters 2 and 3.
As powerful as expression microarray technology is, there are some technical
aspects which could lead to the production of erroneous results, either false positivity or
negativity that may represent under- or over-expression of certain genes (True and Feng,
2005). To overcome some of these problems, all the genes were normalized against the
actin reference gene and log2 ratios below statistical accuracy were removed. More so,

CHAPTER 4: Defense gene responses in mixed Verticillium infections of tomato
140
the microarray data in this study was further confirmed for representative genes that
encode; 1,3-beta glucanase for Group 1, peroxidase for Group 2, 14-3-3 protein for
Group 3 and PR leaf protein for Group 4 using alternate RT-PCR assay to compare the
level of mRNA for the various interactions. The results (Table 4-6) indicated that most of
the microarray values agreed with the RT-PCR in terms of patterns of expression, but not
with absolute values. This could either be as a result of technical problems in either of the
two assays or the increased sensitivity of RT-PCR assay over the microarray technology.
The overall expression profiles were different among all the interactions at both
time points (i.e. 5 and 10 dpi) as shown with the scatter plot results (Figure 4-4). In some
interactions (such as CS/Vd1) many defense genes were initially up-regulated, but were
later suppressed, while in others (such as CS/Dvd-E6), the reverse was the case. These
observations clearly indicate that the plant recognized the presence of the pathogen either
in single or dual infections and responded to their effect(s) accordingly. The hierarchical
clustering analyses of the microarray data using Gene Traffic software v3.2 revealed that
the defense gene responses can be clustered into four groups (Figure 4-5). Groups 1 and 2
were characterized by strong Vd1 induction followed by suppression, while Dvd-E6
suppressed genes in this group at both time points and there was no significant difference
in mRNA levels. However, there was late induction in the mixed infections for Group 1
genes. Group 2 genes differ from Group 1 genes in that there was no significant
difference in mRNA levels in the mixed infection interactions at both 5 and 10 dpi.
Group 3 is distinguished by modest changes in mRNA levels among all the interactions at
both time points, while Group 4 was characterized by late induction by Dvd-E6. What are
the biological significance of these expression profiles?

CHAPTER 4: Defense gene responses in mixed Verticillium infections of tomato
141
When Vd1 infests CS tomato, defense responses are induced to curtail pathogen
spread by up-regulating defense genes, although the timing might be delayed with respect
to resistant cultivar (Heinz et al., 1998; Gold et al., 1996). In the present studies, careful
observation of the nature of genes in Group 1 reveals that they can be correlated with
fungal colonization and symptom expression in the plant. Some of the genes that were
strongly up-regulated by Vd1 in the susceptible response were the ones encoding proteins
known to be associated with plant responses to pathogen invasion and wounding stress,
such as NP24 (PR-5 family) (Rodrigo et al., 1991); a thaumatin-like protein and wound
induced protein (PR-6 family), clearly suggesting that the presence of the pathogen was
detected. Proteins that target fungal cell walls and destroy Verticillium spp. mycelia and
conidia such as class IV chitinases and endochitinase 3 precursors (PR-3 families;
Kombrink and Somssich, 1997) as well as 1,3 beta-glucanases (PR-2 family; Kombrink
and Somssich, 1997) were also among the up-regulated genes. Some transcription factors
such as bZIP (Lee et al., 2002) and TSI1 protein (Park et al., 2001), which are related to
plant defense and wounding responses, as well as genes encoding proteins related to
defense signaling, such as divinylether synthase, an enzyme involved in jasmonic acid
synthesis (Howe et al., 2000), were also among up-regulated genes in the susceptible
reaction. The induction of these genes at 5 dpi (Figure 4-6) may be correlated with the
initial defense responses induced in CS tomato, leading to the first round of fungal
elimination (Chen et al., 2004). It was less anticipated that these genes were later
significantly suppressed by Vd1 at 10 dpi. The biological significance of this observation
could be that, as a result of the delayed resistance response deployed by susceptible plant,
CHAPTER 4: Defense gene responses in mixed Verticillium infections of tomato
142
Vd1 colonization was increased. The presence of high amounts of the pathogen later
overpowered the plant defense, resulting in high symptom levels (3.5 + 0.42) at 10 dpi.
In contrast, the presence of DVd-E6 in CS plants led to lack of induction of Group
1 defense genes at both sampling times. For example, genes encoding class IV chitinase,
a degradatory enzyme known to target fungal cell wall (Kombrink and Somssich, 1997)
were not induced. Also, some genes whose products are important signaling molecules in
pathogenesis and a defense response such as MAP kinase (Kim et al., 2003), as well as
divinylether synthase that catalyze a reaction leading to jasmonic acid synthesis (Howe et
al., 2000) were all suppressed. This may account for the reduced level of symptoms
(0.7+0.4 and 0.19+0.17, respectively at both 5 and 10 dpi) observed in a tolerant plant.
More so, ACC oxidase, a protein which catalyzes a reaction in ethylene biosynthesis,
which has a negative correlation with plant height (Buchanan et al., 2000), was also
among down-regulated genes. Down-regulation of ethylene may also account for the
increased height in a tolerant plant (Mittler and Cheung, 2004; Robb et al., 2007). One
fascinating aspect of the Group 1 defense gene responses was the antagonistic effect of
Vd1 and Dvd-E6 on CS gene expression. At 5 dpi, as more Vd1 were present in the
mixed infections, genes were progressively up-regulated as shown with the beta carotene
hydroxylase gene, which is involved in stress protection in plants (Davison et al., 2002)
as shown in Table 4-1. But, with increased amounts of Dvd-E6 at 10 dpi, the genes that
were initially suppressed in compatible interaction were later induced in the plants with
the dual infections. This suggested that the presence of Dvd-E6 in some way blocks Vd1
gene suppression; rather these genes were then up-regulated. Some of these genes encode
proteins that have antifungal properties or are enzymes leading to the production of plant
CHAPTER 4: Defense gene responses in mixed Verticillium infections of tomato
143
phenolics or phytoalexins that may target fungal spores and mycelia. This observation
may account for the reduced amounts of symptoms in the endophyte-protected plants.
The defense gene responses of Group 2 are similar to Group 1 in some respects. At
5 dpi, among the genes induced by Vd1 are some encoding transcription factors,
putatively involved in defense, such as NAM-proteins (Hu et al., 2006) and members of
the WRKY family (Ulker and Somssich, 2004). Other genes in this group are involved in
signaling pathways such as calmodulin (Takabatake et al., 2007) and the mitigation of
stress such as phytoene synthase (Buchanan et al., 2000). All these genes may have some
roles in protecting the plant but were later suppressed by Vd1, correlating with the
enhanced Vd1 colonization and increased symptom expression at 10 dpi. Similar to what
was observed in Group 1, Dvd-E6 also down-regulates symptom expression related
genes, such as the genes encoding peroxidase; a protein with free radical scavenging
property that plays vital roles in programmed cell death (PCD) (Grant and Loake, 2000).
Also, cytochrome P450 that is involved in the biosynthesis of the signaling molecule
(Chapple, 1998), jasmonic acid (Niki et al., 1998), as well as ethylene related genes such
as those encoding ethylene receptor and oxaloglutarate-dependent dioxygenase (Hamilton
et al., 1990), were all suppressed by Dvd-E6. One characteristic that distinguishes Groups
1 and 2 is the reduced ability of Dvd-E6 to induce Group 2 genes after preventing Vd1
gene suppression in the mixed interactions at 10 dpi. For example, the log2 ratios of 1,3
beta glucanase (Group 1) gene in the CS//Dvd-E6/Vd1 interaction is 6.0+1.5, while the
log2 ratio of phytoene synthase (Group 2) gene is 1.1+0.4. This observation may suggest
lesser roles of Group 2 genes in Dvd-E6-induced defense against V. dahliae pathogens

CHAPTER 4: Defense gene responses in mixed Verticillium infections of tomato
144
with respect to the Group 1 genes, although they may play more important roles in plant
development (Quirino et al., 2000).
A general overview of the Group 3 expression profile shows modest changes in all
the interactions at both time points. This may suggest that gene products in this group
also may play even lesser roles with respect to Group 2 in plant defense response against
V. dahliae in compatible and tolerant interactions. Possibly, they may play important
roles in incompatible interaction. One gene in this group encodes a cellulase membrane-
anchored protein; such proteins are mostly produced by fungi and bacteria that catalyze
hydrolysis of plant cell wall materials (Sampathnarayanan and Shanmugasundarami,
1970; Mehta and Mehta, 1985). Cellulase is also produced by plants but there have not
been any associated function in plant defence. Another protein in this group is
chaperonin; a protein complex that assists in folding of nascent cellular polypeptides and
may also have function in RNA metabolism (Briganti et al., 2000). Also, in this group is
the flavanol synthase gene family; that is involved in flavanol biosynthesis (Sies et al.,
2005). This group also includes genes encoding proteins that are involved in cellular
scaffolding, both tubulin and actin. Most of these genes were slightly induced by Vd1
and slightly suppressed by Dvd-E6 relative to unwounded control.
Group 4 was characterized by late induction by Dvd-E6 and is the only group that
was not suppressed by Vd1 at any time point. Probably, some of these genes may be
associated with pathogenesis in the susceptible response. In contrast, there was strong up-
regulation in the CS/Dvd-E6 interaction as well as the mixed CS/Dvd-E6+Vd1 and
CS/Dvd-E6//Vd1 interactions at 10 dpi. Genes in this group include Pti5, a PR
transcription activator; hydroquinone glycosyl transferase, a PR leaf protein precursor
CHAPTER 4: Defense gene responses in mixed Verticillium infections of tomato
145
that is ethylene induced and a F-box protein required for protein degradation. In the
tolerant interaction, there was a significant induction at 10 dpi.
The expression profiles in some of these groups correlate with the biology of
CS/Verticillium interactions. For example, at 5 dpi in Group 2, as the mRNA levels
progressively decreased from the CS/Vd1 interaction, to that of CS/Dvd-E6, so also the
disease scores decreased in the same direction (Figure 4-8). A similar observation applies
to the expression profile of Group 3 with the total amount of Verticillium biomass. The
profiles for gene expression and fungal biomass at 10 dpi were also similar for Group 4
genes. Whether these observations are directly related or not, will require a functional
approach to determine which genes may be involved in pathogen defense and/or
pathogenesis.
In the various groups, except for Group 4, the CS/Vd1 interaction is characterized
by gene suppression of host genes at 10 dpi, which may reflect its mode of pathogenicity.
A similar suppression of defense genes has been reported in several other plant
pathogens. In bacterial pathogens, there have been several reports of pathogen effector-
mediated suppression of host defense (Wise et al., 2007; Cohn and Martin, 2005; de
Torres et al., 2003; He et al., 2006; Navarro et al., 2004). For example, transcript
profiling revealed that Pseudomonas syringae pv tomato produces an effector that
suppresses a cell wall-based defense response that limit the growth of the pathogen in
Arabidopsis spp. (Hauck et al., 2003). Lee and coworkers have also reported a substantial
Verticillium-suppression of gene encoding PAL protein in compatible interaction (Lee et
al., 1992). Whether the gene suppression by Vd1 is achieved through the suppression of
CHAPTER 4: Defense gene responses in mixed Verticillium infections of tomato
146
various defense genes or a particular gene that regulates the activities of other genes is
not clear and may require further studies.
In the various groups, CS/Dvd-E6 interaction was characterized by suppression of
host genes, which correlates with reduced symptom expression, as also previously
reported by Robb and co-workers (Robb et al., 2007). The mechanism by which Dvd-E6
suppresses some defense genes is not clear, although the lack of symptoms in a tolerant
plant has been linked to suppression of a gene encoding 14-3-3 (Group 3 gene); a protein
which regulates a wide array of targets, including many transcription factors and
signaling proteins (Robb et al., 2007). One possible explanation for lack of Dvd-E6-
induced gene induction could be that the amounts of Dvd-E6 present in the xylem vessels
never reach a threshold to cause induction.
From the previous data, the defense gene response in the CS isoline, which lacks a
functional Ve1 resistance gene, indicated that the presence of Vd1 in the plant induced
some defense genes at 5 dpi, that were later suppressed at 10 dpi. Dvd-E6 was unable to
induce these genes, but the presence of DVd-E6 in mixed infections prevented Vd1- gene
suppression. These fascinating observations prompted us to examine what effects the
presence of the Ve1 resistance gene might have on the patterns of defense gene
expression. To investigate this, CR, an isoline that contains an active Ve1 gene was
inoculated with either/both Vd1 and Dvd-E6 to create the CR/Vd1, CR/Dvd-E6//Vd1 and
CR/Dvd-E6 interactions. Wounded and unwounded uninfected plants also were included
as controls.
Symptom expression scores and the amounts of fungal DNA were determined at
both 5 and 10 dpi (Figures 4-13 and 4-14). The results showed that Vd1-infected CS

CHAPTER 4: Defense gene responses in mixed Verticillium infections of tomato
147
plants were stunted, with both high levels of symptoms and amounts of fungus in the
plant, indicating an effective inoculation procedure in this experiment. The CR/Vd1
plants demonstrated the characteristics of a resistant interaction with both low levels of
symptoms and amounts of fungus in the plant stems at both sampling times. The presence
of the Ve genes enhanced the efficiency of the defence response reducing the amounts of
the pathogen in the stem (Heinz et al., 1998). At 5 dpi, there was no significant difference
in the level of symptoms among most of the interactions, except the CR/Dvd-E6//Vd1.
These observations correlate with the fact that both the susceptible and resistant cultivars
are initially colonized by Verticillium spp., but as a result of differences in the defence
responses in the stems, the former results in a compatible interaction while the latter
produces the resistant response (Pegg and Brady, 2002). Similarly, the CR/E6 plants
showed the characteristics of a tolerant interaction, with higher amounts of Verticillium
DNA and low levels of symptoms with respect to the CR/Vd1 interaction at both
sampling times, although plants were almost the same height as control plants in this
experiment. These observations are consistent with what were previously observed by
Chen and coworkers (Chen et al., 2004). Unlike in the CS/Dvd-E6/Vd1 interaction
(section 2.3.4), which showed an endophyte-induced protection, the results obtained for
this experiment were different. The CR/Dvd-E6//Vd1 plants were shorter than other
CR/Verticillium spp. plants, with somewhat higher symptom scores at both sampling
times. Interestingly, Vd1 was completely restricted from the CR plants at both 5 and 10
dpi.
The effect of the presence of the Ve1 allele on mRNA levels of defense genes was
also investigated. Extracts from CR/Vd1, as well as CR and CS control plants were made
CHAPTER 4: Defense gene responses in mixed Verticillium infections of tomato
148
and used for microarray hybridization. The log2 ratios indicated that in the CR/Vd1
interaction, almost all the defense genes in the various groups were not induced at both
sampling times. This observation suggested that the presence of the Ve1 allele in CR
tomato did not lead to gene induction by Vd1 infection as previously observed at 5 dpi in
Group 1 and 2 genes in the CS/Vd1 interaction. Also, the initial grouping of defense gene
responses established for the CS/Verticillium spp. interaction became not too relevant for
the CR/Verticillium spp. interactions. Surprisingly, the defense genes were not only not
induced, but some even appeared to be suppressed relative to uninoculated CR control
plants at both sampling times. Only a few genes showed small inductions. Some of these
include the Group 1 genes encoding proteins associated with antioxidant behaviour,
peroxidase (Grant and Loake, 2000) and acidic endochitinase precursor, which target
fungal cell wall (Kombrink and Sommssich, 1997). Also, there was some induction of a
few Group 3 genes including those encoding flavanol synthase, glycolate oxidase and
some unknown proteins. This may suggest important roles these proteins play in
incompatible interaction. The results for the CR microarray analyses suggested that
infected resistant plants were not characterized by super-induction of defense genes to
elicit a faster or more intense defense response. A possible explanation for this
observation could be that healthy CR plants normally have higher levels of defense gene
products than the CS plants.
To test this idea further, levels of mRNAs for the two isolines were compared by
microarray hybridization. The results (Table 4:7- 4:10) indicated that indeed the CR
isoline has higher basal mRNA levels for most of the defense genes which can be
attributed to the presence of Ve+ in CR isoline. This observation has been reported also by

CHAPTER 4: Defense gene responses in mixed Verticillium infections of tomato
149
Robb et al. (2009), where the basal level of mRNA was found to be higher in CR isoline
with respect to CS. Furthermore, there was a significant higher basal level of transcript
for some genes, notably important for defense in the CR with relative to CS tomato.
These genes include PR leaf protein 4, known to protect the plant during pathogen attack
(van Loon and van Strien, 1999), the precursor for endochitinase, that targets fungal cell
walls (Kombrink and Somssich, 1997), and also some unknown proteins. This
observation may indicate that the higher basal level of defense proteins in the CR isoline
give it an initial edge over CS in combating infection by Verticillium spp. explaining the
resistant nature in CR plants.
In summary, the results presented in this chapter are fascinating and indicate that
the presence of Vd1 in the CS plant induced some key defense genes at 5 dpi, that were
later suppressed by 10 dpi. Dvd-E6 was unable to induce these genes, but the presence of
DVd-E6 in mixed infections prevents Vd1- gene suppression; thus maintaining a high
level of transcript for these genes and their products that apparently selectively target
Vd1, hence restricting its colonization at 10 dpi. The mechanisms of Dvd-E6 or Vd1 gene
suppression as well as Vd1 gene induction are not yet clear. Also, the mechanism by
which Dvd-E6 blocks Vd1 defense gene suppression is unknown and requires further
experimentation. Further more, the presence of the Ve+ gene abolish the four groupings
previously established as many of the genes were not induced. During a Verticillium spp.
infection, there was a significant gene induction in the susceptible isoline in attempting to
combat the invading pathogens, although unsuccessful. However, in the CR isoline, the
basal level of defense gene products was apparently sufficient; perhaps giving CR plants
an initial advantage. While these results are exciting, further experiments will be required

CHAPTER 4: Defense gene responses in mixed Verticillium infections of tomato
150
to confirm these observations. Also, the effect of the Ve1 resistance allele on defense
gene responses in the other interactions should be examined and further comparisons
made of transcript levels in healthy control plants and at earlier time points.

CHAPTER 5: Altered defense gene expression by RNAi knockdown
151
CHAPTER 5: Altered Defense Gene Expression by RNAi Knockdown
5.1 Introduction
The results in Chapter 4 identified clusters of genes whose expression patterns
correlate with symptom expression (Group 2 defense genes), total amounts of V. dahliae
DNA (Group 3 defense genes) and amounts of V. dahliae, isolate Dvd-E6 (Group 4
defense genes), in the plant. Whether there is any direct relationship between individual
gene expression profiles and the observed phenotypes requires functional analyses.
Identifying specific genes that are directly associated with some of these phenotypes is
important to aid our understanding of Verticillium pathogenicity, resistance, tolerance
induction and Dvd-E6-induced protection in CS. More so, identifying genes whose
expression is associated with the phenotype may also allow development of bioassays for
susceptibility, resistance or tolerance. The results presented in Chapter 4 also indicated
that the higher basal levels of defence gene products in the CR isoline may be enough for
resistant responses. Confirmatory analyses will be the down-regulation of the Ve1+ gene
in the CR isoline, whether the defense gene responses will be similar to that observed
with the CS isoline. This chapter is an attempt to develop gene silencing tools to
determine the functional significance of specific genes identified in Chapter 4. An
ethanol inducible RNA silencing method will be used (for review on RNA silencing;
refer to section 1.5.3). Initially two genes, one encoding a putative receptor, the Ve2 gene
and, a defense response gene of unknown function, TUS15G8 were chosen as targets for
technology assimilation.
The Ve2 gene was chosen because of its putative role in defense against Vd1 and
Vaa. Unlike other herbaceous plants such as alfalfa and potato with multiple resistances,

CHAPTER 5: Altered defense gene expression by RNAi knockdown
152
resistance in tomato against Verticillium spp. has been considered monogenic (Beckman,
1987). More recently, Kawchuk and coworkers (2001) have shown that two inverted
genes, Ve1 and Ve2 independently can confer resistance to Vaa in potato (Kawchuk et al.,
2001), something which has not been verified in tomato. To begin to answer this
question, we have selected Ve2 as the first gene to target with our silencing studies. The
second gene selected for RNAi knockdown was TUS15G8, a gene encoding an unknown
protein which appears to be highly suppressed in the tolerant interaction (Robb et al.,
2007). In a previous study, Robb and coworkers used DNA chip analysis to investigate
expression patterns of defense genes in both tolerant and compatible interactions. The
study showed that, in a tolerant interaction, there was a 25.3 fold reduction in the
transcript level for TUS15G8 when compared to that observed in a susceptible reaction
(Robb et al., 2007). Functional analysis of such a gene could aid our understanding of the
tolerant interactions. In the course of the work described in this chapter, vectors for both
Ve2 and TUS15G8 gene knockouts were constructed and used to transform tomato
plants. Assays for the detection and expression of the transgenes were also developed and
used for preliminary trials, but this time did not permit a full characterization of actual
―knockdown‖.
5.2 Materials and methods
5.2.1 Ethanol inducible RNAi vector construction
The parent ethanol-inducible plasmids (pMW4 and pMW4-GUS) used for this
study were obtained from Dr. Eric Lam’s laboratory (Rutgers University, New Jersey,
USA). The plasmid pMW4 is an alcohol-inducible vector that was derived from the alc
regulon of Aspergillus nidulans that contains two components; the alcR gene and palcA

CHAPTER 5: Altered defense gene expression by RNAi knockdown
153
(Lo et al., 2005). It was constructed by removing the alcR coding region (a transcription
factor which is an ethanol sensor) from Aspergillus nidulans and cloning it into 103c-SK,
an overexpression vector under the 35S CaMV promoter and including the nopaline
synthase 3’-terminator (nos3’). The 35S-alcR-nos3’ fragment was then cloned into a
pCambia 1300 binary vector downstream of palcA. The hpRNA-encoding unit,
containing oppositely oriented recombination sequences of attP1 and attP2 and the
octopine synthase 3’ terminator (ocs3’), were removed from the pHellsgate2 vector and
inserted downstream of palcA as shown in Figure 5-1. The hpRNA construct of the target
gene can be generated in a single step recombination of the attB1 and attB2 sequences
(flanking the PCR product) with the attP1 and attP2 sites in pMW4 as shown in Figure
5-1 (Lo et al., 2005).

CHAPTER 5: Altered defense gene expression by RNAi knockdown
154
Figure 5-1: pMW4, an ethanol-inducible RNAi vector.
In pMW4, alcR is driven by the CaMV 35S promoter. The hpRNA-encoding unit derived
from pHellsgate2 with oppositely oriented recombination sequences (attP1-attP2) was
cloned downstream of the palcA promoter as described in section 5.2.1. To construct
pMW4TUS15G8, TUS15G8 PCR product with attB1 and attB2 flanking sequences was
inserted into pMW4 at the attP1 and attP2 sites. Through recombination, two new sites
(attL1 and attL2) were then generated in the vector and, attR1 and attR2 flanking the
ccdB (a bacterial lethal gene allowing positive selection of the desired construct)
fragment was excised from the vector. The intron and hygromycin resistance gene are
identified as I and Hyg respectively. Modified from Lo et al., 2005.
To make the alcohol inducible RNAi constructs, the targeted sequences were
amplified by PCR using tomato nuclei acid extract as a template. After three successive
rounds of PCR to amplify the gene and incorporate the attB1 and attB2 recombination
sequences, the amplified DNA was inserted into the pMW4 vector through an in vitro
recombination site reaction. The first PCR amplification was made using the gene
specific primers: A17 and antiA17 (for TUS15G8 fragment) or Ve2NP and aVe2NP (for
Ve2 fragment). Each of the PCR products was purified by phenol extraction and the
supernatants were removed, precipitated overnight with 2 volumes of salted ethanol and
CHAPTER 5: Altered defense gene expression by RNAi knockdown
155
dissolved in 1 ml of double distilled water. This was followed by another round of
amplification using the adaptor primers: A17GW and antiA17GW (for TUS15G8 PCR
fragment) or Ve2NPGW and Ve2NPGW (for Ve2 PCR fragment). Again, each of the
PCR products was purified as described above and dissolved in 1 ml of double distilled
water. The last round of amplification was performed with recombination primers
(attB1GW and attB2GW). The PCR products were again each purified as above and
dissolved in 50 l double distilled water. The primer names, sequences and annealing
temperatures used are summarized in Table 5-1. The PCR amplification was conducted
as described in section 2.2.4 with the exception of the annealing temperatures, which
were calculated for the specific primer sequences (Table 5-1). For in vitro recombination,
the recombination reaction mix, containing 50 ng of attB-PCR product, 150 ng of donor
vector pMW4 and 2 l BP Clonase II (Invitrogen, Carlsbad, CA, USA) enzyme, was
prepared and the reaction volume was brought to 10 l with TE buffer (pH 8.0). The
solution was mixed thoroughly by vortex and incubated at 25 oC for 1 hr. The reaction
was terminated by the addition of 1 l Proteinase K (2 g/ml) solution, mixed briefly by
vortex and incubated at 37 oC for 10 min.

CHAPTER 5: Altered defense gene expression by RNAi knockdown
156
Table 5-1: List of primers used for PCR amplifications for the construction and
characterization of TUS15G8 and Ve2 RNAi vectors
Note: nt, nucleotide
5.2.2 Agrobacterium-mediated tomato transformation
The in vitro recombinant DNA was used to transform E. coli DB3.1 cells using a
heat shock transformation method (Sambrook et al., 1989). Selection of positive clones
took advantage of the normally lethal ccdB gene contained in pMW4 and the kanamycin
selectable marker (Bernard, 1995). To confirm the insertion of gene fragments in
opposite orientations, plasmid minipreps were made (Sambrook et al., 1989) from the
two clones pMW4-TUS15G8 or pMW4-Ve2, for PCR amplification. Vector specific
primers (HGsite2 and antiHGsite1) were used together with gene specific primers: A17
for TUS15G8 (Figure 5-2; upper panel) or Ve2NP for Ve2 fragments (Figure 5-2; lower
panel) to detect recombinants by PCR amplification as described in section 2.2.4. To

CHAPTER 5: Altered defense gene expression by RNAi knockdown
157
further confirm the insertion of the gene fragment in the right orientation, minipreps also
were digested with XbaI or HindIII (Fermentas) restriction enzymes, corresponding to the
left and right gene insertion sites, respectively. The 20 l digestion mix contained 1 μg of
plasmid DNA, 2 μl of 10X reaction buffer (supplied with the enzyme) and 2 units of the
restriction endonuclease, XbaI or HindIII (Fermentas). The solution was mixed by vortex
and incubated at 37 oC overnight. The digested reaction products were characterized by
their electrophoretic mobilities on 1.5 % agarose gels as described in section 2.2.4. CsCl
purified maxiprep of the confirmed positive clones were prepared and stored for further
use.
Figure 5-2: Relative locations of PCR primers used to characterize the TUS15G8
and Ve2 RNAi constructs.
Note: The sequence of each primer is defined in Table 5-1.
Agrobacterium tumefaciens strain EHA105 that was used in this study contains
virulent pMOG410 and a rifampicin resistance gene (Hood et al., 1993) EHA105 was
transformed independently with the purified pMW4-TUS15G8 or pMW4-Ve2 plasmids
obtained from E. coli DB3.1 using a freeze‐thaw method (Holsters et al., 1978).

CHAPTER 5: Altered defense gene expression by RNAi knockdown
158
Competent cells were made by growing A. tumefaciens EHA105 in 2 ml YEP medium
(10g peptone, 10g yeast extract, 5g NaCl per liter). The overnight culture was transferred
into a 250 ml flask containing 50 ml of YEP medium and incubated in a shaker at 28 oC.
The absorbance at A600 nm was monitored until it reached a value between 0.5 and 1. The
growth of the culture was stopped by placing the culture flask on ice and the EHA105
cells were collected by centrifugation in a Beckman rotor JA‐20 at 3000x g for 5 min at
4oC. The cells were re-suspended in 1 ml of 20 mM CaCl2 and used for transformation.
For the transformation of competent A. tumefaciens EHA104, 1 μg of purified
pMW4-TUS15G8 or pMW4-Ve2 plasmid DNA was added to 100 μl of competent
EHA105 cells, mixed gently, submerged into liquid nitrogen for 20 sec and transferred
directly into a water bath at 37 oC for 5 min. 1 ml of preheated (at 28
oC) YEP was added
to the tube and incubated at 28 oC in a shaker at 100 rpm for 4 hours. The cells were
collected by centrifugation on a bench top microcentrifuge for 1 min at full speed and re-
suspended in 100 μl YEP medium. The transformed cells were spread on 20 ml YEP agar
(10 g peptone, 10 g yeast extract, 5 g NaCl, 15 % w/v agar) containing 50 μg/ml
kanamycin and 25 μg/ml rifampicin in Petri dishes and incubated at 28 oC for 48 hours.
Colonies were tested for incorporation of pMW4-TUS15G8 or pMW4-Ve2 by PCR and
restriction enzyme analysis as described above. Glycerol stocks of the confirmed positive
clones were made and stored at -80 oC for long term storage.
CS tomato was transformed with A. tumefaciens strain EHA105 containing the
pMW4-TUS15G8 RNAi construct using a method described by Fillatti and coworkers
(Fillatti et al., 1987) with minimal modifications (Chang, 2006). CS tomato seeds were
sterilized with 70 % ethanol for 2 min and then transferred to 5 % hypochlorite solution

CHAPTER 5: Altered defense gene expression by RNAi knockdown
159
for 20 min. The seeds were rinsed six successive times with sterile distilled water and
excess water was removed on a sterile filter paper. The sterile seeds were placed in
magenta boxes (Magenta, Sigma) (25 seeds/margenta box) containing 50 ml of medium
A (for media compositions, refer to Table 5-5) and incubated in a growth chamber at 25
oC with light conditions of 16 hr light and 8 hr darkness. After 8-10 days of incubation,
cotyledon explants were obtained from the germinated seedlings and a 5 mm by 5 mm
portion was cut from the middle of each cotyledon with a surgical blade and placed on
agar plates containing medium B (for media compositions, refer to Table 5-2). The plates
were sealed with parafilm and incubated at 25 oC for 24 hr for pre-cultivation.
Three days before the co-cultivation of explants, glycerol stock of A. tumefaciens strain
EH105 containing the RNAi constructs were streaked on YEP agar plates containing 25
μg/ml rifampicin and 50 μg/ml kanamycin and incubated at 28 oC for 24-48 hours. To
prepare the A. tumefaciens for plant transformation, a single colony from the plate was
used to inoculate 10 ml of YEP medium in a 12 ml blue cap tube containing 25 μg/ml
rifampicin and 50 μg/ml kanamycin and incubated at 28 oC overnight with gentle
shaking. Cells from the overnight A. tumefaciens culture were collected by centrifugation
at 4 oC with 5000 rpm and diluted with liquid MSO (for compositions, refer to Table 5-4)
to an absorbancy at 600 nm of 0.5-1.0. For tomato transformation, 10 ml of the diluted A.
tumefaciens suspension were poured onto the cotyledon explants in a Petri dish, covered
with aluminum foil and left for 20 min with occasional shaking. The excess A.
tumefaciens on the cotyledon explants was drained on filter papers and the cotyledons
were transferred onto plates containing medium B agar with 100 μM of acetosyringone.
The plates were covered with aluminum foil and co-cultivated in the dark at 25 oC for 24

CHAPTER 5: Altered defense gene expression by RNAi knockdown
160
hr. The cotyledon explants were then transferred onto plates containing medium C (for
media compositions, refer to Table 5-5), with 25mg/ml kanamycin and 150mg/ml of
timentin. To initiate calli, cotyledon explants were transferred to fresh medium C as
above, containing 25 mg/ml kanamycin and 150 mg/ml of timentin, twice a week. After
3-4 weeks, shoot-containing calli were cut off and transferred to medium D as in previous
page (for media compositions, refer to Table 5-5) for regeneration and selection. Calli
were transferred onto fresh medium weekly until shoots were about 2-3 cm long. The
shoots were cut off from the calli and transferred to medium E as on previous page (for
media compositions, refer to Table 5-5) in magenta boxes on a biweekly basis to allow
development of roots. When about 6 cm high, plantlets were transferred to pots with
moistened soil mix containing Promix BX (Premier Horticulture Ltee, Riviere-du-Loup,
Quebec, Canada), vermiculite and Turface MVP (Profile Products LLC, Buffalo Grove,
IL, USA) in a 3:2:1 ratio. Pots containing plantlets were placed on flats, wrapped with
plastic wrap to create a humidity chamber and placed in a controlled growth chamber
with 16 hr of light at 25 oC and 8 hr of darkness at 22
oC. Hoagland’s solution was
applied once a week as the plantlets were gradually acclimatized. After 3 weeks, the
transgenic plants were transferred into larger pots.
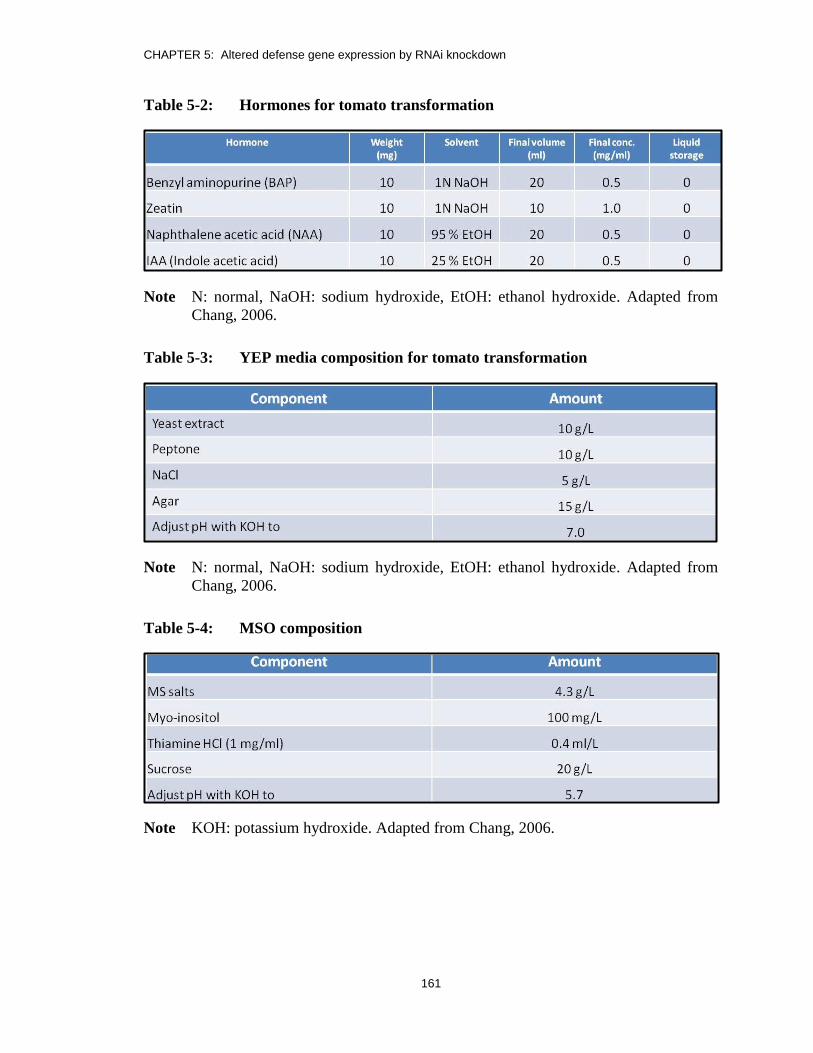
CHAPTER 5: Altered defense gene expression by RNAi knockdown
161
Table 5-2: Hormones for tomato transformation
Note N: normal, NaOH: sodium hydroxide, EtOH: ethanol hydroxide. Adapted from
Chang, 2006.
Table 5-3: YEP media composition for tomato transformation
Note N: normal, NaOH: sodium hydroxide, EtOH: ethanol hydroxide. Adapted from
Chang, 2006.
Table 5-4: MSO composition
Note KOH: potassium hydroxide. Adapted from Chang, 2006.

CHAPTER 5: Altered defense gene expression by RNAi knockdown
162
Table 5-5: Media for tomato transformation
Note NAA: naphthalene acetic acid, BAP: benzyl aminopurine, IAA: indole acetic
acid, KOH: potassium hydroxide. Adapted from Chang, 2006.
5.2.3 Assay for plasmid DNA
Transgenic tomato plants were selected on hygromycin. The presence of the
transgene was confirmed using a PCR-based assay. Total nucleic acid extracts were
prepared from 0.2 g leaf tissue as described in section 2.2.4. A 100 ng aliquot was used as
template for PCR amplification using vector-specific primers; HGsite2 and antiHGsite1
(Table 5-1). To confirm the insertion of the inverted genes, a transgene-specific primer
(A17) and HGsite2 primer were used for the left side insertion, while the right side was
confirmed with the gene specific primer (A17) and antiHGsite2 primer (see Figure 5-2
for relative primer locations).

CHAPTER 5: Altered defense gene expression by RNAi knockdown
163
5.2.4 Assay for plasmid-derived RNA
To determine the expression of the transgene, the RT-PCR-based plasmid-derived
RNA assay was applied. Four week old transgenic plants were ethanol induced by
treatment with 200 ml of 1 % ethanol solution (v/v) by root drenching. Leaf tissues were
collected from the transgenic plants before and after 24 hours of ethanol treatment. Total
nucleic acid extracts were prepared from the leaf samples as described in section 2.2.4.
For the RT-PCR assay, the RT reaction was performed as described in section 2.2.8 using
500 ng template and oligo (dT) primer. A separate RT reaction using the reverse gene
specific primer was also set up as a positive control. The PCR amplification step was
performed using the forward gene specific primer (A17) and antiHGsite1 (Figure 5-2).
Gene specific primers were used for the control PCR amplification step. All the RT-PCR
products were analyzed on agarose gels as described in section 2.2.4.
5.3 Results
5.3.1 Preparation of inducible RNAi knockdown vectors
To develop tools for future studies to investigate the significance of the genetic
differences observed in Chapter 4, an inducible RNAi-based silencing approach was
undertaken. Gene fragments for insertion in an ethanol inducible RNAi vector (–pMW4),
kindly provided by Dr. Eric Lam, were prepared by successive PCR amplification steps
as described in section 5.2.1. A three step approach was used in our laboratory to provide
a simple experimental method for generating the necessary extended recombination
sequences (GGG GAC AAG TTT GTA CAA AAA AGC AGG CT). The fragments were
inserted using the Hellsgate cloning system based on in vitro recombination and BP
clonase (BP Clonase II, Invitrogen, Carlsbad, CA, USA). For the pMW4-TUS15G8

CHAPTER 5: Altered defense gene expression by RNAi knockdown
164
construct, gene specific primers (A17 and antiA17) were used to amplify a 690 bp
fragment region of the gene (Figure 5-3a). For the pMW4-Ve2 construct, gene specific
primers (Ve2NP and aVe2NP) were used to amplify a 294 bp fragment region of the
gene. The PCR products were purified as described in section 5.2.1, and subjected to a
further PCR re-amplification step using adaptor primers: A17 GW and antiA17 GW (for
TUS15G8) or Ve2NPGW and aVe2NPGW (for Ve2), which are chimeric forward and
reverse primers each containing terminal TUS15G8 or Ve2 gene sequences and
recombination sequences (AGC AGG CT). This PCR step added 16 bp to the ends of the
first PCR product resulting in a fragment size of 706 and 310 bp, respectively, to the
TUS15G8 and Ve2 gene fragments (Figure 5-3). The PCR products were again purified
as described in section 5.2.1 and a third round of PCR amplification was repeated using
the recombination sequence primers; attB1GW and attB2GW, which resulted in a 748 or
352 bp fragment, respectively, for TUS15G8 and Ve2 (Figure 5-3). The three successive
PCR amplification reactions added 29 nt of recombination sequence to both ends of the
PCR product. The attB1-TUS15G8-attB2 or attB1-Ve2-attB2 PCR product was again
purified as described in section 5.2.1 and dissolved in 50 μl of double distilled water for
the recombination reaction.

CHAPTER 5: Altered defense gene expression by RNAi knockdown
165
Figure 5-3: Preparation of TUS15G8 and Ve2 partial gene fragments for RNAi
production.
Each insert was prepared by three successive PCR amplifications using: A) gene specific
primers, A17 and antiA17 for TUS15G8 fragment (upper panel) or Ve2NP and aVe2NP
for Ve2 fragment (lower panel); B) Adaptor primers, A17GW and antiA17GW for
TUS15G8 PCR product or Ve2NPGW and aVe2NPGW for Ve2 PCR product (lower
panel); C) Recombination sequence primers (attB1GW and attB2GW) for both
TUS15G8 (upper panel) and Ve2 (lower panel) as described in section 2.2.4. An aliquot
(10 l) of each reaction mix was fractionated on 2 % agarose gels. Lane Mk: Plasmid
pTZ19R digested with HinfI loaded as a size marker; lane 1: PCR amplification product;
and lane Nc: PCR control with no template.

CHAPTER 5: Altered defense gene expression by RNAi knockdown
166
For the recombination reaction, the purified PCR product was incubated with
pMW4 plasmid (Lo et al., 2004) and BP clonase (BP Clonase II, Invitrogen, Carlsbad,
CA, USA). The reaction involves the recombination of the attB1 and attB2 sequences
flanking the PCR product with the attP1 and attP2 sequences contained in pMW4 vector.
The recombination generated the final RNAi vector (containing the attL1 and attL2) and
a by-product (containing the attR1 and attR2), which included the ccdB sequence (a
bacterial lethal gene) that was excised from the donor vector permitting positive selection
of the desired clone (Figure 5-1). The recombination reaction facilitates the simultaneous
insertion of the TUS15G8 or Ve2 gene fragment in two opposite orientations. The
recombination reaction product was used to transform E. coli DB3.1. For pMW-
TUS15G8, a total of 28 clones were observed on the LB-kanamycin plates and 42 clones
for pMW4-Ve2. Nine and six of these clones were selected, respectively, for pMW4-
TUS15G8 and pMW4-Ve2 for miniprep plasmid DNA extraction and further analysis. To
confirm the insertions in two orientations, PCR amplification was used, targeting part of
the TUS15G8 or Ve2 gene sequences and a short fragment of the intron spacer separating
the two gene fragments (Figure 5-2) using miniprep plasmid DNA as a template. To
confirm the insertion of TUS15G8 gene in the left side of the hpRNA-encoding unit, a
gene specific primer (A17) was used as the forward primer for the TUS15G8 gene
fragment, or Ve2NP for the Ve2 gene fragment, and a vector-specific primer (HGsite2) as
the reverse primer for the PCR amplification. To confirm the insertion of the gene in the
right side of the hpRNA-encoding unit, a vector-specific primer (antiHGsite1) was used
as the forward primer and a gene specific primer (A17) for the TUS15G8 gene fragment
and Ve2NP for the Ve2 gene fragment, as reverse primer for PCR amplifications. These

CHAPTER 5: Altered defense gene expression by RNAi knockdown
167
amplifications generated recombination fragments (Figure 5-4) of 1.1 and 0.99 kb for
TUS15G8 or 0.7 and 0.59 kb for Ve2, respectively, for left and right side insertions. The
results summarized in Figure 5-4 show that two positive selected clones had the
TUS15G8 gene inserted on both the left and right sides of the hpRNA encoding unit for
TUS15G8, and three clones showed correct insertions for Ve2 gene.

CHAPTER 5: Altered defense gene expression by RNAi knockdown
168
Figure 5-4: Confirmation of TUS15G8 and Ve2 gene inserts by PCR
amplification.
Plasmid DNAs were isolated from nine selected transformed E. coli DB3.1 positive
clones of pMW4-TUS15G8 and six from pMW4-Ve2 and used as PCR templates. PCR
amplification was performed as described in section 2.2.5. PCR amplification to detect
the insertion of the: (upper panel A) TUS15G8; (lower panel, upper lane) Ve2 sequences
in the left side of the hpRNA-encoding unit and (upper panel B) TUS15G8; (lower panel,
lower lane) Ve2 in the right side of the hpRNA-encoding unit. Aliquots (10 μl) of each
PCR product were fractionated on 2 % agarose gels. Lane Mk: Plasmid pTZ19R digested
with HinfI, loaded as a size marker, lane 1-9: positive clones and lane Nc: PCR control
with no template.

CHAPTER 5: Altered defense gene expression by RNAi knockdown
169
To further confirm the insertion of the TUS15G8 gene fragment in opposite
orientations, restriction enzyme digestions also were performed. ―Miniprep‖ plasmid
DNA from 2 positive clones were digested with XbaI and HindIII endonucleases and
products were fractionated on 1.5 % agarose gel as shown in Figure 5-5. The results
confirmed the observation made in Figure 5-4; both selected clones contained the
TUS15G8 or Ve2 gene fragments in two orientations. One of these two clones was
selected for Agrobacterium transformation.
Figure 5-5: Restriction enzyme digestion of pMW4TUS15G8 constructs.
Plasmid DNAs were isolated from two positive clones and digested with restriction
enzymes; the digested products were fractionated on 1.5 % agarose gels. Left panel: XbaI
digests to detect the insertion of TUS15G8 gene in the left hand side of the hpRNA-
encoding unit. Right panel: HindIII digest to detect the insertion of TUS15G8 gene in the
right hand side of the hpRNA-encoding unit. Lane Mk: Plasmid pTZ19R digested with
HinfI, loaded as a size marker, lane Pc: digested pMW4 positive control; lanes 1-2:
digested pMW4-TUS15G8 clones; lane Uc: undigested pMW4TUS15G8 control.
5.3.2 Preparation of transgenic plants
To insert the hpRNA-encoding unit into the tomato genome, the A. tumefaciens
strain EHA105 binary system was used in preference to LB4404 because of its more
virulent nature (Hood et al., 1993). Plasmid DNA was isolated from a selected positive E.

CHAPTER 5: Altered defense gene expression by RNAi knockdown
170
coli DB3.1 clone and used to transform A. tumefaciens strain EHA105 as described in
section 5.2.2. A total of 68 clones for pMW4-TUS15G8 and 79 clones for pMW4-Ve2
were obtained from this transformation. Four clones each were selected and tested for the
insertion of TUS15G8 or Ve2 gene fragments as described in section 5.3.1. The four
clones selected contained TUS15G8 or Ve2 gene fragments in two orientations as shown
in Figure 5-6.
Figure 5-6: Screening transformed A. tumefaciens EH105 for pMW4-TUS15G8
DNA.
Positive clones of A. tumefaciens were selected on a YEP agar plate containing
kanamycin and streptomycin. Plasmid DNA was isolated from each clone and used for
PCR amplification with one gene specific primer (A17) for TUS15G8 and (Ve2NP) for
Ve2 and each of plasmid specific primers, HGsite2 (upper panel) and anti HGsite1 (lower
panel) as shown in Figure 5-2. The PCR amplifications were conducted as described in
section 2.2.4. A 10 l aliquot of each reaction mix was loaded and fractionated on a 2 %
agarose gels for (left panel) pWW-TUS15G8 and (right panel) pMW4-Ve2. Lane Mk:
Plasmid pTZ19R digested with HinfI loaded as a size marker; lane Nc: PCR control
without template; lanes 1-4: PCR amplification products.
Clone 1 containing the pMW4-TUS15G8 construct was used to transform CS
tomato plants as follows. Fifty sterilized CS seeds were germinated on medium A in

CHAPTER 5: Altered defense gene expression by RNAi knockdown
171
magenta boxes (Figure 5-7A). The cotyledons obtained were co-cultivated with EH105
for 24 hours. The cotyledon explants were then transferred to medium B containing 25
mg/ml hygromycin as a selective marker (Figure 5-7B). The swollen explants were
transferred into fresh medium twice a week until calli formation (Figure 5-7C). After 3-4
weeks, the calli produced shoots which were transferred to new medium to allow shoot
elongation (Figure 5-7D). To induce root formation, 2-3 cm tall shoots were transferred
to magenta boxes containing medium D with a reduced amount (10 mg/ml concentration)
of hygromycin (Figure 5-7E). Four actual transformed plants were obtained. After 6
weeks in magenta boxes (Figure 5-7F), the plantlets were transplanted onto soil and
acclimatized to growth chamber conditions (Figure 5-7G) as described in section 5.2.2.
The transformed plants were maintained till the fruiting stage (Figure 5-7I) and seeds
were collected for storage and further experiments.
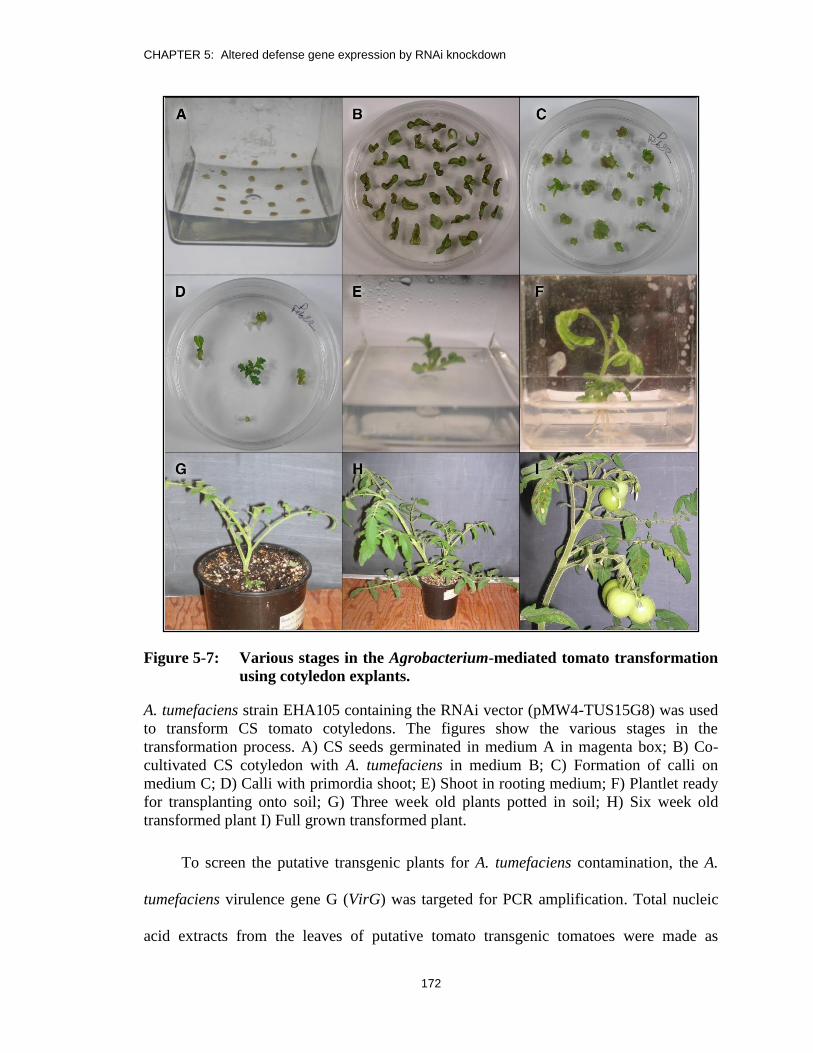
CHAPTER 5: Altered defense gene expression by RNAi knockdown
172
Figure 5-7: Various stages in the Agrobacterium-mediated tomato transformation
using cotyledon explants.
A. tumefaciens strain EHA105 containing the RNAi vector (pMW4-TUS15G8) was used
to transform CS tomato cotyledons. The figures show the various stages in the
transformation process. A) CS seeds germinated in medium A in magenta box; B) Co-
cultivated CS cotyledon with A. tumefaciens in medium B; C) Formation of calli on
medium C; D) Calli with primordia shoot; E) Shoot in rooting medium; F) Plantlet ready
for transplanting onto soil; G) Three week old plants potted in soil; H) Six week old
transformed plant I) Full grown transformed plant.
To screen the putative transgenic plants for A. tumefaciens contamination, the A.
tumefaciens virulence gene G (VirG) was targeted for PCR amplification. Total nucleic
acid extracts from the leaves of putative tomato transgenic tomatoes were made as

CHAPTER 5: Altered defense gene expression by RNAi knockdown
173
described in section 2.2.4 for use in the assays and purified plasmid from A. tumefaciens
strain EHA105 was used as a positive control for the PCR-based assay. As observed in
Figure 5-8, there was no bacterial contamination detected in any of the putative
transgenic plants under conditions which permitted the detection of genome-associated
plasmid sequence (Figure 5-9).
Figure 5-8: PCR-based assays for contamination by A. tumefaciens in transformed
tomato.
Total nucleic acid was isolated from the leaf of three week old putative transgenic plants
and used for PCR amplification as described in section 2.2.4 with a primer set that
targeted the A. tumefaciens virulence gene, VirG. A 10 l aliquot of each reaction mix
was fractionated on a 2 % agarose gel. Lane Mk) Plasmid pTZ19R digested with HinfI
loaded as a size marker; lane Pc) PCR positive control; lanes 1-4) expected PCR
amplification products of putative transgenic plants and lane; Nc) PCR control without
template.
5.3.3 Detection of plasmid DNA in transformed tomato
The putative transgenic plants also were examined for the presence of the RNAi
transgene using a PCR-based assay. Nucleic acid extracts were prepared from leaves of
transgenic plants and PCR amplifications, specific for the left and right inserts, were
performed as described in section 5.3.2. A positive control using the pMW4-TUS15G8

CHAPTER 5: Altered defense gene expression by RNAi knockdown
174
plasmid itself was included. The PCR amplified products were fractionated on an agarose
gel as described in section 2.2.4. The results (Figure 5-9) showed that three of the four
tomato transformants were true transgenic plants while one appeared to be a false
positive.
Figure 5-9: Assay for pMW4TUS15G8 DNA in transgenic tomato
Nucleic acid extracts from leaves of transgenic plants were used for PCR amplifications
as described in section 2.2.4. Upper gel: PCR amplification to detect the insertion of
TUS15G8 gene in the left hand side of the hpRNA-encoding unit. Lower gel: PCR
amplification to detect the insertion of TUS15G8 gene in the right hand side of the
hpRNA-encoding unit. Aliquot (15 l) of each reaction mix were fractionated on 2 %
agarose gel. Lane Sm) Plasmid pTZ19R digested with HinfI loaded as a size marker; lane
Pc) PCR positive control; lanes 1-4) PCR amplification products of putative transgenic
plants and lane Nc) PCR negative control.
5.3.4 Induction of RNAi in transformed tomato
To test for ethanol-inducible transgene expression and also to measure changes in
expression level of the endogenous TUS15G8 gene following RNAi knockdown, RT-
PCR assays were performed on the three confirmed transgenic plants. Since the
expression of the TUS15G8 RNAi was ethanol-inducible, the plants were assayed before
and after ethanol induction as described in section 5.2.4. For the expression assay, total

CHAPTER 5: Altered defense gene expression by RNAi knockdown
175
nucleic acid from leaf tissue was prepared before and 24 hour after ethanol induction.
The two RT-PCR assays that were performed are described in section 2.2.5. The first was
designed to detect the expression of the transgene, while the second would detect changes
in the level of the expression of endogenous TUS15G8 gene following RNAi
knockdown. The RT reaction was performed on the three confirmed transgenic plants
using an oligo (dT) primer as described in section 2.2.4. For the plasmid-derived
transcript, the A17 and antiHGsite1 primers were used. To determine the endogenous
TUS15G8 gene transcripts, the PCR amplification step was performed using the A17 and
antiA17 primers (Figure 5-2). Figure 5-10 shows the results obtained for these assays. As
observed in Figure 5-10A, no expression of the transgene was detected in any of the three
transgenic tomato plants before or after ethanol induction. Similarly, as shown in Figure
5-10B, there was no significant change in the level of the endogenous TUS15G8 mRNA
before or after ethanol induction.
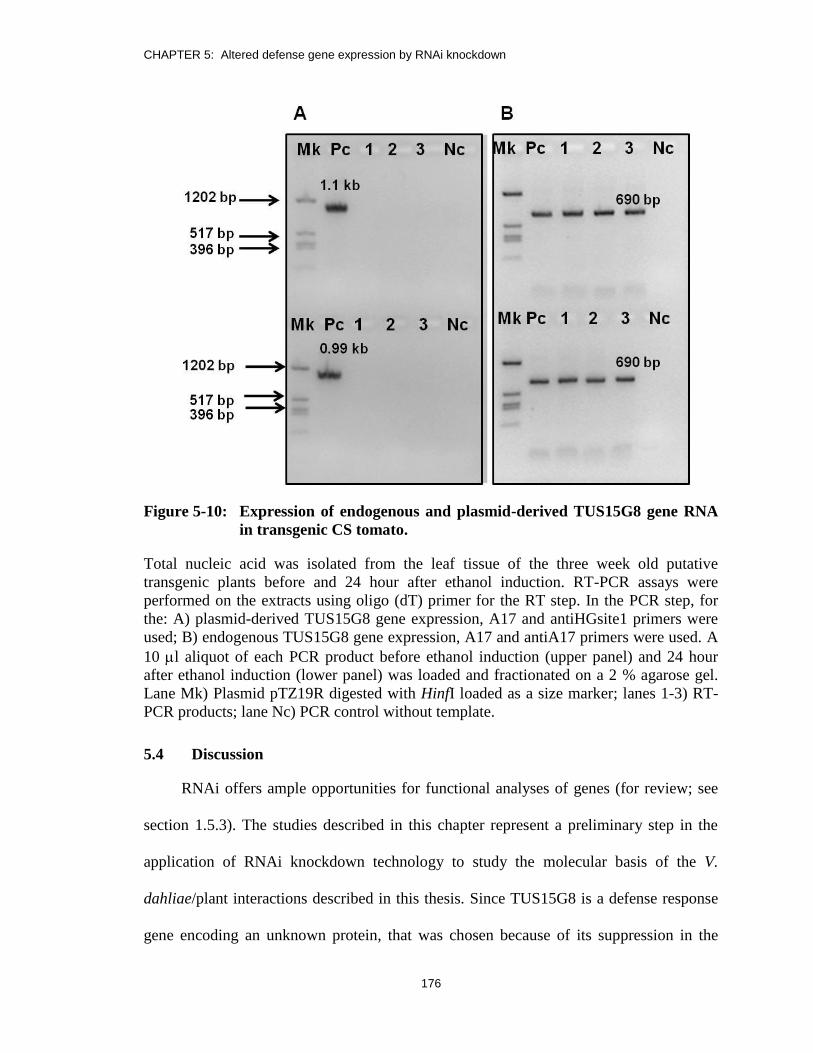
CHAPTER 5: Altered defense gene expression by RNAi knockdown
176
Figure 5-10: Expression of endogenous and plasmid-derived TUS15G8 gene RNA
in transgenic CS tomato.
Total nucleic acid was isolated from the leaf tissue of the three week old putative
transgenic plants before and 24 hour after ethanol induction. RT-PCR assays were
performed on the extracts using oligo (dT) primer for the RT step. In the PCR step, for
the: A) plasmid-derived TUS15G8 gene expression, A17 and antiHGsite1 primers were
used; B) endogenous TUS15G8 gene expression, A17 and antiA17 primers were used. A
10 l aliquot of each PCR product before ethanol induction (upper panel) and 24 hour
after ethanol induction (lower panel) was loaded and fractionated on a 2 % agarose gel.
Lane Mk) Plasmid pTZ19R digested with HinfI loaded as a size marker; lanes 1-3) RT-
PCR products; lane Nc) PCR control without template.
5.4 Discussion
RNAi offers ample opportunities for functional analyses of genes (for review; see
section 1.5.3). The studies described in this chapter represent a preliminary step in the
application of RNAi knockdown technology to study the molecular basis of the V.
dahliae/plant interactions described in this thesis. Since TUS15G8 is a defense response
gene encoding an unknown protein, that was chosen because of its suppression in the

CHAPTER 5: Altered defense gene expression by RNAi knockdown
177
tolerant interaction, the use of an inducible system (Caddick et al., 1998; Salter et al.,
1998) was most appropriate for this type of study. This system will allow the flexibility
of switching on and off, the expression of the target gene to investigate the possible
reversal of phenotype (for review on ethanol inducible system, refer to section 1.5.3).
The study in this chapter employed a recombination strategy to insert a TUS15G8
or a Ve2 gene fragment into the parent vector, pMW4, to form the RNAi vectors. The
strategy took advantage of the ccdB lethal gene for selection of positive clones. In an
initial trial, CS tomatoes were transformed with A. tumefaciens EHA105 containing the
inducible RNAi construct, pMW4-TUS15G8. The transformation efficiency was very
low; only three putative transgenic plants, free of A. tumefaciens contamination, were
obtained from around eighty cotyledons, and analyzed for the presence and expression of
the transgene. The type, concentration, time of application of the inducing molecule and
the spatial distribution of induced activity of the transgene in tomato had been previously
investigated (Garoosi et al., 2005). In a dose-response study, Garoosi and coworkers
(2005) found that, in transgenic plants expressing the CAT and GUS transgenes, optimal
induction of expression was observed with the use of 0.1 % (v/v) ethanol. Similarly, in
time course studies of transgenic tomato plants expressing the GUS gene, the optimal
induction period after ethanol application was 24 hr (Lo et al., 2005). In this chapter,
transgene expression was induced by root drenching the three transgenic plants with 0.1
% (v/v) ethanol. Nucleic acid extracts from leaves (three week old plants) were prepared
before and 24 hr after induction and, the RT-PCR assays were performed to determine
the expression of the transgene. No expression was detected either before or 24 hour after
induction (Figure 5-10A). This result was further confirmed by investigating the down-
CHAPTER 5: Altered defense gene expression by RNAi knockdown
178
regulation of the endogenous TUS15G8 gene with a similar RT-PCR assay. The
expression of the endogenous TUS15G8 gene was detected in all the transgenic plants
(Figure 5-10B), with no differences in the level of expression between induced and non-
induced treatments, indicating that the gene was not down-regulated.
There have been several studies to explain the non expression of transgenes in
transgenic plants. In some studies, gene silencing effects have been attributed to specific
sequence duplication (Scheid et al., 1998; Meyer, 1996; Flavell, 1994; Assaad et al.,
1993) while, in other studies, positional effect (Reuter et al., 1990; Dean et al., 1988;
Hagernann and Snoad, 1971) was given as the reason. In Craigella tomato, it has been
demonstrated that the non-expression of the transgene may be accounted for by an active
silencing mechanism (Chang, 2006; Chang et al., 2009). Chang and coworkers showed
that the expression of a GUS reporter sequence under the PAL5 promoter was only
detected in two of 28 transformants selected from two experiments. The findings also
implicated DNA methylation as the probable cause of the gene silencing. A similar
observation was made by Juarez Ayala in silencing the tomato Ve genes (Juarez Ayala,
2008).
CHAPTER 6: General conclusions
179
CHAPTER 6: General Conclusions
6.1 Conclusions
When Verticillium spp. infect CS tomato, three types of interactions;
susceptibility, resistance or tolerance are possible. Previous studies in our laboratory have
found an isolate of V. dahliae from eggplant, Dvd-E6 that can induce the tolerant state in
CS or CR tomatoes. A tolerant interaction is characterized by high amounts of growth of
the fungus and a low level of symptoms. The plants are more robust and taller than
uninfected control plants of the same physiological stage. In these respects, isolate Dvd-
E6 resembles an endophyte. One of the notable characteristics of an endophyte is the
ability to protect the host plant against a virulent pathogen. There are lots of fundamental
questions associated with plant disease tolerance. Why does Dvd-E6; a pathogenic isolate
on eggplant, induce a tolerant state in Craigella susceptible (CS) tomato? What accounts
for the increased height in a tolerant plant? Why does a plant heavily colonized by Dvd-
E6, show fewer symptoms? Can tolerance be used to protect a host plant against virulent
pathogens? What mechanism may underlie this protection? An understanding of these
fascinating biological questions could increase our knowledge of tolerance as a plant
defense strategy.
This Ph.D. thesis research was undertaken towards seeking a better understanding
of the cellular and molecular basis of plant disease tolerance in tomato and, in particular,
its protective strategy. A previously studied Craigella/Dvd-E6 interaction was used as a
tolerance model. To study mixed infections of Vd1 and Dvd-E6, a PCR/RFLP based
assay was developed to differentiate and quantify both isolates. To investigate the
endophytic property of Dvd-E6 in protecting tomato against virulent Verticillium spp.,

CHAPTER 6: General conclusions
180
the assay was used for exploratory studies, as described in chapter 2. The results showed
that Dvd-E6 protected CS plants from virulent Vd1 with a significant reduction in
symptom level, and plants were taller than the uninfected control. More so, this
observation correlated with the ability of Dvd-E6 to restrict Vd1 colonization in both the
stem and root, when Dvd-E6 was inoculated first (Dvd-E6/Vd1) or simultaneously with
(Dvd-E6+Vd1) Vd1. A preliminary effort was made to investigate the mechanism that
might be involved in restricted Vd1 colonization. The ability of both isolates to grow
together in culture plates was tested. Since the morphology of the two isolates is
different, it allowed the differentiation of colonies from individual isolates on plates. The
results obtained for diameter and numbers of colonies were the same for both isolates,
indicating that the endophyte induced protection observed in tomato probably did not
result from Dvd-E6 outgrowing or inhibiting Vd1.
Global gene expression analyses using microarray hybridization and confirmed by
RT-PCR assay indicated that some defense genes were induced at higher levels in a
tolerant interaction with respect to a compatible interaction at 10 dpi, which suggested
that a molecular interplay between Dvd-E6 and the tomato host may result in the
differential restriction of Vd1 colonization. The microarray data also showed that Dvd-E6
up-regulated some photosynthetic genes with respect to control plants, which may
account for the increased height of a tolerant plant. Other alternatives for the increased
plant height may include the down-regulation of genes involved in ethylene biosynthesis,
such as ACC oxidase, since the level of ethylene production has a negative correlation
with plant height (Buchanan et al., 2000); increased ethylene production in plants
resulted in reduced plant height (Hiraki and Ota, 1975). Also, the effect of bZIP
CHAPTER 6: General conclusions
181
transcription factor on the genes involved in the biosynthesis of the plant growth
hormone, gibberellin, which has a positive correlation with plant height (Richards et al.,
2001). Other work presented in Chapter 2 investigated whether the protective effect
would also restrict Vaa colonization; however, this seemed not to be the case as the
CS//E6/Vaa plants had high levels of both symptoms and fungal DNA, comparable to the
CS/Vaa interaction. This observation suggested that Dvd-E6 protection in tomato is range
restricted.
Chapter 3 examined the biological mechanism that may underlie the protective
strategy. Previous studies have shown that the virulence of a pathogen depends on its
ability to sporulate in the host plant (Schnathorst, 1981); the more spores are produced,
the more these spores spread, germinate and colonize the xylem vessels of the plant
leading to symptom expression. Based on this observation, an approach to collect and
separate fungal spores was developed and used to compare Vd1 and Dvd-E6 spore and
mycelia levels in the various interactions: CS/Vd1, CS//Vd1/Dvd-E6, CS//Dvd-E6/Vd1
and CS/Dvd-E6. The results suggested that Dvd-E6 has a mycelial lifestyle producing
few viable spores whether alone or in mixed infections. Conversely, Vd1 produced many
spores when present alone in the plant and this may account for its increased virulence
over Dvd-E6. However, the Vd1 and Dvd-E6 spore/mycelia ratios remained the same in
the mixed infection interactions in spite of a significant reduction in the amounts of Vd1
biomass, suggesting that the endophyte induced protection in tomato probably affects
both Vd1 spores and mycelia.
Chapter 4 further examined the question whether there is interplay between Dvd-
E6 and the plant and, if so, what genes may be involved that could account for protection.
CHAPTER 6: General conclusions
182
Both microarray, as well as, RT-PCR assay were used to examine gene expression in
various Craigella/Verticillium interactions. The results obtained from the scatter plots
indicated that tomato responds differently to the presence of the two isolates when
present either alone or in mixed infections. Profile analyses revealed that the defense
gene responses to V. dahliae may be characterized by four expression profiles. Vd1 was
able to induce many defense genes at 5 dpi followed by suppression at 10 dpi, which may
account for the substantial level of Vd1 colonization in susceptible plants at 10 dpi.
Conversely, Dvd-E6 infection suppressed other defense genes, notably the ones related to
disease expression; this may also account for the low level of symptoms observed in a
tolerant interaction, as previously reported (Robb et al., 2007). However, Dvd-E6 also
induced a limited number of Group 4 genes at a later time point. The overall results
suggested that endophyte induced protection in tomato was brought about by Dvd-E6 in
compromising the ability of Vd1 to suppress defense genes; hence, these genes which
include; the PR-2, PR-3, PR-5, PR-10, PR-6 families of proteins as well as peroxidase
(PR 9) and genes involved in signal transduction such as MAPK remained induced.
These genes have been reported to play important roles in defense responses (Castroverde
et al., 2009). The presence of these gene products may alter the vascular environment to
inhibit Vd1 sporulation, conidial germination and growth of mycelia in mixed infections,
as suggested in Chapter 3. The microarray data also indicated similarities between
expression profiles between: Group 2 genes and disease scores at 5 dpi, Group 3 genes
and total amounts of V. dahliae biomass as well as Group 3 genes and amount of Dvd-E6.
The significance and actual relationship between the expression profiles and the observed
phenotypes require functional analyses to identify key target genes which may be critical

CHAPTER 6: General conclusions
183
to defence or pathogenesis and may be useful in developing bioassays for susceptibility,
resistance or tolerance.
The results presented in Chapter 4 also examined the effect of the presence of the
Ve1+ allele on the defense gene responses. CR isolines were infected with Vd1 and
mRNA levels were compared relative to CR controls by microarray analyses. The
biological results obtained showed that the presence of the Ve1+ resistance gene resulted
in drastic restriction of Vd1 colonization and in the presence of Dvd-E6 in mixed
infection, Vd1 was completely eliminated from the plant stem. Unlike in the CS
microarray results, where the presence of Vd1 in the compatible interaction led to
induction of defense genes at 5 dpi, the CR results indicated that most of the genes were
not induced at both sampling times. This observation suggested that the level of defense
gene products may be higher in healthy CR plants than CS. This idea was further tested
by comparing the basal mRNA levels of CR and CS isolines. The results obtained
indicated that the basal level of defense proteins present in CR plants was higher and the
results suggest the basal level may be sufficient for the defense response.
To obtain a better idea of function of the various defense genes examined in
Chapter 4, a preliminary step to develop inducible RNAi silencing vectors was
undertaken. The Ve2 gene that encodes a putative receptor and a gene for an unknown
protein, TUS15G8, were chosen for this purpose. Results in Chapter 5 showed a
successful construction of ethanol inducible RNAi vectors; pMW4-TUS15G8 and
pMW4-Ve2. An attempt was made also to use the pMW4-TUS15G8 vector for an
Agrobacterium-mediated tomato transformation. Four putative transformed plants were
generated but only three of them contained the transgene. None of these plants were

CHAPTER 6: General conclusions
184
expressing the RNAi knockdown, since the level of mRNA of the transgene was not
detected and also expression of the endogenous genes remained unchanged before and
after ethanol induction.
From the results of this thesis work, future considerations may include
optimization of the Agrobacterium-mediated tomato transformation protocol, since the
efficiency of regeneration was low in these studies. This will enable the regeneration of
more transgenic plants that could allow functional analyses to be made more effectively.
The expression assay for testing the induction of transgene also needs to be standardized.
Once this assay is established, it will allow specific biological investigations to be made
which may include the nature of the biochemical compounds involved in targeting Vd1
spores and inhibiting mycelial growth in mixed infections, as suggested in Chapter 3.
Also, it may be used to confirm the effect of the Ve1+ allele in CS as well as determine
the roles TUS15G8 and other key defense genes of interest, whose mRNA levels in the
various interactions suggested important roles in tolerance and endophyte-induced
protection. Understanding the mechanism by which Dvd-E6 prevents Vd1 gene
suppression, as suggested in chapter 4, could lead to a better understanding of
Verticillium pathogenesis.
6.2 Agricultural potentials
Resistance to Vd1 has been linked to Ve resistance alleles; but these alleles do not
confer resistance to V. dahliae race 2. More so, there are other agriculturally important
plants such as potato where resistance genes against Verticillium pathogens have not been
found. This thesis work raises some important observations about plant disease tolerance
that could have potential agricultural significance. The results obtained showed that Dvd-

CHAPTER 6: General conclusions
185
E6-induced tolerance can protect CS tomato against virulent Vd1 by blocking its ability
to suppress defense genes in mixed interactions, leading to the up-regulation of the genes
that play important roles in plant defense. The Dvd-E6-induced tolerance was suggested
to involve a molecular interplay between Dvd-E6 and the plant, not Dvd-E6 physically
restricting Vd1 colonization. Therefore, understanding the mechanisms by which Dvd-E6
blocks Vd1 gene suppression can aid our knowledge towards the development of plants
capable of mimicking Dvd-E6 induced tolerance, even without the presence of either
Dvd-E6 or the resistance gene, thereby protecting susceptible plants against Verticillium
pathogens. This initiative can also be extended to other plants where there is no known
resistance gene against Verticillium infections. Furthermore, identification of some key
defense genes whose expression profiles correlate with symptom development or the
amount of Verticillium DNA as suggested in Chapter 4 can lead to the development of
biomarkers for susceptibility, resistance or tolerance.
CHAPTER 6: General conclusions
186
6.3 Further technological advances
Proteomic studies: The results in Chapter 4 suggested different mRNA levels of defense
genes in response to V. dahliae infections. Since the level of mRNA may not correlate
with the actual translated protein, proteomic studies can be undertaken to investigate
whether the expression of some of these defense genes correlate with the actual amount
of proteins. The results from this type of study can be a guide in choosing genes for
functional analysis. This also may increase our understanding of pathogenesis of
Verticillium spp. and other vascular pathogens as well as of plant defence responses.
Cytological studies: Plant resistance to Verticillium spp. attack is characterized by both
biochemical and structural defense responses. The vascular coating response is one of the
mechanisms proposed in Chapter 3 for endophyte induced protection. Cytological studies
to measure coating initiation, coating suppression and fungal escape (Chen et al., 2004)
in all the various interactions may also provide insights into the nature of possible
structural defense strategy involved in the endophyte-induced protection.
In summary, collectively, the results in this thesis work show that Dvd-E6
behaves as an endophyte and also protects tomato against pathogenic Vd1, but not Vaa. A
molecular interplay between CS tomato and Dvd-E6 results in restricting Vd1
colonization from the plant, leading to reduction in symptom expression level. The
pathogenesis of Vd1 may partly involve defence gene suppression, which was blocked by
Dvd-E6 in mixed interactions. The induction of genes in such mixed interactions may
alter the vascular environment that selectively target Vd1 spores and inhibit mycelial
growth. This may account for the reduced level of symptom expression observed in the
endophyte-induced protection in CS tomato. The presence of the Ve1+ allele in the CR

CHAPTER 6: General conclusions
187
isoline restricted Vd1 colonization and resulted in basal levels of defense gene proteins
which is sufficient for defense response. Whether the observations in this thesis are true
also for other fungal endophyte/host interactions will require further studies. In the
interim, unlike several studies which have focused mainly on compatible or/and
incompatible interactions, this thesis work is a contribution towards increasing our
understanding of tolerance to Verticillium dahliae with respect to its protective
mechanism in tomato.

BIBLIOGRAPHY
188
BIBLIOGRAPHY
Abeyrathne, P. D. and Nazar, R. N. (2000). Plasmid-enhanced strategy for PCR-mediated
mutagenesis with difficult DNA templates. Bio-Techniques, 29: 1172–1174.
Agrios, G. N. (2005). Plant Pathology. 5th
ed. Burlington, USA: Elsevier Academic
Press.
Alba, R., Fei, Z., Payton, P., Liu, J. M., Moore, S. L., Debbie, P., Cohn, J., D'Ascenzo,
M., Gordon, J. S., Rose, J. K., Martin, G., Tanksley, S. D., Bouzayen, M., Jahn,
M., and Giovannoni, J. (2004). EST's, cDNA microarrays, and gene expression
profiling: tools for dissecting plant physiology and development. Plant Journal ,
39: 697-714.
Alexander, S. J. and Hall, R. (1974). Verticillium wilt of chrysanthemum: anatomical
observations on colonisation of roots, stems and leaves. Canadian Journal of
Botany, 52: 783-789.
Amdam, G. V., Simões, Z. L., Guidugli, . K. R., Norberg, K., and Omholt, S. W. (2003).
Disruption of vitellogenin gene function in adult honeybees by intraabdominal
injection of double-stranded RNA. BMC Biotechnology, 3: 1-8.
An, G., Watson, B. D., and Chiang, C. C. (1986). Transformation of Tobacco, Tomato,
Potato, and Arabidopsis thaliana Using a Binary Ti Vector System'. Plant
Physiology, 81: 301-305.
Aoyama, T. and Chua, N. H. (1997). A glucocorticoid-mediated transcriptional induction
system in transgenic plants. The Plant Journal , 11: 605–612.
Apostol, I., Low, P. S., Heinstein, P., Stipanovic, R. D., and Altman, D. W. (1987).
Inhibition of elicitor-induced phytoalexin formation in cotton and soybean cells
by citrate. Plant Physiol., 84: 1276-1280.
Arumuganathan, K. and Earle, E. D. (1991). Nuclear DNA content, of some important
plant species. Plant Mol. Biol. Rep., 9: 208–219.
Assaad, F. F., Tucker, K. L., and Singer, E. R. (1993). Epigenetic repeat-induced gene
silencing (RIGS) in Arabidopsis. Plant Mol. Biol. , 22: 1067-1085.
Bagasra, O. and Amjad, M. (2000). Protection against Retroviruses are owing to a
different form of immunity: A RNA- Based Molecular Immunity hypothesis. Appl
Immunochem Mol Morphol., 8: 133–146.
Bagasra, O. and Prilliman, K. R. (2004). RNA interference: The molecular immune
system. Journal of Molecular Histology, 35: 545–553.
Barbara, . D. J. and Clewes, E. (2003). Plant pathogenic Verticillium species: how many
of them are there? Mol. Plant Pathol., 4: 297-305.
BIBLIOGRAPHY
189
Barrow, J. P. (1970). Critical requirements for genetic expression of Verticillium wilt
tolerance in Acala cotton. Phytopathology, 60: 559-560.
Bashi, E. and Rotem, J. (1975). Host and biotic factors affecting sporulation of
Stemphylium botryosum f. sp. lycopersici on tomatoes and Alternaria porri f. sp.
solani on potatoes. Phytoparasitica, 3: 27-38.
Bass, B. L. (2000). Double-stranded RNA as a template for gene silencing. Cell, 101:
235–238.
Baulcombe, D. C. (1996). RNA as a target and an initiator of post-transcriptional gene
silencing in trangenic plants. Plant Molecular Biology, 32: 79-88.
Beckman, C. H. (1987). The Nature of Wilt Diseases of Plant. St. Paul, Minnesota: APS
Press.
Beckman, C. H. and Roberts, E. M. (1995). On the nature and genetic basis of resistance
and tolerance to fungi wilt diseases of plants. Advances in Botanical Research,
21: 35-77.
Bell, A. A. (1969). Phytoalexin production and Verticillium wilt resistance in cotton.
Phtytopathology, 59: 1119-1127.
Bell, A. A. and Mace, M. E. (1981). Biochemistry and Physiology of resistance. In:
Fungal Wilt Diseases of plants. Mace, M. E., Bell, A. A., and Beckman, C. H.
(Eds.), New York: Academic Press. pp. 431-486.
Benhamou, N. (1995). Ultrastructural and cytochemical aspects of the response of egg
plant parenchyma clees in direct contact with Verticillium-infected xylem vessels.
Physiological and Molecular Plant Pathology, 46 (4): 321-338.
Benhamou, N., Kloepper, J. W., Quadt-Hallman, A., and Tuzun, S. (1996). lnduction of
Defense-Related Ultrastructural Modifications in Pea Root Tissues lnoculated
with Endophytic Bacteria. Plant Physiol., 112: 919-929.
Bent, A. F., Kunkel, B. N., Dahleck, D., Brown, K. L., Schmidt, R., Giraudat, J., Leung,
J., and Staskawicz, B. J. (1994). RPS2 of Arabidopsis thaliana: a leucine-rich
repeat class of plant disease resistance genes. Science, 265: 1856-1860.
Ben-Yephet, Y. and Frank, Z. R. (1989). Factors affecting the efficiency of metham-
sodium in controlling Verticillium dahliae. Acid Horticulturae, 255: 227-234.
Bewley, W. F. (1922). Sleepy disease of tomato. Ann. Applied Biol., 9: 116-134.
Bhat, R. G. and Subbarao, K. V. (1999). Host range specificity in Verticillium dahliae.
Phytopathology, 89: 1218-1225.
Bishop, C. D. and Cooper, R. M. (1983). An ultrastructure study of root invasion in three
vascular wilt diseases. Physiol Plant Pathol, 22: 15-27.

BIBLIOGRAPHY
190
Bohner, S., Kebjm, I., Rieping, M., Herold, M., and Gatz, C. (1999). Transcriptional
activator TGV mediates dexamethasone-inducible and tetracycline-inactivatable
gene expression.. The Plant Journal , 19: 87–95.
Bohs, L. and Olmstead, R. G. (1997). Phylogeny of Solanum (Solanaceae) subgenera
based on ndhF sequence data. Systematic Botany , 22 (1): 5-17..
Bolek, Y., El-Zik, K. M., Pepper, A. E., Bell, A. A., Magill, C. W., Thaxton, P. M., and
Reddy, O. U. K. (2005). Mapping of Verticillium wilt resistance genes in cotton.
Plant Science, 168: 1581-1590.
Bonshtien, A., Lev, A., Gibly, A., Debbie, P., Avni, A., and Sessa, G. (2005). Molecular
properties of the Xanthomonas AvrRxy effector and global transcriptional
changes determined by its expression in resistant tomato plants. Molecular Plant
Microbe Interaction, 18: 300-310.
Bonshtien, A., Lev, A., Gibly, A., Debbie, P., Avni, A., and Sessa, G. (2005). Molecular
properties of the Xanthomonas AvrRxy eVector and global transcriptional
changes determined by its expression in resistant tomato plants. Mol Plant
Microbe Interact , 18: 300–310.
Bowden, R. L., Douglas, I. R., and Sharkey, T. D. (1990). Mechanism of photosynthesis
decrease by Verticillium dahliae in potato. Plant Physiology, 94: 1048-1055.
Bowtell, D. D. (1999). Options available—from start to finish—for obtaining expression
data by microarray. Nat Genet , 21 ([1 Suppl]): 25–32.
Brandle, J. . E., Mchugh, S. G., James, L., Labbe, H., and Miki, B. L. (1995). Instability
of transgene expression in-field grown tobacco carrying the csrl-l gene for
sulfonylurea herbicide resistance. Bio/technology, 13: 994-998.
Briganti, G., Giordano, R., Londei, P., and Valle, F. (2000). Functional role of
Chaperonin protein complexes. Physica , 276: 516-517.
Browning, J. A., Simons, M. D., and Frey, K. J. (1962). The potential value of synthetic
tolerant or multilane varieties for control of cereal rusts in North America.
Phytopathology, 52: 726.
Bruce, W., Folkerts, O., Garnaat, C., Crasta, O., Roth, B., and Bowen, B. (2000).
Expression profiling of the maize flavonoid pathway genes controlled by
estradiol-inducible transcription factors CRC. The Plant Cell , 12: 65–80.
Buchanan, B., Gruissem, B. W., and Jones, R. L. (2000). Biochemistry and molecular
biology of plants. American Soceity of Plant Physiologist. Rockville, MD.
Buchner, V., Burstein, Y., and Nachmias, A. (1989). Comparison of Verticillium dahliae
produced phytotoxin peptides purified from culture fluids and infected potato
stems. Physiol. Mol. Plant Pathol., 35: 253-269.
BIBLIOGRAPHY
191
Busch, L. V. and Smith E, E. (1981). Susceptibility of Ontario-grown alflafa cultivars
and certain Medicago species to Verticillium albo-atrum. Canadian Journal of
Plant Pathology, 3: 169-172.
Caddick, M. X., Greenland, A. J., and Jepson, I. (1998). An ethanol inducible gene
switch for plants used to manipulate carbon metabolism. Nature Biotechnology,
16: 177‐180.
Caldwell, R. M., Schafer, J. F.., Compton, L. E., and Patterson, F. L. (1958). Tolerance to
cereal leaf rusts. Science, 128: 714-715.
Call, D. R., Brockman, F. J., and Chandler, D. P. (2001). Detecting and genotyping
Escherichia coli O157:H7 using multiplexed PCR and nucleic acid microarrays.
Int. J. Food Microbiol., 67: 71-80.
Campochiaro, P. A. (2006). Potential applications for RNAi to probe pathogenesis and
develop new treatments for ocular disorders. Gene Therapy, 13: 559–562.
Carder, J. H. and Barbara, D. J. (1999). Taxonomic status of putative Verticillium albo-
atrum isolates. FEMS Microbiology Letters, 170: 211-219.
Castroverde, C. D. M., Nazar, R. N., and Robb, J. (2009). Defense genes in tomato. In:
Tomatoes: Agricultural Procedures, Pathogen Interactions and Health Effects.
Aubé, E. D. and Poole, F. H. (Eds.), Hauppage, New York: Nova Publishers. pp.
in press.
Champe, S. P., Kurtz, M. B., Yager, L. N., Butnick, N. J., and Axelrod, D. E. (1981).
Spore formation in Aspergillus nidulans: Competence and other developmental
processes. In: The Fungal Spore: Morphogenetic Controls. Turian, G. and Hohl,
H. R. (Eds.), pp. 255-76.
Chang, A. (2006). Tomato PAL gene: Highly redundant but strongly underutilized.
Ph.D.Thesis. University of Guelph, Guelph, ON.
Chapple, C. (1998). Molecular genetic analysis of plant cytochrome P450 dependent
monooxygenses. Annu. Rev. Plant Physiol Plant Mol. Biol., 49: 311-343.
Chen, P. (2004). Tolerance to a non-host isolate of Verticillium dahliae. Department of
Molecular Biology and Genetics, University of Guelph, Guelph.
Chen, P., Lee, B., and Robb, J. (2004). Tolerance to a non-host isolate of Verticillium
dahliae in tomato. Physiology Molecular Plant Patholgy , 64: 283-291.
Childs, G., DeRisi, J., Harris, T., Holloway, A., Hou, B. H., Massimi, A., Murphy, M.,
and Somerville, S. (2003). Printing spotted glass microarray. In: A Molecular
Cloning Manual: DNA Microarray. Bowtell, D. and Sambrook, J. (Eds.), Gold
Spring Harbor Laboratory Press. pp. 61-100.
Chuang, C. and Meyerowitz, E. M. (2000). Specific and heritable genetic interference by
double-stranded RNA in Arabidopsis thaliana. PNAS, 97 (9): 4985–4990.
BIBLIOGRAPHY
192
Clark, M. F. (1981). Immunosorbent assys in plant pathology. Annu. Rev.
Phytopathology, 19: 83-106.
Clarke, D. D. (1984). Tolerance of parasitic infection in plants. In: Plant Diseases:
infection, damage and loss. Wood, R. K. S. and Jellis, G. J. (Eds.), Blackwell
Scientific.
Clarke, D. D. (1986). Tolerance of parasites and disease in plants and its significance in
host-parasite interactions. In: Advances in plant pathology. London, UK:
Academic Press. pp. 162-197.
Clay, K. (1988). Clavicipitaceous fungal endophytes of grasses: coevolution and the
change from parasitism to mutualism. In: Coevolution of fungi with plants and
animals. Pirozynski, K. A. and Hawksworth, D. L. (Eds.), London: Academic
Press. pp. 79-105.
Clay, K. (1990). Fungal endophytes of grasses. Ann Rev Ecol and Syst, 21: 275-297.
Clay, K. and Schardl, C. (2002). Evolutionary origins and ecological consequences of
endophyte symbiosis with grasses. Am. Nature, 160: 99-127.
Cohen, Y. and Rotem, J. (1969). The effects of lesion development, air temperature and
duration of moist periods on sporulation of Pseudoperonospora cubensis in
cucumbers. Isr. J. Bot., 18: 135-40.
Cohn, J. R. and Martin, G. B. (2005). Pseudomonas syringae pv tomato type III effectors
AvrPto and AvrPtoB promote ethylene-dependent cell death in tomato. Plant
Journal, 44: 139-154.
Corsini, D. L., Pavek, J. J., and Davis, J. R. (1988). Verticillium wilt resistance in
noncultivated tuber bearing solanum species. Plant Disease, 72: 148-151.
Coyne, D. P. and Schuster, M. I. (1969). Moderate tolerance of bean varieties to brown
spot bacterium (Pseudomonas syringae).. Plant Disease Repot, 53: 677-680.
Crump, D. . H. and Kerry, B. . R. (1981). A quantitative method for extracting resting
spores of two nematode parasitic fungi, Nematophthora gynophila and
Verticillium chlamydosporium, from soil. Nematologica, 26: 330–339.
Cullen, D. W., Toth, I. K., Pitkin, Y., Boonham, N., Walsh, K., Barker, I., and Lees, A.
K. (2005). Use of Quantitative Molecular Diagnostic Assays to Investigate
Fusarium Dry Rot in Potato Stocks and Soil. Phytopathology, 95: 1462-1471.
Danny, A., Robert, M., Manuela, G., Christopher, G., Kristianna, W., Lesue, F., Daryl,
M., Tom, L., Eric, W., and John, R. (1993). Increased tolerance to two oomycetes
pathogens in transgenic tobacco expressing pathogenesis-related protein 1a.
Procceedings of National Academy of Science, USA, 90: 7327-7331.
Davison, P. A., Hunter, C. N., and Horton, P. (2002). Overexpression of beta-carotene
hydroxylase enhances stress tolerance in Arabidopsis. Nature , 418: 203-206.

BIBLIOGRAPHY
193
Davuluri, G. R., Van Tuinen, A., Fraser, P. D., Manfredonia, A., Newman, R., Burgess,
D., Brummell, D. A., King, S. R., Palys, J., Uhlig, J., Bramley, P. M., Pennings,
H. M. J., and Bowler, C. (2005). Fruit-specific RNAi-mediated suppression of
DET1 enhances carotenoid and flavonoid content in tomatoes. Nature
Biotechnology, 23 (7): 890-895.
De Meyer, G. and H¨ofte, M. (1997). Salicylic acid produced by the rhizobacterium
Pseudomonas aeruginosa 7NSK2 induces resistance to leaf infection by Botrytis
cinerea on bean. Phytopathology, 87: 588–593.
De Meyer, G. and Hofte, M. (1997). Salicylic acid produced by the rhizobacterium
Pseudomonas aeruginosa 7NSK2 induces resistance to leaf infection by Botrytis
cinerea on bean. Phytopathology , 87: 588–93.
de Torres, M., Sanchez, P., Frnandez-Delmond, I., and Grant, M. (2003). Expression
profiling of the host response to bacterial infections: the transition from basal to
induced defense responses in RPM1-mediated resistance. Plant Journal, 33: 665-
676.
Dean, C., Jones, J., Favreau, M., Dunsrnuir, P., and Bedbrook, J. (1988). Influence of
flanking sequences on variability in expression levels of an introduced gene in
transgenic tobacco. Plants. Nucl. Acids Res., 16: 9267-9283.
De-Borne, F. D., Vincentz, M., Chupeau, Y., and Vaucheret, H. (1994). Cosuppression of
nitrate reductase host genes and transgenes in transgenic tobacco plants. Mol Gen
Genet., 243: 613-621.
DeRisi, J. L., Iyer, V. R., and Brown, P. O. (1997). Exploring the metabolic and genetic
control of gene expression on a genomic scale. Science, 278: 680–686.
Diatchenko, L., Lau, Y. F., Campbell, A. P., Chenchik, A., Moqadam, F., Huang, B.,
Lukyanov, S., Lukyanov, K., Gurskaya, N., Sverdlov, E. D., and Siebert, P. D.
(1996). Suppression subtractive hybridization: a method for generating
differentially regulated or tissue-specific cDNA probes and libraries. Proc Natl
Acad Sci, 93: 6025-6030.
Diwan, N., Fluhr, R., Eshed, Y., Zamir, D., and Tan, S. D. (1999). Mapping of Ve in
tomato: a gene conferring resistance to the broad-spectrum pathogen, Verticillium
dahliae race 1. Appl. Genet., 98: 315–319.
Dixon, M. S., Jones, D., Keddie, J. S., Thomas, C. M., Harrison, K., and and Jones, J. D.
G. (1996). The Tomato Cf-2 Disease Resistance Locus Comprises Two
Functional Genes Encoding Leucine-Rich Repeat Proteins. Cell, 84: 451–459.
Dobinson, K. F., Patterson, N. A., White, G. J., and Grant, S. (1998). DNA fingerprinting
and vegetative compatibility analysis indicate multiple origins for Verticillium
dahliae race 2 tomato isolates from Ontario, Canada. Mycol Res, 102: 1089-1095.
BIBLIOGRAPHY
194
Dobinson, K. F., Tenuta, G. K., and Lazarovits, G. (1996). Occurence of race 2 of
Verticillium dahliae in processing fields in southwestern Ontario. Canadian
Journal of Plant Pathology, 18: 55-58.
Domsch, K. H., Gams, W., and Anderson, T. H. (1980). Compendium of soil fungi.
London.
Douglas, S. M. and Machardy, W. E. (1981). The relationship between vascular
alterations and symptom development in Verticillium wilt of chrysanthemum.
Physiological Plant Pathology, 19: 31-39.
Drmanac, S., Kita, D., Labat, I., Hauser, B., Burczak, J., and Drmanac, R. (1998).
Accurate sequencing by hybridization for DNA diagnostics and individual
genomics. Nature Biotechnology, 16: 54-58.
Dropkin, V. H. (1955). The relations between nematodes and plants. Exp. Parasitol., 4:
282-322.
Dufva, M., Petersen, J., Stoltenborg, M., Birgens, H., and Christensen, C. B. V. (2006).
Detection of mutations using microarrays of poly(C)10–poly(T)10 modiWed
DNA probes immobilized on agarose Wlms. Annals of Biochemistry , 352: 188–
197.
Duijff, B. J., Bakker, P. A. H. M., and Schippers, B. (1994). Suppression of fusarium wilt
of carnation by Pseudomonas putida WCS358 at different levels of disease
incidence and iron availability. Biocontrol Sci. Technol. , 4: 279–88.
Duijff, B. J., Meijer, J. W., Bakker, P. A. H. M., and Schippers, B. (1993). Siderophore
mediated competition for iron and induced resistance in the suppression of
Fusarium wilt of carnation by fluorescent Pseudomonas spp. Neth. Plant Path.,
99: 277–289.
Duijff, B. J., Meijer, J. W., Bakker, P. A. H. M., and Schippers, B. (1993). Siderophore
mediated competition for iron and induced resistance in the suppression of
Fusarium wilt of carnation by fluorescent Pseudomonas spp. Neth. J. Plant Path. ,
99: 277–289.
Elmayan, T. and Vaucheret, H. (1996). Single copies of a 35S-driven transgene can
undergo post-transcriptional silencing at each generation or can be
transcriptionally inactivated in trans by a 35S silencer. Plant Journ., 9: 787-797.
Eren, J. and Pramer, D. (1965). The most probable number of nematode trapping fungi in
soil. Soil Sci., 99: 285-293.
Eshed, I. N., Paran, I., Presting, G. ., Aviv, D., Tanksley, S., Zamir, D., and Fluhra, R.
(1997). The 12C Family from the WiIt Disease Resistance Locus 12 Belongs to
the Nucleotide Binding, Leucine-Rich Repeat Superfamily of Plant Resistance
Genes. The Plant Cell, 9: 521-532.
BIBLIOGRAPHY
195
Feldmann, K. . A. (1991). T-DNA insertion mutagenesis in Arabidopsis: mutational
spectrum. The Plant Journal, 1 (1): 71-82.
Fillatti, J. J., Kiser, J., Rose, R., and Comai, L. (1987). Efficient transfer of a glyphosate
tolerance gene into tomato using a binary Agrobacterium tumefaciens vector.
Biotechnology, 5: 726‐730.
Fitzell, R., Fahy, P. C., and Evans, G. (1980). Serological studies on some Australian
isolates of Verticillium spp. Austral. Journ. Biol. Sci., 33: 115-124.
Flavell, R. B. (1994). Inactivation of gene expression in plants as a consequence of
specific sequence duplication. pp. 3490-3496.
Fradin, E. F. and Thomma, B. P. (2006). Physiology and molecular aspects of
Verticillium wilt diseases caused by V. dahliae and V. albo-atrum. Molecular
Plant Pathology, 7: 71-86.
Fradin, . E. F., Zhang, Z., Juarez Ayala, J. C., Castroverde, C. D. M., Nazar, R. N., Robb,
J., Liu, C., and Thomma, B. P. H. J. (2009). Genetic Dissection of Verticillium
Wilt Resistance Mediated by Tomato Ve1. Plant Physiology, 150: 320–332.
Frary, A., Nesbitt, T. C., Grandillo, S., Knaap, E., Cong, B., Liu, J., Meller, J., Elber, R.,
Alpert, K. B., and Tanksley, S. D. (2000). Fw2.2: A quantitative trait locus key to
the evolution of tomato fruit size. Science, 289: 85–88.
Fray, R. and Grierson, D. (1993). Identification and genetic analysis of normal and
mutant phytoene synthase genes of tomato by sequencing, complementation and
co-suppression. Plant Mol Biol., 22: 589-602.
Freeman, W. M., Walker, S. J., and Vrana, K. E. (1999). Quantitative Rt-PCR: pitfalls
and potential. BioTechniques, 26: 112-122.
Frick, U. B. and Sccaller, A. (2002). cDNA microarray analysis of fusicoccin-induced
changes in gene expression in tomato plants. Planta, 216: 83–94.
Galbraith, E. A., Antonopoulos, D. A., and White, B. A. (2004). Suppressive subtractive
hybridization as a tool for identifying genetic diversity in an environmental
metagenome: the rumen as a model. Environmental Microbiology , 6 (9): 928–
937.
Gardner, H. W., Desjardins, A. E., McCormick, S. P., and Weisdleder, D. (1994).
Detoxification of the potato phytoalexins rishitin by Gibberella pulicaris..
Phtochemistry, 37: 1001-1005.
Garoosi, G. A., Salter, M. G., Caddick, M. X., and Brian, A. (2005). Characterization of
the ethanol-inducible alc gene expression system in tomato. Tomsett Journal of
Experimental Botany, 56: (416): 1635–1642.
BIBLIOGRAPHY
196
Gatz, C., Frohber, C., and Wendenburg, R. (1992). Stringent repression and
homogeneous de-repression by tetracycline of a modified CaMV 35S promoter in
intact transgenic tobacco plants. The Plant Journal , 2: 397–404.
Gershon, D. (2002). Microarray technology: an array of opportunities. Nature , 416: 885–
891.
Gillaspy, . G., Ben-David, . H., and Gruissem, . W. (1993). Fruits: A developmental
perspective. The Plant Cell , 5: 1439-1451.
Gimenez, C., Cabrera, R., Reina, M., and Gorizale-Coloma, A. (2007). Fungal
endophytes and their role in plant protection. Current Organic Chemistry, 11 (8):
707-720.
Giovannoni, J. J. (2007). Fruit ripening mutants yield insights into ripening control.
Current Opinion in Plant Biology , 10: 283–289.
Goicoechea, . N., Aguirreolea, J., Cenoz, S., and Garcia-Mina, J. M. (2001). Gas
exchange and flowering in Verticillium-wilted pepper plants. J. Phytopathol., , 14:
281-286.
Gold, J. and Robb, J. (1995). The role of the coating response in Craigella tomatoes
infected with Verticillium dahliae, races 1 and 2. Physiology Molecular Plant
Pathology, 47: 141-157.
Grant, J. J. and Loake, G. J. (2000). Role of reactive oxygen intermediates and cognate
redox signaling in disease resistance. Plant Physiol., 124: 21–29.
Green, R. J. (1981). An Overview. In: Fungal Wilt Diseases of Plants. Mace, M. E. . B.
A. A. a. B. C. H. (Eds.), New York, USA: Academic Press, Inc. pp. 640.
Griffiths, D. A. (1971). The development of lignitubers in roots after infection by
Verticillium dahliae Kleb. Canadian Journal of Microbiology, 17: 441-444.
Grison, R., Grezes-Besset, B., Schneider, M., Lucante, N., Olsen, L., Leguay, J., and
Toppan, A. (1996). Field tolerance to fungal pathogens of Brassica napus
constitutively expressing a chimeric chitinases gene. Nature Biotechnology, 14:
643-646.
Gust, B., Challis, G. L., Fowler, K., Kieser, T., and Chater, K. F. (2003). PCR-targeted
Streptomyces gene replacement identifies a protein domain needed for
biosynthesis of the sesquiterpene soil odor geosmin. PNAS, 100: 1541–1546.
Hacia, J. G., Fan, J. B., Ryder, O., Jin, L., Edgemon, K., Ghandour, G., Mayer, R. A.,
Sun, B., Hsie, L., Robbins, C. M., Brody, L. C., Wang, D., Lander, E. S.,
Lipshutz, R., Fodor, S.., and Collins, F. S. (1999). Determination of ancestral
alleles for human single-nucleotide polymorphisms using high-density
oligonucleotide arrays. Nature Genetics , 22: 164–167.

BIBLIOGRAPHY
197
Hagernann, R. and Snoad, B. (1971). Paramutation (somatic conversion) at the sulfurea
locus of Lycopersicon esculentum. The localization of sulf. Heredity, 27: 409-41
8.
Hall, D. H. and Kimble, K. A. (1972). An isolate of Verticillium found pathogenic to
wilt-reistant tomatoees. Calif. Agric., 26: 3-11.
Hamilton, A. J. and Baulcombe, D. C. (1999). A species of small antisense RNA in
posttranscriptional gene silencing in plants. Science, 286: 950–952.
Hamilton, A. J., Lycett, G. W., and Grierson, D. (1990). Antisense gene that inhibits
synthesis of the hormone ethylene in transgenic plants. Nature , 346: 284–287.
Hammond-Kosack, K. E. and Jones, J. D. G. (1997). Plant disease resistance genes.
Annu. Rev. Plant Physiol. Plant Mol. Biol., 48: 575–607.
Hannon, G. J. (2002). RNA interference. Nature, 418 : 244–251.
Harman, G. E. (2000). Myths and dogmas of biocontrol: Changes in perceptions derived
from research on Trichoderma harzianum T- 22. Plant Dis., 84: 377-393.
Harman, G. E. (2000). Myths and dogmas of biocontrol: Changes in perceptions derived
from research on Trichoderma harzianum T-22.. Plant Disease , 84: 377-393.
Harman, G. E., Howell, C. R., Viterbo, A., Chet, I., and Lorito, M. (2004). Trichoderma
species-opportunistic, avirulent plant symbionts. Nature Review, 2: 43-56.
Hastie, A. C. and Heale, J. B. (1984). Genetics of Verticillium. Phytopathologia
Mediterranea, 23: 130-162.
Hauck, . P., Thilmony, R., and He, S. Y. (2003). A Pseudomonas syringae type III
effector suppresses cell wall based extracellular defense in susceptible
Arabidopsis plants. Proc. Natl. Acad. Sci., USA, , 100: 8577-8582.
Hawke, M. A. and Lazarovits, G. (1994). Production and manipulation of individual
microsclerotia of Verticillium dahliae for use in studies of survival.
Phytopathology, 84: 883-890.
Heale, J. B. and Isaac, I. (1963). Wilt of lucerne caused by species of Verticillium. IV.
Pathogenicity of V. albo-atrum and V. dahliae to lucerne and other crops; spread
and survival of V. albo-atrum in soil and weeds; effect upon lucerne production.
Ann. Appl. Biol., 52: 439–451.
Heinz, R., Lee, S. W., Saparno, A., Nazar, R. N., and Robb, J. (1998). Cyclical systemic
colonization in Verticillium-infected tomato. Physiology Molecular Plant
Pathology, 52: 385-396.
Heller, R. A., Schena, M., Chai, A., Shalon, D., Bedilion, T., Gilmore, J., Woolley, D. E.,
and Davis, R. W. (1997). Discovery and analysis of inflammatory disease-related
genes using cDNA microarrays. Proc Natl Acad Sci USA. pp. 2150–2155.

BIBLIOGRAPHY
198
Helliwell, C. and Waterhouse, P. (2003). Constructs and methods for high-throughput
gene silencing in plants. Methods, 30: 289–295.
He, P., Shan, L., Lin, N. C., Martin, G. B., and Kemmerling, B. (2006). Specific bacterial
suppressors of MAMP signaling upstream of MAPKKK in Arabidopsis innate
immunity. Cell, 125: 563-567.
Hiraki, Y. and Ota, Y. (1975). The relationship between growth inhibition and ethylene
production by mechanical stimulation in Lilium longiflorum. Plant and Cell
Physiology, 16 (1): 185-189.
Hoaglund, D. R. and Arnon, D. (1950). The water culture method of growing plants
without soil. California Agricultual Experiment Station.
Holsters, M., Waele, D., and Depicker, A. (1978). Transfection and transformation of
Agrobacterium tumefaciens. Mol. Genet. Genomics , 163: 181‐187.
Hood, E. E., Gelvin, S. B., Melchers, L. S., and Hoekema., A. (1993). New
Agrobacterium helper plasmids for gene transfer to plants. Transgenic Res. , 2:
208-218.
Howe, G. A., Lee, G. I., Itoh, A., Li, L., and DeRocher, A. E. (2000). Cytochrome P450-
dependent metabolism of oxylipins in tomato. Cloning and expression of allene
oxide synthase and fatty acid hydroperoxide lyase. Plant Physiology , 123: 711–
724.
Howell, C. R. (2003). Mechanisms employed by Trichoderma species in the biological
control of plant diseases: the history and evolution of current concepts. Plant
Disease, 87 (1): 4-10.
Huang, B. F. and Cappelini, R. A. (1980). Sporulation of Gibberella zeae. VI. Sporulation
and maximum mycelial growth occur simultaneously. Mycologia, 72: 123 1-35.
Hu, H., Dai, M., Xiao, B., Li, X., Zhang, Q., and Xiong, L. (2006). Overexpressing a
NAM, ATAF and CUC (NAC) transcription factor enhances drought resistance
and salt tolerance in rice. PNAS , 103: 12987-12992.
Hughes, S. J. (1951). Studies on micro-fungi. XI. Some hyphomycetes which produce
phialides. Mycological Papers, 45: 1-36.
Huisman, . O. C. (1982). Interactions of root growth dynamics to epidemiology of root-
invading fungi. Annu. Rev. Phytopathol., 20: 303-327.
Hu, X., Nazar, R. N., and Robb, J. (1993). Quantification of Verticillium biomass in wilt
disease development. Physiology Molecular Plant Pathology, 42: 23-36.
Hunter, D. E., Darling, H. M., Stevenson, F. J., and Cunningham, E. (1968). Inheritance
of resistance to Verticillium wilt in Wisconsin. American Potato Journal, 45: 72-
78.

BIBLIOGRAPHY
199
Isaac, I. (1953). A further comparative study of pathogenic isolates of Verticillium: V.
nubilum Pethybr. and V. tricorpus sp. nov. Transactions of the British
Mycological Society , 36: 180-185.
Isaac, I. (1967). Speciation in Verticillium. Ann. Rev. Phytopathol., 5: 201-222.
Jansky, S., Rouse, D. I., and Kauth, P. J. (2004). Inheritance of resistance to Verticillium
dahliae in diploid interspecific potato hybrids. Plant Disease, 88: 1075-1078.
Jarosz, A. M. and Davelos, A. L. (1995). Effects of disease in wild populations and the
evolution of pathogen aggressiveness. New Phytol, 129: 371-387.
Joost, O., Bianchini, G., Bell, A. A., Benedict, C. R., and Magill, C. W. (1995).
Differential induction of 3-hydroxy-3-methylglutaryl CoA reductase in two cotton
species following inoculation with Verticillium. Mol. Plant Microbe Interaction,
8: 880-885.
Jordan, J. J. (2000). Real-time detection of PCR products and microbiology. New
Technologies For Life Sciences. A Trends Guide, 61-66.
Juarez Ayala, C. . J. (2008). Characterization of Ve genes in Verticillium infected tomato
(Solanum lycopersicum). Ph.D. Thesis. University of Guelph, Guelph, ON., pp.
179pp.
Karapapa, V. K., Bainbridge, B. W., and Heale, J. B. (1997). Morphological and
molecular characterisation of Verticillium longisporum comb. nov., pathogenic to
oilseed rape. Mycol. Res., 101: 1281-1294.
Kawchuk, L. M., Hachey, J., Lynch, D. R., Kulcsar, F., Rooijen, G., Waterer, D. R.,
Robertson, A., Kokko, E., Byers, R., Howard, R. J., Fischer, R., and Pru¨ feri, D.
(2001). Tomato Ve disease resistance genes encode cell surface-like receptors.
Proc. Natl. Acad. Sci. USA, 98 (11): 6511-6515.
Kempin, S. A., Liljegren, S. J., Block, L. M., Rounsley, S. D., Yanofsky, M. F., and Lam,
E. (1997). Targeted disruption in Arabidopsis. Nature, 386: 802-803.
Kerry, B. R. and Bourne, J. . M. (1996). The importance of rhizosphere interactions in the
biological control of plant parasitic nematodes–-a case study using Verticillium
chlamydosporium. Pestic. Sci., 47: 69–75.
Kerry, B. R., Kirkwood, I. A., de Leij, F. A. A., Barba, J., Leijdens, M. B., Brookes, P.
C., and Brookes, P. C. (1993). Growth and survival of Verticillium
chlamydosporium goddard, a parasite of nematodes, in soil. Biol. Control Sci.
Technol., 3: 355–365.
Keukens, E. A., de Vrije, T., van den Boom, C., de Waard, P., Plasman, H. H., Thiel, F.,
Chupin, V., Jongen, W. M., and de Kruijff, B. (1995). Molecular basis of
glycoalkaloid induced membrane disruption. Biochim. Biophys. Acta., 1240: 216-
228.

BIBLIOGRAPHY
200
Kim, C. Y., Liu, Y., Thorne, E. T., Yang, H., Fukushige, H., Gassmann, W., Hildebrand,
D., Sharp, R. E., and Zhang, S. (2003). Activation of a stress-responsive mitogen-
activated protein kinase cascade induces the biosynthesis of ethylene in plants.
Plant Cell, 15: 2707-2718.
Klebahn, H. (1913). Beitrage zur kenntnis der fungi imperfecti I. Eine Verticillium-
Krankheit auf Dahlien. Mykologisches Zentralblatt, 3: 49-66.
Kloepper, J. W., Leong, J., Teintze, M., and Schroth, M. N. (1980). Enhanced plant
growth by siderophores produced by plant growth-promoting rhizobacteria.
Nature, 286: 885–86.
Kombrink, E. and Somssich, I. E. (1997). Pathogenesis-related proteins and plant
defense. In: The Mycota. Plant relationships, part A. Carrol, G. and Tudzynski, P.
(Eds.), Springer, Berlin. pp. 107-128.
Kover, P. X. and Schaal, B. A. (2002). Genetic variation for disease resistance and
tolerance among Arabidopsis thaliana accessions. PNAS, USA, 99 (17): 11270-
11274.
Kurella,., Hsiao, L. L., Yoshida, T., Randall, J. D., Chow, G., Saran, S. S., Jensen, R. V.,
and Gullans, S. R. (2001). DNA Microarray Analysis of Complex Biologic
Processes. J Am Soc Nephrol, 12: 1072–1078.
Kwoh, D. Y., Davis, G. . R., Whitfield, K. M., Chappelle, H. L., DiMichele, L. J., and
Gingeras, T. R. (1989). Transcription-based amplification system and detection of
amplified human immunodeficiency virus type 1 with a bead-based sandwich
hybridisation format. Proc. Natl. Acad. Sci. U.S.A, 86: 1173–1177.
Lausted, C., Dahl, T., Warren, C., King, K., Smith, K., Johnson, M., Saleem, R.,
Aitchison, J., Hood, L., and Lasky, S. R. (2004). POSaM: a fast, flexible, open-
source, inkjet oligonucleotide synthesizer and microarrayer. Genome Biology, 5
(8): R58.2-R58.17.
Le Floch, G., Benhamou, N., Mamaca, E., Salerno, M. I., Tirilly, Y., and Rey, P. (2005).
Characterisation of the early events in atypical tomato root colonisation by a
biocontrol agent, Pythium oligandrum. Plant Physiol Biochem, 43 (1): 1-11.
Lee, S. J., Lee, M. Y., Yi, S. Y., Oh, S. K., Choi, S. H., Her, N. H., Choi, D., Min, B. W.,
and Harn, C. H. (2002). PPI1: a novel pathogen-induced basic region-leucine
zipper (bZIP) transcription factor from pepper. Molecular Plant Microbe
Interaction, 15: 540-548.
Lee, S., Nazar, . R. N., Powell, D. A., and Robb, J. (1992). Reduced PAL gene
suppression in Verticillium-infected resistant tomatoes. Plant Molecular Biology,
18: 345352.

BIBLIOGRAPHY
201
Leister, D., Ballvora, A., Salamini, F., and Gebhardt, C. (1996). A PCR-based approach
for isolating pathogen resistance genes from potato with potential for wide
application in plants. Nature Genetics, 14: 421-429.
Li, K. N., Rouse, D. I., and. (1994). PCR Primers that allow intergeneric differentiation
of ascomycetes and their application to Verticillium spp. Appl Environ.Microbiol.,
60: 4324-4331.
Liu, Y., Roof, S., Ye, Z., Barry, C., Tuinen, A., Vrebalov, J., Bowler, C., and
Giovannoni, J. (2004). Manipulation of light signal transduction as a means of
modifying fruit nutritional quality in tomato. PNAS, 101 (26): 9897–9902.
Liu, R. J., Shen, C. Y., and Chiu, W. F. (1995). Detection of pathogenesis-related
proteins in cotton plants. Physiol. & Mol. Plant Pathol, 47: 357-363.
Lockhart, D. J. and Winzeler, E. A. (2000). Genomics, gene expression and DNA arrays.
Nature , 405: 827–836.
Lockwood, J. L. (1990). Relation of energy stress to behaviour of soil-borne plant
pathogens and to disease development. In: Biological Control of Soil-Borne Plant
Pathogens. Hornby, D. (Eds.), CAB International, Wallingford, Oxon, UK. pp.
197–214.
Lo, C., Wang, N., and Lam, E. (2005). Inducible double‐stranded RNA expression
activates reversible transcript turnover and stable translational suppression of a
target gene in transgenic tobacco. FEBS Letter, 579: 1498‐1502.
Lynch, D. R., Kaw Chuk, M. L., Hachey, J., Bains, P. S., and Howard, R. J. (1997).
Identification of a gene conferring high levels of resistance to Verticillium wilt in
Solanium chacoense. Plant Disease, 81: 1011-1014.
Lynch, D. R., Kawchuck, L. M., and Hachey, J. (1997). Identification of a gene
conferring high levels of resistance to Verticillium wilt in Solanum chacoense.
Plant Disease, 81: 1001-1014.
Mace, M. E., Bell, A. A., and Beckman, C. H., eds. (1981). Fungal wilt diseases of
plants. New York: Academic Press.
Mahuku, G. S. and Platt, H. W. (2002). Molecular evidence that Verticillium albo-atrum
Grp 2 isolates are distinct from V. albo-atrum Grp 1 and V. tricorpus. Mol. Plant
Pathol., 3: 71–79.
Maniatis, T., Fritsch, E. F., and Sambrook, J. (1982). Molecular Cloning: A Laboratory
Manual. New York: Cold Spring Harbour.
Mansoori, B., Milton, J. M., and Smith, C. J. (1995). Isolation and partial purification of
phytotoxin related to pathogenic Verticillium species. Journal of Phytopathology,
143: 33-36.
BIBLIOGRAPHY
202
Marchuk, D., Drumm, M., Saulino, A., and Collins, S. F. (1991). Construction of T-
vectors, a rapid and general system for direct cloning of unmodified PCR
products. Nucleic Acids Res, 19: 1154.
Martienssen, R. A. (1998). Functional genomics: Probing plant gene function and
expression with transposons. Proc. Natl. Acad. Sci. USA, 95: 2021–2026.
Mathieu, O. a. B. J. (2004). RNA-directed DNA methylation. Journal of Cell Sci. , 117:
4881-4888.
Mauch-Mani, B. and Slusarenko, A. J. (1996). Production of salicylic acid precursors is a
major function of phenylalanine ammonia lyase in resistance of Arabidopsis to
Peronospora parasitica. 8: 203-212.
Maurhofer, M., Keel, C., Schnider, U., Voisard, C., Haas, D., and DéFago, G. (1992.).
Influence of enhanced antibiotic production in Pseudomonas fluorescens strain
CHAO on its disease suppressive capacity.. Phytopathology , 82: 190–195.
McGurl, B., Pearce, G., Orozco-Cardenas, M., and Ryan, C. A. (1992). Structure,
expression, and antisense inhibition of the systemin precursor gene. Science, 255
(5051): 1570–1573.
McKenzie, C. L., Bausher, M., Sinisterra, X. H., Powell, C. A., Albano, J. P., Shatters Jr.,
R. G., Sinisterra, X. H., and Powell, C. A. (2005). Deciphering Changes in Plant
Physiological Response to Whitefly Feeding Using Microarray Technology. Acta
Horticulture, 695: 347-351.
Mehta, A. and Mehta, P. (1985). Production of Pectolytic and Cellulolytic Enzymes by
Fusarium oxysporum and F. moniliforme under Different Cultivation Conditions.
Folia Microbiol, 30: 42--50.
Messner, R., Schweigkofler, W., Ibl, M., Berg, G., and Prillinger, H. (1996). Molecular
characterization of the plant pathogen Verticillium dahliae Kleb. using RAPD-
PCR and sequencing of the 18S rRNA gene. Journal of Phytopathology, 144 (7):
347-354.
Meyer, P. (1996). Homology-dependent gene silencing in plants. Annu. Rev. Plant
Physiol. Plant Mol. Biol., 47: 23-48.
Mittler, R. and Cheung, A. Y. (2004). Cell death in plant development and defense. In:
When cells die II: a comprehensive evaluation of apoptosis and programmed cell
death. Lockshin, R. A. and Zakeri, Z. (Eds.), Wiley, Hoboken. pp. 99-122.
Moore, S., Payton, P., and Giovannoni, J. (2002). Development and utilization of tomato
microarrays for the Solanaceae. Comp Funct Genom, 3: 164-169.
Moran, G., Stokes, C., Thewes, S., Hube, B., Coleman, D. C., and Sullivan, D. (2004).
Comparative genomics using Candida albicans DNA microarrays reveals absence
and divergence of virulence-associated genes in Candida dubliniensis.
Microbiology, 150 (10): 3363–3382.
BIBLIOGRAPHY
203
Moreau, M., Catesson, A., Peresse, M., and Czaninski, Y. (1978). Dynamique comparee
des reactions cytologiques du xyleme de l'oeillet en presence de parasites
vascularies. Phytopathol., 91: 289-306.
Morton, A., Carder, J. H., and Barbara, D. J. (1995). Sequences of the internal transcribed
spacers of the ribosomal RNA genes and relationships between isolates of
Verticillium albo-atrum and V. dahliae. Plant Pathol., 44: 183–190.
Mueller, L. A., Solow, T. H., Taylor, N., Skwarecki, B., Buels, R., Binns, J., Lin, C.,
Wright, M. H., Ahrens, R. A., Wang, Y. W., Herbst, E. V., Keyder, E. R., Menda,
N., Zamir, D. Z., and Tanksley, S. D. (2005). The SOL Genomics Network. A
Comparative Resource for Solanaceae Biology and Beyond. Plant Physiology,
138: 1310–1317.
Murphy, D. (2002). Gene expression studies using microarrays: principles, problems, and
prospects. Advances in Physiology education, 26 (4): 256-270.
Napoli, C., Lemieux, C., and Jorgensen, R. A. (1990). Introduction of a chimeric
chalcone synthase gene into Petunia results in reversible co-suppression of
homologous genes in trans. Plant Cell, 2: 279-289.
Navarro, L., Zipfel, C., Rowland, O., Keller, I., and Robatzek, S. (2004). The
transcriptional innate immune response to flg22. Onterplay and overlap with Avr
gene-dependent defense responses and bacterial pathogenesis. Plant Physiology,
135: 1113-1128.
Nazar, R. N., Hu, X., Schmidt, J., Culham, D., and Robb, J. (1991). Potential use of PCR-
amplified detection and differentiation of Verticillium wilt pathogens. Physiology
Molecular Plant Pathology, 39: 1-11.
Neumann, M. J. and Dobinson, K. F. (2003). Sequencing tag analysis of gene expression
during pathogenic growth and microsclerotia development in the vascular wilt
pathogen Verticillium dahliae. Fungi Genetics Biology, 38: 54-62.
Newcombe, G., Lee, B., and Robb, J. (1990). Early vascular sporulation: a possible role
in the virulence of Verticillium albo-atrum in wilt of alfalfa. Physiological and
Molecular Plant Pathology, 36: 441-449.
Nicholson, R. L. and Hammerschmidt, R. (1992). Phenolic compounds and their roles in
disease resistance. Annu. Rev. Phytopalhol. , 30: 369-389.
Niki, T., Mitsuhara, I., Shigemi, S., Ohtsuba, N., and Ohashi, Y. (1998). Antagonistic
effect of salicylic acid and jasmonic acid on the expression of pathogenesis-
related (PR) protein genes in wounded mature tobacco leaves. Plant and Cell
Physiology , 39: 500-507.
Nishikura, K. (2001). A Short Primer on RNAi: Minireview RNA-Directed RNA
Polymerase Acts as a Key Catalyst. Cell, 107: 415–418.

BIBLIOGRAPHY
204
Okoli, C. A., Carder, J. H., and Barbara, D. J. (1994). Restriction fragment length
polymorphisms (RFLP) and the relationships of some host adapted isolates of
Verticillium dahliae. Plant Pathol., 43: 33-40.
Padidam, M. (2003). Chemically regulated gene expression in plants. Current Opinion in
Plant Biology, 6: 169–177.
Park, K. S. and Kloepper, J. W. (2000). Activation of PR-1a Promoter by Rhizobacteria
That Induce Systemic Resistance in Tobacco against Pseudomonas syringae pv.
Tabaci. Biological Control, 18: 2–9.
Park, J. M., Park, C. J., Lee, S. B., Ham, B. K., Shin, R., and Paek, M. K. H. (2001).
Overexpression of the tobacco TSI1 gene encoding an EREBP/AP2-type
transcription factor enhances resistance against pathogen attack and osmotic stress
in tobacco. The Plant Cell , 13: 1035-1046.
Peaset, A. C., Solast, D., Sullivant, E. J., Cronin, M. T., Holmest, C. P., and Fodort, S. P.
A. (1994). Light-generated oligonucleotide arrays for rapid DNA sequence
analysis. pp. 5022-5026.
Pedley, K. F. and Martin, G. B. (2003). Molecular basis of Pto-mediated resistance to
bacterial speck disease in tomato. Annu Rev Phytopathol., 41: 215-243.
Pegg, G. F. (1965). Phytotoxin production by Verticillium albo-atrum Reinke and
Berthold. Nature, 208: 128-1229.
Pegg, G. F. (1978). Effects of host substrate on germination and growth of Verticillium
albo-atrum and V. dahliae conidia and mycelia. Transactions of the British
Mycological Society, 71: 483-489.
Pegg, G. F. (1981). Biochemistry and physiology of pathogenesis. In: Fungal wilt
diseases of plants. M. E. Mace, A. A. B. a. C. H. B. (Eds.), Academic Press, New
York. pp. 193-253.
Pegg, G. F. and Brady, B. L. (2002). Verticillium wilts. Wallingford, Oxon, UK: CABI
Publishing.
Pegg, G. F. and Cronshaw, D. K. (1976). Ethylene production in tomato plants infected
with Verticillium albo-atrum. Physiological Plant pathology, 8: 279-295.
Pegg, G. F. and Young, D. H. (1982). Purification and characterization of chitinase
enzymes from healthy and Verticillium albo-atrum-infected tomato plants, and
from V. albo-atrum. Physiol. Plant Pathol, 21: 221-224.
Pennypacker, B. W., Leath, K. T., and Hill, R. R. (1985). Resistant alfalfa plants as
symptomless carriers of Verticillium albo-atrum. Plant disease, 69: 510-511.
Pérez-Artés, E., García-Pedrajas, M., Bejarano-Alcázar, J., and Jiménez-Díaz, R. (2000).
Differentiation of cotton-defoliating and nondefoliating pathotypes of Verticillium
dahliae by RAPD and specific PCR analyses. Eur J. Plant Pathol., 106: 507–517.

BIBLIOGRAPHY
205
Peterson, D. G., Pearson, W. R., and Stack, S. M. (1998). Characterization of the tomato
(Lycopersicon esculentum) genome using in vitro and in situ DNA reassociation.
Genome, 41: 346–356.
Pethybridge, G. H. (1919). Notes on some saprophtic species of fungi associated with
diseased potato plants and tubers. Transactions of the British Mycological Society
, 6: 104-120.
Pollack, J. R., Perou, C. M., Alizadeh, A. A., Eisen, M. B., Pergamenschikov, A.,
Williams, C. F., Jeffrey, S. S., Botstein, D., and Brown, P. O. (1999). Genome-
wide analysis of DNA copy-number changes using cDNA microarrays. Nature
Genet , 23 (1): 41–46.
Powelson, M. L. and Rowe, R. C. (1993). Biology and management of early dying of
potatoes. Annu. Rev. Phytopathol., 126: 111-126.
Pröls, F. a. M. P. (1992). The methylation patterns of chromosomal integration regions
influence gene activity of transferred DNA in Petunia hybrida. Plant Journ., 2:
465-475.
Quirino, B. F., Noh, Y. S., Himelblau, E., and Amasino, R. M. (2000). Molecular aspects
of leaf senescence. Trends Plant Science, 5: 278-282.
Reinke, J. and Berthold, G. (1879). Die Zersetzung der Kartoffel durch Pilze.
Untersuchungen aus dem Botanischen Laboratorium der Universitat, pp. 67-96.
Reuter, G., Giarre, M., Farah, J., Gansz, J., Spierer, A., and Spierer, P. (1990).
Dependence of position-effect variegation in Drosophila on dose of a gene
encoding an unusual zinc-finger protein. Nature, 344: 219-223.
Richards, D. E., King, K. E., Ait-ali, T., and Harberd, N. P. (2001). How gibberellin
regulates plant growth and development: A Molecular Genetic Analysis of
Gibberellin Signaling. Ann. Rev. Plant Physiol.Plant Mol. Biol., 52: 67-88.
Robb, J. (2002). Verticillium. Encyclopedia of Microbiology. 4: 788-795.
Robb, J. (2007). Verticillium tolerance: resistance, susceptibility or mutualism? Canadian
Journal of Botany, 85: 903-910.
Robb, J., Brisson, J. D., Busch, L. V., and Lu, B. (1979). Ultrastructure of wilt syndrome
caused by Verticillium dahliae. VII. Correlated light and transmission electron
microscope identification of vessels coatings and tyloses. Can. J. Bot., 57: 822-
834.
Robb, J., Busch, L. V., and Lu, B. C. (1975). Ultrastructure of wilt syndrome caused by
Verticillium dahliae I. In chrysanthemum leaves. Canadian Journal of Botany,
53: 901-913.
BIBLIOGRAPHY
206
Robb, . J., Castroverde, D. M. C., Shittu, H. O., and Nazar, R. N. (2009). Patterns of
defence gene expression in the tomato-Verticillium interaction. Botany, 87: 993-
1006.
Robb, J., Lee, S., Mohan, R., and Kolattukudy, P. E. (1991). Chemical characterization of
stress-induced vascular coating in tomato. Plant. Physiol., 97: 528-536.
Robb, J., Lee, B., and Nazar, R. N. (2007). Gene suppression in a tolerant tomato-
vascular pathogen interaction. Planta , 226: 299-309.
Robb, J., Moukhamedov, R., Hu, X., Platt, H., and Nazar, R. N. (1993). Putative sub-
groups of Verticillium albo-atrum distinguishable by PCR-based assays. Physiol.
Mol. Plant Pathol., 43: 423–436.
Robb, E. J. and Nazar, R. N. (1996). Factors contributing to successful PCR-based
diagnostics for potato and other crops. In: Diagnostics in Crop Production. G, M.
(Eds.), British Crop Protection Council, Surrey.
Robb, J., Poweel, D. A., and Street, P. F. S. (1987). Time course of wall coating secretion
in Verticillium-infested tomatoes. Physiol. Mol. Plant Pathol., 31: 217-226.
Robb, E. J., Powell, D. A., and Street, P. F. S. (1989). Vascular coating: a barrier to
colonization by the pathogen in Verticillium wilt of tomato. Canadian Journal of
Botany, 67: 600-607.
Roberts, M. R. (2003). 14-3-3 proteins Wnd new partners in plant cell signalling. Trends
in Plant Science, 8: 218–223.
Robert, M. R., Salinas, J., and Collinge, D. B. (2002). 14-3-3 proteins and the response to
abiotic and biotic stress. Plant Molecular Biology, 50: 1031-1039.
Robinson, D. E., Larson, R. H., and Walker, J. C. (1957). Verticillium wilt of potato in
relation to symptoms, epidemiology and variability of the pathogen. Wisc. Agric.
Exp. Stn. Res. Bull., 2002: 49.
Robinson, M. M., Shah, S., Tamot, B., Pauls, K. P., Moffatt, B. A., and Glick, B. R.
(2001). Reduced symptoms of Verticillium wilt in transgenic tomato expressing a
bacterial ACC deaminase. Mol. Plant. Pathol., 2: 135-145.
Rodrigo, J., Vera, P., Frank, K., and Conejero, V. (1991). IdentiWcation of the viroid-
induced tomato pathogenesis-related (PR) protein P23 as the thaumatin-like
tomato protein NP24 associated with osmotic stress. Plant Mol Biol, 16: 931–934.
Roger, . P. W., Moscou, M. . J., Bogdanove, . A. J., and Whitham, . S. A. (2007).
Transcript Profiling in Host-Pathogen Interactions. Annu. Rev. Phytopathol, 45:
329-69.
Rogers, S. O. and Bendich, A. J. (1985). Extraction of DNA from milligram amounts of
fresh, herbarium and mumminfied plant tissues. Plant Molecular Biology, 5: 69-
76.
BIBLIOGRAPHY
207
Rotem, J. and Cohen, Y. (1978). Ann. Rev. Phytopathol. Host and environmental
influences on sporulation in vivo, 16: 83-101.
Rothstein, R. J. (1983). One-step gene disruption in yeast. Methods Enzymol., 101: 202-
211.
Roy, B. A. and Kirchner, J. W. (2000). Evolutionary dynamics of pathogen resistance and
tolerance. Evolution, 54: 51-63.
Russell, L. B. (1963). Mammalian X-chromosome action: Inactivation limited in spread
and in region of origin. Science, 140: 976-978.
Saikkonen, K., Faeth, S. H., Helander, M., and Sullivan, T. J. (1998). Fungal endophytes:
a continuum of interactions with host plant. Annu. Rev. Ecol. Syst., 29: 319–343.
Saikkonen, K., Wali, P., Helander, M., and Faeth, S. H. (2004). Evolution of endophyte–
plant symbioses. Trends in Plant Science, 9 (6): 275-280.
Salter, M. G., Paine, J. A., and Riddell, K. V. (1998). Characterisation of the
ethanolinducible alc gene expression system for transgenic plants. Plant Journal,
16: 127‐132.
Sambrook, J., Fritsch, E. F., and Maniatis, T. (1989). Molecular Cloning: A Laboratory
Manual. 2nd
ed. Cold Spring Harbor Laboratory Press, Cold Spring, Harbor, USA.
Sampathnarayanan, A. and Shanmugasundarami, E. R. B. (1970). Studies on cellulase of
the cotton wilt pathogen Fusarium vasinfectum Atk. Mycopathologia et
Mycologia applicata, 41 (3): 223-232.
Savoie, C. J., Aburatani, S., Watanabe, S., Eguchi, Y., Muta, S., Imoto, S., Miyano, S.,
Kuhara, S., and Tashiro, K. (2003). Use of gene networks from full genome
microarray libraries to identify functionally relevant drug-affected genes and gene
regulation cascades. DNA Res, 10: 19-25.
Schafer, J. F. (1971). Tolerance to plant disease. Ann. Rev. Phytopathology, 9: 235-252.
Schaible, L., Cannon, O. S., and Waddoups, V. (1951). Inheritance of resistance to
Verticillium wilt in a tomato cross.. Phytopathology , 41: 986‐990.
Scheid, O. O., Afsar, K., and Paszkowski, J. (1998). Release of epigenetic gene silencing
by trans-acting mutations in Arabidopsis. pp. 632–637.
Schena, M., Shalon, D., Davis, R. W., and Brown, P. O. (1995). Quantitative Monitoring
of Gene Expression Patterns with a Complementary DNA Microarray. Science ,
270 (5235): 467 - 470.
Schippers, B. (1988). Biological control of pathogens with rhizobacteria. Phil. Trans. R.
Soc. London, pp. 283–293.

BIBLIOGRAPHY
208
Schippers, B., Bakker, A. W., and Bakker, P. A. (1987). Interactions of deleterious and
beneficial rhizosphere microorganisms and the effect of cropping practices. Annu.
Rev. Phytopathol., 25: 339–58.
Schippers, B. and Gams, W. (1979). Soil-borne plant pathogens. Proceedings of the 4th
International Symposium on Factors determining the Behaviour of Plant
Pathogens in Soil. Munich, Germany: Academic Press, London.
Schnathorst, W. C. (1963). Theoretical relationships between inoculum potential and
disease severity based on a study of the variation in virulence among isolates of V.
albo-atrum. Phytopathology, 53: 888.
Schnathorst, W. C. (1981). Life cycle and epidemiology of Verticillium. In: Fungal Wilt
Diseases of Plants. M. E. Mace, A. A. B. a. C. H. B. (Eds.), Academic Press, Inc.,
New York. pp. 81-111.
Schulthess, F. M. and Faeth, S. H. (1998). Distribution, abundance and associations of
the endophytic fungal community of Arizona fescue (Festuca arizonica Vasey).
Mycologia, 90: 569–578.
Scofield, S. R., Tobias, C. M., Rathjen, J. P., Chang, J. H., Lavelle, D. T., Michelmore, R.
W., and Staskawicz, B. J. (1996). Molecular Basis of Gene-for-Gene Specificity
in Bacterial Speck Disease of Tomato. Science, 274 (5295): 2063-5.
Scofield, S. R., Tobias, C. M., Rathjen, J. P., Chang, J. H., Lavelle, D. T., Michelmore, R.
W., and Staskawicz, B. J. (2010). Molecular Basis of Gene-for-Gene Specificity
in Bacterial Speck Disease of Tomato. Science, 2063-2065.
Sherrod, L. L. and Elliot, A. M. (1967). Grain sorghum as a host for Verticillium albo-
atrum. Phytopathology, 57: 14-17.
Sies, H., Schewe, T., Heiss, C., and Kelm, M. (2005). Cocoa polyphenols and
inXammatory mediators. American Journal of Clinical Nutrition , 81: 304S–
312S.
Simko, I., Haynes, K. G., Ewing, E. E., Costanzo, S., Christ, B. J., and Jones, R. W.
(2004). Mapping genes for resistance to Verticillium albo-atrum in tetraploid and
diploid populations using haplotype association tests and genetic linkage analysis.
Mol. Gen. Genet, 271: 522-531.
Simms, E. L. and Triplett, J. (1994). Cost and benefits of plant responses to disease:
resistance and tolerance. Evolution, 48 (6): 1973-1985.
Smith, I. E. and Berry, D. R. (1974). An Introduction to Biochemistry of Fungal
Development. London Academic Press.
Smith, N. A., Singh, S. P., Wang, M. B., Stoutjesdijk, P. A., Green, A. G., and
Waterhouse, P. M. (2000). Total silencing by intronspliced hairpin RNAs. Nature,
407: 319–320.

BIBLIOGRAPHY
209
Stamova, L. (2005). Resistance to V. dahliae Race 2 and its introgression into processing
tomato cultivars. Acta Hort, 695: 257-261.
Stevenson, M. (2004). Mechanisms of disease Therapeutic Potential of RNA
Interference. The New England journal of Medicine, 35 (17): 1772-1777.
Stintzi, A., Heitz, T., Prasad, V., Wiedemann-Merdinoglu, S., Kauffmann, S., Geoffroy,
P., Legrand, M., and Fritig, B. (1993). Plant 'pathogenesis-related' proteins and
their role in defense against pathogens. Biochimie., 75: 687-706.
Street, P. F. S. and Cooper, R. M. (1984). Quantitative measurement of vascular flow in
petioles of healthy and Verticillium-infected tomato. Plant Pathology, 33: 483-
492.
Subbarao, K. V., Chassot, A., Gordon, R. R., Hubbard, J. C., Bonello, P., Mullin, R.,
Okamoto, D., Davis, R. M., and Koike, S. T. (1995). Genetic relationships and
corss pathogenicities of Verticillium dahliae isolates from cauliflower and other
crops. Phytopathology, 85: 1105-1112.
Sundaram, S., Plasencia, J., and Banttari, E. E. (1991). Enzyme-linked immunosorbent
assay for detection of Verticilium spp. Using antisera produced to V. dahliae from
potato. Phtytopathology, 81 ( 12)): 1485-1489.
Takabatake, A., Karita, E., Seo, S., Mitsuhara, I., Kuchitsu, K., and Ohashi, Y. ( 2007).
Pathogen-induced calmodulin isoforms in basal resistance against bacterial and
fungal pathogens in tobacco. Plant Cell Physiology, 48: 414-423.
Talboys, P. W. (1958). Some mechanisms contributing to Verticillium resistance in the
hop root. Transaction of the British Mycological Society, 41: 227-241.
Tang, G. and Galili, G. (2004). Using RNAi to improve plant nutritional value: from
mechanism to application. TRENDS in Biotechnology, 22 (9): 463-469.
Tanksley, S. D. . e. a. (1992). High density molecular linkage maps of the tomato and
potato genomes. Genetics, 132: 1141–1160.
Tanksley, S. D. (1993). Mapping polygenes. Annu. Rev. Genet. , 27: 205-233.
Tanksley, S. D., Ganal, M. W., Prince, J. P., de Vicente, M. C., Bonierbale, M. W.,
Broun, P., Fulton, T. M., Giovannoni, J. J., Grandillo, S., Martin, G. B.,
Messeguer, R., Miller, J. C., Miller, L., Paterson, A. H., Pineda, O., Riider, M. S.,
Wing, R. A., Wu, W., and Young, N. D. (1992). High Density Molecular Linkage
Maps of the Tomato and Potato Genomes. Genetics , 132: 1141-1160.
Tenllado, F., Llave, C., and D´iaz-Ru´iz, J. R. (2004). RNA interference as a new
iotechnological tool for the control of virus diseases in plants. Virus Research,
102: 85–96.

BIBLIOGRAPHY
210
Ten, L. N., Mukhimedshanov, S. Z., and Otroschchenko, O. S. (1981). Structure of the
peptide moiety of Verticillium. Khimiya Prirodnykh Soedinenii Tashkent, 4: 476-
479.
Threlfall, R. J. (1959). Physiological studies on the Verticillium wilt disease of tomato.
Annals of Applied Biology, 47: 57-77.
Tjamos, E. C. (2000). Strategies in Developing Methods and Applying Techniques for
the Biological Control of Verticillium. In: Advances in Verticillium Research and
Disease Management. Tjamos, E. C., Rowe, R. C., Heale, J. B., and Fravel, D. R.
(Eds.), St. Paul, Minnesota, USA: APS Press. pp. 227-231.
Tjamos, S. E., Flemetakis, E., Paplomatas, E. J., and Katinakis, P. (2005). Induction of
resistance to Verticillium dahliae in Arabidopsis thaliana by the biocontrol agent
K-165 and pathogenesis-related proteins gene expression. Molecular Plant
Microbe Interaction, 18: 555-561.
Tjamos, E. C., Rowe, R. C., Heale, J. B., and Fravel, D. R. (2000). Advances in
Verticillium research and disease management. APS Press, St. Paul.
Tolmsoff, W. J. (1973). Life cycle of Verticillium species. Verticillium wilt of cotton.
Texas. pp. 20-38.
True, L. and Feng, Z. (2005). Immunohistochemical validation of expression microarray
results. Journal of Molecular Diagnostics, 7: 149-151.
Tsai, S. D. and Erwin, D. C. (1975). A method of quantifying numbers of microsclerotia
of Verticillium albo-atrum in cotton plant tissue and in pure culture.
Phytopathology, 65: 1027-1028.
Tsai, S. J. and Wiltbank, M. C. (1996). Quantification of mRNA using competitive RT-
PCR with standard-curve methodology. BioTechniques, 21: 862-866.
Ulker, B. and Somssich, I. E. (2004). WRKY transcription factors:from DNA binding
towards biological function. Current Opinion in Plant Biology , 7: 491-498.
Usaba, M. (2004). RNA interference in crop plants. Current Opinion in Biotechnology,
15: 139–143.
Van der Hoeven, R., Ronning, C., Giovannoni, J., Martin, G., and Tanksley, S. (2002).
Deductions about the Number, Organization, and Evolution of Genes in the
Tomato Genome Based on Analysis of a Large Expressed Sequence Tag
Collection and Selective Genomic Sequencing. The Plant Cell, 14: 1441–1456.
Van der Krol, A. R., Mur, L. A., Beld, M., Mol, J. N. M., and Stuitje, A. R. (1990).
Flavonoid genes in petunia: addition of a limited number of gene copies may lead
to a suppression of gene expression. Plant Cell, 2: 291-299.
BIBLIOGRAPHY
211
van Loon, L. C. (1999). Occurrence and properties of plant pathogenesis-related proteins.
In: Pathogenesis-related proteins in plants. Datta, S. K. and Muthukrishnan, S.
(Eds.), CRC, Boca Raton. pp. 1–19.
Van Loon, L. C. (2006). Significance of inducible defense-related proteins in infected
plants. Annual Review of Phytopathology, 44: 135-162.
van Loon, L. C. and van Strien, E. A. (1999). The families of pathogenesisrelated
proteins, their activities, and comparative analysis of PR-1 type proteins.
Physiology Molecular Plant Pathology , 55: 85–97.
Van Peer, R., Niemann, G. J., and Schippers, B. (1991). Induced resistance and
phytoalexin accumulation in biological control of fusarium wilt of carnation by
Pseudomonas sp. strain WCS417r. Phytopathology , 81: 728–34.
Van Peer, R., Niemann, G. J., and Schippers, B. (1991). Induced resistance and
phytoalexin accumulation in biological control of fusarium wilt of carnation by
Pseudomonas sp. strain WCS417r.. Phytopathology , 81: 728–34.
VanderMolen, G. . E., Beckman, C. H., and Rodehorst, E. (1977). Vascular gelation: A
general response phenomenon following infection. Physiol. Plant Pathol., 11: 95-
100.
VanEtten, H., Matthews, P., Tegtmeier, K., Deitert, M. F., and Stein, J. I. (1989).
Phytoalexin detoxification: importance for pathogenicity and practical
implications. Annu. Rev. Phytopathol., 27: 143-64.
Vaucheret, H., Béclin, C., Elmayan, T., Feuerbach, F., Godon, C., Morel, J. B., Mourrain,
P., Palauqui, J. C., and Vernhettes, S. (1998). Transgene-induced gene silencing
in plants. Plant Journ., 16: 651-659.
Veronese, P., Narasimhan, M. L., Stevenson, R. A., Zhu, J. K., Weller, S. C., Subbarao,
K. V., and Bressan, R. A. (2003). Identification of a locus controlling Verticillium
disease symptom response in Arabidopsis thaliana. Plant Journal, 35: 574-587.
Voigt, . C. A., Schafer, W., and Salomon, S. (2005). A secreted lipase of Fusarioum
graminearum is a virulence factor required for infection of cereals. The Plant
Journal, 42: 364-375.
Wanjiru, . W. M., Zhensheng, . K., and Buchenauer, H. (2002). Importance of cell
walldegrading enzymes produced by Fusarium graminearum during infection of
wheat heads. Eur. J. Plant Pathol., 108: 803-810.
Wei, G., Kloepper, J. W., and Tuzun, S. (1991). Induction of systemic resistance of
cucumber to Colletotrichum orbiculare by select strains of plant growth-
promoting rhizobacteria.. Phytopathology , 81: 1508–1512.
Weindling, R. (1932). Trichoderma lignorum as a parasite of other soil fungi.
Phytopathology, 22: 837-845.
BIBLIOGRAPHY
212
Weinmann, P., Gossen, M., Hillen, W., Bujard, H., and Gatz, C. (1994). A chimeric
transactivator allows tetracycline-responsive gene expression in whole plants. The
Plant Journal , 5: 559–569.
Wesley, S. V., Helliwell, C. A., Smith, N. A., Wang, M. B., Rouse, D. T., Liu, Q.,
Gooding, P. S., Singh, S. P., Abbott, D., Stoutjesdijk, P. A., Robinson, S. P.,
Gleave, A. P., and Waterhouse, P. M. (2001). Construct design for efficient,
effective and high-throughput gene silencing in plants. Plant Journal, 27: 581–
590.
Wilhelm, S. (1955). Longevity of the Verticillium wilt fungus in the laboratory and in the
field. Phytopathology, 45: 180-181.
Wilhelm, S. (1981). Sources and genetics of host resistance in field and fruit crops. In:
Fungal Wilt Disease of Plants. Mace, M. A., Bell, A. A., and Beckman, C. H.
(Eds.), USA Academic Press. pp. 300-376.
Williams, M. A., Brady, B. L., Bridge, P. D., and Paterson, R. R. M. (1992). Biochemical
and physiologial tests as aids to identification of Verticillium section Nigescentia.
Mycopathologia, 119: 101-114.
Wilson, K., Long, D., Swinburne, J., and Coupland, G. (1996). A Díssocíatíon lnsertion
Causes a Semidominant Mutation That lncreases Expression of TINY, an
Arabidopsis Gene Related to APETALA2. Plant Cell, 8: 659–671.
Wise, R., Caldo, R., Hong, L., Shen, L., Cannon, E., and Dickerson, J. (2007).
BarleyBase/PLEXdb: a unified expression profiling database for plant pathogen.
In: Methods in Molecular Biology. Edwards, D. (Eds.), Humana Press, Totowa,
NJ. pp. 203-211.
Wise, R. P., Moscou, M. J., bogdanove, A. J., and Whitham, S. A. (2007). Transcript
profiling in Host-Pathogen interactions. Annual Review of Phytopathology, 45:
329-368.
Wu, D. Y. and Wallace, R. B. (1989). The ligation amplification reaction (LAR)-
amplification f specific DNA sequences using sequential rounds of template-
dependent ligation. Genomics, 4: 560–569.
Yang, G. P., Ross, D. T., Kuang, W. W., Brown, P. O., and Weigel, R. J. ( 1999).
Combining SSH and cDNA microarrays for rapid identification of differentially
expressed genes. Nucleic Acids Res, 27 (6): 1517-1523.
Yi, J. Y., Seo, H. W., Yang, M. S., Robb, E. J., Nazar, R. N., and Lee, S. W. (2004). Plant
defense gene promoter enhances the reliability of shiva-1-gene-induced resistance
to soft rot disease in potato. Planta, 220: 165-171.
Zhang, H.-X. and Blumwald, E. (2001). Transgenic salt-tolerant tomato plants
accumulate salt in foliage but not in fruit. Nature Biotechnology, 19: 765-768.

APPENDIX I: List of primers used and their sequences
213
APPENDIX I: List of Primers Used For This Thesis Research

APPENDIX II: Conversion factors
214
APPENDIX II: Conversion Factors
(A) Conversion from Vd1 or Vaa standard curve values to ng fungal DNA/g
plant tissue
𝐶𝑜𝑛𝑣𝑒𝑟𝑠𝑖𝑜𝑛 𝑓𝑎𝑐𝑡𝑜𝑟 = 3076.923 =1000 × 20
6.5
Where:
1000: Factor to convert from mg to g plant tissue.
6.5: Factor from the starting plant material (as explained in the table
below).
20: Dilution factor from PCR (5 ul) to the total nucleic acid extraction
stock (100 ul).
(B) Correction factor for the short Vd1 DNA restriction fragment
Dvd-E6 intact fragment: 691 bp
Vd1 restriction fragments: 584 and 107 bp
To account for the short Vd1 DNA restriction fragment not seen on agarose gel,
multiply Vd1 molecular analyst area by the correction factor.
Correction factor=1.18=691
584
APPENDIX II: Conversion factors
215
(C) Conversion factor for calculating number of spores/ml/g plant tissue
Protocol
1) Add 0.15 g a pool of plant stem tissues (top 2/3 stem of 3 plants/pool) inti a
mortar.
2) Add 1 ml of autoclaved H2O added.
3) Ground 100 times with a pestle.
4) Add a drop (25 ul) of spore suspension on a hemacytometer groove and allow
settling for 2-3 min.
5) Count the number of spores under the microscope.
6) Find average of 3 counts per replicate for 3 replicates.
Number of spores/ml:
𝑁𝑢𝑚𝑏𝑒𝑟 𝑜𝑓𝑠𝑝𝑜𝑟𝑒𝑠
𝑚𝑙= 𝐴𝑣𝑒𝑟𝑎𝑔𝑒𝑜𝑓 3 𝑒𝑚𝑎𝑐𝑦𝑡𝑜𝑚𝑒𝑡𝑒𝑟 𝑠𝑝𝑜𝑟𝑒 𝑐𝑜𝑢𝑛𝑡𝑠 × 25 × 104
Number of spores/ml/g plant tissue
0.15 g of plant tissue = y number of spores in 1 ml
0.15 g of plant tissue = y number of spores
1g of plant tissue = y number of spores × 6.67
Conversion factor = 6.67
Number of spores/ml/g plant tissue= 6.67 × number of spores/ml

APPENDIX III: Raw data for calculating Vd1 and Vaa standard curves
216
APPENDIX III: Raw Data for Calculating Vd1 and Vaa Standard
Curves
Raw Data for Vd1 Standard Curve (0.1 pg Internal Control)
REPLICATE 1 REPLICATE 2 REPLICATE 3
Int. Ctrl. F C F/C F C F/C F C F/C
(pg)
100 372 59 6.30 265 53 5.00 133 31 4.30
50 374 72 5.20 299 65 4.60 133 31 4.30
10 302 89 3.40 248 73 3.40 93 30 3.10
5 275 106 2.60 163 68 2.40 97 39 2.50
1 147 105 1.40 83 64 1.30 12 42 0.30
1 79 113 0.70 42 70 0.60 25 50 0.50
0 22 114 0.20 16 80 0.20 6 42 0.14
Vd1 Standard Curve (0.1 pg Internal Control)
Average
Rep. 1 Rep. 2 Rep. 3 Average SD
Int. Ctrl. Average Std. Dev.
(pg)
6.30 5.00 4.30 5.20 1.01
100 5.20 1.01
5.20 4.60 4.30 4.70 0.46
50 4.70 0.46
3.40 3.40 3.10 3.30 0.17
10 3.30 0.17
2.60 2.40 2.50 2.50 0.10
5 2.50 0.10
1.40 1.30 0.30 1.00 0.61
1 1.00 0.61
0.70 0.60 0.50 0.60 0.10
1 0.60 0.10
0.20 0.20 0.14 0.18 0.03
0 0.18 0.03
Raw Data for Vaa Standard Curve (0.1 pg Internal Control)
REPLICATE 1 REPLICATE 2 REPLICATE 3
Int. Ctrl. F C F/C F C F/C F C F/C
(pg)
100 237 53 4.47 338 66 5.12 213 47 4.53
50 298 68 4.38 395 92 4.29 341 75 4.55
10 279 86 3.24 368 114 3.23 418 112 3.73
5 220 91 2.42 298 142 2.10 377 115 3.28
1 137 117 1.17 195 168 1.16 165 156 1.06
1 94 130 0.72 134 178 0.75 99 152 0.65
0 26 147 0.18 65 192 0.34 28 160 0.18

APPENDIX III: Raw data for calculating Vd1 and Vaa standard curves
217
Vaa Standard Curve (0.1 pg Internal Control)
Average
Rep. 1 Rep. 2 Rep. 3 Average SD
Int. Ctrl. Average Std. Dev.
(pg)
4.47 5.12 4.53 4.71 0.36
100 4.7 0.25
4.38 4.29 4.55 4.41 0.13
50 4.42 0.11
3.24 3.23 3.73 3.40 0.29
10 3.4 0.72
2.42 2.10 3.28 2.60 0.61
5 2.6 0.61
1.17 1.16 1.06 1.13 0.06
1 1.13 0.06
0.72 0.75 0.65 0.71 0.05
1 0.71 0.05
0.18 0.34 0.18 0.23 0.09
0 0.23 0.01
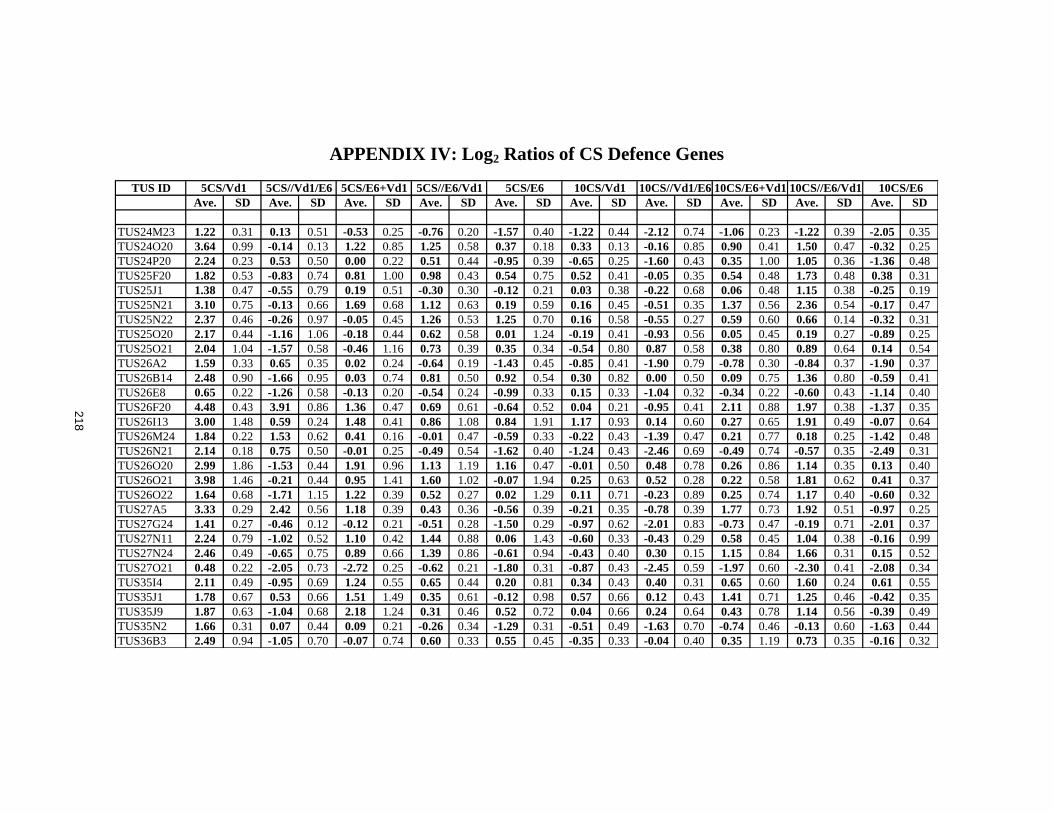
21
8
APPENDIX IV: Log2 Ratios of CS Defence Genes
TUS ID
Ave. SD Ave. SD Ave. SD Ave. SD Ave. SD Ave. SD Ave. SD Ave. SD Ave. SD Ave. SD
TUS24M23 1.22 0.31 0.13 0.51 -0.53 0.25 -0.76 0.20 -1.57 0.40 -1.22 0.44 -2.12 0.74 -1.06 0.23 -1.22 0.39 -2.05 0.35
TUS24O20 3.64 0.99 -0.14 0.13 1.22 0.85 1.25 0.58 0.37 0.18 0.33 0.13 -0.16 0.85 0.90 0.41 1.50 0.47 -0.32 0.25
TUS24P20 2.24 0.23 0.53 0.50 0.00 0.22 0.51 0.44 -0.95 0.39 -0.65 0.25 -1.60 0.43 0.35 1.00 1.05 0.36 -1.36 0.48
TUS25F20 1.82 0.53 -0.83 0.74 0.81 1.00 0.98 0.43 0.54 0.75 0.52 0.41 -0.05 0.35 0.54 0.48 1.73 0.48 0.38 0.31
TUS25J1 1.38 0.47 -0.55 0.79 0.19 0.51 -0.30 0.30 -0.12 0.21 0.03 0.38 -0.22 0.68 0.06 0.48 1.15 0.38 -0.25 0.19
TUS25N21 3.10 0.75 -0.13 0.66 1.69 0.68 1.12 0.63 0.19 0.59 0.16 0.45 -0.51 0.35 1.37 0.56 2.36 0.54 -0.17 0.47
TUS25N22 2.37 0.46 -0.26 0.97 -0.05 0.45 1.26 0.53 1.25 0.70 0.16 0.58 -0.55 0.27 0.59 0.60 0.66 0.14 -0.32 0.31
TUS25O20 2.17 0.44 -1.16 1.06 -0.18 0.44 0.62 0.58 0.01 1.24 -0.19 0.41 -0.93 0.56 0.05 0.45 0.19 0.27 -0.89 0.25
TUS25O21 2.04 1.04 -1.57 0.58 -0.46 1.16 0.73 0.39 0.35 0.34 -0.54 0.80 0.87 0.58 0.38 0.80 0.89 0.64 0.14 0.54
TUS26A2 1.59 0.33 0.65 0.35 0.02 0.24 -0.64 0.19 -1.43 0.45 -0.85 0.41 -1.90 0.79 -0.78 0.30 -0.84 0.37 -1.90 0.37
TUS26B14 2.48 0.90 -1.66 0.95 0.03 0.74 0.81 0.50 0.92 0.54 0.30 0.82 0.00 0.50 0.09 0.75 1.36 0.80 -0.59 0.41
TUS26E8 0.65 0.22 -1.26 0.58 -0.13 0.20 -0.54 0.24 -0.99 0.33 0.15 0.33 -1.04 0.32 -0.34 0.22 -0.60 0.43 -1.14 0.40
TUS26F20 4.48 0.43 3.91 0.86 1.36 0.47 0.69 0.61 -0.64 0.52 0.04 0.21 -0.95 0.41 2.11 0.88 1.97 0.38 -1.37 0.35
TUS26I13 3.00 1.48 0.59 0.24 1.48 0.41 0.86 1.08 0.84 1.91 1.17 0.93 0.14 0.60 0.27 0.65 1.91 0.49 -0.07 0.64
TUS26M24 1.84 0.22 1.53 0.62 0.41 0.16 -0.01 0.47 -0.59 0.33 -0.22 0.43 -1.39 0.47 0.21 0.77 0.18 0.25 -1.42 0.48
TUS26N21 2.14 0.18 0.75 0.50 -0.01 0.25 -0.49 0.54 -1.62 0.40 -1.24 0.43 -2.46 0.69 -0.49 0.74 -0.57 0.35 -2.49 0.31
TUS26O20 2.99 1.86 -1.53 0.44 1.91 0.96 1.13 1.19 1.16 0.47 -0.01 0.50 0.48 0.78 0.26 0.86 1.14 0.35 0.13 0.40
TUS26O21 3.98 1.46 -0.21 0.44 0.95 1.41 1.60 1.02 -0.07 1.94 0.25 0.63 0.52 0.28 0.22 0.58 1.81 0.62 0.41 0.37
TUS26O22 1.64 0.68 -1.71 1.15 1.22 0.39 0.52 0.27 0.02 1.29 0.11 0.71 -0.23 0.89 0.25 0.74 1.17 0.40 -0.60 0.32
TUS27A5 3.33 0.29 2.42 0.56 1.18 0.39 0.43 0.36 -0.56 0.39 -0.21 0.35 -0.78 0.39 1.77 0.73 1.92 0.51 -0.97 0.25
TUS27G24 1.41 0.27 -0.46 0.12 -0.12 0.21 -0.51 0.28 -1.50 0.29 -0.97 0.62 -2.01 0.83 -0.73 0.47 -0.19 0.71 -2.01 0.37
TUS27N11 2.24 0.79 -1.02 0.52 1.10 0.42 1.44 0.88 0.06 1.43 -0.60 0.33 -0.43 0.29 0.58 0.45 1.04 0.38 -0.16 0.99
TUS27N24 2.46 0.49 -0.65 0.75 0.89 0.66 1.39 0.86 -0.61 0.94 -0.43 0.40 0.30 0.15 1.15 0.84 1.66 0.31 0.15 0.52
TUS27O21 0.48 0.22 -2.05 0.73 -2.72 0.25 -0.62 0.21 -1.80 0.31 -0.87 0.43 -2.45 0.59 -1.97 0.60 -2.30 0.41 -2.08 0.34
TUS35I4 2.11 0.49 -0.95 0.69 1.24 0.55 0.65 0.44 0.20 0.81 0.34 0.43 0.40 0.31 0.65 0.60 1.60 0.24 0.61 0.55
TUS35J1 1.78 0.67 0.53 0.66 1.51 1.49 0.35 0.61 -0.12 0.98 0.57 0.66 0.12 0.43 1.41 0.71 1.25 0.46 -0.42 0.35
TUS35J9 1.87 0.63 -1.04 0.68 2.18 1.24 0.31 0.46 0.52 0.72 0.04 0.66 0.24 0.64 0.43 0.78 1.14 0.56 -0.39 0.49
TUS35N2 1.66 0.31 0.07 0.44 0.09 0.21 -0.26 0.34 -1.29 0.31 -0.51 0.49 -1.63 0.70 -0.74 0.46 -0.13 0.60 -1.63 0.44
TUS36B3 2.49 0.94 -1.05 0.70 -0.07 0.74 0.60 0.33 0.55 0.45 -0.35 0.33 -0.04 0.40 0.35 1.19 0.73 0.35 -0.16 0.32
10CS/Vd1 10CS//Vd1/E6 10CS/E6+Vd1 10CS//E6/Vd1 10CS/E65CS/Vd1 5CS//Vd1/E6 5CS/E6+Vd1 5CS//E6/Vd1 5CS/E6
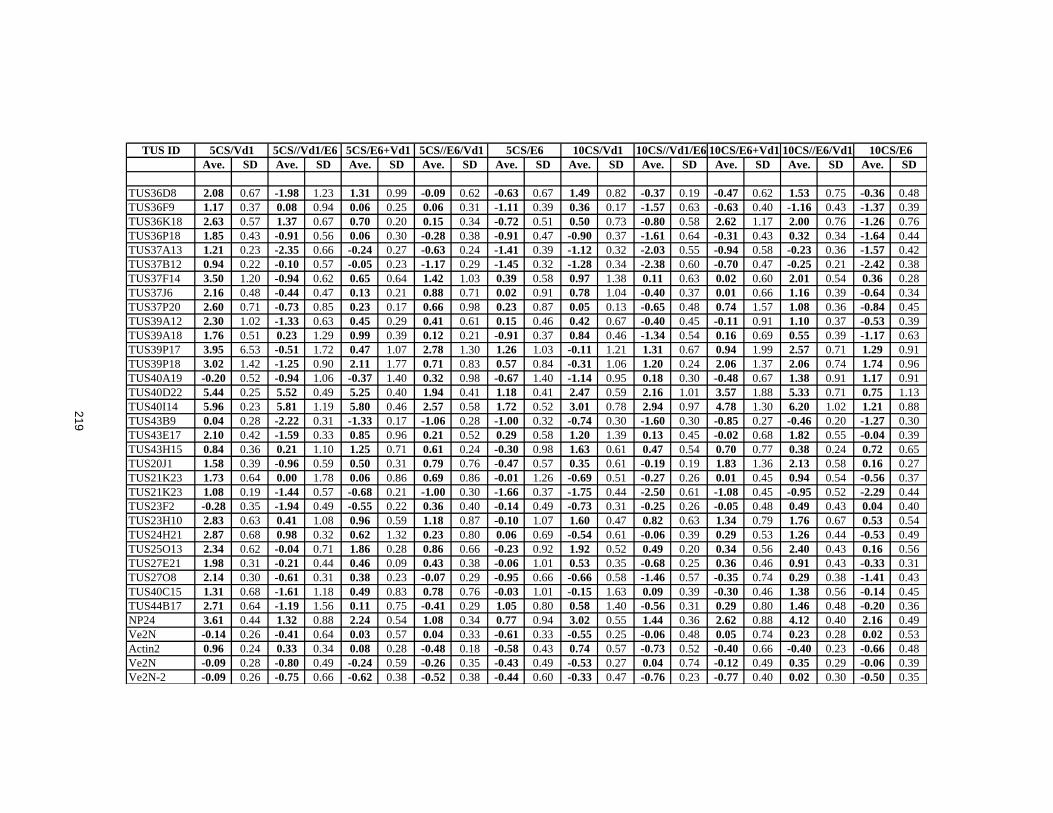
21
9
TUS ID
Ave. SD Ave. SD Ave. SD Ave. SD Ave. SD Ave. SD Ave. SD Ave. SD Ave. SD Ave. SD
TUS36D8 2.08 0.67 -1.98 1.23 1.31 0.99 -0.09 0.62 -0.63 0.67 1.49 0.82 -0.37 0.19 -0.47 0.62 1.53 0.75 -0.36 0.48
TUS36F9 1.17 0.37 0.08 0.94 0.06 0.25 0.06 0.31 -1.11 0.39 0.36 0.17 -1.57 0.63 -0.63 0.40 -1.16 0.43 -1.37 0.39
TUS36K18 2.63 0.57 1.37 0.67 0.70 0.20 0.15 0.34 -0.72 0.51 0.50 0.73 -0.80 0.58 2.62 1.17 2.00 0.76 -1.26 0.76
TUS36P18 1.85 0.43 -0.91 0.56 0.06 0.30 -0.28 0.38 -0.91 0.47 -0.90 0.37 -1.61 0.64 -0.31 0.43 0.32 0.34 -1.64 0.44
TUS37A13 1.21 0.23 -2.35 0.66 -0.24 0.27 -0.63 0.24 -1.41 0.39 -1.12 0.32 -2.03 0.55 -0.94 0.58 -0.23 0.36 -1.57 0.42
TUS37B12 0.94 0.22 -0.10 0.57 -0.05 0.23 -1.17 0.29 -1.45 0.32 -1.28 0.34 -2.38 0.60 -0.70 0.47 -0.25 0.21 -2.42 0.38
TUS37F14 3.50 1.20 -0.94 0.62 0.65 0.64 1.42 1.03 0.39 0.58 0.97 1.38 0.11 0.63 0.02 0.60 2.01 0.54 0.36 0.28
TUS37J6 2.16 0.48 -0.44 0.47 0.13 0.21 0.88 0.71 0.02 0.91 0.78 1.04 -0.40 0.37 0.01 0.66 1.16 0.39 -0.64 0.34
TUS37P20 2.60 0.71 -0.73 0.85 0.23 0.17 0.66 0.98 0.23 0.87 0.05 0.13 -0.65 0.48 0.74 1.57 1.08 0.36 -0.84 0.45
TUS39A12 2.30 1.02 -1.33 0.63 0.45 0.29 0.41 0.61 0.15 0.46 0.42 0.67 -0.40 0.45 -0.11 0.91 1.10 0.37 -0.53 0.39
TUS39A18 1.76 0.51 0.23 1.29 0.99 0.39 0.12 0.21 -0.91 0.37 0.84 0.46 -1.34 0.54 0.16 0.69 0.55 0.39 -1.17 0.63
TUS39P17 3.95 6.53 -0.51 1.72 0.47 1.07 2.78 1.30 1.26 1.03 -0.11 1.21 1.31 0.67 0.94 1.99 2.57 0.71 1.29 0.91
TUS39P18 3.02 1.42 -1.25 0.90 2.11 1.77 0.71 0.83 0.57 0.84 -0.31 1.06 1.20 0.24 2.06 1.37 2.06 0.74 1.74 0.96
TUS40A19 -0.20 0.52 -0.94 1.06 -0.37 1.40 0.32 0.98 -0.67 1.40 -1.14 0.95 0.18 0.30 -0.48 0.67 1.38 0.91 1.17 0.91
TUS40D22 5.44 0.25 5.52 0.49 5.25 0.40 1.94 0.41 1.18 0.41 2.47 0.59 2.16 1.01 3.57 1.88 5.33 0.71 0.75 1.13
TUS40I14 5.96 0.23 5.81 1.19 5.80 0.46 2.57 0.58 1.72 0.52 3.01 0.78 2.94 0.97 4.78 1.30 6.20 1.02 1.21 0.88
TUS43B9 0.04 0.28 -2.22 0.31 -1.33 0.17 -1.06 0.28 -1.00 0.32 -0.74 0.30 -1.60 0.30 -0.85 0.27 -0.46 0.20 -1.27 0.30
TUS43E17 2.10 0.42 -1.59 0.33 0.85 0.96 0.21 0.52 0.29 0.58 1.20 1.39 0.13 0.45 -0.02 0.68 1.82 0.55 -0.04 0.39
TUS43H15 0.84 0.36 0.21 1.10 1.25 0.71 0.61 0.24 -0.30 0.98 1.63 0.61 0.47 0.54 0.70 0.77 0.38 0.24 0.72 0.65
TUS20J1 1.58 0.39 -0.96 0.59 0.50 0.31 0.79 0.76 -0.47 0.57 0.35 0.61 -0.19 0.19 1.83 1.36 2.13 0.58 0.16 0.27
TUS21K23 1.73 0.64 0.00 1.78 0.06 0.86 0.69 0.86 -0.01 1.26 -0.69 0.51 -0.27 0.26 0.01 0.45 0.94 0.54 -0.56 0.37
TUS21K23 1.08 0.19 -1.44 0.57 -0.68 0.21 -1.00 0.30 -1.66 0.37 -1.75 0.44 -2.50 0.61 -1.08 0.45 -0.95 0.52 -2.29 0.44
TUS23F2 -0.28 0.35 -1.94 0.49 -0.55 0.22 0.36 0.40 -0.14 0.49 -0.73 0.31 -0.25 0.26 -0.05 0.48 0.49 0.43 0.04 0.40
TUS23H10 2.83 0.63 0.41 1.08 0.96 0.59 1.18 0.87 -0.10 1.07 1.60 0.47 0.82 0.63 1.34 0.79 1.76 0.67 0.53 0.54
TUS24H21 2.87 0.68 0.98 0.32 0.62 1.32 0.23 0.80 0.06 0.69 -0.54 0.61 -0.06 0.39 0.29 0.53 1.26 0.44 -0.53 0.49
TUS25O13 2.34 0.62 -0.04 0.71 1.86 0.28 0.86 0.66 -0.23 0.92 1.92 0.52 0.49 0.20 0.34 0.56 2.40 0.43 0.16 0.56
TUS27E21 1.98 0.31 -0.21 0.44 0.46 0.09 0.43 0.38 -0.06 1.01 0.53 0.35 -0.68 0.25 0.36 0.46 0.91 0.43 -0.33 0.31
TUS27O8 2.14 0.30 -0.61 0.31 0.38 0.23 -0.07 0.29 -0.95 0.66 -0.66 0.58 -1.46 0.57 -0.35 0.74 0.29 0.38 -1.41 0.43
TUS40C15 1.31 0.68 -1.61 1.18 0.49 0.83 0.78 0.76 -0.03 1.01 -0.15 1.63 0.09 0.39 -0.30 0.46 1.38 0.56 -0.14 0.45
TUS44B17 2.71 0.64 -1.19 1.56 0.11 0.75 -0.41 0.29 1.05 0.80 0.58 1.40 -0.56 0.31 0.29 0.80 1.46 0.48 -0.20 0.36
NP24 3.61 0.44 1.32 0.88 2.24 0.54 1.08 0.34 0.77 0.94 3.02 0.55 1.44 0.36 2.62 0.88 4.12 0.40 2.16 0.49
Ve2N -0.14 0.26 -0.41 0.64 0.03 0.57 0.04 0.33 -0.61 0.33 -0.55 0.25 -0.06 0.48 0.05 0.74 0.23 0.28 0.02 0.53
Actin2 0.96 0.24 0.33 0.34 0.08 0.28 -0.48 0.18 -0.58 0.43 0.74 0.57 -0.73 0.52 -0.40 0.66 -0.40 0.23 -0.66 0.48
Ve2N -0.09 0.28 -0.80 0.49 -0.24 0.59 -0.26 0.35 -0.43 0.49 -0.53 0.27 0.04 0.74 -0.12 0.49 0.35 0.29 -0.06 0.39
Ve2N-2 -0.09 0.26 -0.75 0.66 -0.62 0.38 -0.52 0.38 -0.44 0.60 -0.33 0.47 -0.76 0.23 -0.77 0.40 0.02 0.30 -0.50 0.35
5CS/Vd1 5CS//Vd1/E6 5CS/E6+Vd1 5CS//E6/Vd1 5CS/E6 10CS/Vd1 10CS//Vd1/E6 10CS/E6+Vd1 10CS//E6/Vd1 10CS/E6

22
0
TUS ID
Ave. SD Ave. SD Ave. SD Ave. SD Ave. SD Ave. SD Ave. SD Ave. SD Ave. SD Ave. SD
Ve2N -0.03 0.51 0.05 0.82 -0.35 0.37 -0.07 0.38 -0.03 0.51 -0.35 0.20 -0.25 0.28 -0.20 0.68 0.32 0.27 -0.13 0.33
Ve2N-2 -0.40 0.34 -1.01 0.34 -0.70 0.61 -0.74 0.28 -0.61 0.35 -0.65 0.43 -0.81 0.33 -0.70 0.43 -0.02 0.33 -0.46 0.44
NP24 3.46 0.55 0.53 0.72 3.57 1.30 0.91 0.34 1.10 0.84 1.91 0.48 1.48 0.55 3.06 1.25 4.15 0.57 2.09 0.76
Ve2N-2 -0.13 0.29 -1.75 0.26 -0.58 0.44 -0.68 0.22 -0.77 0.37 -0.88 0.44 -0.86 0.24 -0.63 0.50 0.19 0.41 -0.53 0.26
TUS17J9 4.23 0.41 0.71 1.34 3.41 0.49 0.87 0.36 0.08 0.53 0.99 0.80 0.74 0.37 1.53 0.89 3.35 0.94 0.57 0.55
TUS17K8 2.53 1.28 -0.87 0.76 0.45 0.74 1.29 0.75 0.42 0.75 0.23 0.77 0.45 0.28 2.02 0.83 3.16 0.87 1.02 0.74
TUS17N11 4.54 0.25 3.91 2.57 5.13 1.76 1.91 0.55 1.39 0.63 2.85 1.28 2.16 1.04 5.60 2.38 5.98 1.58 1.50 0.98
TUS17O13 4.06 0.79 0.84 1.05 3.58 0.98 1.45 0.41 1.03 0.38 2.48 1.06 0.39 0.26 3.33 2.00 5.10 1.29 2.21 1.34
TUS17P6 3.98 0.38 0.88 1.71 3.22 0.69 1.25 0.48 0.73 0.34 2.31 0.78 1.66 1.49 3.29 1.68 4.56 1.50 2.43 1.05
TUS19E6 1.85 0.32 -0.03 1.25 0.56 0.27 -0.63 0.49 -1.47 0.33 -1.04 0.63 -1.74 0.81 -0.37 0.45 0.06 0.88 -1.60 0.50
TUS19L21 1.30 0.33 -0.75 1.14 0.73 0.29 -0.61 0.51 -1.17 0.32 -0.75 0.42 -1.55 0.67 -0.08 0.41 0.77 0.77 -1.71 0.42
TUS20E9 1.08 0.28 -1.39 1.19 0.03 0.22 -0.91 0.53 -1.72 0.32 -1.54 0.51 -2.01 0.69 -0.74 0.41 -0.84 0.45 -1.90 0.35
TUS20I20 3.12 0.54 -1.63 0.79 1.35 0.72 0.99 0.64 0.12 0.35 0.04 0.66 -0.14 0.63 1.34 1.04 2.02 0.89 -0.18 0.90
TUS21D9 0.32 0.23 -0.59 1.21 0.21 0.26 -1.10 0.62 -1.57 0.33 -0.54 0.82 -1.70 0.77 -0.68 0.45 0.31 0.63 -1.98 0.46
TUS21E16 3.65 0.41 1.93 2.09 4.31 0.81 0.84 0.36 1.05 0.39 2.43 0.94 2.10 0.90 3.76 1.91 4.63 0.91 1.79 0.97
TUS21E18 0.51 0.28 -0.03 1.24 0.03 0.63 -1.07 0.24 -1.23 0.38 -0.06 0.71 -1.63 0.72 -0.21 0.49 0.66 0.65 -1.60 0.55
TUS21M23 1.63 0.33 -0.74 0.69 0.77 1.18 0.19 0.35 -0.19 0.49 1.05 1.12 -0.29 0.34 2.06 1.82 2.15 0.45 0.67 0.90
TUS21N18 3.49 0.47 -0.80 0.98 1.29 1.29 1.29 0.46 -0.04 0.78 -0.58 0.26 -0.02 0.16 1.69 1.29 2.19 0.60 -0.19 0.27
TUS22A3 2.10 0.49 -2.13 0.90 0.86 1.19 1.19 0.43 -0.62 0.69 0.42 0.55 -0.05 0.67 0.14 0.63 1.80 0.88 -0.12 0.53
TUS22I11 1.35 0.75 -1.48 0.57 0.63 0.41 -0.02 0.38 -0.53 0.48 -0.25 0.65 -0.24 0.71 0.39 0.31 1.01 0.43 -0.43 0.46
TUS22J17 1.60 0.30 -0.52 1.12 0.39 0.29 -0.50 0.62 -1.36 0.36 -0.70 0.66 -1.45 0.73 -0.16 0.40 -0.23 0.55 -1.41 0.38
TUS23A21 1.56 0.31 -1.29 0.84 0.12 0.23 -0.28 0.45 -0.86 0.20 -1.42 0.41 -0.83 0.23 -0.30 0.56 0.63 0.38 -1.07 0.29
TUS23I8 1.50 0.33 -0.47 0.64 0.53 0.46 -0.82 0.49 -1.05 0.67 -0.82 0.47 -1.88 0.40 -0.19 0.80 0.70 0.57 -1.75 0.43
TUS23N9 1.56 0.25 -0.36 0.90 0.09 0.31 -0.71 0.25 -1.48 0.41 -0.97 0.77 -1.88 0.70 -0.30 0.60 -0.67 0.40 -1.70 0.41
TUS24G7 4.79 0.33 2.47 0.83 1.60 0.63 0.19 0.27 -0.51 0.34 -1.00 0.24 -0.48 0.13 2.83 1.05 2.05 0.54 -1.13 0.38
TUS24I10 5.47 0.46 3.66 1.07 3.03 1.17 0.38 0.20 -0.50 0.64 -0.71 0.32 -0.50 0.41 2.82 1.23 2.39 0.67 -1.31 0.42
TUS24K19 0.84 0.30 -1.85 0.86 -0.67 0.22 -0.94 0.40 -1.84 0.39 -1.42 0.59 -2.47 0.55 -1.06 0.37 -1.08 0.37 -2.23 0.27
TUS24L20 0.59 0.25 -1.86 0.89 -0.43 0.18 -0.77 0.45 -1.84 0.29 -0.64 0.32 -1.90 0.47 -1.14 0.32 -1.55 0.21 -1.46 0.28
TUS34J12 0.57 0.29 -2.48 0.54 0.00 0.18 -1.36 0.47 -1.65 0.35 -0.37 0.28 -1.78 0.38 -0.66 0.42 -0.70 0.46 -1.51 0.31
TUS34K10 0.82 0.29 -1.94 0.94 -0.45 0.15 -1.10 0.56 -1.93 0.34 -1.97 0.17 -2.49 0.58 -1.04 0.30 -1.10 0.43 -2.16 0.29
TUS34K19 2.56 0.76 -1.45 0.86 0.91 0.45 -0.05 0.57 -0.92 0.90 0.33 0.58 -0.94 0.32 0.25 0.51 0.88 0.53 -0.95 0.54
TUS34L19 2.95 1.34 -1.02 0.77 0.09 0.87 1.06 0.76 -0.68 0.93 -0.36 0.31 -0.56 0.37 1.92 0.92 1.47 0.44 -0.42 0.30
TUS34M3 1.77 0.64 -1.41 0.77 0.50 0.44 0.09 0.69 -0.79 0.53 -0.65 0.42 -0.50 0.19 0.16 0.45 0.89 0.37 -0.71 0.48
TUS34M11 1.39 0.32 -0.89 0.70 0.13 0.31 -0.64 0.52 -1.47 0.41 -1.23 0.49 -2.08 0.75 -0.43 0.76 -0.29 0.57 -1.91 0.44
TUS34M12 2.57 1.31 -0.97 1.00 0.27 0.24 1.61 0.76 -0.28 0.67 -0.32 0.26 0.13 0.19 0.54 0.78 1.21 0.32 -0.20 0.24
5CS/Vd1 5CS//Vd1/E6 5CS/E6+Vd1 5CS//E6/Vd1 5CS/E6 10CS/Vd1 10CS//Vd1/E6 10CS/E6+Vd1 10CS//E6/Vd1 10CS/E6

22
1
TUS ID
Ave. SD Ave. SD Ave. SD Ave. SD Ave. SD Ave. SD Ave. SD Ave. SD Ave. SD Ave. SD
TUS34N18 3.07 0.51 -0.57 0.84 1.20 0.67 0.16 0.64 0.06 0.99 -0.49 0.42 -0.60 0.24 2.05 1.37 1.42 0.47 -0.69 0.39
TUS34N20 2.84 0.99 -1.36 1.50 0.92 0.58 0.69 0.75 -0.12 0.80 -0.16 0.33 -0.69 0.27 1.25 1.19 1.58 0.75 -0.60 0.45
TUS34N23 1.59 0.53 -0.23 0.51 0.65 0.36 -0.71 0.65 -1.04 0.36 -0.67 0.21 -1.39 0.46 0.34 0.37 0.99 0.47 -1.43 0.30
TUS34N6 1.38 0.21 -1.07 0.99 0.09 0.20 -0.76 0.48 -1.39 0.41 -1.13 0.51 -1.95 0.50 -0.48 0.49 -0.27 0.65 -1.88 0.35
TUS34N7 3.21 1.50 -0.86 1.05 0.46 0.95 0.16 0.39 0.16 1.76 -0.16 0.52 -0.16 0.19 0.65 0.83 0.94 0.45 0.26 0.54
TUS34O3 3.04 0.62 -0.28 0.52 1.41 0.79 0.54 0.61 0.71 0.04 0.35 0.49 -0.45 0.38 1.39 0.48 1.33 0.24 -0.43 0.50
TUS34O19 2.34 0.70 -0.82 0.81 1.75 0.97 0.17 0.26 -0.22 0.44 0.72 0.45 -0.59 0.13 0.83 0.77 1.10 0.51 -0.40 0.47
TUS35A7 1.87 0.41 -1.50 0.82 0.89 0.35 0.30 0.30 -0.70 0.93 -0.06 0.62 -0.90 0.14 0.49 0.66 1.09 0.52 -0.58 0.54
TUS35A11 2.12 0.76 -0.61 0.60 0.81 0.41 0.18 0.42 -0.78 0.52 0.51 0.80 -0.74 0.20 1.61 0.83 1.13 0.36 -0.31 0.56
TUS35B4 1.83 0.67 -1.38 0.55 1.11 2.02 0.44 1.04 -0.32 1.06 -0.77 0.42 0.32 0.37 0.77 0.93 1.43 0.41 0.12 1.01
TUS35B13 3.09 1.08 -1.18 0.92 1.10 1.39 0.61 1.12 0.58 1.55 -0.12 0.39 0.03 0.47 0.97 1.52 2.14 0.85 0.16 0.40
TUS35B24 2.05 0.58 -0.95 0.81 1.77 1.73 0.76 1.22 -0.07 0.90 0.32 0.72 -0.45 0.57 0.49 0.52 1.01 0.30 -0.43 0.45
TUS35E4 2.34 1.48 -1.20 0.71 1.51 1.65 0.24 0.96 1.26 0.61 0.30 0.89 -0.23 0.67 1.51 1.24 0.96 0.44 0.19 1.11
TUS35E7 1.52 0.64 -1.52 0.93 1.39 0.96 0.93 1.05 -0.04 0.78 -0.34 0.47 0.00 0.49 0.41 0.58 0.87 0.52 0.01 0.39
TUS35E9 2.04 0.35 -1.15 0.80 0.82 0.13 -0.06 0.54 -1.13 0.99 0.21 0.45 -0.54 0.30 0.99 0.67 1.04 0.40 -0.46 0.36
TUS35E13 3.18 1.47 -1.26 0.86 0.63 1.18 1.42 0.92 0.40 0.94 -0.06 1.37 -0.30 0.34 0.11 1.08 1.76 0.59 -0.60 0.35
TUS35G20 1.35 0.33 -1.08 0.86 -0.84 0.53 -0.17 0.37 -1.04 0.33 -0.16 0.53 -1.54 0.72 -1.00 0.59 -1.13 0.52 -1.43 0.43
Ve1A 1.36 0.51 -1.19 0.66 -0.18 1.51 1.00 1.52 -0.50 1.08 -0.11 1.11 1.50 1.45 -0.97 0.56 1.91 1.24 0.42 1.36
Ve1B 2.29 1.29 -1.80 0.91 0.19 1.09 0.27 1.21 0.42 1.74 -0.71 0.84 2.60 5.60 0.17 1.53 2.15 0.97 1.26 0.72
Ve2A 0.96 0.52 -1.11 0.69 0.18 1.39 -0.09 0.30 -0.68 1.23 0.22 1.37 0.88 0.57 -0.57 0.63 2.93 1.30 1.59 0.91
Ve2B 1.14 0.45 -1.20 0.68 0.11 1.00 -0.02 0.55 -1.18 1.50 -0.09 0.43 1.40 0.66 0.94 0.52 2.21 0.94 1.75 0.77
PAL Ex1 0.26 0.06 -1.31 0.66 -0.35 0.28 -0.40 0.36 -0.76 0.45 0.08 0.65 0.10 0.61 -0.36 0.31 0.36 0.33 0.44 0.39
PAL Ex2 0.93 0.30 -0.47 0.36 -0.15 0.21 -0.51 0.46 -0.94 0.32 -0.34 0.26 -0.86 0.36 0.10 0.53 0.35 0.26 -0.44 0.19
Actin -0.62 0.30 -0.45 0.66 -0.41 0.25 0.46 0.53 0.25 0.40 -0.08 0.73 0.53 0.73 0.11 0.54 0.20 0.50 0.40 0.38
TUS48N3 1.02 0.31 -0.65 0.60 0.14 0.34 -1.20 0.19 -1.68 0.29 -1.14 0.49 -2.20 0.80 -0.56 0.51 -0.32 0.62 -2.07 0.38
TUS48N15 0.59 0.24 -0.39 0.85 0.50 0.61 -0.83 0.22 -0.58 0.64 1.04 1.19 -0.85 0.64 0.41 0.26 0.07 0.57 -0.31 0.71
TUS48N22 2.79 0.31 1.33 0.92 0.75 0.32 -0.47 0.30 -1.28 0.53 -0.73 0.59 -1.69 0.64 0.81 0.99 0.48 0.94 -1.79 0.48
TUS48O5 4.89 0.35 1.26 0.65 1.61 0.22 1.39 0.70 1.10 0.54 0.45 0.75 0.10 0.29 3.00 1.35 3.65 1.34 -0.12 0.72
TUS48P5(wrong?)1.40 0.87 -4.91 4.01 0.06 1.06 -1.20 0.65 -3.74 1.79 9.19 9.62 0.79 0.81 -0.26 0.43 1.31 1.75 -0.97 0.66
TUS48P5 3.72 0.20 1.60 0.50 3.34 0.35 0.55 0.22 0.55 0.43 1.81 0.59 1.84 0.82 3.69 0.98 3.90 1.07 1.47 0.91
TUS48P8 1.45 0.29 -0.46 1.43 0.25 0.18 -0.85 0.26 -1.46 0.42 -1.11 0.32 -1.60 0.67 -0.27 0.24 -0.23 0.36 -1.60 0.29
TUS24N16 1.29 0.25 -1.12 0.77 -0.20 0.19 -0.78 0.38 -1.67 0.35 -1.35 0.37 -2.27 0.68 -0.97 0.34 -0.95 0.40 -1.99 0.38
TUS25J8 1.55 0.29 -0.72 0.54 0.18 0.41 -0.95 0.23 -1.36 0.65 -0.84 0.70 -1.81 0.72 -0.72 0.40 -0.52 0.44 -1.98 0.39
Ve2N -0.06 0.52 -0.01 0.84 -0.11 0.64 -0.27 0.45 -0.48 0.38 -0.56 0.44 -0.09 0.51 0.16 0.68 0.76 0.35 -0.02 0.40
5CS/Vd1 5CS//Vd1/E6 5CS/E6+Vd1 5CS//E6/Vd1 5CS/E6 10CS/Vd1 10CS//Vd1/E6 10CS/E6+Vd1 10CS//E6/Vd1 10CS/E6

22
2
TUS ID
Ave. SD Ave. SD Ave. SD Ave. SD Ave. SD Ave. SD Ave. SD Ave. SD Ave. SD Ave. SD
TUS14H13 3.70 0.20 0.91 0.74 1.25 0.23 1.00 0.45 0.48 0.33 -0.06 0.69 0.08 0.63 2.37 1.09 3.56 0.79 -0.44 0.79
TUS14J7 1.07 0.26 -0.61 0.78 0.03 0.29 -1.08 0.37 -1.51 0.45 -1.20 0.30 -2.16 0.52 -0.51 0.31 -0.15 0.60 -2.07 0.38
TUS16C8 1.50 0.37 -1.07 0.63 0.16 0.29 -0.73 0.24 -0.83 0.43 -1.02 0.29 -0.99 0.48 0.64 0.25 0.86 0.62 -1.27 0.30
TUS18M11 1.80 0.46 -1.51 0.75 -0.26 0.35 0.33 0.39 0.25 0.46 -1.04 0.31 0.09 0.59 1.08 0.59 0.71 0.38 -0.03 0.34
TUS19N14 2.43 0.66 -0.10 1.07 0.73 1.12 -0.24 0.37 -0.36 0.51 -0.42 0.79 -0.44 0.46 1.38 1.11 1.13 0.60 -0.44 0.50
TUS20E24 1.34 0.29 -1.50 0.85 -0.28 0.32 -0.99 0.15 -1.52 0.30 -1.20 0.29 -1.48 0.56 -0.59 0.21 -0.12 0.48 -1.44 0.36
TUS14A2 4.31 0.53 2.22 1.13 2.93 0.90 1.01 0.37 0.13 0.78 0.86 0.56 1.31 0.82 2.59 0.74 3.63 0.64 0.75 0.65
TUS14B6 3.47 1.19 0.31 0.53 0.32 1.16 1.23 0.60 1.48 0.30 1.32 1.16 1.04 0.37 2.24 0.90 3.63 0.66 1.38 0.95
TUS14C1 4.09 0.62 2.51 0.92 1.86 0.45 1.12 0.81 1.25 0.29 0.32 1.23 1.19 1.57 2.87 1.27 3.65 1.97 -0.91 0.61
TUS14C15 2.17 0.51 1.27 2.39 0.96 0.50 1.24 0.74 -0.17 0.96 -0.03 0.58 0.31 0.43 1.46 1.50 1.70 0.55 -0.04 0.57
TUS14E11 2.89 0.36 1.67 0.54 2.58 0.69 0.33 0.29 0.64 1.04 0.27 0.86 0.74 0.59 2.58 0.41 3.05 0.70 0.45 0.64
TUS14F17 4.70 0.36 5.40 1.32 3.60 0.56 0.97 0.25 1.26 0.78 1.93 0.97 2.12 0.83 4.59 0.63 4.44 1.03 2.31 0.62
TUS14H14 5.60 0.35 3.55 0.73 7.48 2.58 2.99 0.45 2.42 0.58 2.65 1.46 3.73 0.88 6.32 1.41 6.34 1.83 3.70 1.31
TUS14J8 1.83 0.72 -1.01 0.77 1.16 0.95 -0.12 0.87 -0.99 0.63 0.17 0.92 1.16 0.58 -0.40 0.87 2.60 1.41 1.39 0.63
TUS14J16 3.80 0.60 3.67 0.79 3.42 0.31 0.08 0.17 0.15 0.35 -0.29 0.63 1.06 0.86 3.34 0.77 3.49 1.29 0.40 0.70
TUS14K1 -0.37 0.31 -2.70 0.35 -0.04 0.16 -0.57 0.17 -0.65 0.69 -0.24 0.32 -0.86 0.40 -0.32 0.38 -0.37 0.36 -0.66 0.26
TUS14M2 0.95 0.36 -0.62 0.43 0.40 0.32 -0.96 0.26 -0.89 0.81 -0.69 0.63 -1.20 0.51 0.23 0.65 0.77 0.30 -1.69 0.45
TUS14M4 2.42 0.56 0.65 1.08 1.60 1.02 0.86 0.48 0.07 0.40 -0.37 0.53 0.25 0.68 1.20 0.77 1.15 0.39 0.03 0.43
TUS14O1 5.39 0.49 3.91 1.12 3.56 1.02 2.04 0.40 1.59 0.55 1.83 1.53 1.82 0.69 4.10 1.60 4.18 1.20 2.06 1.09
TUS14P18 4.27 0.38 1.14 0.51 1.84 0.65 1.34 0.88 0.07 0.73 -0.21 0.41 -0.09 0.35 2.28 0.63 2.60 0.58 0.30 0.37
TUS15A4 5.40 0.42 5.17 1.67 2.21 0.65 0.77 0.35 -0.81 0.28 -0.43 0.33 -0.28 0.50 3.90 0.98 2.98 0.53 -0.97 0.36
TUS15A17 5.04 0.27 3.95 1.31 1.96 0.38 0.69 0.34 -1.13 0.73 -0.91 0.44 -0.36 0.30 3.43 0.77 2.30 0.70 -1.17 0.38
TUS15G8 5.36 0.68 5.21 0.98 3.12 1.14 2.64 5.56 0.12 0.58 -0.23 1.04 -0.41 0.25 4.01 0.58 3.01 0.72 -1.09 0.26
TUS15I10 4.09 0.30 2.17 0.45 1.98 0.53 0.84 0.45 0.03 0.96 1.15 0.76 0.35 0.28 3.13 0.59 3.33 0.89 0.73 0.59
TUS15I21 4.71 0.38 4.02 0.73 3.78 0.83 1.48 0.29 0.97 0.95 1.14 0.78 1.75 0.72 3.78 0.38 4.26 0.45 0.75 0.37
TUS16A16 3.38 0.29 2.16 0.82 1.88 0.43 -0.23 0.53 -0.39 0.39 -0.68 0.34 -0.72 0.48 2.43 0.92 1.30 0.77 -0.64 0.50
TUS17A4 3.11 0.33 2.32 0.56 2.14 0.42 0.20 0.50 -0.14 0.29 -0.53 0.58 -0.07 0.19 2.27 0.69 2.34 0.59 -0.08 0.37
TUS17C11 1.41 0.28 -0.97 0.87 0.19 0.22 -0.94 0.54 -1.62 0.37 -1.53 0.61 -2.21 0.55 -0.51 0.91 0.01 0.93 -1.75 0.65
TUS17F17 1.37 0.20 -1.14 0.78 0.26 0.30 -0.90 0.51 -1.56 0.37 -1.56 0.62 -2.24 0.60 -0.50 0.86 -0.02 0.86 -1.73 0.66
TUS17G9 3.44 0.42 1.17 1.29 1.50 0.56 0.91 0.33 1.41 0.75 0.92 0.45 0.88 0.96 2.17 0.82 2.54 0.88 1.28 0.55
TUS49A5 1.98 0.38 -0.27 1.15 1.15 0.79 0.62 0.49 -0.43 0.87 0.13 0.30 -0.88 0.16 0.50 0.26 1.16 0.45 -0.34 0.34
TUS49A17 2.49 0.70 -0.36 1.46 1.27 0.88 1.46 0.61 -0.23 0.64 -0.23 0.47 0.25 0.28 2.03 0.76 2.44 0.69 0.26 0.57
TUS49A23 0.98 0.32 -1.72 0.59 -0.56 0.43 -1.14 0.33 -1.60 0.33 -2.02 0.34 -2.58 0.43 -0.67 0.46 0.02 0.54 -2.33 0.33
TUS49C23 1.50 0.35 -0.97 0.40 -0.21 0.26 -0.62 0.21 -1.04 0.28 -1.25 0.34 -1.05 0.33 0.49 0.36 1.71 0.41 -1.64 0.36
TUS49D2 1.85 0.30 -1.39 0.54 -0.04 0.33 -0.08 0.69 -0.87 0.40 -0.48 0.34 -0.81 0.12 1.38 1.86 1.54 0.55 -0.88 0.45
5CS/Vd1 5CS//Vd1/E6 5CS/E6+Vd1 5CS//E6/Vd1 5CS/E6 10CS/Vd1 10CS//Vd1/E6 10CS/E6+Vd1 10CS//E6/Vd1 10CS/E6

22
3
TUS ID
Ave. SD Ave. SD Ave. SD Ave. SD Ave. SD Ave. SD Ave. SD Ave. SD Ave. SD Ave. SD
TUS49D20 4.13 0.57 0.81 0.75 2.25 0.25 1.02 0.42 1.99 0.46 0.52 0.97 0.83 0.63 2.74 0.82 3.54 0.95 0.39 0.72
TUS49G17 4.03 0.92 0.49 1.00 1.21 0.58 1.99 1.26 1.65 0.75 0.76 0.97 0.71 0.86 1.30 0.57 2.32 0.79 0.03 0.42
TUS49H16 2.73 0.32 -0.62 0.63 -0.04 0.21 -0.55 0.32 -1.32 0.38 -1.72 0.44 -2.02 0.68 0.49 0.83 1.56 0.99 -1.96 0.49
TUS49I17 3.48 0.41 -0.07 0.37 1.42 0.23 1.18 0.38 1.18 0.67 0.44 0.66 1.03 0.42 3.07 1.32 3.30 0.88 0.32 0.37
TUS49K5 2.10 0.65 -1.28 0.23 0.15 0.49 0.74 0.54 -0.09 0.54 -0.42 0.27 -0.54 0.19 0.60 0.29 1.57 0.41 -0.47 0.43
TUS49K15 1.66 0.23 0.34 0.77 0.56 0.38 -0.87 0.13 -1.18 0.42 -0.96 0.33 -1.63 0.79 -0.18 0.61 -0.06 0.54 -1.45 0.57
TUS49M21 2.01 0.25 -1.39 0.66 -0.90 0.37 -0.85 0.13 -1.55 0.36 -2.30 0.37 -2.43 0.42 -0.11 0.66 0.94 0.75 -2.46 0.26
TUS49N18 2.42 0.53 -1.18 0.25 0.26 0.58 1.08 0.25 0.31 0.95 -0.25 0.19 0.38 0.22 0.95 0.27 2.56 0.60 0.40 0.27
Ve2N 0.00 0.47 -0.11 0.38 0.02 0.54 -0.08 0.38 -0.68 0.80 -0.87 0.34 -0.35 0.21 0.11 0.65 0.29 0.46 0.16 0.48
NP24 3.23 0.34 0.68 0.73 3.40 1.72 0.90 0.50 1.06 0.59 1.33 0.62 1.21 0.33 3.51 0.59 3.81 0.81 2.02 0.54
NP24 4.05 1.35 0.84 1.01 1.89 0.56 0.94 0.46 0.66 1.12 1.00 0.88 1.26 0.61 4.03 1.00 3.87 0.86 1.91 0.69
Ve1A 0.59 1.76 -1.04 1.08 -0.02 0.51 -0.76 1.41 -0.02 2.24 -1.33 0.95 4.13 6.90 -1.44 1.92 1.79 0.66 1.21 0.45
Ve1B 1.37 1.63 -1.57 0.69 -0.64 1.29 1.23 0.41 -1.21 1.70 -0.21 1.15 0.95 0.80 -0.14 1.01 2.20 0.46 2.76 1.12
Ve2N 0.11 0.53 0.15 0.94 0.45 0.81 -0.07 0.60 -0.07 0.78 -0.74 0.54 -0.05 0.49 0.07 0.52 0.36 0.42 0.20 0.40
TUS45G3 5.24 0.38 5.70 2.58 5.30 0.41 2.30 0.45 1.38 0.69 1.56 1.75 2.52 0.88 4.81 1.14 5.12 1.63 1.55 0.89
TUS45M2 0.25 0.38 -0.48 0.50 0.15 0.30 -1.25 0.37 -1.72 0.28 -0.11 0.80 -1.84 0.69 -0.30 0.43 -0.34 0.34 -1.53 0.47
TUS45N7 1.69 0.29 -1.06 0.78 0.08 0.36 -0.55 0.38 -1.21 0.41 -1.06 0.61 -1.90 0.57 -0.35 0.52 0.01 0.45 -1.51 0.35
TUS45O6 5.63 0.72 5.43 1.32 4.60 0.59 1.87 0.44 1.60 0.75 2.26 1.04 2.56 0.97 5.40 0.96 4.85 1.09 1.76 0.79
TUS45O7 5.07 0.32 4.94 0.79 5.20 0.54 1.82 0.66 1.32 0.74 2.05 0.98 1.21 0.40 4.82 0.56 5.11 1.78 1.21 0.95
TUS45O8 2.46 0.62 0.41 0.60 1.99 0.49 0.88 0.66 -0.09 0.67 1.48 0.95 -0.53 0.18 1.90 0.56 1.92 0.57 -0.10 0.46
TUS46A8 1.23 0.28 -0.44 0.71 0.12 0.14 -1.08 0.10 -1.50 0.39 -1.14 0.59 -2.02 0.65 -0.70 0.37 -0.55 0.33 -1.86 0.35
TUS46B7 3.53 0.92 0.68 0.74 1.25 0.98 0.88 0.49 -0.36 0.70 -0.18 0.55 -0.29 0.36 1.82 0.62 2.19 0.66 -0.23 0.62
TUS46B24 1.35 0.31 -0.57 0.73 -0.08 0.70 -0.88 0.47 -1.55 0.39 -1.33 0.63 -2.31 0.61 -0.84 0.40 -0.72 0.29 -1.99 0.32
TUS46D2 1.53 0.31 -0.04 0.69 0.28 0.14 -0.85 0.47 -1.51 0.40 -1.31 0.55 -2.26 0.64 -0.78 0.39 -0.65 0.32 -1.99 0.35
TUS46E9 3.51 0.50 3.56 1.42 5.09 1.49 1.01 0.44 0.84 0.31 1.42 0.95 2.36 0.91 4.53 0.85 4.43 1.20 2.47 0.78
TUS46I9 3.28 0.66 -0.08 1.33 1.05 0.36 0.53 0.57 -0.31 0.59 -0.35 0.58 0.22 0.92 1.70 0.91 3.35 0.90 -0.48 0.28
TUS46J17 1.36 0.36 0.04 0.87 0.24 0.18 -0.31 0.50 -1.19 0.21 -0.67 0.44 -1.90 0.54 0.09 0.61 -0.07 0.38 -1.71 0.43
TUS46J19 4.02 0.92 0.23 0.60 2.55 0.92 2.00 0.60 0.42 1.35 0.66 0.64 0.24 0.64 2.86 0.91 2.46 0.75 0.57 0.43
TUS46N7 0.71 1.61 -1.45 1.27 -0.15 1.78 0.00 0.24 -1.65 1.09 0.04 1.48 0.24 0.89 -0.03 0.73 0.76 1.13 -0.05 0.58
TUS46O7 0.96 0.52 -0.13 0.58 0.38 0.19 -1.01 0.39 -1.57 0.40 -0.90 0.45 -2.07 0.71 -0.38 0.48 -0.20 0.42 -2.02 0.40
TUS48D8 2.79 0.96 0.88 1.48 3.07 1.22 2.14 1.15 -0.70 1.57 0.32 0.66 0.36 0.63 1.75 0.86 1.88 0.63 -0.04 0.58
TUS48E17 2.06 1.19 -0.57 0.71 -0.14 0.48 0.33 0.55 -0.42 0.83 -0.33 0.25 -1.06 0.45 -0.21 0.17 1.02 0.38 -0.81 0.72
TUS48F3 -0.71 0.45 0.12 0.91 0.24 0.32 -0.43 0.29 -0.09 0.40 -0.34 0.42 -0.84 0.31 -0.18 0.55 0.31 0.57 -0.40 0.62
TUS48F13 1.61 0.47 0.34 0.53 1.01 0.39 -0.22 0.54 -1.01 0.33 -0.37 0.58 -1.62 0.19 0.10 0.48 0.44 0.60 -0.98 0.62
5CS/Vd1 5CS//Vd1/E6 5CS/E6+Vd1 5CS//E6/Vd1 5CS/E6 10CS/Vd1 10CS//Vd1/E6 10CS/E6+Vd1 10CS//E6/Vd1 10CS/E6

22
4
TUS ID
Ave. SD Ave. SD Ave. SD Ave. SD Ave. SD Ave. SD Ave. SD Ave. SD Ave. SD Ave. SD
TUS48I10 5.59 0.51 4.89 1.00 5.18 0.29 1.70 0.28 1.35 0.29 0.97 0.99 1.04 0.41 3.98 1.01 4.54 1.70 0.95 1.11
TUS48K10 6.12 0.39 7.01 1.08 7.24 0.96 2.42 0.66 2.13 0.58 3.51 1.11 4.11 1.56 6.58 1.04 7.34 1.70 2.96 1.39
TUS48K21 2.29 0.59 1.04 0.93 1.38 0.24 -0.29 0.44 -1.03 0.44 -0.88 0.48 -1.64 0.74 0.52 0.82 0.48 0.90 -1.33 0.60
TUS48L15 1.04 0.36 0.13 0.47 0.54 0.20 -0.67 0.61 -0.98 0.49 -0.53 0.93 -1.49 0.23 0.38 0.60 0.26 0.62 -1.44 0.45
Actin -0.90 0.30 -0.31 0.41 -0.18 0.19 0.30 0.24 0.45 0.36 -0.86 0.43 0.34 0.68 0.29 0.62 -0.01 0.52 0.44 0.47
Ve1A 0.84 1.25 -0.94 0.58 0.51 1.44 2.12 1.37 -0.19 1.40 -0.80 0.43 1.17 1.00 -0.16 0.73 2.19 0.98 2.09 1.77
Ve1B 2.30 1.08 -0.68 0.66 0.42 1.29 1.63 1.00 -0.52 0.95 -0.36 0.45 1.12 0.90 2.27 1.51 2.93 0.88 1.50 0.56
Ve2A 1.43 0.96 1.12 5.87 -0.16 0.76 0.76 0.69 -0.15 1.35 -0.27 1.09 1.28 0.43 2.44 1.88 1.63 0.47 1.55 0.38
Ve2B 1.65 0.60 -1.46 0.20 1.87 2.49 1.06 0.91 1.56 1.36 0.00 0.71 1.19 0.64 1.93 0.79 2.75 0.57 1.54 0.32
PALEx1 0.31 0.23 -0.02 0.42 -0.27 0.69 -0.13 0.36 -0.72 0.33 -0.32 0.43 -0.17 0.42 -0.19 0.44 0.78 0.58 0.30 0.30
PALEx2 0.79 0.18 0.05 0.27 0.05 0.41 -0.52 0.28 -0.68 0.20 -0.35 0.42 -1.04 0.29 0.11 0.39 0.63 0.33 -0.60 0.31
Actin -0.86 0.19 0.21 0.28 -0.10 0.18 0.52 0.38 0.56 0.37 -0.69 0.66 0.39 0.76 0.28 0.28 0.03 0.52 0.49 0.40
TUS26B8 1.65 0.44 -2.10 1.07 0.60 1.34 0.33 0.55 -0.46 0.98 1.50 1.76 0.00 0.45 2.42 1.24 1.57 0.58 0.40 0.34
TUS27N21 0.57 0.27 -1.54 0.47 -1.92 0.12 -0.69 0.16 -1.39 0.47 -1.22 0.32 -2.32 0.53 -1.38 0.57 -2.13 0.34 -1.94 0.38
TUS35A9 1.53 0.58 -0.65 0.46 0.44 0.59 0.84 1.26 -0.30 0.69 -0.60 0.40 -1.04 0.33 0.09 0.95 0.98 0.58 -0.74 0.41
TUS35E17 0.75 0.63 -0.36 0.29 0.30 0.22 -0.99 0.24 -1.09 0.56 -1.18 0.37 -1.81 0.61 -0.12 0.57 0.28 0.50 -2.06 0.43
TUS35D11 1.07 0.73 -0.29 0.28 0.00 0.19 -0.95 0.26 -1.51 0.35 -1.45 0.52 -2.67 0.64 -1.16 0.35 -1.07 0.28 -2.28 0.45
TUS38M10 2.67 1.41 -1.55 0.99 1.33 0.81 1.06 0.94 0.94 1.12 -0.22 0.47 -0.94 0.41 0.99 0.90 0.85 0.51 -0.70 0.40
TUS43I19 5.12 0.39 4.09 1.86 5.27 1.71 2.57 0.34 1.93 0.73 2.41 0.84 2.64 0.76 5.05 0.43 5.71 1.10 2.14 0.42
TUS44B14 2.47 1.02 -1.49 1.16 -0.67 0.55 0.26 1.12 0.06 0.84 0.87 1.12 0.29 0.64 2.68 1.59 2.41 0.85 0.84 0.74
TUS14J8 -1.75 0.23 -2.50 0.36 -1.17 0.23 0.24 0.24 0.36 0.47 -1.57 0.43 -0.43 0.33 -0.56 0.37 -0.31 0.42 0.27 0.34
TUS14L6 3.13 1.24 -0.37 1.35 1.29 0.75 0.72 0.95 1.54 0.30 -0.08 1.03 -0.02 0.29 1.08 0.57 1.81 0.40 0.32 0.51
TUS17O13 4.56 0.33 2.61 1.28 3.17 1.48 1.82 0.33 1.12 0.73 2.23 1.06 1.56 0.75 5.73 1.03 3.50 0.98 2.70 1.09
TUS18D14 0.90 0.36 -0.14 0.31 -0.09 0.39 -0.98 0.52 -1.24 0.54 -1.57 0.48 -2.51 0.71 -0.81 0.52 -1.00 0.31 -2.34 0.43
TUS20N21 2.06 1.03 -1.78 1.10 2.33 1.00 0.70 0.73 0.43 1.31 0.05 0.65 -0.52 0.42 0.48 0.43 1.43 0.80 -0.19 0.87
TUS21G10 0.99 0.36 -1.07 0.52 0.06 0.27 -0.60 0.14 0.13 0.93 -0.70 0.19 -0.96 0.36 0.10 0.59 0.83 0.43 -1.28 0.35
TUS21J13 2.85 1.04 -1.48 0.72 0.31 0.49 0.48 0.41 -0.33 1.19 -0.77 0.42 -0.01 0.34 0.61 0.92 1.68 0.30 0.27 0.36
TUS22D22 2.20 1.14 -0.81 1.56 0.19 0.64 1.20 1.15 -0.22 1.09 -0.63 0.54 0.05 0.20 -0.21 0.74 1.53 0.58 0.04 0.54
TUS27P8 1.77 0.57 -0.79 1.42 1.64 0.98 0.39 0.82 0.09 0.30 -0.16 0.43 -0.14 0.40 0.95 0.50 1.04 0.37 -0.58 0.34
TUS28B7 1.38 0.93 -0.44 2.19 1.84 1.06 0.85 0.68 -0.61 0.56 0.37 0.77 -0.13 0.63 1.12 0.98 1.79 0.98 0.37 0.58
TUS28C3 0.56 0.18 -0.36 0.47 0.42 0.16 -0.59 0.27 -1.12 0.49 -0.80 0.45 -1.69 0.71 -0.76 0.18 -0.79 0.28 -1.77 0.60
TUS28C5 1.69 0.71 -0.75 0.52 -0.83 0.85 1.49 1.55 -0.28 1.23 -0.51 0.82 -0.32 0.69 1.98 1.29 1.51 0.63 -0.02 0.98
TUS34B13 1.81 0.34 0.30 0.18 0.72 0.17 -0.68 0.14 -0.95 0.42 -0.96 0.23 -2.09 0.51 0.00 0.57 -0.44 0.41 -1.70 0.53
TUS34C3 1.03 0.77 -1.19 0.70 0.10 0.90 0.18 0.80 0.41 0.82 -0.76 0.29 0.59 1.51 0.46 1.55 2.19 0.71 0.05 0.82
TUS34C17 1.87 0.50 -0.96 0.50 0.73 0.72 1.08 0.49 0.19 0.59 -0.28 0.35 -0.34 0.27 0.31 0.41 0.94 0.36 -0.04 0.48
5CS/Vd1 5CS//Vd1/E6 5CS/E6+Vd1 5CS//E6/Vd1 5CS/E6 10CS//Vd1/E6 10CS/E6+Vd1 10CS//E6/Vd1 10CS/E610CS/Vd1

22
5
TUS ID
Ave. SD Ave. SD Ave. SD Ave. SD Ave. SD Ave. SD Ave. SD Ave. SD Ave. SD Ave. SD
TUS34E23 1.88 0.66 -0.95 0.70 1.22 0.77 0.35 0.56 -0.08 0.64 0.02 0.53 -0.63 0.47 1.37 0.42 1.13 0.34 -0.58 0.37
TUS34F13 1.00 0.34 -0.50 0.63 -0.09 0.77 -1.00 0.27 -1.27 0.45 -1.62 0.52 -2.64 0.73 -0.56 0.52 -0.44 0.35 -2.04 0.40
TUS34F14 1.42 0.47 0.08 1.00 0.67 0.73 0.62 0.42 -0.07 0.21 -0.38 0.37 -0.27 0.23 0.39 0.32 0.75 0.44 -0.06 0.36
TUS34F20 2.16 0.97 -0.90 0.62 0.11 0.82 0.37 0.35 0.12 1.35 -0.13 0.45 0.14 0.46 0.77 0.78 1.43 0.65 0.25 0.51
TUS34F5 2.34 0.31 1.66 0.64 1.10 0.22 0.67 0.32 -0.37 0.59 -0.46 0.53 -0.62 0.37 1.24 0.50 1.01 0.32 -0.80 0.29
TUS34F9 1.16 0.30 0.85 0.89 0.72 0.32 -0.94 0.46 -1.23 0.43 -1.14 0.32 -2.26 0.79 -0.44 0.26 -0.17 0.52 -2.18 0.57
TUS34G9 1.81 0.38 -0.06 0.87 0.97 0.29 -0.28 0.30 -0.87 0.53 -0.45 0.55 -1.20 0.47 0.45 0.36 0.43 0.28 -1.23 0.49
TUS34G10 1.06 0.25 -0.35 0.66 -0.18 0.26 -0.48 0.22 -1.63 0.47 -1.86 0.58 -2.57 0.50 -0.87 0.50 -0.73 0.49 -2.77 0.35
TUS34G12 1.51 0.52 0.04 1.18 0.95 0.52 0.37 0.30 -0.92 1.35 -0.61 0.43 -1.44 0.40 0.17 0.15 0.30 0.41 -1.13 0.37
TUS34G18 1.99 0.48 -1.73 0.73 1.19 0.57 0.41 0.77 0.87 1.34 -0.12 0.47 -0.58 0.48 1.35 0.78 0.98 0.40 -0.60 0.40
TUS34H8 2.53 0.60 -1.25 0.82 0.37 0.66 1.68 0.97 -0.36 1.06 0.50 0.36 0.12 0.60 0.53 0.97 2.72 0.99 0.06 0.37
TUS34H11 2.19 0.38 0.11 0.63 1.29 0.71 0.76 0.29 -0.52 0.68 1.23 0.83 -0.27 0.41 1.91 0.24 1.73 0.52 0.04 0.40
TUS34I3 3.84 0.20 3.35 0.35 2.97 0.42 1.16 0.22 -0.05 0.69 0.62 0.74 -0.36 0.22 3.25 0.46 2.52 0.95 -0.06 0.49
TUS34I12 1.93 0.80 -1.42 1.18 0.59 1.17 1.21 1.19 -0.98 1.08 -0.50 0.54 -0.43 0.36 0.55 0.58 1.45 0.76 -0.22 0.44
TUS34J5 1.86 0.70 -0.08 0.53 1.14 0.96 0.99 0.70 -0.53 0.54 -0.03 0.67 -0.39 0.48 0.45 0.69 1.67 0.62 -0.39 0.42
TUS34J7 1.66 0.33 0.18 0.79 0.43 0.23 -0.63 0.29 -1.12 0.31 -1.05 0.58 -2.00 0.70 -0.41 0.63 -0.59 0.35 -1.74 0.57
TUS34J9 2.33 0.54 -0.96 1.03 0.65 1.12 0.59 0.98 -0.28 2.34 0.23 0.69 -0.46 0.28 1.22 0.03 1.29 0.72 -0.17 0.75
TUS43I21 2.02 0.46 0.99 1.44 1.19 0.80 0.52 0.96 -0.53 0.55 0.69 0.80 -0.75 0.31 1.40 0.56 1.84 0.62 0.20 0.27
TUS43K18 1.85 0.39 0.09 0.31 1.24 0.25 0.47 0.30 -0.34 0.83 0.48 1.32 -0.55 0.15 1.38 0.53 1.15 0.32 0.05 0.43
TUS43N10 1.80 0.49 -0.88 0.34 1.18 0.49 0.86 0.39 -0.41 0.59 0.87 0.56 -0.82 0.13 0.98 0.48 0.54 0.42 -0.18 0.41
TUS43N21 2.56 0.36 -0.46 0.76 0.88 0.61 1.17 0.75 -0.92 0.80 -0.11 0.36 -0.52 0.34 1.30 0.96 1.51 0.50 -0.43 0.32
TUS43N24 0.97 0.24 -1.05 0.36 -0.50 0.44 -0.86 0.14 -1.33 0.37 -1.58 0.46 -2.32 0.43 -0.87 0.43 -0.68 0.19 -1.85 0.35
TUS43O6 3.50 0.41 3.22 0.89 4.34 0.77 0.80 0.16 0.52 0.40 2.35 0.98 2.87 0.66 5.30 0.85 4.75 1.11 3.61 0.42
TUS43O7 3.59 0.32 2.95 0.87 4.09 1.55 0.82 0.22 1.18 0.42 2.33 0.88 2.57 0.82 6.00 1.80 4.95 1.58 2.80 0.63
TUS43O8 3.44 2.27 -0.90 0.69 1.88 0.66 1.35 0.36 -0.21 1.45 0.68 0.60 -0.56 0.23 1.54 0.54 1.70 0.21 -0.42 0.49
TUS43P5 2.07 0.63 -0.55 0.48 0.78 1.66 1.10 0.69 1.43 7.05 0.58 1.35 0.94 0.63 1.76 0.68 2.71 0.88 1.83 0.56
TUS43P7 3.24 0.36 2.71 0.55 5.15 1.14 0.67 0.26 0.46 1.06 2.76 0.87 3.37 0.81 5.77 1.18 5.31 0.93 4.07 0.56
TUS43P8 3.59 0.48 2.32 0.83 4.50 2.21 1.32 0.58 0.31 1.19 3.24 1.64 2.60 0.95 4.45 0.88 4.48 1.71 3.14 0.55
TUS44D18 2.77 0.44 1.39 0.47 1.18 0.21 0.50 0.15 -0.63 0.89 -0.81 0.39 -1.51 0.68 2.75 0.94 2.29 1.03 -1.41 0.65
TUS44E16 3.55 2.43 -0.26 1.46 1.17 0.44 1.27 0.73 -0.14 2.79 -0.05 0.28 -0.60 0.35 1.30 0.89 1.60 0.65 -0.59 0.28
TUS44F14 3.85 0.64 2.46 1.00 2.85 0.81 1.20 0.56 0.65 0.60 1.12 0.59 0.38 0.66 2.71 0.66 2.19 0.88 0.63 0.44
TUS44F17 4.25 0.71 3.01 1.19 3.14 0.68 1.60 0.63 0.26 1.19 0.94 0.72 0.85 0.80 3.54 0.93 3.06 0.75 0.86 0.39
TUS44J4 5.95 0.90 4.75 1.53 4.46 0.65 2.39 0.25 2.08 1.48 2.21 0.33 3.51 0.57 5.56 0.60 7.35 1.76 3.02 0.92
TUS44N7 6.07 0.74 3.95 1.26 5.11 0.99 2.66 0.79 1.74 0.98 2.68 1.37 3.24 1.02 5.46 0.43 5.94 1.33 2.78 0.94
TUS44N17 3.91 0.36 2.40 0.64 1.50 0.38 1.11 0.34 -0.29 0.51 -0.63 0.59 -1.31 0.82 2.19 0.68 0.99 1.21 -1.14 0.59
5CS/Vd1 5CS//Vd1/E6 5CS/E6+Vd1 5CS//E6/Vd1 5CS/E6 10CS/Vd1 10CS//Vd1/E6 10CS/E6+Vd1 10CS//E6/Vd1 10CS/E6
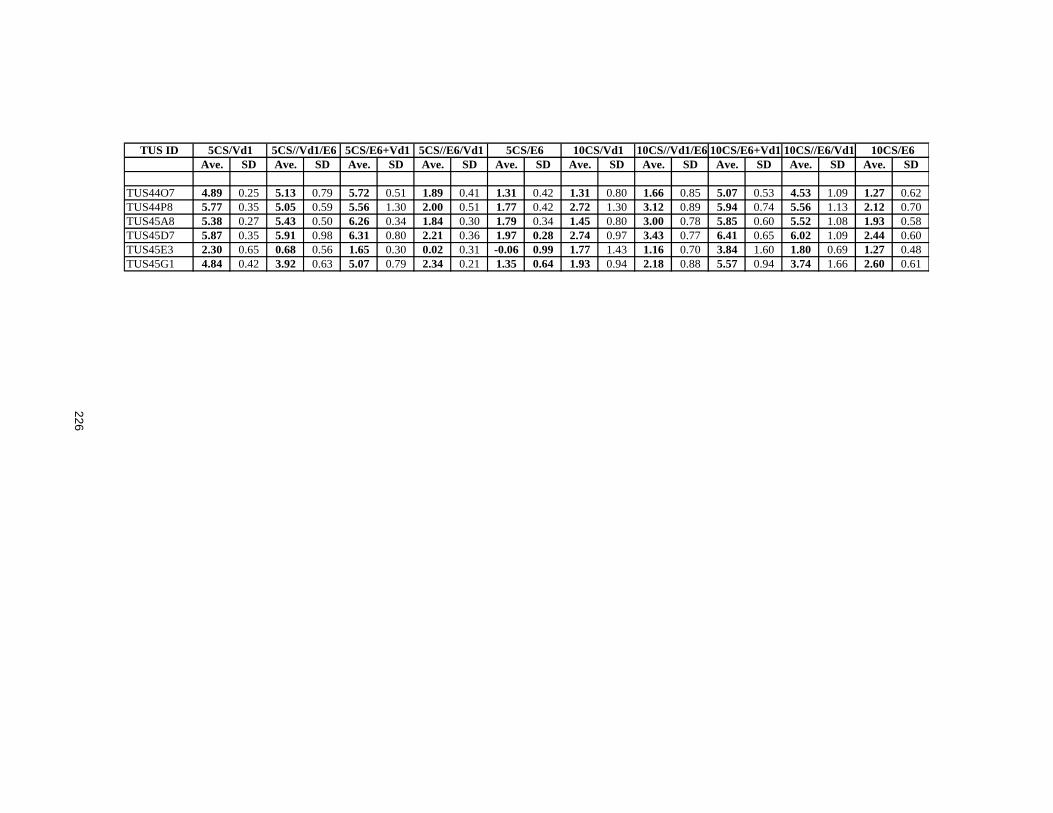
22
6
TUS ID
Ave. SD Ave. SD Ave. SD Ave. SD Ave. SD Ave. SD Ave. SD Ave. SD Ave. SD Ave. SD
TUS44O7 4.89 0.25 5.13 0.79 5.72 0.51 1.89 0.41 1.31 0.42 1.31 0.80 1.66 0.85 5.07 0.53 4.53 1.09 1.27 0.62
TUS44P8 5.77 0.35 5.05 0.59 5.56 1.30 2.00 0.51 1.77 0.42 2.72 1.30 3.12 0.89 5.94 0.74 5.56 1.13 2.12 0.70
TUS45A8 5.38 0.27 5.43 0.50 6.26 0.34 1.84 0.30 1.79 0.34 1.45 0.80 3.00 0.78 5.85 0.60 5.52 1.08 1.93 0.58
TUS45D7 5.87 0.35 5.91 0.98 6.31 0.80 2.21 0.36 1.97 0.28 2.74 0.97 3.43 0.77 6.41 0.65 6.02 1.09 2.44 0.60
TUS45E3 2.30 0.65 0.68 0.56 1.65 0.30 0.02 0.31 -0.06 0.99 1.77 1.43 1.16 0.70 3.84 1.60 1.80 0.69 1.27 0.48
TUS45G1 4.84 0.42 3.92 0.63 5.07 0.79 2.34 0.21 1.35 0.64 1.93 0.94 2.18 0.88 5.57 0.94 3.74 1.66 2.60 0.61
5CS/Vd1 5CS//Vd1/E6 5CS/E6+Vd1 5CS//E6/Vd1 5CS/E6 10CS/Vd1 10CS//Vd1/E6 10CS/E6+Vd1 10CS//E6/Vd1 10CS/E6