physical chemistry lab manual
DESCRIPTION
Physical Chemistry Lab Manual for studentTRANSCRIPT

Version 4.0
LABORATORY MANUAL
FHSC1114
PHYSICAL CHEMISTRY
FOUNDATION IN SCIENCETRIMESTER 1
UNIVERSITI TUNKU ABDUL RAHMANCENTRE FOR FOUNDATION STUDIES

Version 4.0
Table of content:
Lab Title Page
1 Introduction to laboratory safety and apparatus 1
2 Precipitation of barium (II) sulphate 7
3Determination of the amount of dissolved oxygen in a water sample byiodometry – The Winkler’s method 8
4 Gases – Boyle’s Law and Charles’s Law 11
5Thermochemistry – Determination of heat of neutralization ofhydrochloric acid by sodium hydroxide
14
6Reaction kinetics – Determination of the activation energy of the reactionbetween oxalic acid and potassium permanganate
19
7 Rate law of an iodine clock reaction 21
8 Determination of pKa of Bromocresol Green 25
9Determination of the percentages of sodium carbonate and sodiumhydroxide in a mixture
28
10 Ionic – Measurement of the conductivities of strong and weak electrolytes 30

Version 4.0
UNIVERSITI TUNKU ABDUL RAHMANCENTRE OF FOUNDATION STUDIES
LABORATORY SAFETY RULES
The following rules must be obeyed by all students in the science laboratory of the faculty. Willful orrepeated inadvertent noncompliance may result in dismissal or suspension from the laboratories.
I. No entry without permission:
i) Outsiders are not allowed to enter the laboratory without permission.
ii) Visitor must request for a lab coat from the laboratory officer before enter to the
laboratory.
iii) No student is allowed to enter the laboratory unless permission has been given by
laboratory officer or lecturer.
II. At work in the laboratory:
i) No experiment may be attempted without the knowledge and permission of lecturer
or lab officer.
ii) Laboratory coat must be worn at all times in the laboratory.
iii) Students must wear covered shoes in the laboratory. Students wearing open toes
shoes such as slippers or sandals are not allowed to work in the laboratory.
iv) Safety glasses must be worn when necessary.
v) Mobile phones are to be switched off at all times in the laboratory.
vi) Do not smoke, drink, eat, bite nails or pencils, or apply cosmetics in the laboratory.
vii) Do not pipette chemicals with mouth.
viii) Do not taste any chemicals, including diluted solutions. If any acid or alkali
accidentally enters your eyes or mouth, wash immediately with plenty of water.
Inform your lecturer or laboratory staff, and seek medical attention if necessary.
ix) Any accident must report to the lecturer or lab officer immediately.
x) Paper should never be used to light up the Bunsen burners.
xi) Used match sticks, filter papers, and other solid waste must never be thrown into the
sinks. They must be thrown into the dustbins provided. Lighted match sticks and
smoldering materials must be extinguished with tap water before thrown into the
dustbins.

Version 4.0
xii) Students must take responsibility for apparatus and equipment under their charge in
the laboratory.
xiii) Any glassware breakages, apparatus lost and equipment damages or malfunctioning
must be reported to the laboratory officer.
III. Before leaving the laboratory:
i) Ensure all the equipments and working benches used are thoroughly cleaned and
dried.
ii) Wash hands and arms with soap and water before leaving the laboratory.
iii) All stools must be kept under the benches.
iv) No student is allowed to take away any chemicals, equipment or other property of the
laboratory without permission.

Version 4.0
Topic 1: Introductory to laboratory safety and apparatus________________________________________________________________________
1. Materials requirementThere are various materials that students must bring along during laboratory session.Students will be asked to leave the laboratory if they fail to bring the items listed. Laboratory manual Appropriate PPE (Personal Protective Equipment)
Protective laboratory coating (Lab Coat) to protect you and your attire. Covered shoes to protect you from chemical burn or other hazards. Open toes
shoes are strictly not allowed. Safety glasses or goggles to protect your eyes.
Some other experimental materials which are requested by the lecturer. Calculator or scientific calculator. Record book to record observation and experiment results during lab sessions.
2. Practical ExercisesTo get the most out of the practical exercises, you are required to obey theinstructions given. These instructions have been designed to provide you withexperience in the following skills: Following instructions Handling apparatus Having due regards for safety Making accurate observations Recording results in an appropriate form Presenting quantitative results Gives valuable discussion Drawing conclusions
Following InstructionsFollow the sequence of instructions as they are provided in an appropriate order.Experimental procedures must be read through before carrying out the experiment. Drawout the procedure in a flow chart for better understanding of the steps for the experiment.
Apparatus HandlingBefore carrying out an experiment, it is important for scientists to plan and gather fortheir experiment apparatus. As such, you are advised to list down the apparatus to be usedfor the entire experiment before the start of the experiment. You will be able to masterthe basic technique of using different types of apparatus. These include measuringcylinder, bulb pipette, graduated glass pipette, volumetric flasks and burette. For differenttype of tasks, different set of the apparatus are to be used.
Version 4.0
Laboratory Safety Always move slowly and carefully in the lab. During and after practical session, never touch your mouth or eyes with fingers before
thorough wash of hands with soap and water. Make sure glass objects (e.g: thermometer or glass rod) are not placed unattended on
the bench to prevent it from being rolled off from the working bench to the floor. Always put on your PPE such as lab coat, safety glasses and wear covered shoes in
the lab.Remarks: Proper heating using Bunsen burner (even with heating of water). Proper handling of any liquids, particularly those identified as corrosive, irritant, toxic
or harmful. Careful handling of corrosive work. Allow hot plate, Bunsen burner, tripods, gauzes and beakers to cool down before
handling them. Keep long hair tied and do not wear dangly earrings. Do not allow electrical equipment to come into contact with water. If you are not sure about how to carry out a scientific procedure, ask the lecturer or
lab officer. Make sure you understand the rationale and consequences of your actions before you
act. Follow all safety instructions given in the manual or provided by the lecturer/tutor for
particular experiments (e.g. use of gloves or mask).
Making Accurate ObservationThe experiment will make it clear about the needed observation, e.g. the color changeswhen two solutions are added together or time taken for a chemical reaction. Ensure thatyou know the proper handling of relevant equipment before the start of experiment.Think carefully about the precision of your observations. You may need to find outreference for color description from external sources (e.g. reference books or onlinereferences) before the practical session.
Recording Results in an Appropriate FormResults can be recorded in various ways. Often it is helpful to record raw data in a table.Most data will be in the form of numbers, e.g. quantitative data (also known as numericaldata). However, some data, e.g. color of solution, are qualitative. Bear in mind that thebest way for data collection is to avoid missing out any observation you have made, andkeep your raw data in safe hand.
Presenting Quantitative ResultsPresentation of data can be made using table, graph or other visual means to ease resultanalysis. You will have to choose the best way to present the experimental results.
Drawing ConclusionConclusions should be drawn from and supported by experimental results.3. Writing a Scientific Report

Version 4.0
Title Refers to the subject investigated.
Introduction State the hypotheses Give well-defined reason(s) for making hypotheses. Explain the chemical basis of the experiment. Cite sources to substantiate background information. Explain how the method used will produce information relevant to the
hypotheses. State a prediction based on the hypotheses.
Material and Methods Use appropriate format. Give enough details (so that the experiment can be duplicated). State the control treatment, replication, and standardized variables that were used.
Results Summarize the data (do not include raw data). Present the data in an appropriate format (table or graph). Present tables and figures neatly so they are easily read. Label the axes of each graph correctly. Give units of measurement where appropriate. Write a descriptive caption for each table and figure. Include a short paragraph pointing out the important results (do not interpret
the data). Do not create your own data which is not true.
Discussion State whether the hypotheses was supported or proven false by the results, or else
state that the results were inconclusive. Cite specific results that support your conclusions. Compare the results, with your predictions and explain any unexpected results. Compare the results with other research or information available. Discuss any weaknesses the experimental design or problems with the
execution of the experiment. Discuss how you might extend or improve the experiment.
Conclusion State conclusion which is supported by results Restate important results.
Literature Cited Use proper citation form in the text.
Version 4.0
Use proper citation form in the Literature Cited section. Refer in the text to any source listed this section.
Acknowledgment State any appropriate and necessary acknowledgment.
4. Apparatus and Equipments
Apparatus and Equipments Description and Function
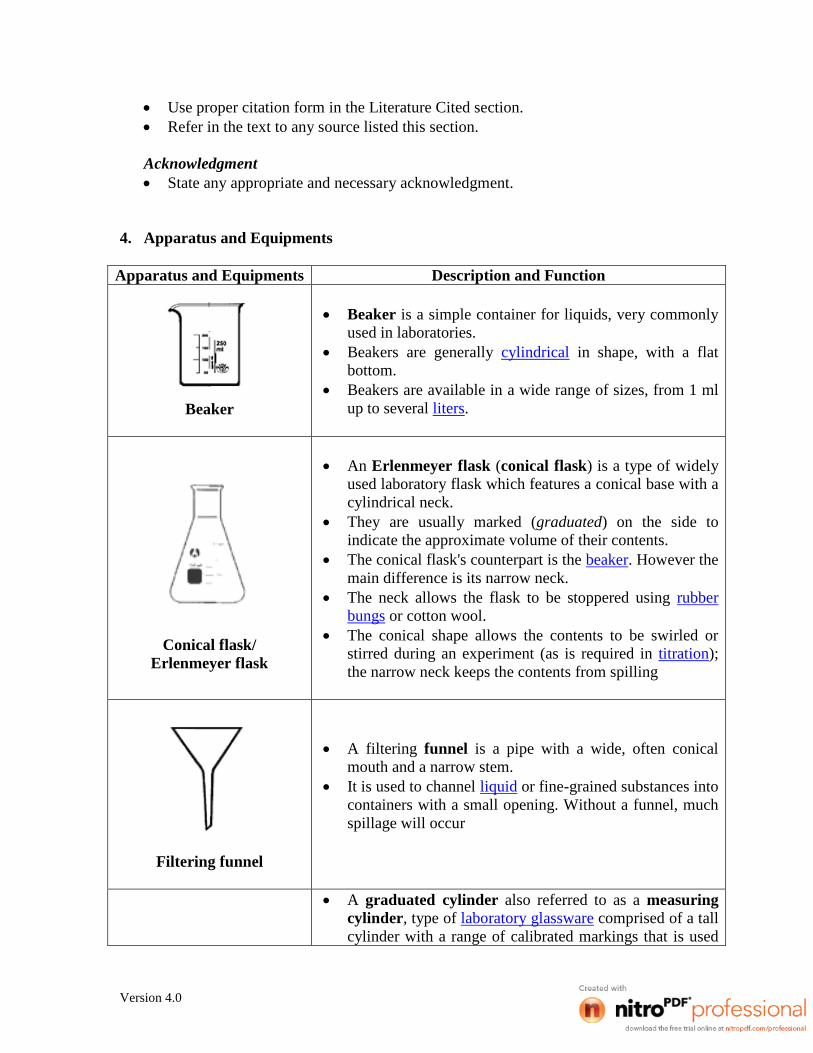
Beaker
Beaker is a simple container for liquids, very commonlyused in laboratories.
Beakers are generally cylindrical in shape, with a flatbottom.
Beakers are available in a wide range of sizes, from 1 mlup to several liters.
Conical flask/Erlenmeyer flask
An Erlenmeyer flask (conical flask) is a type of widelyused laboratory flask which features a conical base with acylindrical neck.
They are usually marked (graduated) on the side toindicate the approximate volume of their contents.
The conical flask's counterpart is the beaker. However themain difference is its narrow neck.
The neck allows the flask to be stoppered using rubberbungs or cotton wool.
The conical shape allows the contents to be swirled orstirred during an experiment (as is required in titration);the narrow neck keeps the contents from spilling
Filtering funnel
A filtering funnel is a pipe with a wide, often conicalmouth and a narrow stem.
It is used to channel liquid or fine-grained substances intocontainers with a small opening. Without a funnel, muchspillage will occur
A graduated cylinder also referred to as a measuringcylinder, type of laboratory glassware comprised of a tallcylinder with a range of calibrated markings that is used

Version 4.0
Measuring cylinder
for visually measuring the volumes of liquids in aquantitative manner.
A graduated cylinder can be made of translucent plasticor borosilicate glass.
Volumetric flask
A volumetric flask refers to graduated glassware usedfor the measurement of volume of liquids when thebottom of the meniscus is perfectly aligned with mark onthe neck of the flask.
Pipette
Pipettes are used to transfer a specific volume of liquid. 2 most common used pipette in a science laboratory are:
a) Volumetric pipette (Bulb pipette)b) Measuring pipette (Serological pipette)
Burette
Burette is a vertical cylindrical piece of laboratoryglassware with a volumetric graduation on its full lengthand a precision tap, or stopcock, on the bottom.
It is used to dispense known amount of a liquid reagent inexperiments for which such precision is necessary, such asa titration experiment.
Burettes are extremely precise: class A burettes areaccurate to ±0.05 ml.
Volumetricpipette
Measuringpipette

Version 4.0
Reagent bottles
Reagent bottles are used to hold small stocks of reagentsand samples for use.
Reagent bottles must be clean but not necessarily dry.
Desiccators
Desiccators are sealable enclosures containing desiccantsused for preserving moisture-sensitive items.
A typical desiccator contains two compartmentsseparated by a perforated plate; the desiccant is placed atthe lower compartment while the reagent is placed in theupper compartment.
It should not be used to dry an object, but to maintain analready dried object indefinitely in a dry condition.
Separating funnel
Separating funnel also known as separatory funnel orseparation funnel. It is used to partition the componentsof a mixture of immiscible liquids with differentdensities.
Typically, one of the liquids will be water, and the otheran organic solvent such as ether or chloroform.
The funnel, which is in the shape of a cone surmountedby a hemisphere, has a stopper at the top
Electronic balance
An electronic balance uses electromagnet to balance theweight on the pan.
This unit widely used in science laboratory as weighingequipment.

Version 4.0
Topic 2: Precipitation of barium (II) sulphate________________________________________________________________________
Introduction:Barium (II) nitrate reacts with sulphuric acid to produce barium (II) sulphate as whiteprecipitate which is difficult to dissolve in water. If sulphuric acid is in excess comparedto barium (II) nitrate, the entire ion Ba2+ will precipitate as barium (II) sulphate.Therefore, barium (II) nitrate is a limiting reagent and the quantity of precipitate formedis determined by this limiting reagent. The excess acid will then be separated usingdistilled water.
Apparatus and Equipments:Pipette (10mL) Hot water bathBeaker (100mL) Filter funnelGlass rod Filter paperWatch glass Electronic balance
Materials:0.1 M Barium (II) nitrate solution, Ba(NO3)2
0.5 M Sulphuric acid, H2SO4
Procedures:1. Pipette 10mL of Ba(NO3)2 into a 100mL beaker.2. Add 10mL of diluted H2SO4 and stir with a glass rod. Allow the precipitate to settle.3. Weigh a clean and dry watch glass with a filter paper. Then, put the filter paper into
the filter funnel.4. Carefully filter all the liquid in the beaker.5. Add 20mL of distilled water into the same beaker, stir for 1 minute, and rinse the
glass rod and the side of the beaker. Wait for a while and filter like the previous step.6. Decant the filtrate and remove the filter paper with precipitate to the watch glass.7. Dry the precipitate on top of the hot water bath until there is no liquid left on the
watch glass.8. When the precipitate dries, cool and measure the weight. Repeat this step until the
mass is same or less than 0.02g different.
Treatment of Data:Mass of dry watch glass with filter paper gMass of watch glass with filter paper + precipitate gMass of BaSO4 precipitate g
Calculation:1. Calculate the molecular weights of Ba(NO3)2 and BaSO4.2. Calculate the moles of BaSO4 are produced in this experiment.3. Calculate the moles of Ba(NO3)2 are required to react with H2SO4.4. Determine which is limiting reactant in this experiment.5. Determine the percentage yield of BaSO4.

Version 4.0
Topic 3: Determination of the amount of dissolved oxygen in a water sample byiodometry – the Winkler’s method
________________________________________________________________________
Introduction:Myriad forms of life exist in lakes, streams and oceans. These creatures depend ondissolved oxygen (D.O.) in water for their life support. Occasionally something willhappen which depletes the oxygen content of a natural water system.
The dissolved oxygen content is an important index when considering the suitability ofwater for town supply. Good potable water will give a D.O. value close to the theoreticalvalue for a saturated solution for oxygen in water. When there is pollution from organicmatter and other trade effluents, the D.O. is used up in various biochemical oxidationprocesses and it is only slowly replaced through surface adsorption. Such water will givea low D.O. content until oxidation is completed. Adequate D.O. is necessary for the lifeof fish and other aquatic organisms.
Gases which are dissolved in water obey Henry’s law to a first approximation:
Xi = k . Pi
Where Xi is the mole fraction of the gas in solution, k is the Henry’s law constant and Pi
is the partial pressure of the gas. For oxygen, at 20 oC, k = 2.5 x 10⁻⁵ atm-1 and P (O2) =0.21 atm for air.
Also, it is approximately true that X (O2) = n (O2) / n (H2O) since n (O2) << n (H2O) andn (H2O) = 5.5 mol/1. Thus, n (O2) = 2.9 x 10⁻⁴ mol/1. The solubility of oxygen is thenS(O2) = 9.3 mg/1 at 20 oC. Experiment indicates that solubility of oxygen is actually 9.2mg/1 of D.O. in pure water at 20 ºC (Table 1).
The solubility decreases with increasing temperature and increasing electrolyteconcentration.
Table 1: Solubility of oxygen in natural waterT (oC) D.O. in pure water (mg/L)
0 14.610 11.320 9.230 7.6
The method described below for the determination of oxygen in water is based on thatdevised by Winkler. Since the D.O. content of a sample is so transitory, the sample mustbe “fixed” very soon after collection. The sample is first treated with excess ofmanganese (II), potassium iodide and sodium hydroxide. The white manganese (II)hydroxide that is formed reacts rapidly with oxygen to form brown manganese (III)hydroxide.

Version 4.0
4Mn(OH)2 (s) + O2 + 2H2O 4Mn(OH)3 (s)
When acidified, the manganese (III) oxidizes iodide which is already present to iodine:
2Mn(OH)3 (s) + 2I- + 6H+ I2 + 6H2O + 2Mn2+
The liberated iodine, which is equivalent to the D.O. content, may then be titrated withstandard sodium thiosulphate:
I2 + 2S2O32- S4O6
2- + 2I-
Apparatus:Volumetric pipette (100 mL) Reagent bottle (1 L)Conical flask (500 mL) Conical flask stopperBurette Retort standBurette clamp Measuring cylinder (5 mL)Pasteur pipette
Materials:Manganese sulfate solutionAlkaline-iodide solution0.025 M Sodium thiosulphate solutionConcentrated sulphuric acidStarch solution
Procedures:
1. When sampling water, care must be taken to ensure that a good representative sampleof the water to be analyzed is obtained. For most purposes, this includes attention todissolved gases. Therefore, the water sample should be taken in a clean bottle whichmust be filled to overflowing and tightly sealed with stopper without introduction ofair. If the water is sampled from a tap, it must be allowed to run for at least 5 minutesprior to sampling. For this purpose, you may collect the water into a 1 L reagentbottle fitted with a stopper.
2. Carefully remove the stopper from the conical flask and add 4 mL of the manganesesulfate solution, discharging the reagent from the tip of a pipette put well below thewater surface. Replace the stopper.
3. Similarly, introduce 4 mL of the alkaline-iodide solution.4. Place the stopper in the bottle; be sure that no air becomes entrapped. Some overflow
may occur. Thoroughly mix the content by inversion and rotation. Manganesehydroxide is precipitated and will settle on standing.
5. When the precipitate has settled, introduce 4 mL of concentrated sulfuric acid withthe tip of the pipette well below the surface of the solution.
6. Replace the stopper and mix until the precipitate dissolves completely. The dissolvedoxygen now liberates free iodine from the potassium iodide present.

Version 4.0
7. Pipette 200 mL of the acidified sample into a 500 mL conical flask and titrate with0.025 M sodium thiosulphate until the solution becomes pale yellow.
8. Add a few drops of starch indicator and continue the titration to the disappearance ofblue color.(If the blue color doesn’t appear after adding starch, repeat the titration and addingstarch before start of titration)
9. Repeat the titration twice.
Treatment of data:
Titration number 1 2 3Final volume (cm3)Initial volume (cm3)Volume used (cm3)
Average volume of titrant required for titration = ____________ cm3
Calculation:1. Determine the concentration (ppm) of dissolved oxygen (DO) in the water sample.2. Chemical equation below shows the reaction between iodine and thiosulphate.
I2 + 2S2O3-2 S4O6
-2 + 2I-
Calculate the oxidation states for the underlined elements and determine the oxidizingand reducing agents.

Version 4.0
Topic 4: Gases Boyle’s Law and Charles’s Law________________________________________________________________________
Introduction:
Boyle's Law states that the volume of a given mass of gas sample is inverselyproportional to the pressure applied to the gas if the temperature is kept constant.
P x V = constant
11 VP = 22 VP
Charles’s Law states that the volume of a given mass of gas sample is directlyproportional to its absolute temperature, if the pressure is kept constant.
T
V= constant
2
2
1
1
T
V
T
V
The data collected from the experiment can be plotted on graphs in order to see therelationship between volume and pressure and the relationship between volume andtemperature.
Apparatus and Equipments:Syringe (25 mL) Pressure GaugeBeaker (500 mL) ThermometerPlastic tubing Lubricating oilHot water bath Retort standBurette Clamp Hotplate
Procedures:
Part 1 – Boyle’s law
1. Pull the syringe plunger to 20 mL mark.2. Connect the end of the syringe to the plastic tubing.3. Connect the other end of the plastic tubing to the pressure gauge. (Make sure all of
the tubing are sealed securely)4. Record the pressure when the syringe plunger is at 20 mL.5. Reduce the volume in the steps of 2.5 mL until the 5 mL mark and record the pressure
for each.6. Plot a graph of pressure (P) versus volume (V) and pressure (P) versus inverse of
volume (1/V).
Version 4.0
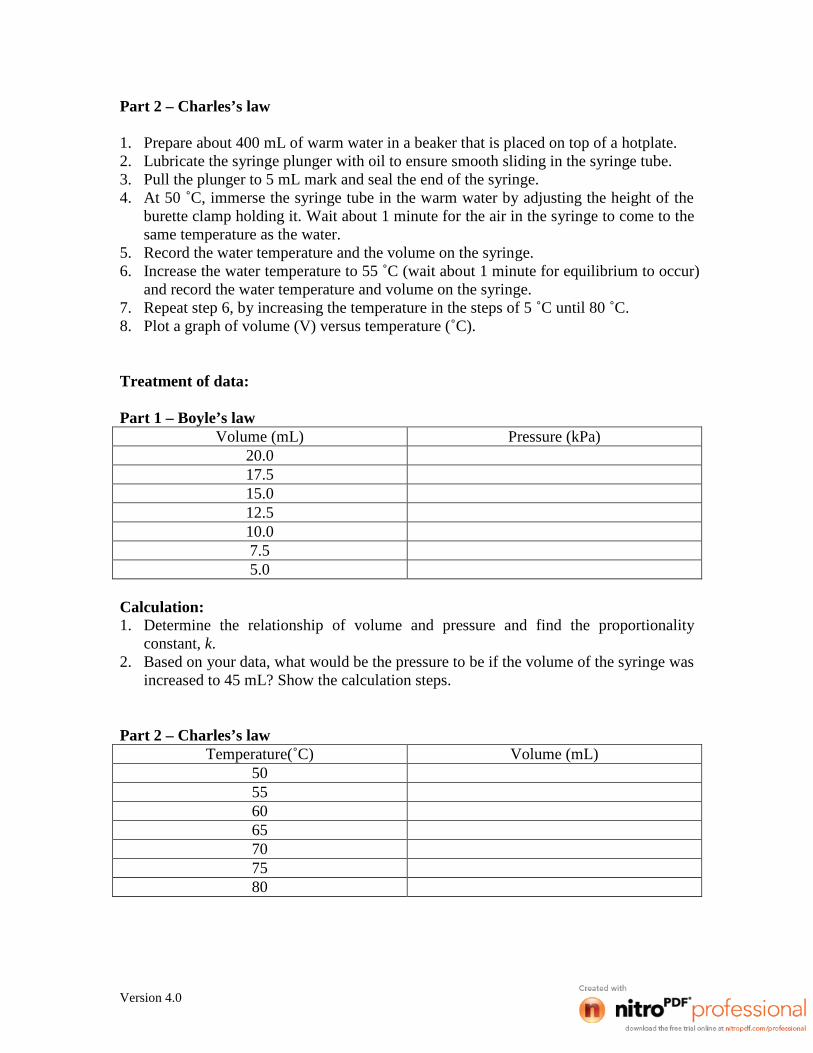
Part 2 – Charles’s law
1. Prepare about 400 mL of warm water in a beaker that is placed on top of a hotplate.2. Lubricate the syringe plunger with oil to ensure smooth sliding in the syringe tube.3. Pull the plunger to 5 mL mark and seal the end of the syringe.4. At 50 ˚C, immerse the syringe tube in the warm water by adjusting the height of the
burette clamp holding it. Wait about 1 minute for the air in the syringe to come to thesame temperature as the water.
5. Record the water temperature and the volume on the syringe.6. Increase the water temperature to 55 ˚C (wait about 1 minute for equilibrium to occur)
and record the water temperature and volume on the syringe.7. Repeat step 6, by increasing the temperature in the steps of 5 ˚C until 80 ˚C.8. Plot a graph of volume (V) versus temperature (˚C).
Treatment of data:
Part 1 – Boyle’s lawVolume (mL) Pressure (kPa)
20.017.515.012.510.07.55.0
Calculation:1. Determine the relationship of volume and pressure and find the proportionality
constant, k.2. Based on your data, what would be the pressure to be if the volume of the syringe was
increased to 45 mL? Show the calculation steps.
Part 2 – Charles’s lawTemperature(˚C) Volume (mL)
50556065707580

Version 4.0
Calculation:1. Determine the relationship of volume and temperature and find the proportionality
constant, k.2. Based on your data, postulate the x-intercept and y-intercept.

Version 4.0
Topic 5: Thermochemistry – Determination of heat of neutralization of hydrochloricacid by sodium hydroxide
________________________________________________________________________
Introduction:
In adiabatic calorimetry, we try to keep as much as possible of the heat change that iscaused by a reaction of interest confined to the reaction vessel and its content, i.e., weattempt to keep heat from leaking into and out of the calorimeter, usually by insulatingthe reaction vessel. When there is no heat leakage to the surroundings, all the heatevolved or absorbed by the reaction of interest must remain in the reaction vessel and itscontents, so it raises or lowers the temperature. It is this temperature change that wemeasure and relate to the heat evolution or absorption that has occurred.
The relationship between the amount of heat, qs that enters or leaves a system and theattendant temperature change, Δ T; may be expressed as
qs
C = —— C = total heat capacity of the system∆T
If the system is composed of several parts, e.g., of a reaction vessel plus the solution itcontains, then the total heat capacity of the system is the sum of the heat capacities of theindividual parts, C = Σ Ci . Since, in the ideal case, no heat is allowed to enter or escape,the sum of the heat from the reaction (qr) and the heat from the system (qs) must be equalto zero,
qr + qs = 0
so that,
qr + C ΔT = 0
Heat capacity is a positive quantity. Therefore, if the temperature of the system rises, i.e.,∆T is positive, then qr will be a negative quantity.
In practice, it is impossible to make a perfect calorimeter, one which has no heat leakage,so measuring the temperature change due to the heat from the reaction is complicated bytemperature changes from heat leaking into or out of the calorimeter. By taking thesefactors into account and correcting them, a graphical procedure is usually used to obtainthe temperature change ΔT, as shown in the following figure of temperature versus timefor an exothermic reaction.

Version 4.0
The initial temperature of the reaction vessel and contents was a little below roomtemperature, so heat was leaking into the system. This explains the slow rise intemperature before the reaction was initiated. After the initial sharp rise in temperaturewhen the reaction has begun, the temperature began to decrease due to heat loss from thecalorimeter. At first, these readings were a bit erratic, as temperature equilibration wasnot yet attained throughout the system.
After some time, the equilibration (and the reaction has completed, the heat loss becamesteady and the temperature decreased linearly. Extrapolation of this linear portion of thecurve back to the time when the reaction began, gives a fairly accurate value for thetemperature which would have been attained if the reaction and temperature equilibrationhad taken place instantaneously as if that no heat loss has occurred.
Generally, a chemical change is usually accompanied by an evolution or absorption ofenergy (e.g. heat); certain physical changes also produce an energy change. The heat ofneutralization of an acid by a base is the energy evolved when 1 mol of the acid isneutralized by 1 mol of a base, the reaction being carried out in dilute aqueous solution.For a strong acid and a strong base, the heat of neutralization is effectively constant.
This is because strong acids and strong bases, and the salts they form are all completelyionized in dilute solution. Thus the reaction between any strong acid and strong base issimply the formation of unionized water from H+ and OH- ions.
e.g.: HCl + KOH KCl + H2O
H+ + Cl- + K+ + OH- K+ + Cl- + H2O
H+ + OH- H2O ΔH = Heat of neutralization.ΔH
Decreasing slope dueto loss of heat to thecalorimeter walls
Starting time
Roomtemperature
ΔT

Version 4.0
The constancy of the heat of neutralization of any strong acid and any strong baseprovides simple, but convincing evidence that strong acids and bases are, in fact,completely ionized.
The temperature rises accompanying the mixing of a solution of a base with a solution ofacid at the same initial temperature in a calorimeter is caused by the heat released duringthe neutralization process.
Apparatus and Equipments:Joule calorimeterDigital stop-watchThermometer (reading to 0.1 oC)Measuring cylinder (50 mL)Hot water bathBeaker (100 mL)
Materials:0.5 M Sodium hydroxide, NaOH0.5 M Hydrochloric acid, HClDistilled water
Procedures:
Part 1 – Calibration of calorimeter
1. Measure 50 cm3 of distilled water into a calorimeter.2. Record the temperature of the water (1 minute interval) for 5 minutes.3. Add another 50 cm3 of water which has initial temperature of 50 oC into the
calorimeter and record the temperature (1 minute interval) for another 10 minutes.
Part 2 – Determination of heat of neutralization
1. Measure 50 cm3 of 0.5 M NaOH solution into the calibrated calorimeter.2. Record the temperature of the base every 2 minutes.3. Measure 50 cm3 of 0.5 M HCl into another container.4. Insert a thermometer and cool or warm slightly until the temperature of the acid is the
same as that of the base.5. Now add the acid to the base quickly and note the time of mixing.6. Record the temperature (30 seconds interval) for first 5 minutes and (1 minute
interval) for the next 10 minutes.
Version 4.0
Treatment of data:
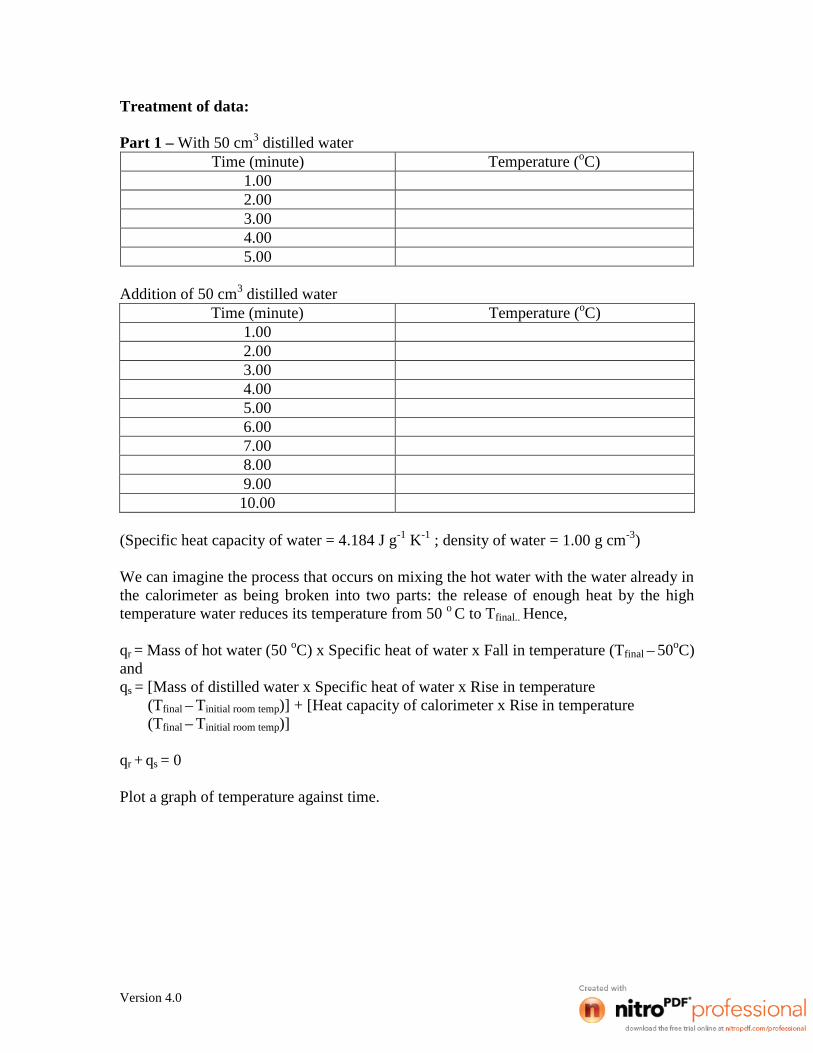
Part 1 – With 50 cm3 distilled waterTime (minute) Temperature (oC)
1.002.003.004.005.00
Addition of 50 cm3 distilled waterTime (minute) Temperature (oC)
1.002.003.004.005.006.007.008.009.00
10.00
(Specific heat capacity of water = 4.184 J g-1 K-1 ; density of water = 1.00 g cm-3)
We can imagine the process that occurs on mixing the hot water with the water already inthe calorimeter as being broken into two parts: the release of enough heat by the hightemperature water reduces its temperature from 50 o C to Tfinal.. Hence,
qr = Mass of hot water (50 oC) x Specific heat of water x Fall in temperature (Tfinal – 50oC)andqs = [Mass of distilled water x Specific heat of water x Rise in temperature
(Tfinal – Tinitial room temp)] + [Heat capacity of calorimeter x Rise in temperature(Tfinal – Tinitial room temp)]
qr + qs = 0
Plot a graph of temperature against time.

Version 4.0
Part 2 – With 50 cm3 of 0.5 M NaOHTime (minutes) Temperature (oC)
2.004.006.008.00
10.0012.00
Addition of 50 cm3 of 0.5 M HClTime (seconds) Temperature (oC)
306090
120150180210240270300360420480540600660720780840900
(Specific heat capacity of water = 4.184 J g-1 K-1 ; density of solution = 1.00 g cm-3)Assuming the specific heat of the solutions to be the same as that of water, the heatevolved by the neutralization process is given by
ΔHneutralization = MNaOH CNaOH ΔT + CCalorimeter ΔT + MHCl CHCl ΔT
Plot a graph of temperature against time.
Calculation:1. Calculate the heat of reaction (qr) for Part 1.2. Determine the heat capacity of the calorimeter.3. Determine the enthalpy of neutralization (Hneutralization) for Part 2.4. Determine the molar enthalpy of neutralization.

Version 4.0
Topic 6: Reaction kinetics Determination of the activation energy of the reactionbetween oxalic acid and potassium permanganate
________________________________________________________________________
Introduction:Reaction between oppositely charged icons are often very fast but the reaction betweensimilarly charged ions, e.g. permanganate and oxalate, may proceed at a rate which ismeasurable:
2KMnO4 + 5H2C2O4 + 3H2SO4 K2SO4 + 2MnSO4 + 8H2O + 10CO2
or
2MnO4- + 16H + + 5C2O42- K2SO4 + 2MnSO4 + 8H2O + 10CO2
The rate of this reaction is measured by the time taken for the disappearance of the purplecolor of the potassium permanganate.
Apparatus and Equipments:Measuring cylinder, test tube, water bath, stopwatch
Materials:0.02M Potassium Permanganate1 M Sulphuric Acid0.5 M Oxalic AcidTest tubeWater bathMeasuring cylinder (5mL)Stopwatch
Procedure:1. In a test tube, measure 2 cm3 of 0.02 M potassium permanganate and 4 cm3 of 1 M
sulphuric acid.2. In another test tube, place 2 cm3 of oxalic acid.3. Place the test tubes in water bath at 35 oC.4. When the solutions have attained this temperature, pour the oxalic acid into the
acidified permanganate solution and immediately start the time.5. Record the time taken for the permanganate to decolorize.6. Repeat the experiment at higher temperatures of 40, 45, 50, 55 and 60 oC.

Version 4.0
Treatment of data:Temperature, T (K) 35 40 45 50 55 601 / T (K-1)Reaction time, t (sec)ln 1/t
Plot a graph of ln 1/t against 1/T.
Calculation:1. Calculate the activation energy, Ea in J mol -1 according to the Arhenius equation
k = A e -Ea / RT

Version 4.0
Topic 7: Rate law of an iodine clock reaction________________________________________________________________________
Introduction:In this experiment you will study the reaction of hydrogen peroxide with iodide ion in thepresence of acid.
H2O2 (aq) + 2 I- (aq) + 2 H3O+ (aq) I2 (aq) + 4 H2O (l)
The rate of the reaction is very much depending on the concentrations. The easiest way tomeasure the rate of reaction is by determining the rate of formation of iodine by reactionbetween iodine (I2) and thiosulfate ion (S2O3
2-) to form the tetrathionate ion (S4O62-)
according to:
I2 (aq) + 2 S2O32- (aq) S4O6
2- (aq) + 2 I- (aq)
The rate of a chemical reaction also depends on temperature, pressure and other physicalcharacteristics of the reaction surroundings. However, the first consideration a chemistgives to a chemical reaction is the concentration of the reactants. Thus, chemists oftenchange the concentration of reactants so that they can study the effect of such changes onthe rate of the reaction.
Apparatus and Equipments:Graduated pipette(1 mL and 25 mL) 250 mL conical flaskDigital stop watch Hot water bathMeasuring cylinder Thermometer
Materials:0.36 M Sulphuric acid, H2SO4
0.025 M Potassium iodide, KI0.8 M Hydrogen peroxide, H2O2
0.0025 M Thiosulfate, S2O32-
Starch solutionDistilled water
Procedures:
Part 1 – Measurement of Rate For One Set Conditions1. To a clean conical flask, add the following in order.
43 cm3 distilled water35 cm3 0.36 M H2SO4
10 cm3 0.025 M KI10 cm3 0.0025 M thiosulfate1 cm3 starch solution

Version 4.0
2. Pipette 1 cm3 of 0.8 M hydrogen peroxide in the fume cupboard. With one eye on awatch, add the peroxide and noting the time to the nearest second.
3. Note the time at which the thiosulfate is all used up and blue colour appears. Recordthe time elapsed.
4. Measure the temperature of the reaction mixture.5. Repeat the experiment.
Part 2 – The Effect of Peroxide1. Proceed as in Part 1 but
(i) use 2 cm3 peroxide and 42 cm3 distilled water.(ii) use 0.5 cm3 of peroxide and 43.5 cm3 distilled water.
2. Plot a graph of rate against concentration of peroxide in the 3 mixtures and describe it.Use axes starting from zero for rate and for [H2O2].
Part 3 – The Effect of Iodide1. Proceed as in Part 1 but
(i) use 20 cm3 KI and 33 cm3 distilled water(ii) use 5 cm3 KI and 48 cm3 distilled water.
2. Plot a graph of rate against concentration of iodide in the 3 mixtures and describe it.Use axes starting from zero for rate and for [I-].
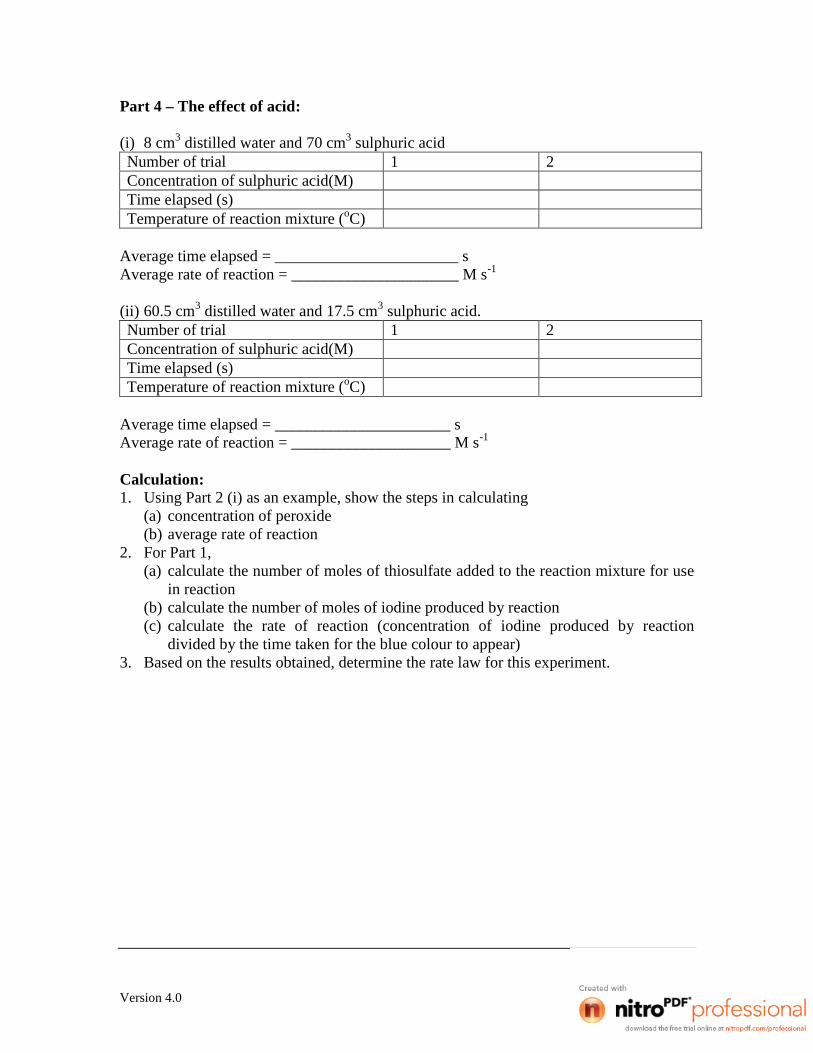
Part 4 – The Effect of Acid1. Proceed as in Part 1 but
(i) use 8 cm3 distilled water and 70 cm3 sulphuric acid.(ii) use 60.5 cm3 distilled water and 17.5 cm3 sulphuric acid.
2. Plot a graph of rate against [H3O+] in the 3 mixtures and describe it. Use axes starting
from zero for rate and for [H3O+].
Treatment of data:
Part 1 – Measurement of rate for one set conditions:
Number of trial 1 2Concentration of peroxide (M)Concentration of iodide (M)Concentration of sulphuric acid (M)Concentration of thiosulphate (M)Time elapsed (s)Temperature of reaction mixture (oC)
Average time elapsed = _________________________ sAverage rate of reaction of peroxide = _______________________ M s-1
Average rate of reaction of iodide = _________________________ M s-1
Average rate of reaction of sulphuric acid = ___________________ M s-1

Version 4.0
Part 2 – The effect of peroxide:
(i) 2 cm3 peroxide and 42 cm3 distilled waterNumber of trial 1 2Concentration of peroxide (M)Time elapsed (s)Temperature of reaction mixture (oC)
Average time elapsed = ______________________ sAverage rate of reaction = ____________________ M s-1
(ii) 0.5 cm3 of peroxide and 43.5 cm3 distilled waterNumber of trial 1 2Concentration of peroxide (M)Time elapsed (s)Temperature of reaction mixture (oC)
Average time elapsed = _____________________ sAverage rate of reaction = ___________________ M s-1
Part 3 – The effect of iodide:
(i) 20 cm3 KI and 33 cm3 distilled waterNumber of trial 1 2Concentration of KI (M)Time elapsed (s)Temperature of reaction mixture (oC)
Average time elapsed = _______________________ sAverage rate of reaction = _____________________ M s-1
(ii) 5 cm3 KI and 48 cm3 distilled waterNumber of trial 1 2Concentration of KI (M)Time elapsed (s)Temperature of reaction mixture (oC)
Average time elapsed = _______________________ sAverage rate of reaction = _____________________ M s-1
Version 4.0
Part 4 – The effect of acid:
(i) 8 cm3 distilled water and 70 cm3 sulphuric acidNumber of trial 1 2Concentration of sulphuric acid(M)Time elapsed (s)Temperature of reaction mixture (oC)
Average time elapsed = _______________________ sAverage rate of reaction = _____________________ M s-1
(ii) 60.5 cm3 distilled water and 17.5 cm3 sulphuric acid.Number of trial 1 2Concentration of sulphuric acid(M)Time elapsed (s)Temperature of reaction mixture (oC)
Average time elapsed = ______________________ sAverage rate of reaction = ____________________ M s-1
Calculation:1. Using Part 2 (i) as an example, show the steps in calculating
(a) concentration of peroxide(b) average rate of reaction
2. For Part 1,(a) calculate the number of moles of thiosulfate added to the reaction mixture for use
in reaction(b) calculate the number of moles of iodine produced by reaction(c) calculate the rate of reaction (concentration of iodine produced by reaction
divided by the time taken for the blue colour to appear)3. Based on the results obtained, determine the rate law for this experiment.
Version 4.0
Topic 8: Determination of pKa of Bromocresol Green
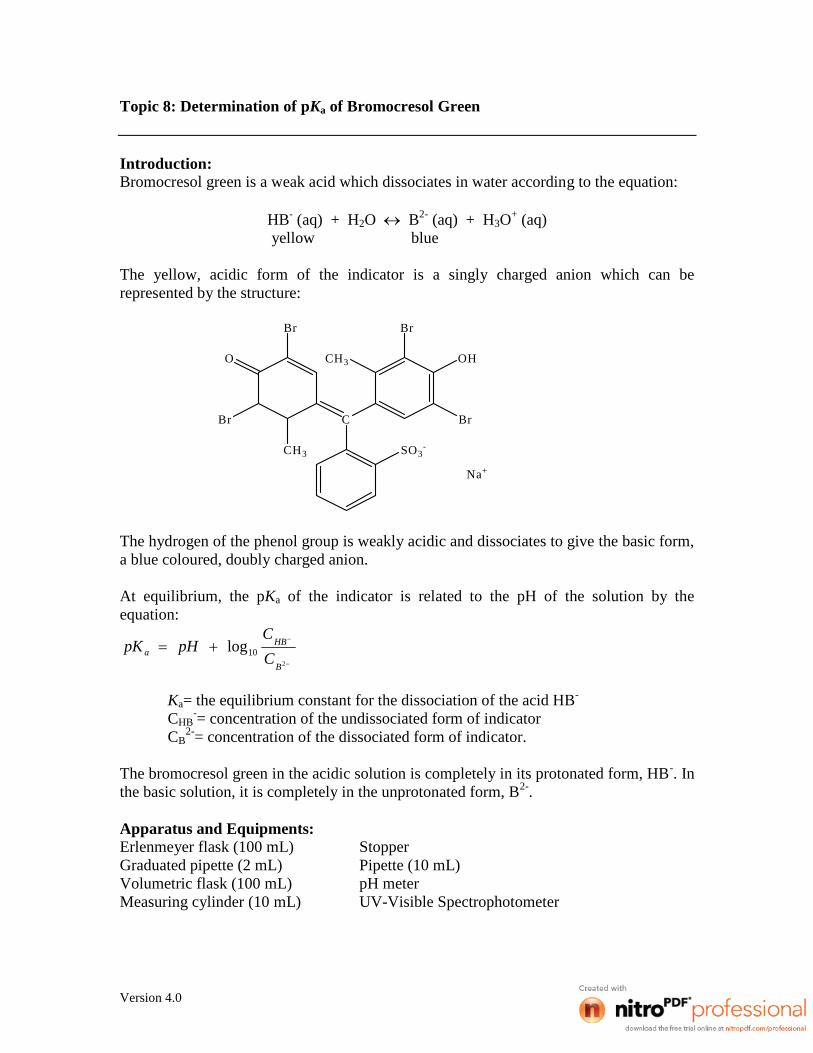
Introduction:Bromocresol green is a weak acid which dissociates in water according to the equation:
HB- (aq) + H2O B2- (aq) + H3O+ (aq)
yellow blue
The yellow, acidic form of the indicator is a singly charged anion which can berepresented by the structure:
C
SO3-
O
Br
Br
CH3
CH3
Br
OH
Br
Na+
The hydrogen of the phenol group is weakly acidic and dissociates to give the basic form,a blue coloured, doubly charged anion.
At equilibrium, the pKa of the indicator is related to the pH of the solution by theequation:
2
10logB
HBa C
CpHpK
Ka= the equilibrium constant for the dissociation of the acid HB-
CHB-= concentration of the undissociated form of indicator
CB2-= concentration of the dissociated form of indicator.
The bromocresol green in the acidic solution is completely in its protonated form, HB-. Inthe basic solution, it is completely in the unprotonated form, B2-.
Apparatus and Equipments:Erlenmeyer flask (100 mL) StopperGraduated pipette (2 mL) Pipette (10 mL)Volumetric flask (100 mL) pH meterMeasuring cylinder (10 mL) UV-Visible Spectrophotometer

Version 4.0
Materials:Bromocresol green indicator solution2 M Hydrochloric acid, HCl2 M Sodium hydroxide, NaOHBuffer solution (pH 5)Distilled water
Procedures:
1. Bromocresol green in basic solution: Put 10 cm3 of 2 M NaOH in a 100 cm3
volumetric flask. Then, pipette 2 cm3 of bromocresol green indicator solution into theflask. Fill to the mark with distilled water, stopper the flask and mix the contentsthoroughly.
2. Bromocresol green in acidic solution: Put 10 cm3 of 2 M HCl in a 100 cm3
volumetric flask. Then, pipette 2 cm3 of bromocresol green indicator solution into theflask. Fill to the mark with distilled water, stopper the flask and mix the contentsthoroughly.
3. Bromocresol green in buffer solution: Put 10 cm3 of pH 5 buffer solution in a 100cm3 volumetric flask. Then, pipette 2 cm3 of bromocresol green indicator solutioninto the flask. Fill to the mark with distilled water, stopper the flask and mix thecontents thoroughly. Measure the pH of this solution by using pH meter.
4. Use distilled water as the blank. Measure the spectrum of these solutions fromwavelength 400 – 630 nm.
Treatment of data:
Bromocresol green in pH max Absorbanceacidic solutionbasic solutionbuffer solution
Cuvette length = ______________ cm

Version 4.0
Wavelength (nm)Absorbance of bromocresol green inacidic solution buffer solution basic solution
400410420430440450460470480490500510520530540550560570580590600610620630
Plot a graph of absorbance against wavelength for each of solution with different pH.
Calculation:1. Determine the isosbestic point for bromocresol green.2. Calculate the pKa value for indicator using the pH of the indicator/buffer solution.3. Determine the maximum buffer capacity for the bromocresol green.

Version 4.0
Topic 9: Determination of the percentages of sodium carbonate and sodiumhydroxide in a mixture
________________________________________________________________________
Introduction:The total alkali (sodium carbonate and sodium hydroxide) present in a mixture isdetermined by titration with hydrochloric acid using methyl orange as indicator.
Na2CO3 + 2HCl 2NaCl + H2O + CO2
NaOH + HCl NaCl + H2O
To a second portion of the mixture, excess barium chloride solution is added.
Na2CO3 + BaCl2 2NaCl + BaCO3
Thus sodium carbonate is removed from the mixture as insoluble barium carbonate. Thehydroxide ion remaining in solution reacts with the acid during titration. Theconcentration of these is determined using phenolphthalein as indicator.
Apparatus:Burette (50mL) Volumetric pipette (25mL)Pipette filler Erlenmeyer flasksRetort stand Burette clampAsbestos board
Materials:Hydrochloric acid, HClMixture of sodium carbonate, Na2CO3 and sodium hydroxide, NaOH in a solutionBarium chloride, BaCl2
Methyl orange indicatorPhenolphthalein indicator
Procedures:1. Pipette 25 cm3 of the mixture solution into a conical flask.2. Add a few drops of methyl orange indicator, and titrate with diluted hydrochloric acid
until the yellow color just changes to orange.3. Repeat the titration twice.4. To another 25 cm3 of the mixture solution, add about an equal volume of barium
chloride solution and one or two drops of phenolphthalein.5. Titrate the mixture with diluted hydrochloric acid, noting the burette reading when
the solution is decolorized (Take care to run in the acid slowly otherwise some of thebarium carbonate may be acted upon before the end-point is reached).
6. Repeat the titration twice.

Version 4.0
Treatment of data:
(a) Methyl orange as indicator
Titration number 1 2 3
Final Volume (cm3)
Initial Volume (cm3)
Volume Used (cm3)
Average volume of hydrochloric acid required for titration = __________ cm3
(b) Phenolphthalein as indicator
Titration number 1 2 3
Final Volume (cm3)
Initial Volume (cm3)
Volume Used (cm3)
Average volume of hydrochloric acid required for titration = __________ cm3
Calculation:1. Calculate the respective concentrations of sodium carbonate and sodium hydroxide in
the mixture in the units of g L-1.2. Determine the percentage of each alkali in the mixture.
(The molecular weights of sodium hydroxide and sodium carbonate are 40 and 106respectively.)
Version 4.0
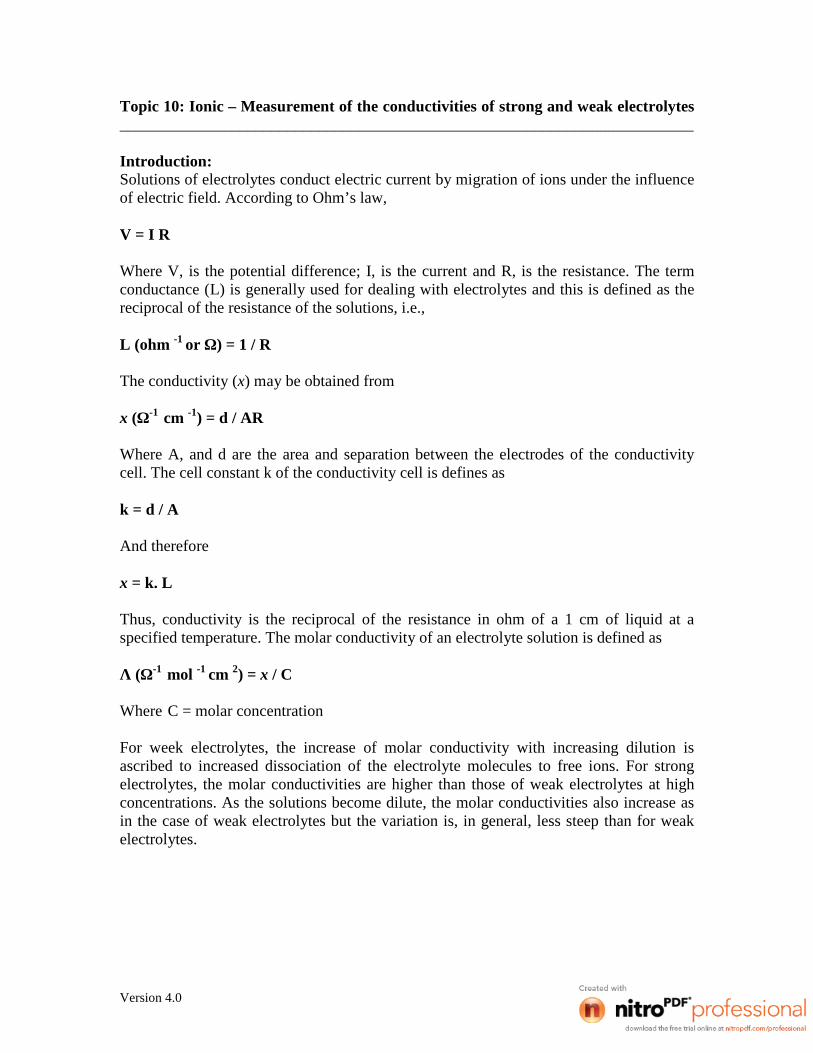
Topic 10: Ionic – Measurement of the conductivities of strong and weak electrolytes________________________________________________________________________
Introduction:Solutions of electrolytes conduct electric current by migration of ions under the influenceof electric field. According to Ohm’s law,
V = I R
Where V, is the potential difference; I, is the current and R, is the resistance. The termconductance (L) is generally used for dealing with electrolytes and this is defined as thereciprocal of the resistance of the solutions, i.e.,
L (ohm -1 or Ω) = 1 / R
The conductivity (x) may be obtained from
x (Ω-1 cm -1) = d / AR
Where A, and d are the area and separation between the electrodes of the conductivitycell. The cell constant k of the conductivity cell is defines as
k = d / A
And therefore
x = k. L
Thus, conductivity is the reciprocal of the resistance in ohm of a 1 cm of liquid at aspecified temperature. The molar conductivity of an electrolyte solution is defined as
Λ (Ω-1 mol -1 cm 2) = x / C
Where C = molar concentration
For week electrolytes, the increase of molar conductivity with increasing dilution isascribed to increased dissociation of the electrolyte molecules to free ions. For strongelectrolytes, the molar conductivities are higher than those of weak electrolytes at highconcentrations. As the solutions become dilute, the molar conductivities also increase asin the case of weak electrolytes but the variation is, in general, less steep than for weakelectrolytes.

Version 4.0
Apparatus and Equipments:Conductivity meter Beaker (100 mL)Volumetric flask (100 mL) Pasteur pipetteVolumetric pipette (50 mL) Wash bottlePipette filler
Materials:0.1 M Sodium chloride, NaCl0.1 M Acetic acid, CH3COOHDistilled Water
Procedures:1. Calibrate the conductivity meter with known cell constant.2. Measure the conductivity of 50 cm 3 of 0.1 M acetic acid.3. Repeat the measurement with 0.0500, 0.0250, 0.0125, and 0.00625M acetic acid
prepared by successive dilution.4. Repeat with sodium chloride.5. Measure the conductivity of the distilled water used.
Treatment of data:
Conductivity of distilled water = _________________Conductivity of electrolytes = Conductivity of solution - Conductivity of distilled water
Tabulate the conductivities as follows:
C (Mol dm-3 )Conductivity (Ω-1 cm-1 )
CH3COOH NaCl0.1000
0.0500
0.0250
0.0125
0.00625
Calculate the molar conductivities and tabulate the results as follows:
C1/2 (Mol dm-3 ) ½ Molar Conductivity Λ (Ω-1 mol -1 cm 2)CH3COOH NaCl
Plot a graph of Λ versus C1/2 for each electrolyte.

Version 4.0
Calculation:1. Show the steps (one example of calculation) in obtaining molar conductivity for each
electrolyte.2. Determine the conductivity and molar conductivity at infinite dilution (Λo) for each
electrolyte.(a) CH3COOH(b) NaCl
3. The molar conductivity of benzoic acid at infinite dilution is 385 -1 cm2 mol-1 and ata concentration of 0.0050 mol dm-3 is 40.8 -1 cm2 mol-1. Calculate the pKa ofbenzoic acid.