physical chemistry lab experiment
DESCRIPTION
Physical_chemistry experimenentTRANSCRIPT
Laboratory Manual Physical Chemistry Year 3
PHYSICAL CHEMISTRY YEAR 3 LABORATORY MANUAL Table of Contents General Information Report Writing
Experiment
1. Bomb Calorimetry
2. Molecular Spectroscopy
a. IR Spectroscopy
b. NMR Spectroscopy
c. UV Spectroscopy
3. The Critical Point
4. Determination of Acid Dissociation Constant For Methyl Red
5. Phase Diagram of A Three – Component Partially Immuscible Liquid
System
6. The Hydrolysis of Tert – Butyl Chloride
7. Influence of Elongation on Surface Activity For Normal Aliphatic
Alcohol Chain
8. Determination of Vapour Viscocity
Laboratory Manual Physical Chemistry Year 3
EXPERIMENT 1: BOMB CALORIMETRY
Principles of Calorimetry
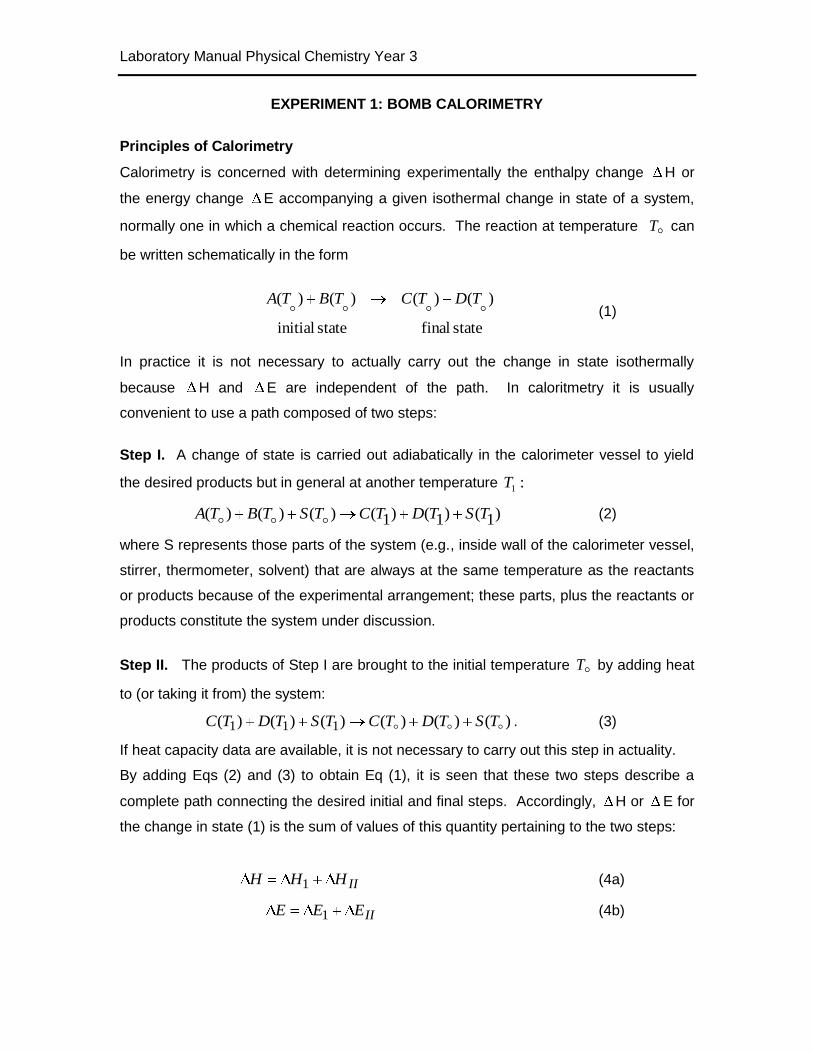
Calorimetry is concerned with determining experimentally the enthalpy change H or
the energy change E accompanying a given isothermal change in state of a system,
normally one in which a chemical reaction occurs. The reaction at temperature T can
be written schematically in the form
state final state initial
)()( )()(
TDTCTBTA (1)
In practice it is not necessary to actually carry out the change in state isothermally
because H and E are independent of the path. In caloritmetry it is usually
convenient to use a path composed of two steps:
Step I. A change of state is carried out adiabatically in the calorimeter vessel to yield
the desired products but in general at another temperature :1T
)1()1()1()()()( TSTDTCTSTBTA (2)
where S represents those parts of the system (e.g., inside wall of the calorimeter vessel,
stirrer, thermometer, solvent) that are always at the same temperature as the reactants
or products because of the experimental arrangement; these parts, plus the reactants or
products constitute the system under discussion.
Step II. The products of Step I are brought to the initial temperature T by adding heat
to (or taking it from) the system:
)()()()()()( 111 TSTDTCTSTDTC . (3)
If heat capacity data are available, it is not necessary to carry out this step in actuality.
By adding Eqs (2) and (3) to obtain Eq (1), it is seen that these two steps describe a
complete path connecting the desired initial and final steps. Accordingly, H or E for
the change in state (1) is the sum of values of this quantity pertaining to the two steps:
IIHHH 1 (4a)
IIEEE 1 (4b)
Laboratory Manual Physical Chemistry Year 3
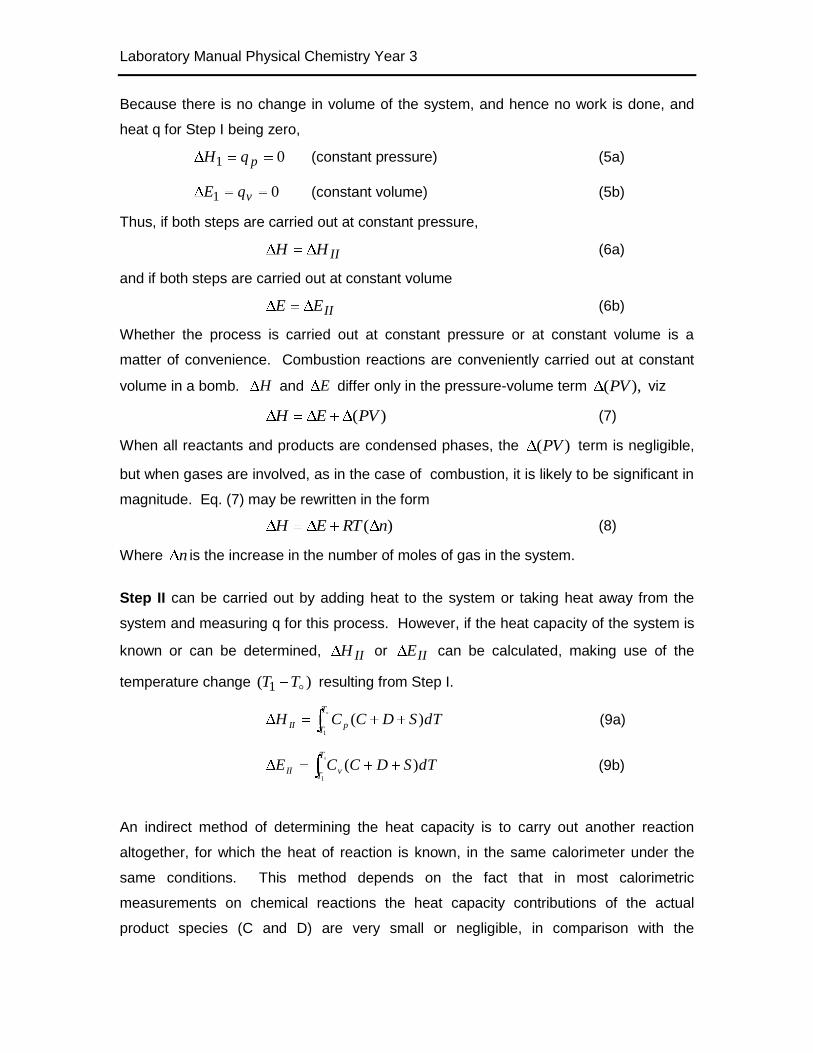
Because there is no change in volume of the system, and hence no work is done, and
heat q for Step I being zero,
01 pqH (constant pressure) (5a)
01 vqE (constant volume) (5b)
Thus, if both steps are carried out at constant pressure,
IIHH (6a)
and if both steps are carried out at constant volume
IIEE (6b)
Whether the process is carried out at constant pressure or at constant volume is a
matter of convenience. Combustion reactions are conveniently carried out at constant
volume in a bomb. H and E differ only in the pressure-volume term ),(PV viz
)(PVEH (7)
When all reactants and products are condensed phases, the )(PV term is negligible,
but when gases are involved, as in the case of combustion, it is likely to be significant in
magnitude. Eq. (7) may be rewritten in the form
)( nRTEH (8)
Where n is the increase in the number of moles of gas in the system.
Step II can be carried out by adding heat to the system or taking heat away from the
system and measuring q for this process. However, if the heat capacity of the system is
known or can be determined, IIH or IIE can be calculated, making use of the
temperature change )( 1 TT resulting from Step I.
dTSDCCHT
TpII )(
1
(9a)
dTSDCCET
TvII )(
1
(9b)
An indirect method of determining the heat capacity is to carry out another reaction
altogether, for which the heat of reaction is known, in the same calorimeter under the
same conditions. This method depends on the fact that in most calorimetric
measurements on chemical reactions the heat capacity contributions of the actual
product species (C and D) are very small or negligible, in comparison with the
Laboratory Manual Physical Chemistry Year 3
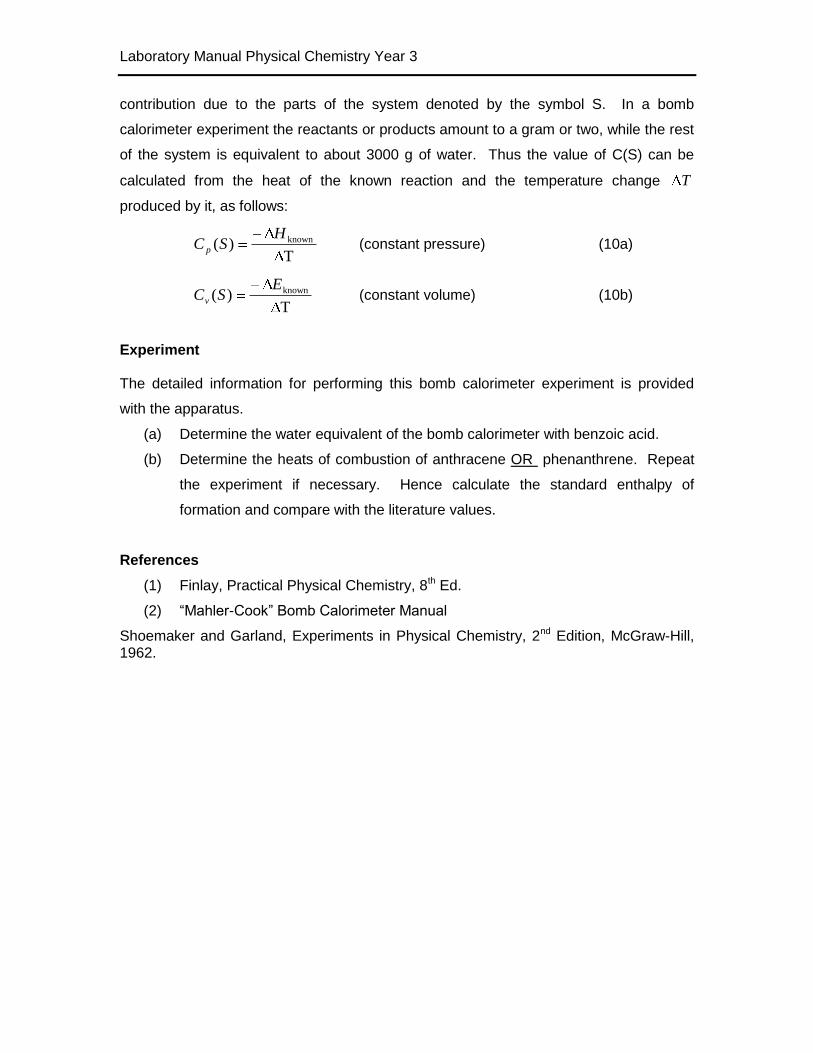
contribution due to the parts of the system denoted by the symbol S. In a bomb
calorimeter experiment the reactants or products amount to a gram or two, while the rest
of the system is equivalent to about 3000 g of water. Thus the value of C(S) can be
calculated from the heat of the known reaction and the temperature change T
produced by it, as follows:
T
)( knownHSC p (constant pressure) (10a)
T
)( knownESCv (constant volume) (10b)
Experiment The detailed information for performing this bomb calorimeter experiment is provided
with the apparatus.
(a) Determine the water equivalent of the bomb calorimeter with benzoic acid.
(b) Determine the heats of combustion of anthracene OR phenanthrene. Repeat
the experiment if necessary. Hence calculate the standard enthalpy of
formation and compare with the literature values.
References
(1) Finlay, Practical Physical Chemistry, 8th Ed.
(2) “Mahler-Cook” Bomb Calorimeter Manual
Shoemaker and Garland, Experiments in Physical Chemistry, 2nd Edition, McGraw-Hill, 1962.
Laboratory Manual Physical Chemistry Year 3
EXPERIMENT 2: MOLECULAR SPECTROSOPY
(A) Infra-Red Spectroscopy
This experiment is designed to familiarize you with certain techniques, features and
applications of infrared spectroscopy. Specifically, this experiment deals with
intermolecular hydrogen-bonding of phenol in solution.
Intermolecular Hydrogen-bonding of Phenol
General
An O-H bond normally gives rise to a sharp absorption band in the region 3500-3700 cm-
1. If, however, the hydroxyl group takes part in a hydrogen bond, the O-H resonance is
shifted to a lower frequency, considerably intensified in terms of band area, and
considerably broadened. In cases of intermolecular hydrogen bonding in suitable
solutions an equilibrium may exist between molecules with „free‟ hydroxyl groups and
those with „bonded‟ hydroxyl groups. The spectra of the two (or more) types of molecule
will be superimposed, giving both sharp O-H absorptions and broader O-H absorptions
at lower frequency. Dilution breaks up the hydrogen bonds, and, relatively speaking the
sharp peak will increase in intensity while the hydrogen bonding.
The intensity of an absorption may be defined by a molar extinction coefficient, , based
on measurements of peak heights (or, more strictly, on integrated band areas). If I is
the transmitted intensity of radiation in the absence of the absorption band, but I the
intensity transmitted at the band absorption maximum, then is given by
)/(log10 IIlC ………….. (1)
Where C is the concentration of the solution in moles per litre and l is the path length in
cm.
Suppose an equilibrium exists for phenol in solution in CC14 of the type (N.B. this is but
one of several possibilities):-
Laboratory Manual Physical Chemistry Year 3
2 2 (PhOH)PhOH
We will refer to the left-hand side species as free phenol and the right-hand side species
as bonded phenol. The sharp O-H band at ca. 3620 cm-1 could be assumed to be due
solely to free phenol. For a given total concentration of phenol only a proportion of the
molecules will be free. Dilution increases this proportion and in theory at infinite dilution
all the molecules will be free. If we knew the true extinction coefficient, of the O-H
absorption of free phenol we could calculate the concentration, fC , of free phenol at
any total phenol concentration, C. To obtain, we could measure apparent extinction
coefficients, a , at several concentrations by means of equation (2).
)/(log1
10 IIlC
a ……….. (2)
And then extrapolate to C = 0. It is then possible to obtain values of fC in any solution
by means of (3)
010 /)/(log1
af CIIl
C
……….. (3)
It can be seen that the path-length, l , does not affect the final result, provided it remains
constant. Tabulate 1.01000101.0 )/(log/)/(log)/1.0(/ IIIICa and plot
against C, then extrapolate to C = 0 to find 1.0/ . N.B. 1.0 is a at the 0.1 M
concentration. Values of fC may be obtained from your tabulated data by means of
equation (4).
)/()/( 1.01.0 af CC ……….. (4)
The concentration, bC , of bonded phenol is then )(2
1fb CCC , and the equilibrium
constant for dimerisation by hydrogen-bonded is then 2/fb CC .
Note that a straight line plot is obtained only if the predominant species formed is the
dimer. The formation of appreciable amounts of other species, such as trimers,
tetramers and other higher polymers, will cause departure from linearity in the region of
higher concentrations. Note also that because of the large uncertainties involved in the
measured quantities in this experiment, e.g. the absorbances, especially at very low or
Laboratory Manual Physical Chemistry Year 3
at very high concentrations (why?), or the effect of the presence of water even in trace
quantities (why?), you have to exercise considerable judgement in arriving at the result
you want. For example, would it be sensible to carry out a least squares treatment if
indeed a straight line is obtained. Consequently it may not be possible to obtain high
precision in the results.
Experimental
You are provided with phenol crystals. Make up 100 mL of a solution in CCl4 of 0.1 M
concentration. Then using dilution techniques make 10 mL solutions of 0.09 M and
other concentrations in decreasing steps of 0.1 M down to 0.01 M.
You are provided with 2 cells with NaC1 windows, of spacing approximately 0.5 mm.
Wash the two cells with CC14. Fill one of the cell with your solution and the other with
CC14. When filling the sample cell make sure that no solution spills over on to the
outside of the NaC1 plates (if it does, wash it off with pure CC14).
You will not operate the infrared spectrophotometer yourself. Place the CC14 cell in the
sample beam and obtain the spectrum of CC14. The place this cell in the reference
beam and the sample cell in the sample beam, and obtain the difference spectrum of
phenol in solution. Wash out the sample cell with CC14 and then fill it with another
solution. Obtain the spectrum of this solution (with the CC14 cell in the reference beam).
The same cell must be used for the solution.
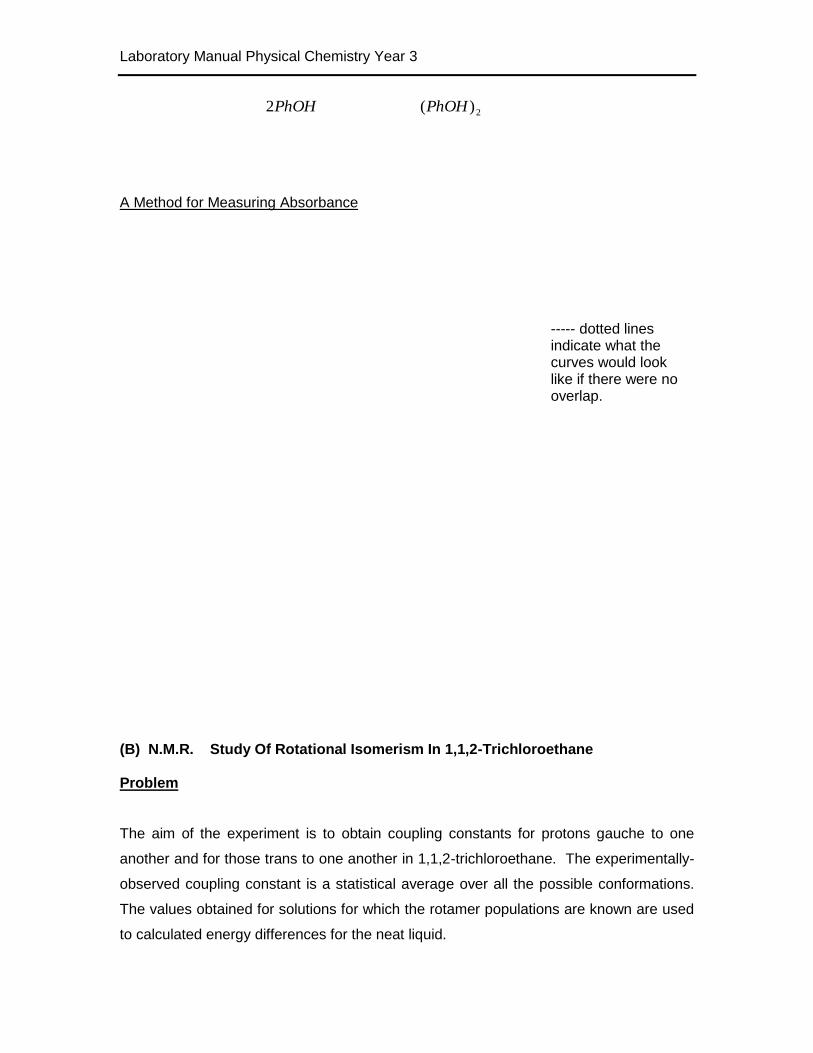
Measure 0I and I for the free OH absorption as in the figure below, making allowance
for the fact that there is some overlapping by the broad bonded OH absorption which lies
between 3600 and 3300 cm-1.
Calculate 1.0/a for each concentration and plot 1.0/a against C. Draw as smooth
a curve as is possible to fit your data and extrapolate to C = 0 to obtain 1.0/a . Note
the large uncertainty in the value of the intercept (why?). If any point on this plot are
wildly off a smooth curve, repeat the spectrum for that concentration. Then using
equation (4) calculate fC , the concentration of free phenol for each total concentration,
C. Obtain values for the equilibrium constant for the equation
Laboratory Manual Physical Chemistry Year 3
2)( 2 PhOHPhOH
A Method for Measuring Absorbance
----- dotted lines indicate what the curves would look like if there were no overlap. (B) N.M.R. Study Of Rotational Isomerism In 1,1,2-Trichloroethane Problem
The aim of the experiment is to obtain coupling constants for protons gauche to one
another and for those trans to one another in 1,1,2-trichloroethane. The experimentally-
observed coupling constant is a statistical average over all the possible conformations.
The values obtained for solutions for which the rotamer populations are known are used
to calculated energy differences for the neat liquid.
Laboratory Manual Physical Chemistry Year 3
Theory
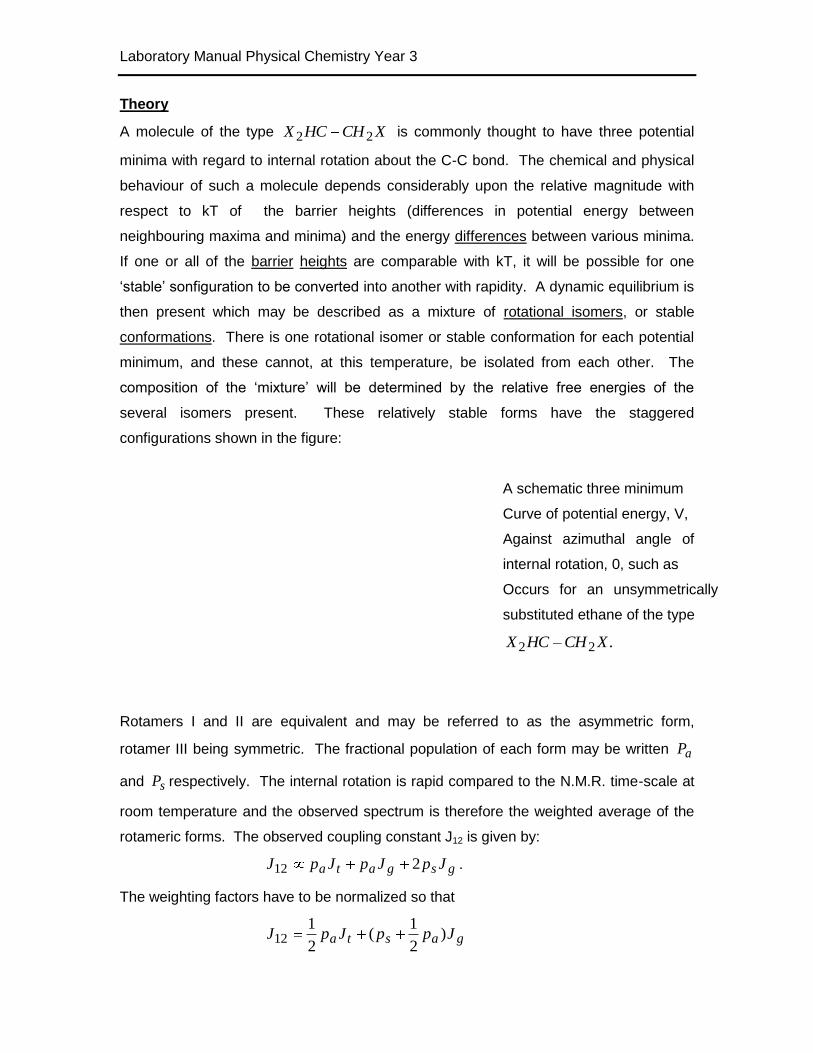
A molecule of the type XCHHCX 22 is commonly thought to have three potential
minima with regard to internal rotation about the C-C bond. The chemical and physical
behaviour of such a molecule depends considerably upon the relative magnitude with
respect to kT of the barrier heights (differences in potential energy between
neighbouring maxima and minima) and the energy differences between various minima.
If one or all of the barrier heights are comparable with kT, it will be possible for one
„stable‟ sonfiguration to be converted into another with rapidity. A dynamic equilibrium is
then present which may be described as a mixture of rotational isomers, or stable
conformations. There is one rotational isomer or stable conformation for each potential
minimum, and these cannot, at this temperature, be isolated from each other. The
composition of the „mixture‟ will be determined by the relative free energies of the
several isomers present. These relatively stable forms have the staggered
configurations shown in the figure:
A schematic three minimum
Curve of potential energy, V,
Against azimuthal angle of
internal rotation, 0, such as
Occurs for an unsymmetrically
substituted ethane of the type
.22 XCHHCX
Rotamers I and II are equivalent and may be referred to as the asymmetric form,
rotamer III being symmetric. The fractional population of each form may be written aP
and sP respectively. The internal rotation is rapid compared to the N.M.R. time-scale at
room temperature and the observed spectrum is therefore the weighted average of the
rotameric forms. The observed coupling constant J12 is given by:
gsgata JpJpJpJ 212 .
The weighting factors have to be normalized so that
gasta JppJpJ )2
1(
2
112
Laboratory Manual Physical Chemistry Year 3
Where gJ and tJ are the coupling constants between protons mutually oriented
gauche and trans respectively.
The chemical shifts of 2H and 2H , are equal, so the spin system is classified as AB2
(or, in first order, 2AX ). The coupling constant J22, thus
does not affect the spectrum. If the enery difference between symmetric and anti-
symmetric form, sa EEE , is known, then ap and sp may be calculated according
to the equation:
RTERTGRTG
s
a eeep
pK /// 22 .
The factor 2 appears because of the statistical weight of th asymmetric form. Values of
E may be obtained from measurements of infrared spectra. The absorption at 1211
cm-1, for example, is assigned to the asymmetric form and that at 1238 cm-1 to the
asymmetric form. If two different solutions of 1,1,2-trichloroethane, with known values of
E , are studied by NMR and J12 is measured for each, then two simultaneous
equations in Jg and Jt are obtained.
Thus the individual values of Jg and Jt may be deduced, and measurements of J12 for
other solutions of 1,1,2-trichloroethane may be used to calculate appropriate E values
(which can be checked by IR measurements).
Experimental Aspects The N.M.R spectra of 1,1,2-trichloroethane in the following 3 solution with
tetramethylsilane as internal reference will be obtained:
Neat liquid,
50% V/V solution in carbon tetrachloride,
50% V/V solution in acetonitrile.
Obtain an average value of J12 in each case.
Calculations and Problems
Infrared measurements show that E is -0.41 and + 0.03 kcal/mole for 50% solutions of
1,1,2-trichloroethane in carbon tetrachloride and acetonitrile respectively. Calculate Jt
and Jg from your data. Deduce a value of E for the neat liquid.
Laboratory Manual Physical Chemistry Year 3
Include in your Discussion section answers to the following problems.
Why do the values of E vary in the manner observed?
What effects tell you the NMR spectrum of 1,1,2-trichloroethane is not exactly
first-order at 60 MHz?
What assumption have been made in this experiment?
Suggest further NMR experiments to investigate rotational isomerism in 1,1,2-
trichloroethane more thoroughly.
Suggested Reading
1. L.M. Jackman and S. Sternhell, Applications of N.M.R. Spectroscopy in Organic
Chemistry, 2nd Ed., Chapter 5-2, 1969, Pergamon Press.
2. S. Mizushima, T. Shimanouchi, T. Miyazawa, I. Ichishima, K. Kuratani, I.
Nakagawa, and N. Shido, J. Chem Phys. 21, 815 (1953).
3 S. Mizushima, Structure of Molecules and Internal Rotation, Chap. II, 1954,
Academic Press.
Molecular Spectroscopy
(C) Spectrophotometric Determination Of An Equilibrium Constant Between A Molecular Complex And Its Free Component Molecules.
Theory The relative weak interactions between an electron donor (D) and an electron acdeptor
(A) can lead to the formation of a molecular complex (D,A). The ground and excited
states of the complex can best be described1,2 by the wave functions
)(),( 10 ADbADaN
And
).,()( 01 ADbADaE
The term 0 refers to the no-bond wave function and corresponds to the structure in
which the bonding results from coulombic, induction, dispersion, and exchange repulsion
forces, while the dative-bond wave function 1 corresponds to the structure where an
electron has been transferred from D to A. Resonance between the no-bond and the
Laboratory Manual Physical Chemistry Year 3
dative structure in the ground state provides additional stability over the usual stability
attributed to forces in the no-bond structure. This additional force contributing to the
stability of the molecular complex is called a charge-transfer force. The coulombic,
induction, and dispersion forces are attractive, whild the exchange repulsion works
against them, giving a total net force in the no-bond structure which might be either
negative or, if the charge-transfer forces are strong enough, even zero or positive.
For weak molecular interaction the ground state energy (WN) is given by the expression
0000 XWXGWHWW fN
Where W is the energy of the two separated molecules, fH is the enthalpy of
formation of the complex, 0G is the no-bond energy term and 0X is the resonance
nergy of interaction between no-bond and the dative states of the complex. The energy
of the excited state of the complex (WE) is given by the expression
1111 XWXGEIWW ADE
Where DI is the ionization potential of the donor, AE is the electron affinity of the
acceptor, 1G is the sum of several terms including the large electrostatic energy of
interaction between the charges on D and A and 1X is the resonance energy due to
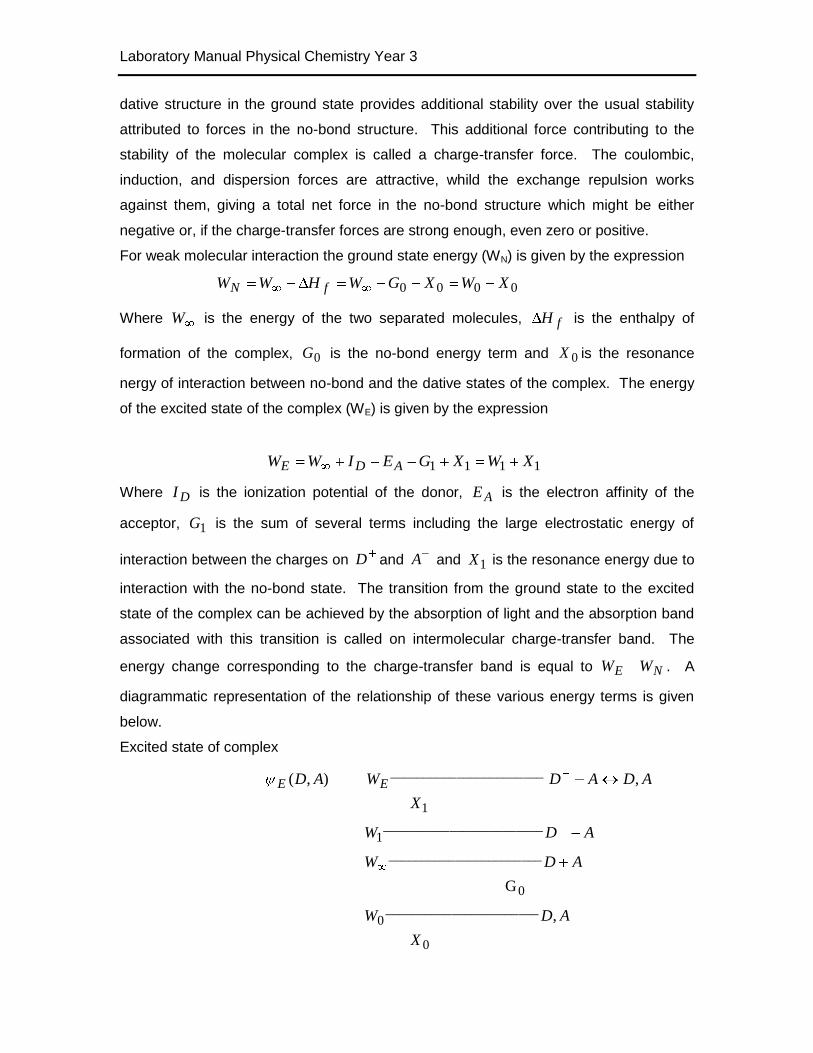
interaction with the no-bond state. The transition from the ground state to the excited
state of the complex can be achieved by the absorption of light and the absorption band
associated with this transition is called on intermolecular charge-transfer band. The
energy change corresponding to the charge-transfer band is equal to NE WW . A
diagrammatic representation of the relationship of these various energy terms is given
below.
Excited state of complex
0
_______________________0
0
_______________________
________________________1
1
_______________________
,
G
, ),(
X
ADW
ADW
ADW
X
ADADWAD EE
Laboratory Manual Physical Chemistry Year 3
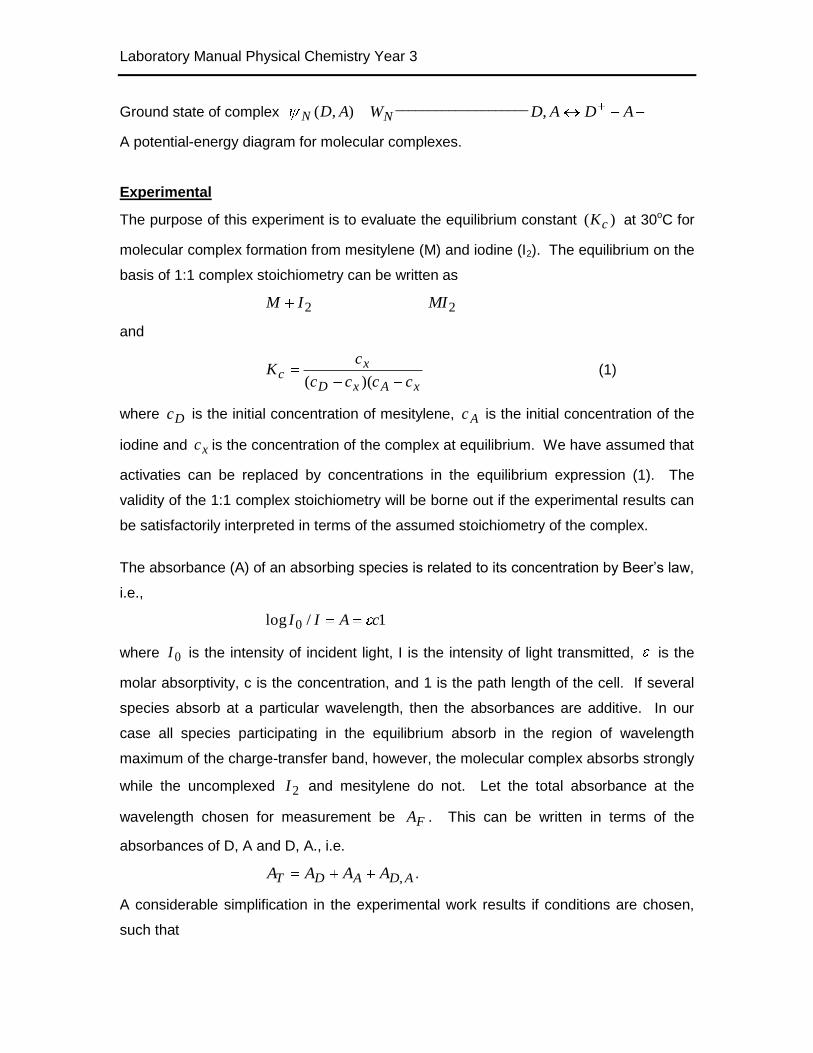
Ground state of complex ),( ADN ADADWN ,____________________
A potential-energy diagram for molecular complexes.
Experimental
The purpose of this experiment is to evaluate the equilibrium constant )( cK at 30oC for
molecular complex formation from mesitylene (M) and iodine (I2). The equilibrium on the
basis of 1:1 complex stoichiometry can be written as
22 MIIM
and
xAxD
xc
cccc
cK
)(( (1)
where Dc is the initial concentration of mesitylene, Ac is the initial concentration of the
iodine and xc is the concentration of the complex at equilibrium. We have assumed that
activaties can be replaced by concentrations in the equilibrium expression (1). The
validity of the 1:1 complex stoichiometry will be borne out if the experimental results can
be satisfactorily interpreted in terms of the assumed stoichiometry of the complex.
The absorbance (A) of an absorbing species is related to its concentration by Beer‟s law,
i.e.,
1/log 0 cAII
where 0I is the intensity of incident light, I is the intensity of light transmitted, is the
molar absorptivity, c is the concentration, and 1 is the path length of the cell. If several
species absorb at a particular wavelength, then the absorbances are additive. In our
case all species participating in the equilibrium absorb in the region of wavelength
maximum of the charge-transfer band, however, the molecular complex absorbs strongly
while the uncomplexed 2I and mesitylene do not. Let the total absorbance at the
wavelength chosen for measurement be FA . This can be written in terms of the
absorbances of D, A and D, A., i.e.
ADADT AAAA , .
A considerable simplification in the experimental work results if conditions are chosen,
such that
Laboratory Manual Physical Chemistry Year 3
XAD ccc .
This means that AA can be taken as zero, and the absorbance due to the complex is
given by
DTAD AAA ,
DA can be calculated if D is known.
This can readily be obtained by measuring the absorbance of a solution containing only
mesitylene at the wavelength chosen for
measurement. Upon replacement of Xc by ADADA ,, / in the equilibrium expression
(1) and rearrangement, one can obtain the expression
cAADcADADAD KcAKccA /1/ ,,, (2)
Absorbancies are masured for a series of solutions made with various known values of
Dc and Ac , and values of ADAD ccA /, are plotted against AAD cA /, . If the data are
represented by a linear plot, the the gradient and the intercept can lead to the value of
DA and cK . A word of caution is in order here. Linearity of the plot merely indicates
that the equilibrium can be interpreted in terms of the postulated equilibrium and that the
approximations used in deriving expression (2) have not been violated. A more
comprehensive analysis of the experimental data is generally required before one can
assign a particular model for the equilibrium reaction.
Procedure
Two solutions are prepared: (a) 100 cm3 of CC14 solution of I2 of molarity in the region of 0.0004 (b)
50 cm3 of CC14 solution of mesitylene of molarity in the region of 2. The first is prepared
by dilution of a more concentrated solution which in turn is made up by dissolving a
weighed quantity of I2 in a measured volume of solution. The second is made up by
accurately weighing about 16 cm3 of distilled mesitylene in a 50 cm3 volumetric flask and
filling to the mark with carbon tetrachloride. All these solutions are made up to the mark
in a thermostat bath at 300C. The concentration of the I2 solution may be checked by
standard titration methods.
The spectra of the following solutions are to be recorded by the use of UV-VIS
spectrophotometer from 320-700 nm. The reference call should have pure CC14.
Laboratory Manual Physical Chemistry Year 3
(a) CCl4 solution of I2 having molarity in the region of 0.0002;
(b) CCl4 solution of mesitylene having molarity in the region of 1;
(c) 1:1 mixture of solutions (a) and (b).
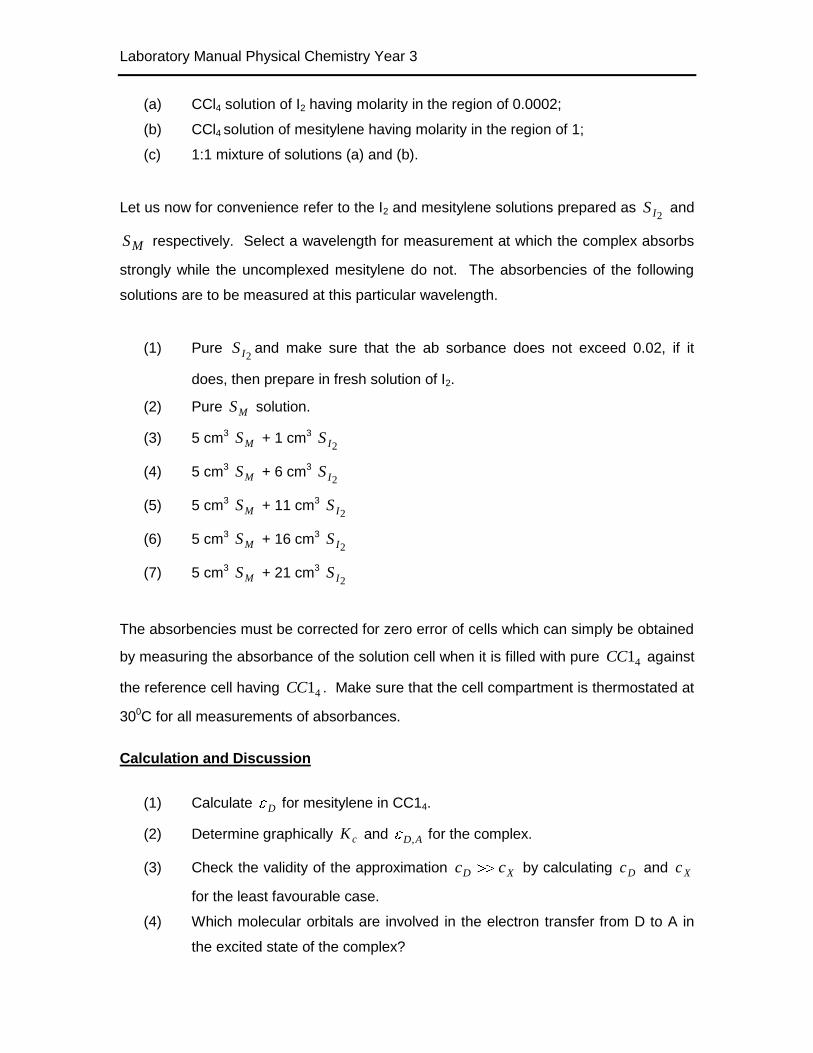
Let us now for convenience refer to the I2 and mesitylene solutions prepared as 2I
S and
MS respectively. Select a wavelength for measurement at which the complex absorbs
strongly while the uncomplexed mesitylene do not. The absorbencies of the following
solutions are to be measured at this particular wavelength.
(1) Pure 2I
S and make sure that the ab sorbance does not exceed 0.02, if it
does, then prepare in fresh solution of I2.
(2) Pure MS solution.
(3) 5 cm3 MS + 1 cm3 2I
S
(4) 5 cm3 MS + 6 cm3 2I
S
(5) 5 cm3 MS + 11 cm3 2I
S
(6) 5 cm3 MS + 16 cm3 2I
S
(7) 5 cm3 MS + 21 cm3 2I
S
The absorbencies must be corrected for zero error of cells which can simply be obtained
by measuring the absorbance of the solution cell when it is filled with pure 41CC against
the reference cell having 41CC . Make sure that the cell compartment is thermostated at
300C for all measurements of absorbances.
Calculation and Discussion
(1) Calculate D for mesitylene in CC14.
(2) Determine graphically cK and AD, for the complex.
(3) Check the validity of the approximation XD cc by calculating Dc and Xc
for the least favourable case.
(4) Which molecular orbitals are involved in the electron transfer from D to A in
the excited state of the complex?
Laboratory Manual Physical Chemistry Year 3
(5) Suggest possible structures for the MI2 complex.
(6) What further experiments would you carry out to determine fH for complex
formation?
(7) Do your results suggest the nature of bonding involved in the ground state of
the complex?
References
(1) R.S. Mulliken, J. Amer. Chem. Soc., 1952, 74, 811.
(2) R.S. Mulliken, and W.B. Person, “Molecular Complexes: A Lecture and
Reprint Volume”, Wiley, New York, 1969.
(3) L.J. Andrews and R.M. Keefer “Molecular complexes in Organic Chemistry”,
Holden-Day, San Francisco, 1964.
Laboratory Manual Physical Chemistry Year 3
EXPERIMENT 3: THE CRITICAL POINT Introduction
The objective of this experiment is to measure the densities of coexisting carbon
dioxide liquid and gas near critical point. At its critical point, the densities of a
liquid and its gas phase become equal. Since such a point is difficult to determine
directly, an extrapolation method is often used to determine the critical density.
This method is based on the “law of rectilinear diameters” which states that
av = ½ ( l + g) = o - cT ,
(1)
where av is the average of the densities of the coexisting liquid and gas phase
at a temperature T, c and o are constants for any particular fluid. The plot of av
versus T is a straight line while the plot of l and g is a curve known as the
coexistence curve. They intersect at the critical point and this serves to locate its
position. Such a plot is called a Cailletet-Mathias curve.
The behaviour of thermodynamic properties near the critical point may be
described by the use of critical exponents. The critical exponent associated with
density is and is defined by
c
c
c
gl
T
TTB . (2)
It may be obtained as the gradient in the plot of log ( l + g) versus log (Tc - T).
Method
A set of 8 capillaries filled with carbon dioxide is provided. Data are supplied
which will enable you to obtain the cross-sectional area of each capillary and the
amount of carbon dioxide that it contains.
Set the thermostat at 24.0oC. The temperature of the bath should be read to
0.01oC and the regulator should be adjusted such that the range of temperature
fluctuations does not exceed 0.04oC.
Laboratory Manual Physical Chemistry Year 3
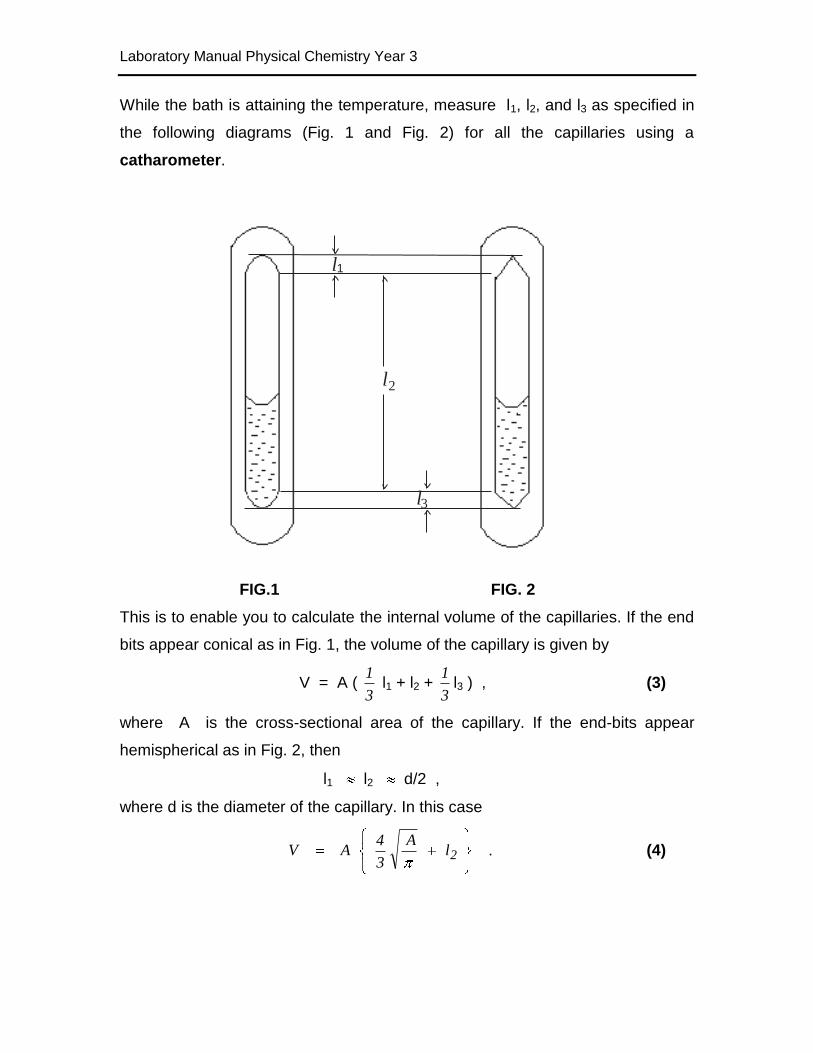
While the bath is attaining the temperature, measure l1, l2, and l3 as specified in
the following diagrams (Fig. 1 and Fig. 2) for all the capillaries using a
catharometer.
l
l
l
1
2
3
FIG.1 FIG. 2
This is to enable you to calculate the internal volume of the capillaries. If the end
bits appear conical as in Fig. 1, the volume of the capillary is given by
V = A ( 3
1 l1 + l2 +
3
1l3 ) , (3)
where A is the cross-sectional area of the capillary. If the end-bits appear
hemispherical as in Fig. 2, then
l1 l2 d/2 ,
where d is the diameter of the capillary. In this case
2lA
3
4AV . (4)
Laboratory Manual Physical Chemistry Year 3
When the set temperature has been reached, maintain the bath at this
temperature for at least 10 minutes. Then measure the level of the meniscus of
the liquid carbon dioxide in each of the capillary.
Repeat the measurement of the meniscus levels at an interval of 0.5 oC until a
temperature of 30.5 oC is reached. You are required to calculate the volume of
the liquid phase, Vl , in the capillaries and plot the result versus temperature as
the experiment proceeds. In the event that the liquid phase in a particular
capillary disappears at the set temperature, lower the temperature slightly until
the liquid phase reappears, and measure the meniscus level again at this lower
temperature (for this particular capillary only). Obtain two to three readings at an
interval of 0.1 oC in this region until the liquid phase disappears again (why?).
Try to observe the critical opalescence in carbon dioxide near the critical
temperature. This is best seen at right angle to the incident light beam.
Caution
Do not raise the temperature of the bath appreciably above 31 oC as the
capillaries may explode. The use of safety glasses in this experiment is
mandatory.
Calculations
Calculate the internal volume, V, of each capillary and the mass of carbon
dioxide in it. At each temperature, calculate Vl , and obtain the volume of the gas
phase, Vg, through the equation
Vg = V - Vl . (5)
Plot Vl against temperature for a chosen capillary. Extrapolate this plot to V l =
0. Let the temperature at this point be To. The density of the gas phase at this
temperature can be calculated. For the other capillaries which still contain two
phases, the density of the gas phase at To is now known. The volumes of the two
phases at this temperature can be obtained by interpolation, and hence the
density of the liquid phase at To can also be obtained.
Laboratory Manual Physical Chemistry Year 3
Repeat this process for all the capillaries to obtain the density of the coexisting
gas phase and liquid phase at a set of new To values.
Finally construct a Cailletet-Mathias plot and from it obtain the critical
temperature Tc. Test the law of rectilinear diameter and finally obtain the critical
density c.
Discussion
Explain why the meniscus in some tubes move down and disappear at the
bottom while the meniscus in other tubes may have move up and disappeared at
the top. Is it possible for the meniscus to remain stationary as the temperature is
raised?
What causes the phenomenon of critical opalescence?
Relate the parameters a and b in the van der Waals eqn.,
TR)bV()V
aP( m2
m
, (6)
to the critical volume and the critical temperature, and hence calculate their
values. How do they compare with literature values?
The van der Waals equation predict a value of 0.5 for the critical experimental .
Does your result agree with this?
References
Shoemaker, Garland and Steinfeld, “Experiments in Physical Chemistry”, 3rd ed.,
pp. 245 -252, McGraw Hill (1974).
Rowlinson,”Liquids and Liquid mixtures”, 2nd ed., pp. 90-94, Butterworth (1969)
Moore, “Physical Chemistry”, 5th ed. Pp. 20-26, 919-922, Longman (1972).
Laboratory Manual Physical Chemistry Year 3
EXPERIMENT 4: DETERMINATION OF ACID DISSOCIATION CONSTANT FOR
METHYL RED
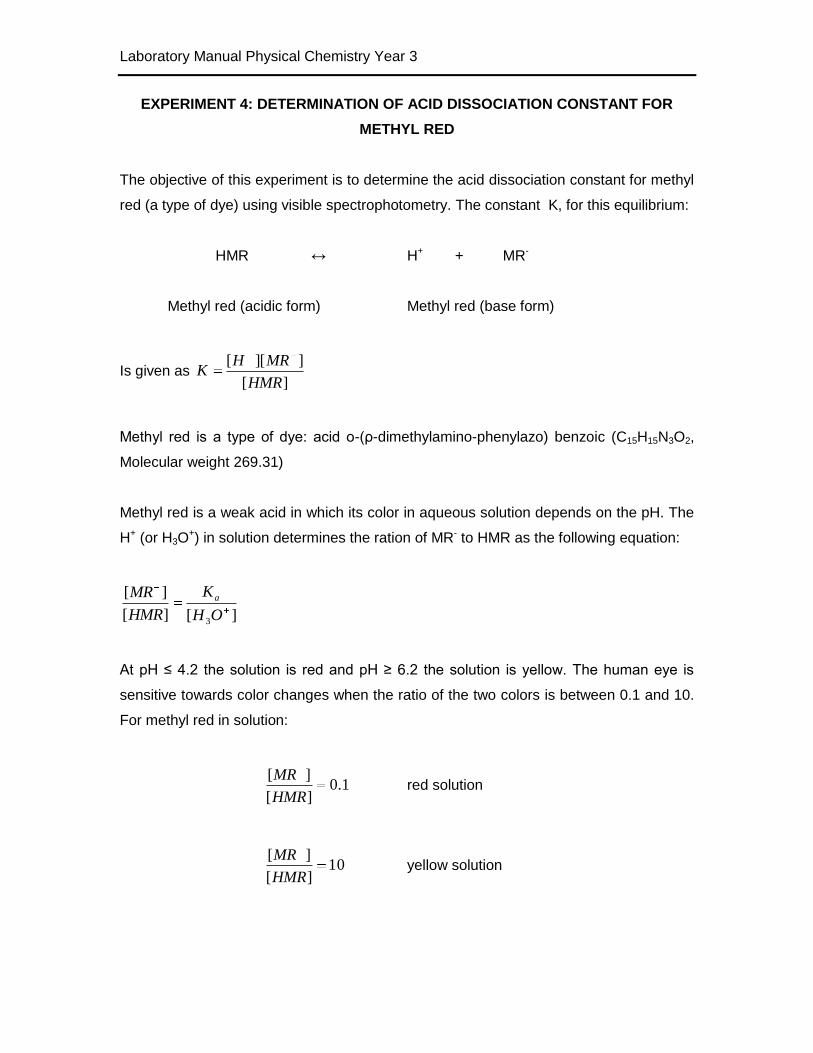
The objective of this experiment is to determine the acid dissociation constant for methyl
red (a type of dye) using visible spectrophotometry. The constant K, for this equilibrium:
HMR ↔ H+ + MR-
Methyl red (acidic form) Methyl red (base form)
Is given as ][
]][[
HMR
MRHK
Methyl red is a type of dye: acid ο-(ρ-dimethylamino-phenylazo) benzoic (C15H15N3O2,
Molecular weight 269.31)
Methyl red is a weak acid in which its color in aqueous solution depends on the pH. The
H+ (or H3O+) in solution determines the ration of MR- to HMR as the following equation:
][][
][
3OH
K
HMR
MR a
At pH ≤ 4.2 the solution is red and pH ≥ 6.2 the solution is yellow. The human eye is
sensitive towards color changes when the ratio of the two colors is between 0.1 and 10.
For methyl red in solution:
1.0][
][
HMR
MR red solution
10][
][
HMR
MR yellow solution
Laboratory Manual Physical Chemistry Year 3
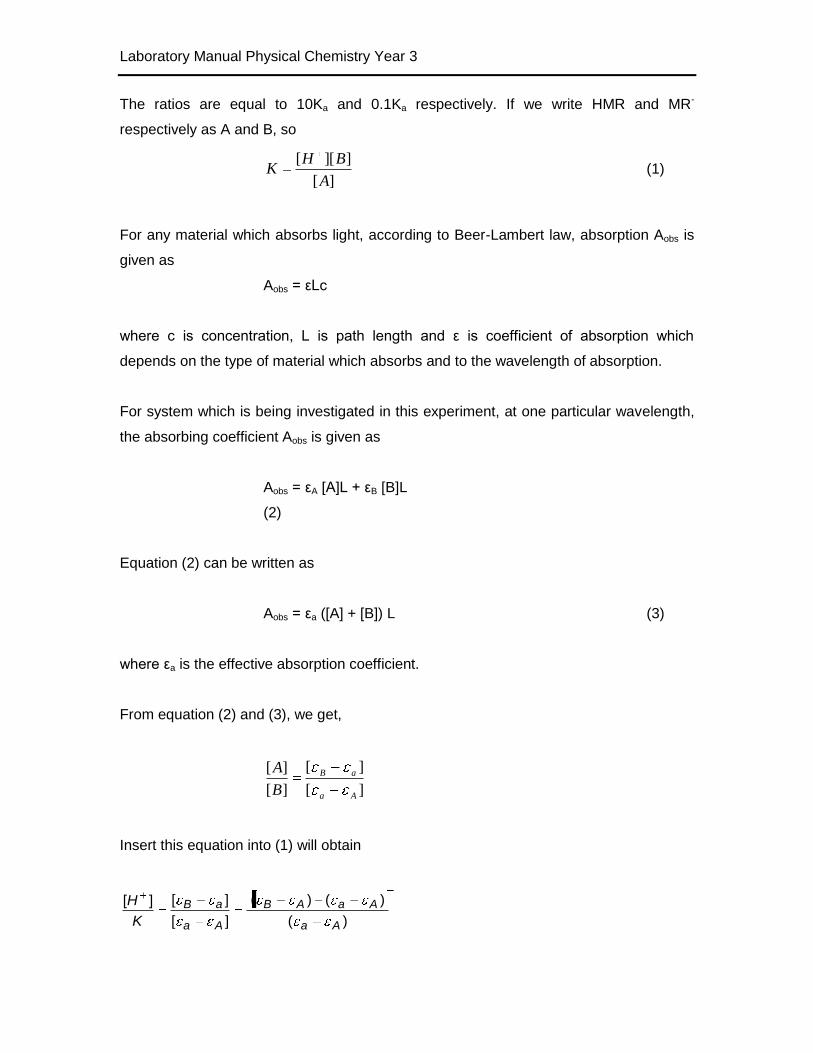
The ratios are equal to 10Ka and 0.1Ka respectively. If we write HMR and MR-
respectively as A and B, so
][
]][[
A
BHK (1)
For any material which absorbs light, according to Beer-Lambert law, absorption Aobs is
given as
Aobs = εLc
where c is concentration, L is path length and ε is coefficient of absorption which
depends on the type of material which absorbs and to the wavelength of absorption.
For system which is being investigated in this experiment, at one particular wavelength,
the absorbing coefficient Aobs is given as
Aobs = εA [A]L + εB [B]L
(2)
Equation (2) can be written as
Aobs = εa ([A] + [B]) L (3)
where εa is the effective absorption coefficient.
From equation (2) and (3), we get,
][
][
][
][
Aa
aB
B
A
Insert this equation into (1) will obtain
)(
)()(
][
][][
Aa
AaAB
Aa
aB
K
H
Laboratory Manual Physical Chemistry Year 3
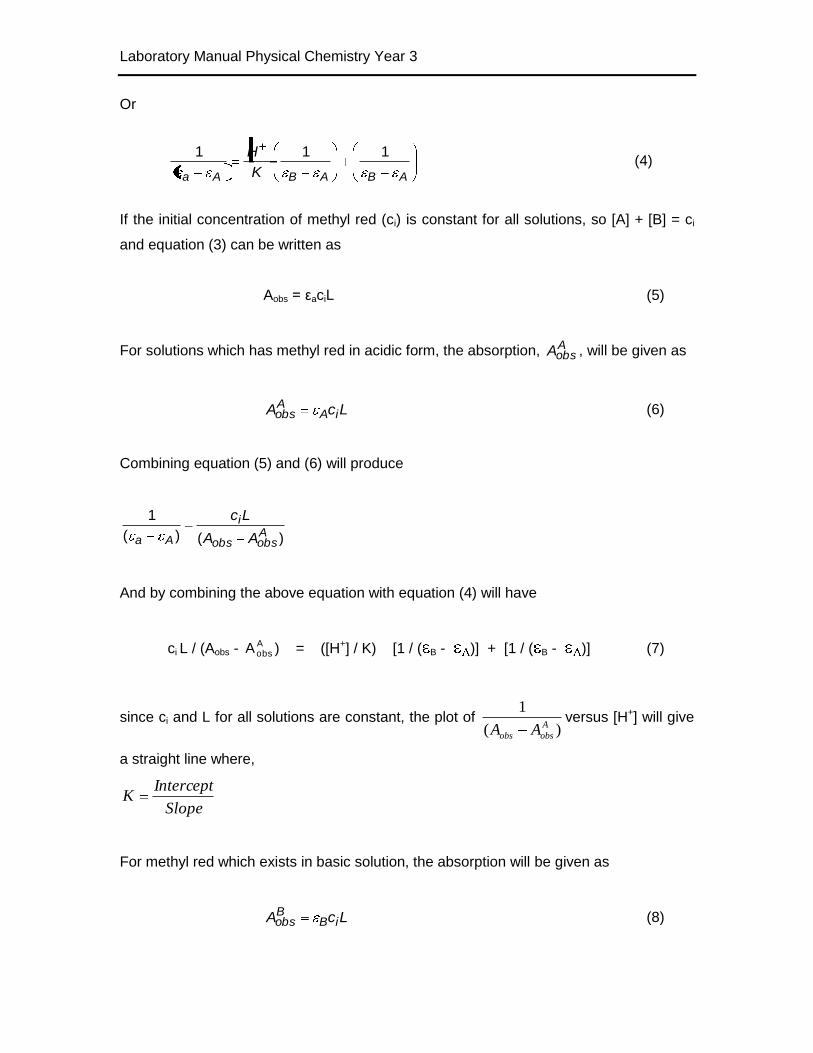
Or
ABABAa K
H 111 (4)
If the initial concentration of methyl red (ci) is constant for all solutions, so [A] + [B] = ci
and equation (3) can be written as
Aobs = εaciL (5)
For solutions which has methyl red in acidic form, the absorption, AobsA , will be given as
LcA iAAobs (6)
Combining equation (5) and (6) will produce
)()(
1Aobsobs
i
Aa AA
Lc
And by combining the above equation with equation (4) will have
ci L / (Aobs - AobsA ) = ([H+] / K) [1 / ( B - )] + [1 / ( B - )] (7)
since ci and L for all solutions are constant, the plot of )(
1A
obsobs AAversus [H+] will give
a straight line where,
Slope
InterceptK
For methyl red which exists in basic solution, the absorption will be given as
LcA iBBobs (8)
Laboratory Manual Physical Chemistry Year 3
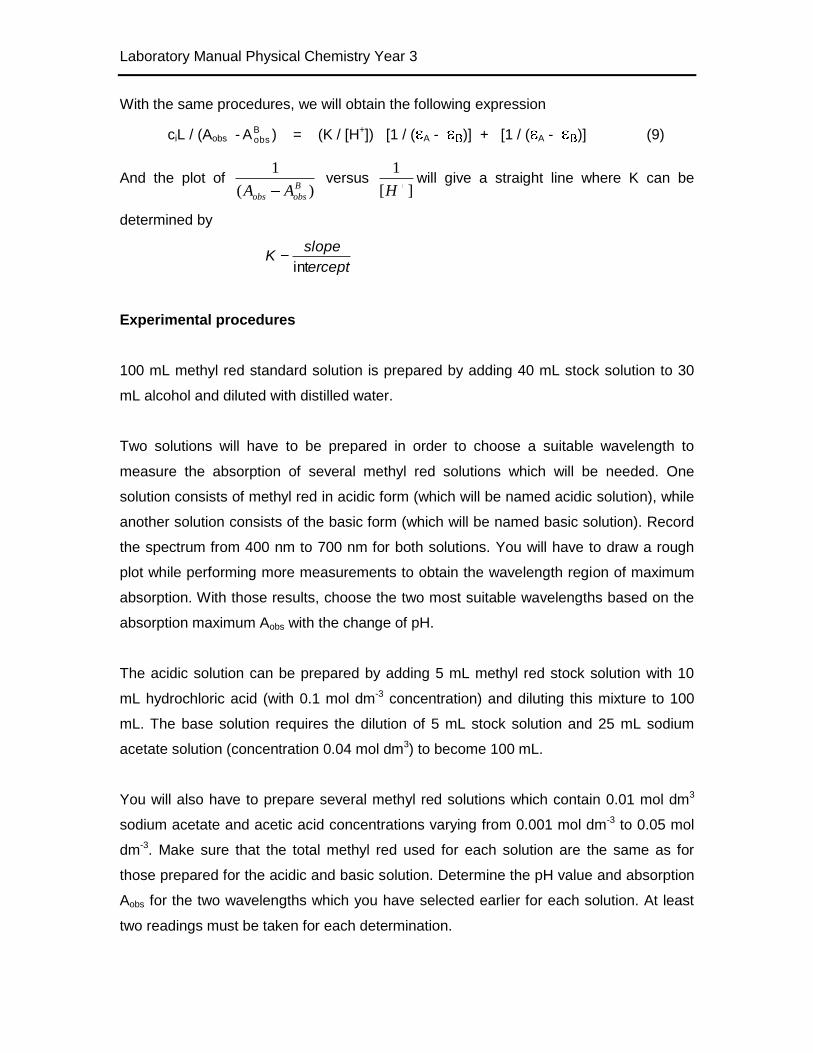
With the same procedures, we will obtain the following expression
ciL / (Aobs -BobsA ) = (K / [H+]) [1 / ( A - )] + [1 / ( A - )] (9)
And the plot of )(
1B
obsobs AA versus
][
1
Hwill give a straight line where K can be
determined by
ercept
slopeK
int
Experimental procedures
100 mL methyl red standard solution is prepared by adding 40 mL stock solution to 30
mL alcohol and diluted with distilled water.
Two solutions will have to be prepared in order to choose a suitable wavelength to
measure the absorption of several methyl red solutions which will be needed. One
solution consists of methyl red in acidic form (which will be named acidic solution), while
another solution consists of the basic form (which will be named basic solution). Record
the spectrum from 400 nm to 700 nm for both solutions. You will have to draw a rough
plot while performing more measurements to obtain the wavelength region of maximum
absorption. With those results, choose the two most suitable wavelengths based on the
absorption maximum Aobs with the change of pH.
The acidic solution can be prepared by adding 5 mL methyl red stock solution with 10
mL hydrochloric acid (with 0.1 mol dm-3 concentration) and diluting this mixture to 100
mL. The base solution requires the dilution of 5 mL stock solution and 25 mL sodium
acetate solution (concentration 0.04 mol dm3) to become 100 mL.
You will also have to prepare several methyl red solutions which contain 0.01 mol dm3
sodium acetate and acetic acid concentrations varying from 0.001 mol dm-3 to 0.05 mol
dm-3. Make sure that the total methyl red used for each solution are the same as for
those prepared for the acidic and basic solution. Determine the pH value and absorption
Aobs for the two wavelengths which you have selected earlier for each solution. At least
two readings must be taken for each determination.
Laboratory Manual Physical Chemistry Year 3
The pH meter must be calibrated with two standard buffer solutions for pH 4 and pH 7.
Results and calculation
1. Plot the spectrum for acidic solution and basic solution. Determine the
wavelengths λA and λB which give maximum absorption for the acidic solution
and basic solution. Record AobsA and Aobs
B which are seen at at λA and λB.
2. For the methyl red solutions with various concentration of acetic acid, record all
pH and Aobs which is determined at λA and λB.
3. For Aobs which was obtained at λA calculate )(
1Aobsobs AA
and [H+] for each
solutions. Record your readings.
4. For Aobs which was obtained at λB record )(
1Bobsobs AA
and ][
1
Hin a table.
5. Plot )(
1Aobsobs AA
versus [H+] and determine the slope and intercept by using
the least square method. Determine the K value and its uncertainty.
6. Repeat (5) but plot )(
1Bobsobs AA
versus ][
1
H.
Questions
1. Derive equation (9) starting from equation (8).
2. Compare K values obtained from (5) and (6). Which of these values are
accurate.
3. Discuss whether the experiment can be performed using wavelengths other than
λA and λB.
Reference
R. Chang, Physical Chemistry, 2nd edition, Macmillan, 1981, Chapter 12.
Laboratory Manual Physical Chemistry Year 3
EXPERIMENT 5: PHASE DIAGRAM OF A THREE-COMPONENT PARTIALLY
IMMISCIBLE LIQUID SYSTEM
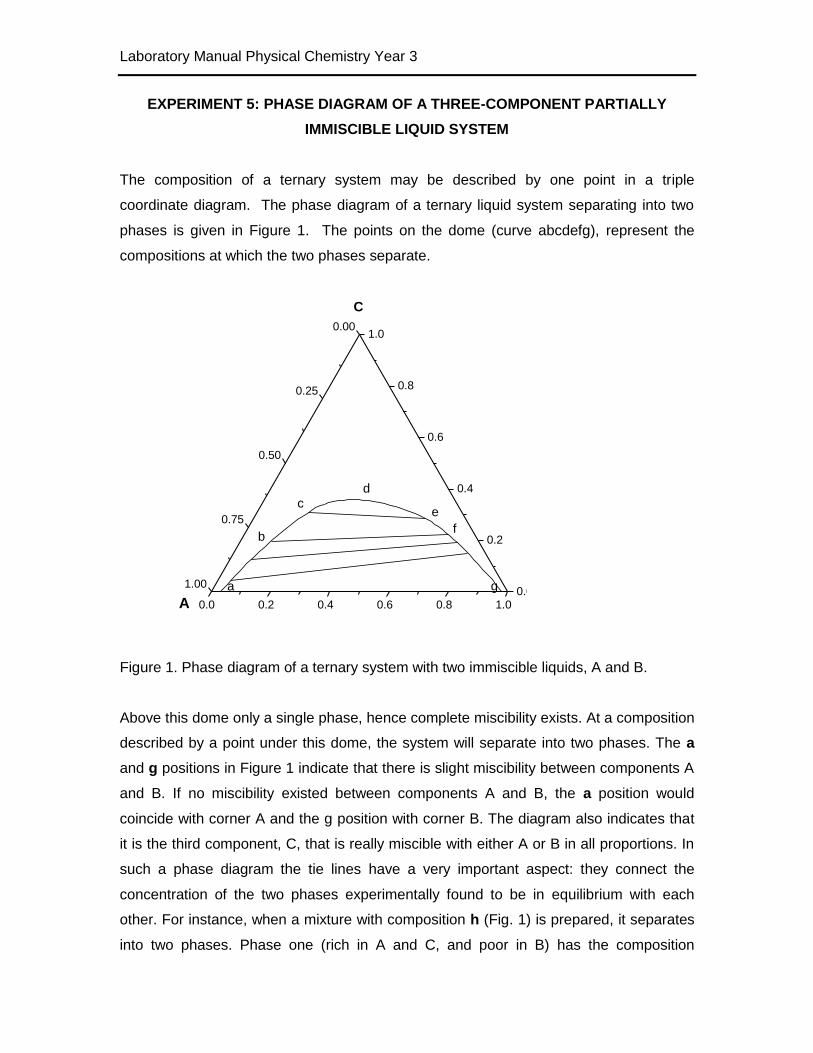
The composition of a ternary system may be described by one point in a triple
coordinate diagram. The phase diagram of a ternary liquid system separating into two
phases is given in Figure 1. The points on the dome (curve abcdefg), represent the
compositions at which the two phases separate.
0.0 0.2 0.4 0.6 0.8 1.00.0
0.2
0.4
0.6
0.8
1.00.00
0.25
0.50
0.75
1.00
C
BA
c
b
d
e
f
ga
Figure 1. Phase diagram of a ternary system with two immiscible liquids, A and B.
Above this dome only a single phase, hence complete miscibility exists. At a composition
described by a point under this dome, the system will separate into two phases. The a
and g positions in Figure 1 indicate that there is slight miscibility between components A
and B. If no miscibility existed between components A and B, the a position would
coincide with corner A and the g position with corner B. The diagram also indicates that
it is the third component, C, that is really miscible with either A or B in all proportions. In
such a phase diagram the tie lines have a very important aspect: they connect the
concentration of the two phases experimentally found to be in equilibrium with each
other. For instance, when a mixture with composition h (Fig. 1) is prepared, it separates
into two phases. Phase one (rich in A and C, and poor in B) has the composition
Laboratory Manual Physical Chemistry Year 3
designated on the diagram by b. Phase two (rich in B and C, but poor in A) has a
composition designated by point f. The quantitative ratio of the two phases is given by,
bh
fh
twoPhase
onePhase
_
_
and, therefore, once a phase diagram is available it can be used to determine the
compositions and proportions of the phases that would result when a mixture of
specified overall composition is prepared.
You may notice that the dome in Figure 1 is not symmetrical and the tie lines are
not parallel to each other. This is simply because the solubility of C in the two phases (A
and B) is not the same. In whatever direction the tie lines are slanted, they connect
points of equilibrium compositions. These equilibrium compositions, b vs. f and c vs. e,
become increasingly similar with each subsequent tie line, starting from the base of the
dome and proceeding upward. Similarly, the tie lines become shorter and finally
converge to a composition. This is called isothermal critical point or the plait point.
EXPERIMENTAL
The phase diagram of a dimethyl sulfoxide-water-benzene system will be obtained. In
order to obtain the points on the miscibility curve dome, one has to titrate different
mixtures of DMSO-benzene with water to the point at which cloudiness appears. This
can be accomplished in the following manner: Stopper and number 10 to 15 Erlenmeyer
flasks of 100 mL capacity. From two burettes (one containing DMSO and one, benzene)
prepare mixtures of DMSO and benzene in different proportions. For example, in the
first bottle, add 15 mL of DMSO and 0.2 mL of benzene, in the second bottle add 14 mL
of DMSO and 1 mL of benzene, and so forth; in the last bottle, combine 1 mL of DMSO
and 14 mL of benzene.
Titrate each bottle with water from a third burette to the point of slight turbidity. Be very
careful because any over-titration will result in separation of phases.
Measure the refractive index of each titrated mixture. Prepare a table to show your
results.
Laboratory Manual Physical Chemistry Year 3
Since the phase diagram to be drawn will represent an isothermal equilibrium, the
following precautions must be observed. After the original mixtures of DMSO and
benzene are prepared, they should be thermostated at 30°C. The titration must be done
slowly as the mixing of DMSO with water is exothermic. Therefore, the water should be
added very slowly, with constant swirling of the Erlenmeyer flask in the thermostat so
that thermal equilibrium is achieved before the endpoint is reached.
Determine the density of each of the components at 30°C. After the endpoint of the
titration has been reached and the refractive index of each mixture has been measured,
add a slight excess of water to each bottle. Allow sufficient time in the thermostat for the
two phases to separate.
After the phases have separated, take a small aliquot from each phase and measure the
refractive indices. Again, present your data with a table. Knowing the densities of the
components, convert the data collected in table 1 into weight percentage composition.
Plot your composition data thus obtained on a three co-ordinate diagram. Connect the
points to form the miscibility curve.
Plot the refractive index diagram above the three co-ordinate diagram in a manner
similar to that given in figure 2 by drawing vertical lines from the points representing the
titration end point compositions. Selecting a proper refractive indices scale as the y-axis,
plot the refractive indices obtained at each titration end point composition. Once a
diagram such as in figure 2 is obtained, use the refractive index calibration curve to
obtain the tie lines.
Laboratory Manual Physical Chemistry Year 3
0.0 0.2 0.4 0.6 0.8 1.0
1.35
1.40
1.45
1.50
1.55
1.60
refra
ctiv
ein
dex
0.0 0.2 0.4 0.6 0.8 1.00.0
0.2
0.4
0.6
0.8
1.00.00
0.25
0.50
0.75
1.00
DMSO
H2O C
6H
6
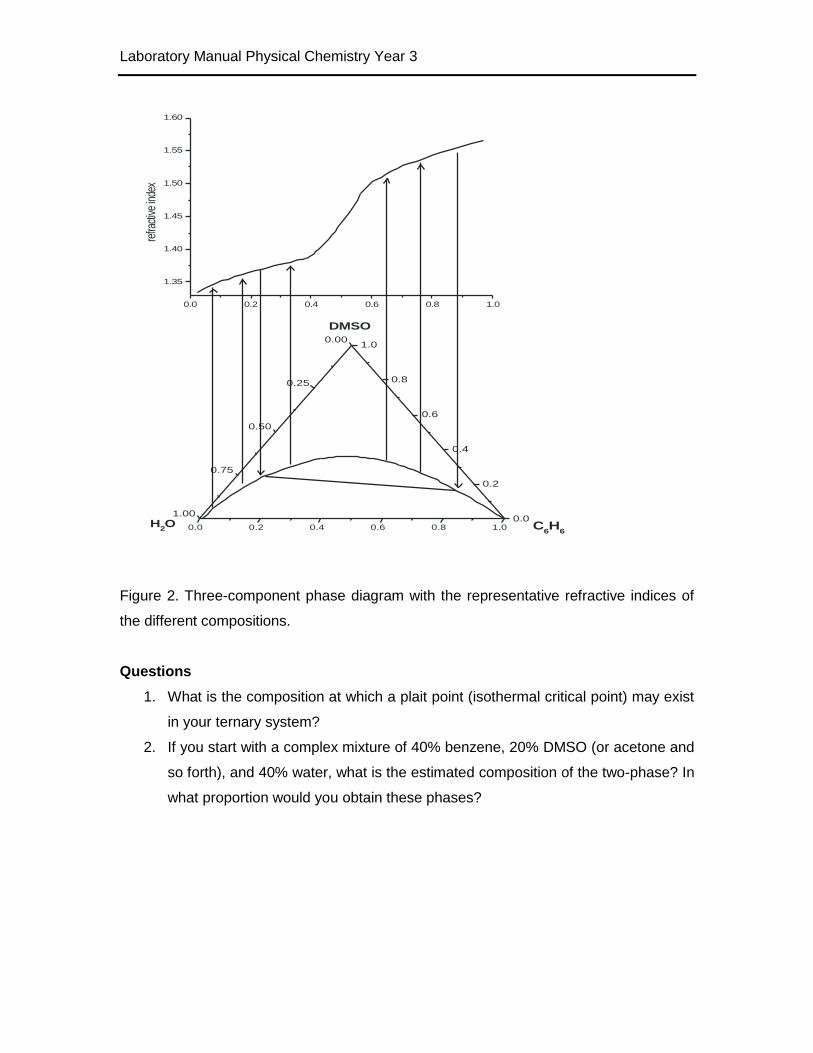
Figure 2. Three-component phase diagram with the representative refractive indices of
the different compositions.
Questions
1. What is the composition at which a plait point (isothermal critical point) may exist
in your ternary system?
2. If you start with a complex mixture of 40% benzene, 20% DMSO (or acetone and
so forth), and 40% water, what is the estimated composition of the two-phase? In
what proportion would you obtain these phases?
Laboratory Manual Physical Chemistry Year 3
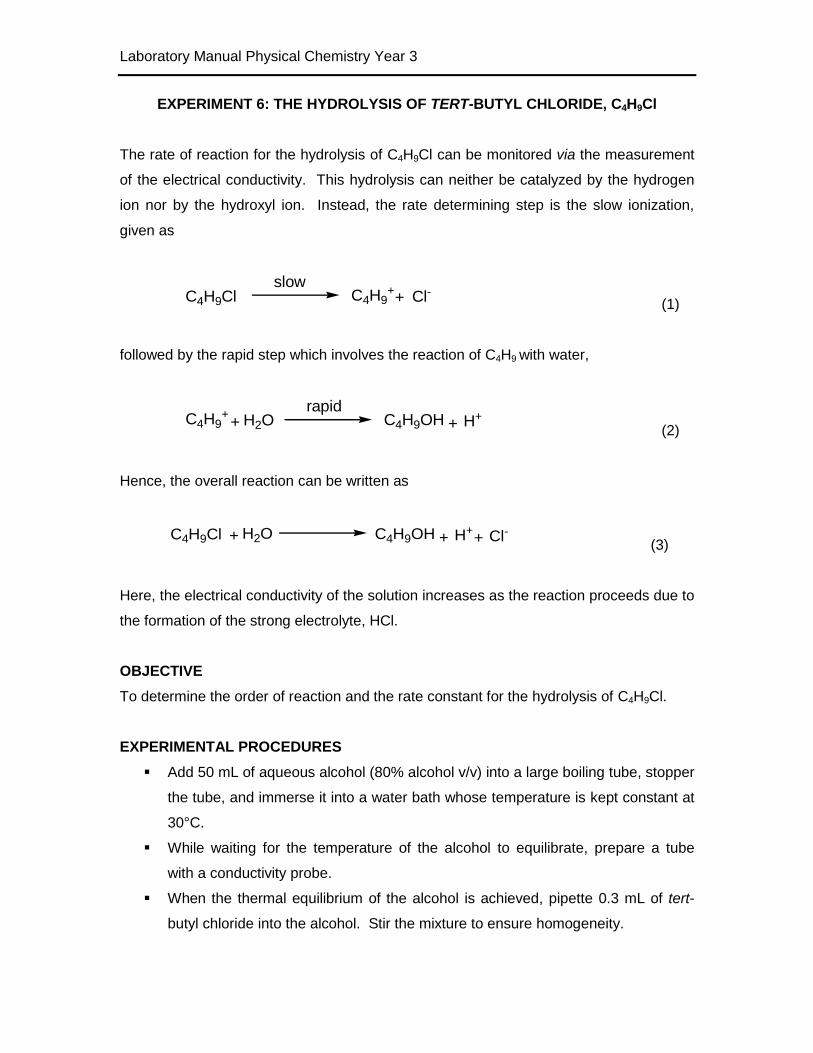
EXPERIMENT 6: THE HYDROLYSIS OF TERT-BUTYL CHLORIDE, C4H9Cl
The rate of reaction for the hydrolysis of C4H9Cl can be monitored via the measurement
of the electrical conductivity. This hydrolysis can neither be catalyzed by the hydrogen
ion nor by the hydroxyl ion. Instead, the rate determining step is the slow ionization,
given as
+slow
C4H9Cl C4H9+
Cl- (1)
followed by the rapid step which involves the reaction of C4H9 with water,
+rapid
+C4H9+ C4H9OHH2O H+
(2)
Hence, the overall reaction can be written as
+ + +C4H9Cl H2O C4H9OH H+ Cl- (3)
Here, the electrical conductivity of the solution increases as the reaction proceeds due to
the formation of the strong electrolyte, HCl.
OBJECTIVE
To determine the order of reaction and the rate constant for the hydrolysis of C4H9Cl.
EXPERIMENTAL PROCEDURES
Add 50 mL of aqueous alcohol (80% alcohol v/v) into a large boiling tube, stopper
the tube, and immerse it into a water bath whose temperature is kept constant at
30°C.
While waiting for the temperature of the alcohol to equilibrate, prepare a tube
with a conductivity probe.
When the thermal equilibrium of the alcohol is achieved, pipette 0.3 mL of tert-
butyl chloride into the alcohol. Stir the mixture to ensure homogeneity.
Laboratory Manual Physical Chemistry Year 3
Insert the conductivity probe into the mixture and start the stopwatch
immediately.
The conductivity can be measured with a conductivity meter. However, prior to
using the conductivity meter, it has to be calibrated with the standard KCl (0.745
g/L solution, producing 1.41 mS cm-1).
The conductivity readings can now be obtained. Initially, the conductivity
readings for this experiment are recorded every 30 s for a period of 5 min, after
which the readings are taken every 2 min for a period of 1 h.
After taking the readings, transfer the conductivity probe into an empty boiling
tube. The boiling tube which contains the reaction mixture is then stoppered and
placed in a beaker of water with a temperature of 60°C for a period of 15 min in
order to complete the hydrolysis.
When the hydrolysis is complete, cool the boiling tube by immersing it again in
the water bath. The final conductivity reading is taken when the reaction mixture
in the boiling tube is at 30°C.
REPEAT THE ABOVE PROCEDURE using 0.2 mL and 0.4 mL of tert-butyl
chloride.
CALCULATIONS AND DISCUSSIONS
The conductivity of the solution is proportionate with the amount of hydrogen chloride
formed. (Alternatively, plot a calibration curve from the successive dilutions of the final
reaction mixture with the solvation of 80% alcohol-water, and measure the conductivity
for each dilution.)
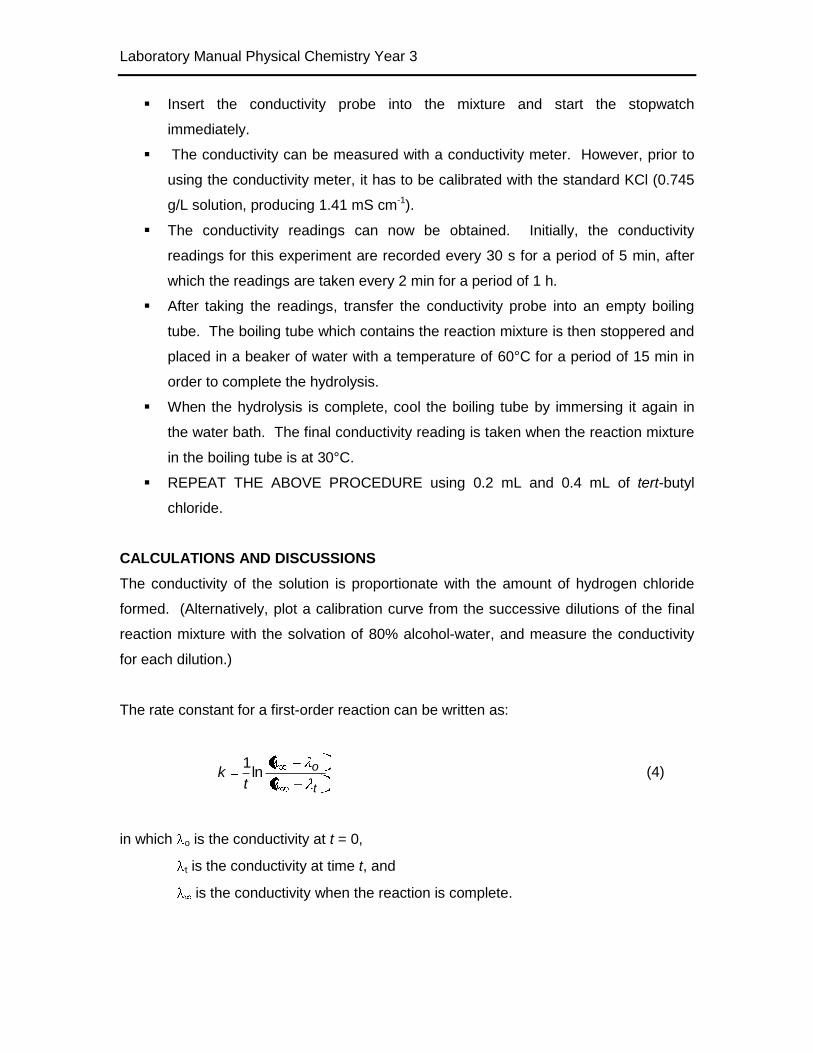
The rate constant for a first-order reaction can be written as:
t
o
tk ln
1 (4)
in which o is the conductivity at t = 0,
t is the conductivity at time t, and
is the conductivity when the reaction is complete.
Laboratory Manual Physical Chemistry Year 3
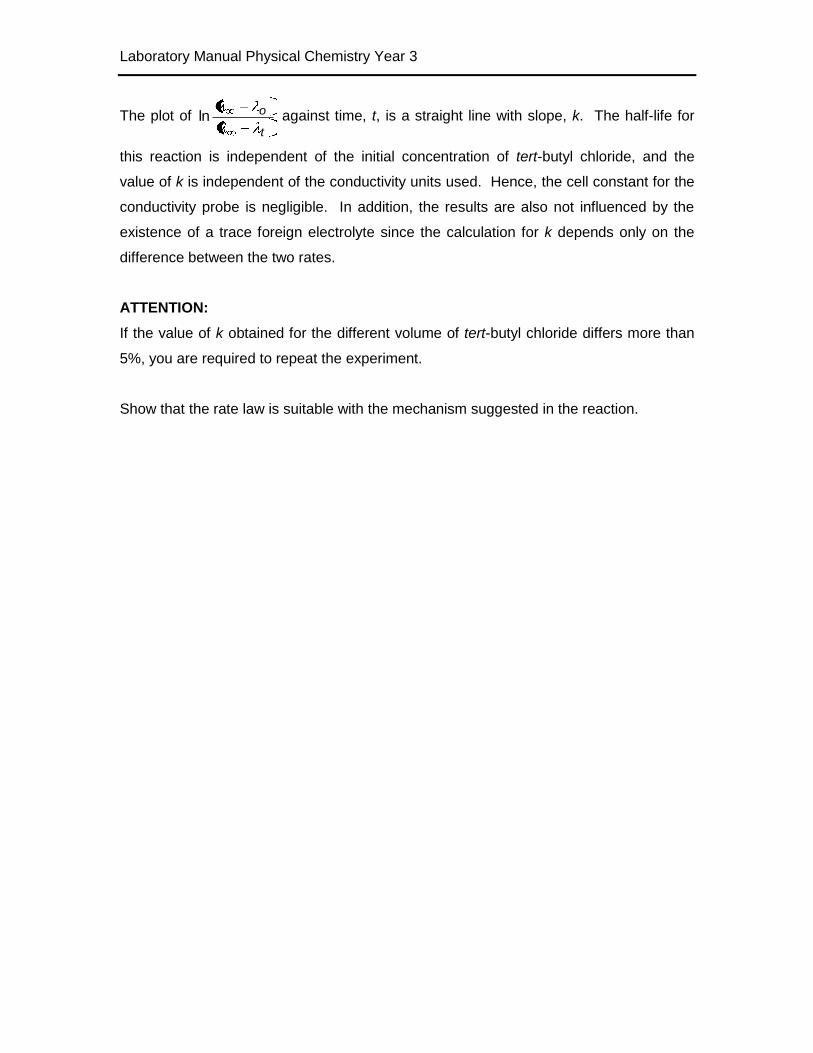
The plot of t
oln against time, t, is a straight line with slope, k. The half-life for
this reaction is independent of the initial concentration of tert-butyl chloride, and the
value of k is independent of the conductivity units used. Hence, the cell constant for the
conductivity probe is negligible. In addition, the results are also not influenced by the
existence of a trace foreign electrolyte since the calculation for k depends only on the
difference between the two rates.
ATTENTION:
If the value of k obtained for the different volume of tert-butyl chloride differs more than
5%, you are required to repeat the experiment.
Show that the rate law is suitable with the mechanism suggested in the reaction.
Laboratory Manual Physical Chemistry Year 3
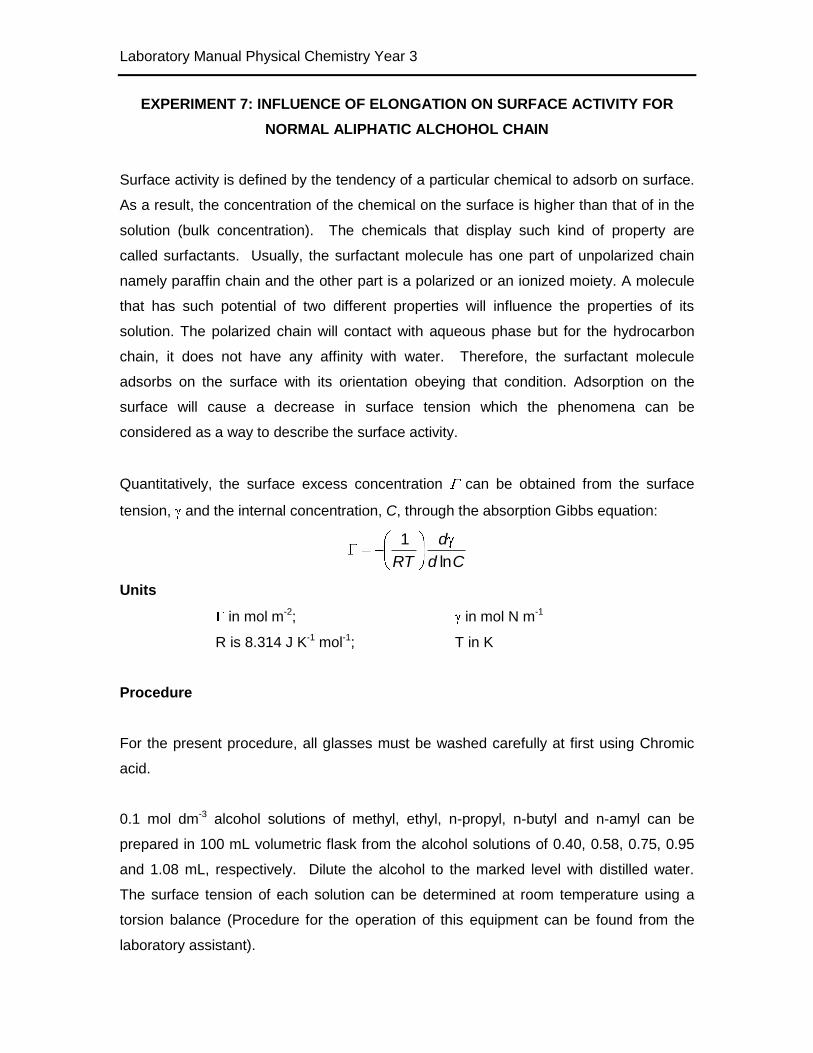
EXPERIMENT 7: INFLUENCE OF ELONGATION ON SURFACE ACTIVITY FOR
NORMAL ALIPHATIC ALCHOHOL CHAIN
Surface activity is defined by the tendency of a particular chemical to adsorb on surface.
As a result, the concentration of the chemical on the surface is higher than that of in the
solution (bulk concentration). The chemicals that display such kind of property are
called surfactants. Usually, the surfactant molecule has one part of unpolarized chain
namely paraffin chain and the other part is a polarized or an ionized moiety. A molecule
that has such potential of two different properties will influence the properties of its
solution. The polarized chain will contact with aqueous phase but for the hydrocarbon
chain, it does not have any affinity with water. Therefore, the surfactant molecule
adsorbs on the surface with its orientation obeying that condition. Adsorption on the
surface will cause a decrease in surface tension which the phenomena can be
considered as a way to describe the surface activity.
Quantitatively, the surface excess concentration can be obtained from the surface
tension, and the internal concentration, C, through the absorption Gibbs equation:
Cd
d
RT ln
1
Units
in mol m-2; in mol N m-1
R is 8.314 J K-1 mol-1; T in K
Procedure
For the present procedure, all glasses must be washed carefully at first using Chromic
acid.
0.1 mol dm-3 alcohol solutions of methyl, ethyl, n-propyl, n-butyl and n-amyl can be
prepared in 100 mL volumetric flask from the alcohol solutions of 0.40, 0.58, 0.75, 0.95
and 1.08 mL, respectively. Dilute the alcohol to the marked level with distilled water.
The surface tension of each solution can be determined at room temperature using a
torsion balance (Procedure for the operation of this equipment can be found from the
laboratory assistant).
Laboratory Manual Physical Chemistry Year 3
Prepare solutions of amyl alcohol with concentrations of
0.01, 0.02, 0.04, 0.06, 0.08, 0.10 mol dm-3
whereas solutions of 0.15, 0.18 and 0.2 mol dm-3 have readily been prepared. Shake
the solutions to ensure all the alcohols have been diluted and determine the surface
tension of each solution as described above.
The surface tension for distilled water must be determined as well. Repeat the
procedures using t-butyl alcohol. Prepare a stock solution containing 6 g t-butyl alcohol
in 100 mL solution in a 100 mL volumetric flask. Dilute solutions of
0.5, 1, 3, 5, 7, 10 and 13 mol dm-3
to 100 mL with distilled water in volumetric flasks. Determine the surface tensions for
the solutions.
Result and discussion
Plot a graph of versus the number of carbon atoms in alcohol. Explain the result
obtained. The decreasing of surface tension can be assumed as a measurement of the
alcohol surface activity.
Plot versus lnC as well for the amyl alcohol and draw a tangent on the line curve at
C = 0.02, 0.04, 0.06, 0.08, 0.12 and 0.18 mol dm-3.
Calculate for the concentrations using the adsorption Gibbs equation. Finally, plot
versus concentration and determine the limiting value for the highest concentration.
Describe the shape of the graph. Use the limiting value in calculating the average
surface area per amyl alcohol molecule. Compare the area with the cross-sectional area
of paraffin chain, namely 0.195 cm2.
Repeat the calculation for the t-butyl alcohol and comment it.
Laboratory Manual Physical Chemistry Year 3
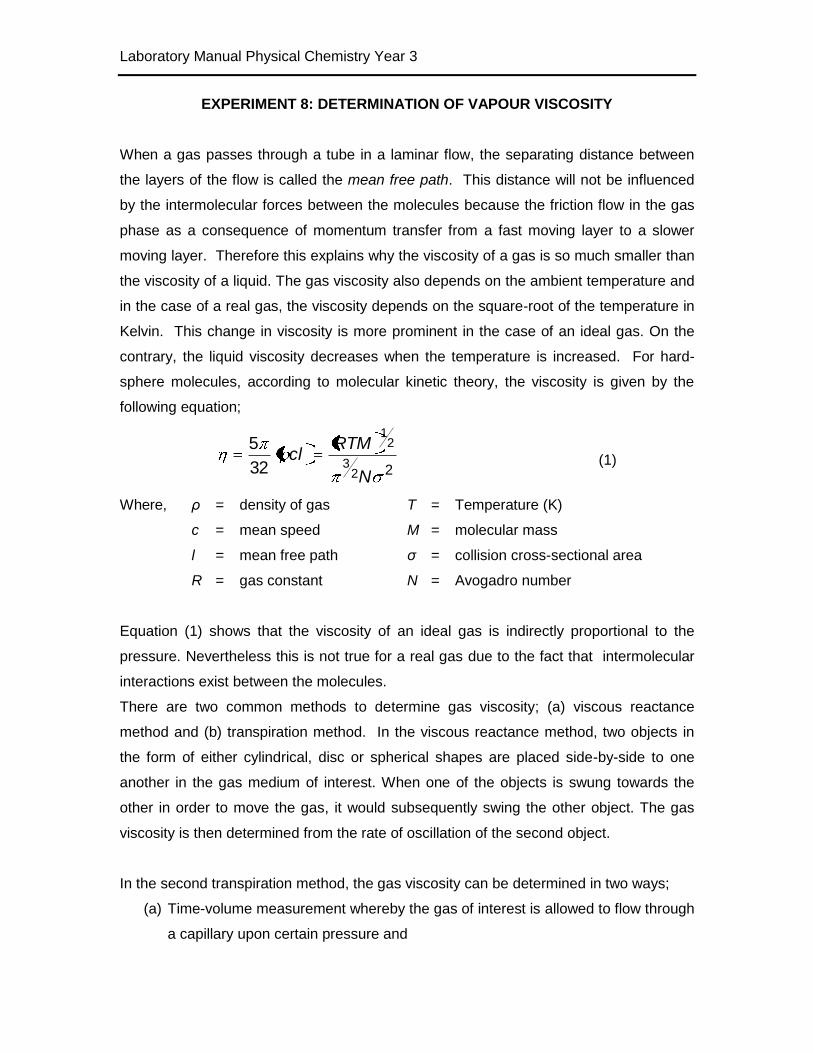
EXPERIMENT 8: DETERMINATION OF VAPOUR VISCOSITY
When a gas passes through a tube in a laminar flow, the separating distance between
the layers of the flow is called the mean free path. This distance will not be influenced
by the intermolecular forces between the molecules because the friction flow in the gas
phase as a consequence of momentum transfer from a fast moving layer to a slower
moving layer. Therefore this explains why the viscosity of a gas is so much smaller than
the viscosity of a liquid. The gas viscosity also depends on the ambient temperature and
in the case of a real gas, the viscosity depends on the square-root of the temperature in
Kelvin. This change in viscosity is more prominent in the case of an ideal gas. On the
contrary, the liquid viscosity decreases when the temperature is increased. For hard-
sphere molecules, according to molecular kinetic theory, the viscosity is given by the
following equation;
223
21
32
5
N
RTMcl (1)
Where, ρ = density of gas T = Temperature (K)
c = mean speed M = molecular mass
l = mean free path σ = collision cross-sectional area
R = gas constant N = Avogadro number
Equation (1) shows that the viscosity of an ideal gas is indirectly proportional to the
pressure. Nevertheless this is not true for a real gas due to the fact that intermolecular
interactions exist between the molecules.
There are two common methods to determine gas viscosity; (a) viscous reactance
method and (b) transpiration method. In the viscous reactance method, two objects in
the form of either cylindrical, disc or spherical shapes are placed side-by-side to one
another in the gas medium of interest. When one of the objects is swung towards the
other in order to move the gas, it would subsequently swing the other object. The gas
viscosity is then determined from the rate of oscillation of the second object.
In the second transpiration method, the gas viscosity can be determined in two ways;
(a) Time-volume measurement whereby the gas of interest is allowed to flow through
a capillary upon certain pressure and
Laboratory Manual Physical Chemistry Year 3
(b) Time-pressure measurement during the vacuuming process through the
capillary. However the size and dimension of the capillary must be precisely
known in order to determine the absolute gas viscosity value. This can be done
by using a standard gas of known viscosity.
Experimental procedure
Set the temperature of water bath to about 35oC. Check for leaks by closing all valves
and vacuum the manifold. Leakage can be detected by observing the barometer
pressure gauge every 10 minutes.
Then introduce dry air through the silica gel into the system. While the capillary is being
vacuumed, record the barometer heights at certain time intervals for 20 - 30 minutes.
Record readings such as pressure inside the manifold Pm and the air pressure Pa. The
difference in the pressure P, is given by P = Pa - Pm. Obtain Pa by using the barometer
provided. Introduce 5 -10 mL of pentane into the manifold by using a round bottom
quick-fit reservoir flask. Secure and seal with silicon grease. Vacuum until almost all the
pentane evaporates. Immediately close the valve and let the temperature equilibrate with
the room temperature. Make sure that all the pentane completely evaporates. Then
vacuum through the capillary and record your barometer readings at certain time
intervals. Repeat the experiment with diethyl ether and methylene dichloride
respectively.
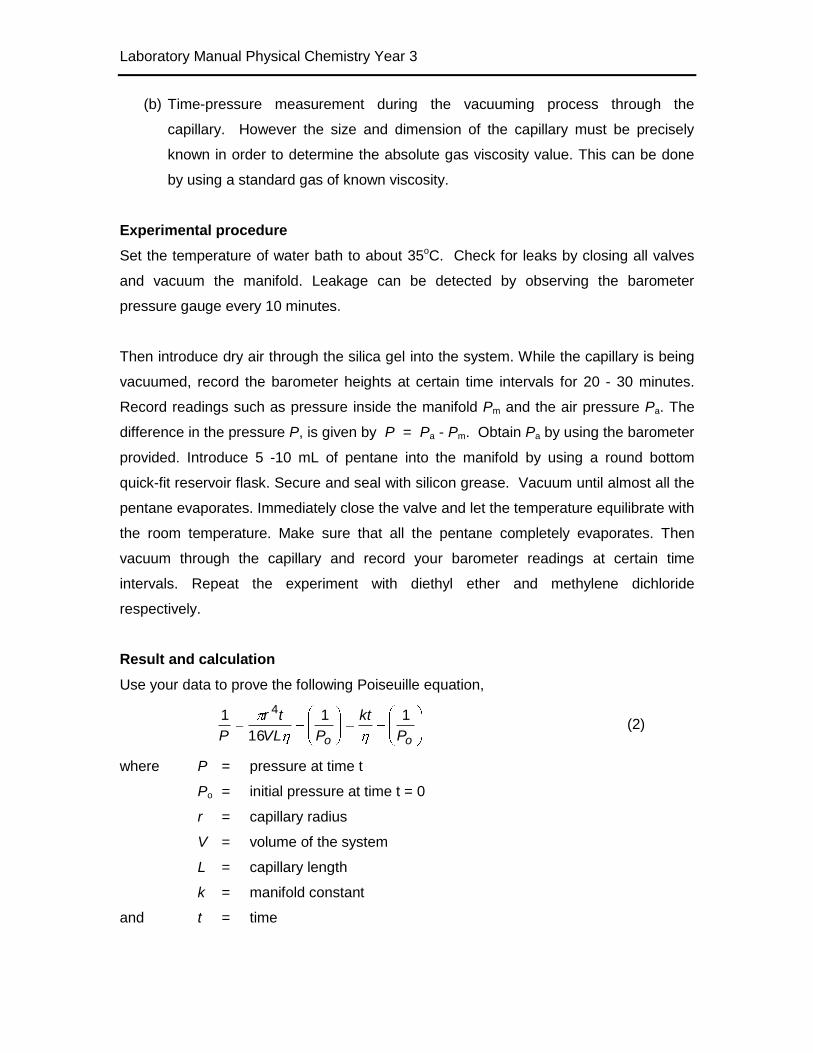
Result and calculation
Use your data to prove the following Poiseuille equation,
oo P
kt
PVL
tr
P
11
16
1 4
(2)
where P = pressure at time t
Po = initial pressure at time t = 0
r = capillary radius
V = volume of the system
L = capillary length
k = manifold constant
and t = time
Laboratory Manual Physical Chemistry Year 3
Plot P
1 against t for dry air and all the three gases investigated. Given that the
viscosity of air at 35oC is 188.6 microPoise, determine the viscosities for all gases.
Assuming that the volume of the system and the length of the capillary are 700 cm3 and
81 mm respectively, determine the radius of the capillary using the data obtain from the
dry air.
Discuss your results with respect to the boiling point of pentane, diethyl ether and
methylene dichloride respectively.
Questions
1. Derive equation (2) from the Poiseuille equation and the ideal gas equation.
Poiseuille equation, L
PPrQ
8
214
where Q = the volume flow rate in the laminar flow and
(P1 - P2) = differential pressure at both ends of the capillary.
2. At what pressure will the mean free path be equal to the length of the capillary?
3. Is equation (2) valid when the mean free path is greater than the length of the
capillary tube?
References
1. P.W. Atkins, "Physical Chemistry", ed. 6, Oxford 1998.
2. I.N. Levine, "Physical Chemistry", ed. 4, McGraw-Hill, 1995.
3. R.A. Alberty & R.J. Silbey, "Physical Chemistry", ed. 2, John Wiley, 1996.