phd thesis - fundacionaquae.org · methodological proposal for social impact assessment and...
TRANSCRIPT
UNIVERSITAT POLITÈCNICA DE VALÈNCIA Departamento de Ingeniería Hidráulica y Medio Ambiente
Programa de Doctorado en Ingeniería del Agua y Medioambiental
PhD Thesis
Methodological proposal for social impact assessment and environmental conflict analysis
Author: Kiko Alexi Delgado Villanueva
Supervised by: Dr. Inmaculada Romero Gil
Valencia, March 2016


I
Acknowledgments
I want to express my more sincere acknowledgment to:
BABEL project from Erasmus Mundus program. In which, I
got a scholarship, that allowed me developing this research
from 2013 to 2016.
Inma Romero, PhD, for giving me the opportunity to join the
team of the Engineering Institute of Water and Environment
(IIAMA) and by her support in the direction of this thesis.
Przemysław Kaszubski, PhD, for his support and teaching
during my stay at the Adam Mickiewicz University in
Poznan, Poland.
All my friends of the Research Group of Environmental
Impact Assessment (GEIA) within of IIAMA, for their
unconditional support during the development of this thesis.
The team of experts from different countries, by their opinion
and support in each stage of development of this thesis, which
enabled successfully complete this research.


III
Abbreviations
AHP : Analytic hierarchy process.
AM : Arithmetic mean.
CI : Consistency index.
CR : Consistency ratio.
CTWF : Triangular whitenization weight functions.
ECA : Environmental conflict analysis.
EIA : Environmental impact assessment.
EW : Entropy-weight.
FAHP : Fuzzy analytic hierarchy process.
GC : Grey clustering.
GDP : Gross domestic product.
GM : Geometric mean.
IGCEW : Integrated grey clustering and entropy-weight.
RI : Random consistency index.
SIA : Social impact assessment.


V
Summary
Social impact assessment (SIA) is a part of environmental impact
assessment (EIA), which is characterized by a high level of uncertainty and
the subjective aspects that are presents in the methods used during its
conduction. In addition, environmental conflict analysis (ECA) has become
a key factor for the viability of projects and welfare of affected populations.
In this thesis, an integrated method for SIA and ECA is proposed, by the
combination of the grey clustering method and the entropy-weight method.
SIA was performed using the grey clustering method, which enables
qualitative information coming from a stakeholder group to be quantified.
In turn, ECA was performed using the entropy-weight method, which
identifies the criteria in which there is greater divergence between
stakeholder groups, thus enabling to establish measures to prevent
potential environmental conflicts. Then, in order to apply and test the
proposed integrated method, two case studies were conducted.
The first case study was a mining project in northern Peru. In this study,
three stakeholder groups and seven criteria were identified. The results
revealed that for the urban population group and the rural population
group, the project would have a positive and negative social impact,
respectively. For the group of specialists the project would have a normal
social impact. It was also noted that the criteria most likely to generate
environmental conflicts in order of importance were: access to drinking
water, poverty, GDP per capita, and employment.
The second case study considered was a hydrocarbon exploration project
located in the Gulf of Valencia, Spain. In this study, four stakeholder groups
and four criteria were identified. The results revealed that for the group of
specialists the project would have a negative social impact, and contrary

perceptions were shown between the group of those directly affected by the
project and the group of citizens in favour. It was also noted that the criteria
most likely to generate environmental conflict were the percentage of
unemployment and GDP per capita.
The proposed integrated method in this thesis showed great potential on
the studied cases, and could be applied to other contexts and other projects,
such as water resources management, industrial projects, construction
projects, and to measure social impact and prevent conflicts during the
implementation of government policies and programs.

VII
Resumen
La evaluación del impacto social (SIA) forma parte de la evaluación de
impacto ambiental (EIA), y está caracterizada por su alto nivel de
incertidumbre, y por los aspectos subjetivos presentes en los métodos
usados para su realización. Por otro lado, el análisis del conflicto ambiental
(ECA) se ha convertido en un factor clave para la viabilidad de los proyectos
y el bienestar de la población afectada. En esta tesis, se propone un método
integrado para la SIA y el ECA, mediante la combinación de los métodos
grey clustering y entropy-weight.
La SIA fue desarrollada usando el método grey clustering, el cual permite
cuantificar la información cualitativa recogida de los grupos de interés o
stakeholders. Sucesivamente, el ECA fue realizado usando el método entropy-
weight, el cual identifica los criterios en los cuales existe gran divergencia
entre los grupos de interés, permitiendo así establecer medidas para
prevenir potenciales conflictos ambientales. Luego, con el fin de aplicar y
testear el método integrado propuesto fueron realizados dos casos de
estudio.
El primer caso de estudio fue un proyecto minero ubicado en el norte de
Perú. En este estudio se identificaron tres grupos de interés y siete criterios.
Los resultados revelaron que para el grupo población urbana y el grupo
población rural, el proyecto tendría un impacto social positivo y negativo,
respectivamente. Para el grupo de los especialistas el proyecto tendría un
impacto social normal. También fue notado que los criterios más probables
de generar conflicto ambiental en orden de importancia fueron: acceso al
agua potable, pobreza, PIB per cápita, y empleo.
El segundo caso de estudio considerado fue un proyecto de exploración de
hidrocarburos ubicado en el Golfo de Valencia, España. En este estudio se

identificaron cuatro grupos de interés y cuatro criterios. Los resultados
revelaron que para el grupo de los especialistas el proyecto tendría un
impacto social negativo, y contrarias percepciones se encontraron entre el
grupo de los directamente afectados y el grupo de los ciudadanos a favor.
También fue notado que los criterios más probables de generar conflicto
ambiental fueron el porcentaje de desempleo y el PIB per cápita.
El método integrado propuesto en esta tesis mostró un gran potencial sobre
los casos estudiados, y podría ser aplicado a otros contextos y otros tipos de
proyectos, tales como gestión de recursos hídricos, proyectos industriales,
proyectos de construcción de obras públicas, y para medir el impacto social
y prevenir conflictos durante la aplicación de políticas y programas
gubernamentales.

IX
Resum
L’avaluació de l'impacte social (SIA) és una part de l’avaluació de l'impacte
ambiental (EIA), la qual està caracteritzada pel seu alt nivell d’incertitud i
els aspectes subjectius presents en els mètodes amprats durant la seua
conducció. A més, la anàlisis del conflicte ambiental (ECA) s'ha convertit en
un factor clau per a la viabilitat dels projectes i el benestar de la població
afectada. En esta tesis es proposa un mètode integrat per a l’avaluació de
l'impacte social i la anàlisis del conflicte ambiental, mitjançant la
combinació del mètode grey clustering i el mètode entropy-weight.
L’avaluació de l'impacte social ha segut realitzada usant el mètode grey
clustering, el qual permet que la informació qualitativa arreplegada dels
grups d’interès siga quantificada. Successivament, la anàlisis del conflicte
ambiental ha segut realitzada usant el mètode entropy-weight, el qual
identifica els criteris en els quals existeix gran divergència entre els grups
d’interès, la qual cosa permet establir mides per a prevenir conflictes
ambientals potencials. Després, amb la finalitat d'aplicar i testejar el mètode
integrat proposat han segut realitzats dos casos d'estudi.
El primer d’ells ha segut un projecte miner al nord de Perú. En aquest
estudi, tres grups d’interès i set criteris foren identificats. Els resultats
revelaren que per al grup població-urbana i el grup població-rural, el
projecte experimentaria un positiu i un negatiu impacte social
respectivament. Per al grup dels especialistes el projecte tindria un impacte
social normal. Per altra banda també va ser reconegut que els criteris més
probables de generar conflicte ambiental en orde d’importància foren: accés
a l'aigua potable, pobresa, PIB per càpita, i ofici.
El segon cas d'estudi considerat va ser un projecte d’exploració
d'hidrocarburs ubicat al Golf de València, Espanya. En este estudi, quatre

grups d’interès i quatre criteris foren identificats. Els resultats revelaren que
per al grup dels especialistes el projecte tindria un impacte social negatiu,
mentre que entre el grup dels directament afectats i el grup dels ciutadans
a favor es mostraren percepcions contraries. Va ser també reconegut que els
criteris més probables de generar conflicte ambiental foren el percentatge
de desocupació i el PIB per càpita.
El mètode integrat proposat en aquesta tesis mostra un gran potencial sobre
els casos estudiats, i pot ser aplicat a altres contexts i altres tipus de projectes
com gestió de recursos hídrics, projectes industrials i projectes de
construcció d'obres públiques. A més pot fer-se servir per mesurar l'impacte
social i prevenir conflictes durant l’aplicació de polítiques i programes
governamentals.

XI
Table of contents
Acknowledgments ............................................................................................ I
Abbreviations ................................................................................................. III
Summary ........................................................................................................ V
Resumen ....................................................................................................... VII
Resum.............................................................................................................IX
Table of contents ............................................................................................XI
List of figures .............................................................................................. XVII
List of tables ................................................................................................ XIX
CHAPTER I ........................................................................................................ 1
1. Introduction .................................................................................................. 3
1.1 Conceptual framework ...................................................................................................... 4
1.1.1 Environmental impact assessment ............................................................................ 4
1.1.2 Social impact assessment .......................................................................................... 5
1.1.3 Environmental conflict .............................................................................................. 5
1.2 Legal framework ................................................................................................................ 7
1.2.1 Peruvian law .............................................................................................................. 7
1.2.2 Spanish law ................................................................................................................ 8
1.3 Objectives of the thesis ..................................................................................................... 9
1.4 Organization of the thesis ................................................................................................. 9
References ............................................................................................................................. 10
CHAPTER II ..................................................................................................... 15
2. State of the art ............................................................................................ 17
2.1 Introduction..................................................................................................................... 17
2.2 The Delphi method .......................................................................................................... 18
2.2.1 Procedure for the Delphi method ........................................................................... 18
2.2.2 Summary of the Delphi method .............................................................................. 20
2.3 The AHP method ............................................................................................................. 21
2.3.1 Procedure for the AHP method ............................................................................... 22

2.3.2 Summary of the AHP method .................................................................................. 34
2.4 The FAHP method............................................................................................................ 34
2.4.1 Procedure for the FAHP method ............................................................................. 36
2.4.2 Summary of the FAHP method ................................................................................ 43
2.5 The grey clustering method ............................................................................................ 44
2.5.1 Procedure for the grey clustering method .............................................................. 45
2.5.2 Summary of the grey clustering method ................................................................. 49
2.6 The entropy-weight method ........................................................................................... 50
2.6.1 Procedure for the entropy-weight method ............................................................. 51
2.6.2 Summary of the entropy-weight method ................................................................ 55
References ............................................................................................................................. 56
CHAPTER III .................................................................................................... 63
3. Formulation of the proposed method ........................................................... 65
3.1 Introduction..................................................................................................................... 65
3.2 Initial study to explore a method for SIA......................................................................... 65
Paper 1: Selection of a method for SIA using AHP ................................................................ 66
3.2.1 Introduction ............................................................................................................. 67
3.2.2 Methodology ........................................................................................................... 69
3.2.3 AHP on the selection of a method for SIA ............................................................... 73
3.2.3.1 Alternatives ...................................................................................................... 73
3.2.3.2 Criteria of selection .......................................................................................... 75
3.2.3.3 Matrix and index of consistency ...................................................................... 76
3.2.3.4 Ranking of the alternatives .............................................................................. 78
3.2.4 Results and discussion ............................................................................................. 80
3.2.5 Conclusions .............................................................................................................. 82
References ........................................................................................................................ 83
3.3 Formulation of the method for SIA and ECA ................................................................... 87
3.3.1 SIA using the grey clustering method based on CTWF ............................................ 87
3.3.2 ECA using the entropy-weight method ................................................................... 89
3.3.3 Integrating SIA and ECA using the grey clustering and entropy-weight methods ... 90
Step 1: Criteria and grey classes .................................................................................. 91
Step 2: CTWF and the comprehensive clustering coefficient ...................................... 91
Step 3: Percentage system........................................................................................... 91
Step 4: Entropy-weight method .................................................................................. 92
Step 5: Objective assessment ...................................................................................... 92

XIII
3.3.4 Schema of the proposed method ............................................................................ 93
3.3.5 Advantages and limitations of the proposed method ............................................. 95
References ........................................................................................................................ 97
CHAPTER IV .................................................................................................. 101
4. Case study in Peru ...................................................................................... 103
Paper 2: Environmental conflict analysis using an integrated grey clustering and entropy-
weight method: A case study of a mining project in Peru .................................................. 103
4.1 Introduction................................................................................................................... 104
4.2 Literature review ........................................................................................................... 107
4.3 Method .......................................................................................................................... 113
4.3.1 Grey clustering method based on CTWF ............................................................... 113
4.3.2 Entropy-weight method ........................................................................................ 115
4.3.3 Integration of the grey clustering and entropy-weight methods .......................... 118
4.4 Case study ..................................................................................................................... 121
4.4.1 Stakeholder Groups ............................................................................................... 122
4.4.2 Calculations ........................................................................................................... 123
Step 1: Criteria and grey classes ................................................................................ 124
Step 2: CTWF and the comprehensive clustering coefficient .................................... 125
Step 3: Percentage system......................................................................................... 129
Step 4: Entropy-weight method ................................................................................ 131
Step 5: Objective assessment .................................................................................... 131
4.5 Results and Discussion .................................................................................................. 132
4.5.1 The case study ....................................................................................................... 132
4.4.1.1 Sensitivity Analysis ......................................................................................... 135
4.4.1.2 Analysis of diverging criteria .......................................................................... 136
4.4.2 The broader potential of the IGCEW method........................................................ 141
4.6 Conclusions.................................................................................................................... 142
References ........................................................................................................................... 143
CHAPTER V ................................................................................................... 151
5. Case study in Spain .................................................................................... 153
Paper 3: Integrating social impact assessment and environmental conflict analysis on a
hydrocarbon exploration project in the gulf of Valencia, Spain. ......................................... 153
5.1. Introduction.................................................................................................................. 154
5.2. Methodology ................................................................................................................ 156

5.2.1. SIA using the GC method ...................................................................................... 157
5.2.2. ECA using the EW method .................................................................................... 160
5.2.3. Integration of SIA and ECA using the IGCEW method .......................................... 162
5.3. Case study .................................................................................................................... 165
5.3.1. Stakeholder Groups .............................................................................................. 166
5.3.2. Calculations using the integrated method ........................................................... 169
Step 1: Criteria and grey classes ................................................................................ 169
Step 2: CTWF and the comprehensive clustering coefficient .................................... 171
Step 3: Percentage system......................................................................................... 175
Step 4: Entropy-weight method ................................................................................ 176
Step 5: Objective assessment .................................................................................... 177
5.4. Results and Discussion ................................................................................................. 177
5.4.1 The potential of the integrated method to integrate SIA and ECA ....................... 177
5.4.2 The case study ....................................................................................................... 179
5.4.2.1 Analysis of findings from calculations ............................................................ 179
5.4.2.2 Analysis of diverging criteria .......................................................................... 182
5.5. Conclusions................................................................................................................... 185
References ........................................................................................................................... 186
CHAPTER VI .................................................................................................. 193
6. General discussion and conclusions ............................................................ 195
6.1 Discussion of the thesis ................................................................................................. 195
6.1.1 Discussion on the proposed integrated method ................................................... 195
6.1.2 Discussion on the application to a project in Peru ................................................ 197
6.1.3 Discussion on the application to a project in Spain ............................................... 198
6.1.4 Discussion on the potential to be applied in other contexts ................................. 199
6.2 Conclusions of the thesis ............................................................................................... 199
6.3 Contributions and limitations of the thesis ................................................................... 200
6.4 Future research lines ..................................................................................................... 201
References ........................................................................................................................... 202
Annexes ....................................................................................................... 203
Annexe 1: Questionnaire used in paper 1 ........................................................................... 205
Annexe 2: Questionnaire used in paper 2 ........................................................................... 206
Annexe 3: Questionnaire used in paper 3 ........................................................................... 207
Annexe 4: Images from stakeholder groups of case study in Peru ..................................... 208

XV
Annexe 5: Images from stakeholder groups of case study in Spain .................................... 211
Annexe 6: Products derived of the thesis ........................................................................... 215


XVII
List of figures
Figure 1.1: Map of environmental conflicts. 7
Figure 2.1: Global schema of Delphi process. 19
Figure 2.2: General schema of the AHP method. 22
Figure 2.3: Hierarchy of criteria to select a project in ACME. 27
Figure 2.4: Results of the hierarchy of the alternatives. 33
Figure 2.5: Fuzzy triangular number. 35
Figure 2.6: Membership functions for numerical rating of FAHP. 37
Figure 2.7: Alternatives and criteria of the example of FAHP. 38
Figure 2.8: Final result of the example of FAHP. 43
Figure 2.9: Center-point triangular whitenization weight functions (CTWF). 46
Figure 3.1: Hierarchy to select a method for SIA. 76
Figure 3.2: Ranking of alternatives methods for SIA. 80
Figure 3.3: Schema according to methods for SIA and ECA. 94
Figure 3.4: Schema according to integration of SIA and ECA. 95
Figure 4.1: Center-point triangular whitenization weight functions (CTWF). 115
Figure 4.2: Schema of the IGCEW method for ECA 118
Figure 4.3: Cajamarca, Peru. 122
Figure 4.4: CTWF in the case study. 126
Figure 4.5: Total social impact assessment of G1, G2 and G3. 133
Figure 4.6: Social impact assessment for each criterion for groups G1 and G2. 134
Figure 4.7: Objective assessment for each criterion for groups G1 and G2. 135
Figure 4.8: Environmental advocacy stakeholder group. 136
Figure 4.9: Lagoon “El Perol”, Cajamarca-Perú. 137
Figure 4.10: Water conflict on the channel “Quinua”, Cajamarca-Peru. 138
Figure 5.1: CTWF (S. Liu & Lin, 2010). 160
Figure 5.2: Schema of the integration of SIA and ECA. 163
Figure 5.3: Project location (Environmental Resources Management Iberia, 2012). 166
Figure 5.4: Those directly affected stakeholder group. 167
Figure 5.5: Those citizens opposed to the project stakeholder group. 167
Figure 5.6: Those citizens in favour stakeholder group. 168
Figure 5.7: Specialists stakeholder group. 169
Figure 5.8: Criteria system of the case study. 170
Figure 5.9: CTWF for the case study. 172

Figure 5.10: Values of SIA of each group. 180
Figure 5.11: Values of SIA of each criterion for groups G1 and G3. 181
Figure 5.12: Objective assessment for each group. 182
Figure 5.13: Opposed citizens to the project. 183
Figure 5.14: Fishing cooperative of Valencia. 184

XIX
List of tables
Table 2.1: The Saaty scale for the relative importance. 23
Table 2.2: Values of IR. 24
Table 2.3: Maximum values of CR. 24
Table 2.4: Criteria of first level normalized. 28
Table 2.5: Calculation of eigenvector. 28
Table 2.6: Calculation of maximum eigenvector. 29
Table 2.7: Values of the criteria the second level. 30
Table 2.8: Global weight of the criteria. 31
Table 2.9: Evaluation of the alternatives for the first criterion. 31
Table 2.10: Weight of the alternatives for every criterion. 32
Table 2.11: Final weight of the alternative A1. 33
Table 2.12: Numerical rating for FAHP. 36
Table 2.13: Aggregated values from the experts. 39
Table 2.14: Total sum of rows and columns of the example. 39
Table 2.15: Aggregated results from experts in the example of FAHP. 41
Table 2.16: Weight of the alternatives in the example of FAHP. 42
Table 2.17: Hierarchy of the alternatives of the example of FAHP. 42
Table 2.18: Values of three educational programs. 47
Table 2.19: The comprehensive clustering coefficient for each program. 49
Table 2.20: Information from the companies. 53
Table 2.21: Normalized values in each criterion. 53
Table 2.22: Entropy values of each criterion. 54
Table 2.23: Degree of divergence in each criterion. 54
Table 2.24: Entropy weight of each criterion. 54
Table 2.25: Ranking of the companies. 55
Table 3.1: Relative importance of the Saaty scale. 70
Table 3.2: Values of IR established by Saaty. 71
Table 3.3: Values of CR established by Saaty. 72
Table 3.4: Paired comparison between criteria. 76
Table 3.5: Accumulated comparison matrix from the experts. 77
Table 3.6: Comparison matrix normalized. 77
Table 3.7: Comparison matrixes of the alternatives. 78
Table 3.8: Normalized matrix of alternatives. 79

Table 3.9: Prediction errors of a statistical model and a grey model. 88
Table 3.10: Comparison with other main approaches. 96
Table 4.1: Comparison of average error of a statistical model and a grey model. 109
Table 4.2: Comparison between grey systems and fuzzy math methods. 110
Table 4.3: Comparison between the IGCEW method and other main approaches. 112
Table 4.4: ECA criteria identified in the case study. 124
Table 4.5: Grey classes for each criterion determined in the case study. 125
Table 4.6: Center-points of the extended grey classes in the case study. 126
Table 4.7: Questions used in the questionnaire. 128
Table 4.8: Aggregated values for each criterion for groups G1, G2 and G3. 129
Table 4.9: Values of CTWF and 𝝈𝒊𝒌 for group G1. 129
Table 4.10: The percentage system established in the case study. 130
Table 4.11: Social impact assessment for group G1. 130
Table 4.12: Social impact assessment for groups G1, G2 and G3. 130
Table 4.13: Normalized values of SIA of groups G1, G2 and G3. 131
Table 4.14: Values of Hj, divj and wj for each criterion in the case study. 131
Table 4.15: Objective assessment scores for each group in the case study. 131
Table 5.1: Evaluation criteria in the case study. 170
Table 5.2: Grey classes for each criterion in the case study. 171
Table 5.3: Center-points of the extended grey classes in the case study. 172
Table 5.4: Questions used in the questionnaire for the case study. 174
Table 5.5: Aggregated values of each criterion for groups G1, G2, G3 and G4. 174
Table 5.6: Values of CTWF and 𝝈𝒊𝒌 for group G1. 175
Table 5.7: The percentage system determined in the case study. 175
Table 5.8: Results of SIA for group G1. 175
Table 5.9: Results of SIA for groups G1, G2, G3 and G4. 176
Table 5.10: Normalized results of SIA for groups G1, G2, G3 and G4. 176
Table 5.11: Values of Hj, divj and wj for each criterion. 176
Table 5.12: Objective assessment scores for each group. 177

CHAPTER I
INTRODUCTION


Chapter I|3
1. Introduction
An environmental factor within of environmental impact assessment is the
social factor, which is characterized by its high level of uncertainly and the
methods used for conducing that are mainly qualitative, as evidenced by
studies of social impact assessment related to food safety (Dreyer, Renn,
Cope, & Frewer, 2010), marine protected area (Voyer, Gladstone, & Goodall,
2012), earthquakes caused by gas extraction (van der Voort & Vanclay, 2015)
or fisheries closure (Hattam, Mangi, Gall, & Rodwell, 2014).
In turn, environmental conflicts often accompany the planning and
implementation of projects and programs, as evidenced by studies of
conflicts related to water management (Bolin, Collins, & Darby, 2008;
Saqalli, Thiriot, & Amblard, 2010), energy (Fontaine, 2010; Karjalainen &
Järvikoski, 2010), exploitation of natural resources (Correia, 2007; Madani,
Rouhani, Mirchi, & Gholizadeh, 2014; Warnaars, 2012) or ecological tourism
(Yang, Ryan, & Zhang, 2013). In Addition, environmental conflicts are
generated between stakeholder groups within communities, due to the
differences in the assessment of an determined project (Arun, 2008; Luyet,
Schlaepfer, Parlange, & Buttler, 2012). For this reason, social impact
assessment should first be performed for each stakeholder group and then
the gap between the groups should be determined in order to predict and
prevent possible environmental conflicts.
In this thesis an integrated method for SIA and ECA is proposed, which
could contribute to improve the qualitative and quantitative methods
existing so far. In addition, in order to apply and test the proposed
integrated method, SIA and ECA were conducted on a project in Peru and
a project in Spain.

Introduction|4
1.1 Conceptual framework
In this section an explanation of the concepts of environmental impact
assessment, social impact assessment, and environmental conflict are
developed.
1.1.1 Environmental impact assessment
Environmental impact assessment (EIA) should be conducted on the
environmental factors, which are classified as shown below (Romero I.,
2012):
1. Climate.
2. Geology and geomorphology.
3. Surface and groundwater hydrology.
4. Edaphology.
5. Atmosphere.
6. Biotic environment.
7. Landscape.
8. Social, economic and cultural environment.
In this thesis, the social environmental is studied and integrated with
environmental conflict analysis.
EIA has been conducted by different methods, according to environmental
factor under study, for example EIA on watersheds (Dubé et al., 2013), solar
radiation (Jedrzej et al., 2013) or environmental noise (Giménez A., 2010).
In addition, the reflexion on the advances of EIA is permanent (Pope et al.,
2013).

Chapter I|5
1.1.2 Social impact assessment
Social impact assessment has been conducted so far, mainly by qualitative
approaches, as shown by studies based on public participation (B. Tang,
Wong, & Lau, 2008), game theory (Prenzel & Vanclay, 2014) or
stakeholder’s views (Hattam et al., 2014). However, there are quantitative
approaches for EIA and SIA, as evidenced by studies based on Delphi and
fuzzy (Chang, Qisen, Zheng, & Zhang, 2009) or logic fuzzy (Peche &
Rodríguez, 2011).
In this thesis, a method to improve the qualitative and quantitative
approaches for SIA is proposed. In addition, the proposed method enabled
to integrate SIA and ECA. Moreover, considering that SIA and ECA are
topics very subjective and inconstant; the proposed method should be
flexible and effective, in order to apply to other type of projects and in
different contexts.
1.1.3 Environmental conflict
Environmental conflicts are characterized by the interaction between (1)
ecological and (2) social complexity (Wittmer, Rauschmayer, & Klauer,
2006).
(1) “One central feature of environmental conflicts is the complexity of the
ecological system which is the natural base of the conflicts. Even if its
understanding is accompanied by a high degree of scientific sophistication,
there remains substantial uncertainty and ignorance. Therefore, the process
leading to the resolution of environmental conflicts must take into account
scientific and idiosyncratic knowledge and must cope with unavoidable
uncertainty and ignorance. Certain forms of multi-criteria decision aid
could satisfy this demand” (Wittmer et al., 2006).

Introduction|6
(2) “Another central feature of environmental conflicts is social complexity.
Some stakeholders are also actors who may impede the implementation of a
decision, or, put positively, their agreement is necessary for a successful
implementation of the decision. Social complexity calls for stakeholder
participation. Decision structuring tools offer the possibility to make
participatory decision processes more transparent” (Wittmer et al., 2006).
The resolution of environmental conflicts should concentrate on both
aspects, social and ecological complexity. Moreover, environmental
conflicts are increasing worldwide, as shown in Figure 1.1 (Environmental
justice, 2015), where is showed that environmental conflicts could be
present in different fields, such as water management, biodiversity
conservation, mineral ores extractions, industrial companies, tourism and
recreation, nuclear energy, etc. In this thesis, a method to analyse
environmental conflict, which is integrated with social impact assessment,
is proposed. In addition, in order to prevent possible environmental
conflicts, it is necessary to perform a social impact assessment during all the
stages of development of project under study (Prenzel & Vanclay, 2014).

Chapter I|7
Source: retrieved from environmental justice
Figure 1.1: Map of environmental conflicts.
1.2 Legal framework
The proposed method was applied to a project in Peru and then a project in
Spain. Therefore, Peruvian law and Spanish law, in relationship with SIA
and ECA, are presented below.
1.2.1 Peruvian law
In Peru, EIA is regulated by law Nº 27446 “Ley del Sistema Nacional de
Evaluación del Impacto Ambiental” (MINAM, 2011a). This law establishes in
article Nº 34 that the EIA must include SIA. In addition, it mentions that
must consider measures to ensure an adequate social management, and
prevention of environmental conflicts. As well as, prevention, control,

Introduction|8
mitigation and eventual compensation for social impacts that could be
generated.
1.2.2 Spanish law
A law in European Union on EIA is Directive Nº 2011/92/UE, which
establishes, in article 2 (incise 1), that the member states must adopt
measures to grant authorization for projects that could have significant
effects on environment. In addition, in article 3 (incise a), it indicates that
the EIA must identify, describe and asses the direct and indirect effects on
humans (Parlamento europeo, 2011).
In Spain, the law Nº 21/2013 “Ley de evaluación ambiental”, which
establishes, in Annexe VI (apart 2, incise e), that the selection of the best
alternative must be supported by a multi-criteria global analysis, which
considers economic, social and environmental aspects (Jefatura del estado,
2013).
In “Comunitat Valenciana” there is a law Nº 6/2014 “Ley de Prevención,
Calidad y Control Ambiental de la Comunidad Valenciana”, which establishes,
in article 2 (incise d), that the purposes of this law are contributing to do
effective the sustainable development through a system of environmental
administrative intervention, which harmonizes economic and social
development with environmental protection (Comunitat Valenciana, 2014).

Chapter I|9
1.3 Objectives of the thesis
The specific objectives of this thesis are to:
1. Propose an integrated method for SIA and ECA.
2. Apply the integrated method for SIA and ECA to the concrete
context of the exploitation plans of the poly-metallic mine in Peru.
3. Apply the integrated method for SIA and ECA to the concrete
context of the hydrocarbon exploration project in Valencia, Spain.
4. Explore if the method proposed exhibits potential for other contexts.
1.4 Organization of the thesis
This thesis is organized according to the following chapters:
CHAPTER I : The introduction of the thesis is described.
CHAPTER II : The state of the art of the main methodologies for
SIA and ECA are described.
CHAPTER III : The details of the proposed integrated method for
SIA and ECA are provided.
CHAPTER IV : The case study on a mining project in Peru is
described.
CHAPTER V : The case study on a hydrocarbon exploration
project in Spain is described.
CHAPTER VI : The general discussion and conclusions of the
thesis are provided.

Introduction|10
References
Arun, E. (2008). Towards a shared systems model of stakeholders in
environmental conflict. International Transactions in Operations
Research, 15, 239–253.
Bolin, B., Collins, T., & Darby, K. (2008). Fate of the verde: Water,
environmental conflict, and the politics of scale in Arizona’s central
highlands. Geoforum, 39(3), 1494–1511.
Chang, Z., Qisen, Z., Zheng, C., & Zhang, Q. (2009). The assessment of the
social, economic, and environmental impacts of expressway
construction projects based on the DFGF Algorithm. In Management
and Service Science. MASS ’09. International Conference (pp. 1–5).
Wuhan: IEEE.
Comunitat Valenciana. (2014). Boletín oficial del estado, 75–98. Retrieved
from http://www.eia.es/autonomica/.
Correia, D. (2007). The sustained yield forest management act and the roots
of environmental conflict in Northern New Mexico. Geoforum, 38(5),
1040–1051.
Dreyer, M., Renn, O., Cope, S., & Frewer, L. J. (2010). Including social
impact assessment in food safety governance. Food Control, 21(12),
1620–1628. http://doi.org/10.1016/j.foodcont.2009.05.007.
Dubé, M., et al.. (2013). A Framework for Assessing Cumulative Effects in
Watersheds: An Introduction to Canadian Case Studies. Integrated
Environmental Assessment and Management, 9(3).

Chapter I|11
Environmental justice. (2015). Environmental justice atlas. Retrieved
September 15, 2015, from http://ejatlas.org/.
Fontaine, G. (2010). The effects of energy co-governance in Peru. Energy
Policy, 38(5), 2234–2244.
Giménez A., S. (2010). Tesis Doctoral: Contribución al estudio de los
índices europeos de valoración del ruido ambiental en ambiente
urbano. Valencia; España: Universidad Politécnica de Valencia.
Hattam, C. E., Mangi, S. C., Gall, S. C., & Rodwell, L. D. (2014). Social
impacts of a temperate fisheries closure: Understanding
stakeholders’ views. Marine Policy, 45, 269–278.
http://doi.org/10.1016/j.marpol.2013.09.005.
Jedrzej, S., et al.. (2013). An auto-calibration procedure for empirical solar
radiation models. Environmental Modelling & Software, (49), 118–
128.
Jefatura del estado. (2013). Boletín oficial del estado, 88340–88344.
Retrieved from http://www.magrama.gob.es/es/calidad-y-
evaluacion-ambiental/temas/evaluacion-ambiental/legislacion/.
Karjalainen, T. P., & Järvikoski, T. (2010). Negotiating river ecosystems:
Impact assessment and conflict mediation in the cases of hydro-
power construction. Environmental Impact Assessment Review,
30(5), 319–327.

Introduction|12
Luyet, V., Schlaepfer, R., Parlange, M. B., & Buttler, A. (2012). A
framework to implement Stakeholder participation in environmental
projects. Journal of Environmental Management, 111, 213–219.
Madani, K., Rouhani, O., Mirchi, A., & Gholizadeh, S. (2014). A
negotiation support system for resolving an international trans-
boundary natural resource conflict. Environmental Modelling &
Software, 51, 240–249.
MINAM. (2011). Ley del sistema nacional de evaluacion de impacto
ambiental y su reglamento, 1 – 160. Retrieved from
http://www.minam.gob.pe/legislaciones/sistema-nacional-de-
evaluacion-de-impacto-ambiental/.
Parlamento europeo. (2011). 28.1.2012, 2011(7), 1–21. Retrieved from
http://www.magrama.gob.es/es/calidad-y-evaluacion-
ambiental/temas/evaluacion-ambiental/legislacion/.
Peche, R., & Rodríguez, E. (2011). Environmental impact assessment by
means of a procedure based on fuzzy logic: A practical application.
Environmental Impact Assessment Review, 31(2), 87–96.
http://doi.org/10.1016/j.eiar.2010.03.006.
Pope, J., et al.. (2013). Advancing the theory and practice of impact
assessment: Setting the research agenda. Environmental Impact
Assessment Review, (41), 1–9.
Prenzel, P. V, & Vanclay, F. (2014). How social impact assessment can
contribute to conflict management. Environmental Impact
Assessment Review, 45, 30–37.

Chapter I|13
Romero I., G. (2012). Introducción a la evaluación de impacto ambiental.
Valencia; España: Editorial Universitat Politècnica de València.
Saqalli, M., Thiriot, S., & Amblard, F. (2010). Investigating social conflicts
linked to water resources trhough agent-based modelling. NATO
Science for Peace and Security Series, 75, 142–157.
Tang, B., Wong, S., & Lau, M. C. (2008). Social impact assessment and
public participation in China: A case study of land requisition in
Guangzhou. Environmental Impact Assessment Review, 28(1), 57–
72. http://doi.org/10.1016/j.eiar.2007.03.004.
Van der Voort, N., & Vanclay, F. (2015). Social impacts of earthquakes
caused by gas extraction in the Province of Groningen, The
Netherlands. Environmental Impact Assessment Review, 50, 1–15.
http://doi.org/10.1016/j.eiar.2014.08.008.
Voyer, M., Gladstone, W., & Goodall, H. (2012). Methods of social
assessment in Marine Protected Area planning: Is public
participation enough? Marine Policy, 36(2), 432–439.
http://doi.org/10.1016/j.marpol.2011.08.002.
Warnaars, X. S. (2012). Why be poor when we can be rich? Constructing
responsible mining in El Pangui, Ecuador. Resources Policy, 37(2),
223–232.
Wittmer, H., Rauschmayer, F., & Klauer, B. (2006). How to select
instruments for the resolution of environmental conflicts? Land Use
Policy, 23(1), 1–9. http://doi.org/10.1016/j.landusepol.2004.09.003.

Introduction|14
Yang, J., Ryan, C., & Zhang, L. (2013). Social conflict in communities
impacted by tourism. Tourism Management, 35, 82–93.

CHAPTER II
STATE OF THE ART
Delphi

Chapter II|17
2. State of the art
2.1 Introduction
Social impact assessment is a topic very inconstant and with high level of
uncertainty (Corbetta, 2007), therefore it demands to be studied under
approaches which consider the qualitative characteristic of social issues,
and also include the uncertainty within their analysis. In addition, to assess
social impact on future projects is convenient to use approaches with low
cost, which consider the uncertainty in prospective studies (Landeta, 2002).
The main approaches to analyse the uncertainty are statistical, fuzzy logic,
and grey systems (S. Liu & Lin, 2010). As discussed in this thesis, the
statistical approaches are not considered, due to their high cost that they
could have during its application. Moreover, the FAHP method based on
fuzzy logic, and grey clustering method based on grey systems are
discussed as alternatives for SIA. In addition, the multi-criteria analysis
methods could be considered as an alternative for SIA (Wittmer et al., 2006);
therefore, the Delphi method and the AHP method, which are classical
multi-criteria methods, are also discussed as other alternatives for SIA.
In turn, environmental conflict analysis has two aspects, the ecological
complexity and the social complexity, which could be treated with multi-
criteria methods (Wittmer et al., 2006). But, environmental conflict analysis
has also a high level of uncertainty and demands a method that analyses
the divergence, as discussed in this thesis the entropy-weight method could
satisfy this demand.
Consequently, in this thesis, the Delphi method, the AHP method, the
FAHP method, and grey clustering method, are discussed as alternatives

State of the art|18
for SIA. In addition, the entropy-weight method is discussed and selected
for ECA.
2.2 The Delphi method
The name of Delphi is the translation from English of the word Delfos, which
was a Greek city that was known for its oracles of Apollo. The Delphi
method has a development since the mid-twentieth century. A decisive
work, on this method, was conducted by Abraham Kaplan in 1949 (Landeta,
2002). A study with the Delphi method consists in the selection of an expert
team, which is asked on future events. The estimates from experts are made
in successive anonymous rounds, the objective is to achieve consensus, but
with the maximum autonomy for the participants (Astigarraga, 2005).
2.2.1 Procedure for the Delphi method
Landeta proposed a schema for the Delphi method, in which, there is a
coordinator group (see Figure 2.1); this group directs all the process of
application of the Delphi method, as well as, it conducts the anonymous
rounds through the information obtained from expert team. A schema, for
the process of Delphi method, proposed by Landeta is shown in Figure 2.1
(Landeta, 2002):

Chapter II|19
Source: retrieved from Landeta (2012)
Figure 2.1: Global schema of Delphi process.
Another procedure for the Delphi method was provided by Astigarraga,
which is summarized by the following steps (Astigarraga, 2005):
Step 1: the problem is formulated according to type and context of
case under study.
Step 2: the experts are selected according to experience of every
professional.
Step 3: the questionnaire is made and the first round is performed
and obtained from experts.
Step 4: the second round is performed, giving to every expert, the
results of the first round. The rounds number depends of the results
of the mean and the standard deviation. The definitive results are
processed when the rounds are finished.
Establish objective of
study
Analysis and aggregation of
responses
Analysis y final aggregation
Questionnaire Coordinator group
Expert
Coordinator group
Coordinator group
Questionnaire
Responses
Responses
Expert

State of the art|20
An example of application of the Delphi method is the work of Ortega
Mohedano on a study of prospective of audio-visual sector in the Castilla y
León community, a brief summary is presented below (Ortega Mohedano &
Ortega, 2008).
Step 1: the problem, on a study of prospective of audio-visual sector in the
Castilla y León community, was formulated in 2008, with horizon until 2015.
Step 2: the expert number was 32, of which 13 were from communication
media, 14 were from university, and 5 were from other sectors, such as,
marketing and content producers.
Step 3: the questionnaire was formed by 38 items, which was sent to
experts. The responses from experts were processed with excel software,
which were sent to expert for second round.
Step 4: in the second round, after analysing the results of the mean and the
standard deviation, the study is finished. According to the consensus
between experts on the proposed questions, the results indicated that
audio-visual sector will be characterized by a greater concentration of
companies, specialization of content, professionalization of resources, and
increasing regional market share.
2.2.2 Summary of the Delphi method
The Delphi method was also applied to other contexts, as evidenced by
studies on the Delphi method applied to economy from natural recourses
in Spain (Soliño Millán, 2004), horticultural cooperatives (Campos-Climent,
Apetrei, & Chaves-Ávila, 2012), the best nutrition counselling practices for
the treatment of anorexia nervosa (Mittnacht & Bulik, 2014) or the lifelong
learning in nursing (Davis, Taylor, & Reyes, 2014).

Chapter II|21
The characteristics of the Delphi method, in relationship with SIA, could
summarize as following:
The Delphi method mainly is applied to make prospective studies,
using the opinion from expert team.
The data processing is performed by basic statistic, such as, mean
and standard deviation.
The Delphi method uses anonymous rounds, which avoids conflict
between experts.
The Delphi method does not consider the uncertainty in the
responses from the experts.
The application de anonymous rounds from the Delphi method could be
used as a complement within other methodologies for SIA. In addition, the
Delphi method should be complemented with other method, which
considers the level of uncertainly, due to the fact that SIA is a topic with
high level of uncertainly.
2.3 The AHP method
Analytic hierarchy process (AHP) is a method that was proposed by
Thomas L. Saaty in 1980 (T. L. Saaty, 1980), which is a basic approach for
decision making. The AHP method is designed to select the best alternative
in function to a criteria number, this process for decision making is
conducted by pairwise comparison judgments, which is used to develop
overall priorities to classify the alternatives (T. Saaty & Vargas, 2012). A
general schema of priories for the AHP method is shown in figure 2.2.

State of the art|22
Source: retrieved from Saaty and Vargas (2012)
Figure 2.2: General schema of the AHP method.
2.3.1 Procedure for the AHP method
The procedure of the AHP method could be summarized as follows
(Ahammeda & Azeem, 2013; Aznar & Guijarro, 2012; Delgado & Romero,
2015):
Step 1: the alternatives for the evaluation are defined as: A1, A2, A3,...,
Am.
Step 2: the criteria for the evaluation are defined as: C1, C2, C3,..., Cm.
Step 3: the comparison matrix and its consistency are performed.
To determine the weight of each criterion, a paired comparison matrix is
used. The comparison is performed according to the scale proposed by
Saaty, which is shown in Table 2.1 (Vargas, 2010).
Criteria
Goal
Alternative
s

Chapter II|23
Table 2.1: The Saaty scale for the relative importance.
Scale Numerical rating Reciprocal
Extremely recommended 9 1/9
Very strong to extremely 8 1/8
Very strongly preferred 7 1/7
Strongly to very strongly 6 1/6
Strongly preferred 5 1/5
Moderately to strongly 4 1/4
Moderately preferred 3 1/3
Equally to moderately 2 1/2
Equally preferred 1 1
Source: retrieved from Vargas (2012).
The results of the comparison between criteria C1, C2, C3,..., Cm, are
presented by the matrix shown in Equation 2.1.
𝐶1 →𝐶2 →⋮⋮
𝐶𝑛 → (
1 𝑝12⋯ 𝑝1𝑛
1
𝑝121 ⋯ 𝑝2𝑛
⋮1
𝑝1𝑛
⋮1
𝑝2𝑛
⋱⋯
⋮1 )
⏞
𝐶1↓
𝐶2↓
⋯⋯ 𝐶𝑛↓
= 𝑃𝑛×𝑛 (2.1)
Now, the matrix P is normalized in each column dividing each element by
the total sum of the respective column: 𝑆1×𝑛 = (𝑠1 𝑠2 𝑠3 ⋯ 𝑠𝑛). Then,
the weight of each criterion is calculated by the arithmetic mean (AM) of
the elements in each row of the normalized matrix. The matrix of weight of
the criteria is presented in Equation 2.2.
𝑊𝑛×1 = (𝑤1 𝑤2 𝑤2 ⋯ 𝑤𝑛)𝑡 (2.2)
To determine the consistency of the comparison matrix, first the consistency
index (CI) is computed using Equation 2.3.
𝐶𝐼 =λ𝑀𝑎𝑥−𝑛
𝑛−1 (2.3)
State of the art|24
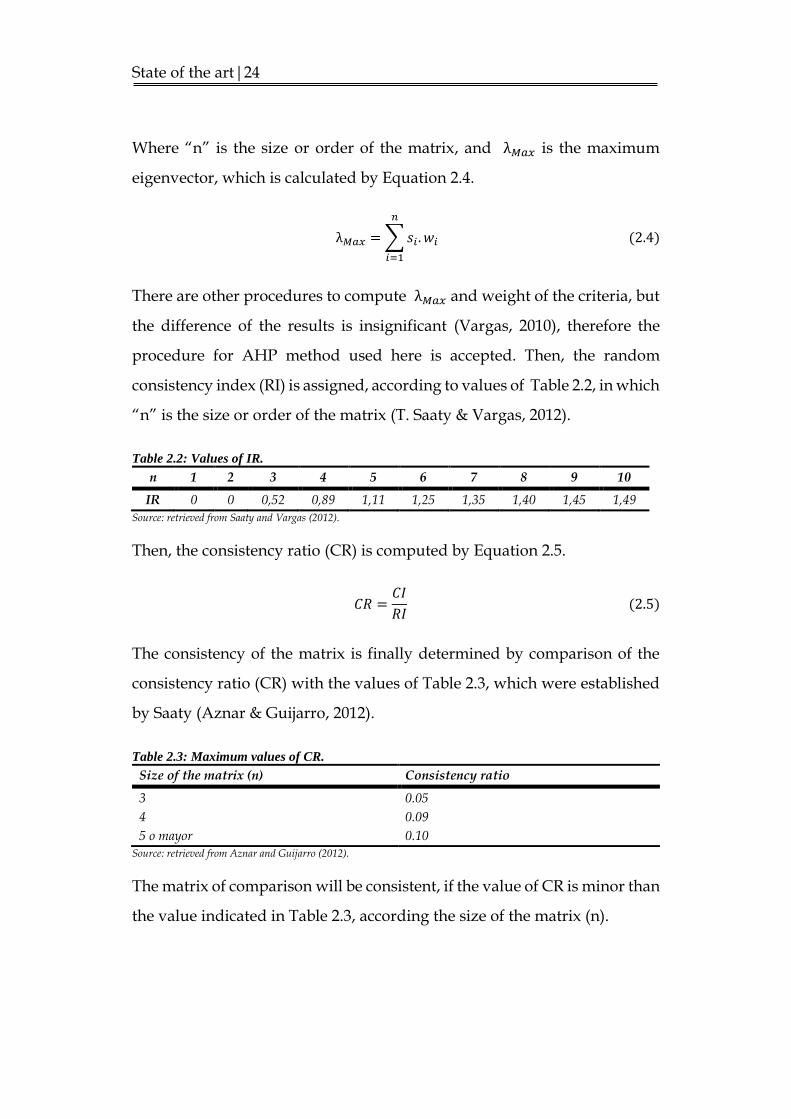
Where “n” is the size or order of the matrix, and λ𝑀𝑎𝑥 is the maximum
eigenvector, which is calculated by Equation 2.4.
λ𝑀𝑎𝑥 =∑𝑠𝑖.
𝑛
𝑖=1
𝑤𝑖 (2.4)
There are other procedures to compute λ𝑀𝑎𝑥 and weight of the criteria, but
the difference of the results is insignificant (Vargas, 2010), therefore the
procedure for AHP method used here is accepted. Then, the random
consistency index (RI) is assigned, according to values of Table 2.2, in which
“n” is the size or order of the matrix (T. Saaty & Vargas, 2012).
Table 2.2: Values of IR.
n 1 2 3 4 5 6 7 8 9 10
IR 0 0 0,52 0,89 1,11 1,25 1,35 1,40 1,45 1,49
Source: retrieved from Saaty and Vargas (2012).
Then, the consistency ratio (CR) is computed by Equation 2.5.
𝐶𝑅 =𝐶𝐼
𝑅𝐼 (2.5)
The consistency of the matrix is finally determined by comparison of the
consistency ratio (CR) with the values of Table 2.3, which were established
by Saaty (Aznar & Guijarro, 2012).
Table 2.3: Maximum values of CR.
Size of the matrix (n) Consistency ratio
3 0.05
4 0.09
5 o mayor 0.10
Source: retrieved from Aznar and Guijarro (2012).
The matrix of comparison will be consistent, if the value of CR is minor than
the value indicated in Table 2.3, according the size of the matrix (n).

Chapter II|25
Step 4: The ranking of the alternatives, for the final decision, is established.
The alternatives: A1, A2, A3,..., Am are evaluated according to each criterion:
C1, C2, C3,..., Cm. The results for each criterion are presented according to
matrix shown in Equation 2.6.
𝐴1 →𝐴2 →⋮⋮
𝐴𝑚 →(
1 𝑞12⋯ 𝑞1𝑚
1
𝑞121 ⋯ 𝑞2𝑚
⋮1
𝑞1𝑚
⋮1
𝑞2𝑚
⋱⋯
⋮1)
⏞
𝐴1↓
𝐴2↓
⋯⋯ 𝐴𝑚↓
= 𝑄𝑚×𝑚𝑛 (2.6)
After of checking the consistency of every comparison matrix, the weight of
the alternatives is determined for every criterion. The results are presented
according to Equation 2.7.
𝐶1 →𝐶2 →⋮
𝐶𝑛 →
(
𝑟11 𝑟12 ⋯ 𝑟1𝑚𝑟21 𝑟22 ⋯ 𝑟2𝑚⋮𝑟𝑛1
⋮𝑟𝑛2
⋱⋯
⋮𝑟𝑛𝑚
)
⏞
𝐴1↓
𝐴2↓
⋯⋯ 𝐴𝑚↓
= 𝑇𝑛×𝑚 (2.7)
The ranking of the alternatives is established according to the results of the
multiplication of the matrixes Wt and T. Finally, the results are presented in
Equation 2.8.
𝑅1×𝑚 = (𝑊𝑛×1)𝑡. 𝑇𝑛×𝑚 (2.8)
An example of application of the AHP method is the study conducted by
Vargas in 2010, on an organization called ACME, which aims to select a
project to ACME (Vargas, 2010). In this study six alternatives and twelve
criteria were defined, which are grouped in four categories. A summary on
this study is presented below:

State of the art|26
Step 1: the alternatives, in this study, were defined as following:
A1: Moving to new office.
A2: New ERP computer system.
A3: New office in China.
A4: New product to international commerce.
A5: IT Infrastructure to outsourcing.
A6: New local campaign of marketing.
Step 2: twelve criteria, in this study, were defined. The tree diagram is
presented in Figure 2.3:

Chapter II|27
Source: retrieved from Vargas (2010)
Figure 2.3: Hierarchy of criteria to select a project in ACME.
Reduce risks for the organization
Urgency
House expertise
Other criteria
Compete in international markets
Improve internal processes
Improve reputation
Strategic
Return of investment
Benefit
Net present value
Financial
Commitment of the project team
Commitment of the organization
Commitment of the project manager
Commitment of the stakeholder
Goal: Selection of a project to ACME

State of the art|28
Step 3: The weights of the criteria of first level are computed.
First, the paired matrix obtained from experts is normalized. The results are
presented in Table 2.4.
Table 2.4: Criteria of first level normalized.
Commitment of the stakeholder
Financial Strategic Other criteria
Commitment of the stakeholder
1 1/5 1/9 1
Financial 5 1 1 5 Strategic 9 1 1 5 Other criteria 1 1/5 1/5 1 Total (Sum) 16,00 2,40 2,31 12,00
Results: Commitment of the stakeholder
1/16=0,063 0,083 0,048 0,083
Financial 5/16=0,313 0,417 0,433 0,417 Strategic 9/16=0,563 0,417 0,433 0,417 Other criteria 1/16=0,063 0,083 0,087 0,083
Source: retrieved from Vargas (2010).
Second, the weights of the criteria of first level are determined by the
eigenvector. The results are shown in Table 2.5.
Table 2.5: Calculation of eigenvector.
Eigenvector (calculation) Eigenvector
Commitment of the stakeholder
[0.063+0,083+0,048+0,083]/4=0,0693 0.0693 (6.93%)
Financial [0,313+0,417+0,433+0,417]/4=0,3946 0.3946 (39.46%) Strategic [0,563+0,417+0,433+0,417]/4=0,4571 0.4571 (45.71%) Other criteria [0,063+0,083+0,087+0,083]/4=0,0789 0.0789 (7.89%)
Source: retrieved from Vargas (2010).
Now, the consistency test is performed. First, λ𝑀𝑎𝑥 is calculated, the details
of the calculations are presented in Table 2.6.

Chapter II|29
Table 2.6: Calculation of maximum eigenvector.
Commitment of the stakeholder
Financial Strategic Other criteria
Eigenvector 0.0693 0.3946 0.4571 0.0789 Total (Sum) 16.00 2.40 2.31 12.00 Maximum eigenvalue (λMax)
[(0,0693x16,00)+(0,3946x2,40)+(0,4571x2,31)+(0,0789x12,00)]=4,06
Source: retrieved from Vargas (2010).
Then, the consistency index (CI) is calculated by Equation 2.3:
𝐶𝐼 =λ𝑀𝑎𝑥 − 𝑛
𝑛 − 1=4.06 − 4
4 − 1= 0.02
The random consistency index (RI) is obtained from Table 2.2, for n=4, we
have IR=0.89. Then, the consistency ratio (CR) is calculated by Equation 2.5:
𝐶𝑅 =0.02
0.89= 0.0225 = 2.25%
The value of CR obtained is compared with the maximum value of
consistency ratio of table 2.3, which, for n=4, has a value of 0.09. It is
observed that the value obtained 0.0225 is minor than 0.09. Therefore, it is
concluded that the matrix of comparison is consistent, and the weights of
the criteria of first level are valid.
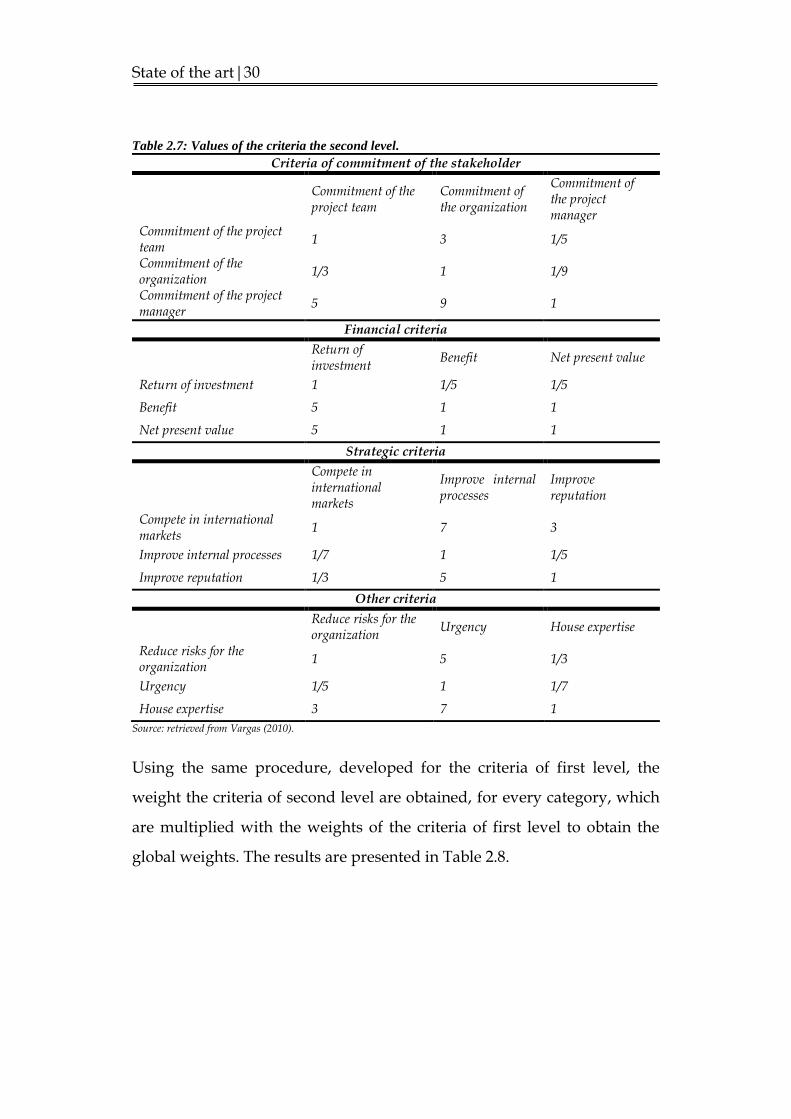
In turn, the weights of the criteria of second level are calculated. The values
obtained from experts are presented in Table 2.7.
State of the art|30
Table 2.7: Values of the criteria the second level.
Criteria of commitment of the stakeholder
Commitment of the project team
Commitment of the organization
Commitment of the project manager
Commitment of the project team
1 3 1/5
Commitment of the organization
1/3 1 1/9
Commitment of the project manager
5 9 1
Financial criteria
Return of investment
Benefit Net present value
Return of investment 1 1/5 1/5
Benefit 5 1 1
Net present value 5 1 1
Strategic criteria
Compete in international markets
Improve internal processes
Improve reputation
Compete in international markets
1 7 3
Improve internal processes 1/7 1 1/5
Improve reputation 1/3 5 1
Other criteria
Reduce risks for the organization
Urgency House expertise
Reduce risks for the organization
1 5 1/3
Urgency 1/5 1 1/7
House expertise 3 7 1
Source: retrieved from Vargas (2010).
Using the same procedure, developed for the criteria of first level, the
weight the criteria of second level are obtained, for every category, which
are multiplied with the weights of the criteria of first level to obtain the
global weights. The results are presented in Table 2.8.

Chapter II|31
Table 2.8: Global weight of the criteria.
Weight of criteria of first level
Weight of criteria of second level
Global weight of criteria
Commitment of the project team 0,0693 0,1782 0,012
Commitment of the organization 0,0693 0,0704 0,005
Commitment of the project manager 0,0693 0,7514 0,052
Return of investment 0,3946 0,0909 0,036
Benefit 0,3946 0,4545 0,179
Net present value 0,3946 0,4545 0,179
Compete in international markets 0,4571 0,6491 0,297
Improve internal processes 0,4571 0,0719 0,033
Improve reputation 0,4571 0,2790 0,128
Reduce risks for the organization 0,0789 0,2790 0,022
Urgency 0,0789 0,0719 0,006
House expertise 0,0789 0,6491 0,051
Source: retrieved from Vargas (2010).
Step 4: The ranking of the alternatives, for the final decision, is established.
The six alternatives were evaluated according to each criterion. The results
obtained from experts were processed. For example, the results for first
criteria are presented in Table 2.9.
Table 2.9: Evaluation of the alternatives for the first criterion.
Criterion: commitment of the project team
A1 A2 A3 A4 A5 A6
A1 1 5 3 1/3 9 7 A2 1/5 1 1/5 1/7 1 1/3 A3 1/3 5 1 1/3 7 3 A4 3 7 3 1 5 5 A5 1/9 1 1/7 1/5 1 1/3 A6 1/7 3 1/3 1/5 3 1
Source: retrieved from Vargas (2010).
Now, the weights of the alternatives for the first criterion were determined.
With same procedure the weights of the alternatives were obtained for
other criteria. All the results are presented in Table 2.10.

State of the art|32
Table 2.10: Weight of the alternatives for every criterion.
A1 A2 A3 A4 A5 A6
Commitment of the project team
0.2968 0.0378 0.0721 0.3961 0.1613 0.0358
Commitment of the organization
0.0993 0.0326 0.0608 0.2884 0.4875 0.0315
Commitment of the project manager
0.1586 0.0402 0.0733 0.3546 0.3444 0.0288
Return of investment 0.0296 0.0415 0.1014 0.4564 0.3066 0.0645
Benefit 0.0315 0.0307 0.1092 0.4685 0.2917 0.0685
Net present value 0.0366 0.0611 0.1178 0.4743 0.2449 0.0653
Compete in international markets
0.1033 0.0371 0.0241 0.3767 0.4076 0.0512
Improve internal processes
0.1903 0.3975 0.0512 0.0363 0.0455 0.2792
Improve reputation 0.0421 0.0680 0.3389 0.1736 0.3520 0.0254
Reduce risks for the organization
0.2994 0.1168 0.4230 0.0890 0.0279 0.0439
Urgency 0.0553 0.0924 0.0528 0.4774 0.2879 0.0342
House expertise 0.4796 0.0242 0.3313 0.0366 0.0605 0.0678
Source: retrieved from Vargas (2010).
Then, the weight of each alternative is multiplied with the global weight of
each criterion. For example, for the first alternative (A1), the calculation is
presented in Table 2.11.

Chapter II|33
Table 2.11: Final weight of the alternative A1.
Weight of the alternative A1
Global weight of the criteria
Results of the multiplication
Commitment of the project team 0.2968 0.012 0.004
Commitment of the organization 0.0993 0.005 0.000
Commitment of the project manager
0.1586 0.052 0.008
Return of investment 0.0296 0.036 0.001
Benefit 0.0315 0.179 0.006
Net present value 0.0366 0.179 0.007
Compete in international markets 0.1033 0.297 0.031
Improve internal processes 0.1903 0.033 0.006
Improve reputation 0.0421 0.128 0.005
Reduce risks for the organization 0.2994 0.022 0.007
Urgency 0.0553 0.006 0.000
House expertise 0.4796 0.051 0.024
Final weight of the alternative A1 0.099
Source: retrieved from Vargas (2010).
The same procedure was performed with all the alternatives. All the results
are presented in Figure 2.4.
Source: retrieved from Vargas (2010)
Figure 2.4: Results of the hierarchy of the alternatives.
In conclusion, from figure 2.4, the alternative A4, New product to
international commerce, will be the project selected by the AIME
organization, due to the fact that this alternative presents the major score.
0.099
0.060
0.307
0.344
0.059
0.131
A1: Moving to new office.
A2: New ERP computer system.
A3: New office in China.
A4: New product to international commerce.
A5: IT Infrastructure to outsourcing.
A6: New local campaign of marketing.

State of the art|34
2.3.2 Summary of the AHP method
The AHP method has also been applied to other fields and other contexts.
Such as, the studies on optimal allocation of energy subsidy (Sadeghi &
Ameli, 2012), selection of priorities for recycling (Kim, Jang, & Lee, 2013), or
emergency treatment and disposal in accidents (Shenggang, Jingcan, Li,
Wenyan, & Liqiu, 2014).
A summary of the AHP method, in relationship with SIA, is presented below:
An advantage of the AHP method is that it is able to attribute
weights to the evaluation criteria.
The procedure of the AHP method is relatively easy. This fact makes
that this method can be applied on different field.
A disadvantage of the AHP method is that it does not consider the
uncertainly within its analysis.
Considering that the SIA is a social topic, which has a high level of
uncertainly, the AHP method should be supplemented with other
approach, which considers the uncertainly.
2.4 The FAHP method
Fuzzy analytic hierarchy process (FAHP) is a method, which adds the
theory of fuzzy logic to the classical AHP. The FAHP method is an
approach, which considers the uncertainty within its analysis.
Fuzzy logic was proposed by Professor Lotfi A. Zadeh, who published his
work on “Fuzzy sets” in 1965, which proposes a type of logic based on an
infinite number of responses for a proposition (Zadeh, 1965). This fact, is a
great difference with respect to the classical Aristotelian logic, which

Chapter II|35
proposes only two possibilities for the responses of a proposition, true or
false (Hernández Rojas, 1997). The fuzzy logic involves a new type of
number, which is called fuzzy triangular number defined as (𝑙,𝑚, 𝑛), and
represented in Figure 2.5 (Guarino, Gabriel, & Ribas, 2012):
Source: retrieved from Guarino, Gabriel, and Ribas (2012)
Figure 2.5: Fuzzy triangular number.
The membership function 𝜇𝐴(𝑥) is defined as:
𝜇𝐴(𝑥) =
{
(𝑥 − 1)
(𝑚 − 1), 𝑠𝑒 𝑥 ∈ [1 ,𝑚]
(𝑥 − 𝑢)
(𝑚 − 𝑢) , 𝑠𝑒 𝑥 ∈ [𝑚 , 𝑢]
0 , 𝑖𝑛 𝑎𝑛𝑜𝑡ℎ𝑒𝑟 𝑐𝑎𝑠𝑒
(2.9)
𝑊ℎ𝑒𝑟𝑒:
𝑙 = 𝐿𝑜𝑤𝑒𝑟 𝑙𝑖𝑚𝑖𝑡
𝑚 = 𝑀𝑜𝑑𝑎𝑙 𝑣𝑎𝑙𝑢𝑒 (𝑚𝑒𝑚𝑏𝑒𝑟𝑠ℎ𝑖𝑝 𝑣𝑎𝑙𝑢𝑒 = 1)
𝑛 = 𝑈𝑝𝑝𝑒𝑟 𝑙𝑖𝑚𝑖𝑡
l m n x 0
1
µ(x)

State of the art|36
The operation rules of the fuzzy triangular numbers are defined as follows:
1. (𝑙1,𝑚1, 𝑢1) ⊕ (𝑙2,𝑚2, 𝑢2) = (𝑙1 + 𝑙2,𝑚1 +𝑚2, 𝑢1 + 𝑢2) 2. (𝑙1,𝑚1, 𝑢1) ⊙ (𝑙2,𝑚2, 𝑢2) = (𝑙1𝑙2,𝑚1𝑚2, 𝑢1𝑢2) 3. (𝜆, 𝜆, 𝜆) ⊙ (𝑙1, 𝑚1, 𝑢1) = (𝜆𝑙1, 𝜆𝑚1, 𝜆𝑢1) , 𝜆 > 0, 𝜆 ∈ 𝑅 4. (𝑙1,𝑚1, 𝑢1)
−1 = (1/𝑢1, 1/𝑚1, 1/𝑙1)
2.4.1 Procedure for the FAHP method
The main steps of the FAHP method are descripted as follows (Guarino et
al., 2012; Rodríguez, 2009):
Step 1: The alternatives and the criteria for evaluation are defined.
Step 2: The weights of the criteria are determined by a paired comparison.
This comparison is performed using the fuzzy values, which are shown in
Table 2.12.
Table 2.12: Numerical rating for FAHP.
Numerical rating Reciprocal
AHP FAHP AHP FAHP
1 (1, 1, 1) 1/1 (1, 1, 1)
2 (1, 2, 3) 1/2 (1/3, 1/2, 1)
3 (2, 3, 4) 1/3 (1/4, 1/3,1/2)
4 (3, 4, 5) 1/4 (1/5, 1/4, 1/3)
5 (4, 5, 6) 1/5 (1/6, 1/5, 1/4)
6 (5, 6, 7) 1/6 (1/7, 1/6, 1/5)
7 (6, 7, 8) 1/7 (1/8, 1/7, 1/6)
8 (7, 8, 9) 1/8 (1/9, 1/8, 1/7)
9 (8, 9, 9) 1/9 (1/9, 1/9, 1/8)
Source: retrieved from Rodriguez (2009)
The membership functions of the numerical rating for FAHP are
represented by Figure 2.6.

Chapter II|37
Source: retrieved from Rodriguez (2009)
Figure 2.6: Membership functions for numerical rating of FAHP.
Now, the values of the criteria obtained from the experts are aggregated
using geometric mean (GM) or arithmetic mean (AM), and then the value
of fuzzy synthetic extent (Si) is calculated using Equation 2.10.
𝑆𝑖 = (𝑙𝑟𝑜𝑤 𝑖, 𝑚𝑟𝑜𝑤 𝑖, 𝑢𝑟𝑜𝑤 𝑖) ⊙ (1/𝑢∑𝑐𝑜𝑙𝑢𝑚𝑛, 1/𝑚∑𝑐𝑜𝑙𝑢𝑚𝑛, 1/𝑙∑𝑐𝑜𝑙𝑢𝑚𝑛) (2.10)
Then, the grade of possibility of 𝑆2 ≥ 𝑆1 is represented as 𝑉(𝑆2 ≥ 𝑆1) and
defined as:
If 𝑆1 = (𝑙1,𝑚1, 𝑢1) and 𝑆2 = (𝑙2,𝑚2, 𝑢2) are convex fuzzy numbers:
𝑉(𝑆2 ≥ 𝑆1) = ℎ𝑔𝑡(𝑆1 ∩ 𝑆2) = 𝜇𝑆2(𝑑) = 𝑓(𝑥)
=
{
1, 𝑆𝑖 𝑚2 ≥ 𝑚10, 𝑆𝑖 𝑙1 ≥ 𝑢2 𝑙1 − 𝑢2
(𝑚2 − 𝑢2) − (𝑚1 − 𝑙1), 𝑖𝑛 𝑜𝑡ℎ𝑒𝑟 𝑐𝑎𝑠𝑒
(2.11)
Then, choosing the minor value of 𝑉(𝑆𝑖 ≥ 𝑆𝑘) for each 𝑆𝑖 , the vector of
priorities is obtained, which is normalized, in order to determine the weight
of the criteria.
Step 3: The alternatives are evaluated with respect to each criteria. This
procedure is performed in same way that step 2.
1 2 3 4 5 6 7 8 9 0
1
µ(x)
State of the art|38
Step 4: Finally, the ranking of the alternatives is established, which is
obtained by the scalar multiplication of the weight of the criteria with the
weight of the alternatives.
An example of application of the FAHP method is the study conducted by
Guarino, Grabiel and Ribas, on a risk analysis of a hydroelectric power
station in stage of construction (Guarino et al., 2012). A summarize of this
study is presented below.
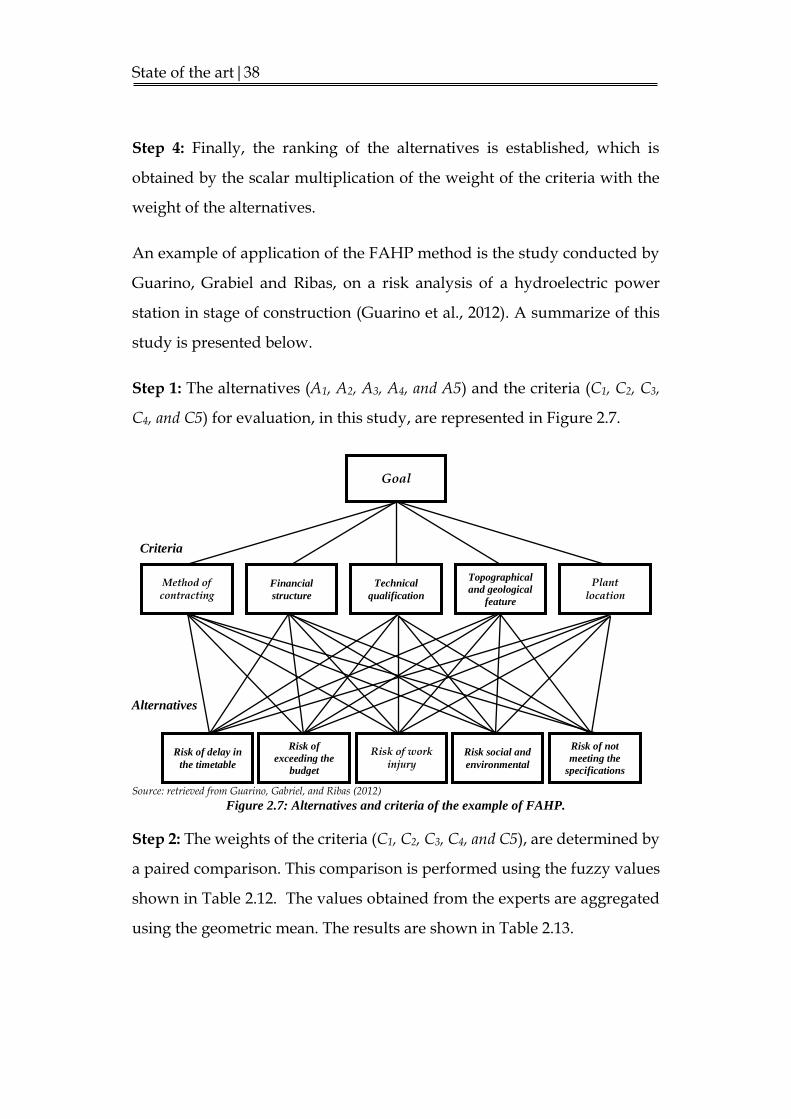
Step 1: The alternatives (A1, A2, A3, A4, and A5) and the criteria (C1, C2, C3,
C4, and C5) for evaluation, in this study, are represented in Figure 2.7.
Source: retrieved from Guarino, Gabriel, and Ribas (2012)
Figure 2.7: Alternatives and criteria of the example of FAHP.
Step 2: The weights of the criteria (C1, C2, C3, C4, and C5), are determined by
a paired comparison. This comparison is performed using the fuzzy values
shown in Table 2.12. The values obtained from the experts are aggregated
using the geometric mean. The results are shown in Table 2.13.
Risk of delay in
the timetable
Risk of
exceeding the
budget
Risk of work injury
Risk social and
environmental
Risk of not
meeting the
specifications
Goal
Method of contracting
Financial
structure
Technical
qualification
Topographical
and geological
feature
Plant location
Criteria
Alternatives

Chapter II|39
Table 2.13: Aggregated values from the experts.
C1 C2 C3 C4 C5
C1 (1,1,1) (4.18,4.72,5.25) (0.22, 0.25, 0.29) (0.16, 0.18, 0.2) (3.04, 3.56, 4.07)
C2 (0.19,0.21,0.24) (1,1,1) (0.21, 0.24, 0.27) (0.16, 0.18, 0.2) (1.04, 1.71, 2.31)
C3 (3.44, 3.98, 4.51) (3.7, 4.22, 4.73) (1,1,1) (0.34, 048, 0.62) (5.17, 5.74, 6.18)
C4 (5.09, 5.59, 6.1) (5.09, 5.59, 6.1) (1.46, 2.08, 2.64) (1,1,1) (2.16, 2.33, 2.47)
C5 (0.25, 0.28, 0.33) (0.36, 0.58, 0.79) (0.16, 0.17, 0.19) (0.41, 0.43, 0.46) (1,1,1)
Source: retrieved from Guarino, Gabriel, and Ribas (2012)
Now, the total sum of the rows and columns are presented in Table 2.14.
Table 2.14: Total sum of rows and columns of the example.
Sum of rows Sum of columns
C1 (8.60835, 9.704684, 10.80256) (9.9608, 11.0656, 12.17928)
C2 (2.605937, 3.337851, 4.018992) (14.3247, 16.1131, 17.8695)
C3 (13.65049, 15.41576, 17.04645) (3.05670, 3.74277, 4.3933)
C4 (14.79327, 16.59394, 18.30305) (2.07761, 2.26805, 2.4779)
C5 (2.169801, 2.469944, 2.779249) (12.4079, 14.3326, 16.030)
Sum of sum of the columns (41.82785, 47.52218, 52.9503)
Source: retrieved from Guarino, Gabriel, and Ribas (2012)
The values of fuzzy synthetic extent (Si) are calculated using Equation 2.10.
The results are shown below:
S1= (0.16257, 0.20421, 0.258262) S2= (0.049214, 0.07023, 0.0960841)
S3= (0.257798, 0.32439, 0.407538) S4= (0.27938021, 0.34918, 0.437580)
S5= (0.0409780, 0.05197455, 0.066444)

State of the art|40
Then, the comparison between the values of fuzzy synthetic extent (Si) is
performed by Equation 2.11. The results are presented below:
V (S1≥ S2) = 1 V (S1≥ S3) = 0.003847 V (S1≥ S4) = 0 V (S1≥ S5) = 1
V (S2≥ S1) = 0 V (S2≥ S3) = 0 V (S2≥ S4) = 0 V (S2≥ S5) = 1
V (S3≥ S1) = 1 V (S3≥ S2) = 1 V (S3≥ S4) = 0.837907 V (S3≥ S5) = 1
V (S4≥ S1) = 1 V (S4≥ S2) = 1 V (S4≥ S3) = 1 V (S4≥ S5) = 1
V (S5≥ S1) = 0 V (S5≥ S2) = 0.485448 V (S5≥ S3) = 0 V (S5≥ S4) = 0
Finally, choosing the minor value of 𝑉(𝑆𝑖 ≥ 𝑆𝑘) for each 𝑆𝑖, the vector of
priorities is obtained:
W’c = (0, 0, 0.837907, 1, 0)
The vector of priorities is normalized, in order to determine the weight of
each criterion:
Wc = (0, 0, 0.455903, 0.544097, 0)
Step 3: The alternatives are evaluated with respect to each criteria. The
results of the aggregated evaluations, from the experts, are presented in
Table 2.15.

Chapter II|41
Table 2.15: Aggregated results from experts in the example of FAHP.
C1 A1 A2 A3 A4 A5
A1 (1,1,1) (0.34, 0.48, 0.62) (7.11, 7.61, 7.97) (5.17, 5.74, 6.18) (2.2, 3, 3.62)
A2 (1.46, 2.08, 2.64) (1,1,1) (5.17, 5.74, 6.18) (3.76, 4.33, 4.8) (1.07, 1.44, 1.75)
A3 (0.13, 0.13, 0.14) (0.16, 0.17, 0.19) (1,1,1) (0.62, 0.69, 0.79) (0.22, 0.25, 0.29)
A4 (0.16, 0.17, 0.19) (0.21, 0.23, 0.27) (1.27, 1.44, 1.62) (1,1,1) (0.46, 0.52, 0.6)
A5 (0.25, 0.33, 0.41) (0.52, 0.69, 0.85) (3.44, 3.98, 4.51) (1.67, 1.91, 2.19) (1,1,1)
C2 A1 A2 A3 A4 A5
A1 (1,1,1) (0.85, 1.44, 1.99) (6.29, 6.8, 7.19) (6.29, 6.8, 7.19) (6.29, 6.8, 7.19)
A2 (0.41, 0.69, 0.97) (1,1,1) (3.02, 3.98, 4.66) (3.02, 3.98, 4.66) (2.67, 3.56, 4.2)
A3 (0.14, 0.15, 0.16) (0.19, 0.25, 0.3) (1,1,1) (0.5, 1, 1.5) (0.41, 0.69, 0.97)
A4 (0.14, 0.15, 0.16) (0.19, 0.25, 0.3) (0.5, 1, 1.5) (1,1,1) (0.36, 0.58, 0.79)
A5 (0.14, 0.15, 0.16) (0.22, 0.28, 0.34) (0.85, 1.44, 1.99) (1.04, 1.71, 2.31) (1,1,1)
C3 A1 A2 A3 A4 A5
A1 (1,1,1) (2.01, 2.76, 3.4) (1.78, 2.47, 3.07) (2.2, 3, 3.62) (0.43, 0.48, 0.54)
A2 (0.27, 0.36, 0.45) (1,1,1) (0.71, 1, 1.28) (0.85, 1.44, 1.99) (0.21, 0.23, 0.27)
A3 (0.3, 0.41, 0.51) (0.71, 1, 1.28) (1,1,1) (1.18, 1.91, 2.56) (0.18, 0.19, 0.22)
A4 (0.25, 0.33, 0.41) (0.54, 0.69, 0.97) (0.32, 0.52, 0.7) (1,1,1) (0.15, 0.16, 0.18)
A5 (1.46, 2.08, 2.64) (3.76, 4.33, 4.8) (4.57, 5.13, 5.57) (5.56, 6.08, 6.48) (1,1,1)
C4 A1 A2 A3 A4 A5
A1 (1,1,1) (0.41, 0.69, 0.97) (4.18, 4.72, 5.25) (4.18, 4.72, 5.25) (2.67, 3.56, 4.2)
A2 (0.85, 1.44, 1.99) (1,1,1) (2.76, 3.66, 4.39) (4.73, 5.28, 5.82) (4.57, 5.13, 5.57)
A3 (0.19, 0.21, 0.24) (0.21, 0.27, 0.33) (1,1,1) (1.48, 1.71, 1.97) (1.43, 1.61, 1.8)
A4 (0.19, 0.21, 0.24) (0.17, 0.19, 0.21) (0.51, 0.58, 0.68) (1,1,1) (0.84, 1.12, 1.36)
A5 (0.22, 0.28, 0.34) (0.18, 0.19, 0.22) (0.56, 0.62, 0.7) (0.67, 0.89, 1.08) (1,1,1)
C5 A1 A2 A3 A4 A5
A1 (1,1,1) (0.41,0.69,0.97) (1.46, 2.08, 2.64) (0.62, 0.69, 0.79) (1.04, 1.22, 1.4)
A2 (0.85, 1.44, 1.99) (1,1,1) (3.7, 4.22, 4.73) (0.81, 0.92, 1.06) (1.27, 1.44, 1.62)
A3 (0.34, 0.48, 0.62) (0.21, 0.24, 0.27) (1,1,1) (0.36, 0.58, 0.79) (0.61, 0.84, 1.05)
A4 (1.27, 1.44, 1.62) (0.94, 1.09, 1.24) (1.04, 1.71, 2.31) (1,1,1) (1.21, 1.44, 1.7)
A5 (0.72, 0.82, 0.96) (0.62, 0.69, 0.79) (0.86, 1.19, 1.49) (0.59, 0.69, 0.82) (1,1,1)
Source: retrieved from Guarino, Gabriel, and Ribas (2012)

State of the art|42
Then, the weights of the alternatives are determined. This procedure is
performed in same way that step 2. The results are shown in Table 2.16.
Table 2.16: Weight of the alternatives in the example of FAHP.
A1 A2 A3 A4 A5
C1 63.6 36.4 0 0 0
C2 67.7 32.3 0 0 0
C3 1.1 0 0 0 98.9
C4 44.4 55.6 0 0 0
C5 17.7 52.7 0 29.6 0
Source: retrieved from Guarino, Gabriel, and Ribas (2012)
Step 4: The ranking of the alternatives is established by the scalar
multiplication of the weight of the criteria with the weight of the
alternatives, as is shown in Table 2.17:
Table 2.17: Hierarchy of the alternatives of the example of FAHP.
C1 C2 C3 C4 C5 A1 A2 A3 A4 A5
0 0 0.46 0.54 0 63.6 36.4 0 0 0 C1
67.7 32.3 0 0 0 C2
1.1 0 0 0 98.9 C3
44.4 55.6 0 0 0 C4
17.7 52.7 0 29.6 0 C5
Hierarchy of the alternatives 24.7 30.2 0 0 45.1
Source: retrieved from Guarino, Gabriel, and Ribas (2012)
The final results are presented in Figure 2.8.

Chapter II|43
Source: retrieved from Guarino, Gabriel, and Ribas (2012)
Figure 2.8: Final result of the example of FAHP.
In this example, the final conclusion is that the alternative A5 (Risk of not
meeting the specifications) has the major score. Therefore the major risk that
could have the project is the risk of not meeting the specifications.
2.4.2 Summary of the FAHP method
The FAHP method has also been applied to other contexts, as evidenced by
studies on the selection of academic staff (Rouyendegh & Erkan, 2012), the
decision for selection of lead-free equipment (Y. C. Tang & Lin, 2011), the
selection of the multimedia applications for learning (Volaric,
Tomislav;Brajkovic, 2013) or the evaluation of the software quality (X. Liu
& Pang, 2010).
The main characteristics of the FAHP method could be summarized as
following:
Similarly as AHP, The FAHP method is able to attribute weights
to the evaluation criteria.
An advantage of the FAHP method is that it considers the
uncertainty within its analysis. This is due to the fact that the
FAHP method uses the fuzzy logic within of its procedure.
24.7
30.2
0.0
0.0
45.1
A1: Risk of delay in the timetable
A2: Risk of exceeding the budget
A3: Risk of work injury
A4: Risk social and environmental
A5: Risk of not meeting the specifications

State of the art|44
The FAHP method is an approach based on fuzzy logic, which is
characterized for the application to problems with clear intention
and unclear extension. “For example, the instance, “young man” is a
fuzzy concept, because everybody understands the idea of “young man”.
However, if you are going to determine the exact range within which
everybody is young and outside which everybody is not young, then you
will find yourself in difficulty. This is because the concept of young man
does not have a clear extension” (S. Liu & Lin, 2010).
A methodology for SIA, which considers the uncertainty within its analysis,
should include the analysis of problems with clear extension, due to the fact
that the affected population, who are interviewed in order to conduct a SIA,
know or perceive the minimum and maximum value of a social variable
under analysis.
2.5 The grey clustering method
The grey clustering method is an approach, which is based on grey systems
theory. The grey systems theory was established by Julong Deng (Deng,
1985), which is applied to research problems with limited information and
small samples (S. Liu & Lin, 2010). This fact makes that the grey systems
theory can be applied to different fields, such as water management (L. N.
Zhang, Wu, & Jia, 2013), safety management (Li, Chen, & Xiang, 2015),
transport management (Leng et al., 2012), or evaluation of web sites (Bindu,
Padmaja, & Chandulal, 2010).
The grey clustering method can be applied using grey incidence matrices or
grey whitenization weight functions. The grey clustering method is used to
classify observation objects into definable classes, called grey classes. In this
thesis, the grey clustering method, based on center-point triangular

Chapter II|45
whitenization weight functions (CTWF), is used; as stakeholder groups can
be treated as observation objects for SIA. In addition, since respondents
tend to be more certain about the center-point of a grey class compared with
other points within the grey class, conclusions based on such cognitive
certainty are more scientific and reliable (S. Liu & Lin, 2010).
2.5.1 Procedure for the grey clustering method
The procedure for the grey clustering method, based on center-point
triangular whitenization weight functions (CTWF) is developed below (S.
Liu & Lin, 2010; Y. Zhang, Ni, Liu, & Jian, 2014):
First, assume a set of m objects, a set of n criteria and a set of s different grey
classes, according to the sample value xij (i=1, 2 ,…, m; j=1, 2, …, n) of the
ith (i=1, 2, …, m) object, for the criterion j (j=1, 2, …, n). Then, the steps for
the grey clustering method based on CTWF can be developed as follows:
Step 1: The range of each criterion is divided into s grey classes, and then
center-points λ1, λ2,…, λs of grey classes 1, 2, …, s are determined.
Step 2: The grey obtained classes are expanded in two directions, adding
the grey classes 0 and (s+1) with their center-points λ0 and λs+1 respectively.
Therefore, the new sequence of center-points is established as λ0, λ1, λ2,…,
λs, λs+1 (see Figure 2.9). The CTWF for the kth grey class, k=1, 2,…, s, of the
jth criterion, j=1, 2,…, n, for an observed value 𝑥𝑖𝑗 is defined by Equation
2.12.
𝑓𝑗𝑘(𝑥𝑖𝑗) =
{
0 , 𝑥 ∉ [𝜆𝑘−1, 𝜆𝑘+1]
𝑥 − 𝜆𝑘−1𝜆𝑘 − 𝜆𝑘−1
, 𝑥 ∈ [𝜆𝑘−1 , 𝜆𝑘]
𝜆𝑘+1 − 𝑥
𝜆𝑘+1 − 𝜆𝑘, 𝑥 ∈ [𝜆𝑘 , 𝜆𝑘+1]
(2.12)

State of the art|46
Source: retrieved from Liu and Lin (2010).
Figure 2.9: Center-point triangular whitenization weight functions (CTWF).
Step 3: The comprehensive clustering coefficient 𝜎𝑖𝑘, for object i, i=1, 2,…,
m, with respect to the grey class k, k=1,…, s is calculated by Equation 2.13.
𝜎𝑖𝑘 =∑𝑓𝑗
𝑘(𝑥𝑖𝑗). 𝜂𝑗 (2.13)
𝑛
𝑗=1
where 𝑓𝑗𝑘(𝑥𝑖𝑗) is the CTWF of the kth grey class of the jth criterion, and ηj is
the weight of criterion j.
Step 4: If *
}{max1
k
i
k
isk
, it is decided that object i belongs to grey class k*.
When there are several objects in grey class k*, these objects can be ordered
according to the magnitudes of their comprehensive clustering coefficients.
In order to describe the procedure of the grey clustering method based on
CTWF, a study on the evaluation of the quality from educational programs
of a university is summarized below (S. Liu & Lin, 2010).
In this study six evaluation criteria and three educational programs were
established. In addition, the weights of the criteria were defined as follows
η1=0.21, η2=.0.24, η3=0.23, η4=0.14, η5=0.10, and η6=0.08. The aggregated
results obtained from expert team are shown in Table 2.18.
𝒙
𝑦 = 𝑓𝑗1
𝜆0
0
1
𝒚
𝑦 = 𝑓𝑗2 𝑦 = 𝑓𝑗
𝑘 𝑦 = 𝑓𝑗𝑠
𝜆1 𝜆2 𝜆3 𝜆𝑘−1 𝜆𝑘 𝜆𝑘+1 𝜆𝑠−1 𝜆𝑠 𝜆𝑠+1

Chapter II|47
Table 2.18: Values of three educational programs.
Program #
Faculty
Scholarly
works
Talent Productio
n
Disciplinary
platform
Working environmen
t
Scholarly
exchange
1 83 89 93 78 74 63
2 79 80 82 66 72 47
3 83 40 51 56 70 45
Source: retrieved from Liu and Lin (2010)
Step 1: The values range is divided into four grey classes: excellent, good,
fine, and poor. All of values of the programs are within range of 40 to 95.
Then, the interval [40 , 95] is divided in four intervals according to the grey
classes. These intervals are: [40,60>, [60,75>, [75,85>, and [85,95>. The
center-points are determined as follows: λ1=90, λ2=80, λ3=70, λ4=50.
Step 2: The grey classes are expanded in two directions, adding the grey
classes 0 and 5 with their center-points 100 and 30 respectively. Therefore,
the new sequence of center-points is: λ0 =100, λ1 =90, λ2 =80, λ3 =70, λ4 =50,
λ5 =30. From Equation 2.12, the CTWF for the kth grey class, k=1, 2, 3, 4, of
the jth criterion, j=1, 2, 3, 4, 5, 6, for an observed value 𝑥𝑖𝑗 are defined by
Equations 2.14, 2.15, 2.16, and 2.17.
𝑓𝑗1(𝑥) =
{
0, 𝑥 ∉ [80 , 100]
𝑠𝑑𝑓𝑔𝑥 − 80
10, 𝑥 ∈ [80 , 90]
𝑠𝑓𝑠𝑓𝑔𝑠𝑓𝑔100 − 𝑥
10, 𝑥 ∈ [90 , 100]
(2.14)
𝑓𝑗2(𝑥) =
{
0, 𝑥 ∉ [70 , 90]
𝑠𝑑𝑓𝑔𝑥 − 70
10, 𝑥 ∈ [70 , 80]
𝑠𝑓𝑠𝑓𝑔𝑠𝑓𝑔90 − 𝑥
10, 𝑥 ∈ [80 , 90]
(2.15)

State of the art|48
𝑓𝑗3(𝑥) =
{
0, 𝑥 ∉ [50 , 80]
𝑠𝑑𝑓𝑔𝑥 − 50
20, 𝑥 ∈ [50 , 70]
𝑠𝑓𝑠𝑓𝑔𝑠𝑓𝑔80 − 𝑥
10, 𝑥 ∈ [70 , 80]
(2.16)
𝑓𝑗4(𝑥) =
{
0, 𝑥 ∉ [30 , 70]
𝑠𝑑𝑓𝑔𝑥 − 30
20, 𝑥 ∈ [30 , 50]
𝑠𝑓𝑠𝑓𝑔𝑠𝑓𝑔70 − 𝑥
20, 𝑥 ∈ [50 , 70]
(2.17)
Step 3: The comprehensive clustering coefficient 𝜎𝑖𝑘, for object i, i=1, 2, 3,
with respect to the grey class k, k=1, 2, 3, 4, is calculated by Equation 2.13.
The results are shown in Table 2.19.

Chapter II|49
Table 2.19: The comprehensive clustering coefficient for each program.
Grey class X1 X2 X3 X4 X5 X6 𝝈𝟏𝒌
1 0.3 0.9 0.7 0 0 0 0.44
2 0.7 0.1 0 0.8 0.4 0 0.323
3 0 0 0 0.2 0.6 0.65 0.14
4 0 0 0 0 0 0.35 0.028
Grey class X1 X2 X3 X4 X5 X6 𝝈𝟐𝒌
1 0 0 0.2 0 0 0 0.046
2 0.9 1 0.8 0 0.2 0 0.817
3 0.1 0 0 0.8 0.8 0 0.213
4 0 0 0 0.2 0 0.85 0.096
Grey class X1 X2 X3 X4 X5 X6 𝝈𝟑𝒌
1 0.3 0 0 0 0 0 0.063
2 0.7 0 0 0 0 0 0.147
3 0 0 0.05 0.3 1 0 0.1535
4 0 0.5 0.95 0.7 0 0.75 0.4965
Source: retrieved from Liu and Lin (2010)
Step 4: From:
max1≤𝑘≤4
{𝜎1𝑘} = 𝜎1
1 = 0.44 max1≤𝑘≤4
{𝜎2𝑘} = 𝜎2
2 = 0.817 max1≤𝑘≤4
{𝜎3𝑘} = 𝜎3
4 = 0.4965
it is concluded that: the quality of the program 1 is into the grey class of
“excellent” , of the program 2 is “good”, and of the program 3 is “poor”.
Therefore, the program 1 has more quality than other two programs.
2.5.2 Summary of the grey clustering method
The grey clustering method based on CTWF has also been applied to other
fields, as shown by the studies on the analysis of a water rights allocation
system (L. N. Zhang et al., 2013), the classification of innovation strategic
alliances (Y. Zhang et al., 2014), or the evaluation of low-carbon urban
transport development (Guo, Zhao, & Yimin, 2015).
State of the art|50
The main characteristics of the grey clustering method based on CTWF
could be summarized as follows:
As AHP and FAHP, the grey clustering method based on CTWF
is able to accept weights to the evaluation criteria.
Similarly as FAHP, the grey clustering method based on CTWF
also considers the uncertainty within its analysis.
The grey clustering method based on CTWF is an approach,
which is characterized for the application to problems with
unclear intention and clear extension. This fact is the main
difference of the grey clustering method based on CTWF, with
respect to other approaches based on fuzzy logic (S. Liu & Lin,
2010).
The grey clustering method based on CTWF could benefit to SIA, as this
method considers the uncertainty within its analysis, and it is adequate to
apply to problems with clear extension. This fact helps to the affected
population, as they know or perceive the minimum and maximum value of
a social variable under analysis. This fact eases the gathering of information
during the field work.
2.6 The entropy-weight method
The entropy-weight method is based on Shannon entropy theory. Shannon
entropy or information theory of Shannon, was originally proposed by
Shannon (Shannon & Weaver, 1947). Shannon entropy is a concept which is
applied to measure the contrast between criteria, this information is
important for decision-making (Zeleny, 1996). This fact makes that Shannon
entropy can be applied to different fields, such as, clinical neurophysiology

Chapter II|51
(Cao & Slobounov, 2011), transport systems (Chen, Leng, Mao, & Liu, 2014),
or environmental time series data (Srivastav & Simonovic, 2014).
Shannon developed measure H which satisfies the following properties for
all pi within an estimated joint probability distribution P (Shemshadi,
Shirazi, Toreihi, & Tarokh, 2011; Zitnick & Kanade, 2004):
1. H is a continuous positive function;
2. If all pi are equal, pi=1/n , then H should be a monotonic increasing
function of n; and,
3. For all,
𝑛 ≥ 2,𝐻(𝑝1, 𝑝2, … , 𝑝𝑛) = ℎ(𝑝1 + 𝑝2, 𝑝3, … , 𝑝𝑛) + (𝑝1 + 𝑝2)𝐻(𝑝1
𝑝1+𝑝2,𝑝2
𝑝1+𝑝2)
Shannon showed that the only function which satisfies these properties is:
𝐻𝑆ℎ𝑎𝑛𝑜𝑛 = −∑𝑝𝑖𝑙𝑜𝑔(𝑝𝑖)
𝑛
𝑖
(2.18)
where: 0 ≤ 𝑝𝑖 ≤ 1; ∑ 𝑝𝑖 = 1𝑛𝑗=1
2.6.1 Procedure for the entropy-weight method
The procedure of the entropy-weight can be summarized as follows
(Fagbote, Olanipekun, & Uyi, 2014; Ji, Huang, & Sun, 2015; Wang & Lee,
2009; Xie & Yang, 2011):
First, assume that there are m objects for evaluation and each one has n
evaluation criteria, which form decision matrix 𝑍 = {𝑧𝑖𝑗; 𝑖 = 1, 2, … ,𝑚; 𝑗 =
1, 2, … , 𝑛}. Then, the steps of the entropy-weight method can be expressed
as follows:

State of the art|52
Step 1: The decision matrix 𝑍 = {𝑧𝑖𝑗; 𝑖 = 1, 2, … ,𝑚; 𝑗 = 1, 2, … , 𝑛} is
normalized for each criterion Cj (j=1, 2,..., n). The normalized values Pij are
calculated by Equation 2.19.
𝑃𝑖𝑗 =𝑧𝑖𝑗
∑ 𝑧𝑖𝑗𝑚𝑖=1
(2.19)
Step 2: The entropy Hj of each criterion Cj is calculated by Equation 2.20.
𝐻𝑗 = −𝑘∑𝑃𝑖𝑗
𝑚
𝑖=1
𝑙𝑛(𝑃𝑖𝑗) (2.20)
k is a constant, let k = (ln(m))-1.
Step 3: The degree of divergence divj of the intrinsic information in each
criterion Cj is calculated by Equation 2.21.
𝑑𝑖𝑣𝑗 = 1 − 𝐻𝑗 (2.21)
Step 4: The entropy weight wj of each criterion Cj is calculated by Equation
2.22.
𝑤𝑗 =𝑑𝑖𝑣𝑗
∑ 𝑑𝑖𝑣𝑗𝑛𝑗=1
(2.22)
In order to illustrate the procedure of the entropy-weight method, a study
on valuation of companies (Aznar & Guijarro, 2012; Diakoulaki, Mavrotas,
& Papayannakis, 1995), is summarized below. In this study, eight
companies are valuated, according to three criteria: cost effectiveness,
market share, and productivity. The information on the eight companies is
presented in Table 2.20.

Chapter II|53
Table 2.20: Information from the companies.
Company Cost effectiveness
(%) Market share
(%) Productivity
(Millions of dollars)
A 61 1.08 4.33
B 20.7 0.26 4.34
C 16.3 1.98 2.53
D 9 3.29 1.65
E 5.4 2.77 2.33
F 4 4.12 1.21
G 0.01 3.52 2.1
H 0.01 3.31 0.98
Source: retrieved from Aznar and Guijarro (2012); Diakoulaki, Mavrotas, and Papayannakis (1995)
Step 1: The values of Table 2.20 are normalized in each criterion. The
normalized values are calculated by Equation 2.19. The results are shown
in Table 2.21.
Table 2.21: Normalized values in each criterion.
Company Cost effectiveness Market share Productivity
A 0.5240 0.0531 0.2224
B 0.1778 0.0128 0.2229
C 0.1400 0.0974 0.1299
D 0.0773 0.1618 0.0847
E 0.0464 0.1363 0.1197
F 0.0344 0.2027 0.0621
G 0.0001 0.1731 0.1079
H 0.0001 0.1628 0.0503
Source: retrieved from Aznar and Guijarro (2012); Diakoulaki, Mavrotas, and Papayannakis (1995)
Step 2: The entropy Hj of each criterion Cj is calculated by Equation 2.20.
The results are presented in Table 2.22.

State of the art|54
Table 2.22: Entropy values of each criterion.
Cost effectiveness Market share Productivity
Hj 0.66305 0.92691 0.94285
Source: retrieved from Aznar and Guijarro (2012); Diakoulaki, Mavrotas, and Papayannakis (1995)
Step 3: The degree of divergence divj of in each criterion Cj is calculated by
Equation 2.21. The results are shown in Table 2.23.
Table 2.23: Degree of divergence in each criterion.
Cost effectiveness Market share Productivity
divj 0.33695 0.07309 0.05715
Source: retrieved from Aznar and Guijarro (2012); Diakoulaki, Mavrotas, and Papayannakis (1995)
Step 4: The entropy weight wj of each criterion Cj is calculated by Equation
2.22. The results are presented in Table 2.24.
Table 2.24: Entropy weight of each criterion.
Cost effectiveness Market share Productivity
wj 0.7212 0.1564 0.1223
Source: retrieved from Aznar and Guijarro (2012); Diakoulaki, Mavrotas, and Papayannakis (1995)
In conclusion, the weights of the criteria are established as follows:
Cost effectiveness : 72.12%
Market share : 15.64%
Productivity : 12.23%
As additional information, in this study, the authors suggested a ranking of
the companies by a weighted sum, considering the weights of the criteria
and the values of Table 2.20. The results are shown in Table 2.25.

Chapter II|55
Table 2.25: Ranking of the companies.
Company Cost effectiveness
(%)
Market share (%)
Productivity (Millions of
dollars) Ranking
A 61 1.08 4.33 44.69
B 20.7 0.26 4.34 15.50
C 16.3 1.98 2.53 12.37
D 9 3.29 1.65 7.21
E 5.4 2.77 2.33 4.61
F 4 4.12 1.21 3.68
G 0.01 3.52 2.1 0.81
H 0.01 3.31 0.98 0.64
wj 0.7212 0.1564 0.1223
Source: retrieved from Aznar and Guijarro (2012); Diakoulaki, Mavrotas, and Papayannakis (1995)
2.6.2 Summary of the entropy-weight method
The entropy-weight method is an approach that considers the uncertainty
within its analysis. In addition, this method also allows us identifying the
conflictive criteria into of an environmental conflict under study. Due to the
fact that the entropy-weight method for a certain criterion, if there is a large
difference between the alternatives, the criterion will give decision makers
a large amount of information and the criterion can be regarded as an
important factor (Kou et al., 2011). It can thus be argued that the entropy-
weight method could be applied for ECA to determine those criteria for
which there is divergence between the stakeholder groups.
The entropy-weight method should be combined with other method, which
assesses the social impact, in order to integrate social impact assessment
and environmental conflict analysis. In this thesis, a combined method
based on the grey clustering method and the entropy-weight method is
proposed, to integrate social impact assessment and environmental impact
analysis.
State of the art|56
References
Ahammeda, F., & Azeem, A. (2013). Selection of the most appropriate
package of Solar Home System using Analytic Hierarchy Process
model in rural areas of Bangladesh. Renewable Energy, 55, 6–11.
Astigarraga, E. (2005). El Método Delphi. España: Universidad de Deusto-
San Sebastian.
Aznar, J., & Guijarro, F. (2012). Nuevos métodos de valoración, modelos
multicriterio (Vol. 2a). Valencia: Universitat Politèctica de València.
Bindu, C., Padmaja, M., & Chandulal, J. A. (2010). Evaluating Web Sites
Based on GHAP. International Journal on Computer Science and
Engineering, 2(3), 674–679.
Campos-Climent, V., Apetrei, A., & Chaves-Ávila, R. (2012). Delphi
method applied to horticultural cooperatives. Management
Decision, 50(7), 1266–1284. http://doi.org/10.1108/00251741211247003.
Cao, C., & Slobounov, S. (2011). Application of a novel measure of EEG
non-stationarity as “ Shannon- entropy of the peak frequency
shifting” for detecting residual abnormalities in concussed
individuals. Clinical Neurophysiology, 122(7), 1314–1321.
Chen, S., Leng, Y., Mao, B., & Liu, S. (2014). Integrated weight-based multi-
criteria evaluation on transfer in large transport terminals: A case
study of the Beijing South Railway Station. Transportation Research
Part A, 66, 13–26.
Corbetta, P. (2007). Metodología y técnicas de investigación social. Madrid:
McGRAW-HILL.

Chapter II|57
Davis, L., Taylor, H., & Reyes, H. (2014). Lifelong learning in nursing: A
Delphi study. Nurse Education Today, 34(3), 441–445.
http://doi.org/10.1016/j.nedt.2013.04.014.
Delgado, A., & Romero, I. (2015). Selection of a method for social impact
assessment using AHP. Revista ECIPerú, 12(1), 84–91.
Deng, J. (1985). Generation functions of grey systems. Fuzzy Mathematics,
5(2), 11–22.
Diakoulaki, D., Mavrotas, G., & Papayannakis, L. (1995). Determining
objective weights in multiple criteria problems: The critic method.
Computers & Operations Research, 22(7), 763–770.
http://doi.org/10.1016/0305-0548(94)00059-H.
Fagbote, E. O., Olanipekun, E. O., & Uyi, H. S. (2014). Water quality index
of the ground water of bitumen deposit impacted farm settlements
using entropy weighted method. International Journal of
Environmental Science and Technology, 11(1), 127–138.
Guarino, C., Gabriel, C., & Ribas, J. R. (2012). O método fuzzy ahp aplicado
à análise de riscos de usinas hidrelétricas em fase de construção. In
Congreso Latino-Iberoamericano de Investigación Operativa (p. 13).
Rio de Janeiro: Universidade Federal do Rio de Janeiro.
Guo, J., Zhao, X., & Yimin, H. (2015). Grey clustering evaluation of urban
low-carbon transport development based on triangular
whitenization weight function. Grey Systems : Theory and
Application, 5(3), 278–289.
Hernández Rojas, D. (1997). Lógica Fuzzy. España: Omron.

State of the art|58
Ji, Y., Huang, G. H., & Sun, W. (2015). Risk assessment of hydropower
stations through an integrated fuzzy entropy-weight multiple
criteria decision making method: A case study of the Xiangxi River.
Expert Systems with Applications, 42, 5380–5389.
Kim, M., Jang, Y.-C., & Lee, S. (2013). Application of Delphi-AHP methods
to select the priorities of WEEE for recycling in a waste management
decision-making tool. Journal of Environmental Management,
128(0), 941–948.
Landeta, J. (2002). El método Delphi, Una técnica de previsión del futuro.
Barcelona, España: Editorial Ariel.
Leng, Y., Kou, C., Zhou, N., Li, Q., Liang, Y., Xu, Z., & Chen, S. (2012).
Evaluation on Transfer Efficiency at Integrated Transport Terminals
through Multilevel Grey Evaluation. In 8th International Conference
on Traffic and Transportation Studies (Vol. 43, pp. 587–594).
Changsha.
Li, C., Chen, K., & Xiang, X. (2015). An integrated framework for effective
safety management evaluation: Application of an improved grey
clustering measurement. Expert Systems with Applications, 42, 5541-
5553.
Liu, S., & Lin, Y. (2010). Grey Systems: Theory and Applications. Berlin:
Springer.
Liu, X., & Pang, J. (2010). A fuzzy synthetic evaluation method for software
quality. E-Business and Information System Security (EBISS, 1–4.
http://doi.org/10.1109/EBISS.2010.5473544.

Chapter II|59
Mittnacht, A. M., & Bulik, C. M. (2014). Best nutrition counseling practices
for the treatment of anorexia nervosa: A Delphi study. International
Journal of Eating Disorders, 111–122.
http://doi.org/10.1002/eat.22319.
Ortega Mohedano, F., & Ortega, F. (2008). El método Delphi, prospectiva
en las Ciencias Sociales. Revista EAN, 64(64), 31–54.
Rodríguez, A. (2009). Utilización de la lógica difusa en la estimación del
riesgo en proyectos. XIII Congreso Internacional de Ingeniería de
Proyectos, 12.
Rouyendegh, B. D., & Erkan, T. E. (2012). Selection of academic staff using
the fuzzy analytic hierarchy process (FAHP): a pilot study. Technical
Gazette, 199(4), 923–929.
Saaty, T. L. (1980). The Analytic Hierarchy Process. McGraw-Hill Inc. New
York: McGraw-Hill.
Saaty, T., & Vargas, L. (2012). Models, Methods, Concepts & Applications
of the Analytic Hierarchy Process (Vol. 2o). New York: Springer.
Sadeghi, M., & Ameli, A. (2012). An AHP decision making model for
optimal allocation of energy subsidy among socio-economic
subsectors in Iran. Energy Policy, 45, 24–32.
Shannon, C. E., & Weaver, W. (1947). The mathematical theory of
communication. The University of Illinois Press: Urbana.
Shemshadi, A., Shirazi, H., Toreihi, M., & Tarokh, M. J. (2011). A fuzzy
VIKOR method for supplier selection based on entropy measure for

State of the art|60
objective weighting. Expert Systems with Applications, 38(10),
12160–12167.
Shenggang, S., Jingcan, C., Li, F., Wenyan, l., & Liqiu, Z. (2014).
Construction of a technique plan repository and evaluation
systembased on AHP group decision-making for emergency
treatment anddisposal in chemical pollution accidents. Journal of
Hazardous Materials, 276, 200–206.
Soliño Millán, M. (2004). El Método Delphi: aplicación a la Economía de
los Recursos Naturales en España. In V Congreso de Economía
Agraría (p. 19). Santiago de Compostela: Universidad de Vigo.
Srivastav, R., & Simonovic, S. (2014). An analytical procedure for multi-
site, multi-season streamflow generation using maximum entropy
bootstrapping. Environmental Modelling & Software, 59, 59–75.
Tang, Y. C., & Lin, T. W. (2011). Application of the fuzzy analytic hierarchy
process to the lead-free equipment selection decision. International
Journal of Business and Systems Research, 5(1), 35.
http://doi.org/10.1504/IJBSR.2011.037289.
Vargas, R. (2010). Utilizando el proceso analítico jerárquico (paj) para
seleccionar y priorizar proyectos en una cartera. In PMI Global
Congress 2010 ‐ América del Norte (pp. 1–25). Washington DC.
Volaric, Tomislav;Brajkovic, E. S. T. (2013). Selection of the Multimedia
Applications for Learning using FAHP and, 44–48.

Chapter II|61
Wang, T.-C., & Lee, H.-D. (2009). Developing a fuzzy TOPSIS approach
based on subjective weights and objective weights. Expert Systems
with Applications, 36(5), 8980–8985.
Wittmer, H., Rauschmayer, F., & Klauer, B. (2006). How to select
instruments for the resolution of environmental conflicts? Land Use
Policy, 23(1), 1–9. http://doi.org/10.1016/j.landusepol.2004.09.003.
Xie, M., & Yang, Y. (2011). Cost Risk Assessment of Construction Projects
Based on Entropy-Weighted Matter-Element Model. Advanced
Materials Research, 168-170, 2402–2405.
Zadeh, L. (1965). Fuzzy sets. Information Control, 8(3), 338–353.
Zeleny, M. (1996). Multiple criteria decision making. New York: Springer.
Zhang, L. N., Wu, F. P., & Jia, P. (2013). Grey Evaluation Model Based on
Reformative Triangular Whitenization Weight Function and Its
Application in Water Rights Allocation System. The Open
Cybernetics & Systemics Journal, 7(1), 1–10.
Zhang, Y., Ni, J., Liu, J., & Jian, L. (2014). Grey evaluation empirical study
based on center-point triangular whitenization weight function of
Jiangsu Province industrial technology innovation strategy alliance.
Grey Systems: Theory and Application, 4(1), 124–136.
Zitnick, L., & Kanade, T. (2004). Maximum Entropy for Collaborative
Filtering. In In ACM proceedings of the 20th conference on
uncertainty in artificial intelligence (pp. 636–643).


CHAPTER III
FORMULATION OF THE PROPOSED METHOD
Entropy-weight


Chapter III|65
3. Formulation of the proposed method
3.1 Introduction
In this chapter, the formulation and details of the proposed integrated
method for SIA and ECA are developed.
First, in section 3.2, an initial study published in a journal on the selection
of a method for SIA is translated and adapted in this thesis. In this study,
the opinion form expert team, on the best method for SIA, is collected and
processed.
Second, in section 3.3, the proposed integrated method is developed and
discussed. The integration of SIA and ECA is performed by combining the
grey clustering method based on CTWF and the entropy-weight method.
3.2 Initial study to explore a method for SIA
In this section, in order to explore the best method for SIA, an initial study,
by processing of the opinion from expert team using AHP, is presented.
This study was published in the journal “Revista ECIPerú”, which is a
journal of open access (public domain), with ISSN: 1813-0194. This article
was translated and adapted for this thesis.
Link of the English version from data base, Hyper Article en Ligne (HAL):
https://hal.archives-ouvertes.fr/hal-01242027v1
Link of the Spanish version from data base, Hyper Article en Ligne (HAL):
https://hal.archives-ouvertes.fr/hal-01188398v2
Link from the journal:
http://www.reddeperuanos.com/revista/eci2015irevista/index.htm

Formulation of the proposed method|66
Paper 1: Selection of a method for SIA using AHP
Authors: Alexi Delgado(1),(2), I. Romero(1)
(1) Research Institute of Water and Environmental Engineering (IIAMA), Universitat Politècnica de València, Valencia, Spain.
(2) Faculty of Science and Engineering, Universidad de Ciencias y Humanidades, Lima, Peru.
Reference:
Delgado, Alexi; Romero, I. (2015). Selection of a method for social impact assessment using AHP. Revista ECIPerú. 12 (1): 84-91. OPEN ACCESS.
Abstract
Increasing of environmental conflicts during the planning or execution of
projects makes social impact assessment necessary and objective, in order
to prevent potential environmental conflicts. In this paper, we present a
study to select the best alternative methodology available and applicable
for social impact assessment (SIA) on projects and programs. The selection
was conducted using the methodology of analytic hierarchy process (AHP).
In this study, four alternative methods for social impact assessment were
proposed: Delphi, AHP, FAHP and grey clustering, which were ranked
according to criteria: quantification, robustness and standardization. To
make the selection using AHP, a panel of four experts was convoked for
this study. The results showed that the best method for social impact
assessment is the grey clustering complemented with Delphi method and
other qualitative procedures during field work and data collection.
Keywords: Social Impact Assessment (SIA), Analytic Hierarchy Process
(AHP)
Chapter III|67
3.2.1 Introduction
Environmental conflicts are increasing due to developing of investment
projects that demand to exploit natural resources, which affect to
population into influence area from determined project, as evidenced by
studies on environmental conflicts of water management (Saqalli et al.,
2010), or of exploitation of energy resources (Karjalainen & Järvikoski,
2010). To prevent possible environmental conflicts is necessary to conduct
social impact assessment (SIA), before, during, and after of execution of a
project.
Social impact assessment has been mainly conducted under qualitative
approaches, as descripted by study on social impact assessment on a
infrastructure developing project (Prenzel & Vanclay, 2014). Qualitative
methods contribute with much information during analysis of a problem,
but it has limitations for decision making, as there is lack of numeric
information, which allows doing a good discrimination. Therefore,
qualitative methods must be complemented with other quantitative
approaches, in order to improve assessment and decision making.
Between the main available methodological alternatives for social impact
assessment, which allow quantifying the qualitative information, we have:
first, the Delphi method, which is used to do studies on prospective and
indicators construction, as evidenced by study on construction of indicators
to evaluate university institutions (Garcia Aracli, 2012). Second, the AHP
method, used to make decisions, as shown by the study on decision making
for allocation of subsidised energy (Sadeghi & Ameli, 2012). Third, the
FAHP method that is an extension of AHP, which includes fuzzy logic
within its analysis. FAHP is a method that is used, among other things, for
decision making as shown in the study on the evaluation of alternatives in

Formulation of the proposed method|68
the production cycle (Weck, Klocke, Schell, & Riienauver, 1997). Fourth, the
grey clustering method, which is used to classify objects using evaluation
criteria, as shown by the study on the risk assessment of investment in an
energy project (Ke, Xiaoliu, Zhongfu, & Wenyan, 2012).
The AHP method is a practical and useful option to choose the best
alternative between a set of them, as shown by studies on the selection of
recycle alternatives (Kim et al., 2013), or the emergency control of accidents
of environmental pollution (Shenggang et al., 2014). Therefore, the AHP
method is a tool , which helps us to choose the best alternative for SIA
by evaluating of the four alternatives propose in this study.
The criteria established to select the best method for SIA were:
quantification, robustness and standardization. This criteria were sectioned
according to main approaches on quality that must have the methods
(Vinagre, 1995), and by the opinion of the expert team.
To conduct the process of selection of a method for SIA, we convoked to
four specialist experts from fields of multi-criteria methods, decision
making, social sciences, and environmental sciences. The characterises of
these experts are that they know their speciality and also have a holistic
view on socio-environmental problem, which is a requirement in opinion
of Landeta (Landeta, 2002).
The objectives in this study are to: select the best method for SIA using AHP,
and characterize the method chosen.
This article is organized as follows: In Section 3.2.2, the methodology is
developed. The application of AHP to select a method for SIA is performed

Chapter III|69
in Section 3.2.3. In Section 3.2.4, the results and discussion are provided. The
conclusions of this study are presented in Section 3.2.5.
3.2.2 Methodology
The methodology used in this study to select a method for SIA was AHP.
AHP method was proposed by Thomas L. Saaty (T. L. Saaty, 1980). AHP
was designed to select the best alternative from a set of proposed
alternatives, which are evaluated according to previously established
criteria (T. Saaty & Vargas, 2012). The procedure of AHP method can be
summarized by the following steps (Ahammeda & Azeem, 2013; Aznar &
Guijarro, 2012):
Step 1: The alternatives for evaluation are defined as: A1, A2, A3,..., Am.
Step 2: The criteria for evaluation are defined as: C1, C2, C3,…, Cn.
Step 3: The matrix of comparison and its consistency are established.
To determine the weight for each criterion, a matrix of paired comparison
is used. This matrix is constructed used a scale that was proposed by Saaty
(Vargas, 2010). The values are shown in Table 3.1.

Formulation of the proposed method|70
Table 3.1: Relative importance of the Saaty scale.
Scale Numerical rating Reciprocal
Extremely recommended 9 1/9
Very strong to extremely 8 1/8
Very strongly preferred 7 1/7
Strongly to very strongly 6 1/6
Strongly preferred 5 1/5
Moderately to strongly 4 1/4
Moderately preferred 3 1/3
Equally to moderately 2 1/2
Equally preferred 1 1
Source: retrieved from Vargas (2010)
The results of the comparison between the criteria: C1, C2, C3,…, Cn , are
established according to the matrix shown in Equation 3.1.
𝐶1 →𝐶2 →⋮⋮
𝐶𝑛 →(
1 𝑝12⋯ 𝑝1𝑛
1
𝑝121 ⋯ 𝑝2𝑛
⋮1
𝑝1𝑛
⋮1
𝑝2𝑛
⋱⋯
⋮1)
⏞
𝐶1↓
𝐶2↓
⋯⋯ 𝐶𝑛↓
= 𝑃𝑛×𝑛 (3.1)
Now, the matrix P is normalized in each column by the division of each
element by total sum of the column: 𝑆1×𝑛 = (𝑠1 𝑠2 𝑠3 ⋯ 𝑠𝑛). Then, the
weight of each criterion is calculated by the arithmetic mean of the elements
of each row. The weight matrix is represented by Equation 3.2.
𝑊𝑛×1 = (𝑤1 𝑤2 𝑤2 ⋯ 𝑤𝑛)𝑡 (3.2)
To determine the consistency of the comparison matrix, first, the
consistency index (CI) is calculated by Equation 3.3.
𝐶𝐼 =λ𝑀𝑎𝑥−𝑛
𝑛−1 (3.3)

Chapter III|71
Where n is the order of the matrix, and λ𝑀𝑎𝑥 is the maximum eigenvector,
which is calculated by Equation 3.4.
λ𝑀𝑎𝑥 =∑𝑠𝑖.
𝑛
𝑖=1
𝑤𝑖 (3.4)
As additional information, there are other procedures to calculate the
weight of the criteria, but the difference between results is insignificant
(Vargas, 2010). Therefore, the procedure used in this article is valid. Next,
the random consistency index (RI) is determined according to values of
Table 3.2, which were calculated by Saaty (T. Saaty & Vargas, 2012), where
n is the order of the matrix.
Table 3.2: Values of IR established by Saaty.
n 1 2 3 4 5 6 7 8 9 10
IR 0 0 0,52 0,89 1,11 1,25 1,35 1,40 1,45 1,49
Source: retrieved from Saaty and Vargas (2012).
Then, the consistency ratio (CR) is calculated by Equation 3.5.
𝐶𝑅 =𝐶𝐼
𝑅𝐼 (3.5)
The consistency of the matrix is finally determined by comparison between
the consistency ratio (CR) and the values established by Saaty (Aznar &
Guijarro, 2012), which are shown in Table 3.3.

Formulation of the proposed method|72
Table 3.3: Values of CR established by Saaty.
Order of the matrix (n) Consistency ratio(CR)
3 0.05
4 0.09
5 o mayor 0.10
Source: retrieved from Aznar and Guijarro (2012).
The matrix of comparison will be consistent, if the value of CR is minor than
the value from Table 3.3, according to order of the matrix (n).
Step 4: The ranking of the alternatives for the final decision is established.
The alternatives A1, A2, A3,..., Am, are evaluated according to criteria C1, C2,
C3,…, Cn. The results for each criterion are presented in Equation 3.6.
𝐴1 →𝐴2 →⋮⋮
𝐴𝑚 →(
1 𝑞12⋯ 𝑞1𝑚
1
𝑞121 ⋯ 𝑞2𝑚
⋮1
𝑞1𝑚
⋮1
𝑞2𝑚
⋱⋯
⋮1)
⏞
𝐴1↓
𝐴2↓
⋯⋯ 𝐴𝑚↓
= 𝑄𝑚×𝑚𝑛 (3.6)
After of checking the consistency of each comparison matrix, the weight of
the alternatives is determined, with respect to each criterion. The results are
shown in Equation 3.7.
𝐶1 →𝐶2 →⋮
𝐶𝑛 →
(
𝑟11 𝑟12 ⋯ 𝑟1𝑚𝑟21 𝑟22 ⋯ 𝑟2𝑚⋮𝑟𝑛1
⋮𝑟𝑛2
⋱⋯
⋮𝑟𝑛𝑚
)
⏞
𝐴1↓
𝐴2↓
⋯⋯ 𝐴𝑚↓
= 𝑇𝑛×𝑚 (3.7)
The ranking of the alternatives is established according to results of the
multiplication of matrix 𝑊𝑡 and the matrix T, by Equation 3.8.

Chapter III|73
𝑅1×𝑚 = (𝑊𝑛×1)𝑡. 𝑇𝑛×𝑚 (3.8)
3.2.3 AHP on the selection of a method for SIA
The application of the AHP method for selection of a method for SIA is
described below.
3.2.3.1 Alternatives
The alternatives were established according to literature review on SIA,
method for environmental impact assessment, method of muti-criteria
analysis, and by consultation to expert team. In this study the following
alternatives were established:
A1: The Delphi method
The Delphi method was developed since mid-twentieth century. “The name
"Delphi" is the English translation of Delfos, a city of ancient Greece [...] known
by the oracles that Apollo performed by a priestess (Pythia) [...] the Delphi method
was conceived in the core of the research centre of the American Rand Corporation
from late forties [...] a decisive study for the scientific support of the technical was
carried out by Abraham Kaplan in 1949”(Landeta, 2002). A Delphi is the
selection of a group of experts who are asked on their opinions of issues
related to future events. The estimates from experts are made in successive
anonymous rounds, the objective is to try to achieve consensus, but with
maximum autonomy in the participants (Astigarraga, 2005). The Delphi
method has been applied to many researches in the social sciences, for
example in the analysis of audio-visual sector prospective (Ortega
Mohedano & Ortega, 2008). The Delphi method is an alternative for SIA
because it would allow making the evaluation of a project by consulting of
experts.

Formulation of the proposed method|74
A2: The AHP method
The AHP method developed in this article is an alternative for SIA, as it
would allow evaluating a project according to social criteria, which would
be defined in concordance with the characteristics of project or program
under study.
A3: The FAHP method
The FAHP is a method, which include the fuzzy logic within the AHP
method. The formal starting of fuzzy logic is considered in 1965, in which
Lotfi A. Zadeh published his work on “Fuzzy Sets” (Zadeh, 1965). The
FAHP method has been applied to a diversity of problems, as for example
to determine the perception of hotel services quality (Yen-Cheng, Tung-
Han, Pei-Ling, & Ching-Sung, 2014), to determine the indicators of
entrepreneurial in an university (Reza, 2014), or to evaluate the risks in a
mining company (Verma & Chaudhri, 2014). The FAHP method is an
alternative for SIA, because it could assess social impact using criteria, in
same way that AHP, but incorporating fuzzy logic within its analysis.
A4: The grey clustering method
The grey clustering method is based on grey systems theory, which was
developed by Deng (Deng, 1985). Grey systems study the problems with
small samples or with limited information, in real world there are many
problems of this type, this fact makes grey systems can be applied to
different fields. As for example to evaluate web sites (Bindu et al., 2010), the
water management (L. N. Zhang et al., 2013), or occupational safety
management (Li et al., 2015). The grey clustering method is an alternative
for SIA, because it assesses social impact using criteria, and also establishes

Chapter III|75
intervals or grey classes, which help to determine a ranking of the social
impact.
3.2.3.2 Criteria of selection
The criteria to select a method for SIA were established using attributes,
which determine the quality of a method (Vinagre, 1995). In addition, the
opinion from the experts was also used, in order to determine the criteria of
evaluation. Three criteria ware finally established:
C1: Quantification
One of the limitations of some methods for SIA is its lack of capacity to
quantify the results. Therefore, this criterion evaluates the level of
quantification of alternative methods for SIA, presented in this study.
C2: Robustness
This criterion evaluates the scientific solidity of alternatives methods for
SIA, analysing theories on which are supported and the procedure that is
used to assess social impact.
C3: Standardization
This criterion evaluates the level of applicability of the alternatives methods
for SIA. In other words, this criterion evaluates the capacity of the
alternatives methods to be applied to other contexts and other type of
projects.
The hierarchy to select a method for SIA, including the alternatives and the
criteria, is shown in Figure 3.1.

Formulation of the proposed method|76
Figure 3.1: Hierarchy to select a method for SIA.
3.2.3.3 Matrix and index of consistency
The expert team are represented by E1, E2, E3, and E4, who performed the
evaluation of the criteria, in order to determine the weights of each criterion.
This evaluation was performed according the values from Table 3.1. The
results of the paired comparison obtained from the experts are presented in
Table 3.4.
Table 3.4: Paired comparison between criteria.
E1 E2 E3 E4 GM
C1-C2 1.00 2.00 1.00 2.00 1.41
C1-C3 2.00 3.00 0.50 3.00 1.73
C2-C3 3.00 1.00 0.33 1.00 1.00
Level 3: Alternatives
Level 2: Criteria
Level 1: Goal
Selection of a method for SIA
Qu
an
tifi
cati
on
Ro
bu
stn
ess
Sta
nd
ard
iza
tio
n
Delphi Grey AHP FAHP
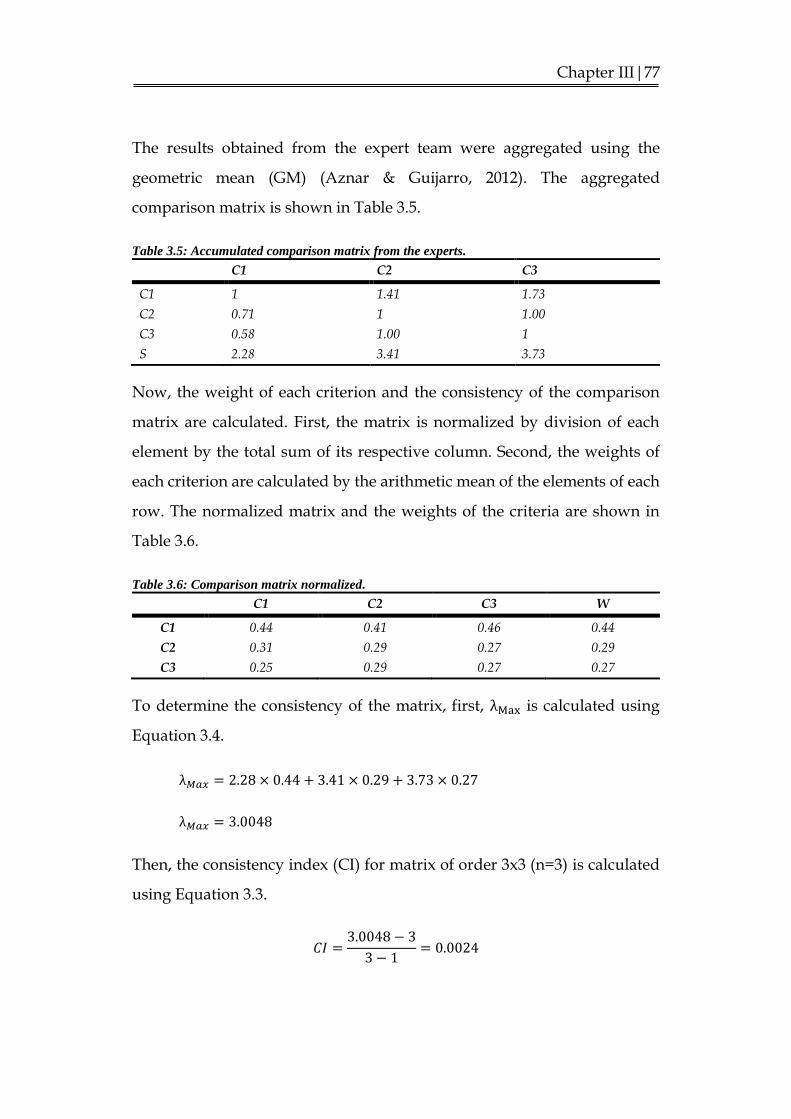
Chapter III|77
The results obtained from the expert team were aggregated using the
geometric mean (GM) (Aznar & Guijarro, 2012). The aggregated
comparison matrix is shown in Table 3.5.
Table 3.5: Accumulated comparison matrix from the experts.
C1 C2 C3
C1 1 1.41 1.73
C2 0.71 1 1.00
C3 0.58 1.00 1
S 2.28 3.41 3.73
Now, the weight of each criterion and the consistency of the comparison
matrix are calculated. First, the matrix is normalized by division of each
element by the total sum of its respective column. Second, the weights of
each criterion are calculated by the arithmetic mean of the elements of each
row. The normalized matrix and the weights of the criteria are shown in
Table 3.6.
Table 3.6: Comparison matrix normalized.
C1 C2 C3 W
C1 0.44 0.41 0.46 0.44
C2 0.31 0.29 0.27 0.29
C3 0.25 0.29 0.27 0.27
To determine the consistency of the matrix, first, λMax is calculated using
Equation 3.4.
λ𝑀𝑎𝑥 = 2.28 × 0.44 + 3.41 × 0.29 + 3.73 × 0.27
λ𝑀𝑎𝑥 = 3.0048
Then, the consistency index (CI) for matrix of order 3x3 (n=3) is calculated
using Equation 3.3.
𝐶𝐼 =3.0048 − 3
3 − 1= 0.0024
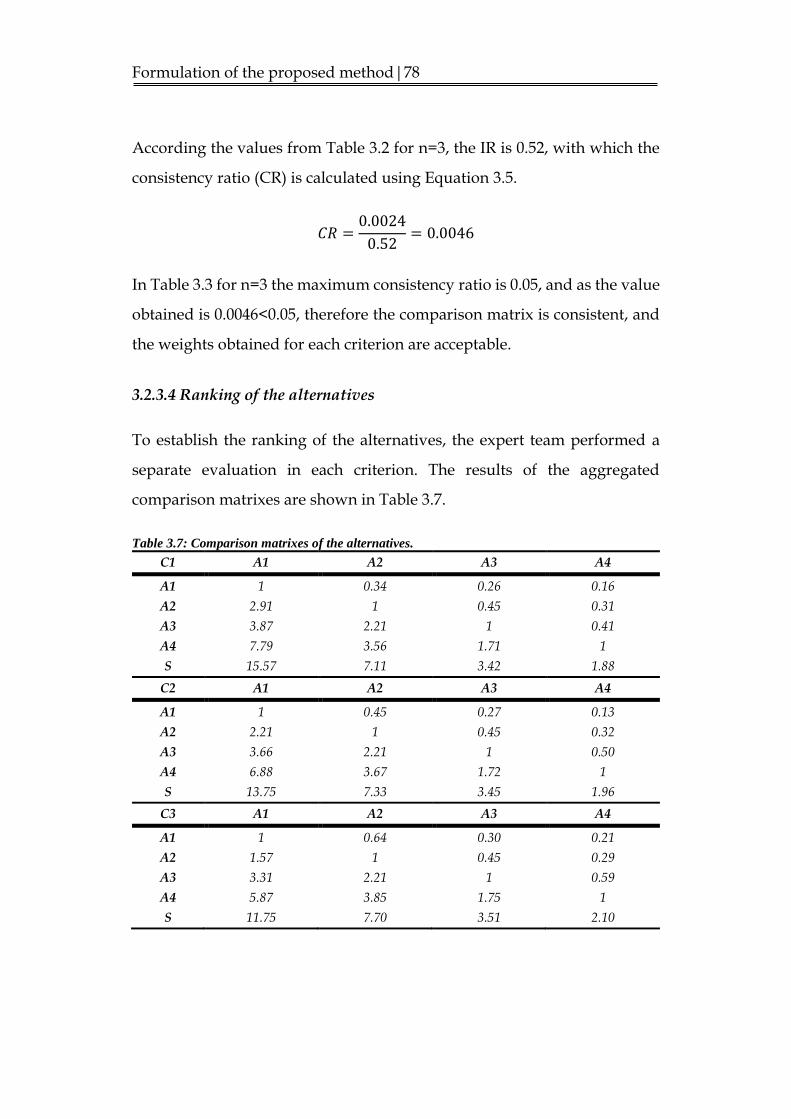
Formulation of the proposed method|78
According the values from Table 3.2 for n=3, the IR is 0.52, with which the
consistency ratio (CR) is calculated using Equation 3.5.
𝐶𝑅 =0.0024
0.52= 0.0046
In Table 3.3 for n=3 the maximum consistency ratio is 0.05, and as the value
obtained is 0.0046<0.05, therefore the comparison matrix is consistent, and
the weights obtained for each criterion are acceptable.
3.2.3.4 Ranking of the alternatives
To establish the ranking of the alternatives, the expert team performed a
separate evaluation in each criterion. The results of the aggregated
comparison matrixes are shown in Table 3.7.
Table 3.7: Comparison matrixes of the alternatives.
C1 A1 A2 A3 A4
A1 1 0.34 0.26 0.16
A2 2.91 1 0.45 0.31
A3 3.87 2.21 1 0.41
A4 7.79 3.56 1.71 1
S 15.57 7.11 3.42 1.88
C2 A1 A2 A3 A4
A1 1 0.45 0.27 0.13
A2 2.21 1 0.45 0.32
A3 3.66 2.21 1 0.50
A4 6.88 3.67 1.72 1
S 13.75 7.33 3.45 1.96
C3 A1 A2 A3 A4
A1 1 0.64 0.30 0.21
A2 1.57 1 0.45 0.29
A3 3.31 2.21 1 0.59
A4 5.87 3.85 1.75 1
S 11.75 7.70 3.51 2.10
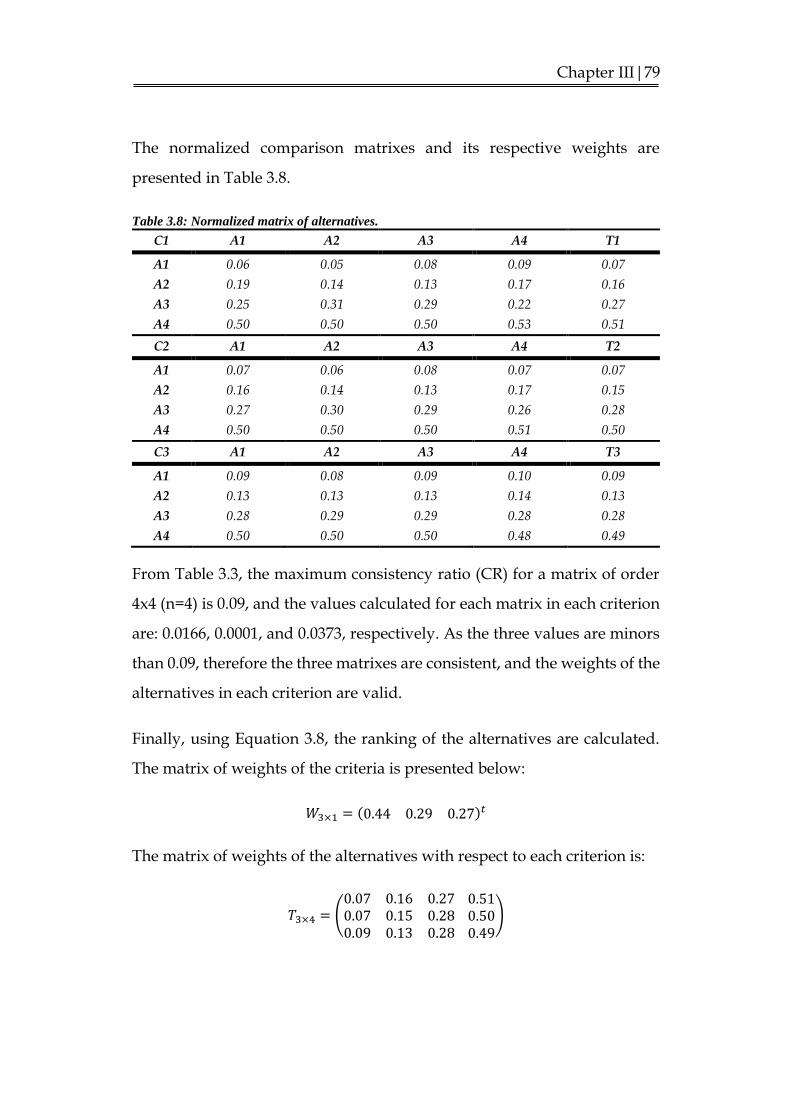
Chapter III|79
The normalized comparison matrixes and its respective weights are
presented in Table 3.8.
Table 3.8: Normalized matrix of alternatives.
C1 A1 A2 A3 A4 T1
A1 0.06 0.05 0.08 0.09 0.07
A2 0.19 0.14 0.13 0.17 0.16
A3 0.25 0.31 0.29 0.22 0.27
A4 0.50 0.50 0.50 0.53 0.51
C2 A1 A2 A3 A4 T2
A1 0.07 0.06 0.08 0.07 0.07
A2 0.16 0.14 0.13 0.17 0.15
A3 0.27 0.30 0.29 0.26 0.28
A4 0.50 0.50 0.50 0.51 0.50
C3 A1 A2 A3 A4 T3
A1 0.09 0.08 0.09 0.10 0.09
A2 0.13 0.13 0.13 0.14 0.13
A3 0.28 0.29 0.29 0.28 0.28
A4 0.50 0.50 0.50 0.48 0.49
From Table 3.3, the maximum consistency ratio (CR) for a matrix of order
4x4 (n=4) is 0.09, and the values calculated for each matrix in each criterion
are: 0.0166, 0.0001, and 0.0373, respectively. As the three values are minors
than 0.09, therefore the three matrixes are consistent, and the weights of the
alternatives in each criterion are valid.
Finally, using Equation 3.8, the ranking of the alternatives are calculated.
The matrix of weights of the criteria is presented below:
𝑊3×1 = (0.44 0.29 0.27)𝑡
The matrix of weights of the alternatives with respect to each criterion is:
𝑇3×4 = (0.07 0.16 0.270.07 0.15 0.280.09 0.13 0.28
0.51 0.50 0.49
)

Formulation of the proposed method|80
The ranking of the alternatives is calculated below:
𝑅1×4 = (𝑊3×1)𝑡. 𝑇3×4
𝑅1×4 = (0.44 0.29 0.27)(0.07 0.16 0.270.07 0.15 0.280.09 0.13 0.28
0.51 0.50 0.49
)
𝑅1×4 = (0.07 0.15 0.28 0.50)𝐴1 𝐴2 𝐴3 𝐴4
3.2.4 Results and discussion
In Figure 3.2, the results of the application of AHP are shown. In which the
best method for SIA is the grey clustering method, second place is occupied
by the FAHP method, third place is occupied by the AHP method, and last
place is occupied by the Delphi method.
Figure 3.2: Ranking of alternatives methods for SIA.
The potential of each alternative method for SIA, according to literature
review and opinion from the experts, is analysed below:
The advantage of the Delphi method is that experts can argument their
responses anonymously, in addition, the opinion from an expert team could
0.07
0.15
0.28
0.50
0.00 0.10 0.20 0.30 0.40 0.50 0.60
Delphi
AHP
FAHP
Grey

Chapter III|81
be considered as subjective, but it is not arbitrary, therefore Delphi could be
completed with other methodology for SIA. The disadvantage of the Delphi
method is that a basic statistic is used during the data processing. This fact
makes that the Delphi method presents minor capacity of quantification; in
addition, experts tend to change their opinions when too many rounds are
conducted.
The AHP method has the following advantage, the use of evaluation criteria
and the determination of weights for each criterion improves the level of
objectiveness of the evaluations with respect to the Delphi method; in
addition, the calculations relatively easy in this method makes that it used
in different fields. The disadvantage of the AHP method is that due to its
elementary mathematic base used during its analysis, it should be
complemented with other theories to achieve a SIA more objective.
The advantage of the FAHP method with respect to the AHP method is that
it incorporates fuzzy logic within its analysis, with which the level of
quantification is improved. On the other hand, during the data collection it
is important to take care, to obtain good results applying the FAHP method.
For example, in some cases, there are not quantitative data for facilitating
the evaluation from the experts; this fact makes the evaluation being
subjective. Therefore, it is necessary previously to make a quantification of
the variables using the grey systems theory as an alternative.
The grey clustering method has advantage with respect to the FAHP
method, due to the fact that it has good level of quantification, and also it
allows having a range of evaluation for the experts, as the grey clustering
method uses grey classes in each criterion to conduce SIA. Consequently,
this fact improves the data collection.

Formulation of the proposed method|82
Finally, according to literature review and the opinion from the experts, the
best method for SIA of projects and programs is the grey clustering method.
The grey clustering method could be complemented with the Delphi
method during the data collection. In addition, to assess social impact is
necessary to analyse stakeholder groups within affected population, as
these stakeholder groups could have a different evaluation on the
determined project; therefore, it is necessary to make social impact
assessment in each stakeholder group, in order to prevent possible
environmental conflicts.
3.2.5 Conclusions
The AHP method allowed us selecting the best method for SIA by the
evaluation from expert team, who finally established that the best method
for SIA is the grey clustering method, due to the fact that it facilitate data
collection from stakeholder groups within affected population; in addition,
the grey clustering method has a good level of quantification, as it uses a
solid mathematic theory.
The grey clustering method could be complemented with a Delphi during
the data collection from the effected population, and from the expert team,
who evaluate a determined project. In addition, it is convenient to make
social impact assessment in each stakeholder group, in order to determine
the differences between them, and then to propose measures to prevent
possible environmental conflicts.
In future researches, the grey clustering method could be tested and applied
to assess social impact of projects such as, water management projects,
mining exploitation projects, hydrocarbon exploration projects, public

Chapter III|83
works construction projects, etc. This method could also be applied to assess
social impact of public or private programs.
Acknowledgements
We want to acknowledge to the experts team for their collaborations and
suggestions, which made possible to perform this study.
References
Ahammeda, F., & Azeem, A. (2013). Selection of the most appropriate
package of Solar Home System using Analytic Hierarchy Process
model in rural areas of Bangladesh. Renewable Energy, 55, 6–11.
Astigarraga, E. (2005). El Método Delphi. España: Universidad de Deusto-
San Sebastian.
Aznar, J., & Guijarro, F. (2012). Nuevos métodos de valoración, modelos
multicriterio (Vol. 2a). Valencia: Universitat Politèctica de València.
Bindu, C., Padmaja, M., & Chandulal, J. A. (2010). Evaluating Web Sites
Based on GHAP. International Journal on Computer Science and
Engineering, 2(3), 674–679.
Deng, J. (1985). Generation functions of grey systems. Fuzzy Mathematics,
5(2), 11–22.
Garcia Aracli, A. (2012). Indicadores para la Evaluación de las Instituciones
Universitarias: Validación a través del Método Delphi. (U. P. de V. I. de
G. de la I. y del C.-I. de G. de la I. i del Coneixement, Ed.). CSIC.

Formulation of the proposed method|84
Karjalainen, T. P., & Järvikoski, T. (2010). Negotiating river ecosystems:
Impact assessment and conflict mediation in the cases of hydro-
power construction. Environmental Impact Assessment Review,
30(5), 319–327.
Ke, L., Xiaoliu, S., Zhongfu, T., & Wenyan, G. (2012). Grey Clustering
Analysis Method for Overseas Energy Project Investment Risk
Decision. Systems Engineering Procedia, 3, 55–62.
Kim, M., Jang, Y.-C., & Lee, S. (2013). Application of Delphi-AHP methods
to select the priorities of WEEE for recycling in a waste management
decision-making tool. Journal of Environmental Management,
128(0), 941–948.
Landeta, J. (2002). El método Delphi, Una técnica de previsión del futuro.
Barcelona, España: Editorial Ariel.
Li, C., Chen, K., & Xiang, X. (2015). An integrated framework for effective
safety management evaluation: Application of an improved grey
clustering measurement. Expert Systems with Applications, 42, 5541-
5553.
Ortega Mohedano, F., & Ortega, F. (2008). El método Delphi, prospectiva
en las Ciencias Sociales. Revista EAN, 64(64), 31–54.
Prenzel, P. V, & Vanclay, F. (2014). How social impact assessment can
contribute to conflict management. Environmental Impact
Assessment Review, 45, 30–37.
Reza, K. (2014). Indicators of Entrepreneurial University: Fuzzy AHP and
Fuzzy TOPSIS Approach. J Knowl Econ, 5, 370–387.

Chapter III|85
Saaty, T. L. (1980). The Analytic Hierarchy Process. McGraw-Hill Inc. New
York: McGraw-Hill.
Saaty, T., & Vargas, L. (2012). Models, Methods, Concepts & Applications
of the Analytic Hierarchy Process (Vol. 2o). New York: Springer.
Sadeghi, M., & Ameli, A. (2012). An AHP decision making model for
optimal allocation of energy subsidy among socio-economic
subsectors in Iran. Energy Policy, 45, 24–32.
Saqalli, M., Thiriot, S., & Amblard, F. (2010). Investigating social conflicts
linked to water resources trhough agent-based modelling. NATO
Science for Peace and Security Series, 75, 142–157.
Shenggang, S., Jingcan, C., Li, F., Wenyan, l., & Liqiu, Z. (2014).
Construction of a technique plan repository and evaluation
systembased on AHP group decision-making for emergency
treatment anddisposal in chemical pollution accidents. Journal of
Hazardous Materials, 276, 200–206.
Vargas, R. (2010). Utilizando el proceso analítico jerárquico (paj) para
seleccionar y priorizar proyectos en una cartera. In PMI Global
Congress 2010 América del Norte (pp. 1–25). Washington DC.
Verma, S., & Chaudhri, S. (2014). Integration of Fuzzy Reasoning approach
(FRA) and Fuzzy Analytic Hierarchy Process (FAHP) for Risk
Assessment in Mining Industry. Journal of Industrial Engineering
and Management, 7(5), 1347–1367.

Formulation of the proposed method|86
Vinagre, J. (1995). Calidad de Métodos análiticos. In Producción y Manejo
de Datos de Composición Química de Alimentos en Nutrición (pp.
137–146). Santiago de Chile.
Weck, M., Klocke, F., Schell, H., & Riienauver, E. (1997). Evaluating
altemative production cycles using the extended fuzzy AHP method.
European Journal of Operational Research, 100(96), 351–366.
Yen-Cheng, C., Tung-Han, Y., Pei-Ling, T., & Ching-Sung, L. (2014). A
fuzzy AHP approach to construct international hotel spa atmosphere
evaluation model. Qual Quant, 48, 645–657.
Zadeh, L. (1965). Fuzzy sets. Information Control, 8(3), 338–353.
Zhang, L. N., Wu, F. P., & Jia, P. (2013). Grey Evaluation Model Based on
Reformative Triangular Whitenization Weight Function and Its
Application in Water Rights Allocation System. The Open
Cybernetics & Systemics Journal, 7(1), 1–10.

Chapter III|87
3.3 Formulation of the method for SIA and ECA
This section provides a discussion of the grey clustering method based on
CTWF and of the entropy-weight method, followed by details of the
proposed integrated method for SIA and ECA.
3.3.1 SIA using the grey clustering method based on CTWF
One characteristic of SIA is its high level of uncertainly (Wittmer et al.,
2006). Therefore, SIA should be conducted by a method, which considers
the uncertainly.
In classical approaches of multi-criteria analysis, such as Delphi or AHP,
the uncertainty is not considered, due to the fact that the importance
degrees of criteria and the performance scores of alternatives are assumed
to be known precisely (Baykasoğlu & Gölcük, 2015). Moreover, there are
many methods used to model the uncertainly: fuzzy logic approaches,
probabilistic approaches or grey systems approaches are some options.
Approaches based on fuzzy logic, such as FAHP emphasizes the
investigation of problems with cognitive uncertainty, where the research
objects possess the characteristic of clear intention and unclear extension.
The focus of approaches based on grey systems theory is on the uncertainty
problems, where the research objects possess the characteristic of unclear
intention and clear extension (S. Liu & Lin, 2010). SIA has clear extension of
the criteria in a determined study, for example, in a historic range of five
years, we know the minimum and maximum value of a social variable
under analysis. In addition, affected population within a determined project
is clear about when things were good or bad: before or after project
implementation.

Formulation of the proposed method|88
As additional information, in statistical approaches the concept of large
samples represents the degree of tolerance to incompleteness. However, for
some situations, even when the sample contains thousands or several tens
of thousands of objects, true statistical laws still cannot be successfully
revealed (S. Liu & Lin, 2010). Moreover, considering that one of the criteria
for evaluating methods is the cost (Wittmer et al., 2006), in this aspect an
approach based in grey systems could have lower cost with respect to a
statistical approach, due to the fact that sample size influences on the cost
during the field work. On the other hand, in 1994, (1) Jiangping Qiu and (2)
Xisheng Hua respectively established a theoretically delicate statistical
regression model and relatively coarse grey model based on the
deformation and leakage data of a certain large scale hydraulic dam. Their
work shows that their grey model provided a better fit than the statistical
regression model. When comparing the errors between the predictions of
the two models with the actual observations, it is found that the prediction
accuracy of the grey model is generally better than that of the regression
model, for more details see Table 3.9 (S. Liu & Lin, 2010).
Table 3.9: Prediction errors of a statistical model and a grey model.
Nº Type Average error
Statistical model Grey model
1
Horizontal displacement 0.862 0.809
Vertical displacement 1.024 1.029
Water level of pressure measurement hole 6.297 3.842
2
Horizontal displacement 0.446 0.232
Vertical displacement 0.465 0.449
Water level of pressure measurement hole 0.204 0.023
Source: retrieved from Liu and Lin (2010)

Chapter III|89
As conclusion, it can be argued that the grey clustering method would
benefit SIA, as it considers the uncertainty within its analysis. In addition,
the grey clustering method could be more adequate than approaches based
on fussy logic, because it considers clear extension of the analysis criteria.
Finally, the grey clustering method could be more effective and would have
a lower cost than other statistical approaches during its application.
3.3.2 ECA using the entropy-weight method
Environmental conflicts are frequently presents during the planning and
implementation of projects and programs as evidenced by studies on
conflicts related to energy (Fontaine, 2010; Karjalainen & Järvikoski, 2010),
exploitation of natural resources (Correia, 2007), ecological tourism (Yang
et al., 2013), or water management (Bolin et al., 2008; Saqalli et al., 2010).
Environmental conflicts are generated between stakeholder groups within
communities, due to the differences in the assessment of a projects (Arun,
2008; Luyet et al., 2012). For this reason, social impact assessment should
first be performed for each stakeholder group and then the gap between the
groups should be determined in order to predict and prevent possible
environmental conflicts. In addition, SIA and ECA should be integrated, as
both aspects are directly related (Prenzel & Vanclay, 2014).
In addition, environmental conflict analysis could be conducted by classical
multi-criteria methods (Wittmer et al., 2006), or by statistical approaches (S.
Liu & Lin, 2010). However, classical multi-criteria methods do not consider
the uncertainty within their analysis (Baykasoğlu & Gölcük, 2015).
Furthermore, statistical approaches could have high cost during the field
work (Wittmer et al., 2006), and could have a minor precision (S. Liu & Lin,
2010).
Formulation of the proposed method|90
The entropy-weight method, which is based on Shannon entropy theory, is
a good option for integrating SIA and ECA. First, on the same way and
under the same philosophy as the grey clustering method, Shannon entropy
is a concept which is proposed as a measure of uncertainty (Zeleny, 1996).
Second, in our view, the entropy-weight method would benefit the ECA, as
it allows researchers to determine the criteria for which there is divergence
between stakeholder groups involved in a conflict (Kou, Sun, & Peng, 2011).
The combination of the grey clustering method and the entropy-weight
method could integrate SIA and ECA. The grey clustering method could
assess social impact by quantifying of information from stakeholders
groups. And then, the entropy-weight method could identify criteria, for
which, there are the most divergence between stakeholders groups, within
of a project under scrutiny. In addition, the integrated method could be
complemented with other qualitative approaches, such as Delphi, in order
to improve the information gathering during the field work.
3.3.3 Integrating SIA and ECA using the grey clustering and entropy-
weight methods
The integrated method proposed in this thesis can be described using the
following sets:
1. A set of m objects or stakeholder groups called G = {G1, G2,..., Gm}
2. A set of n criteria called C = {C1, C2,..., Cn}
3. A set of s grey classes called V = {V1, V2,..., Vs}
4. A set of evaluation values called X = {xij, i = 1, 2,..., m; j = 1, 2,..., n} of Gi (i = 1, 2,..., m) with respect to criterion Cj (j = 1, 2,..., n).
The steps are described below:

Chapter III|91
Step 1: Criteria and grey classes
A set of n criteria (C1, C2,..., Cn), and a set of s grey classes (V1, V2,..., Vs) for
SIA and ECA are established based on the characteristics of the project
under scrutiny.
Step 2: CTWF and the comprehensive clustering coefficient
The values of CTWF for each stakeholder group are calculated using
Equation 3.9.
𝑓𝑗𝑘(𝑥𝑖𝑗) =
{
0 , 𝑥 ∉ [𝜆𝑘−1, 𝜆𝑘+1]
𝑥 − 𝜆𝑘−1𝜆𝑘 − 𝜆𝑘−1
, 𝑥 ∈ [𝜆𝑘−1 , 𝜆𝑘]
𝜆𝑘+1 − 𝑥
𝜆𝑘+1 − 𝜆𝑘, 𝑥 ∈ [𝜆𝑘 , 𝜆𝑘+1]
(3.9)
Then, the comprehensive clustering coefficient 𝝈𝒊𝒌 for object i, i=1, 2,…, m,
with respect to the grey class k, k=1,…, s, is calculated using Equation 3.10.
𝜎𝑖𝑘 =∑𝑓𝑗
𝑘(𝑥𝑖𝑗). 𝜂𝑗 (3.10)
𝑛
𝑗=1
Step 3: Percentage system
Social impact assessment of each stakeholder group is presented as a
percentage system (Chang and Qisen, 2009), defined by values α1, α2, α3,…,
and αs, where αs=100, α1=100/s, α2=α1+α1, α3=α1+α2,…, and αs-1=α1+αs-2 ; s is the
number of grey classes established. The results are given by Equation 3.11.
𝑧𝑗𝑖 =∑𝑓𝑗
𝑘(𝑥𝑖𝑗). α𝑘
𝑠
𝑘=1
(3.11)

Formulation of the proposed method|92
where 𝑓𝑗𝑘(𝑥𝑖𝑗) is the CTWF of the kth grey class of the jth criterion and 𝛼𝑘 is
the percentage value of each grey class. The results are represented by a
matrix determined by Equation 3.12.
𝑍 = {𝑧𝑖𝑗, 𝑖 = 1, 2, … ,𝑚; 𝑗 = 1, 2, … , 𝑛} (3.12)
Step 4: Entropy-weight method
First, matrix 𝑍 = {𝑧𝑖𝑗 , i = 1, 2, … ,m; j = 1, 2, … , n} is normalized for each
criterion Cj (j=1, 2,..., n). The normalized values Pij are calculated using
Equation 3.13.
𝑃𝑖𝑗 =𝑧𝑖𝑗
∑ 𝑧𝑖𝑗𝑚𝑖=1
(3.13)
Then, Hj, divj and wj are calculated using Equations 3.14, 3.15, and 3.16.
𝐻𝑗 = −𝑘∑𝑃𝑖𝑗
𝑚
𝑖=1
𝑙𝑛(𝑃𝑖𝑗) (3.14)
𝑑𝑖𝑣𝑗 = 1 − 𝐻𝑗 (3.15)
𝑤𝑗 =𝑑𝑖𝑣𝑗
∑ 𝑑𝑖𝑣𝑗𝑛𝑗=1
(3.16)
Step 5: Objective assessment
The final stage of the proposed method is the calculation of objective
assessment (Shemshadi et al., 2011) for each stakeholder group i, i=1, 2,…,
m, in each criterion Cj (j=1, 2,..., n). The objective assessment values are
defined by Equation 3.17.
𝑄𝑖𝑗 = 𝑤𝑗𝑧𝑖𝑗 (3.17)
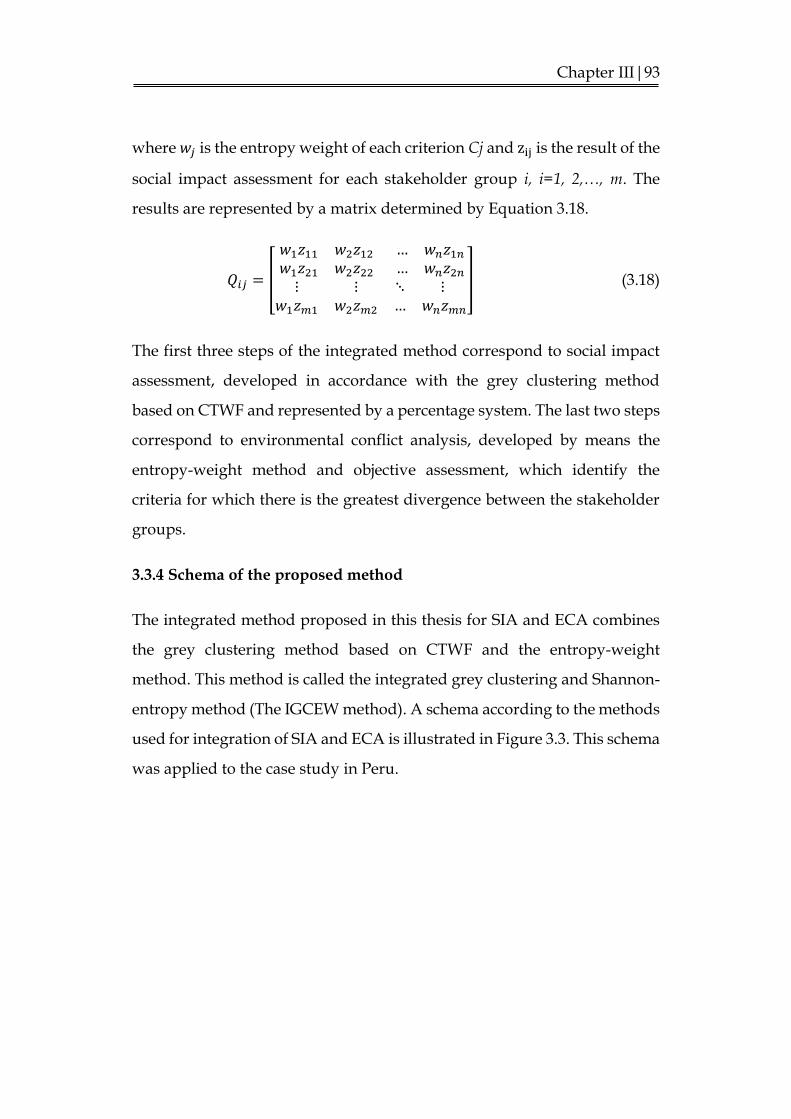
Chapter III|93
where 𝑤𝑗 is the entropy weight of each criterion Cj and zij is the result of the
social impact assessment for each stakeholder group i, i=1, 2,…, m. The
results are represented by a matrix determined by Equation 3.18.
𝑄𝑖𝑗 = [
𝑤1𝑧11 𝑤2𝑧12𝑤1𝑧21 𝑤2𝑧22
… 𝑤𝑛𝑧1𝑛… 𝑤𝑛𝑧2𝑛
⋮ ⋮𝑤1𝑧𝑚1 𝑤2𝑧𝑚2
⋱ ⋮ … 𝑤𝑛𝑧𝑚𝑛
] (3.18)
The first three steps of the integrated method correspond to social impact
assessment, developed in accordance with the grey clustering method
based on CTWF and represented by a percentage system. The last two steps
correspond to environmental conflict analysis, developed by means the
entropy-weight method and objective assessment, which identify the
criteria for which there is the greatest divergence between the stakeholder
groups.
3.3.4 Schema of the proposed method
The integrated method proposed in this thesis for SIA and ECA combines
the grey clustering method based on CTWF and the entropy-weight
method. This method is called the integrated grey clustering and Shannon-
entropy method (The IGCEW method). A schema according to the methods
used for integration of SIA and ECA is illustrated in Figure 3.3. This schema
was applied to the case study in Peru.

Formulation of the proposed method|94
Figure 3.3: Schema according to methods for SIA and ECA.
As other form, the integrated method (The IGCEW Method) can also be
represented according to the stages of SIA and ECA, as illustrated in Figure
3.4. This schema was applied to the case study in Spain.
Step 3 Percentage system
Step 5 Objective assessment
Step 4 Entropy-weight method
Grey clustering method based on CTWF
The IGCEW method for SIA and ECA
Step 1 Criteria and grey classes
Step 2 CTWF and comprehensive clustering
coefficient
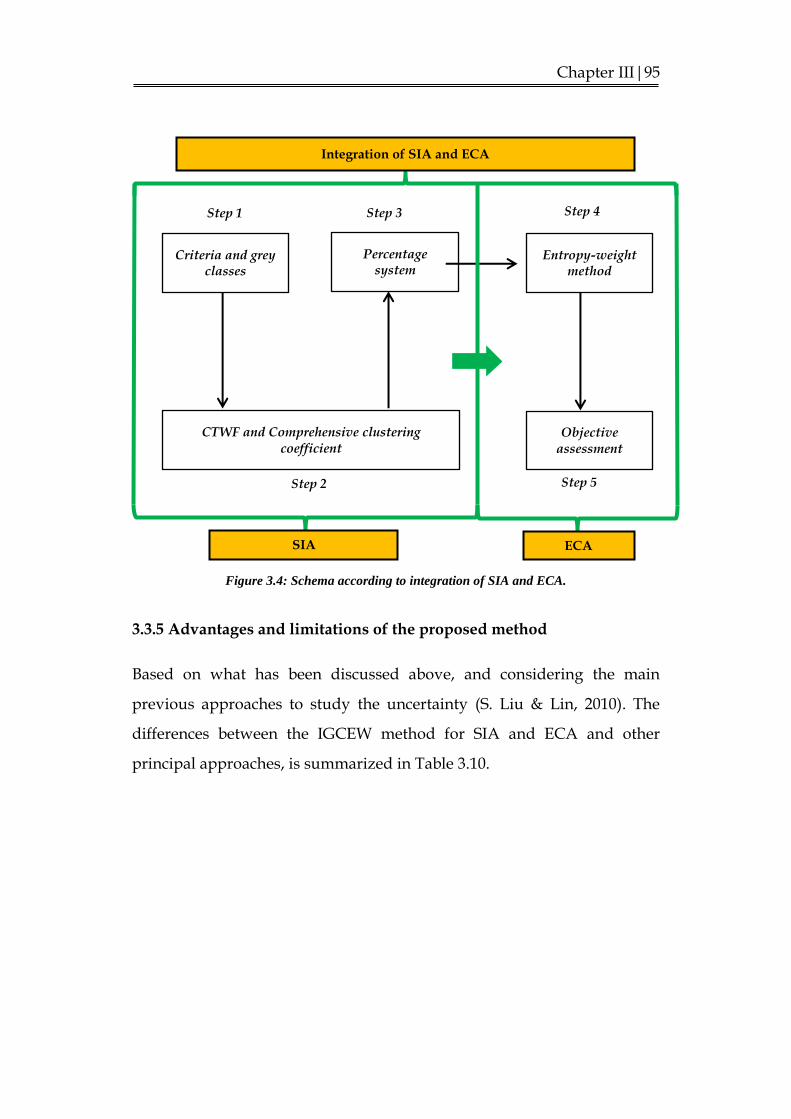
Chapter III|95
Figure 3.4: Schema according to integration of SIA and ECA.
3.3.5 Advantages and limitations of the proposed method
Based on what has been discussed above, and considering the main
previous approaches to study the uncertainty (S. Liu & Lin, 2010). The
differences between the IGCEW method for SIA and ECA and other
principal approaches, is summarized in Table 3.10.
Criteria and grey classes
Percentage system
CTWF and Comprehensive clustering coefficient
Entropy-weight method
Objective assessment
Step 2
ECA SIA
Integration of SIA and ECA
Step 1 Step 3
Step 5
Step 4

Formulation of the proposed method|96
Table 3.10: Comparison with other main approaches.
Aspect The IGCEW method Approaches based
on fuzzy logic
Approaches
based on statistics
Epistemological
paradigm
Integrate qualitative and
quantitative paradigms.
Integrate qualitative and
quantitative paradigms.
Prioritize quantitative
paradigm.
Uncertainty
Focus on the uncertainty
problems of small samples and
limited information.
Investigation of problems
with cognitive
uncertainty.
Stochastic uncertainty.
Data requirement Any distribution. Known membership. Typical distribution.
Emphasis of
research object
Clear extension and unclear
intention.
Clear intention and
unclear extension.
Revealing the
historical statistical
laws.
Objective of
research problem Laws of reality. Cognitive expression.
Historical statistical
laws.
Costs during
application
Low, due to the fact that a
small sample is used.
Medium, due to the fact
that experience is used.
High, due to the fact
that a large sample is
used.
Source: adapted and modified from Liu and Lin (2010)
Consequently, the main advantages of the IGCEW method may be
summarized as follows:
(1) The grey clustering method and the entropy-weight method are
combined for first time on the integration of SIA and ECA in the
literature.
(2) The proposed integrated method would be more appropriate
than other approaches based on multi-criteria analysis, as it
analyses problems with high level of uncertainty.
(3) The combined approach integrates social impact assessment and
environmental conflict prevention, performing an analysis of
stakeholder groups.
(4) The proposed combined approach could be more effective and
would have lower cost than other statistical approaches during
its application.

Chapter III|97
(5) The combined approach would be more convenient than other
approaches based on fuzzy logic, as it analyses SIA and ECA
considering clear extension of criteria.
The limitations of the IGCEW method may be summarized as follows:
(1) It presents some subjective aspects during information gathering
and the establishment of limits of grey classes.
(2) The grey systems and Shannon entropy approaches are not
widely diffused compared to approaches based on fuzzy logic or
on statistics models.
(3) The calculations are a little tedious when processing data. This
could be improved by implementing a computer system.
(4) As it is a new approach it needs to be validated in other contexts
to improve its effectiveness.
References
Arun, E. (2008). Towards a shared systems model of stakeholders in
environmental conflict. International Transactions in Operations Research,
15, 239–253.
Baykasoğlu, A., & Gölcük, İ. (2015). Development of a novel multiple-
attribute decision making model via fuzzy cognitive maps and hierarchical
fuzzy TOPSIS. Information Sciences, 301, 75–98.
http://doi.org/10.1016/j.ins.2014.12.048.

Formulation of the proposed method|98
Bolin, B., Collins, T., & Darby, K. (2008). Fate of the verde: Water,
environmental conflict, and the politics of scale in Arizona’s central
highlands. Geoforum, 39(3), 1494–1511.
Correia, D. (2007). The sustained yield forest management act and the roots
of environmental conflict in Northern New Mexico. Geoforum, 38(5), 1040–
1051.
Fontaine, G. (2010). The effects of energy co-governance in Peru. Energy
Policy, 38(5), 2234–2244.
Karjalainen, T. P., & Järvikoski, T. (2010). Negotiating river ecosystems:
Impact assessment and conflict mediation in the cases of hydro-power
construction. Environmental Impact Assessment Review, 30(5), 319–327.
Kou, G., Sun, Q., & Peng, Y. (2011). An Entropy-Weighted Clustering
Method for Environmental Pollution Assessment in China. In Y. Shi, S.
Wang, G. Kou, & J. Wallenius (Eds.), New State of MCDM in the 21st
Century (pp. 177–188). Berlin: Springer.
Liu, S., & Lin, Y. (2010). Grey Systems: Theory and Applications. Berlin:
Springer.
Luyet, V., Schlaepfer, R., Parlange, M. B., & Buttler, A. (2012). A
framework to implement Stakeholder participation in environmental
projects. Journal of Environmental Management, 111, 213–219.
Prenzel, P. V, & Vanclay, F. (2014). How social impact assessment can
contribute to conflict management. Environmental Impact Assessment
Review, 45, 30–37.
Chapter III|99
Saqalli, M., Thiriot, S., & Amblard, F. (2010). Investigating social conflicts
linked to water resources trhough agent-based modelling. NATO Science
for Peace and Security Series, 75, 142–157.
Wittmer, H., Rauschmayer, F., & Klauer, B. (2006). How to select
instruments for the resolution of environmental conflicts? Land Use
Policy, 23(1), 1–9. http://doi.org/10.1016/j.landusepol.2004.09.003.
Yang, J., Ryan, C., & Zhang, L. (2013). Social conflict in communities
impacted by tourism. Tourism Management, 35, 82–93.
Zeleny, M. (1996). Multiple criteria decision making. New York: Springer.


CHAPTER IV
CASE STUDY: MINING PROJECT IN PERU


Chapter IV|103
4. Case study in Peru
Paper 2: Environmental conflict analysis using an integrated grey clustering and entropy-weight method: A case study of a mining project in Peru
Authors: Alexi Delgado(1),(2), I. Romero(1)
(1) Research Institute of Water and Environmental Engineering
(IIAMA), Universitat Politècnica de València, Valencia, Spain.
(2) Faculty of Science and Engineering, Universidad de Ciencias y
Humanidades, Lima, Peru.
Reference:
Delgado, Alexi; Romero, I. (2016). Environmental conflict analysis using an
integrated grey clustering and entropy-weight method: A case study of a
mining project in Peru. Environmental modelling and software. 77, 108-121:
doi: http://dx.doi.org/10.1016/j.envsoft.2015.12.011.
Editorial: ELSEVIER
Abstract
Environmental conflict analysis (henceforth ECA) has become a key factor
for the viability of projects and welfare of affected populations. In this
study, we propose an approach for ECA using an integrated grey clustering
and entropy-weight method (The IGCEW method). The case study
considered a mining project in northern Peru. Three stakeholder groups
and seven criteria were identified. The data were gathered by conducting
field interviews. The results revealed that for the groups urban population,
rural population and specialists, the project would have a positive, negative

Case study: Mining project in Peru|104
and normal social impact, respectively. We also noted that the criteria most
likely to generate environmental conflicts in order of importance were:
access to drinking water, poverty, GDP per capita and employment. These
results could help regional and central governments to seek appropriate
measures to prevent environmental conflicts. The proposed method
showed practical results and a potential for application to other types of
projects.
Keywords:
Grey clustering method.
Entropy-weight method.
Environmental conflict.
Social impact.
Mining project.
4.1 Introduction
Environmental conflicts often accompany the planning and
implementation of projects and programs, as evidenced by studies of
conflicts related to water management (Bolin et al., 2008; Saqalli et al., 2010),
energy (Fontaine, 2010; Karjalainen & Järvikoski, 2010), exploitation of
natural resources (Correia, 2007; Madani et al., 2014; Warnaars, 2012) or
ecological tourism (Yang et al., 2013). Therefore, organizations and
governments require techniques enabling them to assess social impact and
then, given this information, to propose measures for preventing
environmental conflicts (Barrow, 2010; Prenzel & Vanclay, 2014).
Organizations have obligation as part of their corporate social responsibility
to evaluate their social impact to prevent possible conflicts within the

Chapter IV|105
affected communities (Kemper, Schilke, Reimann, Wang, & Brettel, 2013).
Furthermore, governments are obligated to improve population welfare to
achieve sustainable development of countries; therefore, they must
measure social impact of their programs and state policies to prevent
possible conflicts (Franks & Vanclay, 2013). In addition, stakeholders are a
dimension of integrated assessment (Hamilton, ElSawah, Guillaume,
Jakeman, & Pierce, 2015), and environmental conflicts are generated
between stakeholder groups within communities, due to the differences in
the assessment of industrial projects (Arun, 2008; Luyet et al., 2012). For this
reason, social impact assessment must first be performed for each
stakeholder group and then the gap between the groups must be
determined in order to predict and prevent possible environmental
conflicts.
Thus far, ECA has been mostly carried out using qualitative methods such
as those described by Prenzel and Vanclay based on game theory (Prenzel
& Vanclay, 2014), who address environmental conflict from an
infrastructure development project, or by Griewald and Rauschmayer
based on a capability perspective (Griewald & Rauschmayer, 2014), who
consider environmental conflict in a protected nature area. In addition,
there are also quantitative methods for ECA, found, for example, in the
study by Al-Mutairi et al. based on fuzzy logic (Al-Mutairi, Hipel, & Kamel,
2008) of environmental conflict over aquifer contamination caused by a
chemical company. In this article, we apply a method for ECA combining
the grey clustering method and the entropy-weight method (The IGCEW
method), as an extension to the qualitative and quantitative methods.
The grey clustering method enables quantification of qualitative
information and classification of observed objects into definable classes, as

Case study: Mining project in Peru|106
well as verification of whether the observed objects belong to
predetermined classes – as shown by the studies of (L. N. Zhang et al., 2013),
who analysed a water rights allocation system, or by (Y. Zhang et al., 2014),
who classified innovation strategic alliances. It can be argued that the grey
clustering method is likely to benefit the first stage of ECA in that it helps
assess social impact by quantifying the qualitative information obtained
from stakeholder groups involved in a given environmental conflict.
In turn, the entropy-weight method is used to calculate objective weights of
criteria. If there is a large difference between the objects for a criterion
determined, this criterion can be regarded as an important factor for the
analysis of alternatives, as shown by the study of (Wang & Lee, 2009), who
resolved a software selection problem, or by (Kou et al., 2011), who assessed
a case of environmental pollution. In our view, the entropy-weight method
would benefit the final stage of ECA, as it allows researchers to determine
the criteria for which there is divergence between the stakeholder groups
involved in a conflict. The combination of both methods would be beneficial
for ECA because it integrates social impact assessment and divergent
criteria identification. To illustrate the method we propose, a case study was
conducted assessing the exploitation plans of a poly-metallic mine in
northern Peru. Three stakeholder groups were identified and a set of seven
criteria for ECA were established in the mining project.
The specific objectives of this article are to:
1. Apply the IGCEW method for ECA to the concrete context of the
exploitation plans of the poly-metallic mine in Peru.
2. Explore if the IGCEW method exhibits potential for other ECA
contexts.
Chapter IV|107
In section 4.2 the literature review is described. Section 4.3 provides the
details of the IGCEW method for ECA. In Section 4.4 the case study is
described, followed by the results and discussion in Section 4.5.
Conclusions are provided in Section 4.6.
4.2 Literature review
Environmental conflicts are characterized by the interaction between (1)
ecological and (2) social complexity (Wittmer et al., 2006).
(3) One central feature of environmental conflicts is the complexity of
the ecological system which is the natural base of the conflicts. Even
if its understanding is accompanied by a high degree of scientific
sophistication, there remains substantial uncertainty and ignorance.
Therefore, the process leading to the resolution of environmental
conflicts should take into account scientific and idiosyncratic
knowledge and should cope with unavoidable uncertainty and
ignorance. Certain forms of multi-criteria decision aid could satisfy
this demand (Wittmer et al., 2006).
(4) Another central feature of environmental conflicts is social
complexity. Some stakeholders are also actors who may impede the
implementation of a decision, or, put positively, their agreement is
necessary for a successful implementation of the decision. Social
complexity calls for stakeholder participation. Decision structuring
tools offer the possibility to make participatory decision processes
more transparent (Wittmer et al., 2006).
The resolution of environmental conflicts should concentrate on both
aspects, social and ecological complexity. (Wittmer et al., 2006) suggest
approaching both aspects by an intensive integration of stakeholders and

Case study: Mining project in Peru|108
multi-criteria analysis. However, environmental conflict is a social issue
and has high level of uncertainty. In addition, in classical multi-criteria
analysis methods, the importance degrees of criteria and the performance
scores of alternatives are assumed to be known precisely. Moreover, the
practical constraints of the real world hinder the use of crisp values. The
problems faced in practice occur in such an environment that the goals,
constraints and consequences of alternatives are not precise. Furthermore,
the ambiguities, uncertainties and vagueness inherent in decision makers’
evaluations necessitate the use of methods to model uncertainty in decision
problems (Baykasoğlu & Gölcük, 2015). There are many methods used to
model uncertainty in decision problems. Probabilistic approaches
(Augustsson, Filipsson, Öberg, & Bergbäck, 2011), fuzzy logic (Zadeh,
1965), and grey systems (S. Liu & Lin, 2010) are some examples of the
options used to model uncertainty.
The grey systems theory is a methodology for studying uncertainty
problems (Deng, 1985), in which there are limited information and small
samples (S. Liu & Lin, 2010). In order to explore the differences, we compare
grey systems with other main approaches, below.
Comparison between grey systems and probabilistic approaches
A comparison study between grey systems and probabilistic approaches
was performed in 1994 by (1) Jiangping Qiu and (2) Xisheng Hua
respectively, who established a theoretically delicate statistical regression
model and relatively coarse grey model based on the deformation and
leakage data of a certain large scale hydraulic dam. Their work shows that
their grey model provided a better fit than the statistical regression model.
When comparing the errors between the predictions of the two models with
the actual observations, it is found that the prediction accuracy of the grey

Chapter IV|109
model is generally better than that of the regression model, for more details
see Table 4.1 (S. Liu & Lin, 2010).
Table 4.1: Comparison of average error of a statistical model and a grey model.
Nº Type Average error
Statistical model Grey model
1
Horizontal displacement 0.862 0.809
Vertical displacement 1.024 1.029
Water level of pressure measurement
hole 6.297 3.842
2
Horizontal displacement 0.446 0.232
Vertical displacement 0.465 0.449
Water level of pressure measurement
hole 0.204 0.023
As shown in Table 4.1, we believe that a model based on grey system could
be more accurate than a statistical model. In addition, considering that
environmental conflict is a social issue and a very inconstant and subjective
topic, which requires a permanent analysis, and that one of the criteria for
evaluating methods for ECA is the cost (Wittmer et al., 2006), in this aspect
an approach based in grey systems would have a lower cost with respect to
a statistical approach, due to the fact that sample size influences the cost of
field research.
Comparison between grey systems and fuzzy logic approaches
Fuzzy mathematics emphasizes the investigation of problems with
cognitive uncertainty, where the research objects possess the characteristic
of clear intention and unclear extension. For example, the instance, “young
man” is a fuzzy concept, because everybody understands the idea of
“young man”. However, if you are going to determine the exact range

Case study: Mining project in Peru|110
within which everybody is young and outside which everybody is not
young, then you will find yourself in difficulty. This is because the concept
of young man does not have a clear extension. For this kind of problem of
cognitive uncertainty with clear intention and unclear extension, the
situation is dealt with in fuzzy mathematics by making use of experience
and the so-called membership function (S. Liu & Lin, 2010).
The focus of grey systems theory is on the uncertainty problems of small
samples and limited information which are difficult to handle for
probability and fuzzy mathematics. One of its characteristics is construct
models with small amounts of data. What is clearly different of fuzzy
mathematics is that grey systems theory emphasizes the investigation of
such objects which process clear extension and unclear intention. A
summary of the differences between these approaches is shown in Table 4.2
(S. Liu & Lin, 2010).
Table 4.2: Comparison between grey systems and fuzzy math methods.
Object Grey systems Fuzzy math
Research objects Poor information Cognitive uncertainty
Basic sets Grey hazy sets Fuzzy sets
Methods Information coverage Mapping
Procedures Sequence operator Cut set
Data requirement Any distribution Known membership
Emphasis Clear extension Clear intention.
Objective Laws of reality Cognitive expression
Characteristics Small sample Experience
Based on what is described above, we strongly believe that the grey
clustering method based on grey systems could be more convenient than an
Chapter IV|111
approach based on fuzzy logic, to analyse an environmental conflict, due to
the fact that we have clear extension and unclear intention of ECA criteria.
For example, in a historic range of five years, we know the minimum and
maximum value of a social variable under analysis. In addition, an affected
population within a determined project is clear about when things were
good or bad: before or after project implementation.
In turn, ECA should be performed considering stakeholder participation
(Wittmer et al., 2006), that is, identifying and analysing divergences
between stakeholder groups into the influence areas of a determined
project. In addition, social impact assessment and environmental conflict
prevention should be integrated (Franks & Vanclay, 2013), in order to
properly manage possible environmental conflicts during project
development. Stakeholders’ analysis is a social topic and has a lot of
uncertainty which could be dealt with by applying Shannon entropy theory.
Shannon entropy is a quantitative measurement of uncertainty (Kou et al.,
2011), which could help us to discern the divergence between stakeholder
groups. We strongly believe the entropy-weight method, based on Shannon
entropy theory, integrated with the grey clustering method could
contribute to ECA, as it integrates social impact assessment and
environmental conflict prevention, in a similar way and under the same
philosophy as grey systems. However, so far there has been more research
on fuzzy logic or on statistics models than on grey systems or Shannon
entropy, which could change to the extent that research based on grey
systems or Shannon entropy proposes a further development of the theory
and establishment of innovative methods in the different fields of
knowledge. Based on what has been discussed above, we summarize the
differences between the IGCEW method, proposed in this article, and other
principal approaches in Table 4.3.

Case study: Mining project in Peru|112
Table 4.3: Comparison between the IGCEW method and other main approaches.
Aspect The IGCEW method Approaches based
on fuzzy logic
Approaches based
on statistics
Epistemological
paradigm
Integrate qualitative and
quantitative paradigms.
Integrate qualitative and
quantitative paradigms.
Prioritize quantitative
paradigm.
Uncertainty
Focus on the uncertainty
problems of small samples and
limited information.
Investigation of problems
with cognitive
uncertainty.
Stochastic uncertainty.
Data
requirement Any distribution. Known membership. Typical distribution.
Emphasis of
research object
Clear extension and unclear
intention.
Clear intention and
unclear extension.
Revealing the
historical statistical
laws.
Objective of
research problem Laws of reality. Cognitive expression.
Historical statistical
laws.
Costs during
application
Low, due to the fact that a
small sample is used.
Medium, due to the fact
that experience is used.
High, due to the fact
that a large sample is
used.
The main advantages of the IGCEW method may be summarized as
follows:
(1) The grey clustering method and the entropy-weight method are
combined for the first time in ECA literature.
(2) The IGCEW method is more appropriate than other classical
approaches based on multi-criteria analysis, as it considers
uncertainty within its analysis.
(3) The IGCEW method integrates social impact assessment and
environmental conflict prevention, performing an analysis of
stakeholder groups.
(4) The IGCEW method is more effective and has a lower cost than
other statistical approaches during its application.

Chapter IV|113
(5) The IGCEW method is more convenient than other approaches
based on fuzzy logic, as it analyses environmental conflict
considering clear extension of criteria for ECA.
4.3 Method
This section provides a summary of the grey clustering method and of the
entropy-weight method, followed by details of the IGCEW method for
ECA.
4.3.1 Grey clustering method based on CTWF
The grey clustering method is based on grey system theory, originally
developed by (Deng, 1985). The grey system is a theory which focuses on
the study of problems involving small samples and limited information (S.
Liu & Lin, 2010). In the real world there are many problems of this type,
determining a broad range of applicability of the theory of grey systems, for
example:
Evaluation of web sites (Bindu et al., 2010),
Transport management (Leng et al., 2012),
Water management (L. N. Zhang et al., 2013),
Safety management (Li et al., 2015; Wei, Zhou, Wang, & Wu, 2015).
The grey clustering method was developed for classifying observation
indices or observation objects into definable classes using grey incidence
matrices or grey whitenization weight functions. The grey clustering
method using whitenization weight functions is mainly applied to test
whether the objects of observation belong to predetermined classes, so that
they can be treated accordingly (S. Liu & Lin, 2010). In this article, we use
the grey clustering method based on center-point triangular whitenization

Case study: Mining project in Peru|114
weight functions (CTWF) because stakeholder groups can be treated as
observation objects for ECA. In addition, since respondents tend to be more
certain about the center-point of a grey class as compared with other points
within the class, conclusions based on such cognitive certainty are more
scientific and reliable (S. Liu & Lin, 2010). This fact is important for
collecting information from stakeholder groups and for assessing
objectively the social impact they may be affected by.
The grey clustering method based on CTWF is developed according to the
following definition.
Definition 1. Assume that there are a set of m objects, a set of n criteria and
a set of s different grey classes, according to the sample value xij (i=1, 2 ,…,
m; j=1, 2, …, n) of the ith (i=1, 2, …, m) object, for the criterion j (j=1, 2, …,
n). The steps for grey clustering based on CTWF can be expressed as follows
(S. Liu & Lin, 2010; Y. Zhang et al., 2014):
Step 1: The individual ranges of the criteria are divided into s grey classes,
and then center-points λ1, λ2,…, λs of grey classes 1, 2, …, s are determined.
Step 2: The grey classes are expanded in two directions, adding the grey
classes 0 and (s+1) with their center-points λ0 and λs+1 respectively.
Therefore, the new sequence of center-points is established λ0, λ1, λ2,…, λs,
λs+1 (see Figure 4.1). The CTWF for the kth grey class, k=1, 2,…, s, of the jth
criterion, j=1, 2,…, n, for an observed value 𝑥𝑖𝑗 is defined by Equation (4.1).
𝑓𝑗𝑘(𝑥𝑖𝑗) =
{
0 , 𝑥 ∉ [𝜆𝑘−1, 𝜆𝑘+1]
𝑥 − 𝜆𝑘−1𝜆𝑘 − 𝜆𝑘−1
, 𝑥 ∈ [𝜆𝑘−1 , 𝜆𝑘]
𝜆𝑘+1 − 𝑥
𝜆𝑘+1 − 𝜆𝑘, 𝑥 ∈ [𝜆𝑘 , 𝜆𝑘+1]
(4.1)

Chapter IV|115
Figure 4.1: Center-point triangular whitenization weight functions (CTWF).
Step 3: The comprehensive clustering coefficient 𝜎𝑖𝑘, for object i, i=1, 2,…, m,
with respect to the grey class k, k=1,…, s is calculated by Equation (4.2).
𝜎𝑖𝑘 =∑𝑓𝑗
𝑘(𝑥𝑖𝑗). 𝜂𝑗 (4.2)
𝑛
𝑗=1
where 𝑓𝑗𝑘(𝑥𝑖𝑗) is the CTWF of the kth grey class of the jth criterion, and ηj is
the weight of criterion j.
Step 4: If *
}{max1
k
i
k
isk
, we decide that object i belongs to grey class k*.
When there are several objects in grey class k*, these objects can be ordered
according to the magnitudes of their comprehensive clustering coefficients.
4.3.2 Entropy-weight method
The entropy-weight method is based on Shannon entropy, originally
developed by Shannon (Shannon & Weaver, 1947). Shannon entropy is a
concept which is proposed as a measure of uncertainty in information,
formulated in terms of probability theory. Since the concept of entropy is
well suited to measuring the relative intensities of contrast criteria in order
to represent the average intrinsic information transmitted for decision-
making (Zeleny, 1996), it is an appropriate and convenient choice for our
𝒙
𝑦 = 𝑓𝑗1
𝜆0
0
1
𝒚
𝑦 = 𝑓𝑗2 𝑦 = 𝑓𝑗
𝑘 𝑦 = 𝑓𝑗𝑠
𝜆1 𝜆2 𝜆3 𝜆𝑘−1 𝜆𝑘 𝜆𝑘+1 𝜆𝑠−1 𝜆𝑠 𝜆𝑠+1

Case study: Mining project in Peru|116
purpose. Subsequent research on Shannon entropy has contributed to the
resolution of a range of problems in areas such as:
Clinical neurophysiology (Cao & Slobounov, 2011),
Transport systems (Chen et al., 2014),
Environmental time series data (Srivastav & Simonovic, 2014),
Fault detection (Bafroui, Ohadi, Heidari Bafroui, & Ohadi, 2014).
Shannon developed measure H which satisfies the following properties for
all pi within an estimated joint probability distribution P (Shemshadi et al.,
2011; Zitnick & Kanade, 2004):
1. H is a continuous positive function;
2. If all pi are equal, pi=1/n , then H should be a monotonic increasing
function of n; and,
3. For all,
𝑛 ≥ 2,𝐻(𝑝1, 𝑝2, … , 𝑝𝑛) = ℎ(𝑝1 + 𝑝2, 𝑝3, … , 𝑝𝑛) + (𝑝1 + 𝑝2)𝐻(𝑝1
𝑝1+𝑝2,𝑝2
𝑝1+𝑝2)
Shannon showed that the only function which satisfies these properties is:
𝐻𝑆ℎ𝑎𝑛𝑛𝑜𝑛 = −∑𝑝𝑖𝑙𝑜𝑔(𝑝𝑖)
𝑛
𝑖
(4.3)
where: 0 ≤ 𝑝𝑖 ≤ 1; ∑ 𝑝𝑖 = 1𝑛𝑗=1
For a certain criterion, if there is a large difference between the alternatives,
the criterion will give decision makers a large amount of information and
the criterion can be regarded as an important factor (Kou et al., 2011). It can
thus be argued that the entropy-weight method can be applied in ECA to

Chapter IV|117
determine those criteria for which there is divergence between the
compared stakeholder groups.
The entropy-weight method is developed according to the following
definition.
Definition 2. Assume that there are m objects for evaluation and each has n
evaluation criteria, which form decision matrix 𝑍 = {𝑧𝑖𝑗; 𝑖 = 1, 2, … ,𝑚; 𝑗 =
1, 2, … , 𝑛}. Then, the steps of the entropy-weight method can be expressed
as follows (Fagbote et al., 2014; Ji et al., 2015; Wang & Lee, 2009; Xie & Yang,
2011):
Step 1: The decision matrix 𝑍 = {𝑧𝑖𝑗; 𝑖 = 1, 2, … ,𝑚; 𝑗 = 1, 2, … , 𝑛} is
normalized for each criterion Cj (j=1, 2,..., n). The normalized values Pij are
calculated by Equation (4.4).
𝑃𝑖𝑗 =𝑧𝑖𝑗
∑ 𝑧𝑖𝑗𝑚𝑖=1
(4.4)
Step 2: The entropy Hj of each criterion Cj is calculated by Equation (4.5).
𝐻𝑗 = −𝑘∑𝑃𝑖𝑗
𝑚
𝑖=1
𝑙𝑛(𝑃𝑖𝑗) (4.5)
k is a constant, let k = (ln(m))-1.
Step 3: The degree of divergence divj of the intrinsic information in each
criterion Cj is calculated by Equation (4.6).
𝑑𝑖𝑣𝑗 = 1 −𝐻𝑗 (4.6)
Step 4: The entropy weight wj of each criterion Cj is calculated by Equation
(4.7).

Case study: Mining project in Peru|118
𝑤𝑗 =𝑑𝑖𝑣𝑗
∑ 𝑑𝑖𝑣𝑗𝑛𝑗=1
(4.7)
4.3.3 Integration of the grey clustering and entropy-weight methods
The IGCEW method for ECA combines the grey clustering method based
on CTWF and the entropy-weight method, as illustrated in Figure 4.2.
Figure 4.2: Schema of the IGCEW method for ECA
Step 3 Percentage system
Step 5 Objective assessment
Step 4 Entropy-weight method
Grey clustering method based on CTWF
The IGCEW method for ECA
Step 1 Criteria and grey classes
Step 2 CTWF and comprehensive clustering coefficient

Chapter IV|119
The IGCEW method for ECA can be described using the following sets:
1. A set of m objects or stakeholder groups called G = {G1, G2,..., Gm}
2. A set of n criteria called C = {C1, C2,..., Cn}
3. A set of s grey classes called V = {V1, V2,..., Vs}
4. A set of evaluation values called X = {xij, i = 1, 2,..., m; j = 1, 2,..., n}
of Gi (i = 1, 2,..., m) with respect to criterion Cj (j = 1, 2,..., n).
The steps are described below:
Step 1: Criteria and grey classes. A set of n criteria and a set of s grey classes
for ECA are established based on the characteristics of the project under
scrutiny.
Step 2: CTWF and comprehensive clustering coefficient. The values of CTWF for
each stakeholder group are calculated using Equation (4.1). Then, the
comprehensive clustering coefficient 𝝈𝒊𝒌 for object i, i=1, 2,…, m, with
respect to the grey class k, k=1,…, s, is calculated using Equation (4.2).
Step 3: Percentage system. The social impact assessment of each stakeholder
group is presented as a percentage system (Chang et al., 2009), defined by
values α1, α2, α3,…, and αs, where αs=100, α1=100/s, α2=α1+α1, α3=α1+α2,…, and αs-
1=α1+αs-2 ; s is the number of grey classes established. The results are given
by Equation (4.8).
𝑧𝑗𝑖 =∑𝑓𝑗
𝑘(𝑥𝑖𝑗). α𝑘
𝑠
𝑘=1
(4.8)

Case study: Mining project in Peru|120
where 𝑓𝑗𝑘(𝑥𝑖𝑗) is the CTWF of the kth grey class of the jth criterion and 𝛼𝑘 is
the percentage value of each grey class. The results are represented by a
matrix determined by Equation (4.9).
𝑍 = {𝑧𝑖𝑗, 𝑖 = 1, 2, … ,𝑚; 𝑗 = 1, 2, … , 𝑛} (4.9)
Step 4: Entropy-weight method. First, matrix 𝑍 = {𝑧𝑖𝑗 , i = 1, 2, … ,m; j =
1, 2, … , n} is normalized for each criterion Cj (j=1, 2,..., n). The normalized
values Pij are calculated using Equation (4.4). Then, Hj, divj and wj are
calculated using Equations (4.5), (4.6) and (4.7).
Step 5: Objective assessment. The final stage of the ECA is the calculation of
objective assessment (Shemshadi et al., 2011) regarding each stakeholder
group i, i=1, 2,…, m, for each criterion Cj (j=1, 2,..., n). The objective
assessment value is defined by Equation (4.10).
𝑄𝑖𝑗 = 𝑤𝑗𝑧𝑖𝑗 (4.10)
where 𝑤𝑗 is the entropy weight of each criterion Cj and zij is the result of the
social impact assessment for each stakeholder group i, i=1, 2,…, m. The
results are represented by a matrix determined by Equation (4.11).
𝑄𝑖𝑗 = [
𝑤1𝑧11 𝑤2𝑧12𝑤1𝑧21 𝑤2𝑧22
… 𝑤𝑛𝑧1𝑛… 𝑤𝑛𝑧2𝑛
⋮ ⋮𝑤1𝑧𝑚1 𝑤2𝑧𝑚2
⋱ ⋮ … 𝑤𝑛𝑧𝑚𝑛
] (4.11)
The first three steps of the IGCEW method for ECA correspond to social
impact assessment, developed in accordance with the grey clustering
method based on CTWF and represented by a percentage system. Then,
entropy-weight and objective assessment are applied, which identify the

Chapter IV|121
criteria for which there is the greatest divergence between the stakeholder
groups.
In order to illustrate and validate the IGCEW method for ECA we
conducted a case study described below.
4.4 Case study
In order to test the IGCEW method, we performed an ECA of the expansion
plans of a poly-metallic mine in northern Peru, in the department of
Cajamarca (Figure 4.3). Our study measured the social impact of this project
on the zone of influence and, based on the results, determined the criteria
likely to generate environmental conflicts between the identified
stakeholder groups.

Case study: Mining project in Peru|122
Source: Retrieved from (Wikimedia Commons, 2014)
Figure 4.3: Cajamarca, Peru.
4.4.1 Stakeholder Groups
Our field work identified three different stakeholder groups (k=3), and the
composition of these groups was determined on the basis of the similarities
found during the overall assessment of the expansion plans of the mine. The
sample size in each group was established by the principle of saturation of
discourse, which stipulates that information gathering should end when
respondents no longer contribute new observations (Corbetta, 2007). The
stakeholder groups were defined as follows:

Chapter IV|123
G1: Urban population
This group was composed of citizens from the urban areas near the
exploitation site. They expressed a generally favourable opinion towards
the mining project, and tended to stress the importance of private
investment for the resolution of social problems. This group was made up
of one hundred and fifteen interviewees.
G2: Rural population
This group was composed of citizens from the rural areas near the
exploitation site, consisting of people undertaking productive activities
related to agriculture and livestock. The group of rural population had a
generally adverse opinion of the mining project and was made up of one
hundred and five interviewees.
G3: Specialists
This group was composed of professionals from different fields who were
familiar with the area of influence and the characteristics of the
environmental and social impacts of the mining project, and who
manifested a generally neutral assessment of the mining project. This group
was made up of thirty-five interviewees.
4.4.2 Calculations
The calculations for the case study, based on the steps detailed above,
proceeded as follows.

Case study: Mining project in Peru|124
Step 1: Criteria and grey classes
The ECA criteria in the studied case were established by taking into account
the economic and social situation of the area of influence and the
characteristics of the evaluated mining project, as well as consultations with
experts. Initially, during the exploratory study, certain criteria were
submitted by stakeholders, such as unexpected death of livestock, lack of
health facilities, subsidies for traditional celebrations in the area, and road
construction. But these criteria were discarded in the analysis as they were
not directly related to the project or were already covered by other
previously defined criteria. Seven criteria (n=7) were identified as shown in
Table 4.4.
Table 4.4: ECA criteria identified in the case study.
Criterion Code Description
GDP per capita C1 The GDP per capita as soles per month (annual average)
in the department of Cajamarca.
Employment rate C2 The employment rate per year in the department of
Cajamarca.
Poverty rate C3 The poverty rate per year in the region.
Number of
inhabitants per
doctor (GP)
C4 The number of inhabitants per doctor (GP) per year in
the department of Cajamarca.
Enrolment rate in
primary education C5
The enrolment rate per year in primary education in the
region.
Number of
reported crimes C6
The number of reported crimes per year in the
department of Cajamarca.
Access to drinking
water rate C7
The access to drinking water rate per year in the
department of Cajamarca.

Chapter IV|125
Five grey classes (Very Negative, Negative, Normal, Positive and Very
Positive) were established for the mining project on the basis of historical
information about the 2009-2013 social indicators provided by the Peru
government (INEI, 2014) and a qualitative analysis of the consultations with
experts – in order to satisfy the need to reflect the social impact of the
specific region as accurately as possible (S. Liu & Lin, 2010). It was decided
that the criteria had the same weight (ηj = 0.143), inasmuch as they were all
social criteria (Corbetta, 2007). The grey classes established for each of the
seven criteria are shown in Table 4.5.
Table 4.5: Grey classes for each criterion determined in the case study.
Code
Grey classes
Very Negative
(V1)
Negative
(V2)
Normal
(V3)
Positive
(V4)
Very Positive
(V5)
C1 611 ≤ x11 ≤ 690 690 ≤ x1
2 ≤ 768 768 ≤ x13 ≤ 847 847 ≤ x1
4 ≤ 926 926 ≤ x15 ≤ 1004
C2 61.8 ≤ x21 ≤ 66.2 66.2 ≤ x2
2 ≤ 70.7 70.7 ≤ x23 ≤ 75.1 75.1 ≤ x2
4 ≤ 79.6 79.6 ≤ x25 ≤ 84.0
C3 45.4 ≤ x31 ≤ 52.5 38.3 ≤ x3
2 ≤ 45.4 31.2 ≤ x33 ≤ 38.3 24.1 ≤ x3
4 ≤ 31.2 17.0 ≤ x35 ≤ 24.1
C4 2651 ≤ x41 ≤ 3026 2276 ≤ x4
2 ≤ 2651 1901 ≤ x43 ≤ 2276 1526 ≤ x4
4 ≤ 1901 1151 ≤ x45 ≤ 1526
C5 93.0 ≤ x51 ≤ 93.9 93.9 ≤ x5
2 ≤ 94.8 94.8 ≤ x53 ≤ 95.7 95.7 ≤ x5
4 ≤ 96.6 96.6 ≤ x55 ≤ 97.5
C6 7651 ≤ x61≤ 9075 6226 ≤ x6
2 ≤ 7651 4802 ≤ x63 ≤ 6226 3377 ≤ x6
4 ≤ 4802 1953 ≤ x65 ≤ 3377
C7 55.1 ≤ x71 ≤ 61.8 61.8 ≤ x7
2 ≤ 68.5 68.5 ≤ x73 ≤ 75.2 75.2 ≤ x7
4 ≤ 81.9 81.9 ≤ x75 ≤ 88.6
Step 2: CTWF and the comprehensive clustering coefficient
The data obtained from the stakeholder groups were evaluated using
CTWF. The grey classes were extended in two directions by adding classes
V0 and V6 (“extra negative” and “extra positive”, respectively), and their
center-points λ0 and λ6 were determined. Therefore, there was a new
sequence of center-points, λ0, λ1, λ2, λ3, λ4, λ5 and λ6, as shown in Table 4.6
and Figure 4.4.

Case study: Mining project in Peru|126
Table 4.6: Center-points of the extended grey classes in the case study.
Criteria
Center-points of the extended grey classes
Extra Negative
impact (λ0)
Very Negative
impact (λ1)
Negative
impact (λ2)
Normal
impact (λ3)
Positive
impact (λ4)
Very Positive
impact (λ5)
Extra Positive
impact (λ6)
C1 572 651 729 808 886 965 1044
C2 59.6 64.0 68.5 72.9 77.4 81.8 86.3
C3 56.0 48.9 41.8 34.7 27.6 20.5 13.4
C4 3213 2838 2463 2088 1713 1338 963
C5 92.5 93.4 94.3 95.2 96.1 97.0 97.9
C6 9788 8363 6939 5514 4090 2665 1241
C7 51.7 58.4 65.1 71.8 78.5 85.2 91.9
Figure 4.4: CTWF in the case study.
To illustrate, for the first criterion C1 (j=1), shown in the first row of Table
4.5 and Table 4.6, we first had the grey classes V1= [611; 690], V2= [690; 768],
V3= [768; 847], V4= [847; 926], and V5= [926; 1004], with their center-points
being λ1=651, λ2=729, λ3=808, λ4=886 and λ5=965. The grey classes were
then expanded in two directions by adding the grey classes V0= [533; 611]
and V6= [1004; 1083], with their center-points being λ0=572 and λ6=1044.
Thus, we obtained a new sequence of center-points: λ0, λ1, λ2, λ3, λ4, λ5 and
𝜆6 𝜆0
Very Positive impact
𝑦 = 𝑓𝑗5
Very Negative impact 𝑦 = 𝑓𝑗
1
𝒙
𝒚 Positive impact 𝑦 = 𝑓𝑗
4
Normal impact 𝑦 = 𝑓𝑗
3
Negative impact 𝑦 = 𝑓𝑗
2
𝜆1 𝜆2 𝜆3 𝜆4 𝜆5
0
1

Chapter IV|127
λ6. The values were substituted into Equation (4.1), and the CTWF of the
five grey classes were then obtained. The results for the first criterion Cj
(j=1) are shown in Equations (4.12), (4.13), (4.14), (4.15) and (4.16):
𝑓11(𝑥) =
{
0, 𝑥 ∉ [572 , 729]𝑥 − 572
79, 𝑥 ∈ [572 , 651]
729 − 𝑥
78, 𝑥 ∈ [651 , 729]
(4.12)
𝑓12(𝑥) =
{
0, 𝑥 ∉ [651 , 808]𝑥 − 651
78, 𝑥 ∈ [651 , 729]
808 − 𝑥
79, 𝑥 ∈ [729 , 808]
(4.13)
𝑓13(𝑥) =
{
0, 𝑥 ∉ [729 , 886]𝑥 − 729
79, 𝑥 ∈ [729 , 808]
886 − 𝑥
78, 𝑥 ∈ [808 , 886]
(4.14)
𝑓14(𝑥) =
{
0, 𝑥 ∉ [808 , 965]𝑥 − 808
78, 𝑥 ∈ [808 , 886]
965 − 𝑥
79, 𝑥 ∈ [886 , 965]
(4.15)
𝑓15(𝑥) =
{
0, 𝑥 ∉ [886 , 1044]𝑥 − 886
79, 𝑥 ∈ [886 , 965]
1044 − 𝑥
79, 𝑥 ∈ [965 , 1044]
(4.16)
The data was collated by means of a field study carried out in the area of
influence of the mining project. The information from the stakeholder
groups was gathered via direct interviews using a structured questionnaire

Case study: Mining project in Peru|128
based on the evaluation criteria and the grey classes established. The
questions used in the questionnaire are presented in Table 4.7.
Table 4.7: Questions used in the questionnaire.
Question
Grey classes
Very
Negative
(V1)
Negative
(V2)
Normal
(V3)
Positive
(V4)
Very Positive
(V5)
1 What effect would the project have on
the economic income per person?
Decrease
noticeably Decrease
No
effect Increase
Increase
noticeably
2 What effect would the project have on
the employment rate?
Decrease
noticeably Decrease
No
effect Increase
Increase
noticeably
3 What effect would the project have on
the poverty rate?
Increase
noticeably Increase
No
effect Decrease
Decrease
noticeably
4 What effect would the project have on
the number of inhabitants per doctor
(GP)?
Increase
noticeably Increase
No
effect Decrease
Decrease
noticeably
5 What effect would the project have on
the enrolment rate in primary
education?
Decrease
noticeably Decrease
No
effect Increase
Increase
noticeably
6 What effect would the project have on
the number of reported crimes?
Increase
noticeably Increase
No
effect Decrease
Decrease
noticeably
7 What effect would the project have on
the access to drinking water?
Decrease
noticeably Decrease
No
effect Increase
Increase
noticeably
Table 4.8 shows the overall results of the evaluation of the three stakeholder
groups (m = 3) with respect to each criterion. The data were aggregated
using arithmetic means (Aznar & Guijarro, 2012).

Chapter IV|129
Table 4.8: Aggregated values for each criterion for groups G1, G2 and G3.
Group C1 C2 C3 C4 C5 C6 C7
G1 929 80.3 23 1777 95.9 4578 83
G2 689 67.6 45 2324 94.7 6369 60
G3 902 78.2 29 1788 95.2 5799 69
By way of illustration, for group G1 the values of CTWF were calculated
using Equations (4.12), (4.13), (4.14), (4.15) and (4.16). Subsequently, the
comprehensive clustering coefficient (𝝈𝒊𝒌) was calculated for each
stakeholder group using Equation (4.2). The values of CTWF and
𝝈𝒊𝒌 obtained for group G1 (m=1) are shown in Table 4.9.
Table 4.9: Values of CTWF and 𝝈𝒊𝒌 for group G1.
𝒇𝒋𝒌(𝒙) C1 C2 C3 C4 C5 C6 C7 𝝈𝒊
𝒌
𝒇𝒋𝟏(𝒙) 0.00 0.00 0.00 0.00 0.00 0.00 0.00 0.00
𝒇𝒋𝟐(𝒙) 0.00 0.00 0.00 0.00 0.00 0.00 0.00 0.00
𝒇𝒋𝟑(𝒙) 0.00 0.00 0.00 0.17 0.23 0.34 0.00 0.11
𝒇𝒋𝟒(𝒙) 0.46 0.34 0.31 0.83 0.77 0.66 0.29 0.52
𝒇𝒋𝟓(𝒙) 0.54 0.66 0.69 0.00 0.00 0.00 0.71 0.37
Identical procedure was applied to the other groups in the case study.
Step 3: Percentage system
The social impact assessment for the case study was presented as a
percentage system, defined by values α1, α2, α3, α4, and α5, where α5=100,
α1=100/5=20, α2=α1+α1=40, α3=α1+α2=60 and α4=α1+α3=80, according to the
grey classes established (s=5). The results are given in Table 4.10. To
illustrate, the values of social impact assessment for group G1 were
calculated using Equation (4.8), as shown in Table 4.11.

Case study: Mining project in Peru|130
Table 4.10: The percentage system established in the case study.
Social impact class Interval αk
Very negative [20, 30] 20
Negative [30, 50] 40
Normal [50, 70] 60
Positive [70, 90] 80
Very positive [90, 100] 100
Table 4.11: Social impact assessment for group G1.
Impact class
αk C1 C2 C3 C4 C5 C6 C7 Total
Very negative
20 0.00 0.00 0.00 0.00 0.00 0.00 0.00 0.00
Negative 40 0.00 0.00 0.00 0.00 0.00 0.00 0.00 0.00
Normal 60 0.00 0.00 0.00 10.29 13.71 20.57 0.00 6.37
Positive 80 36.57 27.43 25.14 66.29 61.71 52.57 22.86 41.80
Very positive
100 54.29 65.71 68.57 0.00 0.00 0.00 71.43 37.14
90.86 93.14 93.71 76.57 75.43 73.14 94.29 85.31
Very positive
Very positive
Very positive
Positive Positive Positive Very positive
Positive
The values of social impact assessment for groups G2 and G3 were obtained
using the same procedure as for group G1. A complete summary of all the
results is shown in Table 4.12.
Table 4.12: Social impact assessment for groups G1, G2 and G3.
Group C1 C2 C3 C4 C5 C6 C7 Tota
l Impact class
G1 90.86 93.14 93.71 76.57 75.43 73.14 94.29 85.31 Positive impact
G2 29.71 36.00 29.71 47.43 48.00 48.00 25.71 37.80 Negative impact
G3 84.00 84.00 76.00 76.00 60.00 56.00 52.00 69.71 Normal impact

Chapter IV|131
Step 4: Entropy-weight method
We next proceeded to apply the entropy-weight method part. First, the
criteria values shown in Table 4.12 were normalized using Equation (4.4),
the normalized values are given in Table 4.13. Then, Hj, divj and wj were
calculated using Equations (4.5), (4.6) and (4.7). The results are given in
Table 4.14.
Table 4.13: Normalized values of SIA of groups G1, G2 and G3.
Group C1 C2 C3 C4 C5 C6 C7
G1 0.44 0.44 0.47 0.38 0.41 0.41 0.55
G2 0.15 0.17 0.15 0.24 0.26 0.27 0.15
G3 0.41 0.39 0.38 0.38 0.33 0.32 0.30
Table 4.14: Values of Hj, divj and wj for each criterion in the case study.
C1 C2 C3 C4 C5 C6 C7
𝑯𝒋 0.92 0.94 0.92 0.98 0.98 0.99 0.89
𝒅𝒊𝒗𝒋 0.08 0.06 0.08 0.02 0.02 0.01 0.11
𝒘𝒋 0.21 0.16 0.21 0.05 0.04 0.04 0.29
Step 5: Objective assessment
The ECA was completed by calculating objective assessment for each
stakeholder group i, i=1, 2, 3, for each criterion Cj (j=1, 2, 3, 4, 5, 6, 7), using
Equation (4.10). The results are shown in Table 4.15.
Table 4.15: Objective assessment scores for each group in the case study.
Group C1 C2 C3 C4 C5 C6 C7
G1 19.43 14.98 20.05 3.91 2.94 2.63 26.90
G2 6.36 5.79 6.36 2.42 1.87 1.72 7.34
G3 17.97 13.51 16.26 3.88 2.34 2.01 14.84

Case study: Mining project in Peru|132
4.5 Results and Discussion
The results and discussion are presented below in accordance with the two
main objectives of this article.
4.5.1 The case study
The detailed calculations for the case study produced three important
findings, which we discuss below.
First, the IGCEW method helped to identify major tensions among the
stakeholder groups. Figure 4.5 (based on Table 4.12) shows the score of
social impact assessment for each stakeholder group: for group G1 (urban
population) the score was 85.31 (positive impact), for group G2 (rural
population) it was 37.80 (negative impact) and for group G3 (specialists) it
was 69.71 (normal impact). These results suggest a strong antagonism
between groups G1 and G2, despite the specialists (G3) expressing the
opinion that the mining project would have an acceptable degree of social
impact. The results for G3 indicate that the mining project would not
generate dramatic social problems, but the directly affected populations, as
represented by groups G1 and G2, presented contradictory views of the
project, the difference suggesting potential conflicts between G1 and G2
groups. In order to analyse and more fully understand the mechanisms and
forces at play, we need to look at the specific criteria of conflict between G1
and G2, which points to our second important finding.

Chapter IV|133
Figure 4.5: Total social impact assessment of G1, G2 and G3.
The second interesting finding in our case study analysis is that the
behaviour of the criteria is considerably different across the affected groups.
Figure 4.6, derived from Table 4.12, shows the results of social impact
assessment for each criterion. For group G1, the criteria C1, C2, C3 and C7 are
placed in the range of “very positive impact” (90-100), and the criteria C1,
C5 and C6 occur in the range of “positive impact” (70-90). In addition, for
group G2, the criteria C1, C3 and C7 are found in the range of “very negative
impact” (20-30), and the criteria C2, C4, C5 and C6 in the range of “negative
impact” (30-50). These results pose a need for a closer comparison of all
these criteria in order to identify the most controversial ones among them.
85.31
37.80
69.71
0
20
40
60
80
100
G1 G2 G3
So
cia
l im
pa
ct a
sses
smen
t

Case study: Mining project in Peru|134
Figure 4.6: Social impact assessment for each criterion for groups G1 and G2.
It is at this stage that our third finding and the entropy-weight method
proved useful. We were able to identify the most divergent criteria
implying the most potential causes of conflict between the affected
stakeholder groups. Figure 4.7, based on Table 4.15, shows that the
stakeholder groups converge for criteria C4 (number of inhabitants per
doctor (GP)), C5 (Enrolment rate in primary education) and C6 (number of
reported crimes), while they diverge for criteria C1 (GDP per capita), C2
(employment rate), C3 (poverty rate) and C7 (access to drinking water rate).
The criteria with the greatest divergence are related to access to drinking
water, poverty, GDP per capita and employment, in that order. It would
thus appear that these four issues should first be taken into account when
implementing measures to prevent environmental conflict over the mining
project analysed. In addition, Figure 4.7 also shows that the criterion with
the greatest divergence is related to access to drinking water (C7). This very
issue is especially problematic due to G2’s strongly expressed belief that the
mining company’s planned activity would contribute greatly to the
contamination of the water sources.
90.86
93.14
93.71
76.57
75.43
73.14
94.29
0 20 40 60 80 100
C1
C2
C3
C4
C5
C6
C7
Social impact assessment (G1)
29.71
36.00
29.71
47.43
48.00
48.00
25.71
0 20 40 60 80 100
C1
C2
C3
C4
C5
C6
C7
Social impact assessment (G2)

Chapter IV|135
Figure 4.7: Objective assessment for each criterion for groups G1 and G2.
4.4.1.1 Sensitivity Analysis
The IGCEW method is flexible, versatile and adjustable due to the fact that
the number of stakeholder groups and number of ECA criteria are
determined according to the particularities of the project under scrutiny. In
the case studied in this article, we determined seven criteria and three
stakeholder groups.
The IGCEW method is sensitive to number and type of stakeholder groups.
For example, in our case study, if we were to include the environmental
advocacy stakeholder group, see Figure 4.8, the mining project would have
very negative total impact, as in the opinion of this stakeholder group the
mining project is completely non-viable (Sánchez, 2011). If we were to
include the government stakeholder group or the company stakeholder
group the mining project would have very positive total impact, as in the
opinion of these stakeholder groups the mining project is completely viable
(Knight Piésold, 2010; MINAM, 2011b). In this study, we excluded the
0
5
10
15
20
25
30
C1 C2 C3 C4 C5 C6 C7
Obj
ecti
ve
ass
essm
ent
G1 G2

Case study: Mining project in Peru|136
environmental advocacy, government and company stakeholder groups, as
these stakeholders groups distort the results; in addition, they are not the
directly affected population (Wittmer et al., 2006).
Source: retrieved from (El Comercio, 2015)
Figure 4.8: Environmental advocacy stakeholder group.
4.4.1.2 Analysis of diverging criteria
The mining project, commonly called Conga, consists of Newmont Mining
Corporation (51.35%), Compañía de Minas Buenaventura (43.65%), and the
World Bank’s International Finance Corporation (5%). The planned
duration of the mining process is 19 years, including 2 years of construction
and 17 years in operation. The standard annual operation consists of the
removal of overburden (topsoil and rocks) in order to obtain low-grade
metal ores, which are then concentrated using a combination of physical
and chemical processes that entail the very intense use of water (Silva-
Macher & Farrell, 2014).
In order to establish some measures to prevent environment conflict in the
mining project, we analyse the context of the diverging criteria below.

Chapter IV|137
Access to drinking water
Access to drinking water is the most controversial criterion, in terms of the
quantity and quality of the water supply to rural and urban areas. The
mining project is placed at the headwaters of five important watersheds. In
addition, the mining company plans to use four natural lagoons, the lagoon
El Perol among them, see Figure 4.9. These lagoons will be emptied, the first
two for mineralogical use and the last two for waste rock dumps (MINAM,
2011b). The mining company proposes building four water reservoirs,
enough to replace the volumes of the natural lagoons and satisfy the
demands of rural and urban areas (Knight Piésold, 2010).
Source: retrieved from (Celendín libre, 2015)
Figure 4.9: Lagoon “El Perol”, Cajamarca-Perú.
On the one hand, the urban stakeholder group strongly believes that there
will be no problems with the quality and quantity of water for urban areas
and the economic benefits to the city will be much more advantageous. On
the other hand, the rural stakeholder group strongly believes that there will
be problems with the quality and quantity of water for rural areas, as the
mining company has caused serious environmental damage in previous
projects developed in the area (Grufides, 2015), see Figure 4.10. In addition,
the mining company conducted an environmental impact assessment (EIA)
in 2010 (Knight Piésold, 2010), in order to show the viability of the project.
However, the rural stakeholder group believes that it is not transparent, as

Case study: Mining project in Peru|138
the mining company hired a consulting company to conduct the EIA, even
though this is permitted by Peruvian law. This perception was present in
all controversial criteria.
Source: retrieved from (Red verde, 2011)
Figure 4.10: Water conflict on the channel “Quinua”, Cajamarca-Peru.
Poverty
In the department of Cajamarca, about 68% of the population lives in rural
areas, hence it is one of the most rural regions of Peru (De Echave & Diez,
2013). In addition, in the Sierra region of Peru, where the department of
Cajamarca lies, poverty is 34.7%, higher than the average in the country,
which stands at 23.9%. In the Sierra rural area poverty is 52.9% and in the
Sierra urban area it is 16.2% (INEI, 2014).
The urban stakeholder group believes that the mining project will reduce
the level of poverty, as it will generate direct and indirect economic income
for families. While the rural stakeholder group, despite the fact that it has
higher rates of poverty, believes the project will make them poorer, as it will
destroy their economic base, which is based on agriculture and livestock.

Chapter IV|139
GDP per capita
In the department of Cajamarca, in 1990, agricultural activity, with 42% of
total production, was the mainstay of the regional economy, and mining
accounted for only 5.9% of total production. In 2010 agricultural activity
decreased to 20.1% and mining increased to 20.2%. In addition trade
activities, hostelry and manufacturing also increased. This growth mainly
benefited urban areas (De Echave & Diez, 2013).
The urban stakeholder group believes that the GDP per capita in the cities
will grow, as there will be much more investment in trade activities and
other activities in urban areas. The rural stakeholder group does not believe
that the GDP per capita in the rural areas will grow, due to the fact that they
do not have other economic alternatives to agriculture and livestock, which
will be affected by the mining project.
Employment
In recent years mining in Peru has experienced notable growth due to
government promoted reforms on investment in mining. However, this
economic sector does not generate significant direct employment, as it
requires specialized labour. However, the mining industry generates
indirect economic movement in other areas such as trade and services,
which provides indirect employment (De Echave & Diez, 2013).
The urban stakeholder group strongly believes that the mining project will
generate employment in urban areas, as there will be growth in economic
sectors such as trade and services; in addition, the mining company affirms
that it will train and hire people from the villages around the project area
(Knight Piésold, 2010). However, the rural stakeholders group believes that
when the mining project ends, it will leave serious environmental damage,

Case study: Mining project in Peru|140
and it will not be possible to use the land for agriculture or livestock, which
means job losses in the rural area.
Based on what is analysed above, we believe that in order to prevent
environmental conflict the following measures could be implemented:
Due to the fact that the rural population has lost confidence in the
mining company and central government, we propose the
implementation of a permanent committee of environmental and
social monitoring, in which the rural population is represented.
We propose a change in legislation, so that EIA is not conducted or
contracted by the mining company and that EIA must be contracted
by the government and with the agreement of the affected
population and the mining company.
The mining company should study and consider other alternatives,
which do not involve the use of natural lagoons, due to the fact that
they provide ecological balance in the area and also represent the
main causes of conflict over water.
Taxes collected by the implementation of the project should be
invested in social development projects in the area of influence, so
that the population is able to perceive the benefits of the project.
Diversification of economic activities in rural areas in order to create
jobs to improve agriculture and livestock and take advantage of
opportunities in the context of mining.
The mining company and the government should explain and
demonstrate to the directly affected population, that environmental
and social impacts will be mitigated when the mining project is
finished.

Chapter IV|141
4.4.2 The broader potential of the IGCEW method
ECA methods are mainly developed as part of qualitative and quantitative
approaches. In order to discuss the potential of the IGCEW method, we
compare it below with the qualitative methods and then with the
quantitative methods.
First, we believe that the IGCEW method for ECA illustrated in this article
could contribute to the improvement of the qualitative methods of ECA. For
example, the study developed by (Griewald & Rauschmayer, 2014) or by
(Prenzel & Vanclay, 2014), both conducted using qualitative methods, could
be supplemented by applying the grey clustering method based on CTWF,
which quantifies the qualitative information obtained from the stakeholder
groups and then by a percentage system establishing a ranked order of
social impact assessment for each stakeholder group. This knowledge can
allow researchers to study environmental conflicts more accurately,
because the procedure provides numerical information easy to analyse and
to establish comparisons between the stakeholder groups involved in a
given conflict.
Second, the IGCEW method for ECA applied in this article would also
contribute to the improvement of the quantitative methods. For example,
the study developed by (Al-Mutairi et al., 2008), conducted under a
quantitative method, could be supplemented by applying the entropy-
weight method, which identifies the criteria with the greatest divergence
factor between the stakeholder groups, and thus helps to define the causes
of environmental conflict more closely, enabling researchers to find more
accurate measures of conflict prevention.

Case study: Mining project in Peru|142
4.6 Conclusions
The application of the IGCEW method for ECA to the mining project in Peru
has made it possible to quantify the qualitative information provided by the
three stakeholder groups identified, allowing us to establish the values of
social impact for each stakeholder group objectively. In addition, the
application of the IGCEW method determined the divergent criteria most
likely to produce environmental conflicts between the stakeholder groups.
The specific results obtained, we believe, could help analysts in the mining
company or in the Peruvian government to seek appropriate measures to
prevent conflict over the mining project.
We also strongly believe that the IGCEW method for ECA described in this
article could be applied as an extension to the qualitative and quantitative
methods for ECA, as it provides quantitative information of social impact
for each stakeholder group by applying the grey clustering method based
on CTWF. In addition, the results from the entropy-weight method can
show clearly the criteria most likely leading to environmental conflicts.
The limitations of the IGCEW method may be summarized as follows:
(1) It presents subjective aspects during information gathering and
the establishment of limits of grey classes.
(2) The grey systems and Shannon entropy approaches are not
widely diffused compared to approaches based on fuzzy logic or
on statistics models.
(3) The calculations are a little tedious when processing data. This
could be improved by implementing a computer system.
(4) As it is a new approach it needs to be validated in other contexts
to improve its effectiveness.

Chapter IV|143
In future research, the IGCEW method for ECA could be applied to other
types of projects, such as water resources management, industrial projects,
public construction projects, hydrocarbons exploitation projects, as well as
be used to measure the social impact of public policies or governmental
programs of conflict prevention.
Acknowledgments
This paper was reviewed by Przemysław Kaszubski, PhD, from the Faculty
of English at the Adam Mickiewicz University in Poznan, Poland. The
authors would like to thank him for his valuable comments and
suggestions.
References
Al-Mutairi, M., Hipel, K., Kamel, M., 2008. Fuzzy preferences in conflicts.
J. Syst. Sci. Syst. Eng. 17, 257-276.
Arun, E., 2008. Towards a shared systems model of stakeholders in
environmental conflict. Int. Trans. Oper. Res.15, 239-253.
Augustsson, A., Filipsson, M., Öberg, T., Bergbäck, B., 2011. Climate change - An uncertainty factor in risk analysis of contaminated land. Sci. Total Environ. 409, 4693-4700.
Aznar, J., Guijarro, F., 2012. Nuevos Métodos De Valoración, Modelos
Multicriterio, 2ª ed. Universitat Politèctica de València, Valencia.
Barrow, C.J., 2010. How is environmental conflict addressed by SIA?
Environ. Impact Assess. Rev. 30, 293-301.
Baykasoglu, A., Gölcük, I., 2015. Development of a novel multiple-attribute
decision making model via fuzzy cognitive maps and hierarchical
fuzzy TOPSIS. Inform. Sciences. 301, 75-98.

Case study: Mining project in Peru|144
Bindu, C., Padmaja, M., Chandulal, J.A., 2010. Evaluating Web Sites Based
on GHAP. Int. J. Computer Sci. Eng. 2, 674-679.
Bolin, B., Collins, T., Darby, K., 2008. Fate of the verde: Water,
environmental conflict, and the politics of scale in Arizona‟s central
highlands. Geoforum. 39, 1494-1511.
Cao, C., Slobounov, S., 2011. Application of a novel measure of EEG non-
stationarity as Shannon-entropy of the peak frequency shifting for
detecting residual abnormalities in concussed individuals. Int. J.
Clin. Neuropsyc. 122, 1314-1321.
Celendín libre, 2015. Lagoon “El Perol”, Cajamarca-Perú. Retrieved from.
https://celendinlibre.files.wordpress.com/2011/10/laguna-
perol.jpg
Chang, Z., Qisen, Z., 2009. The assessment of the social, economic, and
environmental impacts of expressway construction projects based on
the DFGF Algorithm., Management and Service Science. MASS '09.
International Conference On, Wuhan. 1-5.
Chen, S., Leng, Y., Mao, B., Liu, S., 2014. Integrated weight-based multi-
criteria evaluation on transfer in large transport terminals: A case
study of the Beijing South Railway Station. Transport. Res. A-Pol. 66,
13-26.
Corbetta, P., 2007. Metodología y Técnicas de Investigación Social.
McGRAW-HILL, Madrid.

Chapter IV|145
Correia, D., 2007. The sustained yield forest management act and the roots
of environmental conflict in Northern New Mexico. Geoforum. 38,
1040-1051.
De Echave, J., Diez, A., 2013. Más allá de Conga. Red Peruana por una
Globalización con Equidad - RedGE, Lima – Perú.
Deng, J., 1985. Generation functions of grey systems. Fuzzy Mathematics.
5, 11-22.
El Comercio, 2015. Enfrentamiento en Cajamarca deja un consejero regional herido. Retrieved from. http://elcomercio.pe/peru/cajamarca/enfrentamiento-conga-deja-consejero-regional-herido-noticia-1808009?ref=flujo_tags_322786&ft=nota_3&e=titulo
Fagbote, E.O., Olanipekun, E.O., Uyi, H.S., 2014. Water quality index of
the ground water of bitumen deposit impacted farm settlements
using entropy weighted method. Int. J. Environ. Sci. Technol. 11, 127-
138.
Fontaine, G., 2010. The effects of energy co-governance in Peru. Energy
Policy. 38, 2234-2244.
Franks, D.M., Vanclay, F., 2013. Social Impact Management Plans:
Innovation in corporate and public policy. Environ. Impact Assess.
Rev. 43, 40-48.
Griewald, Y., Rauschmayer, F., 2014. Exploring an environmental conflict
from a capability perspective. Ecol. Econ. 100, 30-39.
Grufides, 2015. Observatorio de conflictos Cajamarca, conflicto minero Conga. Retrieved from. http://www.grufides.org/sites/default/files//Documentos/fichas_casos/CONFLICTO%20MINERO%20CONGA.pdf.

Case study: Mining project in Peru|146
Hamilton, S.H., ElSawah, S., Guillaume, J.H., Jakeman, A.J., Pierce, S.A., 2015. Integrated assessment and modelling: Overview and synthesis of salient dimensions. Environ. Modell. Softw. 64, 215-229.
Heidari Bafroui, H., Ohadi, A., 2014. Application of wavelet energy and
Shannon entropy for feature extraction in gearbox fault detection
under varying speed conditions. Neurocomputing. 133, 437-445.
INEI, 2014. Instituto Nacional de Estadística e Informática del Perú. 2014.
Retrieved from http://www.inei.gob.pe/
Ji, Y., Huang, G.H., Sun, W., 2015. Risk assessment of hydropower stations
through an integrated fuzzy entropy-weight multiple criteria
decision making method: A case study of the Xiangxi River. Expert
Syst. Appl. 42, 5380-5389.
Karjalainen, T.P., Järvikoski, T., 2010. Negotiating river ecosystems:
Impact assessment and conflict mediation in the cases of hydro-
power construction. Environ. Impact Assess. Rev. 30, 319-327.
Kemper, J., Schilke, O., Reimann, M., Wang, X., Brettel, M., 2013.
Competition-motivated corporate social responsibility. J. Bus. Res.
66, 1954-1963.
Knight Piésold, 2010. Estudio de Impacto Ambiental. Proyecto Conga.
Minera Yanacocha S.R.L.. Perú.
Kou, G., Sun, Q., Peng, Y., 2011. An Entropy-Weighted Clustering Method
for Environmental Pollution Assessment in China, in Shi, Y., Wang,
S., Kou, G., Wallenius, J. (Eds.), New State of MCDM in the 21st
Century. Springer, Berlin, pp. 177-188.

Chapter IV|147
Leng, Y., Kou, C., Zhou, N., Li, Q., Liang, Y., Xu, Z., Chen, S., 2012.
Evaluation on Transfer Efficiency at Integrated Transport Terminals
through Multilevel Grey Evaluation. Procedia - Social and
Behavioral Sciences. 43, 587-594.
Li, C., Chen, K., Xiang, X., 2015. An integrated framework for effective
safety management evaluation: Application of an improved grey
clustering measurement. Expert Syst. Appl. 42, 5541-5553.
Liu, S., Lin, Y., 2010. Grey Systems: Theory and Applications. Springer,
Berlin.
Luyet, V., Schlaepfer, R., Parlange, M.B., Buttler, A., 2012. A framework to
implement Stakeholder participation in environmental projects. J.
Environ. Manage. 111, 213-219.
Madani, K., Rouhani, O., Mirchi, A., Gholizadeh, S., 2014. A negotiation
support system for resolving an international trans-boundary
natural resource conflict. Environ. Modell. Softw. 51, 240-249.
MINAM, 2011. Ministerio del Ambiente. Informe Nº 001-2011. Perú.
Prenzel, P.V., Vanclay, F., 2014. How social impact assessment can
contribute to conflict management. Environ. Impact Assess. Rev. 45,
30-37.
Red verde, 2011. Water conflict on the “Quinua” channel. Retrieved from.
http://caballeroredverde.blogspot.com.es/2011/09/usuario-de-
canal-quinua-marchan-en.html

Case study: Mining project in Peru|148
Sánchez, W., 2011. ¿Por qué el proyecto conga es inviable?. Universidad
Nacional de Cajamarca. Perú. Retrieved from.
http://slideplayer.es/slide/4378756/.
Saqalli, M., Thiriot, S., Amblard, F., 2010. Investigating social conflicts
linked to water resources trhough agent-based modelling. NATO
Science for Peace and security series 75, 142- 157.
Shannon, C.E., Weaver, W., 1947. The Mathematical Theory of
Communication. Urbana, The University of Illinois Press.
Shemshadi, A., Shirazi, H., Toreihi, M., Tarokh, M.J., 2011. A fuzzy
VIKOR method for supplier selection based on entropy measure for
objective weighting. Expert Syst. Appl. 38, 12160-12167.
Silva-Macher, J.C., Farrell, K.N., 2014. The flow/fund model of Conga:
exploring the anatomy of environmental conflicts at the Andes–
Amazon commodity frontier. Environ. Dev. Sustain. 16, 747-768.
Srivastav, R., Simonovic, S., 2014. An analytical procedure for multi-site,
multi-season streamflow generation using maximum entropy
bootstrapping. Environ. Modell. Softw. 59, 59- 75.
Wang, T., Lee, H., 2009. Developing a fuzzy TOPSIS approach based on
subjective weights and objective weights. Expert Syst. Appl. 36, 8980-
8985.
Warnaars, X.S., 2012. Why be poor when we can be rich? Constructing
responsible mining in El Pangui, Ecuador. Resour. Policy. 37, 223-
232.

Chapter IV|149
Wei, J., Zhou, L., Wang, F., Wu, D., 2015. Work safety evaluation in
Mainland China using grey theory. Appl. Math. Model. 39, 924-933.
Wikimedia Commons, 2014. File: Peru_-_(template).svg. Retrieved from.
http://es.wikipedia.org/wiki/Departamento_de_Cajamarca#medi
aviewer/File:Peru_-_Cajamarca_Department_(locator_map).svg
Wittmer, H., Rauschmayer, F., Klauer, B., 2006. How to select instruments
for the resolution of environmental conflicts?. Land Use Policy. 23, 1-
9.
Xie, M., Yang, Y., 2011. Cost Risk Assessment of Construction Projects
Based on Entropy- Weighted Matter-Element Model. Adv. Mat. Res.
168-170, 2402-2405.
Yang, J., Ryan, C., Zhang, L., 2013. Social conflict in communities impacted
by tourism. Tourism. Manage. 35, 82-93.
Zadeh, L.A., 1965. Fuzzy sets. Inform. Control. 8, 338-353.
Zeleny, M., 1996. Multiple Criteria Decision Making. Springer, New York.
Zhang, Y., Ni, J., Liu, J., Jian, L., 2014. Grey evaluation empirical study
based on center-point triangular whitenization weight function of
Jiangsu Province industrial technology innovation strategy alliance.
Grey Systems: Theory and Application 4, 124-136.
Zhang, L.N., Wu, F.P., Jia, P., 2013. Grey Evaluation Model Based on
Reformative Triangular Whitenization Weight Function and Its
Application in Water Rights Allocation System. The Open
Cybernetics & Systemics Journal 7, 1-10.

Case study: Mining project in Peru|150
Zitnick, L., Kanade, T., 2004. Maximum Entropy for Collaborative Filtering.
In ACM Proceedings of the 20th Conference on Uncertainty in Artificial
Intelligence, 636-643.

CHAPTER V
CASE STUDY: HYDROCARBON EXPLORATION IN SPAIN


Chapter V|153
5. Case study in Spain
Paper 3: Integrating social impact assessment and environmental conflict analysis on a hydrocarbon exploration project in the gulf of Valencia, Spain.
Authors: Alexi Delgado(1),(2), I. Romero(1)
(1) Research Institute of Water and Environmental Engineering
(IIAMA), Universitat Politècnica de València, Valencia, Spain.
(2) Faculty of Science and Engineering, Universidad de Ciencias y
Humanidades, Lima, Peru.
Reference:
Delgado, Alexi; Romero, I. (2016). Integrating social impact assessment and
environmental conflict analysis on a hydrocarbon exploration project in the
gulf of Valencia, Spain. Ocean & Coastal Management. Under review.
Editorial: ELSEVIER
Abstract
Social impact assessment (SIA) has become a key factor for environmental
conflicts prevention, which makes necessary to integrate SIA and
environmental conflict analysis (ECA). In this study, we integrate SIA and
ECA using a method based on grey systems and Shannon entropy. A case
study was conducted on a hydrocarbon exploration project located in the
Sea of the Gulf of Valencia, Spain. Four stakeholder groups and four criteria
were identified. The results revealed that for group of specialists the project
would have negative social impact; and contrary perceptions were found

Case study: Hydrocarbon exploration in Spain|154
between the group of those directly affected and the group of citizens in
favour. It was also noted that the criteria most likely to generate
environmental conflicts were the percentage of unemployment and GDP
per capita. These results could help central and community governments to
make the best decision on the project within of the use management of the
gulf of Valencia, Spain. The method showed interesting results and could
be apply to manage other projects or programs in coastal areas or ocean
areas from point of view of social factors.
Keywords:
Social impact assessment
Environmental conflict analysis
Grey systems - Shannon entropy
Coastal and ocean management
Gulf of Valencia in Spain
5.1. Introduction
Social impact assessment (SIA) is an important factor to prevent
environmental conflicts caused by implantation of investment projects
(Prenzel & Vanclay, 2014). Qualitative methods are available for SIA, as
evidenced by studies based on public participation (Tang, Wong, & Lau,
2008), or game theory (van der Voort & Vanclay, 2015). In addition, there
are quantitative methods for environmental impact assessment and SIA,
which can be found in studies based on fuzzy logic (Kim, Jang, & Lee, 2013;
Peche & Rodríguez, 2011), or Delphi and fuzzy (Chang, Qisen, Zheng, &
Zhang, 2009). In this study, we apply the grey clustering method (The GC
method), which is based on grey systems theory, to conduce SIA.

Chapter V|155
The GC method is an approach that considers the uncertainty within its
analysis, and also it enables the classification of observed objects into
definable classes, called grey classes (S. Liu & Lin, 2010), as evidenced by
the studies on a water rights allocation system (L. N. Zhang, Wu, & Jia,
2013), or the classification of innovation strategic alliances (Y. Zhang, Ni,
Liu, & Jian, 2014). In this article, we argue that the GC method could benefit
SIA, as SIA is a topic with high level of uncertainty.
Moreover, environmental conflict analysis (ECA) also is a key factor to
prevent conflicts during planning and implementation of projects and
programs, as evidenced by the studies on conflicts related to ecological
tourism (Yang, Ryan, & Zhang, 2013), or water management (Bolin, Collins,
& Darby, 2008; Saqalli, Thiriot, & Amblard, 2010). ECA has been mostly
conducted using qualitative methods, as showed by the study on
environmental conflict from an infrastructure project (Prenzel & Vanclay,
2014), which was based on the capability perspective. In addition, there are
also quantitative methods for ECA, as evidenced by the study on
environmental conflict over aquifer contamination (Al-Mutairi, Hipel, &
Kamel, 2008), which was based on fuzzy logic. In this study, we apply the
entropy-weight method (the EW method) to conduce ECA.
The EW method is based on Shannon entropy theory. Shannon entropy is a
concept proposed as a measure of uncertainty (Zeleny, 1996). This
determines a wide range of application for the EW method, as shown by the
studies to resolve a software selection problem (Wang & Lee, 2009), or to
asses a case of environmental pollution (Kou, Sun, & Peng, 2011). We
believe that the EW method could contribute to ECA, as it would help to
identify controversial criteria under the same philosophy of the GC method.

Case study: Hydrocarbon exploration in Spain|156
Furthermore, stakeholders are an important dimension of integrated
assessment (Hamilton, ElSawah, Guillaume, Jakeman, & Pierce, 2015), and
environmental conflicts are generated between stakeholder groups within
affected population (Arun, 2008; Luyet, Schlaepfer, Parlange, & Buttler,
2012). This makes that SIA should first be conducted for each stakeholder
group and then the differences between them should be determined in
order to prevent possible environmental conflicts (Prenzel & Vanclay,
2014). In this study, we integrate SIA and ECA using the GC method and
the EW method (The integrated method) (Delgado & Romero, 2015).
Subsequently, in order to apply and test the IGCEW method, we conducted
a study of SIA and ECA on a hydrocarbon exploration project in the Gulf of
Valencia, Spain.
The specific objectives of this article are to:
1. Integrate SIA and ECA using the GC method and the EW method.
2. Apply the integrated method to the concrete context of the
hydrocarbon exploration project in the Gulf of Valencia, Spain.
Section 5.2 provides details of the methodology to integrate SIA and ECA.
In Section 5.3 the case study is described, followed by the results and
discussion in Section 5.4. Conclusions are provided in Section 5.5.
5.2. Methodology
This section describes SIA using the GC method, ECA using the EW
method, and provides the details of the integrated method for SIA and ECA.

Chapter V|157
5.2.1. SIA using the GC method
SIA is characterized by its high level of uncertainty (Wittmer, Rauschmayer,
& Klauer, 2006). Therefore, SIA should be conducted by a method, which
considers the uncertainly.
Some classical approaches of multi-criteria analysis, such as Delphi
(Campos-Climent, Apetrei, & Chaves-Ávila, 2012; Landeta, 2002) or
analytic hierarchy process (AHP) (Saaty, 1980; Sadeghi & Ameli, 2012), do
not consider the uncertainty within their analysis, due to the fact that the
importance degrees of criteria and the performance scores of alternatives
are assumed to be known precisely (Baykasoğlu & Gölcük, 2015). Moreover,
some options to model the uncertainly can be fuzzy logic approaches
(Rouyendegh & Erkan, 2012), probabilistic approaches (Augustsson,
Filipsson, Öberg, & Bergbäck, 2011) or grey systems approaches (S. Liu &
Lin, 2010).
Grey systems theory established by Julong Deng focuses on the study of
problems for which there are small samples or limited information available
(Deng, 1985). In the real world, there are many uncertain systems with small
samples or limited information, this fact determines a broad range of
applicability of the grey systems. For example:
1. Geographical information systems (Wu, Lin, Peng, & Huang, 2012),
2. Health management (Yu, Wang, & Chengwu, 2013),
3. Optimization (Cui, Liu, Zeng, & Xie, 2013),
4. Safety management (Wei, Zhou, Wang, & Wu, 2015).
Approaches based on fuzzy logic, such as fuzzy analytic hierarchy process
(FAHP) (Rouyendegh & Erkan, 2012; Zadeh, 1965), emphasize the
investigation of problems with cognitive uncertainty, where the research

Case study: Hydrocarbon exploration in Spain|158
objects possess the characteristic of clear intention and unclear extension.
The focus of approaches based on grey systems theory is on the uncertainty
problems, where the research objects possess the characteristic of unclear
intention and clear extension (S. Liu & Lin, 2010). SIA has clear extension of
the criteria on a determined study, for example, in a historic range of five
years, we can know the minimum and maximum value of a social variable
under analysis. In addition, affected population within a determined project
could be clear about when things were good or bad: before or after project
implementation (Delgado & Romero, 2015).
In turn, in statistical approaches the concept of large samples represents the
degree of tolerance to incompleteness (S. Liu & Lin, 2010), and considering
that one of the criteria for evaluating methods can be the cost (Wittmer et
al., 2006), in this aspect an approach based in grey systems would have a
lower cost with respect to a statistical approach, due to the fact that sample
size influences on the cost during the field work. In addition, in 1994,
Jiangping Qiu and Xisheng Hua established a comparison between
statistical regression model and grey model on the deformation and leakage
data of a certain large scale hydraulic dam. Their work showed that their
grey model could provide a better fit than the statistical regression model
(S. Liu & Lin, 2010).
Therefore, it could be argued that the GC method based on grey systems
theory would benefit SIA, as it considers the uncertainty within its analysis.
In addition, the grey clustering method would be more adequate than
approaches based on fuzzy logic, as it considers clear extension for
evaluation criteria. Furthermore, the GC method could be more effective
and would have a lower cost than other statistical approaches during its
application.
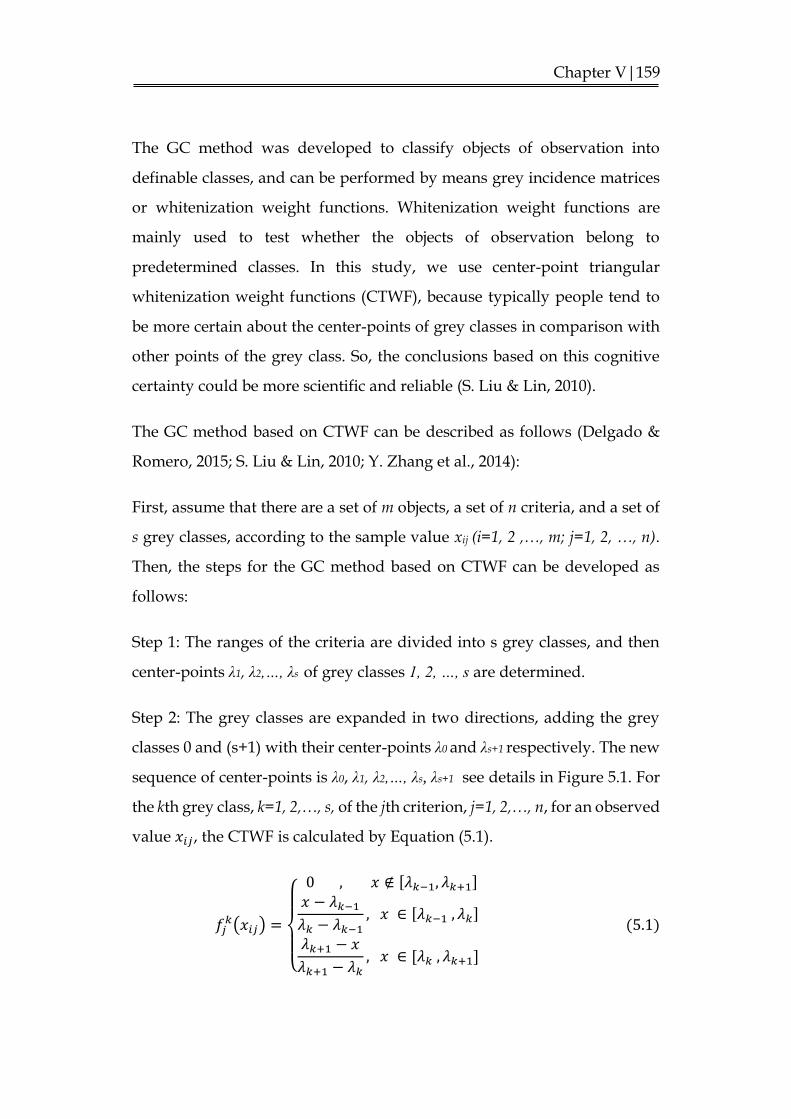
Chapter V|159
The GC method was developed to classify objects of observation into
definable classes, and can be performed by means grey incidence matrices
or whitenization weight functions. Whitenization weight functions are
mainly used to test whether the objects of observation belong to
predetermined classes. In this study, we use center-point triangular
whitenization weight functions (CTWF), because typically people tend to
be more certain about the center-points of grey classes in comparison with
other points of the grey class. So, the conclusions based on this cognitive
certainty could be more scientific and reliable (S. Liu & Lin, 2010).
The GC method based on CTWF can be described as follows (Delgado &
Romero, 2015; S. Liu & Lin, 2010; Y. Zhang et al., 2014):
First, assume that there are a set of m objects, a set of n criteria, and a set of
s grey classes, according to the sample value xij (i=1, 2 ,…, m; j=1, 2, …, n).
Then, the steps for the GC method based on CTWF can be developed as
follows:
Step 1: The ranges of the criteria are divided into s grey classes, and then
center-points λ1, λ2,…, λs of grey classes 1, 2, …, s are determined.
Step 2: The grey classes are expanded in two directions, adding the grey
classes 0 and (s+1) with their center-points λ0 and λs+1 respectively. The new
sequence of center-points is λ0, λ1, λ2,…, λs, λs+1 see details in Figure 5.1. For
the kth grey class, k=1, 2,…, s, of the jth criterion, j=1, 2,…, n, for an observed
value 𝑥𝑖𝑗, the CTWF is calculated by Equation (5.1).
𝑓𝑗𝑘(𝑥𝑖𝑗) =
{
0 , 𝑥 ∉ [𝜆𝑘−1, 𝜆𝑘+1]
𝑥 − 𝜆𝑘−1𝜆𝑘 − 𝜆𝑘−1
, 𝑥 ∈ [𝜆𝑘−1 , 𝜆𝑘]
𝜆𝑘+1 − 𝑥
𝜆𝑘+1 − 𝜆𝑘, 𝑥 ∈ [𝜆𝑘 , 𝜆𝑘+1]
(5.1)

Case study: Hydrocarbon exploration in Spain|160
Figure 5.1: CTWF (S. Liu & Lin, 2010).
Step 2: The comprehensive clustering coefficient 𝜎𝑖𝑘 for object i, i=1, 2,…, m,
with respect to the grey class k, k=1, 2,…, s, is calculated by Equation (5.2).
𝜎𝑖𝑘 =∑𝑓𝑗
𝑘(𝑥𝑖𝑗). 𝜂𝑗 (5.2)
𝑛
𝑗=1
where 𝑓𝑗𝑘(𝑥𝑖𝑗) is the CTWF of the kth grey class of the jth criterion, and ηj is
the weight of criterion j.
Step 4: If *
}{max1
k
i
k
isk
, we decide that object i belongs to grey class k*.
When there are several objects in grey class k*, these objects can be ordered
according to the magnitudes of their comprehensive clustering coefficients.
5.2.2. ECA using the EW method
ECA is a social topic, which also has high level of uncertainty. ECA could
be conducted by classical multi-criteria methods (Wittmer et al., 2006), or
by statistical approaches (S. Liu & Lin, 2010). However, classical multi-
criteria methods do not consider the uncertainty within their analysis
(Baykasoğlu & Gölcük, 2015). In addition, statistical approaches would
have high cost during the field work (Wittmer et al., 2006).
𝒙
𝑦 = 𝑓𝑗1
𝜆0
0
1
𝒚
𝑦 = 𝑓𝑗2 𝑦 = 𝑓𝑗
𝑘 𝑦 = 𝑓𝑗𝑠
𝜆1 𝜆2 𝜆3 𝜆𝑘−1 𝜆𝑘 𝜆𝑘+1 𝜆𝑠−1 𝜆𝑠 𝜆𝑠+1

Chapter V|161
A good option for ECA could be the EW method, which is based on
Shannon entropy theory. Shannon proposed the concept of entropy as a
measure of uncertainty in information, formulated in terms of probability
theory (Shannon & Weaver, 1947). The concept of entropy is well suited to
identify the contrast criteria for decision-making (Zeleny, 1996). This fact
determines that Shannon entropy has made contributions to the resolution
of problems, in areas such as:
Pollution (Ainslie, Reuten, Steyn, Le, & Zidek, 2009),
Water quality (L. Liu, Zhou, An, Zhang, & Yang, 2010),
Management (Shemshadi, Shirazi, Toreihi, & Tarokh, 2011),
Fault detection (Bafroui, Ohadi, Heidari Bafroui, & Ohadi, 2014).
ECA could be conducted by the EW method, as it considers uncertainty
within its analysis, and under the same philosophy as the GC method. In
addition, the EW method would benefit ECA, as it could help to researchers
to determine the criteria for which there is divergence between stakeholder
groups involved in a determined conflict (Kou et al., 2011).
The EW method can be developed as follows (Delgado & Romero, 2015;
Fagbote, Olanipekun, & Uyi, 2014; Ji, Huang, & Sun, 2015):
First, assume that there are m objects for evaluation and n evaluation
criteria, which form the decision matrix 𝑍 = {𝑧𝑖𝑗; 𝑖 = 1, 2, … ,𝑚; 𝑗 =
1, 2, … , 𝑛}. Then, the steps of the EW method can be expressed as follows:
Step 1: The decision matrix 𝑍 = {𝑧𝑖𝑗; 𝑖 = 1, 2, … ,𝑚; 𝑗 = 1, 2, … , 𝑛} is
normalized for each criterion Cj (j=1, 2,..., n). The normalized values Pij are
calculated by Equation (5.3).

Case study: Hydrocarbon exploration in Spain|162
𝑃𝑖𝑗 =𝑧𝑖𝑗
∑ 𝑧𝑖𝑗𝑚𝑖=1
(5.3)
Step 2: The entropy Hj of each criterion Cj is calculated by Equation (5.4).
𝐻𝑗 = −𝑘∑𝑃𝑖𝑗
𝑚
𝑖=1
𝑙𝑛(𝑃𝑖𝑗) (5.4)
k is a constant, let k = (ln(m))-1.
Step 3: The degree of divergence divj of each criterion Cj is calculated by
Equation (5.5).
𝑑𝑖𝑣𝑗 = 1 −𝐻𝑗 (5.5)
Step 4: The entropy weight wj of each criterion Cj is calculated by Equation
(5.6).
𝑤𝑗 =𝑑𝑖𝑣𝑗
∑ 𝑑𝑖𝑣𝑗𝑛𝑗=1
(5.6)
The combination of the GC method and the EW method could integrate SIA
and ECA. Firs, the GC method assesses social impact by quantifying of
information from stakeholders groups. And then, the EW method identifies
criteria, for which, there is the most divergence between stakeholders
groups within of project under scrutiny.
5.2.3. Integration of SIA and ECA using the IGCEW method
The IGCEW method consists of five steps, of which the first three
correspond to SIA, which are based on the GC method; and the final two
correspond to ECA, which are based on the EW method, as shown in Figure
5.2.
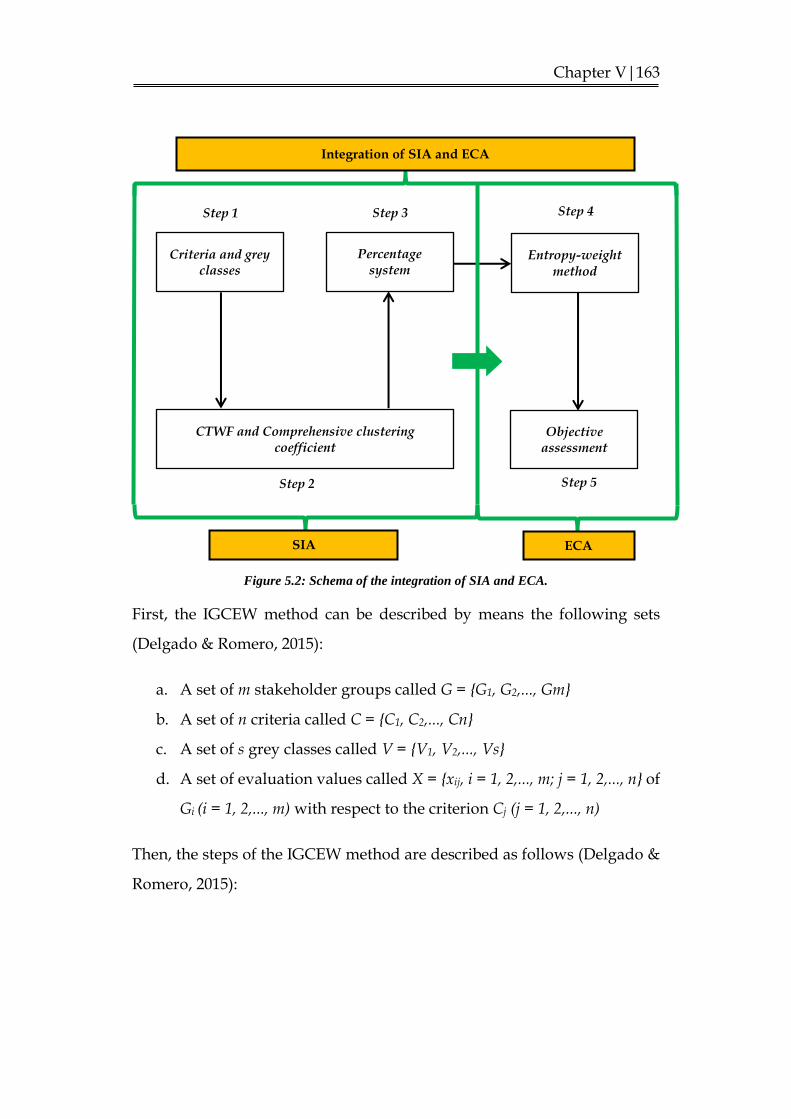
Chapter V|163
Figure 5.2: Schema of the integration of SIA and ECA.
First, the IGCEW method can be described by means the following sets
(Delgado & Romero, 2015):
a. A set of m stakeholder groups called G = {G1, G2,..., Gm}
b. A set of n criteria called C = {C1, C2,..., Cn}
c. A set of s grey classes called V = {V1, V2,..., Vs}
d. A set of evaluation values called X = {xij, i = 1, 2,..., m; j = 1, 2,..., n} of
Gi (i = 1, 2,..., m) with respect to the criterion Cj (j = 1, 2,..., n)
Then, the steps of the IGCEW method are described as follows (Delgado &
Romero, 2015):
ECA SIA
Integration of SIA and ECA
Step 1
Step 2
Step 3
Step 5
Step 4
Criteria and grey classes
Percentage system
CTWF and Comprehensive clustering coefficient
Entropy-weight method
Objective assessment

Case study: Hydrocarbon exploration in Spain|164
Step 1: Criteria and grey classes
A set of n criteria for SIA, determined by Cj (j=1, 2,…, n), is established; and
a set of s grey classes, determined by Vk (k=1, 2,…, s), is defined.
Step 2: CTWF and Comprehensive clustering coefficient
The CTWF values of each stakeholder group are obtained using Equation
(5.1). Then, the comprehensive clustering coefficients 𝜎𝑖𝑘 for object i, i=1,
2,…, m, with respect to the grey class k, k=1,…, s, are calculated using
Equation (5.2).
Step 3: Percentage system
SIA finishes with a percentage system (Chang et al., 2009; Delgado &
Romero, 2015), defined by the values: α1, α2, α3,…, αs, where s is the number of
grey classes defined, αs=100, α1=100/s, α2=α1+α1, α3=α1+α2, …,and αs-1=α1+αs-2.
The results for each stakeholder group are given by Equation (5.7).
𝑧𝑗𝑖 =∑𝑓𝑗
𝑘(𝑥𝑖𝑗). α𝑘
𝑠
𝑘=1
(5.7)
where 𝑓𝑗𝑘(𝑥𝑖𝑗) is CTWF of the kth grey class of the jth criterion and α𝑘 is the
percentage value of each grey class. The results are represented by the
matrix determined by Equation (5.8).
𝑍 = 𝑧𝑗𝑖 = {𝑧𝑖𝑗, 𝑖 = 1, 2, … ,𝑚; 𝑗 = 1, 2, … , 𝑛} (5.8)
Step 4: Entropy-weight method
ECA is carried out by applying the EW method. First, using Equation (5.3),
the normalized values Pij of the matrix 𝑍 = 𝑧𝑗𝑖 = {𝑧𝑖𝑗 , 𝑖 = 1, 2, … ,𝑚; 𝑗 = 1, 2, … , 𝑛}

Chapter V|165
are calculated. Then, Hj, divj and wj are determined using Equations (5.4),
(5.5) and (5.6).
Step 5: Objective assessment
The final step of ECA involves calculating the objective assessment
(Delgado & Romero, 2015; Shemshadi et al., 2011) of each stakeholder group
i, i=1, 2,…, m, for each criterion Cj (j=1, 2,..., n), by means Equation (5.9).
𝑄𝑖𝑗 = 𝑤𝑗𝑧𝑖𝑗 (5.9)
where 𝑤𝑗 is the entropy weight for each criterion Cj and 𝑧𝑖𝑗 is the result of
SIA for each stakeholder group. The results are represented by the matrix
defined by Equation (5.10).
𝑄𝑖𝑗 = [
𝑤1𝑧11 𝑤2𝑧12𝑤1𝑧21 𝑤2𝑧22
… 𝑤𝑛𝑧1𝑛… 𝑤𝑛𝑧2𝑛
⋮ ⋮𝑤1𝑧𝑚1 𝑤2𝑧𝑚2
⋱ ⋮ … 𝑤𝑛𝑧𝑚𝑛
] (5.10)
5.3. Case study
SIA and ECA were performed for a project located in the Gulf of Valencia
in Spain, as shown in Figure 5.3. The concerned company proposes to
conduct the hydrocarbon exploration by means a campaign of 3D seismic
acquisition in zones B, G, AM-1 and AM-2, indicated on the map
(Environmental Resources Management Iberia, 2012). Ultrasound
technology was proposed to be used to determine the existence of
hydrocarbon deposits in the marine subsoil. In this study, we conducted
SIA and ECA of this project on the city of Valencia, located inside the zone
of influence of the project.

Case study: Hydrocarbon exploration in Spain|166
Figure 5.3: Project location (Environmental Resources Management Iberia, 2012).
5.3.1. Stakeholder Groups
During the field work, we identified four different stakeholder groups
(k=4), the composition of these groups was determined according to
similarities found during the overall assessment on the hydrocarbon
exploration project (Delgado & Romero, 2015). The sample size in each
group was determined by means the principle of saturation of discourse,
which establish that information gathering should end when respondents
do not produce new information relevant to object of study (Corbetta, 2007).
The stakeholder groups were defined as follows:

Chapter V|167
5.3.1.1. Those directly affected (G1)
This group was composed of those members of the population who are
directly affected by the impacts of the project, consisting of people
undertaking productive activities related to fishing or tourism (see Figure
5.4). This group was made up of thirty interviewees.
Figure 5.4: Those directly affected stakeholder group.
5.3.1.2. Those citizens opposed to the project (G2)
This group was composed of citizens who generally have an adverse
opinion of the project, mainly consisting of students with no links to
productive activities related to fishing or tourism (see Figure 5.5). This
group was made up of thirty interviewees.
Figure 5.5: Those citizens opposed to the project stakeholder group.

Case study: Hydrocarbon exploration in Spain|168
5.3.1.3. Those citizens in favour (G3)
This group was composed of citizens who generally have a favourable
opinion of the project, mainly consisting of retirees and people linked to the
government of the day, who tended to stress during the interview the
importance of private investment in the resolution of social problems (see
Figure 5.6). This group was made up of fifteen interviewees.
Figure 5.6: Those citizens in favour stakeholder group.
5.3.1.4. Specialists (G4)
This group was composed of experts from different fields who are familiar
with the area of influence and the characteristics of the environmental and
social impacts of hydrocarbon exploration projects, and who manifested an
objective and neutral general assessment of the project (see Figure 5.7). This
group was made up of eight interviewees.

Chapter V|169
Figure 5.7: Specialists stakeholder group.
5.3.2. Calculations using the integrated method
The calculations for the case study, based on the IGCEW method, are
preceded as follows.
Step 1: Criteria and grey classes
a) Evaluation criteria
The criteria for the case study were established by taking into account to the
economic and social situation of the city of Valencia and the characteristics
of the project, and by consulting with experts. Four criteria were (n=4) were
identified as shown in Figure 5.8.

Case study: Hydrocarbon exploration in Spain|170
Figure 5.8: Criteria system of the case study.
The established criteria are described in Table 5.1.
Table 5.1: Evaluation criteria in the case study.
Criterion Description
C1
This criterion measured the change in the volume of fishing in the
Comunitat Valenciana, with the baseline figure being taken as the volume
of fishing in 2013, which was 31,29 thousand tonnes of fish (INE-España,
2014).
C2
This criterion measured the change in the number of foreign tourists
visiting the Comunitat Valenciana, with the baseline figure being taken as
the number of foreign tourists in 2013, which was 5.97 million (INE-
España, 2014).
C3
This criterion measured the change in quantity of GDP per capita in the
Comunitat Valenciana, with the baseline figure being the GDP per capita in
2013, which was 19,500 euros per year (Datos Macro, 2014).
C4
This criterion measured the change in the percentage of unemployment in
the Comunitat Valenciana, with the baseline figure being the
unemployment rate in 2013, which was 28.05% (INE-España, 2014).
Go
al:
So
cia
l im
pa
ct
ass
essm
ent
C4: Percentage of unemployment
C1: Volume of fishing
C2: Quantity of tourists
C3: GDP per capita

Chapter V|171
b) Grey classes
Five grey classes (s = 5) for the case study were established according to the
historical information from 2009 to 2013 (Datos Macro, 2014; INE-España,
2014), and by the consultation with experts, in order to satisfy the need to
reflect the characteristics of the specific region as accurately as possible (S.
Liu & Lin, 2010). All the criteria had the same weight (ηj = 0.250), as they
are social criteria (Corbetta, 2007). The grey classes established for each
criterion are shown in Table 5.2.
Table 5.2: Grey classes for each criterion in the case study.
Criterion
Grey classes
Very Negative (V1)
Negative (V2)
Normal (V3)
Positive (V4)
Very Positive (V5)
C1 25.07 ≤ x11 ≤
27.56 27.56 ≤ x1
2 ≤ 30.05
30.05 ≤ x13 ≤ 32.54 32.54 ≤ x1
4 ≤ 35.03 35.03 ≤ x1
5 ≤ 37.52
C2 04.78 ≤ x21 ≤ 05.26 05.26 ≤ x2
2 ≤ 05.73 05.73 ≤ x23 ≤ 06.21 06.21 ≤ x2
4 ≤ 06.68 06.68 ≤ x2
5 ≤ 07.16
C3 18.66 ≤ x31 ≤ 19.00 19.00 ≤ x3
2 ≤ 19.33 19.33 ≤ x33 ≤ 19.67 19.67 ≤ x3
4 ≤ 20.00 20.00 ≤ x3
5 ≤ 20.34
C4 33.52 ≤ x41 ≤ 37.16 29.87 ≤ x4
2 ≤ 33.52 26.23 ≤ x43 ≤ 29.87 22.58 ≤ x4
4 ≤ 26.23 18.94 ≤ x4
5 ≤ 22.58
Step 2: CTWF and the comprehensive clustering coefficient
The data obtained from the stakeholder groups were processed using
CTWF. The grey classes were extended in two directions by adding the grey
classes V0 and V6 ("extra negative" and "extra positive", respectively), and
with their center-points λ0 and λ6 being determined. Therefore, the new
sequence of center-points was λ0, λ1, λ2, λ3, and λ6, as shown in Table 5.3 and
Figure 5.9.

Case study: Hydrocarbon exploration in Spain|172
Table 5.3: Center-points of the extended grey classes in the case study.
Criterion Center-points of the extended grey classes
Extra negative impact (λ0)
Very negative impact (λ1)
Negative impact (λ2)
Normal impact (λ3)
Positive impact (λ4)
Very positive impact (λ5)
Extra positive impact (λ6)
C1 23.82 26.31 28.80 31.29 33.78 36.27 38.76
C2 04.55 05.02 05.50 05.97 06.45 06.92 07.40
C3 18.50 18.83 19.17 19.50 19.84 20.17 20.51
C4 38.99 35.34 31.70 28.05 24.41 20.76 17.12
Figure 5.9: CTWF for the case study.
As illustration, for the first criterion C1 (j=1) shown in the first row of Table
5.2 and Table 5.3, we have the grey classes: V1= [25.07; 27.56], V2= [27.56;
30.05], V3= [30.05; 32.54], V4= [32.54; 35.03] and V5= [35.03; 37.52], with their
center-points being λ1=26.31, λ2=28.80, λ3=31.29, λ4=33.78 and λ5=36.27. The
grey classes were then expanded in two directions by adding the grey
classes V0= [22.58; 25.07] and V6= [37.52; 40.01], with their centres being
λ0=23.82 and λ6=38.76. Thus, we obtained a new sequence of centres: λ0, λ1,
λ2, λ3, and λ6. The values were substituted into Equation (5.1), to obtain the
CTWF of the five grey classes. The results for the first criterion Cj(j=1) are
shown in Equations (5.11), (5.12), (5.13), (5.14) and (5.15):
𝜆0 𝜆6
Very Positive impact 𝑦 = 𝑓𝑗
5
Very Negative impact 𝑦 = 𝑓𝑗
1
𝒙
𝒚 Positive impact 𝑦 = 𝑓𝑗
4
Normal impact 𝑦 = 𝑓𝑗
3
Negative impact 𝑦 = 𝑓𝑗
2
𝜆1 𝜆2 𝜆3 𝜆4 𝜆5
0
1

Chapter V|173
𝑓11(𝑥) =
{
0, 𝑥 ∉ [23.82 , 28.80]𝑥 − 23.82
2.49, 𝑥 ∈ [23.82 , 26.31]
28.80 − 𝑥
2.49, 𝑥 ∈ [26.31 , 28.80]
(5.11)
𝑓12(𝑥) =
{
0, 𝑥 ∉ [26.31 , 31.29]𝑥 − 26.31
2.49, 𝑥 ∈ [26.31 , 28.80]
31.29 − 𝑥
2.49, 𝑥 ∈ [28.80 , 31.29]
(5.12)
𝑓13(𝑥) =
{
0, 𝑥 ∉ [28.80 , 33.78]𝑥 − 28.80
2.49, 𝑥 ∈ [28.80 , 31.29]
33.78 − 𝑥
2.49, 𝑥 ∈ [31.29 , 33.78]
(5.13)
𝑓14(𝑥) =
{
0, 𝑥 ∉ [31.29 , 36.27]𝑥 − 31.29
2.49, 𝑥 ∈ [31.29 , 33.78]
36.27 − 𝑥
2.49, 𝑥 ∈ [33.78 , 36.27]
(5.14)
𝑓15(𝑥) =
{
0, 𝑥 ∉ [33.78 , 38.76]𝑥 − 33.78
2.49, 𝑥 ∈ [33.78 , 36.27]
38.76 − 𝑥
2.49, 𝑥 ∈ [36.27 , 38.76]
(5.15)
The information from stakeholder groups was gathered by means of direct
interviews using a structured questionnaire based on the evaluation criteria
and grey classes established for the case study. The questions used are
presented in Table 5.4.

Case study: Hydrocarbon exploration in Spain|174
Table 5.4: Questions used in the questionnaire for the case study.
Question
Grey classes
Very Negative (V1)
Negative
(V2)
Normal (V3)
Positive (V4)
Very Positive (V5)
1 What effect would the project have on the volume of fishing?
Decrease noticeably
Decrease No
effect Increase
Increase noticeably
2
What effect would the project have on the quantity of tourists?
Decrease noticeably
Decrease No
effect Increase
Increase noticeably
3 What effect would the project have on the GDP per capita?
Decrease noticeably
Decrease No
effect Increase
Increase noticeably
4
What effect would the project have on the percentage of unemployment?
Increase noticeably
Increase No
effect Decrease
Decrease noticeably
Table 5.5 shows the overall results of the evaluation of the four stakeholder
groups (m = 4) for each criterion. These data were aggregated using the
arithmetic mean (Aznar & Guijarro, 2012).
Table 5.5: Aggregated values of each criterion for groups G1, G2, G3 and G4.
Group C1 C2 C3 C4
G1 26.81 05.16 18.85 34.98
G2 26.89 05.59 19.53 26.96
G3 30.13 05.88 19.92 22.22
G4 27.87 05.61 19.42 27.14
Then, for group G1, the values of CTWF were calculated using Equations
(5.11), (5.12), (5.13), (5.14) and (5.15). Subsequently, the comprehensive
clustering coefficient (𝜎𝑖𝑘) was calculated for each stakeholder group using
Equation (5.2). The values of CTWF and 𝜎𝑖𝑘 obtained for group G1 (m=1) are
shown in Table 5.6.

Chapter V|175
Table 5.6: Values of CTWF and 𝝈𝒊𝒌 for group G1.
𝒇𝒋𝒌(𝒙) C1 C2 C3 C4 𝝈𝒊
𝒌
𝒇𝒋𝟎(𝒙) 0.8000 0.7000 0.9333 0.9000 0.8333
𝒇𝒋𝟏(𝒙) 0.2000 0.3000 0.0667 0.1000 0.1667
𝒇𝒋𝟐(𝒙) 0.0000 0.0000 0.0000 0.0000 0.0000
𝒇𝒋𝟑(𝒙) 0.0000 0.0000 0.0000 0.0000 0.0000
𝒇𝒋𝟒(𝒙) 0.0000 0.0000 0.0000 0.0000 0.0000
Step 3: Percentage system
The final stage of SIA for the case study involved the employment of a
percentage system defined by the values α1, α2, α3, α4 and α5, where α5=100,
α1=100/5=20, α2=α1+α1=40 , α3=α1+α2=60 and α4=α1+α3=80, according to five
grey classes established, as shown in Table 5.7. Then, the results of SIA for
group G1 were calculated using Equation (5.7), as presented in Table 5.8.
Table 5.7: The percentage system determined in the case study.
Impact class Interval αk
Very negative [20, 30] 20 Negative [30, 50] 40 Normal [50, 70] 60 Positive [70, 90] 80 Very positive [90, 100] 100
Table 5.8: Results of SIA for group G1.
Impact class αk C1 C2 C3 C4 Total
Very negative 20 16.00 14.00 18.67 18.00 16.67
Negative 40 08.00 12.00 02.67 04.00 06.67
Normal 60 00.00 00.00 00.00 00.00 00.00
Positive 80 00.00 00.00 00.00 00.00 00.00
Very positive 100 00.00 00.00 00.00 00.00 00.00
24.00 26.00 21.33 22.00 23.33
Very negative
Very Negative
Very negative
Very negative
Very negative

Case study: Hydrocarbon exploration in Spain|176
The values of SIA for groups G2, G3 and G4 were obtained using the same
procedure as for group G1. The results for all stakeholder groups are
presented in Table 5.9.
Table 5.9: Results of SIA for groups G1, G2, G3 and G4.
Group C1 C2 C3 C4 Total Impact class
G1 24.00 26.00 21.33 22.00 23.33 Very negative
G2 24.67 44.00 62.00 66.00 49.17 Negative
G3 50.67 56.00 85.33 92.00 71.00 Positive
G4 32.50 45.00 55.00 65.00 49.38 Negative
Step 4: Entropy-weight method
ECA for the case study was carried out by applying the EW method. First,
the criteria values shown in Table 5.9 were normalized using Equation (5.3),
the normalized values are shown in Table 5.10. Then, Hj, divj and wj were
calculated using Equations (5.4), (5.5) and (5.6). The results are shown in
Table 5.11.
Table 5.10: Normalized results of SIA for groups G1, G2, G3 and G4.
Group C1 C2 C3 C4
G1 0.182 0.152 0.095 0.090
G2 0.187 0.257 0.277 0.269
G3 0.384 0.327 0.382 0.376
G4 0.247 0.263 0.246 0.265
Table 5.11: Values of Hj, divj and wj for each criterion.
C1 C2 C3 C4
𝑯𝒋 0.964 0.976 0.932 0.930
𝒅𝒊𝒗𝒋 0.036 0.024 0.068 0.070
𝒘𝒋 0.182 0.123 0.343 0.353

Chapter V|177
Step 5: Objective assessment
ECA for the case study was completed by calculating objective assessment
of each stakeholder group i, i=1, 2, 3, 4, for each criterion Cj (j=1, 2, 3, 4). The
results were obtained using Equation (5.9), as shown in Table 5.12.
Table 5.12: Objective assessment scores for each group.
Group C1 C2 C3 C4
G1 04.36 03.20 07.31 07.76
G2 04.48 05.41 21.24 23.28
G3 09.21 06.89 29.23 32.45
G4 05.91 05.53 18.84 22.92
5.4. Results and Discussion
The results and discussion, according to objectives in this study, are
presented below.
5.4.1 The potential of the integrated method to integrate SIA and ECA
In this article, we proposed to conduct SIA by means the GC method based
on grey systems, as it can analyse problems with high level of uncertainty,
which could be an advantage with respect to classical multi-criteria
methods as Delphi o AHP (Baykasoğlu & Gölcük, 2015). In addition, the GC
method can be applied to problems with clear extension, which could help
to collect information from stakeholder groups, this fact could be an
advantage with respect to approaches based on fuzzy logic (S. Liu & Lin,
2010). Furthermore, the GC method uses small samples, which could have
lower cost during its application than other statistical approaches (Wittmer
et al., 2006).

Case study: Hydrocarbon exploration in Spain|178
In turn, ECA was carried out by means the EW method based on Shannon
entropy, which is a method that also considers the uncertainty within its
analysis (Zeleny, 1996). Therefore, the EW method could integrate SIA and
ECA under the same philosophy of the GC method, identifying
controversial criteria between stakeholder groups.
The main advantages of the integrated method could be summarized as
follows:
The integrated method could be more effective than other classical
multi-criteria methods, as it considers uncertainty within its analysis.
The integrated method could be more appropriate than other
approaches based on fuzzy logic, as it considers clear extension of
criteria within its analysis.
The integrated method could have a lower cost than other statistical
approaches during its application.
The integrated method integrates SIA and ECA, performing an
analysis of stakeholders, which is a dimension of integrated
assessment.
The main limitations of the integrated method could be summarized as
follows:
The approaches based on grey systems or Shannon entropy are not
widely diffused compared to approaches based on multi-criteria
analysis, fuzzy logic or statistics models.
The integrated method presents still subjective aspects, during
information gathering and the establishment of limits of grey classes.

Chapter V|179
The calculations are still tedious during the application of the
integrated method. However, this could improve by implementing a
computer system.
5.4.2 The case study
5.4.2.1 Analysis of findings from calculations
The calculations for the case study produced three important findings,
which are discussed below.
First, the major tensions among stakeholder groups were identified. Figure
5.10 (based on Table 5.9) shows a strong antagonism between groups G1
(those directly affected) and G3 (those citizens in favour), despite the fact that the
specialists (G4) expressed the opinion that the project would have a negative
social impact. The results indicate that G1 and G3, presented contradictory
views on the project, these differences suggest potential conflicts between
G1 and G3 groups. In order to analyse and more fully understand the
mechanisms and forces at play, we need to look at the specific criteria of
conflict between G1 and G3, which points to our second important finding.

Case study: Hydrocarbon exploration in Spain|180
Figure 5.10: Values of SIA of each group.
Second, Figure 5.11 based on Table 5.9 shows the behaviour of the criteria
for G1 and G3 groups: for group G1, all the criteria are in the “very
negative” range; for group G3, C1 and C2 are placed in the range of
“normal”, C3 is found in the range of “positive”, and C4 is in the range of
“very positive”. These results suggest a specific comparison of all these
criteria, in order to identify the most controversial criteria among them.
Negative Very
negative Positive
Negative

Chapter V|181
Figure 5.11: Values of SIA of each criterion for groups G1 and G3.
Third, the most divergent criteria between the stakeholder groups, which
could imply potential causes of conflicts, were identified. Figure 5.12, which
is based on Table 5.12, shows that the stakeholder groups converge for
criteria C1 (volume of fishing) and C2 (quantity of tourists) and diverge for
criteria C3 (GDP per capita) and C4 (percentage of unemployment). The
convergent criteria can be considered as strengths and the divergent criteria
as threats in a possible environmental conflict. The criterion with the
greatest divergence is related to unemployment, followed by GDP per
capita. Therefore, these issues should be taken into account when
implementing measures to prevent environmental conflicts on the
hydrocarbon exploration project.
Very negative
Very negative
Very negative
Very negative
Normal Normal Positive Very
positive

Case study: Hydrocarbon exploration in Spain|182
Figure 5.12: Objective assessment for each group.
5.4.2.2 Analysis of diverging criteria
The hydrocarbon exploration project in the Gulf of Valencia consists of the
application of ultrasound technology, in order to determine the existence of
hydrocarbon deposits in the marine subsoil (Environmental Resources
Management Iberia, 2012). The company presented environmental impact
assessment (EIA) to Spain government in 2012, but at the present (2015) this
project is paused due to the fact that a part of the population of Valencia
city manifests opposition to the implementation of the project. In order to
propose some measures to prevent environmental conflicts on the project,
the context of the divergent criteria is analysed.
a) Percentage of unemployment
The unemployment is a social problem in Spain, which increased since year
2009, for example in Valencia in 2009 was 20.76%, and in 2013 was 28.05%
(INE-España, 2014). This is due to the fact that the economic crisis in Europa
and particularly in Spain impacts on the employment.
0
5
10
15
20
25
30
35
C1 C2 C3 C4
Ob
ject
ive
ass
essm
ent
G1 G2
G3 G4

Chapter V|183
The group G3 (those citizens in favour) believe that the project will generate
direct and indirect employment, as the hydrocarbon industry demands
supplies that would increase the employment in all economic sectors.
However, the group G1 (those directly affected), in concordance with the
groups G2 (those citizens opposed to the project) and G4 (Specialists), strongly
believe that the project will destroy the employment in sensitive sectors,
such as tourism and fishing. Therefore, this fact generates discomfort on a
part of the population in Valencia (see Figure 5.13).
Figure 5.13: Opposed citizens to the project.
b) GDP per capita
In the Comunitat Velenciana, the GDP per capita has been decreased
according to increasing of economic crisis since 2009, for example in 2009
was 20170 euros per year, and in 2013 was 19500 euros per year (INE-
España, 2014). This is due to the fact that the employment and the salary
have decreased notably.

Case study: Hydrocarbon exploration in Spain|184
The group G3 believe that the project will increase the GDP per capita, as
there will be investment from the company that will impulse other sectors
of the economy. However, for groups G1, G2 and G4, the project will affect
to the more important economic sectors of Valencia, which are tourism and
fishing. For example a part of group G1, the fishing cooperative of Valencia
strongly believes that the project will affect their economic income,
considering the context of lack of employment (see Figure 5.14).
Figure 5.14: Fishing cooperative of Valencia.
According to what was analysed above, the following measures could be
implemented in order to prevent environmental conflicts on the project:
As three of four stakeholder groups are not according to the project.
This project would not be feasible, due to the fact that it is located
within sensitive ecological area. In addition, this project could affect
important economic sectors in Valencia City.

Chapter V|185
However, if the central government or the company insist on
implementing the project, they should demonstrate the benefits of
the project to affected population.
In addition, in order to prevent possible environmental conflict, the
central and community governments should listen to the suggestions
from the affected population, which are related with the tourism and
fishing activities.
5.5. Conclusions
The integrated method applied in this article made possible to integrate SIA
and ECA. SIA was conducted by means the GC method, which quantified
the qualitative information collected from stakeholder groups. In turn, ECA
was performed by means the EW method, which identified the
controversial criteria. The results obtained on the hydrocarbon exploration
project in the Sea of the Gulf of Valencia, Spain, could help to central
government or authorities of the community to make the best decision to
manage the use of the Gulf of Valencia.
In addition, the integrated method could be applied in future studies to
other types of programs or projects in ocean areas or coastal areas. The
number of stakeholder groups and of criteria could be determinate
according to each type of project or program and the concrete social
situation of the zone of influence.
Acknowledgments
The authors would like to thank to all experts for his valuable collaboration,
comments and suggestions on this study.

Case study: Hydrocarbon exploration in Spain|186
References
Ainslie, B., Reuten, C., Steyn, D.G., Le, N.D., Zidek, J. V, 2009. Application
of an entropy-based Bayesian optimization technique to the redesign
of an existing monitoring network for single air pollutants. J.
Environ. Manage. 90, 2715–2729.
Al-Mutairi, M., Hipel, K., Kamel, M., 2008. Fuzzy preferences in conflicts.
J. Syst. Sci. Syst. Eng. 17, 257–276.
Arun, E., 2008. Towards a shared systems model of stakeholders in
environmental conflict. Int. Trans. Oper. Res. 15, 239–253.
Augustsson, A., Filipsson, M., Öberg, T., Bergbäck, B., 2011. Climate
change - An uncertainty factor in risk analysis of contaminated land.
Sci. Total Environ. 409, 4693–4700.
Aznar, J., Guijarro, F., 2012. Nuevos métodos de valoración, modelos
multicriterio. Universitat Politèctica de València, Valencia.
Bafroui, H.H., Ohadi, A., Heidari Bafroui, H., Ohadi, A., 2014. Application
of wavelet energy and Shannon entropy for feature extraction in
gearbox fault detection under varying speed conditions.
Neurocomputing 133, 437–445.
Baykasoğlu, A., Gölcük, İ., 2015. Development of a novel multiple-attribute
decision making model via fuzzy cognitive maps and hierarchical
fuzzy TOPSIS. Inf. Sci. 301, 75–98.
Bolin, B., Collins, T., Darby, K., 2008. Fate of the verde: Water,
environmental conflict, and the politics of scale in Arizona’s central
highlands. Geoforum 39, 1494–1511.
Chapter V|187
Campos-Climent, V., Apetrei, A., Chaves-Ávila, R., 2012. Delphi method
applied to horticultural cooperatives. Manag. Decis. 50, 1266–1284.
Chang, Z., Qisen, Z., Zheng, C., Zhang, Q., 2009. The assessment of the
social, economic, and environmental impacts of expressway
construction projects based on the DFGF Algorithm, in: Management
and Service Science. MASS ’09. International Conference. IEEE,
Wuhan, pp. 1–5.
Corbetta, P., 2007. Metodología y técnicas de investigación social.
McGRAW-HILL, Madrid.
Cui, J., Liu, S.F., Zeng, B., Xie, N.M., 2013. A novel grey forecasting model
and its optimization. Appl. Math. Model. 37, 4399–4406.
Datos Macro, 2014. Evolución anual PIB per capita Comunidad. Retrieved
from. http://www.datosmacro.com/pib/espana-comunidades-
utonomas/valencia.
Delgado, A., Romero, I., 2016. Environmental conflict analysis using an
integrated grey clustering and entropy-weight method: A case study
of a mining project in Peru. Environ. Model. Softw. 77, 108-121: doi:
http://dx.doi.org/10.1016/j.envsoft.2015.12.011.
Deng, J., 1985. Generation functions of grey systems. Fuzzy Math. 5, 11–22.
Environmental Resources Management Iberia, 2012. Documento
Ambiental para la Campaña de Adquisición Sísmica 3D en los
Permisos B, G, AM-1 y AM-2 en el Golfo de Valencia. ERM Iberia,
S.A., Madrid; España.

Case study: Hydrocarbon exploration in Spain|188
Fagbote, E.O., Olanipekun, E.O., Uyi, H.S., 2014. Water quality index of
the ground water of bitumen deposit impacted farm settlements
using entropy weighted method. Int. J. Environ. Sci. Technol. 11, 127–
138.
Hamilton, S.H., ElSawah, S., Guillaume, J.H.A., Jakeman, A.J., Pierce,
S.A., 2015. Integrated assessment and modelling: Overview and
synthesis of salient dimensions. Environ. Model. Softw. 64, 215–229.
INE-España, 2014. Instituto Nacional de Estadística de España Retrieved
from. http://www.ine.es/.
Ji, Y., Huang, G.H., Sun, W., 2015. Risk assessment of hydropower stations
through an integrated fuzzy entropy-weight multiple criteria
decision making method: A case study of the Xiangxi River. Expert
Syst. Appl. 42, 5380–5389.
Kim, M., Jang, Y.-C., Lee, S., 2013. Application of Delphi-AHP methods to
select the priorities of WEEE for recycling in a waste management
decision-making tool. J. Environ. Manage. 128, 941–948.
Kou, G., Sun, Q., Peng, Y., 2011. An Entropy-Weighted Clustering Method
for Environmental Pollution Assessment in China, in: Shi, Y., Wang,
S., Kou, G., Wallenius, J. (Eds.), New State of MCDM in the 21st
Century. Springer, Berlin, pp. 177–188.
Landeta, J., 2002. El método Delphi, Una técnica de previsión del futuro.
Editorial Ariel, Barcelona, España.

Chapter V|189
Liu, L., Zhou, J., An, X., Zhang, Y., Yang, L., 2010. Using fuzzy theory and
information entropy for water quality assessment in Three Gorges
region, China. Expert Syst. Appl. 37, 2517–2521.
Liu, S., Lin, Y., 2010. Grey Systems: Theory and Applications. Springer,
Berlin.
Luyet, V., Schlaepfer, R., Parlange, M.B., Buttler, A., 2012. A framework to
implement Stakeholder participation in environmental projects. J.
Environ. Manage. 111, 213–219.
Peche, R., Rodríguez, E., 2011. Environmental impact assessment by means
of a procedure based on fuzzy logic: A practical application. Environ.
Impact Assess. Rev. 31, 87–96.
Prenzel, P. V, Vanclay, F., 2014. How social impact assessment can
contribute to conflict management. Environ. Impact Assess. Rev. 45,
30–37.
Rouyendegh, B.D., Erkan, T.E., 2012. Selection of academic staff using the
fuzzy analytic hierarchy process (FAHP): a pilot study. Tech. Gaz.
199, 923–929.
Saaty, T.L., 1980. The Analytic Hierarchy Process, McGraw-Hill Inc.
McGraw-Hill, New York.
Sadeghi, M., Ameli, A., 2012. An AHP decision making model for optimal
allocation of energy subsidy among socio-economic subsectors in
Iran. Energy Policy 45, 24–32.

Case study: Hydrocarbon exploration in Spain|190
Saqalli, M., Thiriot, S., Amblard, F., 2010. Investigating social conflicts
linked to water resources trhough agent-based modelling. NATO
Sci. Peace Secur. Ser. 75, 142–157.
Shannon, C.E., Weaver, W., 1947. The mathematical theory of
communication. Urbana, The University of Illinois Press.
Shemshadi, A., Shirazi, H., Toreihi, M., Tarokh, M.J., 2011. A fuzzy
VIKOR method for supplier selection based on entropy measure for
objective weighting. Expert Syst. Appl. 38, 12160–12167.
Tang, B., Wong, S., Lau, M.C., 2008. Social impact assessment and public
participation in China: A case study of land requisition in
Guangzhou. Environ. Impact Assess. Rev. 28, 57–72.
van der Voort, N., Vanclay, F., 2015. Social impacts of earthquakes caused
by gas extraction in the Province of Groningen, The Netherlands.
Environ. Impact Assess. Rev. 50, 1–15.
Wang, T.-C., Lee, H.-D., 2009. Developing a fuzzy TOPSIS approach based
on subjective weights and objective weights. Expert Syst. Appl. 36,
8980–8985.
Wei, J., Zhou, L., Wang, F., Wu, D., 2015. Work safety evaluation in
Mainland China using grey theory. Appl. Math. Model. 39, 924–933.
Wittmer, H., Rauschmayer, F., Klauer, B., 2006. How to select instruments
for the resolution of environmental conflicts? Land use policy 23, 1–
9.
Wu, W.-H., Lin, C.-T., Peng, K.-H., Huang, C.-C., 2012. Applying
hierarchical grey relation clustering analysis to geographical

Chapter V|191
information systems – A case study of the hospitals in Taipei City.
Expert Syst. Appl. 39, 7247–7254.
Yang, J., Ryan, C., Zhang, L., 2013. Social conflict in communities impacted
by tourism. Tour. Manag. 35, 82–93.
Yu, J., Wang, D., Chengwu, H., 2013. Selection method of monitoring
parameter optimization in prognostics and health management
based on grey clustering decision. Grey Syst. Theory Appl. 3, 16–25.
Zadeh, L., 1965. Fuzzy sets. Inf. Control 8, 338–353.
Zeleny, M., 1996. Multiple criteria decision making. Springer, New York.
Zhang, L.N., Wu, F.P., Jia, P., 2013. Grey Evaluation Model Based on
Reformative Triangular Whitenization Weight Function and Its
Application in Water Rights Allocation System. Open Cybern. Syst.
J. 7, 1–10.
Zhang, Y., Ni, J., Liu, J., Jian, L., 2014. Grey evaluation empirical study
based on center-point triangular whitenization weight function of
Jiangsu Province industrial technology innovation strategy alliance.
Grey Syst. Theory Appl. 4, 124–136.

CHAPTER VI
CONCLUSIONS


Chapter VI|195
6. General discussion and conclusions
In this section the general discussion and conclusions on this thesis are
descripted; as well as, the contributions and limitations of the thesis, and
the future research lines are presented.
6.1 Discussion of the thesis
According to objectives of this thesis, a general discussion is presented
below:
6.1.1 Discussion on the proposed integrated method
The proposed methodology in this thesis is a combination of the grey
clustering method and the entropy-weight method. The grey clustering
method was used to quantify the information obtained from stakeholder
groups, with which, social impact assessment for each stakeholder group
was determined. In turn, the entropy-weight method was used to identify
controversial criteria between stakeholder groups, with which,
environmental conflict analysis was performed. Consequently, the
combination of both methods was able to integrate social impact assessment
(SIA) and environmental conflict analysis (ECA).
Some alternative to assess social impact studied in this thesis were classical
methods of multi-criteria analysis such as the Delphi method and the AHP
method. The grey clustering method would be more convenient than these
classical methods of multi-criteria analysis, because, the grey clustering
method includes uncertainty within its analysis. This aspect is not present
in classical methods of multi-criteria analysis as the Delphi method and the
AHP method (Baykasoğlu & Gölcük, 2015).
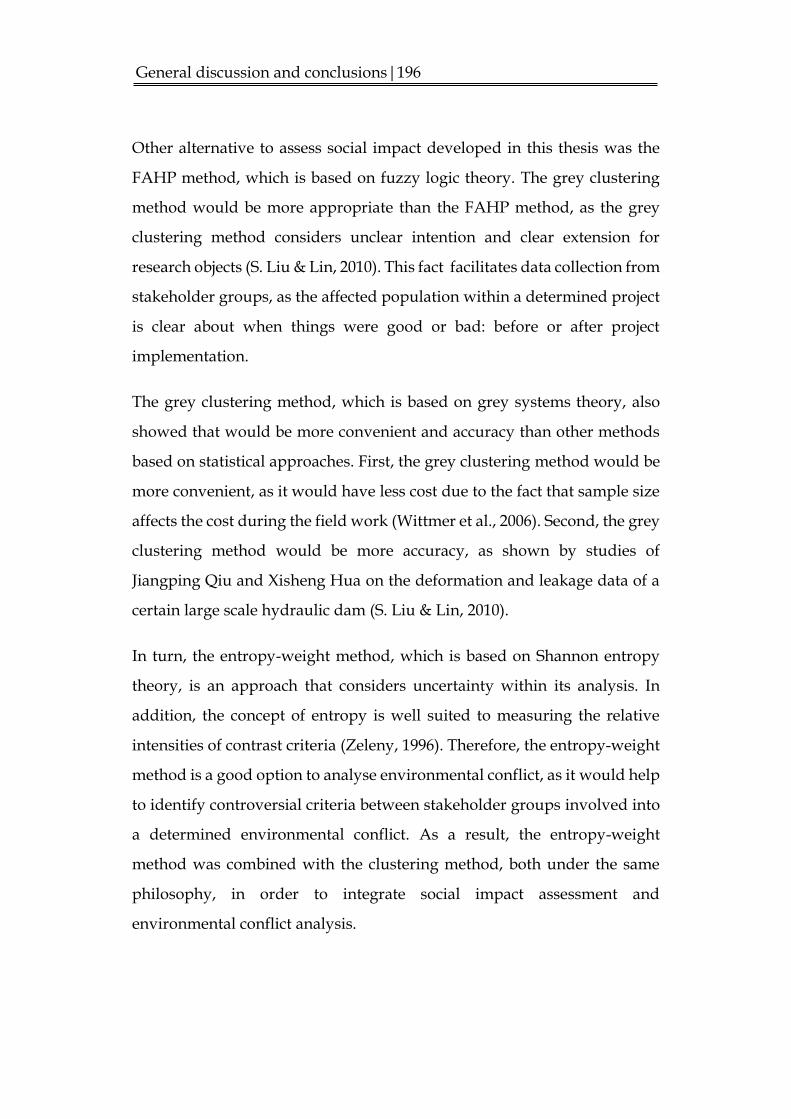
General discussion and conclusions|196
Other alternative to assess social impact developed in this thesis was the
FAHP method, which is based on fuzzy logic theory. The grey clustering
method would be more appropriate than the FAHP method, as the grey
clustering method considers unclear intention and clear extension for
research objects (S. Liu & Lin, 2010). This fact facilitates data collection from
stakeholder groups, as the affected population within a determined project
is clear about when things were good or bad: before or after project
implementation.
The grey clustering method, which is based on grey systems theory, also
showed that would be more convenient and accuracy than other methods
based on statistical approaches. First, the grey clustering method would be
more convenient, as it would have less cost due to the fact that sample size
affects the cost during the field work (Wittmer et al., 2006). Second, the grey
clustering method would be more accuracy, as shown by studies of
Jiangping Qiu and Xisheng Hua on the deformation and leakage data of a
certain large scale hydraulic dam (S. Liu & Lin, 2010).
In turn, the entropy-weight method, which is based on Shannon entropy
theory, is an approach that considers uncertainty within its analysis. In
addition, the concept of entropy is well suited to measuring the relative
intensities of contrast criteria (Zeleny, 1996). Therefore, the entropy-weight
method is a good option to analyse environmental conflict, as it would help
to identify controversial criteria between stakeholder groups involved into
a determined environmental conflict. As a result, the entropy-weight
method was combined with the clustering method, both under the same
philosophy, in order to integrate social impact assessment and
environmental conflict analysis.

Chapter VI|197
6.1.2 Discussion on the application to a project in Peru
The first application of proposed method in this thesis was on a mining
project, which is located in northern Peru. The mining company is trying to
expand its exploitation in the area since 2010 (Knight Piésold, 2010;
MINAM, 2011b). This fact has generated a lot of conflicts between effected
populations. In this study, three stakeholder groups were identified: urban
population, rural population, and specialists. In addition, seven criteria
were established: GDP per capita, employment rate, poverty rate, number
of inhabitants per doctor (GP), enrolment rate in primary education,
number of reported crimes, and access to drinking water rate.
The results showed that for specialists stakeholder group the project would
have a normal social impact. However, for the urban stakeholder group the
project would have a positive impact, and for the rural stakeholder group
would have a negative social impact. This antagonism is due to the fact that
the rural population believes that their main economy activities, which are
agriculture and livestock, will strongly be affected. While, the urban
stakeholder group believes that the project will generate welfare and
economic development for urban population.
The main controversial criterion was the access to drinking water rate. The
rural population strongly believes that the project will contaminate their
water sources, and their economic income will decrease notably. In contrast,
the urban population believes that the amount of water available will
increase, due to the fact that the mining company will construct water
reservoirs. Other minor controversial criteria were poverty rate, GDP per
capita, and employment rate.

General discussion and conclusions|198
6.1.3 Discussion on the application to a project in Spain
The second application of proposed method in this thesis was on a
hydrocarbon exploration project, which is located in the gulf of Valencia in
Spain. The company is planning to explore hydrocarbon since 2012
(Environmental Resources Management Iberia, 2012). This fact has
generated environmental conflicts between effected populations in
Valencia City. In this study, four stakeholder groups were identified: those
directly affected, those citizens opposed to the project, those citizens in
favour and the specialists. In addition, four criteria were established:
volume of fishing, quantity of tourists, GDP per capita, and percentage of
unemployment.
The results showed that for specialists stakeholder group the project would
have a negative social impact, for those citizens opposed to the project
stakeholder group would have a negative social impact. In addition, for
those directly affected stakeholder group the project would have a very
negative social impact, and for those citizens in favour stakeholder group
would have a positive social impact. This antagonism is due to the fact that
those directly affected believe that their main economy activities, which are
tourism and fishing, will strongly be affected by the project. While, those
citizens in favour believe that the project will generate a lot of direct and
indirect employment.
The main controversial criterion was the percentage of unemployment.
Those citizens in favour strongly believe that the project will generate a lot
of direct and indirect employment, and consequently, it will generate
economic development. In contrast, those directly affected believe that the
project will destroy the employment existing. Other minor controversial
criterion was GDP per capita.

Chapter VI|199
6.1.4 Discussion on the potential to be applied in other contexts
As was argued above, the proposed integrated method in this thesis
showed much flexibility, as it was able to be applied to two different
contexts, as are the Peruvian context and the Spanish context. This fact
would demonstrate that the integrated method could be applied to other
contexts without major inconvenient.
In addition, the proposed method is able to adapt to each type of project, in
other words, the criteria number and the stakeholder groups number are
defined according to particularities of project and the decision of project
coordinators.
The proposed method is also able to be applied to different alternatives of
a determined project; this is, if a company or an organization, which
proposes a project, presents alternatives within of EIA, then the integrated
method can be applied for each alternative.
As additional information, the integrated method could also be applied to
assess the impact on other environmental factors, which have high level of
uncertainty or subjectivity, as for example the impact assessment on the
landscape.
6.2 Conclusions of the thesis
1. Social impact assessment and environmental conflict analysis were
integrated by combination of the grey clustering method and the
entropy-weight method.

General discussion and conclusions|200
2. The proposed integrated method in this thesis showed to be effective
and flexible during its application on the mining project in northern
Peru.
3. The proposed integrated method in this thesis showed to be effective
and flexible during its application on the hydrocarbon exploration
project in the gulf of Valencia in Spain.
4. The proposed integrated method showed a great potential to be
applied to other contexts and other types of programs or projects.
6.3 Contributions and limitations of the thesis
The main contributions of this thesis may be summarized as follows:
Social impact assessment and environmental conflict analysis are
integrated for first time using the grey clustering method and the
entropy-weight method; both approaches consider uncertainty
within their analysis.
A new methodology to assess social impact and analyse
environmental conflict on hydrocarbon project is proposed in this
thesis.
This thesis provides a new methodology for social impact
assessment and environmental conflict analysis of mining projects.
This thesis provides a methodological alternative for social impact
assessment and environmental conflict analysis, which could be
applied to other contexts and other types of programs and projects.
The main limitations of this thesis may be summarized as follows:
The grey systems and Shannon entropy are not approaches
sufficiently diffused in comparison with other approaches based on
fuzzy logic or statistics model.

Chapter VI|201
As the proposed method is a new approach, it needs to be applied to
other project, in order to test its effectiveness.
The calculations during the application of proposed method are a
little tedious; this fact could change implementing a computer
system.
6.4 Future research lines
The future research lines generate from results of this thesis could be
summarized as follows:
To apply the proposed method for social impact assessment and
environmental conflict analysis to other contexts and other projects
and programs. Such as water resources management, industrial
projects, public construction projects, etc. As well as be used to
measure the social impact of public policies or governmental
programs.
To apply the proposed method to assess the impact of other
environmental factors, in which there is high level of uncertainty or
subjectivity, such as the assessment of impact on landscape.
To develop informatics systems to simplify the procedure during the
application of proposed method.

General discussion and conclusions|202
References
Baykasoğlu, A., & Gölcük, İ. (2015). Development of a novel multiple-
attribute decision making model via fuzzy cognitive maps and
hierarchical fuzzy TOPSIS. Information Sciences, 301, 75–98.
http://doi.org/10.1016/j.ins.2014.12.048.
Environmental Resources Management Iberia. (2012). Documento
Ambiental para la Campaña de Adquisición Sísmica 3D en los
Permisos B, G, AM-1 y AM-2 en el Golfo de Valencia. Madrid;
España: ERM Iberia, S.A.
Knight Piésold. (2010). Estudio de Impacto Ambiental del Proyecto Conga.
Perú: Minera Yanacocha S.R.L.
Liu, S., & Lin, Y. (2010). Grey Systems: Theory and Applications. Berlin:
Springer.
MINAM. (2011). Ministerio del Ambiente. Informe No 001-2011. Perú.
Wittmer, H., Rauschmayer, F., & Klauer, B. (2006). How to select
instruments for the resolution of environmental conflicts? Land Use
Policy, 23(1), 1–9. http://doi.org/10.1016/j.landusepol.2004.09.003.
Zeleny, M. (1996). Multiple criteria decision making. New York: Springer.

Annexes

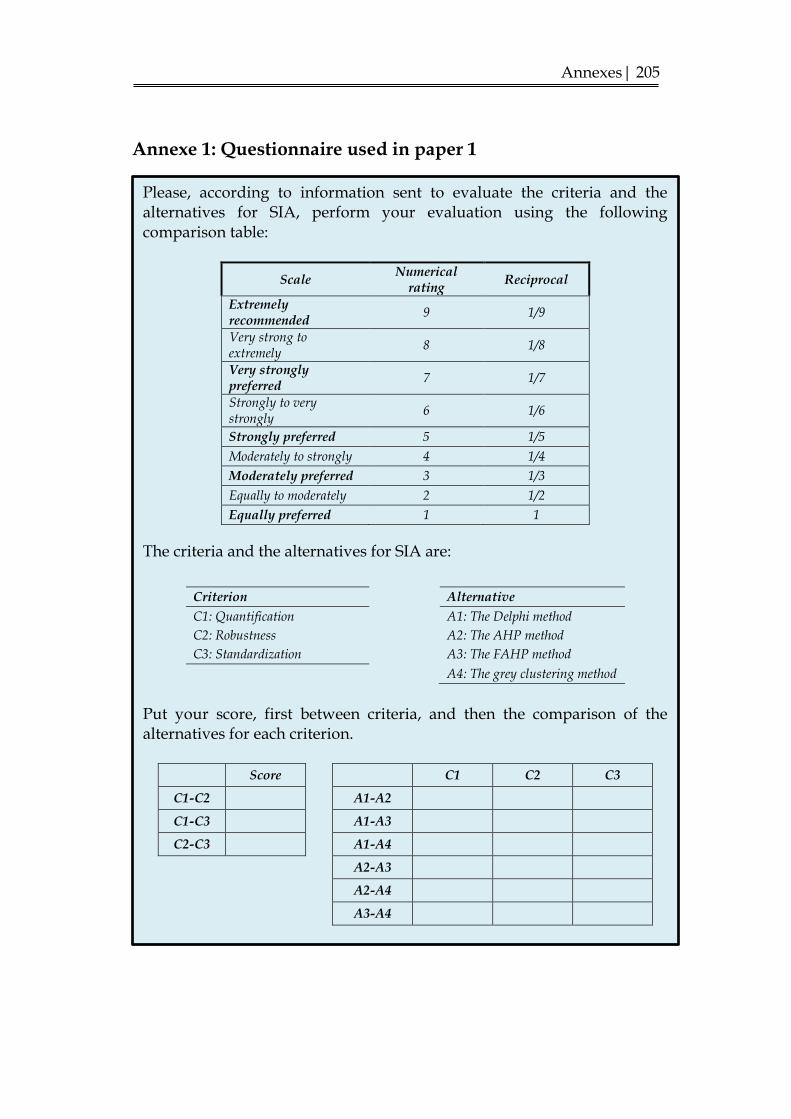
Annexes| 205
Annexe 1: Questionnaire used in paper 1
Please, according to information sent to evaluate the criteria and the alternatives for SIA, perform your evaluation using the following comparison table:
Scale Numerical
rating Reciprocal
Extremely recommended
9 1/9
Very strong to extremely
8 1/8
Very strongly preferred
7 1/7
Strongly to very strongly
6 1/6
Strongly preferred 5 1/5
Moderately to strongly 4 1/4
Moderately preferred 3 1/3
Equally to moderately 2 1/2
Equally preferred 1 1
The criteria and the alternatives for SIA are:
Criterion Alternative
C1: Quantification A1: The Delphi method
C2: Robustness A2: The AHP method
C3: Standardization A3: The FAHP method A4: The grey clustering method
Put your score, first between criteria, and then the comparison of the alternatives for each criterion.
Score C1 C2 C3
C1-C2 A1-A2
C1-C3 A1-A3
C2-C3 A1-A4
A2-A3
A2-A4
A3-A4
Thank you very much for your collaboration. Please, additional comments can be sent by e-mail.
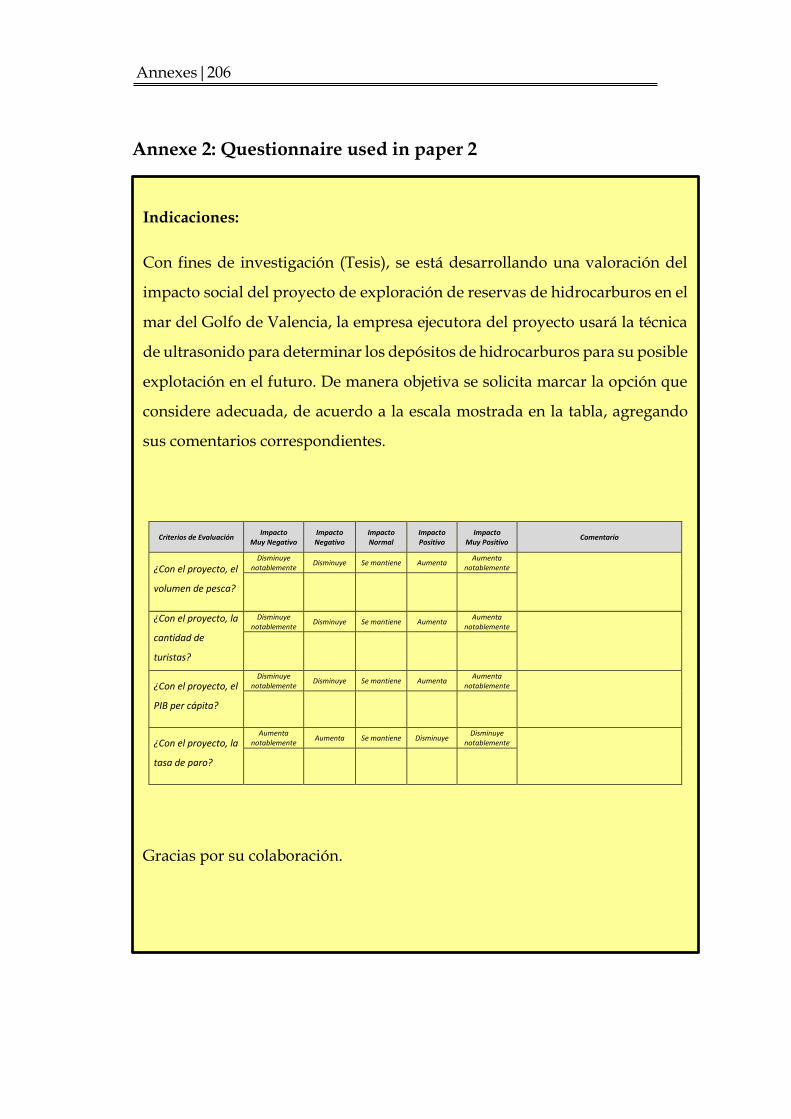
Annexes|206
Annexe 2: Questionnaire used in paper 2
Indicaciones:
Con fines de investigación (Tesis), se está desarrollando una valoración del
impacto social del proyecto de exploración de reservas de hidrocarburos en el
mar del Golfo de Valencia, la empresa ejecutora del proyecto usará la técnica
de ultrasonido para determinar los depósitos de hidrocarburos para su posible
explotación en el futuro. De manera objetiva se solicita marcar la opción que
considere adecuada, de acuerdo a la escala mostrada en la tabla, agregando
sus comentarios correspondientes.
Criterios de Evaluación Impacto
Muy Negativo Impacto Negativo
Impacto Normal
Impacto Positivo
Impacto Muy Positivo
Comentario
¿Con el proyecto, el
volumen de pesca?
Disminuye notablemente
Disminuye Se mantiene Aumenta Aumenta
notablemente
¿Con el proyecto, la
cantidad de
turistas?
Disminuye notablemente
Disminuye Se mantiene Aumenta Aumenta
notablemente
¿Con el proyecto, el
PIB per cápita?
Disminuye notablemente
Disminuye Se mantiene Aumenta Aumenta
notablemente
¿Con el proyecto, la
tasa de paro?
Aumenta notablemente
Aumenta Se mantiene Disminuye Disminuye
notablemente
Gracias por su colaboración.

Annexes| 207
Annexe 3: Questionnaire used in paper 3
Indicaciones:
Con fines de investigación (Tesis), se está desarrollando una valoración del
impacto social del proyecto minero Conga, ubicado en el departamento de
Cajamarca en Perú, la empresa planea expandir su explotación. De manera
objetiva se solicita marcar la opción que considere adecuada, de acuerdo a la
escala mostrada en la tabla, agregando sus comentarios correspondientes.
Criterios de Evaluación Impacto
Muy Negativo Impacto Negativo
Impacto Normal
Impacto Positivo
Impacto Muy Positivo
Comentario
¿Con el proyecto, el ingreso económico por persona?
Disminuye notablemente
Disminuye Se mantiene Aumenta Aumenta
notablemente
¿Con el proyecto, la tasa de empleo?
Disminuye notablemente
Disminuye Se mantiene Aumenta Aumenta
notablemente
¿Con el proyecto, el porcentaje de pobreza?
Aumenta notablemente
Aumenta Se mantiene Disminuye Disminuye
notablemente
¿Con el proyecto, el número de habitantes por médico?
Aumenta notablemente
Aumenta Se mantiene Disminuye Disminuye
notablemente
¿Con el proyecto, la tasa de matrícula en educación primaria?
Disminuye notablemente
Disminuye Se mantiene Aumenta Aumenta
notablemente
¿Con el proyecto, los incidentes delictivos?
Aumenta notablemente
Aumenta Se mantiene Disminuye Disminuye
notablemente
¿Con el proyecto, el acceso al agua potable?
Disminuye notablemente
Disminuye Se mantiene Aumenta Aumenta
notablemente
Gracias por su colaboración.

Annexes|208
Annexe 4: Images from stakeholder groups of case study in Peru
G1: Urban population

Annexes| 209
G2: Rural population

Annexes|210
G3: Specialists

Annexes| 211
Annexe 5: Images from stakeholder groups of case study in Spain
G1: Those directly affected.

Annexes|212
G2: Those citizens opposed to the project

Annexes| 213
G3: Those citizens in favour

Annexes|214
G4: Specialists

Annexes| 215
Annexe 6: Products derived of the thesis
6.1 Scientific articles
1. Delgado, Alexi; Romero, I. (2015). Selection of a method for social impact assessment using AHP. Revista ECIPerú. 12 (1): 84-91. OPEN ACCESS.
2. Delgado, Alexi; Romero, I. (2016). Environmental conflict analysis using an integrated grey clustering and entropy-weight method: A case study of a mining project in Peru. Environmental modelling and software. 77, 108-121. doi: http://dx.doi.org/10.1016/j.envsoft.2015.12.011. Editorial: ELSEVIER.
3. Delgado, Alexi; Romero, I. (2016). Integrating social impact assessment and environmental conflict analysis on a hydrocarbon exploration project in the gulf of Valencia, Spain. Ocean & Coastal
Management. Under review. Editorial: ELSEVIER.
6.2 Documents presented to congress
1. Delgado, Alexi; Romero, I. (2014). Ponencia: Modelo matemático para la valoración del impacto ambiental social. Encuentro Científico Internacional 2014 de invierno. Lima-Perú. 30 julio – 01 agosto, 2014.
2. Delgado, Alexi; Romero, I. (2015). Ponencia: Selección de un método para la evaluación del impacto social usando AHP. Encuentro Científico Internacional 2015 de invierno. Lima-Perú. 30 julio – 01 agosto, 2015.
3. Delgado, Alexi; Romero, I. (2016). Poster: Social impact assessment of hydrocarbon exploration project in the gulf of Valencia using grey clustering and Shannon entropy. The International Society for Ecological Modelling Global Conference 2016. Towson University, Baltimore, MD, USA. 08 -12 May, 2016. Abstract accepted.
6.3 Copyright
1. Delgado, Alexi; Romero, I. (2014). Copyright: Modelo cuali-cuantivativo para la valoración del impacto ambiental social. Oficina europea de copyright. Cod: DEP635393794353951250.