pg&e smartmeter to smart grid transition - ufrj · pg&e smartmeter to smart grid transition...
TRANSCRIPT

PG&E SmartMeter to Smart Grid Transition
March 6, 2012
Jim Meadows
Pacific Gas and Electric Company
The Challenge of Becoming SMART Operationally

Company Overview
Energy services to 15M
customers
9.8 million electric and gas
meters
70,000 square miles with
diverse topography and
climate zones
Provides generation,
transmission, electric
and gas distribution
20,000 employees
A regulated investor-owned
utility
De-coupled revenues / sales
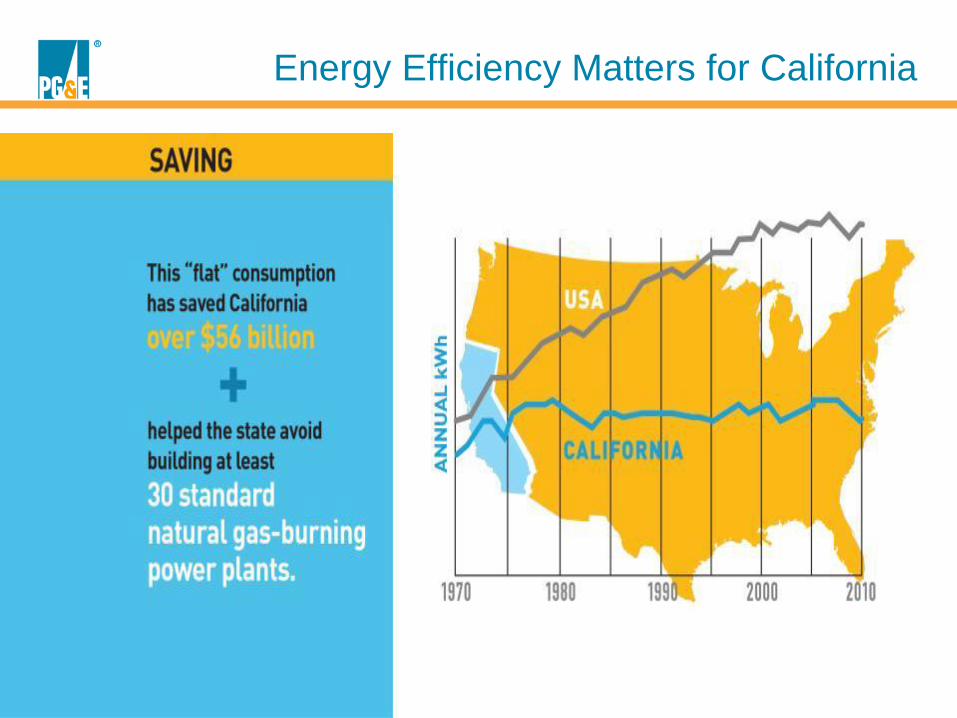
Energy Efficiency Matters for California
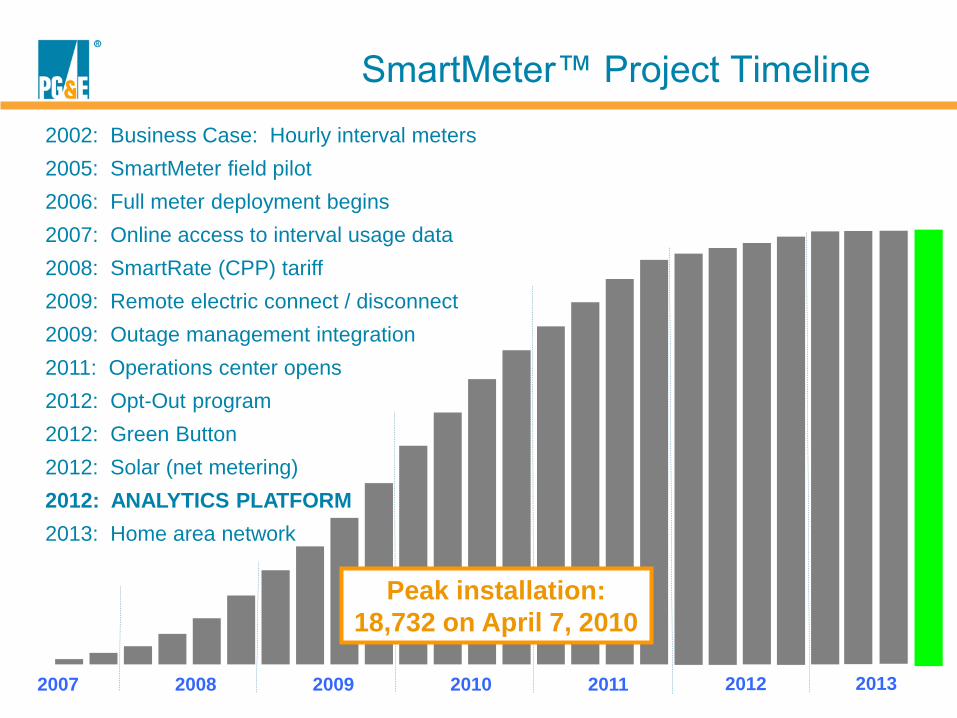
SmartMeter™ Project Timeline
2007 2008 2009 2010 2011 2012
2002: Business Case: Hourly interval meters
2005: SmartMeter field pilot
2006: Full meter deployment begins
2007: Online access to interval usage data
2008: SmartRate (CPP) tariff
2009: Remote electric connect / disconnect
2009: Outage management integration
2011: Operations center opens
2012: Opt-Out program
2012: Green Button
2012: Solar (net metering)
2012: ANALYTICS PLATFORM
2013: Home area network
2013
Peak installation:
18,732 on April 7, 2010
5
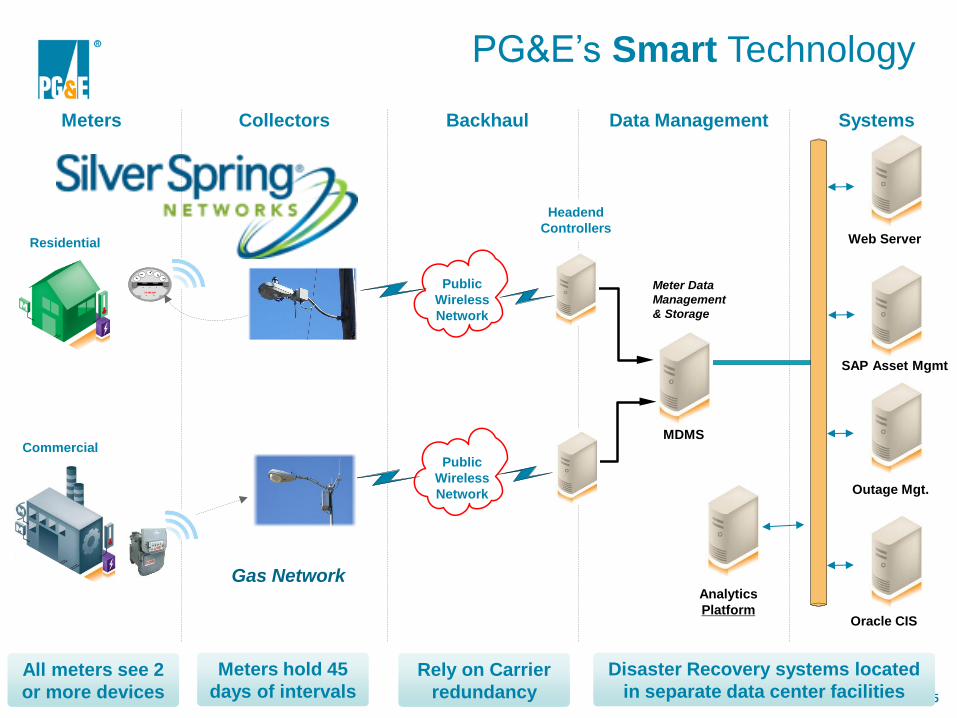
SAP Asset Mgmt
Oracle CIS
MDMS
Meter Data
Management
& Storage
Analytics
Platform
Meters Collectors Backhaul
Residential
Headend
Controllers
Commercial
Systems Data Management
Public
Wireless
Network
Public
Wireless
Network
Web Server
Outage Mgt.
Gas Network
PG&E’s Smart Technology
All meters see 2
or more devices
Meters hold 45
days of intervals Rely on Carrier
redundancy
Disaster Recovery systems located
in separate data center facilities
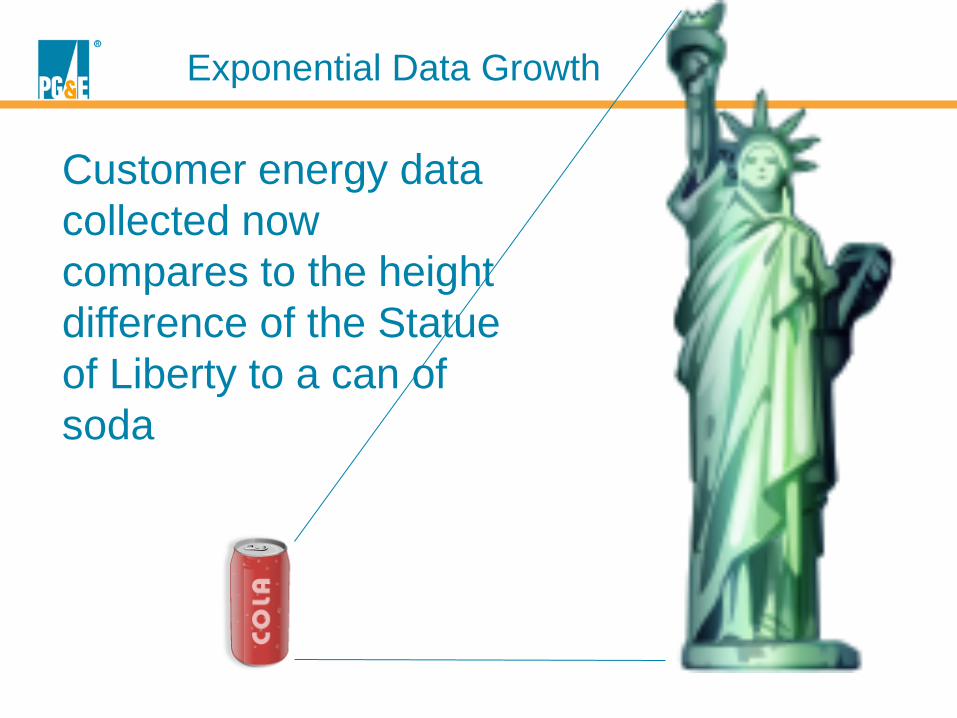
Exponential Data Growth
Customer energy data
collected now
compares to the height
difference of the Statue
of Liberty to a can of
soda

The Utility needs a data & analytics strategy and platform
Data availability and retrieval rules need to be drawn
Lines of business need to be engaged
Data analytics prepared and integrated into business practices and operations
So Now What?

Data Analytics Platform at PG&E
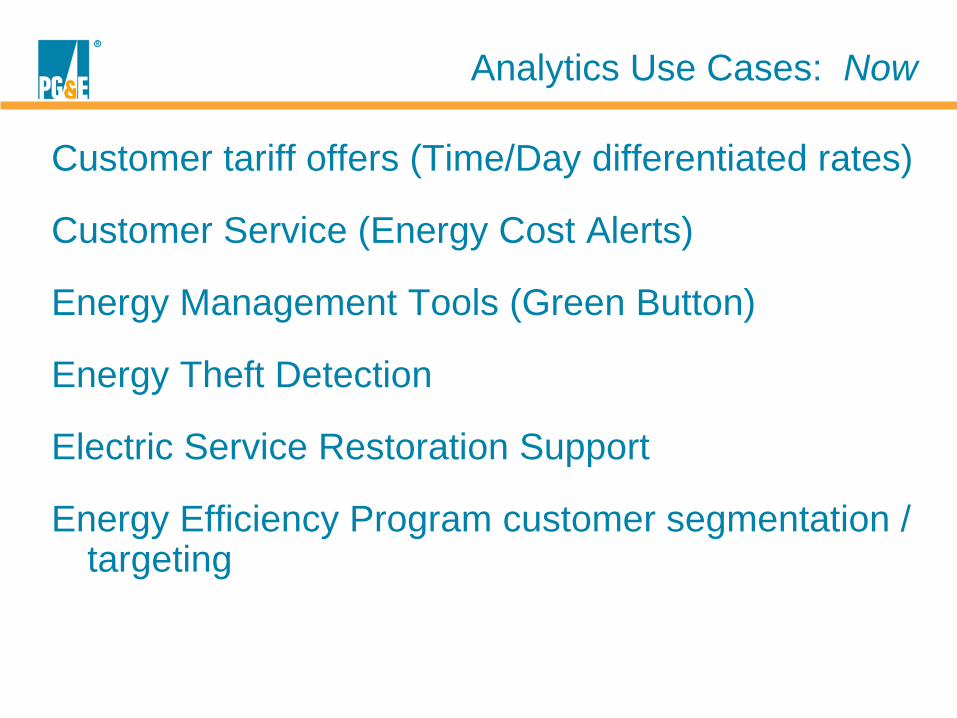
Customer tariff offers (Time/Day differentiated rates)
Customer Service (Energy Cost Alerts)
Energy Management Tools (Green Button)
Energy Theft Detection
Electric Service Restoration Support
Energy Efficiency Program customer segmentation / targeting
Analytics Use Cases: Now

Provide data-enhanced Energy Audits
Identify previously unknown PV or EV customers
Condition-based maintenance on distribution assets
Deferral of substation peak-load asset investment
Analytics Use Cases: Near Term

Typical Load Shape on a PG&E circuit
% of Max Demand Demand Threshold in KW Hours Time of Day Days
Max Demand 5,292 1 5 PM 1
95% 5,027 11 3 to 6 PM 5
90% 4,762 20 2 to 7 PM 9
85% 4,498 60 2 to 8 PM 21
80% 4,233 131 1 to 8 PM 33
Highest demand is concentrated in
very few hours
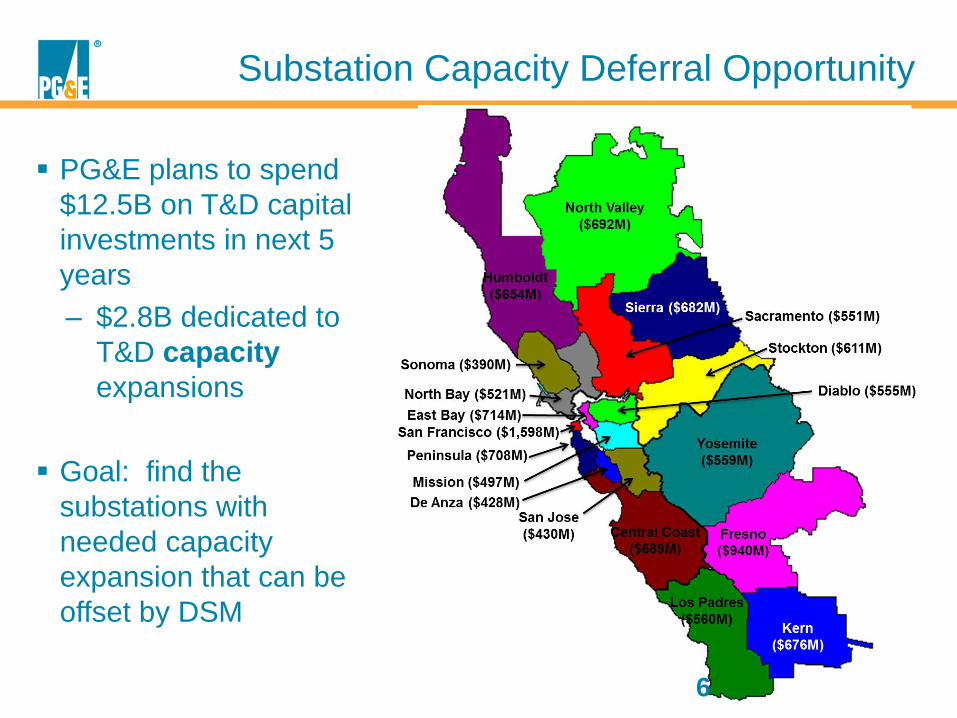
Substation Capacity Deferral Opportunity
PG&E plans to spend
$12.5B on T&D capital
investments in next 5
years
– $2.8B dedicated to
T&D capacity
expansions
Goal: find the
substations with
needed capacity
expansion that can be
offset by DSM
6

Case Study: Substation M
8
Customer %
Food Processing 10.26%
Food Processing 3.19%
Manufacturing 3.06%
Retail 2.00%
Retail 1.57%
Manufacturing 1.30%
Retail 1.12%
Automotive 0.82%
Food Processing 0.80%
Manufacturing 0.55%
Retail 0.52%
Retail 0.48%
Retail 0.47%
Hospitality 0.42%
Food Processing 0.35%
Top 15 Customers in Order of
Contribution to Peak Load
Substation MW intervals
Sept 2012 – Aug 2013
Maximum
Substation
Capacity
Usage

Identified Opportunity: Substation M
SmartMeter data
identifies Substation M
with a concentration of
15 customers driving
peak demand
Targeted DSM
programs to find 1 MW
of peak demand
Success could defer
$6M of capital
investment with $450k
of Energy Efficiency
program costs

Rethinking the Internal Processes
T&D engineers have historically not considered Demand Side
Management when planning capacity expansion projects:
billions of dollars may ultimately be saved (at least deferred!)
PG&E finds that EVERY business process within the utility has
already or will be significantly changed due to the SmartMeter
technology
Plan the analytics platform early; the more robust the platform,
the sooner the internal processes can adopt and adjust
Smart Meter data combined with analytics changes everything
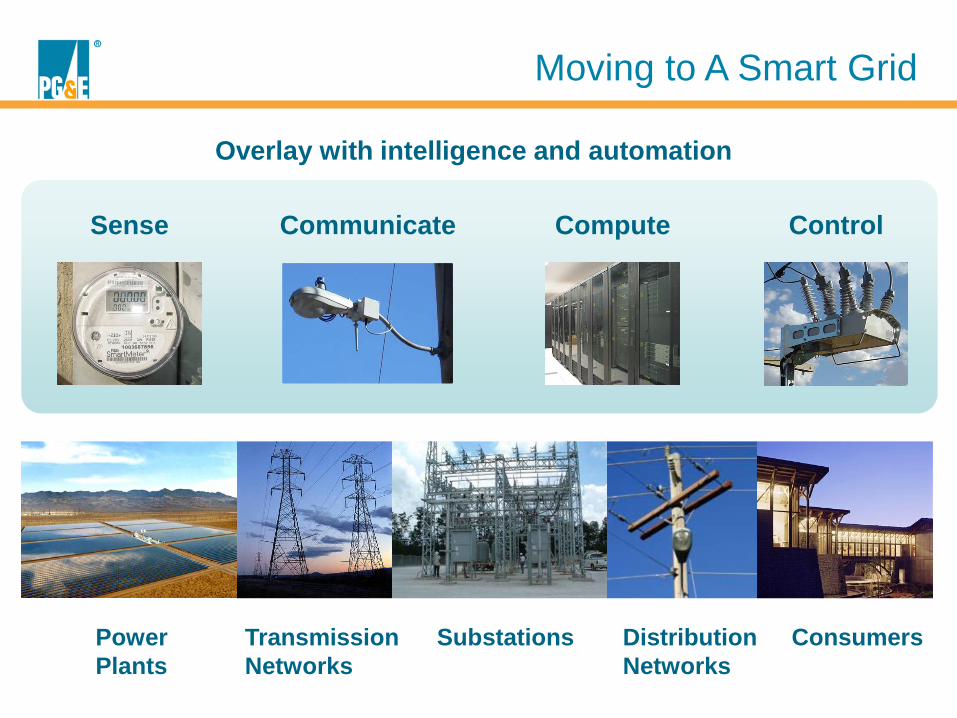
Power
Plants
Transmission
Networks
Substations Distribution
Networks
Consumers
Overlay with intelligence and automation
Sense Communicate Compute Control
Moving to A Smart Grid

Targeted
deployment
• Extend pilots to
targeted roll-outs
based on benefits
• Insights used to
feed the next cycle
of technology
deployment
Controlled Pilots
• Implement tested technologies in a real-
world but controlled setting to demonstrate
value
• Work with customers to prepare for the new
technologies and services
Standards definition
• Shape and validate the
standards that will
underlie future smart-
grid implementations
Testing
• Prototyping and testing of smart-grid
technologies before piloting
• Accelerate technology development
and ensures standards compliance
early on
• Develop preliminary customer
communications to support pilots
Implementation Approach
PG&E
Service
Area in
Northern &
Central
California
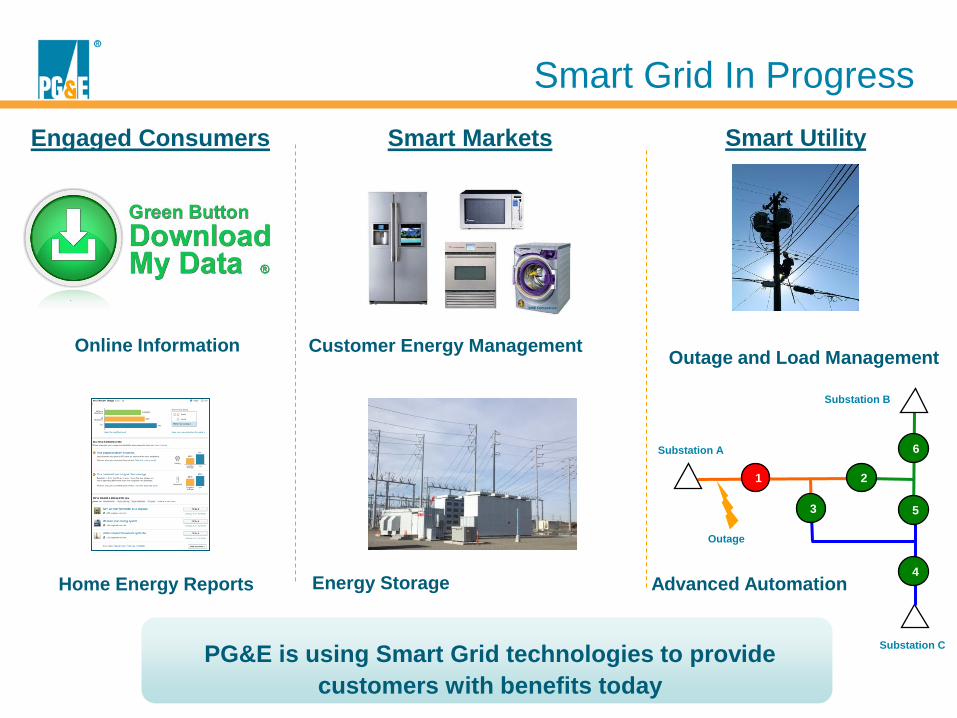
Smart Grid In Progress
PG&E is using Smart Grid technologies to provide
customers with benefits today
Home Energy Reports
Online Information
Engaged Consumers
Customer Energy Management
Energy Storage
Smart Markets Smart Utility
Outage and Load Management
1
6 Substation A
Substation C
4
5 3
2
Outage
Substation B
Advanced Automation

Engaged Customers
Home Energy Report Program – Over
660,000 customers to date receive
personalized reports.
Energy Alerts Program – Over 77,000
customers have signed up to receive
these alerts.
PG&E’s HAN Enablement Program will
allow customers to select and validate
HAN devices for use.
PG&E’s Customer Data Access platform
will allow third-party access to customer
usage data once authorized by the
customer.
Since its launch,
customers have
“clicked” on the Green
Button over 100,000
times to download
customer data from
PG&E’s Website
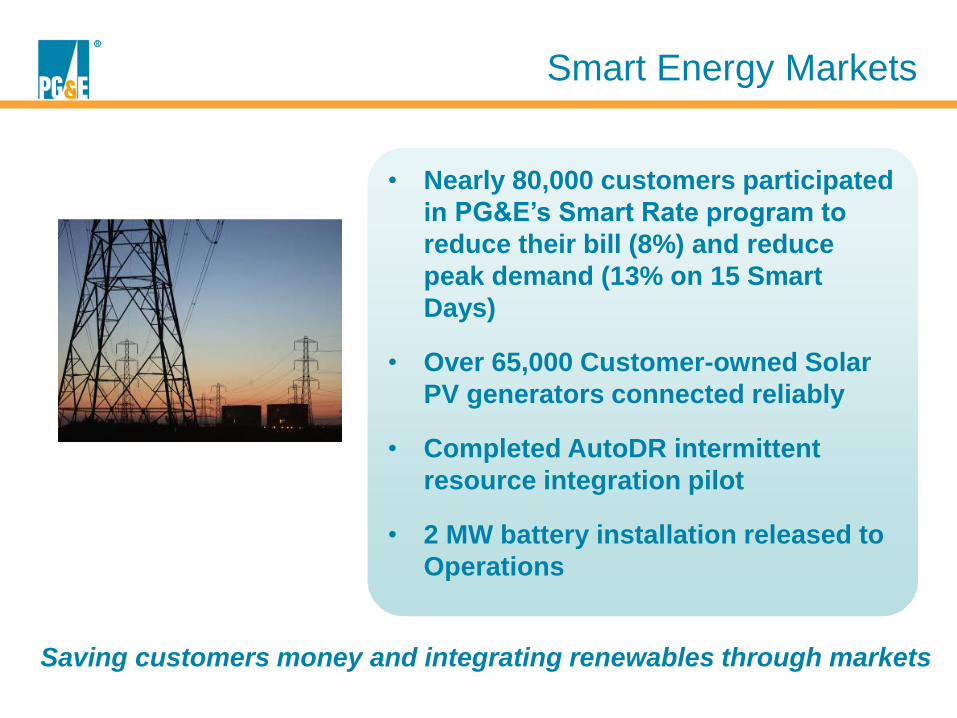
Smart Energy Markets
• Nearly 80,000 customers participated
in PG&E’s Smart Rate program to
reduce their bill (8%) and reduce
peak demand (13% on 15 Smart
Days)
• Over 65,000 Customer-owned Solar
PV generators connected reliably
• Completed AutoDR intermittent
resource integration pilot
• 2 MW battery installation released to
Operations
Saving customers money and integrating renewables through markets

Smart Utility
• 200 circuits across PG&E’s
system with advanced
distribution automation to
improve reliability (800,000
customer minutes of outage time
saved on just 13 events)
• Smart Meter data is fully
integrated with PG&E’s Outage
Management system (over 6,000
truck rolls avoided in 2012)
• Western Interconnection
Synchrophasor Project is in
construction across PG&E’s
Service Area
Improving reliability and safety with technology
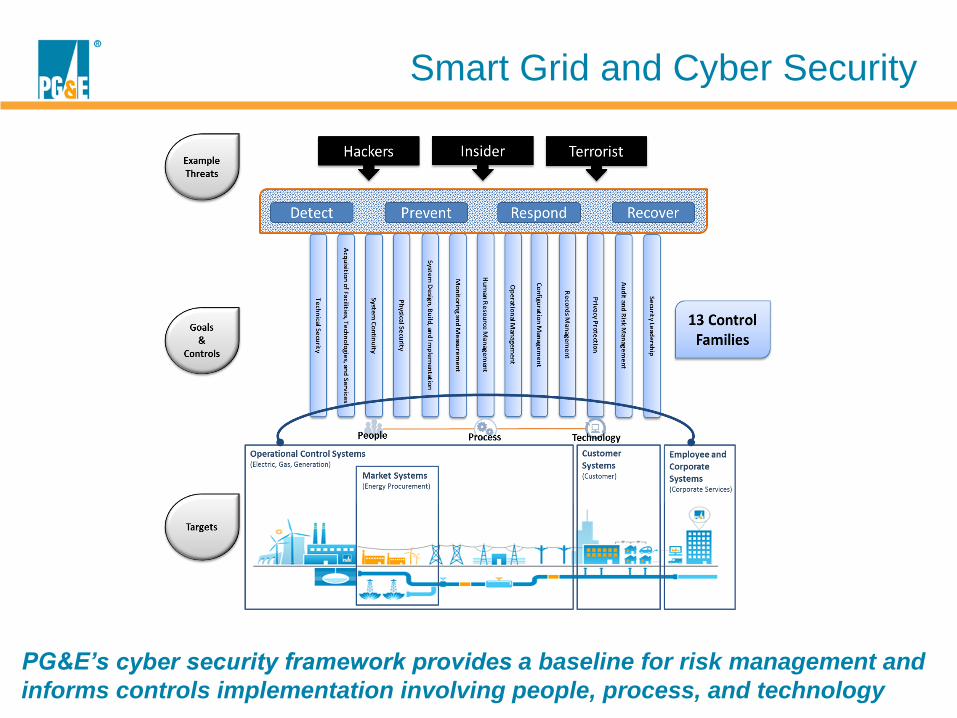
Smart Grid and Cyber Security
PG&E’s cyber security framework provides a baseline for risk management and
informs controls implementation involving people, process, and technology

New Smart Grid Programs Pending
• Smart Grid Line Sensors
• Voltage and Reactive Power Optimization
• Detect and Locate Line Faults
• Short Term Demand Forecasting
The projects will be implemented in 2013-2016
• Renewable Integration
• Grid Modernization and Optimization
• Customer Service and Enablement
Smart Grid Pilot Projects
EPIC Technology Demonstration and Deployment
Program will be in place through 2020

Becoming SMART Operationally
Innovation must continue
There are much more benefits to come from the
SMART generated data
Smart Meter data combined with analytics changes
everything

25
Questions?