performance optimization of paste thickening · performance optimization of paste thickening mika...
TRANSCRIPT
Paste 2017, Beijing, China 13
Performance optimization of paste thickening
Mika Kosonen Outotec, Finland
Sakari Kauvosaari Outotec, Finland
Shan Gao Outotec, Finland
Brandt Henriksson Outotec, Australia
Abstract
Traditionally, thickener controls are implemented as single loop controllers in plant control systems. Based on
our experiences from numerous thickener installations, this approach has several drawbacks, leading easily
to poor process control and sub-optimal process performance. Especially challenging applications are paste
thickeners, where the requirement is to achieve consistently high underflow density and high system
availability without suffering process upsets and mechanical failures.
The main reason for the poor performance of the traditional, single loop Proportional Integral (PI) controllers
is their inability to handle the slow response dynamics and cross action between controlled variables. This
makes tuning of the PI-loops challenging, and compromises have to be made between system robustness and
the desired speed of response. In many cases, these controllers are run either totally or partially in manual
mode, and operator intervention is needed to maintain process stability and the desired operation point in
varying running situations.
This paper discusses the optimizing control solution for paste thickeners. Initially, the instrumentation needed
is briefly discussed. After this, an optimizing control solution based on multivariable model predictive control
(MPC) is introduced, and the results from applying this control strategy to a production scale concentrate
thickener are presented. Finally, a simulated example shows how the same control strategy improves the
performance of paste thickener when compared to traditional control strategies. It is shown that by using an
advanced, model based control strategy, the thickener can consistently run with higher and more stable
underflow density, so that the required level of overflow clarity is also obtained.
1 Introduction
Traditionally, thickener controls are implemented as single loop controllers in DCS/PLC systems. Based on our
experiences from numerous thickener installations around the world, we have identified the following main
challenges in this approach:
Thickeners in general suffer from poor process control, resulting in sub-optimal performance.
In many cases, controllers are run either totally or partially in manual mode.
Operator intervention is needed to maintain the desired operation point in varying running situations.
Excessive amounts of polymers are used as a precaution to compensate for changes in material
settling properties.
The main reason for this is that traditional single-loop PI controllers are not optimal for handling the behavior
of the thickening process. Slow and complicated response dynamics and cross-actions between the controlled
variables make PI loops very challenging to tune, and compromises must be made between system
https://papers.acg.uwa.edu.au/p/1752_02_Kosonen/
14 Paste 2017, Beijing, China
robustness and the desired response speed. This paper discuss the optimizing control solution for paste
thickeners. Initially, the instrumentation needed is briefly discussed. After this, an optimizing control solution
based on multivariable model predictive control (MPC) is introduced, and the results from applying this
control strategy to a production scale concentrate thickener are presented. Finally, a simulated example
shows how the same control strategy improves the performance of the paste thickener when compared to
traditional control strategies.
2 Process instrumentation
Robust and reliable process instrumentation is the cornerstone of a control system. The instrumentation
installed should be suitable for the process, and it should be operated and maintained in an appropriate
manner. This chapter discusses, on a general level, the key process instrument utilized for paste thickener
process control. These measurements include density, the inventory level, overflow turbidity and rake torque
measurements (Parker et al., 2016).
2.1 Density measurement
Achieving the target underflow density is a major key performance indicator for a thickener, and hence it
should be measured online. Even if automatic control of density is not used, the relationship between bed
mass and underflow density tells an experienced operator the efficiency of dewatering process. Density
measurements are quite rarely used in the incoming lines due to relatively high investment. However, when
they are applied especially together with incoming flow measurement, they provide valuable information for
the control system designer about the changes in the feed dry mass flow. While a range of instruments is
available for density measurement, gamma radiation-based instruments represent the industry standard and
are widely available.
2.2 Thickener inventory level
Thickeners accumulate solids to create the bed pressure necessary to achieve dewatering. During steady state
operation, the long-term solids withdrawal rate should match the feed rate. To achieve this steady state of
operation, it is desirable to either measure both mass flows with a high level of accuracy, or measure the
solids inventory in the thickener tank. However, accurate mass flow reconciliation between inflow and
outflow is difficult due to instrument error, leading to uncertainty. Therefore, direct measurement of
inventory level is normally the preferred solution.
Basically, two different approaches exist for inventory measurement: the first is based on the measurement
of the hydrostatic pressure in the bottom cone of the thickener – i.e., bed pressure. Second approach aims
for the direct detection of the height of the formed bed of solids.
2.2.1 Bed pressure
In bed pressure measurement, inventory indication is achieved by means of a pressure transducer mounted
at the bottom of the tank. This bed pressure is measured in kPa, but can be transformed to “% bed mass”
units for easier interpretation by operators. Best practice has the sensor flush mounted to the inside of the
tank, because any buildup of solids forming a barrier between the bed and the sensor will reduce the accuracy
of the reading. When installed properly, bed mass is a very robust and reliable measurement, and hence a
good choice for process control.
2.2.2 Bed level
Typical techniques used for bed level measurements are either based on ultrasonic sonar or diver probes
entering into the thickener. Both systems have their own benefits and challenges in implementation.
Implementation of the sonar-based system is rather straightforward, because the sensor is installed on top
Paste 2017, Beijing, China 15
of the thickener. However, they are sensitive to situations where the sonar response changes according to
process condition and re-calibration of the measurement is needed.
Alternatively, diver probes are not sensitive to free solids material, so they are suitable for paste applications
having cloudy overflow and a bed level line within the cylindrical section of the thickener. However, due to
their mechanical nature, rather complicated and costly measurement setup is needed for fully automated
probing systems.
2.3 Overflow turbidity
Turbidity is measured by detecting the attenuation of light when it passes through a water sample. It is a
relative measurement for the amount of solids and colloidal particles in suspension and hence it can be used
to detect the clarity of thickener overflow. As such, it does not directly tell the solids content, but it can be
used as a “watch-dog” to avoid the escape of solids to the overflow.
2.4 Rake torque
High levels of rake torque are required in modern thickeners due to design and operational improvements
that allow increased underflow density targets. These torque levels can have catastrophic consequences,
unless control and protection systems are in place. From process control point of view, it is important that
monitoring of the rake torque is included in the control strategy, so that system optimization is able to prevent
situations leading to excessive torque levels.
3 Optimizing control for thickeners
In this chapter, a novel approach to utilize a multivariable, model predictive controller (MPC) in thickeners is
presented. MPC is an advanced process control method which has been used in chemical plants and oil
refineries since 1980s. In recent years, it has spread among other process industries also, and nowadays it is
considered to be a standard method for control processes with a multivariable character and complex
response dynamics (Maciejowski, 2002; Kosonen, 2004).
MPC control is based on the process response models, which are typically obtained by performing process
trials or simulating the process responses. These process models are used to predict process behavior in the
future. Based on this prediction, a set of future control actions is calculated to drive the process to the desired
setpoints.
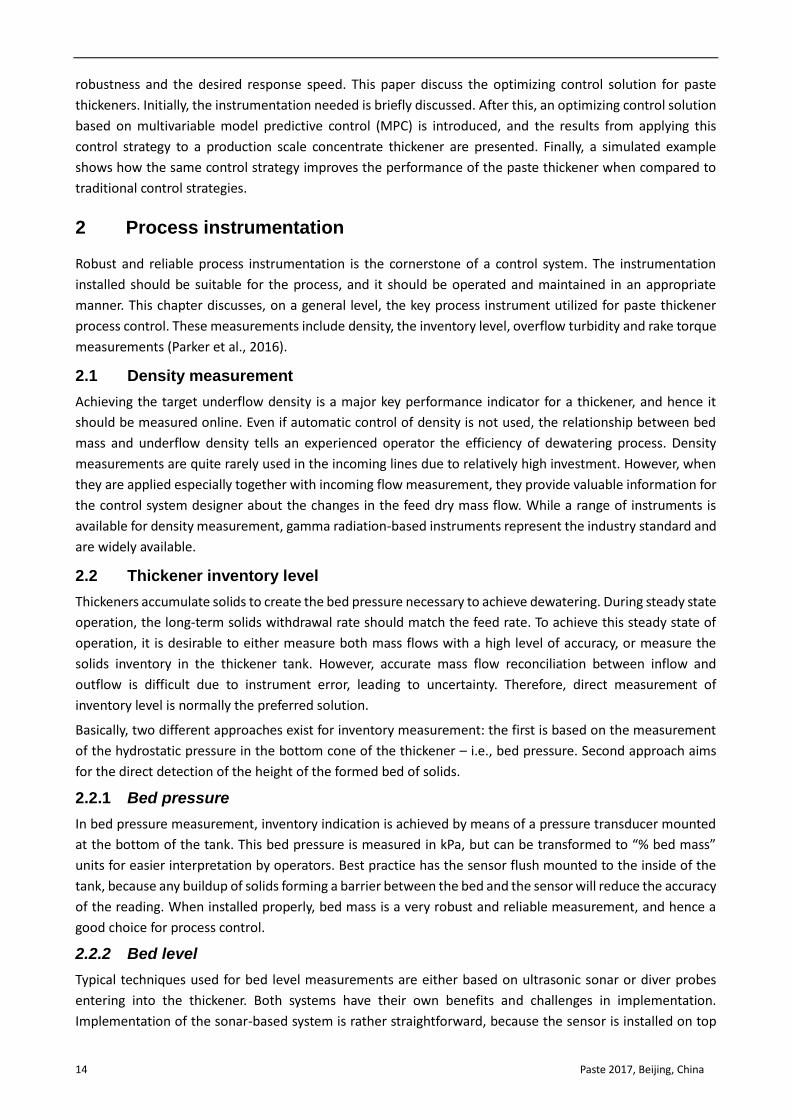
3.1 System structure
The optimizing control solution thickener optimizer is built on the Outotec Advanced Control Tool (ACT)
platform, and the controller structure is shown in Figure 1. The controlled variables in the system are:
Underflow density.
Overflow turbidity.
Thickener inventory level (bed pressure).
The control manipulates the underflow pump speed and flocculant dosing rate. Information from the
thickener feed line, input flow rate and slurry density can also be used as feed-forward information when
available. Rake torque is also taken into account as a constraint in the optimization, so that control actions
leading to critical rake loads are avoided.
In multivariable MPC, there is no direct manipulated variable versus controlled variable relationships,
meaning that one specific actuator, like underflow pump speed, is adjusted purely to control one specific
controlled variable, e.g. underflow density. Instead, controller outputs are calculated as an optimized result
of the cost function, which take into account the predicted control errors, predicted actuator movements and
constraints given to the controller.
16 Paste 2017, Beijing, China
Figure 1 Optimizing control for thickeners – system structure
3.2 Results from a nickel concentrate thickener
To verify the potential of the optimizing control solution, it was implemented on a production scale nickel
concentrate thickener. This concentrator plant has significant variation in the feed ore grade and ore
hardness, which results in a varying tonnage of nickel concentrate produced. This results in varying feeds to
the nickel concentrate, making the thickener difficult to run.
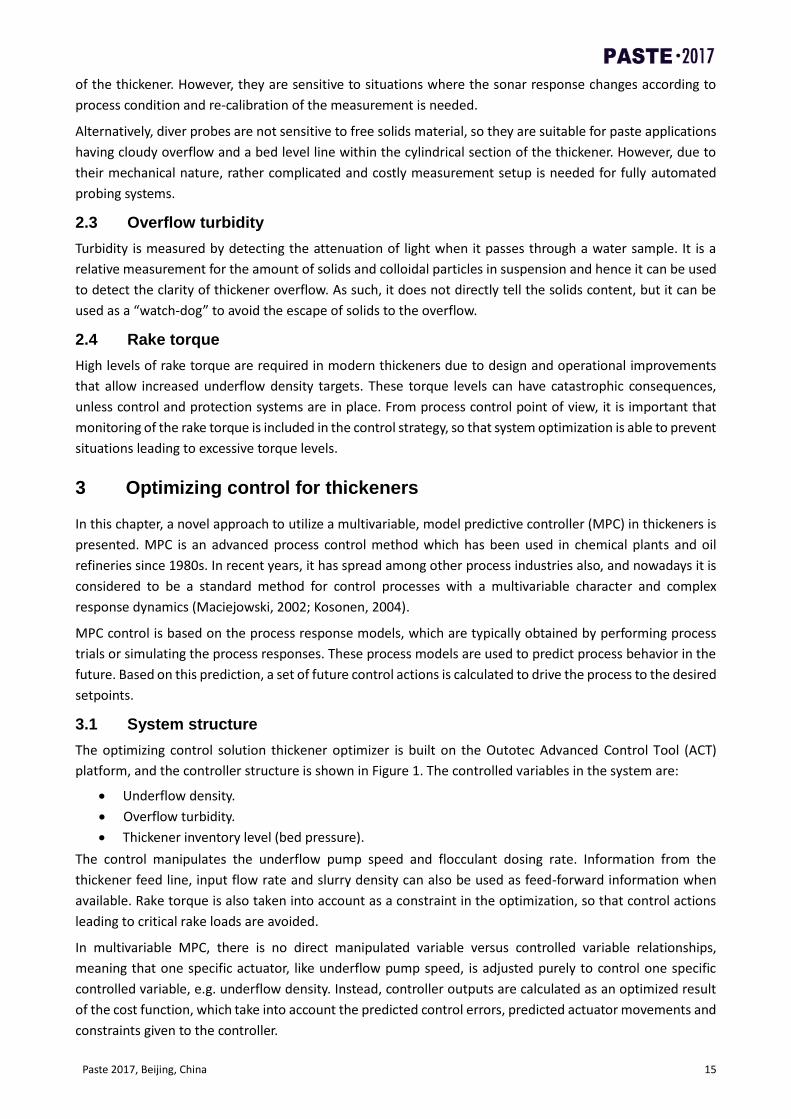
Figure 2 Thickening performance – Manual control versus optimizing control
Before the advanced control implementation, the thickener had traditional PI control loops for bed pressure
and underflow density. However, these controllers were very rarely used due to difficult controller tuning.
According to site personnel, it was very challenging to tune the PI loops to achieve reactivity to production
changes and long-term stability. The outcome was that most of the operators were running the thickener on
manual, meaning that a lot of operator attention was needed when production conditions changed.
As a result, the thickener was not able to maintain the required bed pressure and underflow density. Often,
the thickener tended to run too empty, with the consequence that underflow density was lost and re-
circulation had to be turned on to increase the inventory level. Varying underflow density had a direct
Paste 2017, Beijing, China 17
influence on concentrate filtration, because the decreased feed density decreased the filtration efficiency.
Another challenge caused by poor process controls emerged when more poorly settling material came into
the thickener. If the operator was unable to immediately react to the situation with a polymer dosage, the
material did not settle properly, resulting in a burst of solids to the overflow. Because the overflow was
re-circulated backwards in the process as flotation spray water, the flotation performance was also disrupted
by the solids covered with polymers.
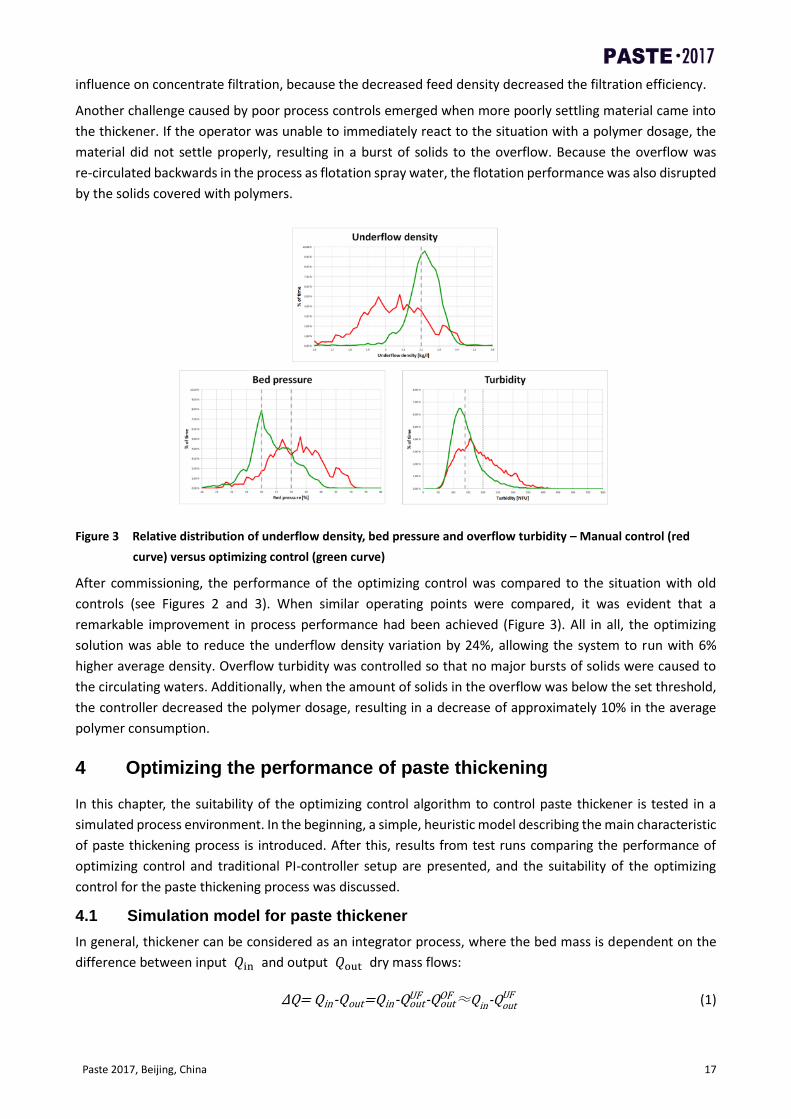
Figure 3 Relative distribution of underflow density, bed pressure and overflow turbidity – Manual control (red
curve) versus optimizing control (green curve)
After commissioning, the performance of the optimizing control was compared to the situation with old
controls (see Figures 2 and 3). When similar operating points were compared, it was evident that a
remarkable improvement in process performance had been achieved (Figure 3). All in all, the optimizing
solution was able to reduce the underflow density variation by 24%, allowing the system to run with 6%
higher average density. Overflow turbidity was controlled so that no major bursts of solids were caused to
the circulating waters. Additionally, when the amount of solids in the overflow was below the set threshold,
the controller decreased the polymer dosage, resulting in a decrease of approximately 10% in the average
polymer consumption.
4 Optimizing the performance of paste thickening
In this chapter, the suitability of the optimizing control algorithm to control paste thickener is tested in a
simulated process environment. In the beginning, a simple, heuristic model describing the main characteristic
of paste thickening process is introduced. After this, results from test runs comparing the performance of
optimizing control and traditional PI-controller setup are presented, and the suitability of the optimizing
control for the paste thickening process was discussed.
4.1 Simulation model for paste thickener
In general, thickener can be considered as an integrator process, where the bed mass is dependent on the
difference between input 𝑄in and output 𝑄out dry mass flows:
∆Q= Qin-Qout=Qin-QoutUF -Qout
OF ≈Qin-QoutUF (1)
18 Paste 2017, Beijing, China
Where the outgoing dry mass flow can be divided into the flow to the underflow 𝑄out𝑈𝐹 and flow to the
overflow 𝑄out𝑂𝐹 . In practice, 𝑄out
𝑂𝐹 is negligible when compared to the other mass flow rates, so that it can be
ignored in the modeling.
Bed mass measurement is used to represent the inventory level of the thickener. In practice, it is a pressure
measurement located in thickener underflow cone, which is calibrated to express the filling degree of the
thickener. The response from the mass flow difference ∆𝑄 to the change in bed mass 𝑚 can be represented
with a simple integrator model
G𝑚(s) = K𝑚
se−d𝑚s (2)
Where K𝑚 is process gain and d𝑚 is process delay.
Phenomena influencing the formation of underflow density are very complicated. Obtained underflow
density is dependent on the height of the solids bed, aggregate size and settling velocity of the solids material.
These are instead dependent on the fluid shear rate, flocculant dosage, particle size distribution, and solids
volumetric fraction (Remes and Vesa, 2014; Remes et al., 2009). For practical reasons, a straightforward
approach was selected for our simulator, and it was assumed that the main influencing factors affecting the
underflow density ρUF are the bed mass 𝑚 and the flocculant dosage 𝑓flocc.
G𝜌(s) = Gρm(s) + 𝐺ρ
flocc(s) (3)
The dynamic relationship between the bed mass and underflow density was expressed with a simple first
order dynamic model.
Gρm(s) =
Kρm
τρms+1
e−dρms (4)
Where time constant τρm and delay dρ
m are constants and the process gain Kρm has a logarithmic
relationship to the bed mass m.
Kρm = α ⋅ ln(m) + β (5)
Where α and β are constants.
The influence of the flocculant dosage on underflow density was taken into account with a similar first order
model.
𝐺ρflocc(𝑠) =
Kρflocc
𝜏𝜌floccs+1
e−d𝜌floccs (6)
Where all model parameters are constants. Correspondingly, similar linear first-order response models were
also used to describe the dynamics responses from flocculant dosage and incoming dry mass flow to turbidity.
Influence from underflow mass flow to overflow turbidity and from flocculant dosage to bed mass were
assumed to be negligible.
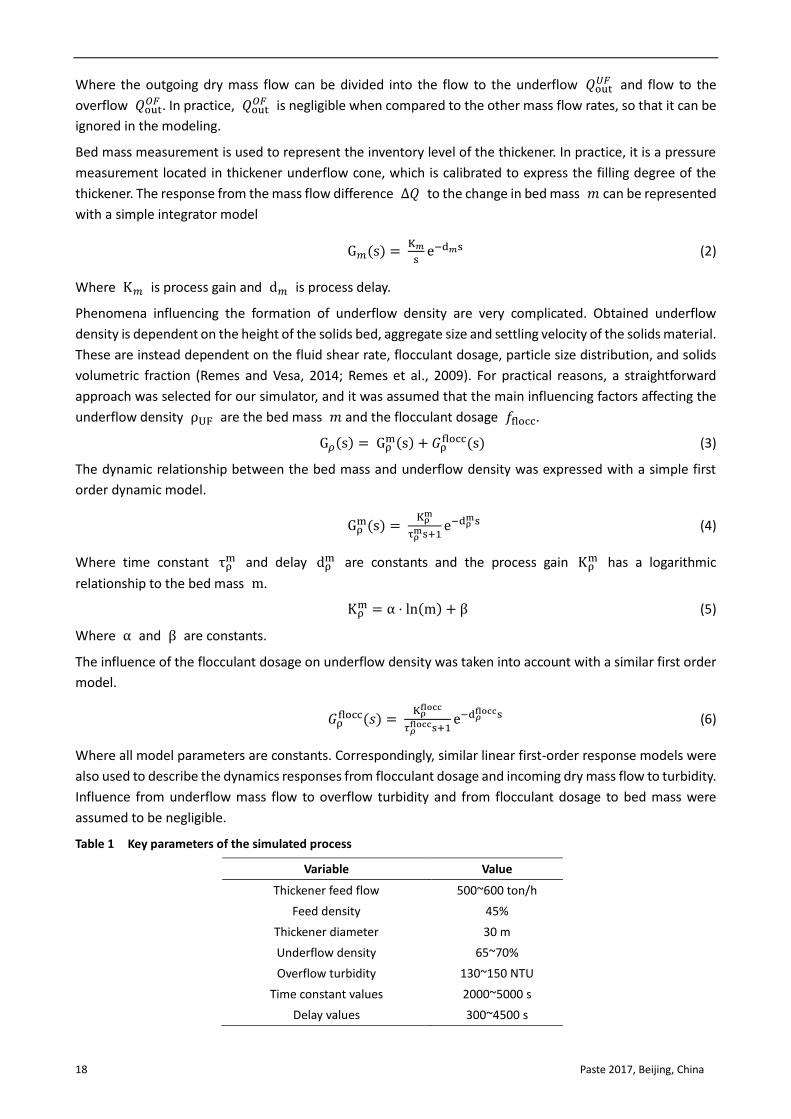
Table 1 Key parameters of the simulated process
Variable Value
Thickener feed flow 500~600 ton/h
Feed density 45%
Thickener diameter
Underflow density
Overflow turbidity
Time constant values
Delay values
30 m
65~70%
130~150 NTU
2000~5000 s
300~4500 s
Paste 2017, Beijing, China 19
The model above was parameterized to match the presumed dynamics of the tailings paste thickener. Long
delay and time constant values were used to emphasize the fact that paste thickeners are run with high
inventory levels and high retention times, resulting in a sluggish and slowly turning process. The key running
parameters of the simulator are presented in Table 1.
4.2 Test bench setup
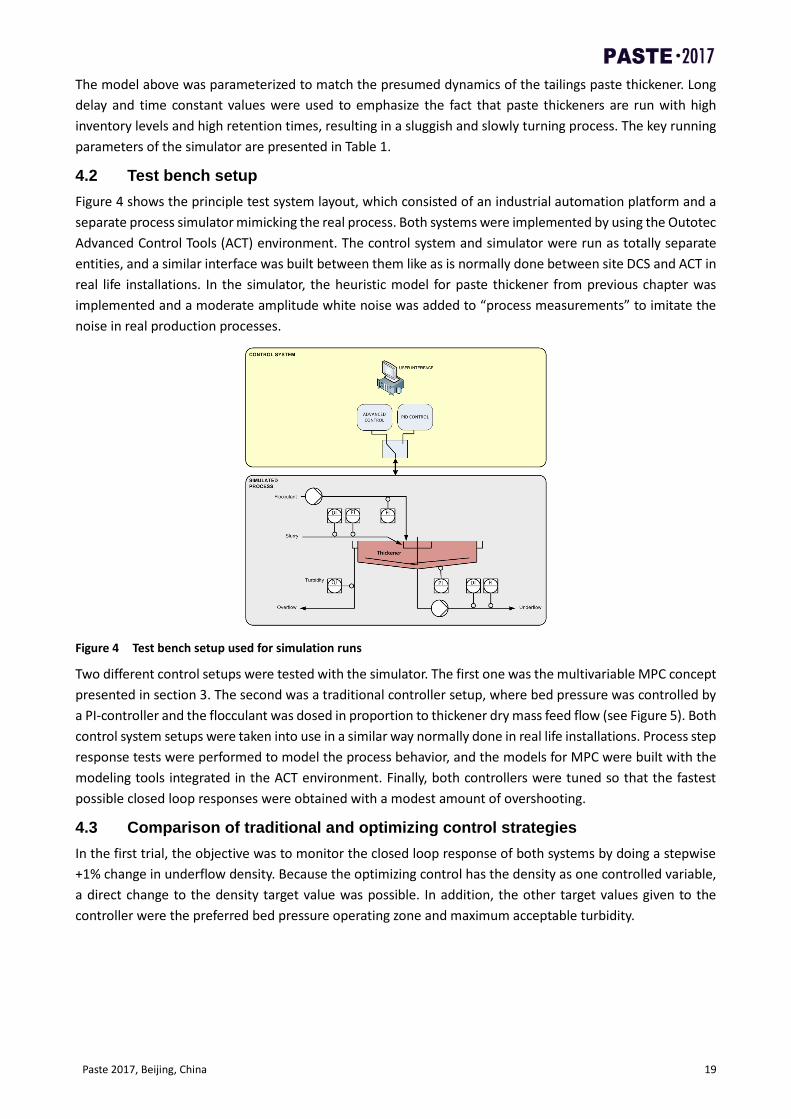
Figure 4 shows the principle test system layout, which consisted of an industrial automation platform and a
separate process simulator mimicking the real process. Both systems were implemented by using the Outotec
Advanced Control Tools (ACT) environment. The control system and simulator were run as totally separate
entities, and a similar interface was built between them like as is normally done between site DCS and ACT in
real life installations. In the simulator, the heuristic model for paste thickener from previous chapter was
implemented and a moderate amplitude white noise was added to “process measurements” to imitate the
noise in real production processes.
Figure 4 Test bench setup used for simulation runs
Two different control setups were tested with the simulator. The first one was the multivariable MPC concept
presented in section 3. The second was a traditional controller setup, where bed pressure was controlled by
a PI-controller and the flocculant was dosed in proportion to thickener dry mass feed flow (see Figure 5). Both
control system setups were taken into use in a similar way normally done in real life installations. Process step
response tests were performed to model the process behavior, and the models for MPC were built with the
modeling tools integrated in the ACT environment. Finally, both controllers were tuned so that the fastest
possible closed loop responses were obtained with a modest amount of overshooting.
4.3 Comparison of traditional and optimizing control strategies
In the first trial, the objective was to monitor the closed loop response of both systems by doing a stepwise
+1% change in underflow density. Because the optimizing control has the density as one controlled variable,
a direct change to the density target value was possible. In addition, the other target values given to the
controller were the preferred bed pressure operating zone and maximum acceptable turbidity.
20 Paste 2017, Beijing, China
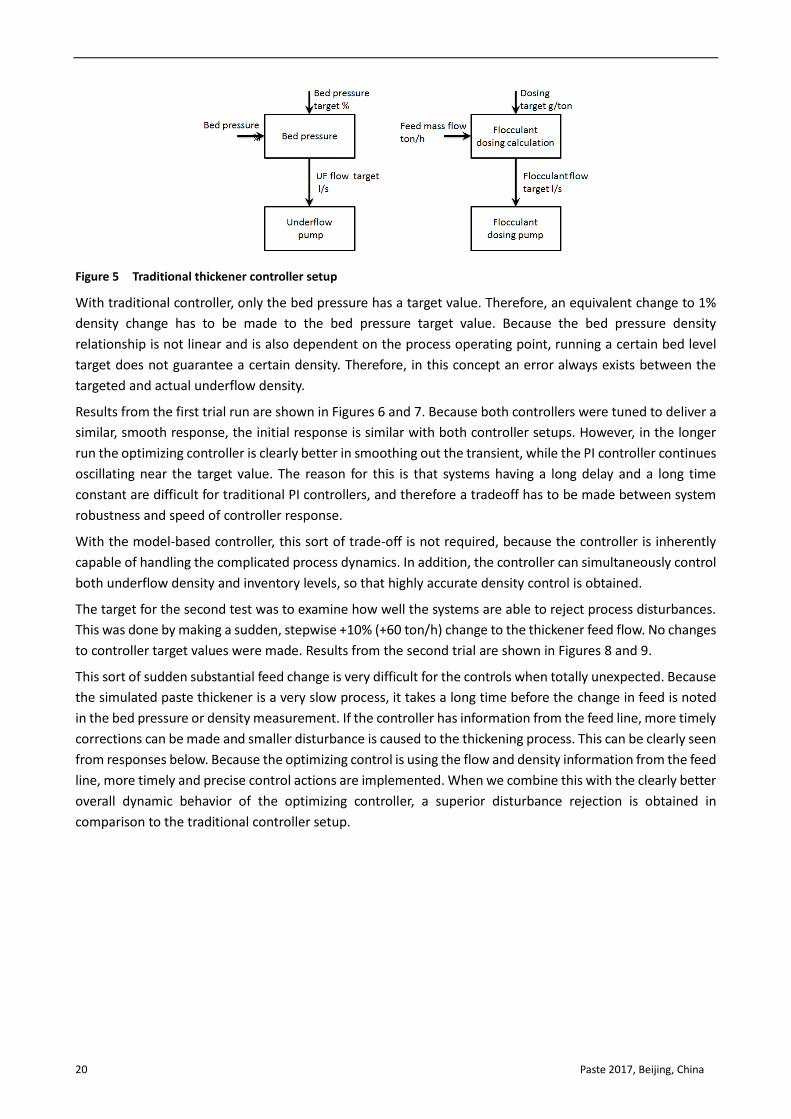
Figure 5 Traditional thickener controller setup
With traditional controller, only the bed pressure has a target value. Therefore, an equivalent change to 1%
density change has to be made to the bed pressure target value. Because the bed pressure density
relationship is not linear and is also dependent on the process operating point, running a certain bed level
target does not guarantee a certain density. Therefore, in this concept an error always exists between the
targeted and actual underflow density.
Results from the first trial run are shown in Figures 6 and 7. Because both controllers were tuned to deliver a
similar, smooth response, the initial response is similar with both controller setups. However, in the longer
run the optimizing controller is clearly better in smoothing out the transient, while the PI controller continues
oscillating near the target value. The reason for this is that systems having a long delay and a long time
constant are difficult for traditional PI controllers, and therefore a tradeoff has to be made between system
robustness and speed of controller response.
With the model-based controller, this sort of trade-off is not required, because the controller is inherently
capable of handling the complicated process dynamics. In addition, the controller can simultaneously control
both underflow density and inventory levels, so that highly accurate density control is obtained.
The target for the second test was to examine how well the systems are able to reject process disturbances.
This was done by making a sudden, stepwise +10% (+60 ton/h) change to the thickener feed flow. No changes
to controller target values were made. Results from the second trial are shown in Figures 8 and 9.
This sort of sudden substantial feed change is very difficult for the controls when totally unexpected. Because
the simulated paste thickener is a very slow process, it takes a long time before the change in feed is noted
in the bed pressure or density measurement. If the controller has information from the feed line, more timely
corrections can be made and smaller disturbance is caused to the thickening process. This can be clearly seen
from responses below. Because the optimizing control is using the flow and density information from the feed
line, more timely and precise control actions are implemented. When we combine this with the clearly better
overall dynamic behavior of the optimizing controller, a superior disturbance rejection is obtained in
comparison to the traditional controller setup.
Paste 2017, Beijing, China 21
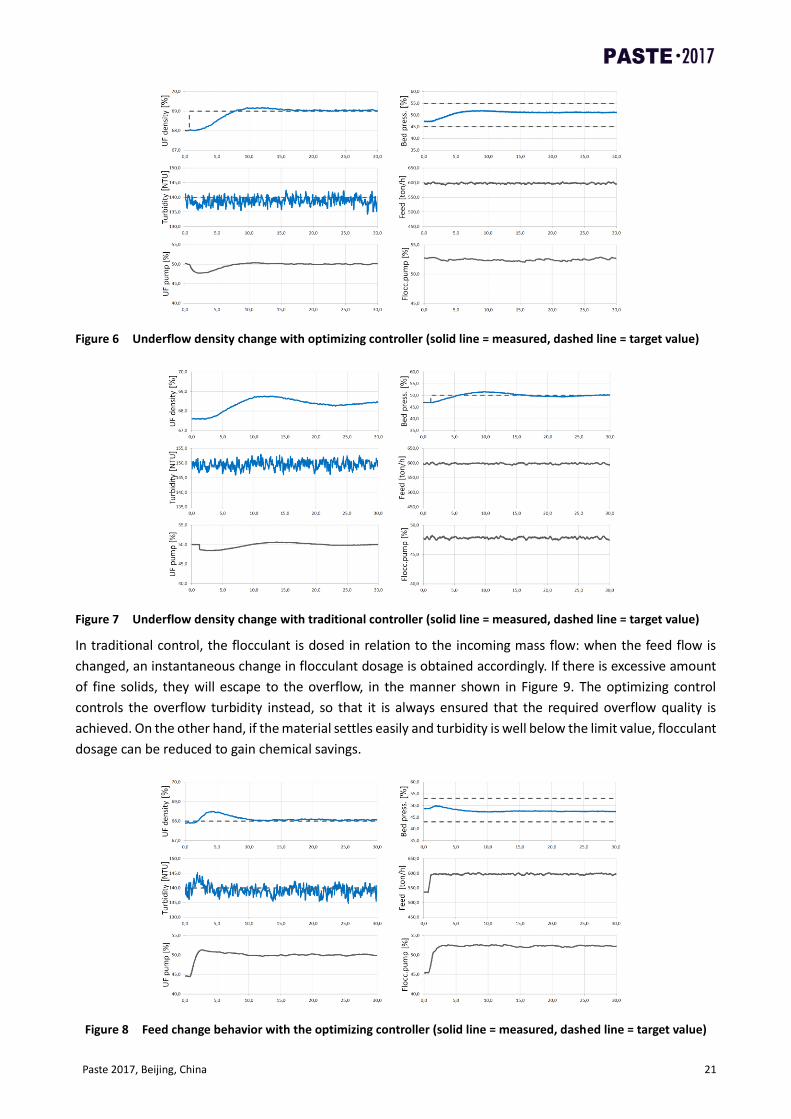
Figure 6 Underflow density change with optimizing controller (solid line = measured, dashed line = target value)
Figure 7 Underflow density change with traditional controller (solid line = measured, dashed line = target value)
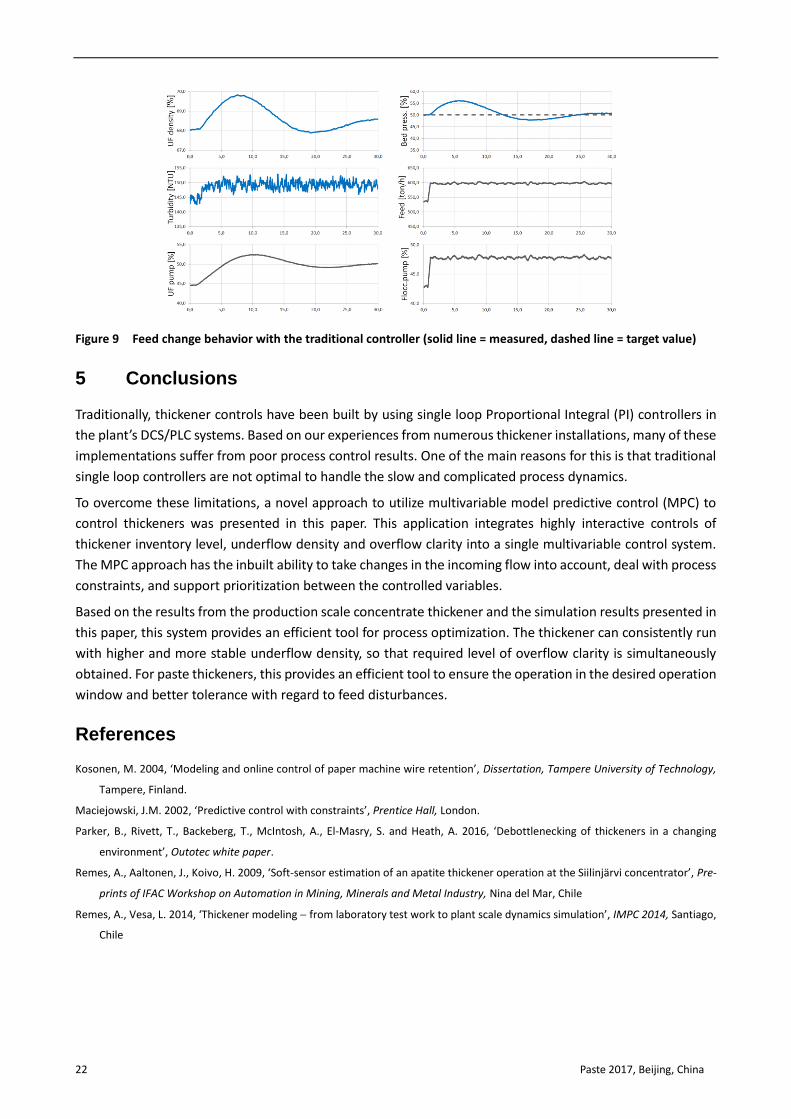
In traditional control, the flocculant is dosed in relation to the incoming mass flow: when the feed flow is
changed, an instantaneous change in flocculant dosage is obtained accordingly. If there is excessive amount
of fine solids, they will escape to the overflow, in the manner shown in Figure 9. The optimizing control
controls the overflow turbidity instead, so that it is always ensured that the required overflow quality is
achieved. On the other hand, if the material settles easily and turbidity is well below the limit value, flocculant
dosage can be reduced to gain chemical savings.
Figure 8 Feed change behavior with the optimizing controller (solid line = measured, dashed line = target value)
22 Paste 2017, Beijing, China
Figure 9 Feed change behavior with the traditional controller (solid line = measured, dashed line = target value)
5 Conclusions
Traditionally, thickener controls have been built by using single loop Proportional Integral (PI) controllers in
the plant’s DCS/PLC systems. Based on our experiences from numerous thickener installations, many of these
implementations suffer from poor process control results. One of the main reasons for this is that traditional
single loop controllers are not optimal to handle the slow and complicated process dynamics.
To overcome these limitations, a novel approach to utilize multivariable model predictive control (MPC) to
control thickeners was presented in this paper. This application integrates highly interactive controls of
thickener inventory level, underflow density and overflow clarity into a single multivariable control system.
The MPC approach has the inbuilt ability to take changes in the incoming flow into account, deal with process
constraints, and support prioritization between the controlled variables.
Based on the results from the production scale concentrate thickener and the simulation results presented in
this paper, this system provides an efficient tool for process optimization. The thickener can consistently run
with higher and more stable underflow density, so that required level of overflow clarity is simultaneously
obtained. For paste thickeners, this provides an efficient tool to ensure the operation in the desired operation
window and better tolerance with regard to feed disturbances.
References
Kosonen, M. 2004, ‘Modeling and online control of paper machine wire retention’, Dissertation, Tampere University of Technology,
Tampere, Finland.
Maciejowski, J.M. 2002, ‘Predictive control with constraints’, Prentice Hall, London.
Parker, B., Rivett, T., Backeberg, T., McIntosh, A., El-Masry, S. and Heath, A. 2016, ‘Debottlenecking of thickeners in a changing
environment’, Outotec white paper.
Remes, A., Aaltonen, J., Koivo, H. 2009, ‘Soft-sensor estimation of an apatite thickener operation at the Siilinjärvi concentrator’, Pre-
prints of IFAC Workshop on Automation in Mining, Minerals and Metal Industry, Nina del Mar, Chile
Remes, A., Vesa, L. 2014, ‘Thickener modeling from laboratory test work to plant scale dynamics simulation’, IMPC 2014, Santiago,
Chile