pdf processed with cutepdf evaluation edition … annual report 2012-13 ester industries ltd. 5 22...
TRANSCRIPT


27th Annual Report 2012-13 1ESTER INDUSTRIES LTD.
CONTENTS
Corporate Information ................................................................................................................................................2
Notice of Annual General Meeting .........................................................................................................................3
Chairman’s Message ....................................................................................................................................................6
Directors’ Report ............................................................................................................................................................8
Management Discussion & Analysis ................................................................................................................... 16
Corporate Governance Report .............................................................................................................................. 24
Auditors’ Report ......................................................................................................................................................... 37
Balance Sheet .............................................................................................................................................................. 42
Profit and Loss Account ........................................................................................................................................... 43
Cash Flow Statement ................................................................................................................................................ 44
Notes to Financial Statement ................................................................................................................................ 45
Subsidiary Details under Section 212(3) of the Companies Act, 1956 ................................................... 74
Auditors’ Report on Consolidated Financial Statement ............................................................................... 75
Consolidated Balance Sheet .................................................................................................................................. 76
Consolidated Profit and Loss Account . ............................................................................................................. 77
Consolidated Cash Flow Statement .................................................................................................................... 78
Notes to Consolidated Financial Statement .................................................................................................... 79
Subsidiary Financial Information under Section 212(8) of the Companies Act, 1956 ....................108
E-mail Registration Form .......................................................................................................................................109
Attendance Sheet and Proxy Form ...................................................................................................................111

2 ESTER INDUSTRIES LTD. 27th Annual Report 2012-13
CORPORATE INFORMATION
BOARD OF DIRECTORS MR. ARVIND KUMAR SINGHANIA NON - EXECUTIVE CHAIRMAN
MR. V. B. HARIBHAKTI DIRECTOR
MR. A. K. NEWATIA DIRECTOR
MR. M. S. RAMACHANDRAN DIRECTOR
MR. DINESH CHANDRA KOTHARI DIRECTOR
DR. ANAND CHAND BURMAN DIRECTOR
MR. P. S. DASGUPTA DIRECTOR
MR. PRADEEP KUMAR RUSTAGI EXECUTIVE DIRECTOR & CFO
MR. ASHOK KUMAR AGARWAL EXECUTIVE DIRECTOR - OPERATIONS & PROJECTS
COMPANY SECRETARY MR. DIWAKER DINESH
STATUTORY AUDITORS M/S S.R. BATLIBOI & CO. LLP, GURGAON
BANKERS BANK OF INDIA
BANK OF BARODA
UNION BANK OF INDIA
CANARA BANK
STATE BANK OF BIKANER & JAIPUR
HEAD OFFICE PLOT NO. 11, BLOCK-A, INFOCITY-I,
SECTOR 33 & 34, GURGAON-122001, HARYANA
REGISTERED OFFICE & WORKS SOHAN NAGAR, P.O. CHARUBETA
KHATIMA – 262 308, DISTRICT UDHAM SINGH NAGAR
UTTARAKHAND
REGISTRAR & SHARE MCS LIMITED
TRANSFER AGENTS F-65, OKHLA INDUSTRIAL AREA, PHASE-I
NEW DELHI – 110 020
LISTING OF SECURITIES BOMBAY STOCK EXCHANGE LIMITED
PHIROZE JEEJEEBHOY TOWERS
25TH FLOOR, DALAL STREET
MUMBAI 400 001
NATIONAL STOCK EXCHANGE OF INDIA LTD.
EXCHANGE PLAZA,
PLOT NO. C/1, G BLOCK,
BANDRA-KURLA COMPLEX, BANDRA (E)
MUMBAI - 400 051

27th Annual Report 2012-13 3ESTER INDUSTRIES LTD.
NOTICE
NOTICE is hereby given that the 27th ANNUAL GENERAL MEETING of ESTER INDUSTRIES LIMITED will be held on 30th September, 2013 at 11.30 AM at the Registered Office of the Company at Sohan Nagar, P.O. Charubeta, Khatima - 262308, District Udham Singh Nagar, Uttarakhand, to transact the following business:
Ordinary Business
1. To receive, consider and adopt the Audited Balance Sheet as on 31st March 2013 and the Profit and Loss account for the year ended on that date together with the reports of Directors and Auditors thereon.
2. To appoint a Director in place of Dr. Anand Chand Burman who retires by rotation and being eligible, offers himself for re-appointment;
3. To appoint a Director in place of Mr. P. S. Dasgupta who retires by rotation and being eligible, offers himself for re-appointment;
4. To consider and, if thought fit, to pass with or without modification(s), the following resolution as an Ordinary Resolution:-
“RESOLVED THAT subject to the provisions of Section 224 & 225 and other applicable provisions, if any, of the Companies Act, 1956, M/s. S.R. Batliboi & Associates LLP, Chartered Accountants, be and are hereby appointed as Statutory Auditors of the Company to hold office from the conclusion of this Annual General Meeting upto the conclusion of the next Annual General Meeting in place of the retiring Auditors, M/s S.R. Batliboi & Co. LLP, Chartered Accountants, at a remuneration to be fixed by the Board of Directors
By Order of the Board of DirectorsFor Ester Industries Limited
Place : Gurgaon Diwaker DineshDate : 5th August, 2013 Company Secretary
NOTES
1) A MEMBER ENTITLED TO ATTEND AND VOTE AT THIS ANNUAL GENERAL MEETING IS ENTITLED TO APPOINT ONE OR MORE PROXIES TO ATTEND AND VOTE (ON A POLL ONLY) ON HIS/HER BEHALF AND A PROXY NEED NOT BE A MEMBER OF THE COMPANY. PROXIES IN ORDER TO BE EFFECTIVE MUST BE RECEIVED AT THE REGISTERED OFFICE OF THE COMPANY AT SOHAN NAGAR, P.O. CHARUBETA, KHATIMA-262308, DISTRICT UDHAM SINGH NAGAR, UTTARAKHAND NOT LESS THAN 48 HOURS BEFORE THE MEETING.
2) The relevant details of Item Nos. 2 and 3 pursuant to Clause 49 of the Listing Agreement are annexed hereto.
3) The Register of Member and Share Transfer Books will remain closed from Monday, 23rd September, 2013 to Friday, 27th September, 2013 for the purpose of Annual General Meeting.
4) In case of Joint holders attending the meeting, only such Joint holder who is higher in the order of names will be entitled to vote.
5) Corporate Members intending to send their Authorized Representative to attend the Meeting are requested to send a certified true copy of the Board Resolution authorizing their representative to attend and vote on their behalf at the meeting.
6) Members are requested to notify immediately:
I . In case shares are held in physical form: any change in address, if any, to the Company at Plot No.11, Block-A, Infocity-I, Sector 33 & 34, Gurgaon – 122001 , India or to the Registrar and Share Transfer Agent of the Company viz. MCS Limited, F-65, Okhla Industrial Area Phase I, New Delhi- 110 020 quoting their folio number.
II. In case shares are held in dematerialised form: any change in address, if any, to their Depository Participants
7) Members/Proxies should bring Annual Report along with the attendance slip duly filled in for attending the Meeting. Members who hold shares in dematerialised form are requested to write their Client ID and DP ID and those who hold shares in physical form are requested to write their Folio Number in the attendance slip for attending the Meeting.
8) Members desiring any information on the accounts are required to write to the Company at Plot No.11, Block-A, Infocity-I, Sector 33 & 34, Gurgaon – 122001, India at least 7 days before the Meeting so as to enable the management to

4 ESTER INDUSTRIES LTD. 27th Annual Report 2012-13
keep the information ready. Replies will be provided only at the Meeting.
9) All the documents referred to in the accompanying Notice are open for inspection at the Registered Office of the Company between 11.00 a.m. to 1.00 p.m. on all the working days except Saturday up-to the date of the Annual General Meeting.
10) Pursuant to Section 205A and 205C of the Companies Act, 1956, any money transferred to the Unpaid Dividend Account of the Company, which remains Unpaid or Unclaimed for a period of 7 (Seven) years from the date of such transfer to the Unpaid Dividend Account shall be transferred by the Company to the Investor Education and Protection Fund (IEPF) established by the Central Government and the shareholders shall not be able to claim any unpaid dividend from the said fund from the Company thereafter.
The Unclaimed and Unpaid final dividend for the year 2004-05, had been transferred to IEPF on 7th November, 2013. The Company had not declared any dividend for financial years 2005-06, 2006-07 and 2011-12.
Members who have not yet encashed their dividend warrant(s) for the financial year 2007-08 to 2010-11 are requested to claim the amount of dividend from the Company immediately. The details of the said unclaimed/unpaid dividend are available on the Company's website viz. www.esterindustries.com as well as on the website of Ministry of Corporate Affairs viz. www.iepf.gov.in.
NOTE ON APPOINTMENT OF M/S. S. R. BATLIBOI & ASSOCIATES LLP, CHARTERED ACCOUNTANTS AS STATUTORY AUDITORS OF THE COMPANY (ITEM NO. 4)
M/s S.R. Batliboi & Co. LLP, Chartered Accountants who retires at this Annual General Meeting has shown its unwillingness for reappointment as Statutory Auditors of the Company and has not offered themselves for reappointment.
Further the Company has received special notice of a resolution from a Member of the Company, in terms of the applicable provisions of the Act, signifying his intention to propose the appointment of M/s. S. R. Batliboi & Associates LLP as the statutory auditors, in place of existing Statutory Auditors, of the Company from the conclusion of this AGM till the conclusion of the next AGM of the Company.
M/s. S. R. Batliboi & Associates LLP has expressed its willingness to act as statutory auditors of the Company, if appointed, and have further confirmed that the said appointment would be in conformity with the provisions of Section 224(1B) of the Act.
The Members’ approval is being sought for the appointment of M/s. S. R. Batliboi & Associates LLP as the statutory auditors and to authorise the Board of Directors to determine the remuneration payable to them. None of the Directors is concerned or interested in this resolution.
INFORMATION OF DIRECTORS SEEKING APPOINTMENT/REAPPOINTMENT AS REQUIRED UNDER CLAUSE 49 OF THE LISTING AGREEMENT
The particulars of Directors seeking appointment/re-appointment as required under clause 49 of the listing agreement are given below:
A. Dr. Anand Chand Burman
Dr. Anand Chand Burman is an eminent Industrialist having expertise in Oncology, Active Pharmaceutical Ingredients and Formulations. He is a leading figure specializing in the area of research and development, invention of new drugs, pharmaceuticals, medicines and chemicals in all or any of the systems of medicines. He is Doctorate in Pharmaceutical Chemistry from University of Kansas, USA.
Directorships of Dr. Anand Chand Burman as on 31st March, 2013 are as follows:
S. No. Name of the Company
1 Dabur India Limited
2 Dabur Pharmaceuticals Limited
3 Dabur International Limited
4 Dabur UK Limited
5 B. A. Holdings Pvt. Ltd.
6 Dabur Research Foundation
7 Hindustan Motors Limited
8 Puran Associates Pvt. Ltd.
9 ACEE Enterprises
10 Excellent (India) Pvt. Limited
11 Milky Investments & Trading Co.
12 Moonlight Ranch Pvt. Ltd.
13 H & B Stores Ltd.
14 IMB Infrastructures Pvt. Ltd.
15 Vansh Holdings Pvt. Ltd.
16 KBC India Pvt. Ltd.
17 Aviva Life Insurance Company India Ltd.
18 Vic Enterprises Pvt. Ltd.
19 Althea Lifesciences Limited
20 Hero Motocorp Ltd.
21 Windy Investments Pvt. Ltd.
27th Annual Report 2012-13 5ESTER INDUSTRIES LTD.
22 M. B. Finmart Pvt. Ltd.
23 A.V.B. Finance Pvt. Ltd.
24 Diwan Chand Medical Services Pvt. Ltd.
25 Hobi Kosmetik
26 Dermoviva Skin Essentials Inc.
27 Diwan Chand Radnet Services Pvt. Ltd.
28 Diwan Chand Integral Health Services Pvt. Ltd.
29 Asia Pacific Healthcare Pvt. Ltd.
30 Windy Finvest Pvt. Ltd.
31 Dabur Securities Pvt. Ltd.
Membership of Dr. Anand Chand Burman in Committees of the Board as on 31st March, 2013 is as follows:
S. No.
Name of the Company
Nature of Committee Designation
1 Dabur India Limited
Remuneration Committee
Member
Dr. Anand Chand Burman has no relationship with other Directors of the Company. He does not have any shareholding in the Company.
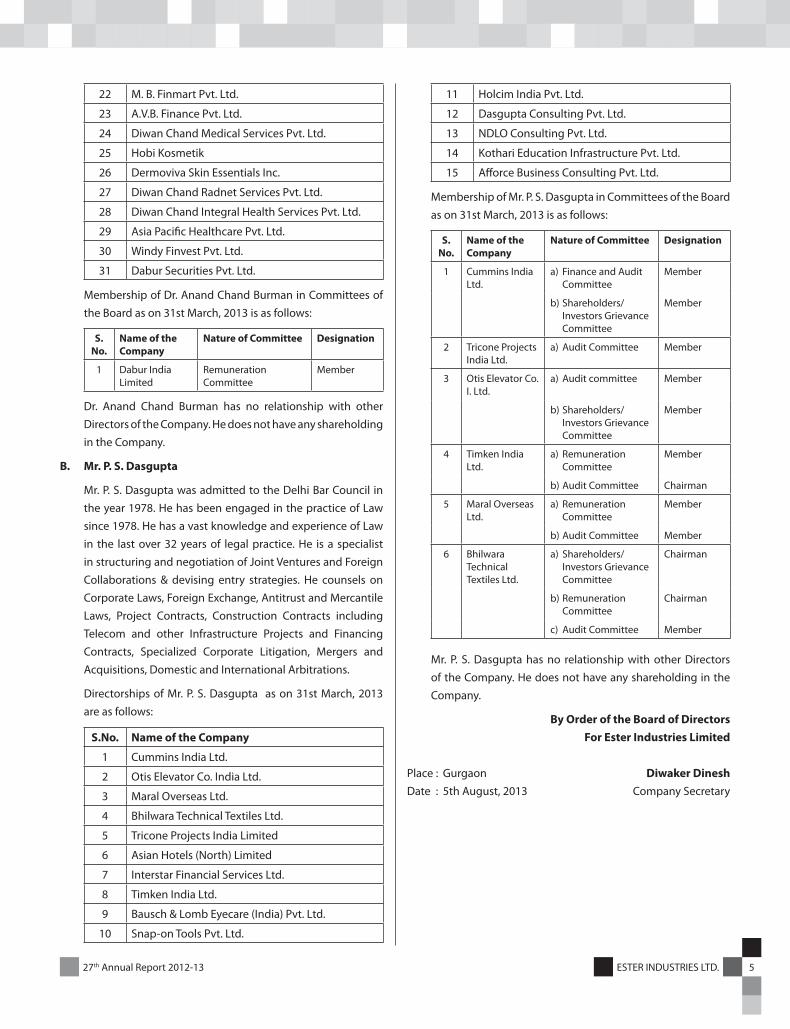
B. Mr. P. S. Dasgupta
Mr. P. S. Dasgupta was admitted to the Delhi Bar Council in the year 1978. He has been engaged in the practice of Law since 1978. He has a vast knowledge and experience of Law in the last over 32 years of legal practice. He is a specialist in structuring and negotiation of Joint Ventures and Foreign Collaborations & devising entry strategies. He counsels on Corporate Laws, Foreign Exchange, Antitrust and Mercantile Laws, Project Contracts, Construction Contracts including Telecom and other Infrastructure Projects and Financing Contracts, Specialized Corporate Litigation, Mergers and Acquisitions, Domestic and International Arbitrations.
Directorships of Mr. P. S. Dasgupta as on 31st March, 2013 are as follows:
S.No. Name of the Company
1 Cummins India Ltd.
2 Otis Elevator Co. India Ltd.
3 Maral Overseas Ltd.
4 Bhilwara Technical Textiles Ltd.
5 Tricone Projects India Limited
6 Asian Hotels (North) Limited
7 Interstar Financial Services Ltd.
8 Timken India Ltd.
9 Bausch & Lomb Eyecare (India) Pvt. Ltd.
10 Snap-on Tools Pvt. Ltd.
11 Holcim India Pvt. Ltd.
12 Dasgupta Consulting Pvt. Ltd.
13 NDLO Consulting Pvt. Ltd.
14 Kothari Education Infrastructure Pvt. Ltd.
15 Afforce Business Consulting Pvt. Ltd.
Membership of Mr. P. S. Dasgupta in Committees of the Board as on 31st March, 2013 is as follows:
S. No.
Name of the Company
Nature of Committee Designation
1 Cummins India Ltd.
a) Finance and Audit Committee
Member
b) Shareholders/ Investors Grievance Committee
Member
2 Tricone Projects India Ltd.
a) Audit Committee Member
3 Otis Elevator Co. I. Ltd.
a) Audit committee Member
b) Shareholders/ Investors Grievance Committee
Member
4 Timken India Ltd.
a) Remuneration Committee
Member
b) Audit Committee Chairman
5 Maral Overseas Ltd.
a) Remuneration Committee
Member
b) Audit Committee Member
6 Bhilwara Technical Textiles Ltd.
a) Shareholders/ Investors Grievance Committee
Chairman
b) Remuneration Committee
Chairman
c) Audit Committee Member
Mr. P. S. Dasgupta has no relationship with other Directors of the Company. He does not have any shareholding in the Company.
By Order of the Board of DirectorsFor Ester Industries Limited
Place : Gurgaon Diwaker DineshDate : 5th August, 2013 Company Secretary

6 ESTER INDUSTRIES LTD. 27th Annual Report 2012-13
CHAIRMAN’S MESSAGE
Dear shareholders,
I am pleased to present the Annual report for the financial year
2012-13 and share with you the developments and progress.
The year 2012-13 has been quite challenging as the world economy
continues to endeavor to stabilize at marginal growth levels. While
certain developed economies (especially the Eurozone) grappled
with their financial woes, there were indications of a recovery in
North America. However the growth in emerging markets was
slower than expected. Areas such as Africa and the Middle East
continue to address challenging socio-political conditions.
India was also affected by the global uncertainties. India’s GDP
grew at a rate of 5% in 2012-13 as compared to 6.9% in 2011-
12, the lowest in a decade. There is a significant economic
slowdown, primarily due to deceleration in industrial growth,
more specifically in private investment. Rising cost of credit and
weak domestic business sentiment, added to this decline. Taking
a macro view of the overall economy and keeping in mind the
difficult global environment, the RBI expects the GDP growth in
2013-14 to be around 6.1 – 6.7%.
The year 2012-13 presented many challenges to the BOPET Film
SBU (Strategic Business Unit) due to demand supply mismatch
due to over capacity additions and subdued economic growth
in global markets. Additional global capacities commenced
production coupled with a weak demand environment had a
significant impact on pricing in the second half of the year.
Ester maintained its focus on value added and specialty products
through the year and delivered a volume growth of 18% on
this portfolio. The share of the value added product portfolio
increased from 18% to 21% of the overall business and thereby
partially mitigated the challenges of the operating environment.
Ester’s R&D efforts enabled the launch of two new products
which were well accepted by select markets. Ester strengthened
its efforts towards long term partnerships with key customers
and the response has been very encouraging. Ester endeavored
to build on a portfolio of developmental projects with key FMCG
players via a process of co-creation based on consumer insights.
The relentless focus on cost leadership continued in 2012-13. An
investment was made in another biomass fired boiler to meet
27th Annual Report 2012-13 7ESTER INDUSTRIES LTD.
the energy needs of our manufacturing facility, which would be
commissioned in the following year. Further, a reclaim extruder
was installed in our largest film production line which resulted in
a 40% reduction of the accumulated reclaim.
The Engineering Plastics SBU staged a significant recovery in
2012-13, recording a material sales growth of around 50%, much
ahead of Industry growth. Focused customer acquisition process
and improved product range enabled us to enhance the active
customer base by ~ 50%. Approvals were secured from various
OEMs in the automotive, electrical and appliances industries.
Efforts towards development of cost-effective formulations
yielded desired results in the increasingly competitive market
environment.
We plan to maintain our aggressive growth strategy in 2013-14 and
have planned for capacity enhancement to support our growth
aspirations. We expect to further improve our performance, with
respect to sales as well as profitability, by continuing to focus
on new product/application development, consistent product
quality and rapid response to customer needs.
The Specialty Polymers SBU made material progress by way of
developing the Polyester grades, PEN (Poly Ethylene Naphthalate)
& Specialty PBT (Poly Butylene Terephtahlate). Developmental
efforts in partnership with global companies have been put
into place to expedite the product trials & qualifications. Hot-fill
PET, Dish-washable PET & EBM PET are other products which are
expected to pave the forward for volume growth in this business.
Ester has also developed specialty PET grades based on PCR (Post
Consumer Recycled) PET.
Recession in Europe has globally affected the PET rigid packaging
market. Demand for rigid packaging is growing uniformly at a
CAGR of 10%, in spite of a significant growth in recycling. The
interest in recycling and sustainability is seen to be increasing
with many entities devoting resources to work on bio derived
monomers.
Ester is concerned for the environment and is committed to
sustainability. Our focus in this area is evident by the following
efforts:
1. Commercial launch of PCR (Post Consumer Recyled) BOPET
films.
2. Usage of bio-mass to replace fossil fuels.
3. Increasing usage of bio-based raw material.
4. Exploring and experimenting with ox—biodegradable
BOPET films.
You will be happy to note that as a result of these efforts, Ester has
reduced its carbon footprint (fossil fuel consumption per unit) by
more than 80% over the last ten years and we endeavor to further
reduce the same in the coming years. I remain personally involved
in all efforts related to sustainability.
While the journey around people initiatives continued, the year
2012-13 witnessed efforts enabling change management. The
robust implementation of our Performance Management System
(PACE) combined with the deployment of the Ester Competency
Framework (Esterian DNA) challenged the team to not only bring
about a positive change in their behaviors, but also brought
about an appreciation for results rather than efforts. This was
made possible by executing a road map which included regular
communication and engagement with employees at various
levels and structured training interventions. With an objective of
creating a talent pool, we plan to take our people development
initiatives to the next level by introducing High Potential
management and Succession Planning programs.
Going forward, the two strategic priorities are profitable growth
and sustainability. To progress this critical agenda, Ester would
continue to focus on developing a robust customer portfolio,
long term sales agreements and product mix. Long term and
productive relationships with key accounts (whose priorities are
aligned with Ester’s innovation and development efforts) will
determine the customer portfolio. The developing product mix
will focus on specialty products and customized solutions for
valued customers. Ester aspires to be the solution provider of
choice.
I would like to take this opportunity to thank all stakeholders,
including my fellow directors for their support and guidance.
I look forward to your confidence and engagement as we take our
company towards a promising future.
With regards,
Arvind Kumar Singhania
Chairman
8 ESTER INDUSTRIES LTD. 27th Annual Report 2012-13
DIRECTORS’ REPORT
To The Members
Your directors are pleased to present the Twenty Seventh Annual Report together with Audited Statement of Accounts of your Company
for the year ended 31st March 2013.
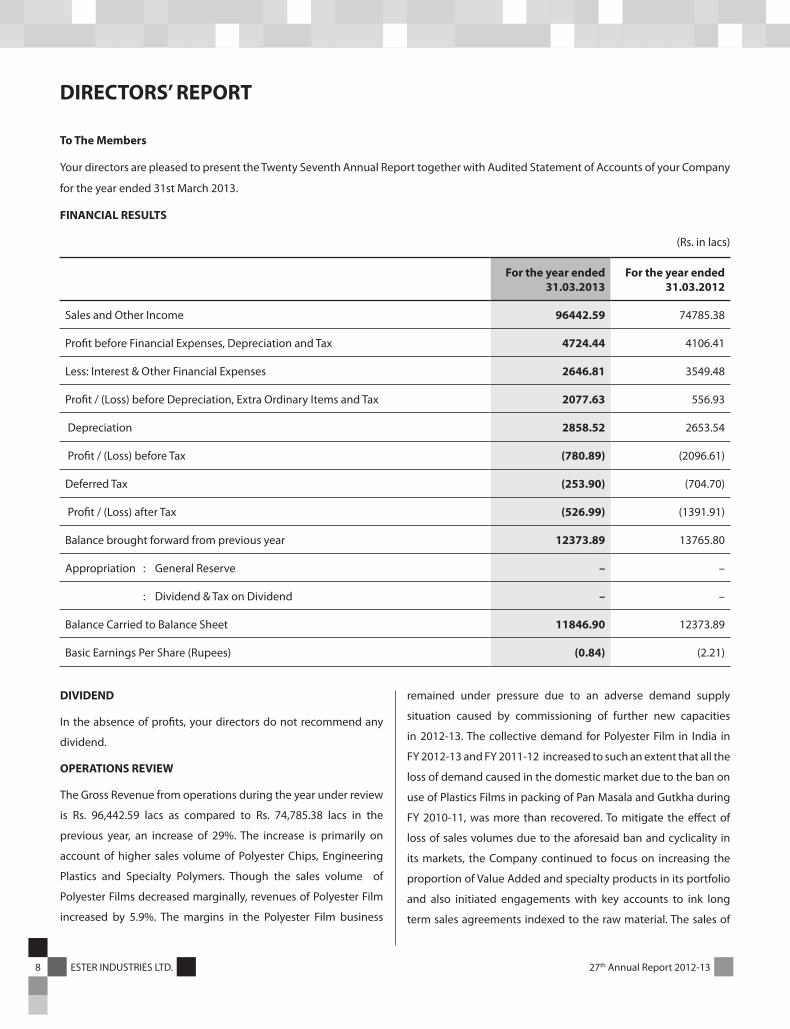
FINANCIAL RESULTS
(Rs. in lacs)
For the year ended 31.03.2013
For the year ended 31.03.2012
Sales and Other Income 96442.59 74785.38
Profit before Financial Expenses, Depreciation and Tax 4724.44 4106.41
Less: Interest & Other Financial Expenses 2646.81 3549.48
Profit / (Loss) before Depreciation, Extra Ordinary Items and Tax 2077.63 556.93
Depreciation 2858.52 2653.54
Profit / (Loss) before Tax (780.89) (2096.61)
Deferred Tax (253.90) (704.70)
Profit / (Loss) after Tax (526.99) (1391.91)
Balance brought forward from previous year 12373.89 13765.80
Appropriation : General Reserve – –
: Dividend & Tax on Dividend – –
Balance Carried to Balance Sheet 11846.90 12373.89
Basic Earnings Per Share (Rupees) (0.84) (2.21)
DIVIDEND
In the absence of profits, your directors do not recommend any
dividend.
OPERATIONS REVIEW
The Gross Revenue from operations during the year under review
is Rs. 96,442.59 lacs as compared to Rs. 74,785.38 lacs in the
previous year, an increase of 29%. The increase is primarily on
account of higher sales volume of Polyester Chips, Engineering
Plastics and Specialty Polymers. Though the sales volume of
Polyester Films decreased marginally, revenues of Polyester Film
increased by 5.9%. The margins in the Polyester Film business
remained under pressure due to an adverse demand supply
situation caused by commissioning of further new capacities
in 2012-13. The collective demand for Polyester Film in India in
FY 2012-13 and FY 2011-12 increased to such an extent that all the
loss of demand caused in the domestic market due to the ban on
use of Plastics Films in packing of Pan Masala and Gutkha during
FY 2010-11, was more than recovered. To mitigate the effect of
loss of sales volumes due to the aforesaid ban and cyclicality in
its markets, the Company continued to focus on increasing the
proportion of Value Added and specialty products in its portfolio
and also initiated engagements with key accounts to ink long
term sales agreements indexed to the raw material. The sales of

27th Annual Report 2012-13 9ESTER INDUSTRIES LTD.
Value Added products and Specialty films increased from 8898
MT in 2011-12 to 10493 MT in 2012-13
To counter the threat of cheaper imports of Engineering Plastics in
CFL segment, development of cost effective formulations yielded
the desired results and the Company could regain erstwhile lost
market share. The Company witnessed a material growth of 49%
in sales of Engineering Plastics products. Consequently, the Net
Sales of Engineering Plastics increased from Rs. 7,036.84 lacs to
Rs. 10,528.07 lacs.
As a result of a focused strategy adopted by the management, the
sales of Polyester Chips increased by about 180% both in quantity
and value terms.
The Company’s initiative to diversify into Specialty Polymers is
on track and is likely to yield good results in the following years.
The Sales volume of Specialty Polymers increased from 472 MT
in FY2011-12 to 2241 MT in FY2012-13, an increase of 375% with
corresponding sales value increasing from Rs. 568.98 lacs to
Rs. 3983.68 lacs.
As a result of various initiatives and capacity expansions over the
last five years, the Net Sales have grown at a CAGR of 22% pa,
viz from Rs. 31,918.21 lacs in FY2007-08 to Rs. 87,129.44 lacs in
FY2012-13.
The production of Polyester Film was marginally lower at 50,076
MT as compared to 51,744 MT during the year 2011-12. The
capacity utilization in Polyester Films was approx. 88%, which is
a good performance considering that the capacity was enhanced
in FY 2010-11.
Pursuant to the clarification issued by Ministry of Corporate
Affairs, Government of India dated 9th August 2012, the foreign
exchange fluctuation on foreign currency borrowings for Capital
goods has been capitalized. Interest and financial expenses
during the year under review were 2.99% of Net Sales with overall
leveraging at prudent levels of 1.48.
Subsequent to the registration of Bio-mass based Thermal
Energy generation project of the Company by the Executive
Board of the Clean Development Mechanism (CDM) under
United Nations Framework Convention on Climate Change in its
meeting dated 15th April 2011, the Company has started to earn
Certified Emissions Reductions (CERs) with effect from November
2010. As the Company is aware of ongoing global environment
concerns, it has committed to enhance its Thermal Energy
generation capacity by installing an additional Bio-mass based
Thermal Energy generation project of 10 million kilo calories
during FY2013-14 to reduce its dependence on Furnace Oil based
thermal energy generation.
Details on operations, a view on the outlook for the current
year and various strategies (internal and external) adopted by
the Management are provided in the ‘Management Discussion
& Analysis Report’ which forms an integral part of this Annual
Report.
CORPORATE OFFICE BUILDING
During the year under review, the Company moved its Corporate
Office from a rented premises in the Central Business District
of Gurgaon to a self owned premises in the upcoming area of
Infocity, Gurgaon.
DEBOTTLENECKING AND MODERNIZATION PROJECTS
The Company has undertaken to invest about Rs. 60 crores during
FY 2013-14 in various initiatives that will enhance capability /
capacity to increase production of Value Added products, reduce
Power & Fuel cost and improve operating efficiency. By the end
of FY2013-14, Company would be commissioning additional
extrusion capacity of 8000 MT per annum in Engineering Plastics.
With this expansion, the operating capacity in Engineering Plastics
will increase from 8500 MT per annum to 16500 MT per annum.
SCHEME OF ARRANGEMENT
Ester Industries Limited (Transferee) has entered into a Scheme
of Amalgamation with M/s. Sriyam Impex Private Limited
(Transferor). Your directors have already approved the Scheme.
After the implementation of the Scheme, M/s. Sriyam Impex
Private Limited will be merged into your company. The Company
has obtained ‘No Objection Certificates’ from NSE and BSE as per
Listing Agreement and as on date, the company is in process to
file the petition to Hon’ble High Court of Uttarakhand.
SUBSIDIARY COMPANIES
Pursuant to Circular no. 2/2011 dated 8th February, 2011 of
Ministry of Corporate Affairs (MCA), the Company has not
attached Annual Accounts and other statutory reports of Ester
International (USA) Limited (Subsidiary of Ester Industries Limited)
for financial year 2012-13, subject to compliance of conditions
stated in the Circular.

10 ESTER INDUSTRIES LTD. 27th Annual Report 2012-13
Further the Annual Accounts of the Subsidiary Company and
the related detailed information shall be made available to the
members of the Company or its subsidiary on their request. Such
Annual Accounts shall also be kept for inspection by any member
at the Corporate Office and Registered Office of the Company and
its subsidiary. The same is also available on company’s website
viz. www.esterindustries.com.
FIXED DEPOSIT
The Company has not accepted any deposit during the year.
DIRECTORS
Mr. P S Dasgupta and Dr. Anand Chand Burman, directors of the
Company, retire by rotation and being eligible, offer themselves
for reappointment at the ensuing Annual General Meeting.
CORPORATE GOVERNANCE
The Company has complied with the mandatory provisions of
Corporate Governance as prescribed in the Listing Agreement
with the Stock Exchanges. A separate report on Corporate
Governance is included as a part of the Annual Report along with
the practicing Company Secretary’s Certificate on its compliance.
DIRECTORS’ RESPONSIBILITY STATEMENT
Pursuant to the requirement under Section 217(2AA) of the
Companies Act, 1956 with respect to the Directors’ Responsibility
Statement, the Directors confirm the following, on the basis
of information placed before them by the Management and
Auditors: -
1. That in the preparation of the annual accounts for the
Financial Year ended 31st March 2013 the applicable
Accounting Standards has been followed;
2. That the Company has selected appropriate accounting
policies and applied them consistently and made judgment
and estimates that were reasonable and prudent, so as to
give a true and fair state of the affairs of the Company at the
end of the financial year and of the Profit and Loss of the
Company for the year under review;
3. That the Company has taken proper and sufficient care
for the maintenance of adequate accounting records in
accordance with the provisions of the Companies Act,
1956 for safeguarding the assets of the Company and for
preventing and detecting fraud and other irregularities; and
4. That the accounts of the Company for the financial year
ended 31st March 2013 have been prepared on a going
concern basis.
The Company’s Internal Auditors have conducted periodic audit
to evaluate the adequacy & effectiveness of internal controls and
to provide reasonable assurance that the Company’s established
systems, policies and procedures have been followed. The Audit
Committee constituted by the Board reviews the internal controls
and financial reporting issues with Internal Auditors on regular basis.
CODE OF CONDUCT
The Code of Conduct, as adopted by the Board of Directors,
is applicable to all Directors and senior management of the
Company. They have affirmed compliance with the Code of
Conduct. A declaration to this effect duly signed by Executive
Director – Operations & Projects is enclosed as a part of the
Corporate Governance Report. A copy of the Code of Conduct is
available on the Company’s website viz. www.esterindustries.com
The Code of Conduct is based on the fundamental principles of
good corporate governance and corporate citizenship. The Code
covers the Company’s commitment to sustainable development,
concern for occupational health, safety and environment, a
gender friendly workplace, transparency, auditability and legal
compliance.
CONSOLIDATED FINANCIAL STATEMENT
In accordance with the Accounting Standard AS-21 on
Consolidated Financial Statements, your directors have made
available the audited Consolidated Financial Statements in the
Annual Report.
AUDITORS’ REPORT
The Auditors’ Report read together with Annexures referred
to in Paragraph 3 of the Auditors’ Report do not contain any
qualification of significant nature and do not call for any
explanation/clarification.
STATUTORY AUDITORS
M/s S.R. Batliboi & Co. LLP, Chartered Accountants who retires at this Annual General Meeting has shown its unwillingness for reappointment as Statutory Auditors of the Company and has not offered themselves for reappointment.
The Company has received special notice of a resolution from a Member of the Company, in terms of the applicable provisions

27th Annual Report 2012-13 11ESTER INDUSTRIES LTD.
of the Act, signifying his intention to propose the appointment of M/s. S. R. Batliboi & Associates LLP as the statutory auditors, in place of existing Statutory Auditors, of the Company from the conclusion of this AGM till the conclusion of the next AGM of the Company.
Your Directors recommend the appointment of M/s. S. R. Batliboi & Associates LLP, Chartered Accountants as Statutory Auditors.
M/s. S. R. Batliboi & Associates LLP has expressed its willingness to act as statutory auditors of the Company, if appointed, and have further confirmed that the said appointment would be in conformity with the provisions of Section 224(1B) of the Act.
COST AUDITORS
During the year under review, with the approval of the Central
Government, your directors re-appointed M/s. Sanjay Gupta &
Associates, Cost Accountants as Cost Auditor to carry out the cost
audit for the year 2013-14. The cost audit for the year 2012-2013
shall be completed within the stipulated time as prescribed in the
Companies Act, 1956 read with Cost Audit (Report) Rules, 2001.
The particulars of Cost Auditor and Cost Audit Report, as required
vide General Circular No. 15/2011 dated 11th April, 2011 issued
by Cost Audit Branch, Ministry of Corporate Affairs, Government
of India, are as under:
Name of the Cost Auditor M/s. Sanjay Gupta &
Associates, Cost Accountants
C4E/135, Janak Puri,
New Delhi - 110058
Firm Registration Number
of Cost Auditor
00212
Due date for filing of
Cost Audit Report for the
financial year 2012-13 by
the Cost Auditor with the
Central Government
Within 180 days from the
close of the Company’s
financial year, i.e. upto 27th
September, 2013
Actual date for filing of
Cost Audit Report for the
financial year 2012-13 by
the Cost Auditor with the
Central Government
The report shall be filed to the
Central Government within
due date.
LISTING OF SECURITIES
Your Company’s securities are currently listed with Bombay Stock
Exchange Limited (BSE) and National Stock Exchange of India
Limited (NSE). The Company has paid the listing fees to BSE and
NSE for the financial year 2013-14.
CONSERVATION OF ENERGY, TECHNOLOGY ABSORPTION
AND FOREIGN EXCHANGE EARNING AND OUTGO
The prescribed details as required under Section 217(1)(e) of the
Companies Act, 1956 read with the Companies (Disclosure of
Particulars in the Report of Board of Directors) Rules, 1988 are set
out in the Annexure ‘A’ forming part of this report. Your Company
was a net foreign exchange earner during the year under review.
PARTICULARS OF THE EMPLOYEES
The particulars of the employees drawing the salary as prescribed
under Section 217(2A) of the Companies Act, 1956 read with
Companies (Particulars of Employees) Rules, 1975 form part of
this report.
As per the provisions of Section 219(1)(b)(iv) of the Companies Act,
1956, the reports and accounts are being sent to all shareholders
of the Company excluding the statement of particulars of the
employees. Any shareholder interested in obtaining a copy may
write to the Company Secretary of the Company.
ACKNOWLEDGEMENT
Your Directors acknowledge the cooperation and assistance
received from various departments of the Central & State
Government, banks and Non-banking finance companies.
Your Directors wish to place on record their appreciation of the
sincere services rendered by the workmen, staff and executives
of the Company at all levels ensuring successful management of
the Company. Your Directors also thank the shareholders for their
continued support.
On behalf of the Board
Place : Gurgaon (A.K. Singhania)Date : 5th August, 2013 Chairman
12 ESTER INDUSTRIES LTD. 27th Annual Report 2012-13
ANNEXURE - A
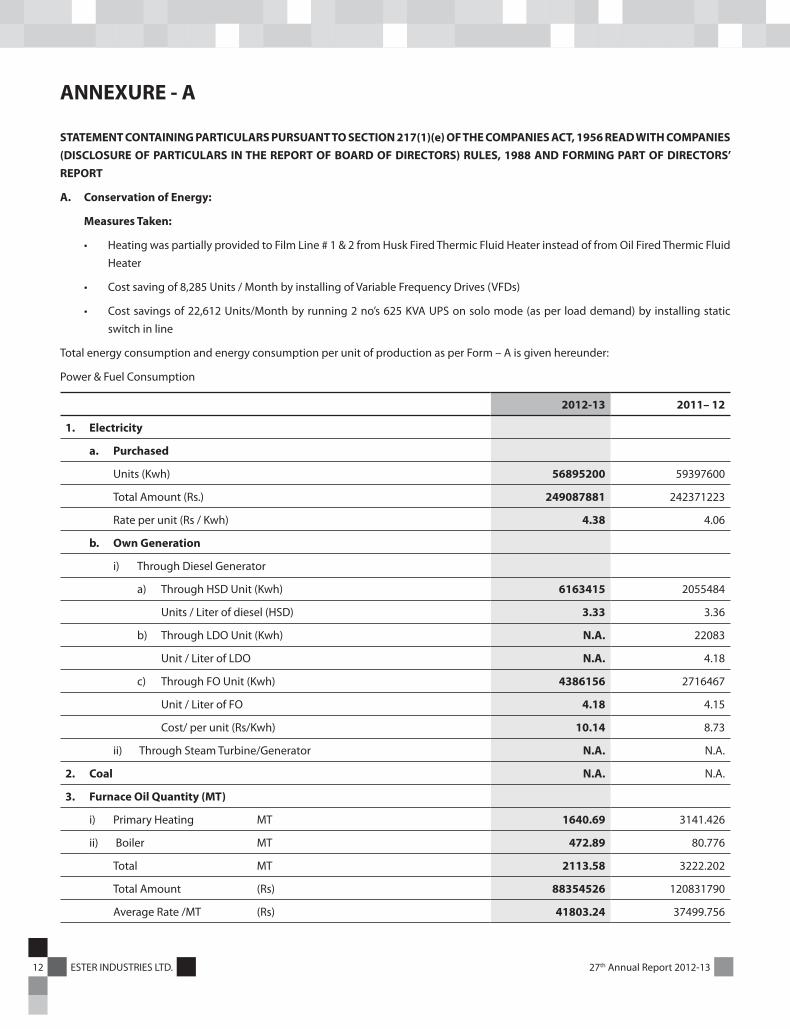
STATEMENT CONTAINING PARTICULARS PURSUANT TO SECTION 217(1)(e) OF THE COMPANIES ACT, 1956 READ WITH COMPANIES (DISCLOSURE OF PARTICULARS IN THE REPORT OF BOARD OF DIRECTORS) RULES, 1988 AND FORMING PART OF DIRECTORS’ REPORT
A. Conservation of Energy:
Measures Taken:
• HeatingwaspartiallyprovidedtoFilmLine#1&2fromHuskFiredThermicFluidHeaterinsteadoffromOilFiredThermicFluidHeater
• Costsavingof8,285Units/MonthbyinstallingofVariableFrequencyDrives(VFDs)
• Costsavingsof22,612Units/Monthbyrunning2no’s625KVAUPSonsolomode(asper loaddemand)by installingstaticswitch in line
Total energy consumption and energy consumption per unit of production as per Form – A is given hereunder:
Power & Fuel Consumption
2012-13 2011– 12
1. Electricity
a. Purchased
Units (Kwh) 56895200 59397600
Total Amount (Rs.) 249087881 242371223
Rate per unit (Rs / Kwh) 4.38 4.06
b. Own Generation
i) Through Diesel Generator
a) Through HSD Unit (Kwh) 6163415 2055484
Units / Liter of diesel (HSD) 3.33 3.36
b) Through LDO Unit (Kwh) N.A. 22083
Unit / Liter of LDO N.A. 4.18
c) Through FO Unit (Kwh) 4386156 2716467
Unit / Liter of FO 4.18 4.15
Cost/ per unit (Rs/Kwh) 10.14 8.73
ii) Through Steam Turbine/Generator N.A. N.A.
2. Coal N.A. N.A.
3. Furnace Oil Quantity (MT)
i) Primary Heating MT 1640.69 3141.426
ii) Boiler MT 472.89 80.776
Total MT 2113.58 3222.202
Total Amount (Rs) 88354526 120831790
Average Rate /MT (Rs) 41803.24 37499.756

27th Annual Report 2012-13 13ESTER INDUSTRIES LTD.
2012-13 2011– 12
4. HSD Quantity (MT)
i) Primary Heating MT 1672.58 196.724
ii) Boiler MT NIL NIL
Total MT 1672.58 196.724
Total Amount (Rs) 63848543 7000750
Average Rate /MT (Rs) 38173.59 35586.66
5. Husk
Quantity (MT)
For Steam 12469 13583
For Primary Heating 23425 19890
Total Qty (MT) 35894 33473
Total Amount (Rs) 125062029 115740046
Average Rate /MT (Rs) 3484.20 3457.71
Consumption per unit of production
PRODUCT UNIT PER TON PER TON
1. Electricity
Polyester Chips KWH 126.8 130.3
Continuous Polymerization KWH 75.7 78.9
Polyester Film (Line –1) KWH 948.1 949.1
Polyester Film (Line –2) KWH 928.4 856.5
Polyester Film (Line –3) KWH 671.4 650.1
2. Furnace Oil
Polyester Chips MT Per Ton 0.073 0.098
Continuous Polymerization MT Per Ton 0.000 0.005
Polyester Film (Line –1) MT Per Ton 0.021 0.064
Polyester Film (Line –2) MT Per Ton 0.020 0.066
Polyester Film (Line –3) MT Per Ton 0.000 0.006
3. HSD Oil
Polyester Chips KL Per Ton 0.045 0.011
Continuous Polymerization KL Per Ton 0.002 0.001
Polyester Film (Line –1) KL Per Ton 0.026 0.000
Polyester Film (Line –2) KL Per Ton 0.043 0.000
Polyester Film (Line –3) KL Per Ton 0.002 0.001
4. Husk
Polyester Chips MT Per Ton 0.000 0.000
Continuous Polymerization MT Per Ton 0.255 0.250
Polyester Film (Line-1) MT Per Ton 0.095 0.000
Polyester Film (Line-2) MT Per Ton 0.014 0.000
Polyester Film (Line –3) MT Per Ton 0.296 0.280
14 ESTER INDUSTRIES LTD. 27th Annual Report 2012-13
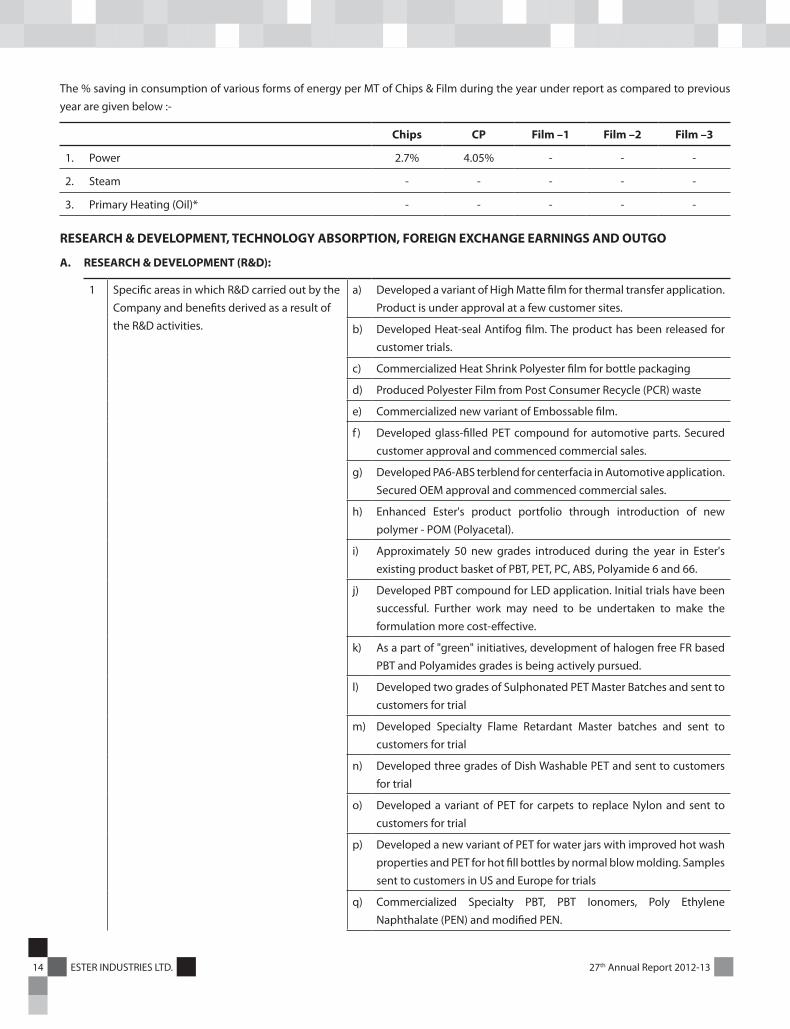
The % saving in consumption of various forms of energy per MT of Chips & Film during the year under report as compared to previous year are given below :-
Chips CP Film –1 Film –2 Film –3
1. Power 2.7% 4.05% - - -
2. Steam - - - - -
3. Primary Heating (Oil)* - - - - -
RESEARCH & DEVELOPMENT, TECHNOLOGY ABSORPTION, FOREIGN EXCHANGE EARNINGS AND OUTGO
A. RESEARCH & DEVELOPMENT (R&D):
1 Specific areas in which R&D carried out by the Company and benefits derived as a result of the R&D activities.
a) Developed a variant of High Matte film for thermal transfer application. Product is under approval at a few customer sites.
b) Developed Heat-seal Antifog film. The product has been released for customer trials.
c) Commercialized Heat Shrink Polyester film for bottle packaging
d) Produced Polyester Film from Post Consumer Recycle (PCR) waste
e) Commercialized new variant of Embossable film.
f ) Developed glass-filled PET compound for automotive parts. Secured customer approval and commenced commercial sales.
g) Developed PA6-ABS terblend for centerfacia in Automotive application. Secured OEM approval and commenced commercial sales.
h) Enhanced Ester's product portfolio through introduction of new polymer - POM (Polyacetal).
i) Approximately 50 new grades introduced during the year in Ester's existing product basket of PBT, PET, PC, ABS, Polyamide 6 and 66.
j) Developed PBT compound for LED application. Initial trials have been successful. Further work may need to be undertaken to make the formulation more cost-effective.
k) As a part of "green" initiatives, development of halogen free FR based PBT and Polyamides grades is being actively pursued.
l) Developed two grades of Sulphonated PET Master Batches and sent to customers for trial
m) Developed Specialty Flame Retardant Master batches and sent to customers for trial
n) Developed three grades of Dish Washable PET and sent to customers for trial
o) Developed a variant of PET for carpets to replace Nylon and sent to customers for trial
p) Developed a new variant of PET for water jars with improved hot wash properties and PET for hot fill bottles by normal blow molding. Samples sent to customers in US and Europe for trials
q) Commercialized Specialty PBT, PBT Ionomers, Poly Ethylene Naphthalate (PEN) and modified PEN.

27th Annual Report 2012-13 15ESTER INDUSTRIES LTD.
r) Developed Specialty PET (Terpolymers) for bottles for filling at 90-1000 C
s) Developed PET for Extrusion Blow Molding (EBM) application
2. Future plan of action a) Development of high-end PA66 based compounds for automotive applications.
b) Enhancement of PET-based product basket.
c) Development of PC-PET and PC-PBT blends.
d) Modified PET for High Tenacity and High Elongation in textile application
e) PET for Hot Melt Adhesive application
f ) Fast Crystallizing PET for Injection Molding application
g) PET for thermoforming application to replace Polypropylene
h) PEN for tyre coil application
i) PET for superior barrier properties
j) PET with improved impact resistance
k) PET for Extrusion Blow Molding (EBM) to replace Polycarbonate
l) PET for sealable / peelable Film
m) PET for Injection Molding
n) Company continues to remain focused on development of new products for applications in Plain Polyester Film, Metallized Polyester Film and Engineering Plastics.
B. Technology absorption:
Efforts in brief made towards technology absorption,
adaptation and innovation.
• InstalledanewRecycleExtruderinFilmLine#3.
Benefits derived as a result of the above efforts.
In case of Imported technology (imported during the last 5
years reckoned from the beginning of the financial year)
(a) Technology imported:
(b) Year of import:
(c) Has technology been fully absorbed?
(d) If not fully absorbed, areas where this has not taken place,
reasons there for and future plans of action
C. Foreign Exchange Earnings and Outgo:
(Rs. in Lacs)
2012-13 2011-12
1. Earnings – FOB Value of Exports 27,674.79 27,195.93
2. Outgo – CIF Value of Imports 11,094.04 5,520.07

16 ESTER INDUSTRIES LTD. 27th Annual Report 2012-13
Indian Economy India’s GDP grew at a rate of 5% in 2012-13 as compared to 6.9%
in 2011-12, the lowest in a decade. There has been a significant
slowdown in comparison to the preceding two years, primarily due
to deceleration in industrial growth, more specifically in private
investment. Rising cost of credit and weak domestic business
sentiment, added to this decline. Moreover, the rate of growth
of consumption expenditure (public and private) decelerated
to 4.1% as compared to 8.1% in last fiscal. Estimated gross fiscal
deficit worsened to 5.1 per cent of GDP for 2012-13 and the global
economic turmoil exerted pressure on the exchange rate.
Taking into account a macro view of the overall economy and
keeping in mind the difficult global environment, the RBI expects
GDP growth in 2013-14 to be in the band of 6.1 – 6.7%
The overall WPI for FY 2012-13 stood at 7.6%, as compared to 8.9%
in 2011-12. Thus, while month-wise headline inflation averaged
7.6% during April 2012 – March 2013, non-food manufacturing
sector inflation (i.e. core inflation as per RBI’s definition) averaged
much lower at 4.8%, indicating that inflation was driven mainly
by supply side factors which could not be affected by the tight
monetary policy stance of the RBI.
India’s inflation is largely structural, driven predominantly by
agricultural supply constraints and global cost push. While the
macroeconomic numbers were not very weak when compared
to the global economic environment, they were marked by
significant volatility evident not only in the numbers but also in
the sentiments primarily driven by the global clues and policy
responses to cater to inflation.
Operational Performance
Business Segment
Thin BOPET Films
The productPET is a versatile plastic used to produce a wide spectrum of
packaging material for beverages, food, personal and home
care, pharmaceuticals, as well as other consumer and industrial
products. PET is a strong, lightweight, non-reactive and inert
material, thus making an ideal product to protect food, beverages
& pharmaceuticals against oxidation and aroma loss to enable
longer shelf life. Various Health and Safety conscious agencies
around the world have approved PET as a safe material for use in
packaging foods and beverages. The PET Film industry comprises of
both thin (50 micron and under) and thick films (above 50 microns)
Global markets
Overview* : Globally, the BOPET Film industry is estimated to
grow at around 7% during the next few years. Currently, the
Central and East-Asian region is the largest BOPET film producing
region, accounting for more than 50% of the installed BOPET film
capacity in the world.
Growth drivers: The BOPET film segment is expected to grow on
account of :
• Increaseindemand,asFMCG(FastMovingConsumerGoods)
companies increase their reach in rural areas in developing
economies, primarily in Asia. Smaller SKU’s in flexible
packaging are being used by leading brands to gain access
to new customer segments near the middle of the economic
pyramid .
• Focusonsustainabilityandenvironmentalconcernscausing
a shift from other substrates (such as PVC) to BOPET, being
a more environment friendly material. However price
premiums are currently not available for the same.
Some emerging themes in the flexible packaging market are:
• Costoptimisationthroughlaminatestructuresimplification.
Thinner laminate structures offering similar performance
offers opportunities for the growth of value added and
speciality films.
• Changes indemography& lifestyle in fastdevelopingand
emerging economies. Enhanced consumption of ready to
eat /snack foods by cash rich - time poor, double income
families is driving growth for value added and speciality
flexible films.
*Report on “World Markets for BOPET Films to 2017” by PCI Films.
Indian markets
Overview : Due to some recent capacity additions, the total
installed production capacity in India is now approx. 500,000
Management Discussion and Analysis

27th Annual Report 2012-13 17ESTER INDUSTRIES LTD.
MTPA of Thin BOPET films. Of India’s production of 350,000 MTPA,
around 70% is consumed within the country, while the balance
is exported. Continuous capacity addition over the years has
improved India’s reach and share in global markets. The domestic
demand for Thin BOPET film is estimated to be growing at a CAGR
(Compounded Annual Growth Rate) of ~ 15%.
Growth and drivers: The growth in India is driven by demographic
and lifestyle changes (rising middle class population), increasing
investments in supermarkets, hypermarkets, innovative
packaging and expansions in the organised retail sector. This has
resulted in increased demand for innovative and attractive high
quality packaging. The current per capita packaging consumption
in India is less than one third that of developed economies and
thus offers tremendous growth opportunites
The recent legislation regarding Foreign Direct Investment (FDI)
in retail may enhance the demand for flexible packaging as store
brands in low cost packing are expected to be introduced by
the new entrants in this space. However a better clarity on the
long term policy would enable global majors to take investment
decisions and progress towards commencement of operations in
India.
Company Overview
Highlights: FY 2012-13
Production Innovation &
Development
Performance
• Reclaimextruder
installed in latest
film production line
- accumulated
reclaim reduced by
40%.
• Latestfilmline’s
(FilmLine#
3) production
efficiency stabilised,
production
increased by 8.2%
Launched two new
products for specialty
applications.
• Salesrevenue(net
of excise duty)
of BOPET films
increased by 4.22%
from Rs. 558.17
crores in FY 2011-12
to Rs. 581.74 crores
in FY 2012-13
• Salesvolumes
of Value Added
product Increased
by 17.9%
The Company’s vertically integrated operations based out of
Khatima, Uttarakhand comprise of PET chips, Thin BOPET Films
and Metalised Thin BOPET Film manufacturing facilities.
Ester offers a diversified portfolio of value added and speciality
BOPET Films . The Company enjoys good business relations with
marquee clients across India. Its global footprint extends across 75
countries, which include not only developed economies like the
USA and Europe, but also the Middle East, Russia, Latin America,
Africa and South East Asia.
Competitive edge
Scale: Ester has consistently invested in improving operating
efficiencies and increasing capacity through modifications
and brownfield expansions, providing economies of scale and
possessing the ability to seamlessly cater to growing demand
from its markets and customers.
Technology: Ester is the second manufacturer in India and
the third in the world to install the cost-effective Continuous
Polymerisation (CP) and Direct Casting technology, significantly
reducing capital cost and overall cost of production.
Integrated Operations: Vertical integration has enabled a
reduction in operational cost and superior product quality on
a consistent basis. Forward integration into metallised films and
other Value Added products enables better realisations which
improves profitability.
Capacity Utilisation: Ester’s passion towards internal efficiency is
reflected in optimum capacity utilisation over the past few years,
making the operations cost-effective and providing additional
volumes for business growth.
Product Portfolio: Ester offers the widest variety of Value Added
and speciality BOPET Films among its peers; during FY 2012-13,
volumes of Value Added products grew by 17.9% despite adverse
effect on sales volumes of certain value added products as a result
of ban on use of plastic films in packing of Pan Masala & Gutkha
which was in full effect across India in FY 2012-13.
Reach: Ester’s diversified geographic presence (domestic
and global) mitigates the risks associated with concentration
of markets. The increasing global presence enables Ester to
strengthen its growth agenda.
Processes and Systems: Ester continues its focus on designing
and implementing business processes and systems which would
not only reduce constant manual intervention but also allow the
organisation to enhance value on a sustainable basis. Some of the
business procesess which were designed and implemented were
the ‘Order to Cash Process’ and the Credit Management Process
for domestic sales.

18 ESTER INDUSTRIES LTD. 27th Annual Report 2012-13
Performance overview (FY2012-13)
In FY 2012-13, Ester optimised its enhanced production capability
and maintained high levels of operating efficiencies through the
year. During the year there were new capacity additions globally
which added to the surplus capacity and widened the demand and
supply gap. The operating margins were under severe pressure
due to a weak pricing environment which was also impacted by
low economic growth in both domestic and overseas markets. In
these challenging times, Ester continued to remain focused on its
long term strategy of:
1. Optimizing production levels. Company was able to
sustainably operate the New Film plant at a capacity
utilization of over 90% during the FY 2012-13
Focus on increasing market share in select profitable
overseas markets. Ester increased sales volumes of Value
Added products in select profitable overseas markets by
19.3%. Keeping in mind the weak global demand and
pricing scenario, a conscious choice was made to identify
and market products in select overseas markets which
offered profitable growth opportunities, specially for value
added and speciality products. This focussed approach
ensured better realisation and higher sales volumes of value
added products in export markets despite the challenging
environment. The share of value added products in overseas
markets grew from 23% to 32% in 2012-13.
2. Increasing volumes of Value Added products. The overall
volume of Value Added products grew by 17.9% despite the
weak demand and challenging pricing environment.
3. Enhancing Brand Equity by participating in Industrial Fairs
and Exhibitions (Pack Expo 2012, USA)
4. Maintaining focus on operational efficiencies by taking
steps to
a. Reduce Cost
b. Reduce Waste
c. Improve Sustainability
Outlook
While the global demand for BOPET films will continue to grow,
pressure on margins due to demand supply imbalance as new
capacity additions which are in the offing, is likely to continue
in 2013-14. Ester had devised a long term 3-pronged strategy to
ensure that it is able to meet and exceed the expectations of its
shareholders and stakeholders
1. Focus on procuring a robust customer profile, whose
innovation and development priorities are aligned with
Ester. This initiative is not only expected to support Ester in
further enhancing the robustness of its sales product mix,
but is also expected to guide Ester in its efforts to develop
innovative products for the future.
2. Progress long term relationships and partnerships with key
customers.
3. Assess market needs accurately and endeavour to be a
solution provider.
This implementation of the strategy commenced in 2012-13
and the green shoots of the results are visible in the focus
areas. Ester had initiated developmental projects with key
FMCG players in 2012-13 which would be commercialised in
2013-14. The developmental projects would be scaled up in
the months ahead which would help bolster Ester’s revenue
and profit growth. Building on the initiatives in the area of
building long term relationships through partnerships,
Ester has planned to expand this portfolio and add new key
customers in 2013-14.
Ester’s other priorities to achieve the stated objective are:
• OperationalExcellence
o Optimizing asset utilisation
o Continuous cost reduction
• FocusonInnovationandvalueselling
o Build on sales competency to deliver complete
customer solutions
o New product development through the process of
co-creation with key customers.
Although the business is passing through a volatile phase, Ester
is confident that an effective implementation of its strategy will
enable the creation of a robust business model which will ensure
value maximisation for its shareholders and stakeholders.
Engineering Plastics The Product
Engineering Plastics (such as Polybutylene Terephthalate,

27th Annual Report 2012-13 19ESTER INDUSTRIES LTD.
Polyamides and Polycarbonate) have better mechanical and/
or thermal properties as compared to commodity plastics (such
as Polystyrene, Polypropylene and Polyethylene). Engineering
Plastics usually exhibit a combination of properties (such as
mechanical strength, heat resistance, and impact & abrasion
resistance) that make them suitable for applications in various
industries such as automotive, electrical and electronics, medical,
consumer durables and telecommunication.
Ester manufactures and sells its products (which are compounds
of PBT, PET, PA6, PA66, PC, ABS, POM and their respective blends)
under the brand name “Estoplast”.
Industry Overview
Global: The global engineering plastics market (estimated at 20.6
million metric tons in 2013), is expected to grow at a CAGR of 5%
and will therefore be approx. 29 million metric tons by 2020. In
terms of value, the demand for engineering plastics is projected
to grow from US$ 67 billion in 2013 to approximately US$ 113.7
billion by 2020 – translating to a CAGR of 7.9%. Most of this growth
is expected to emerge from developing regions like Asia-Pacific &
South America and certain regions of Europe & Middle-East.
Asia-Pacific: The Asia-Pacific region accounts for 39% share
of the global engineering plastics market, and is growing at a
CAGR of 8.8%. The Engineering Plastics market in Asia-Pacific, led
by India and China, has seen a higher growth over the last few
years than the global market. Increased purchasing power and
advancements in new applications across various industries such
as automotive, construction and infrastructure, transportation,
telecommunications and household appliances have primarily
contributed to this growth. Polyamides and PBT are expected to
achieve the highest growth in this region at around 10-11% from
2010 to 2015.
India: India, with its low per capita consumption of engineering
plastics as compared to the global average, offers good growth
prospects. The EP compounds market in India, estimated at
about 125000 MT, is expected to grow at a CAGR of ~ 14%
till 2015. This impressive growth is expected primarily due to
rapid industrialization, increased investments in infrastructure
development and a relatively stable economy. PC, PBT and
Polyamides would account for a major portion of the projected
growth. The automotive sector contributes to about one half of
the engineering plastics consumption in India.
Performance Overview
The actions initiated during FY2011-12 (with respect to team-
building, strengthening customer base and enhancing brand
visibility) yielded desired results and helped in delivering a better
performance in FY2012-13. During the financial year 2012-13,
our Engineering Plastics business registered a material sales
growth of approximately 50%, significantly ahead of industry
growth. Our focused customer acquisition process and improved
product range helped in enhancing our active customer base
by ~ 50%. Approvals were also secured from various Original
Equipment Manufacturers (OEMs) in the automotive, electrical
and appliances industries.
Some of the key actions that contributed towards this success
include;
• Focus on new product development to meet customer
needs that helped in expanding our product portfolio from
250 to approximately 300 grades, including introduction of
a new polymer (Polyoxymethylene -POM) – in our product
basket.
• Enhanced customer satisfaction through an improved
distribution channel, consistent product quality and
improved response time.
• Focusedeffortstoregain lost volumes in the CFL segment,
with ~ 60% growth achieved in FY 2012-13.
• Sustainedeffortsforproductivity/efficiency improvement at
the manufacturing facility.
Key drivers for Industry Growth
1. Increased usage of plastics in the automotive industry to
reduce the weight of vehicles for better fuel efficiency and
lesser emissions.
2. Increased focus by the government to promote usage of
energy-saving light equipment.
3. Enhanced safety awareness resulting in higher usage of low
voltage switch gear.
4. New applications for engineering plastics being developed
across various industries.
5. Shifting of manufacturing bases by several global players
(mainly automotive and electrical) to India for reduced
production costs.
6. Increased government & private spending in construction
and infrastructure projects.
20 ESTER INDUSTRIES LTD. 27th Annual Report 2012-13
Business Prospects
Automotive Segment: The automotive segment comprises of
automobile and auto-components and is one of the key drivers of
the Indian economy. Despite a sluggish performance in 2012-13,
India continues to be an attractive destination for manufacturers
in view of the projected demand growth. Owing to lower
manufacturing costs, many foreign players have been setting up
their manufacturing bases in India to cater to the local as well as
global demand.
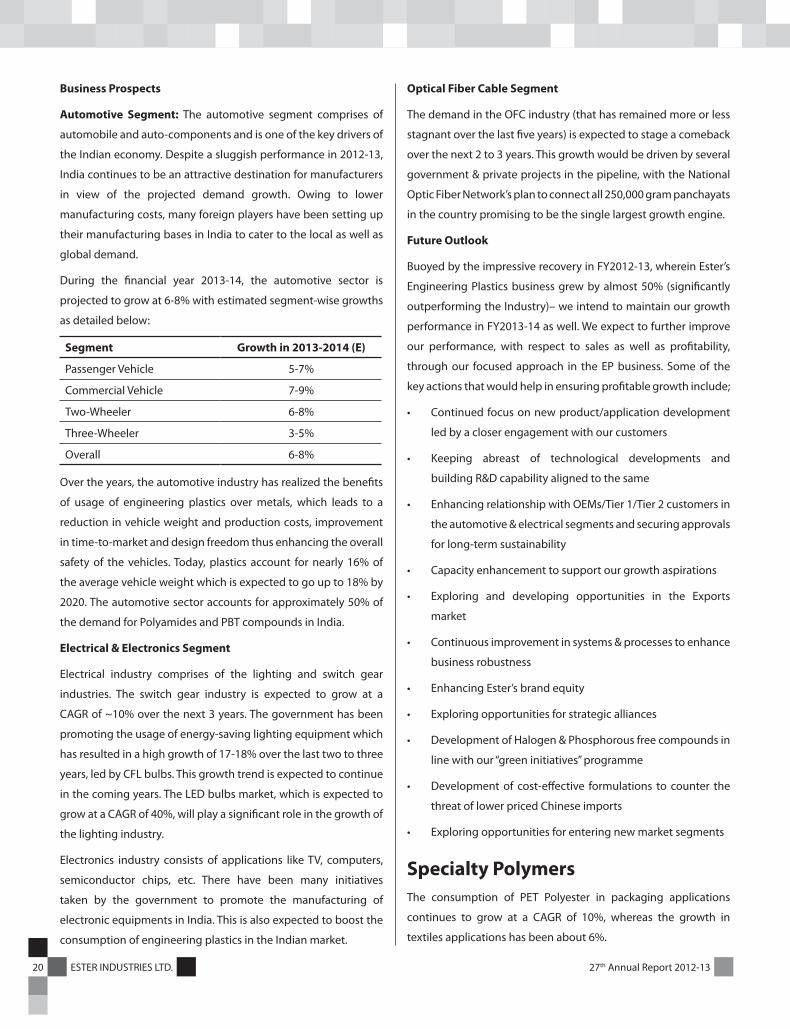
During the financial year 2013-14, the automotive sector is
projected to grow at 6-8% with estimated segment-wise growths
as detailed below:
Segment Growth in 2013-2014 (E)
Passenger Vehicle 5-7%
Commercial Vehicle 7-9%
Two-Wheeler 6-8%
Three-Wheeler 3-5%
Overall 6-8%
Over the years, the automotive industry has realized the benefits
of usage of engineering plastics over metals, which leads to a
reduction in vehicle weight and production costs, improvement
in time-to-market and design freedom thus enhancing the overall
safety of the vehicles. Today, plastics account for nearly 16% of
the average vehicle weight which is expected to go up to 18% by
2020. The automotive sector accounts for approximately 50% of
the demand for Polyamides and PBT compounds in India.
Electrical & Electronics Segment
Electrical industry comprises of the lighting and switch gear
industries. The switch gear industry is expected to grow at a
CAGR of ~10% over the next 3 years. The government has been
promoting the usage of energy-saving lighting equipment which
has resulted in a high growth of 17-18% over the last two to three
years, led by CFL bulbs. This growth trend is expected to continue
in the coming years. The LED bulbs market, which is expected to
grow at a CAGR of 40%, will play a significant role in the growth of
the lighting industry.
Electronics industry consists of applications like TV, computers,
semiconductor chips, etc. There have been many initiatives
taken by the government to promote the manufacturing of
electronic equipments in India. This is also expected to boost the
consumption of engineering plastics in the Indian market.
Optical Fiber Cable Segment
The demand in the OFC industry (that has remained more or less
stagnant over the last five years) is expected to stage a comeback
over the next 2 to 3 years. This growth would be driven by several
government & private projects in the pipeline, with the National
Optic Fiber Network’s plan to connect all 250,000 gram panchayats
in the country promising to be the single largest growth engine.
Future Outlook
Buoyed by the impressive recovery in FY2012-13, wherein Ester’s
Engineering Plastics business grew by almost 50% (significantly
outperforming the Industry)– we intend to maintain our growth
performance in FY2013-14 as well. We expect to further improve
our performance, with respect to sales as well as profitability,
through our focused approach in the EP business. Some of the
key actions that would help in ensuring profitable growth include;
• Continuedfocusonnewproduct/applicationdevelopment
led by a closer engagement with our customers
• Keeping abreast of technological developments and
building R&D capability aligned to the same
• EnhancingrelationshipwithOEMs/Tier1/Tier2customersin
the automotive & electrical segments and securing approvals
for long-term sustainability
• Capacityenhancementtosupportourgrowthaspirations
• Exploring and developing opportunities in the Exports
market
• Continuousimprovementinsystems&processestoenhance
business robustness
• EnhancingEster’sbrandequity
• Exploringopportunitiesforstrategicalliances
• DevelopmentofHalogen&Phosphorousfreecompoundsin
line with our “green initiatives” programme
• Developmentof cost-effective formulations to counter the
threat of lower priced Chinese imports
• Exploringopportunitiesforenteringnewmarketsegments
Specialty Polymers The consumption of PET Polyester in packaging applications
continues to grow at a CAGR of 10%, whereas the growth in
textiles applications has been about 6%.

27th Annual Report 2012-13 21ESTER INDUSTRIES LTD.
The consumption of PET in rigid packaging applications was 21
million tonnes during 2011 (including thermoformed containers)
and about 31 million tonnes in textile applications.
USA, Europe, Japan, South Africa and Australia are the regions
from where good response has been received for specialty
polyesters.
Key Drivers
The recyclability of PET material and PET’s suitability for food
contact applications is the main driver for growth in consumption.
PET continues to remain the most preferred polymer for Packaging
application.
There are significant opportunities to replace other plastics such
as PP, PE, PS even at higher costs. PET can also replace PC as a cost
effective superior alternative .
Modified polyesters for hot fill applications are in great demand.
There are various applications and several customized PET grades
are under development for various applications. Ester is working
on various customized products with material market potential.
1. The 4/5 gallon water containers manufactured with this new
grade with improved hot washability can be a safer product for
reusing after hot wash (can also be superior alternative to PC ).
2. Polyester container which can be filled at 82-85°C for
applications in Juices, Health drinks, Sports drinks etc. and
containers which can be used for filling various product such
as Syrup, Sauces, Jams at a temperature 90-95°C are in great
demand.
There is also significant demand for modified PET for dish
washable containers.
Competitive Edge
Ester is focusing mainly on packaging applications. The critical
success parameter is being able to modify the requisite physical
properties of PET molecular structure without any adverse affect
on its colour, clarity and chemical properties is the main key to
develop the required product grade. The modification of polymer
rheology is being achieved by incorporating various catalyst and
additives in PET and also by process technology. Ester is furthering
its sustainability agenda by incorporating PCR PET Flakes and
using Bio MEG to manufacture all its specialty polyester grades.
During FY 2012-13, Ester manufactured specialty grades of PET,
PBT and PEN material and carried out almost 1050 trials batches
in its pilot plant. These products have been sent to various
customers for approval. We have identified suitable partners for
each product to expedite development & commercial trials by
incorporating joint development and partnership approach.
Ester has also successfully recycled all the polyester based waste
generated during manufacture so as to achieve a zero wastage
process. Four grades developed by Ester have received US FDA
approval. Patent application for hotfill PET has already been filed.
BUSINESS & FINANCIAL PERFORMANCE
Quantity Produced (MT)
(During 2012-13)
Quantity Produced (MT)
(During 2011-12)
Growth
PET Chips (including Specialty Polymers)
69571 60217 15.5%
PET Film 50076 51744 (3.2%)
PET Film - Metallized 9366 10491 (10.7%)
Engineering Plastics 6964 4641 50.0%
Quantity Sold (During 2012-13)
Quantity Sold (During 2011-12)
Growth
PET Chips 17257 6218 177.5%
Specialty Polymers 2241 472 374.8%
PET Film 40237 40005 0.58%
PET Film - Metallized 9402 10199 (7.8%)
Engineering Plastics 6945 4655 49.2%
Sales Value (Net of Excise
Duty) (Rs. in Lacs) (During 2012-13)
Sales Value (Net of Excise
Duty) (Rs. In Lacs) (During 2011-12)
Growth
PET Chips 14424.60 4956.17 191.0%
Specialty Polymers 3941.90 563.66 599.3%
PET Film 45213.69 42655.54 6.0%
PET Film - Metallized 12952.33 13150.09 (1.5%)
Engineering Plastics 10527.69 7035.39 49.6%
(Rs. in Lacs) (During 2012-13)
(Rs. In Lacs) (During 2011-12)
Growth
EBITDA 4724.44 4106.42 15.1%
PBT (780.89) (2096.61) 62.7%
PAT (526.99) (1391.91) 62.1%
The increase in sales value (net of Excise Duty) has been primarily
on account of a significant increase in the sales volume of

22 ESTER INDUSTRIES LTD. 27th Annual Report 2012-13
Polyester Chips, Specialty Polymers and Engineering Plastics. In
Polyester Films, despite marginal reduction in volumes, the sales
value has increased by 4.22% as the volumes of Value Added and
Speciality films in the sales mix has increased by 17.9%
Margins in the Polyester Film business remained under pressure.
However, the continuous focus on increasing the proportion of
Value Added and Speciality films (along with rationalising its
customer and market portfolio) has enabled the company to
mitigate the effect of cyclicality in the business to some extent.
Pursuant to clarification issued by the Ministry of Corporate
Affairs, Government of India dated 9th August 2012, foreign
exchange fluctuation on foreign currency borrowings for Capital
goods has been capitalized.
Due to repayment of term borrowings, the financial leveraging
indicated by Total Debt: Tangible Net Worth ratio stands at the
prudent level of 1.48 as on 31st March 2013. The book value per
equity share stood at Rs. 40.27.
Risk Management
In the current volatile and dynamic environment, each business
is embedded with uncertainties, affecting operational & financial
performance and prospects.
The Risk Management framework adopted by the Company
encompasses clear understanding of strategies, policies,
initiatives, norms, structured reporting and control. It ensures
that the risk management discipline is centrally initiated by the
senior management and progressively decentralised, extending
to managers across hierarchies, facilitating risk mitigation at
the transactional level. Consequently, business decisions are
taken in a manner that risk and reward are optimally balanced,
ensuring that the Company’s revenue-generating initiatives are
consistent with the risks taken, so that shareholders get their
desired total return.
Company classifies the risks broadly into Strategic risks,
Operational risks, Financial risks and Information Technology risks.
Risks in each classification are identified and aggregated to form
a library of risks. The Company reviews the library of risks from
time to time to update and modify its mitigation strategies with
the changing risk scenario. There is a reviewing and monitoring
mechanism in place to ensure effectiveness of mitigation plans.
Intellectual capital
Following the philosophy that People are key assets that facilitate
achievement of the vision and transform dreams into reality,
continuous efforts are made to ensure creation of value aligned
with business objectives
Building on the platform created over last few years, the
Performance Management System (PMS) as conceptualised and
designed is being implemented in the right earnest and manner.
Efforts were focused on enabling managers to drive performance
within their teams. We focused on high impact performance
with an objective to ensure efficient and optimum delivery of
PMS to individuals.
A set of critical business focussed behaviours that form the DNA
of a high performance work culture at Ester has been drawn.
The behavioural competencies have been designed keeping in
mind the key elements of Ester’s goals and growth drivers of cost
leadership and product innovation. These behaviours will drive us
towards achieving the aggressive business goals that we have set
for ourselves. This will enable us to manage the talent and achieve
the long term objective of Succession Planning.
Steps are being taken continuously to enhance the capability
levels of the team. We facilitated Development Centres and
created Individual Development Plans (IDPs) for identified
managers. We have been working closely with individuals and
their managers to keep the momentum going as regards to IDPs.
Internal control systems
The Company has a structured Internal Control System in place,
which assures the Board of Directors and the management that
there is an effective system for:
• Planningandachievementofgoals
• Risksevaluation
• Reliable financial and operating reporting and legal and
regulatory compliance
• Adequatecontrolagainstfraudandnegligence
• RegularPerformanceReviews
The integrated financial accounting system, supported by
in-built controls, ensures reliable and timely financial and
operational reporting. Controls and legal compliances are
periodically reviewed by audit systems. The financial accounting

27th Annual Report 2012-13 23ESTER INDUSTRIES LTD.
and audit systems ensure prevention and detection of frauds
and negligence.
The company has during the year 2012-13 implemented
a Business Intelligence tool. This enables the managers to
access relevant data & information on real time basis to make
informed decisions. Company has also upgraded its ERP (SAP
from R/3 4.7 to ECC 6.0).
Corporate Social Responsibility
CSR continues to be an important and essential part of Ester’s
commitment to align our company’s activities with the social,
economic and environmental expectations of our stakeholders.
Our corporate social responsibility (CSR) programs are designed
to provide long-term benefits to our employees, customers,
shareholders, partners, and individuals in communities
in which we operate. Our approach to corporate social
responsibility (CSR) aligns responsible business practices and
social investments to create long-term value for our business,
internal and external stakeholders.
We continue to work on various programs aimed at improving the
livelihood of the economically disadvantaged sections of society
by making contributions to charitable institutions. We continue to
support the Make-A-Wish Foundation a global organization that
has enriched the lives of children with life-threatening medical
conditions through its unique wish-granting work.
Ester has in the past demonstrated its commitment towards
preserving environment by reducing dependence on fossil fuels.
Another step in that direction is being taken by enhancing our
Thermal Energy generation capacity by installing yet another Bio-
mass based Thermic Fluid Heater.
We will continue to support socially relevant programs in
FY2013-14.
Cautionary statement
Statements in this section relating to future status, events,
circumstances, plans and objectives are forward – looking
statements based on estimates and anticipated effects of future
events. Such statements are subject to risks and uncertainties
and accordingly are not predictive of future results. Actual results
may differ materially from those anticipated in the forward –
looking statements. The Company cannot be held responsible
in any manner for such statements. The company undertakes no
obligation to publicly update these forward looking statements
to reflect subsequent events or circumstances.

24 ESTER INDUSTRIES LTD. 27th Annual Report 2012-13
Corporate governance is about promoting corporate fairness,
transparency, accountability and ethical business conduct.
The ambit of governance involved all the stakeholders and
how the corporation deals with those stakeholders, including
the shareholders, employees, regulators, customers, suppliers
and society. It is the combination of voluntary practices and
compliance with laws and regulations leading to effective control
and management of the organisation.
This corporate governance report sets out the governance
framework adopted by the Board of Ester Industries Limited and
highlights the key activities during the year.
In its approach to governance, the Board embraces best practice
in the area of Corporate Governance to ensure the attainment
of highest levels of transparency, accountability and equity
in all the facets of its operations and in all its interactions with
its stakeholders. The Board continues to hold and augment
the standards of Corporate Governance by ensuring that the
Company pursues policies and procedures to satisfy its legal and
ethical responsibilities.
1. Board of Directors
The Company has an optimum combination of Executive, Non
Executive and Independent directors, having a pool of collective
knowledge from various disciplines, Engineering, Finance,
Business Management, Corporate Planning etc on its board. The
Board comprised of nine directors of which one is Non- Executive
Chairman and belongs to Promoter category, two are Executive
Director and other six are Non-executive & Independent
Directors. The composition of the board is in consonance with the
requirement of Clause – 49 of the Listing Agreement.
The Board of Directors and its committees meet at regular
intervals.
Number of Board Meetings held and the dates on
which held
5 (Five) Board Meetings were held during the year 2012-13. The
dates on which the meetings were held are 4th May, 2012, 1st
August, 2012, 7th November, 2012, 17th January, 2013, and 11th
February, 2013.
CORPORATE GOVERNANCE REPORT
Details of Name, Composition, and Attendance record of the Directors for the year ended 31.03.2013 and the number of
Directorship and Committee Chairmanship/Membership held by them in other Companies are as follows:
Name of the Director Designation Attendance Particulars
No. of directorships
in other Companies1
No of Membership/ Chairmanship of Committees
in other Companies2
Board Meeting
Last AGM Committee Membership
Chairperson of Committees
Arvind Kumar Singhania Non Executive Chairman 5 Yes 1 None None
V. B. Haribhakti Independent Director 5 Yes 7 7 3
M. S. Ramachandran Independent Director 3 No 4 1 None
A.K. Newatia Independent Director 5 Yes None None None
Dinesh Chandra Kothari Independent Director 4 No 3 4 2
Anand Chand Burman Independent Director 3 No 7 None None
P. S. Dasgupta Independent Director 5 No 8 9 2
Pradeep Kumar Rustagi Whole time Director 5 No None None None
Ashok Kumar Agarwal Whole time Director 4 Yes None None None
1The other Directorships held by Directors as mentioned above do not include alternate directorship, directorships of Private Limited
Company, Directorship in the Company incorporated outside India and Section 25 Companies .
2As required by clause 49 of the Listing Agreement, the disclosure includes memberships/ chairpersonship of Audit Committee and
Shareholders/Investor Grievance Committee in Indian public companies (listed and unlisted) only.
None of the directors is related to each other.

27th Annual Report 2012-13 25ESTER INDUSTRIES LTD.
The elaborated details of following Directors seeking the
re-appointment are forming the part of the notice –
Dr. Anand Chand Burman
Mr. P. S. Dasgupta
Information provided to the Board of Directors
1. Annual operating plans of the business, capital budgets,
acquisitions etc.
2. Quarterly results of the company.
3. Minutes of the meeting of the Audit committee and other
Committees of the Board.
4. Information on recruitment and remuneration of senior
offices below the Board level.
5. Detail of any Investment.
6. Information related to the shareholder services and
share transfers.
7. Significant development on the human resources and
industrial relations front.
8. Details of any joint venture or collaboration agreement,
if any.
9. Sale of material nature, of investments, subsidiaries assets,
which is not in normal course of business.
Statutory Compliance
The Board periodically reviews the Compliance Report of the
law applicable to the Company as well as the Steps taken by the
company to rectify the instances of non compliance, if any.
Compliance of Code of Conduct
We have laid down a code of conduct for all Board Members
and senior management of the Company. The code of
conduct is available on the website of the Company viz.
www.esterindustries.com. All Board members and senior
management personnel of the Company have affirmed their
adherence to the code. The declaration to this effect from
Executive Director-Operations & Projects forms a part of this
report.
2. Audit Committee
The Audit Committee formed in pursuance of clause 49 of the
listing agreement and Section 292A of the Companies Act, 1956
is instrumental in overseeing the financial reporting besides
reviewing the quarterly, half yearly, annual financial result of
the company. It reviews the company’s financial and other
management policies and the internal control system, internal
audit system etc. through discussion with internal and external
auditors. All members of the audit committee are knowledgeable
in project finance, accounts and company law matters. Minutes of
each audit committee meeting are placed before the board and
discussed in depth.
The terms of reference stipulated by the Board to the Audit
Committee are, as contained under clause 49 of the Listing
Agreement, as follows:
a. To oversee financial reporting and disclosure process.
b. To recommend the appointment and removal of statutory
auditors and decide their remuneration.
c. To review financial results and statements, before submission
to the Board, focus primarily on-
• Anychangeinaccountingpoliciesandpractices.
• Majoraccountingentries,basedonexerciseofjudgment
by the management.
• Qualificationsinthedraftauditreport.
• Significantadjustmentsarisingoutoftheaudit.
• Goingconcernassumption.
• Compliancewithaccountingstandards.
• Compliancewithstockexchangeandlegalrequirements
concerning financial statements.
• Anyrelatedpartytransactionsi.e.transactionsofthe
Company of a material nature, with promoters or the
management, their subsidiaries or relatives, etc. that
may have potential conflict with larger interests of
the Company.

26 ESTER INDUSTRIES LTD. 27th Annual Report 2012-13
d. To oversee adequacy of internal control systems.
e. Reviewing adequacy of internal audit function, coverage and
frequency of internal audit report.
f. Discussion with internal auditors and concurrent
auditors on any significant findings in their reports and
follow up thereon.
During the year 2012-2013, the Audit Committee has met 4 times on 4th May, 2012, 1st August 2012, 7th November, 2012 and
11th February, 2013.
The Composition of the Audit Committee and the particulars of meeting attended by the members of the Audit Committee are
given below:
Name of Members Category No. of Meetings held Attendance of the Members
Mr. V. B. Haribhakti (Chairman of Committee) Independent Director 4 4
Mr. Dinesh Chandra Kothari Independent Director 4 4
Mr. M. S. Ramachandran Independent Director 4 3
g. Discussion with external auditors before audit commences,
as regards nature and scope of audit, as well as having post
audit discussions to ascertain any areas of concern.
h. Reviewing the Company’s financial and risk management
policies.
i. Approval of appointment of CFO or any other person
heading the finance function or discharging that function.
Mr. V. B. Haribhakti & Mr. Dinesh Chandra Kothari is a qualified
Chartered Accountant having rich experience in Accounting and
Finance. Other member of the Committee has basic accounting
and finance knowledge with wide exposure in their relevant
areas. The composition of the Committee is in conformity with
Clause 49 and Section 292A of the Companies Act, 1956.
The Chairman, Executive Director & CFO, Executive
Director-Operations & Projects are invited to the meetings.
Representatives of Statutory Auditors and Internal Auditors are
also being invited to the meetings and most of the meetings
are attended by Statutory Auditors. The Company Secretary of
the Company acts as the Secretary to the Committee.
Apart from other matters, as per clause 49 of the listing agreement
the Audit committee also reviews the following information:
1. Management Discussion and Analysis of financial condition
and result of operation.
2. Statement of significant related party transactions.
3. Internal Audit report relating to internal control weakness
and
4. The appointment, removal and term of remuneration of
internal auditors, if any.
Mr. V. B. Haribhakti, Chairman of the Audit Committee was present
at the last Annual General Meeting held on 28th September, 2012.
3. Remuneration Committee
The broad terms of reference of the Committee are to appraise
the performance of Managing/ Whole Time Directors/Relative of
Directors, and to decide and approve remuneration including any
revision thereto from time to time, in respect of the managerial
personnel of the Company and Non Executive Directors of
the Company. Remuneration Committee also plays the role of
Nomination Committee in terms of Schedule XIII of the Companies
Act, 1956.
The Composition of the Remuneration Committee and the
particulars of meeting attended by the members of the
Remuneration Committee are given below:
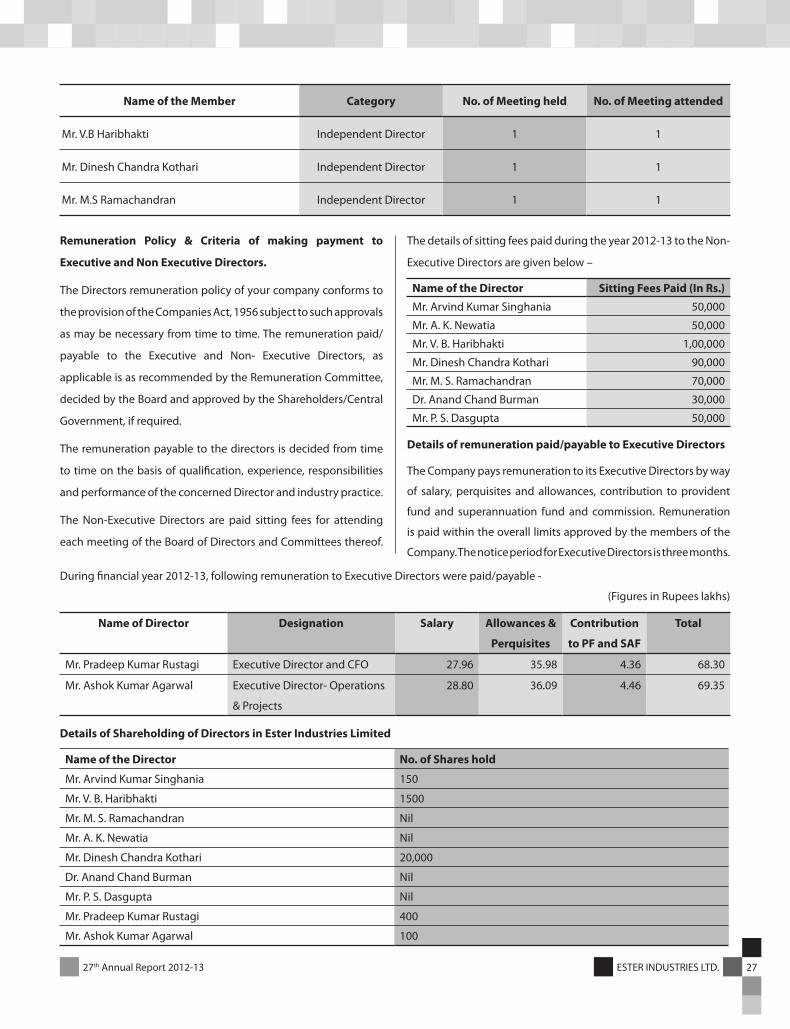
27th Annual Report 2012-13 27ESTER INDUSTRIES LTD.
Name of the Member Category No. of Meeting held No. of Meeting attended
Mr. V.B Haribhakti Independent Director 1 1
Mr. Dinesh Chandra Kothari Independent Director 1 1
Mr. M.S Ramachandran Independent Director 1 1
Remuneration Policy & Criteria of making payment to
Executive and Non Executive Directors.
The Directors remuneration policy of your company conforms to
the provision of the Companies Act, 1956 subject to such approvals
as may be necessary from time to time. The remuneration paid/
payable to the Executive and Non- Executive Directors, as
applicable is as recommended by the Remuneration Committee,
decided by the Board and approved by the Shareholders/Central
Government, if required.
The remuneration payable to the directors is decided from time
to time on the basis of qualification, experience, responsibilities
and performance of the concerned Director and industry practice.
The Non-Executive Directors are paid sitting fees for attending
each meeting of the Board of Directors and Committees thereof.
The details of sitting fees paid during the year 2012-13 to the Non-
Executive Directors are given below –
Name of the Director Sitting Fees Paid (In Rs.)
Mr. Arvind Kumar Singhania 50,000
Mr. A. K. Newatia 50,000
Mr. V. B. Haribhakti 1,00,000
Mr. Dinesh Chandra Kothari 90,000
Mr. M. S. Ramachandran 70,000
Dr. Anand Chand Burman 30,000
Mr. P. S. Dasgupta 50,000
Details of remuneration paid/payable to Executive Directors
The Company pays remuneration to its Executive Directors by way
of salary, perquisites and allowances, contribution to provident
fund and superannuation fund and commission. Remuneration
is paid within the overall limits approved by the members of the
Company. The notice period for Executive Directors is three months.
During financial year 2012-13, following remuneration to Executive Directors were paid/payable -
(Figures in Rupees lakhs)
Name of Director Designation Salary Allowances &
Perquisites
Contribution
to PF and SAF
Total
Mr. Pradeep Kumar Rustagi Executive Director and CFO 27.96 35.98 4.36 68.30
Mr. Ashok Kumar Agarwal Executive Director- Operations
& Projects
28.80 36.09 4.46 69.35
Details of Shareholding of Directors in Ester Industries Limited
Name of the Director No. of Shares hold
Mr. Arvind Kumar Singhania 150
Mr. V. B. Haribhakti 1500
Mr. M. S. Ramachandran Nil
Mr. A. K. Newatia Nil
Mr. Dinesh Chandra Kothari 20,000
Dr. Anand Chand Burman Nil
Mr. P. S. Dasgupta Nil
Mr. Pradeep Kumar Rustagi 400
Mr. Ashok Kumar Agarwal 100

28 ESTER INDUSTRIES LTD. 27th Annual Report 2012-13
4. Share Transfer cum Shareholders’/ Investors’ Grievance
Committee
The Company has a Share Transfer cum Shareholders’/ Investors’
Grievance Committee to look into the redressal of investors’
complaints and requests such as delay in transfer of shares, non-
receipt of annual report, change of address, etc.
During the year Mr. Arvind Kumar Singhania, Non Executive
Chairman of the Company, has been appointed as new
member of Share Transfer Cum Shareholders/ Investors
Grievance Committee.
Therefore the present constitution of the Committee is as follow –
1. Mr. A. K. Newatia, Independent Director (Chairman of the
Committee)
2. Mr. Arvind Kumar Singhania, Non Executive Chairman of
the Board
3. Mr. Pradeep Kumar Rustagi, Executive Director & CFO
4. Mr. Ashok Kumar Agarwal, Executive Director-Operations
& Projects
Mr. Diwaker Dinesh, Company Secretary, acts as Compliance
Officer.
The Board of Directors has approved the following terms of
reference for the Share Transfer cum Shareholders/ Investors
Grievances Committee.
1. To approve/refuse/reject registration of transfer/transmission
of shares.
2. To authorise issue of Duplicate Share Certificate and Share
Certificate after split/consolidation/replacement.
3. To monitor redressal of Shareholders and Investors
Complaints about transfer of shares, non receipt of balance
sheet , non receipt of declared dividend.
4. To affix or authorise affixation of the Common Seal of the
Company on Share Certificate of the Company.
5. Such other functions as may be assigned by the Board.
The committee met as and when required during the year
under review.
The Company has received 70 Complaints from the shareholders
and all of them have been resolved by furnishing requisite
information/ documents. There was no complaint pending as on
31st March, 2013.
The Company gives utmost priority to the redressal of Shareholders
Grievances which is evident from the fact that all complaint
received from the shareholders are resolved expeditiously to the
satisfaction of the shareholders.
Certification in terms of Clause 49 (V) of the Listing Agreement
Certification by Executive Director – Operations and Projects and
Executive Director & CFO as stipulated in the Clause 49 (V) of the
Listing Agreement was placed before the Board along with the
financial statement for the year ended 31st March 2013, and the
Board reviewed the same. The said Certificate is annexed with the
Corporate Governance Report.
5. Borrowing Committee
The Company has a Borrowing Committee, authorized and
empowered to borrow such amount as Company may require
within the agreed limit from time to time for the purpose of the
business of the Company.
The Borrowing Committee of the Board comprised of the four
directors of which one is Non- Executive Chairman and belongs
to Promoter category, two are Executive Director and other one is
Independent Director viz as follows:
1. Mr. A. K. Newatia, Independent Director (Chairman of the
Committee)
2. Mr. Arvind Kumar Singhania, Non-Executive Chairman of the
Board
3. Mr. Pradeep Kumar Rustagi, Executive Director & CFO
4. Mr. Ashok Kumar Agarwal, Executive Director-Operations &
Projects
Meeting of Borrowing Committee and attendance during the
year
No Borrowing Committee Meeting was held during the Year
2012-2013.

27th Annual Report 2012-13 29ESTER INDUSTRIES LTD.
6. General Body Meetings
Details of the Annual General Meetings and Extra Ordinary General Meetings held during the last three years as follows:
Annual General Meeting
Financial Year Date Time Venue Special Resolution Passed
2011-2012 28.09.2012 12.00 Noon Sohan Nagar, P.O Charubeta,
Khatima -262308, District Udham
Singh Nagar, Uttarakhand
1. Commission on Profits to Non Executive
Director of the Company
2. Modification in terms and conditions of
appointment of Mr. Ayush Vardhan Singhania
2010-2011 25.07.2011 10.30 A.M Sohan Nagar, P.O Charubeta,
Khatima -262308, District Udham
Singh Nagar, Uttarakhand
1. Commencement of New Business under
Other Objects
2. Alteration of Articles of Association of the
Company
2009-2010 27.07.2010 10.30 A.M Sohan Nagar, P.O Charubeta,
Khatima -262308, District Udham
Singh Nagar, Uttarakhand
Appointment of Mr. Ayush Vardhan Singhania
(Relative of Managing Director) as Group Leader-
Business Development
Extra Ordinary General Meeting
Financial Year Date Time Venue Special Resolution Passed
2012-13 07.04.2012 1.30 P.M Sohan Nagar, P.O Charubeta,
Khatima -262308, District Udham
Singh Nagar, Uttarakhand
1. Modifications in the terms of appointment
of Mr. Pradeep Kumar Rustagi as Whole-Time
Director of the Company.
2. Modifications in the terms of appointment
of Mr. Ashok Kumar Agarwal as Whole-Time
Director of the Company.
2009-10 21.10.2009 11.00 A.M Sohan Nagar, P.O Charubeta,
Khatima -262308, District Udham
Singh Nagar, Uttarakhand
Preferential allotment of Zero Coupon Fully and
Compulsorily Convertible Unsecured Debentures
and Zero Coupon Warrants
During the year under review no Resolution was passed through Postal Ballot.
7. Disclosures
Related Party Transactions
During the financial year 2012-13 there was no materially significant related party transactions i.e. transactions of the Company of
material nature, with its promoters, the directors or the management, their subsidiaries or relatives, etc. that may have potential conflict
with the interests of the Company at large.

30 ESTER INDUSTRIES LTD. 27th Annual Report 2012-13
Disclosure of Accounting Treatment
During the Year while in the preparation of the financial statement,
no treatment different from that prescribed in an Accounting
Standard has been followed.
Compliance by the company
The Company has complied with the requirement of the Stock
Exchange, SEBI and other statutory authorities relating to the
capital market during the last three years.
No penalties or Strictures have been imposed on the company by
the Stock Exchange, SEBI and other statutory authorities relating
to the above.
Management
Management Discussion and Analysis forms the part of the
Annual Report to the Shareholders.
Whistle Blower Policy
Employees can report there concerns by e-mail to the Company
for this purpose at [email protected] or by sending a letter
to the Chairman.
8. Means of communication
• The quarterly and yearly financial results are generally
published in the following newspapers:
Economic Times, Times of India, Financial Express, Himachal
Times, Dehradun.
• Website - Ester’s website www.esterindustries.com
contains a separate dedicated section ‘Investor Relations’
which provides shareholders information like quarterly
financial results, annual reports, shareholding patterns,
news and announcements and other shareholder
information. Further as all such information are also filed/
intimated to BSE and NSE, the shareholder can also obtain
information from their website viz. www.bseindia.com and
www.nseindia.com respectively.
• NSE Electronic Application Processing System (NEAPS)
- NEAPS is a web based application designed by NSE for
corporate. All intimations, compliance filings like corporate
action, financial results, shareholding pattern, corporate
governance report etc. are intimated/filed electronically on
NEAPS.
• BSE Listing Centre - BSE has launched web based application
for compliances and intimation under Listing Agreement
for companies Listed in BSE. All intimations, compliance
filings like corporate action, financial results, shareholding
pattern, corporate governance report etc. are intimated/filed
electronically on Listing Centre.
• Designated e-mail address for investor services- In terms of
Clause 47(f ) of the Listing Agreement, the designated e-mail
address for investor complaints is [email protected].
9. General Shareholder Information:
9.1 Forthcoming Annual General Meeting
Date and Time Monday, 30th September, 2013 at 11.30 AM
Venue Sohan Nagar, P.O. Charubeta, Khatima-
262308, District Udhamsingh Nagar,
Uttarakhand
9.2 Financial Calendar (Tentative and subject to change):
Financial Results for the Quarter ending
30th June 2013
August – 2013
Financial Results for the Quarter ending
30th September 2013
November – 2013
Financial Results for the Quarter ending
31st December 2013
February - 2014
Financial Results for the Quarter and year
ending 31st March 2014
April/May – 2014
Annual General Meeting Any date between
May 2014 -
September 2014
9.3 Books closure date Monday, 23rd September, 2013 to
Friday, 27th September, 2013 (both days inclusive) in
compliance with Listing Agreement for the purpose of
Annual General Meeting
9.4 Dividend
No dividend has been recommended for the financial
year 2012-13

27th Annual Report 2012-13 31ESTER INDUSTRIES LTD.
9.5 Listing of Equity Shares on Stock Exchanges
Ester Industries Limited is presently listed on Bombay Stock Exchange and National Stock Exchange the details of the same are
mentioned as under:
Address of Stock Exchanges Bombay Stock Exchange Limited
Phiroze Jeejeebhoy Towers,
Dalal Street, Mumbai- 400001
National Stock Exchange of India Limited
Exchange Plaza, Plot no. C/1,
G Block, Bandra-Kurla Complex,
Bandra (E), Mumbai – 400051
Listed Capital 62893706 Equity Shares of Rs. 5/- each 62893706 Equity Shares of Rs. 5/- each
Website of Stock Exchanges www.bseindia.com www.nseindia.com
Scrip Code 500136 ESTER
9.6 Stock Market Data:
The data for trading in equity shares of the Company at Bombay Stock Exchange and National Stock Exchange are provided
below:
Month Bombay Stock Exchange National Stock Exchange
Month’s High
Price (In Rs.)
Month’s low
Price (In Rs.)
Volume (No. of
Shares)
Month’s High
Price (In Rs.)
Month’s low
Price (In Rs.)
Volume (No. of
Shares)
Apr-12 22.65 19.00 508654 22.60 19.05 281630
May-12 20.40 15.55 333234 20.40 15.20 257367
Jun-12 18.45 16.05 266060 20.60 16.10 246121
Jul-12 22.35 16.55 553597 22.40 16.15 524756
Aug-12 18.90 15.80 321217 18.80 15.70 220233
Sep-12 17.20 15.75 371008 16.90 15.80 205083
Oct-12 19.95 16.50 512282 20.40 16.45 416735
Nov-12 19.30 16.50 326256 19.45 16.50 256204
Dec-12 18.35 16.25 299897 18.80 16.30 237522
Jan-13 19.50 16.00 487956 19.65 15.60 407247
Feb-13 16.35 12.50 359255 16.95 12.20 235364
Mar-13 13.35 9.30 243311 13.25 09.50 301496
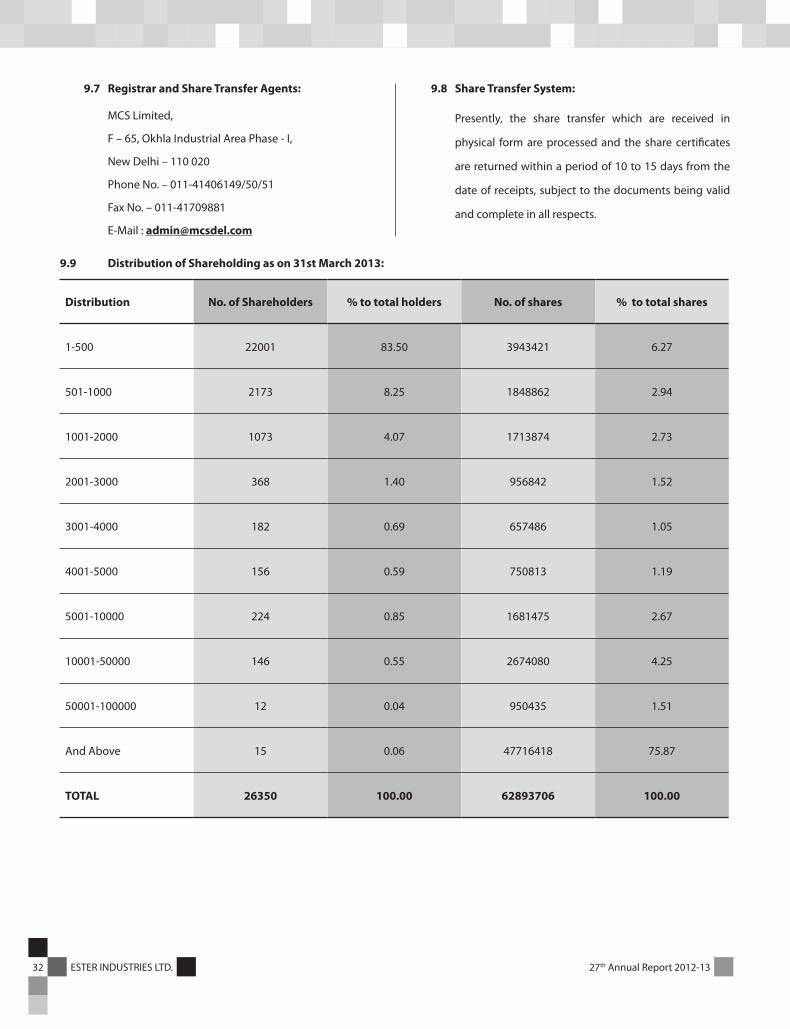
32 ESTER INDUSTRIES LTD. 27th Annual Report 2012-13
9.7 Registrar and Share Transfer Agents:
MCS Limited,
F – 65, Okhla Industrial Area Phase - I,
New Delhi – 110 020
Phone No. – 011-41406149/50/51
Fax No. – 011-41709881
E-Mail : [email protected]
9.8 Share Transfer System:
Presently, the share transfer which are received in
physical form are processed and the share certificates
are returned within a period of 10 to 15 days from the
date of receipts, subject to the documents being valid
and complete in all respects.
9.9 Distribution of Shareholding as on 31st March 2013:
Distribution No. of Shareholders % to total holders No. of shares % to total shares
1-500 22001 83.50 3943421 6.27
501-1000 2173 8.25 1848862 2.94
1001-2000 1073 4.07 1713874 2.73
2001-3000 368 1.40 956842 1.52
3001-4000 182 0.69 657486 1.05
4001-5000 156 0.59 750813 1.19
5001-10000 224 0.85 1681475 2.67
10001-50000 146 0.55 2674080 4.25
50001-100000 12 0.04 950435 1.51
And Above 15 0.06 47716418 75.87
TOTAL 26350 100.00 62893706 100.00

27th Annual Report 2012-13 33ESTER INDUSTRIES LTD.
Shareholding Pattern as on 31st March 2013:
Category of Shareholder No. of Shareholders No. of Shares % to total shares
A. PROMOTER AND PROMOTER GROUP
1. Indian
a. Individual/HUF 2 300 0.0005
b. Bodies Corporate 1 10222650 16.2539
Sub Total 3 10222950 16.2544
2. Foreign
a. Individuals (NRI/ Foreign Individuals) 2 300 0.0005
b. Bodies Corporate 1 35120192 55.8405
Sub Total 3 35120492 55.8410
Total Shareholding of Promoter and Promoter Group 6 45343442 72.0954
B. PUBLIC SHAREHOLDING
1. Institutions
a. Mutual Funds/UTI 5 27500 0.0437
b. Financial Institutions/Banks 10 34800 0.0553
c. Insurance Companies 1 300 0.0005
Sub Total 16 62600 0.0995
2. Non Institutions
a. Bodies Corporate 496 2016064 3.2055
b. Resident Individuals 25668 14494720 23.0464
c. Non-Resident Individual 164 976880 1.5532
Sub Total 26328 17487664 27.8051
Total Public Shareholding 26344 17550264 27.9046
GRAND TOTAL (A) + (B) 26350 62893706 100.00
34 ESTER INDUSTRIES LTD. 27th Annual Report 2012-13
9.10 Dematerialisation of Shares: As on 31st March 2013, 96.82% of the Company’s shares
were held in dematerialised form.
9.11 Outstanding GDRs/ ADRs/ As on date there are no outstanding
Warrants or any Convertible warrants or any convertible
Instruments and their likely instruments. The Company has not
impact on equity issued any GDR/ ADR.
9.12 Plant location: Sohan Nagar, P.O. Charubeta, Khatima – 262 308,
District Udham Singh Nagar, Uttarakhand
9.13 (i) Investor Correspondence For shares held in physical form
To Registrar & Transfer Agent (RTA)
(For transfer/dematerlisation MCS Limited
of shares and any other query F – 65, Okhla Industrial Area Phase - I,
related to the shares of the New Delhi – 110 020
Company) Phone No. – 011-41406149/50/51
Fax No. – 011-41709881
E-Mail: - [email protected]
For shares held in Demat form
To the respective Depository Participant
(ii) Any query on Annual Report Legal & Secretarial Department
Plot No.11, Block-A, Infocity-I,
Sector 33 & 34, Gurgaon, Haryana – 122 001
Phone: 0124-4572100
Fax : 0124-4572199
E-Mail: [email protected]
Web site: www.esterindustries.com
(iii) Investor Grievances Redressal Mechanism – In case of any complaint, the Investor can contact the Company
or our Registrar & Transfer Agent. Further the Company process investor complaints through a centralized web
based “SEBI complaints redress system” (SCORES) also. Investor can check online status of complaint and action
taken on the same. It assists in speedy resolution of complaint in more transparent manner.
DECLARATION
It is hereby declared that all the Board Members and Senior Management of the Company have affirmed adherence to and compliance
with the ‘Code of Conduct’ laid down by the Company.
For Ester Industries Limited
Place : Gurgaon Ashok Kumar AgarwalDate : 5th August, 2013 Executive Director – Operations & Projects

27th Annual Report 2012-13 35ESTER INDUSTRIES LTD.
CERTIFICATE BY EXECUTIVE DIRECTOR & CFO AND EXECUTIVE DIRECTOR-OPERATIONS & PROJECTS
In terms of clause 49(V) of the Listing Agreement, we certify as under:
(a) We have reviewed Financial Statements and the Cash Flow Statement for the year ended on 31st March 2013 and that to the best of
our knowledge and belief:
(i) these statements do not contain any materially untrue statement or omit any material fact or contain statements that might be
misleading;
(ii) these statements together present a true and fair view of the Company’s affairs and are in compliance with existing accounting
standards, applicable laws and regulations.
(b) There are, to the best of our knowledge and belief, no transactions entered into by the company during the Financial Year 2012-2013
which are fraudulent, illegal or violative of the Company’s code of conduct.
(c) We accept responsibility for establishing and maintaining internal controls for financial reporting and that we have evaluated the
effectiveness of internal control systems of the Company pertaining to financial reporting and have disclosed to the auditors and
the Audit Committee, deficiencies in the design or operation of such internal controls, if any, of which we are aware and the steps
we have taken or propose to take to rectify these deficiencies.
(d) We have indicated to the auditors and the Audit Committee
(i) significant changes, if any, in the internal control over financial reporting during the year;
(ii) significant changes, if any, in accounting policies during the year and the same have been disclosed in the notes to the financial
statements; and
(iii) instances of significant fraud of which we have become aware and the involvement therein, if any, of the management or an
employee having a significant role in the Company’s internal control system over financial reporting.
Pradeep Kumar RustagiExecutive Director and CFO
Dated : 24th May, 2013 Ashok Kumar AgarwalPlace : New Delhi Executive Director- Operations & Projects

36 ESTER INDUSTRIES LTD. 27th Annual Report 2012-13
CERTIFICATE ON CORPORATE GOVERNANCE
To,
The Members of Ester Industries Limited
We have examined the compliance of conditions of Corporate Governance by M/s. Ester Industries Limited, for the year ended
31st March, 2013, as stipulated in Clause 49 of the Listing Agreement of the said company with Stock Exchanges.
The compliance of conditions of corporate governance is the responsibility of the management. Our examination was limited to
procedures and implementation thereof, adopted by the Company for ensuring the compliance of the condition of the Corporate
Governance. It is neither an audit nor an expression of the opinion on the financial statements of the company.
In our opinion and to the best of our information and according to the explanation given to us, we certify that the company has complied
with the conditions of the Corporate Governance as stipulated in the above mentioned Listing Agreement.
We state that no investor grievance is pending for a period exceeding one month against the Company as per record maintained by the
Company.
We further state that such compliance is neither an assurance as to the future viability of the Company nor the efficiency or effectiveness
with which management has conducted the affairs of the company.
For Dhananjay Shukla & Associates(Company Secretaries)
Sd/-Dhananjay Shukla
Date : 5th August, 2013 ProprietorPlace : Gurgaon C.P. No. – 8271

27th Annual Report 2012-13 37ESTER INDUSTRIES LTD.
INDEPENDENT AUDITOR’S REPORTTo the Members of Ester Industries Limited
Report on the Financial Statements
We have audited the accompanying financial statements of Ester Industries Limited (“the Company”), which comprise the Balance Sheet as at March 31, 2013, and the Statement of Profit and Loss and Cash Flow Statement for the year then ended, and a summary of significant accounting policies and other explanatory information.
Management’s Responsibility for the Financial Statements
Management is responsible for the preparation of these financial statements that give a true and fair view of the financial position, financial performance and cash flows of the Company in accordance with accounting principles generally accepted in India, including the Accounting Standards referred to in sub-section (3C) of section 211 of the Companies Act, 1956 (“the Act”). This responsibility includes the design, implementation and maintenance of internal control relevant to the preparation and presentation of the financial statements that give a true and fair view and are free from material misstatement, whether due to fraud or error.
Auditor’s Responsibility
Our responsibility is to express an opinion on these financial statements based on our audit. We conducted our audit in accordance with the Standards on Auditing issued by the Institute of Chartered Accountants of India. Those Standards require that we comply with ethical requirements and plan and perform the audit to obtain reasonable assurance about whether the financial statements are free from material misstatement.
An audit involves performing procedures to obtain audit evidence about the amounts and disclosures in the financial statements. The procedures selected depend on the auditor’s judgment, including the assessment of the risks of material misstatement of the financial statements, whether due to fraud or error. In making those risk assessments, the auditor considers internal control relevant to the Company’s preparation and fair presentation of the financial statements in order to design audit procedures that are appropriate in the circumstances. An audit also includes evaluating the appropriateness of accounting policies used and the reasonableness of the accounting estimates made by management, as well as evaluating the overall presentation of the financial statements. We believe that the audit evidence we have obtained is sufficient and appropriate to provide a basis for our audit opinion.
Opinion
In our opinion and to the best of our information and according to the explanations given to us, the financial statements give the information required by the Act in the manner so required and give a true and fair view in conformity with the accounting principles generally accepted in India:
(a) in the case of the Balance Sheet, of the state of affairs of the Company as at March 31, 2013;
(b) in the case of the Statement of Profit and Loss, of the loss for the year ended on that date; and
(c) in the case of the Cash Flow Statement, of the cash flows for the year ended on that date.
Report on Other Legal and Regulatory Requirements
1. As required by the Companies (Auditor’s Report) Order, 2003 (“the Order”) issued by the Central Government of India in terms of sub-section (4A) of section 227 of the Act, we give in the Annexure a statement on the matters specified in paragraphs 4 and 5 of the Order.
2. As required by section 227(3) of the Act, we report that: (a) We have obtained all the information and explanations
which to the best of our knowledge and belief were necessary for the purpose of our audit;
(b) In our opinion proper books of account as required by law have been kept by the Company so far as appears from our examination of those books;
(c) The Balance Sheet, Statement of Profit and Loss, and Cash Flow Statement dealt with by this Report are in agreement with the books of account;
(d) In our opinion, the Balance Sheet, Statement of Profit and Loss, and Cash Flow Statement comply with the Accounting Standards referred to in subsection (3C) of section 211 of the Companies Act, 1956;
(e) On the basis of written representations received from the directors as on March 31, 2013, and taken on record by the Board of Directors, none of the directors is disqualified as on March 31, 2013, from being appointed as a director in terms of clause (g) of sub-section (1) of section 274 of the Companies Act, 1956.
For S. R. BATLIBOI & CO. LLPChartered Accountants
Firm registration number: 301003E
per Manoj GuptaPlace : New Delhi PartnerDate : May 24, 2013 Membership Number: 83906

38 ESTER INDUSTRIES LTD. 27th Annual Report 2012-13
Re: Ester Industries Limited (‘the Company’)
(i) (a) The Company has maintained proper records showing
full particulars, including quantitative details and
situation of fixed assets.
(b) All fixed assets have not been physically verified
by the management during the year but there is a
regular program of verification which, in our opinion,
is reasonable having regard to the size of the Company
and the nature of its assets. No material discrepancies
were noticed on such verification.
(c) There was no disposal of a substantial part of fixed
assets during the year.
(ii) (a) The management has conducted physical verification
of inventory at reasonable intervals during the year.
(b) The procedures of physical verification of inventory
followed by the management are reasonable and
adequate in relation to the size of the Company and the
nature of its business.
(c) The Company is maintaining proper records of inventory
and no material discrepancies were noticed on physical
verification.
(iii) (a) According to the information and explanations given to
us, the Company has not granted any loans, secured or
unsecured to companies, firms or other parties covered
in the register maintained under section 301 of the
Companies Act, 1956. Accordingly, the provisions of
clause 4(iii)(a) to (d) of the Order are not applicable to
the Company and hence not commented upon.
(b) According to information and explanations given to
us, the Company has not taken any loans, secured or
unsecured, from companies, firms or other parties
covered in the register maintained under section 301 of
the Companies Act, 1956. Accordingly, the provisions of
clause 4(iii)(e) to (g) of the Order are not applicable to
the Company and hence not commented upon.
(iv) In our opinion and according to the information and
explanations given to us, there is an adequate internal
control system commensurate with the size of the Company
and the nature of its business, for the purchase of inventory
and fixed assets and for the sale of goods. There is no sale
of service; hence provisions of this clause, to the extent
of sale of services are not applicable to the Company.
During the course of our audit, we have not observed any
major weakness or continuing failure to correct any major
weakness in the internal control system of the company in
respect of these areas.
(v) (a) According to the information and explanations provided
by the management, we are of the opinion that the
particulars of contracts or arrangements referred to in
section 301 of the Companies Act, 1956 that need to be
entered into the register maintained under section 301
have been so entered.
(b) In our opinion and according to the information and
explanations given to us, the transactions made in
pursuance of such contracts or arrangements and
exceeding the value of Rupees five lakhs have been
entered into during the financial year at prices which
are reasonable having regard to the prevailing market
prices at the relevant time.
(vi) The Company has not accepted any deposits from the public.
(vii) In our opinion, the Company has an internal audit system
commensurate with the size and nature of its business.
(viii) We have broadly reviewed the books of account maintained
by the Company pursuant to the rules made by the Central
Government for the maintenance of cost records under
section 209(1)(d) of the Companies Act, 1956, related to the
Annexure referred to in paragraph 1 under the heading “Report on Other
Legal and Regulatory Requirements” of our report of even date

27th Annual Report 2012-13 39ESTER INDUSTRIES LTD.
manufacture of polyester films and engineering plastics and
are of the opinion that prima facie, the prescribed accounts
and records have been made and maintained. We have not,
however, made a detailed examination of the same.
(ix) (a) Undisputed statutory dues including provident fund,
investor education and protection fund, employees’
state insurance, income-tax, sales-tax, wealth-tax,
service tax, custom duty, excise duty, cess and other
material statutory dues have generally been regularly
deposited with the appropriate authorities.
(b) According to the information and explanations given
to us, no undisputed amounts payable in respect of
provident fund, investor education and protection
fund, employees’ state insurance, income-tax, wealth-
tax, service tax, sales-tax, customs duty, excise duty,
cess and material other undisputed statutory dues were
outstanding, at the year end, for a period of more than
six months from the date they became payable.
(c) According to the records of the Company, the dues outstanding of income-tax, sales-tax, wealth-tax, service tax, custom duty,
excise duty and cess on account of any dispute, are as follows:
Name of the
Statute
Nature of Dues Amount
(Rs. in lacs)
Period to which the
amount relates
Forum where
dispute is pending
Central Excise
Act, 1944
Dispute on MODVAT credit taken on chips
used in yarn and on exempted clearance
of chips. Demand raised for duty on
removal of PET Chips in custody.
30.04 July 87 to June 93
and Jan 95
Commissioner
Central Excise (Noida)
Central Excise
Act, 1944
Dispute on MODVAT credit taken on
inputs and Capital Goods used in chips
which were cleared at NIL duty.
173.86 March 90 to Feb 92
and Oct 94 to Feb 95
Commissioner
(Appeals), Central
Excise Ghaziabad
Central Excise
Act, 1944
Dispute on disallowance of MODVAT on
TEG as documents were more than six
months old.
4.80 March 92 Customs, Excise,
Service Tax Appellate
Tribunal (Delhi)
The Customs
Act, 1962
Demand for Custom Duty forgone on
value based advance license.
57.71 June 93 to April 95 Commissioner/
Additional
Commissioner
Customs (DEEC)
Mumbai
Central Excise
Act, 1944
Demand on PET Chips waste cleared
at nil rate of duty. MEG received under
chapter X after rescinding of Notification
No. 34/87 CE. Inadmissibility of MODVAT
credit against PBT Chips and Polyester
films.
4.57 July 93 to May 94
and Feb to Aug 2000
Deputy
Commissioner
Central Excise,
Rampur
Central Excise
Act, 1944
Demand raised on account of differences
in stocks as per physical and book records.
7.72 November 1992 Commissioner
Meerut II
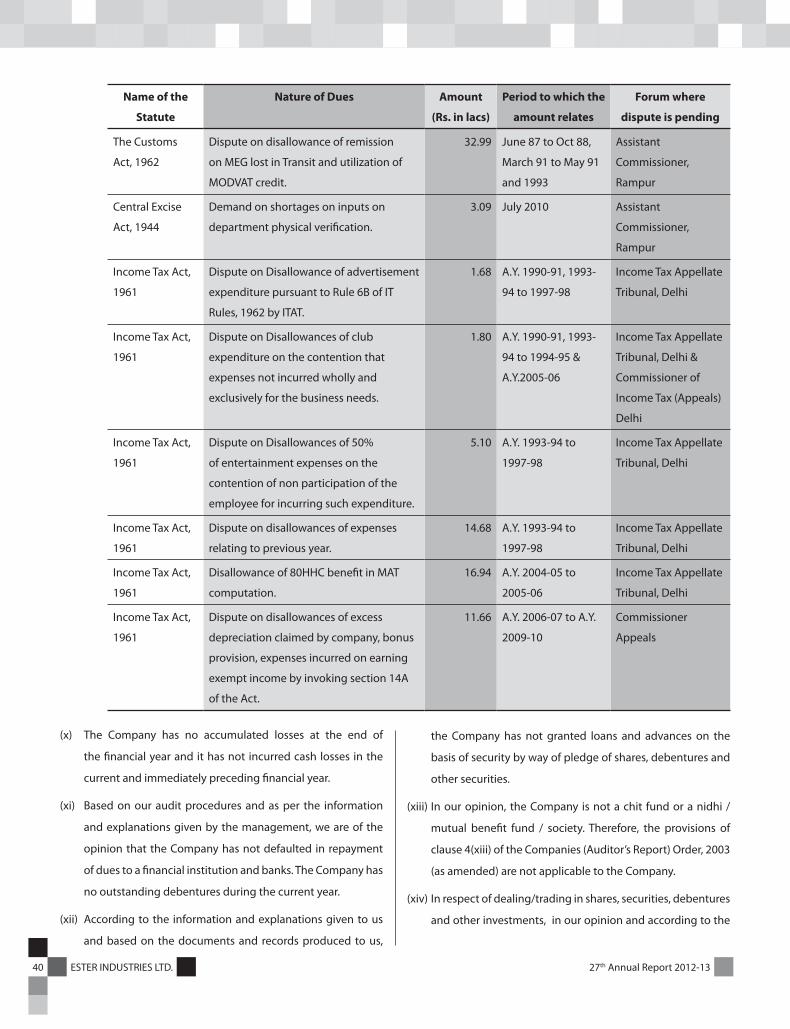
40 ESTER INDUSTRIES LTD. 27th Annual Report 2012-13
Name of the
Statute
Nature of Dues Amount
(Rs. in lacs)
Period to which the
amount relates
Forum where
dispute is pending
The Customs
Act, 1962
Dispute on disallowance of remission
on MEG lost in Transit and utilization of
MODVAT credit.
32.99 June 87 to Oct 88,
March 91 to May 91
and 1993
Assistant
Commissioner,
Rampur
Central Excise
Act, 1944
Demand on shortages on inputs on
department physical verification.
3.09 July 2010 Assistant
Commissioner,
Rampur
Income Tax Act,
1961
Dispute on Disallowance of advertisement
expenditure pursuant to Rule 6B of IT
Rules, 1962 by ITAT.
1.68 A.Y. 1990-91, 1993-
94 to 1997-98
Income Tax Appellate
Tribunal, Delhi
Income Tax Act,
1961
Dispute on Disallowances of club
expenditure on the contention that
expenses not incurred wholly and
exclusively for the business needs.
1.80 A.Y. 1990-91, 1993-
94 to 1994-95 &
A.Y.2005-06
Income Tax Appellate
Tribunal, Delhi &
Commissioner of
Income Tax (Appeals)
Delhi
Income Tax Act,
1961
Dispute on Disallowances of 50%
of entertainment expenses on the
contention of non participation of the
employee for incurring such expenditure.
5.10 A.Y. 1993-94 to
1997-98
Income Tax Appellate
Tribunal, Delhi
Income Tax Act,
1961
Dispute on disallowances of expenses
relating to previous year.
14.68 A.Y. 1993-94 to
1997-98
Income Tax Appellate
Tribunal, Delhi
Income Tax Act,
1961
Disallowance of 80HHC benefit in MAT
computation.
16.94 A.Y. 2004-05 to
2005-06
Income Tax Appellate
Tribunal, Delhi
Income Tax Act,
1961
Dispute on disallowances of excess
depreciation claimed by company, bonus
provision, expenses incurred on earning
exempt income by invoking section 14A
of the Act.
11.66 A.Y. 2006-07 to A.Y.
2009-10
Commissioner
Appeals
(x) The Company has no accumulated losses at the end of
the financial year and it has not incurred cash losses in the
current and immediately preceding financial year.
(xi) Based on our audit procedures and as per the information
and explanations given by the management, we are of the
opinion that the Company has not defaulted in repayment
of dues to a financial institution and banks. The Company has
no outstanding debentures during the current year.
(xii) According to the information and explanations given to us
and based on the documents and records produced to us,
the Company has not granted loans and advances on the
basis of security by way of pledge of shares, debentures and
other securities.
(xiii) In our opinion, the Company is not a chit fund or a nidhi /
mutual benefit fund / society. Therefore, the provisions of
clause 4(xiii) of the Companies (Auditor’s Report) Order, 2003
(as amended) are not applicable to the Company.
(xiv) In respect of dealing/trading in shares, securities, debentures
and other investments, in our opinion and according to the

27th Annual Report 2012-13 41ESTER INDUSTRIES LTD.
information and explanations given to us, proper records
have been maintained of the transactions and contracts
and timely entries have been made therein. The shares,
securities, debentures and other investments have been
held by the Company in its own name.
(xv) According to the information and explanations given to us,
the Company has not given any guarantee for loans taken by
others from bank or financial institutions.
(xvi) Based on information and explanations given to us by the
management, term loans were applied for the purpose for
which the loans were obtained.
(xvii) According to the information and explanations given to us
and on an overall examination of the balance sheet of the
Company, we report that no funds raised on short-term basis
have been used for long-term investment.
(xviii) The Company has not made any preferential allotment
of shares to parties or companies covered in the register
maintained under section 301 of the Companies Act, 1956.
(xix) The Company did not have any outstanding debentures
during the year.
(xx) The Company has not raised any money through a public
issue during the year.
(xxi) Based upon the audit procedures performed for the purpose
of reporting the true and fair view of the financial statements
and as per the information and explanations given by the
management, we report that no fraud on or by the Company
has been noticed or reported during the year.
For S.R. BATLIBOI & CO. LLP
Chartered Accountants
Firm registration number: 301003E
per Manoj Gupta
Place : New Delhi Partner
Date : May 24, 2013 Membership Number: 83906

42 ESTER INDUSTRIES LTD. 27th Annual Report 2012-13
BALANCE SHEET as at March 31, 2013
(Rs. in Lacs)
As at As at Notes March 31, 2013 March 31, 2012
Equity and liabilitiesShareholders' fund
Share capital 3 3,144.69 3,144.69 Reserves & surplus 4 22,717.31 23,258.90
25,862.00 26,403.60 Non - current liabilities
Long term borrowings 5 15,960.42 16,796.11 Deferred tax liability (net) 6 1,895.45 2,149.35 Long term provisions 7 436.89 392.72
18,292.76 19,338.18 Current liabilities
Short term borrowings 8 14,930.37 11,079.61 Trade payables 9 2,082.32 1,860.71 Other current liabilities 10 3,911.69 3,822.18 Short term provisions 7 225.68 207.92
21,150.06 16,970.42 Total 65,304.82 62,712.19 AssetsNon-current assets
Fixed assetsTangible assets 11 37,462.42 34,981.12 Intangible assets 11 89.10 63.53 Capital work in progress 510.79 1,719.34
Non-current investment 12 1.71 80.41 Long term loans & advances 13 801.40 1,534.01 Other non-current assets 14 9.61 57.19
38,875.03 38,435.60 Current assets
Inventories 15 12,270.11 10,431.03 Trade receivables 16 10,902.17 8,420.65 Cash & bank balances 17 1,425.52 2,116.87 Short term loans & advances 13 1,354.04 2,924.44 Other current assets 14 477.95 383.60
26,429.79 24,276.59 Total 65,304.82 62,712.19 Summary of significant accounting policies 2
The accompanying notes are an integral part of the financial statements. As per our report of even date
For S.R. BATLIBOI & CO. LLP For and on behalf of the board of directors Chartered Accountants of Ester Industries Limited Firm Registration No. 301003E
per Manoj Gupta Ashok NewatiaPartner DirectorMembership no. 83906
Place : New Delhi Pradeep Rustagi Diwaker DineshDate : May 24, 2013 Executive Director & CFO Company Secretary

27th Annual Report 2012-13 43ESTER INDUSTRIES LTD.
STATEMENT OF PROFIT AND LOSS for the year ended March 31, 2013
(Rs. in Lacs)
Notes For the year ended For the year ended
March 31, 2013 March 31, 2012
Revenue from operations (gross) 18 95,863.14 74,207.07
Less: - Excise duty 7,260.86 4,249.06
Revenue from operations (net) 88,602.28 69,958.01
Other income 19 579.45 578.31
Total revenues (I) 89,181.73 70,536.32
Expenses
Cost of material consumed 20 64,490.13 51,833.23
(Increase) / decrease in inventories of finished goods & work in progress
21 427.58 (2,474.86)
Employee benefits expense 22 3,220.20 2,482.20
Other expenses 23 16,319.38 14,589.34
Total expenses (II) 84,457.29 66,429.90
Earnings before interest, tax, depreciation and amortization {EBITDA} (I)-(II)
4,724.44 4,106.42
Depreciation and amortisation expense 11 2,873.12 2,668.13
Less: Transferred from revaluation reserve 14.60 2,858.52 14.59 2,653.54
Finance costs 24 2,646.81 3,549.48
Profit / (loss) before tax (780.89) (2,096.61)
Tax expense
Current tax - -
Deferred tax (253.90) (704.70)
Total tax expenses (253.90) (704.70)
Profit / (loss) after tax (526.99) (1,391.91)
Earnings per share
Basic & diluted (in Rs.) 25 (0.84) (2.21)
{Nominal value per share Rs. 5 (previous year Rs. 5)}
Summary of significant accounting policies 2
The accompanying notes are an integral part of the financial statements. As per our report of even date
For S.R. BATLIBOI & CO. LLP For and on behalf of the board of directors Chartered Accountants of Ester Industries Limited Firm Registration No. 301003E
per Manoj Gupta Ashok NewatiaPartner DirectorMembership no. 83906
Place : New Delhi Pradeep Rustagi Diwaker DineshDate : May 24, 2013 Executive Director & CFO Company Secretary

44 ESTER INDUSTRIES LTD. 27th Annual Report 2012-13
CASH FLOW STATEMENT for the year ended March 31, 2013
(Rs. in Lacs)
For the year ended For the year endedMarch 31, 2013 March 31, 2012
Cash flow from operating activitiesNet profit / (loss) before tax (780.89) (2,096.61)Adjustments for:
Depreciation/Amortisation 2,858.52 2,653.54 Loss on Fixed Assets Sold/Discarded (net) 83.69 15.31 Interest Expense 1,998.00 1,982.23 Interest income (120.60) (110.31)Dividend income (0.03) (0.72)Premium on forward contracts amortised 267.21 140.72 Unrealized foreign exchange loss (net) 54.27 1,310.58 Bad debts, advances and irrecoverable balances written off (net) 89.83 0.20 Provision for Obsolete Inventories 4.03 - Loss on sale of Investment 8.32 - Provisions / liabilities no longer required written back (19.86) (42.48)
Operating Profit before Working Capital Changes 4,442.49 3,852.46 Movements in working capital :
Decrease / (Increase) in trade receivables (2,447.81) 3,682.65 Decrease / (Increase) loans and advances/other current assets 2,110.16 (615.86)Decrease / (Increase) in Inventories (1,843.11) (2,993.49)Increase/ (Decrease) in Trade & Other Payables/ Provisions 2.19 1,121.45
Cash Generated from Operations 2,263.92 5,047.21 Direct Taxes Paid - (310.77)
Net cash flow from operating activities (a) 2,263.92 4,736.44 CASH FLOW FROM INVESTING ACTIVITIES
Purchase of Fixed Assets (3,672.62) (3,676.35)Sale of Fixed Assets 28.65 64.11 Deposits (238.18) (1,099.92)Proceeds of deposits matured 940.38 1,077.82 Sale of investment 70.38 10.00 Interest Received 133.28 81.25 Dividend Received 0.03 0.72
Net cash flow from /(used) in investing activities (b) (2,738.08) (3,542.37)CASH FLOW FROM FINANCING ACTIVITIES
Net proceeds from short term borrowings 3,834.91 1,219.57 Proceeds from long term borrowings 1,279.94 2,328.40 Repayment of long term borrowings (2,630.57) (974.56)Interest Paid (2,041.20) (1,991.27)Dividend Paid (5.65) (1,447.11)
Net cash flow from /(used) in financing activities ( c) 437.43 (864.97)Net increase/(decrease) in cash and cash equivalents (a+b+c) (36.73) 329.10 Cash and cash equivalents at the beginning of the year 1,021.61 692.51 Cash and cash equivalents at the end of the year 984.88 1,021.61 Components of cash and cash equivalents
Cash on Hand 6.08 12.71 Balances with Scheduled Banks :- On current Accounts 915.22 939.67 - On Term Deposits 450.25 1,152.45 - On Unpaid Dividend Accounts* 63.58 69.23
Cash & Bank Balances 1,435.13 2,174.06 Less: Fixed deposits not considered as cash and cash equivalents- Deposit Pledged with banks 37.00 106.44 - Deposit having maturity period more than 3 months 413.25 1,046.01
984.88 1,021.61
* These balances are not available for use by the Company as they represent corresponding unpaid dividend liabilities
As per our report of even date
For S.R. BATLIBOI & CO. LLP For and on behalf of the board of directors Chartered Accountants of Ester Industries Limited Firm Registration No. 301003E
per Manoj Gupta Ashok NewatiaPartner DirectorMembership no. 83906
Place : New Delhi Pradeep Rustagi Diwaker DineshDate : May 24, 2013 Executive Director & CFO Company Secretary
27th Annual Report 2012-13 45ESTER INDUSTRIES LTD.
NOTES TO FINANCIAL STATEMENT for the year ended March 31, 2013
1. Nature of operations
Ester Industries Limited (hereinafter referred to as ‘the Company’) is a manufacturer of polyester film and engineering plastics.
2. Statement of significant accounting policies
a) Basis of preparation
The financial statements of the company have been prepared in accordance with generally accepted accounting principles in India (Indian GAAP). The company has prepared these financial statements to comply in all material respects with the accounting standards notified under the Companies (Accounting Standards) Rules, 2006,(as amended) and the relevant provisions of the Companies Act,1956. The financial statements have been prepared under the historical cost convention on an accrual basis except in case of assets for which revaluation is carried out. The accounting policies adopted in the preparation of financial statements are consistent with those of previous year, except for the change in accounting policy explained below.
b) Change in accounting policy
Pursuant to clarification issued by Ministry of Corporate Affairs, Government of India dated August 9, 2012, the Company has changed the accounting policy in respect of foreign exchange fluctuation as prescribed under para 4(e) of Accounting Standard 16 “Borrowing Costs”. Accordingly, foreign exchange fluctuations amounting to Rs. 614.88 lacs has been capitalised and added to the cost of fixed assets. Hitherto followed, loss of the Company would have been higher by Rs. 587.77 lacs (net of tax of Rs. Nil) and net block of fixed assets would have been lower by Rs. 587.36 lacs (net of depreciation of Rs. 27.52 lacs).
c) Use of estimates
The preparation of financial statements in conformity with Indian GAAP requires the management to make judgments, estimates and assumptions that affect the reported amounts of revenues, expenses, assets and liabilities and the disclosure of contingent liabilities, at the end of the reporting period. Although these estimates are based on the management’s best knowledge of current events and actions, uncertainty about these assumptions and estimates could result in the outcomes requiring a material adjustment to the carrying amounts of assets or liabilities in future periods.
d) Tangible fixed Assets
Tangible fixed assets are stated at cost, less accumulated depreciation and impairment losses, if any, except Land, Building and Plant & Machinery, which had been revalued on 31.10.1992 by a Government registered valuer on the basis of the then replacement value. The cost comprises purchase price, borrowing costs if capitalization criteria are met and directly attributable cost of bringing the asset to its working condition for the intended use. Any trade discounts and rebates are deducted in arriving at the purchase price.
Expenditure directly relating to construction activity is capitalized (net of income, if any). Indirect expenditure specifically attributable to construction of a project or to the acquisition of the fixed assets or bringing it to working condition is capitalised as part of Construction project or as a part of Fixed assets. Other indirect expenditure incurred during the construction period which is not related to construction activity nor is incidental thereto is charged to Statement of profit and loss.
Gains or losses arising from derecognition of fixed assets are measured as the difference between the net disposal proceeds and the carrying amount of the asset and are recognized in the Statement of profit and loss when the asset is derecognized.
Subsequent expenditure related to an item of fixed asset is added to its book value only if it increases the future benefits from the existing asset beyond its previously assessed standard of performance. All other expenses on existing fixed assets, including day-to-day repair and maintenance expenditure and cost of replacing parts, are charged to the Statement of profit and loss for the period during which such expenses are incurred.
e) Depreciation
i. Depreciation on fixed assets (other than lease hold improvements) is provided using Straight Line Method as per rates prescribed under Schedule XIV of the Companies Act, 1956. The management of the Company is of the view that this depreciation rate fairly represents the useful life of the assets except for the following assets where a higher rate is used:

46 ESTER INDUSTRIES LTD. 27th Annual Report 2012-13
Rates (SLM) Schedule XIV Rates (SLM)
Batteries under UPS project (Plant and Machinery) 19.60% 5.28%
ii. Fixed assets costing below Rs.5000 are depreciated at the rate of 100%.
iii. Depreciation on the revalued portion of fixed assets is adjusted against the revaluation reserve.
iv. Depreciation on the amount of additions made to fixed assets due to up gradations / improvements is provided over the remaining useful life of the asset to which it relates.
v. Depreciation on fixed assets added/disposed off during the year is provided on pro-rata basis.
vi. Lease hold improvements are amortised over a primary period of lease i.e 9 years or useful life, whichever is lower.
f) Intangibles
Software costs relating to acquisition of initial software license fee and installation costs are capitalized in the year of purchase. Software’s are amortized on a straight-line basis over its useful life, which is considered to be of a period of three years.
g) Impairment of assets
i) The carrying amounts of assets are reviewed at each balance sheet date if there is any indication of impairment based on internal/external factors. An impairment loss is recognized wherever the carrying amount of an asset exceeds its recoverable amount. The recoverable amount is the greater of the asset’s net selling price and value in use. In assessing value in use, the estimated future cash flows are discounted to their present value a pre-tax discount rate that reflects current market assessment of the time value of money and risks specific to asset.
ii) After impairment, depreciation is provided on the revised carrying amount of the asset over the remaining useful life.
h) Leases
Where the Company is the lessee
Leases where the lessor effectively retains substantially all the risks and benefits of ownership of the leased item are classified as operating leases. Operating lease payments are recognized as an expense in the Statement of profit and loss on a straight-line basis over the lease term.
i) Investment
Investments that are readily realizable and intended to be held for not more than a year are classified as current investments. All other investments are classified as long-term investments. Current investments are carried at lower of cost and fair value determined on an individual investment basis. Long-term investments are carried at cost. However, provision for diminution in value is made to recognize a decline other than temporary in the value of such investments.
j) Inventories
Inventories are valued as follows:
Raw materials, Components and stores & spares
Lower of cost and net realizable value. However, materials and other items held for use in the production of inventories are not written down below cost if the finished products, in which they will be incorporated, are expected to be sold at or above cost. Cost of raw materials, components and stores & spares is determined on a moving weighted average basis.
Work-in-progress and finished goods
Lower of cost and net realizable value. Cost includes direct materials and labour and a proportion of manufacturing overheads based on normal operating capacity. Cost of finished goods includes excise duty. Cost is determined on moving weighted average basis.
Net realizable value is the estimated selling price in the ordinary course of business, less estimated costs of completion and estimated costs necessary to make the sale.

27th Annual Report 2012-13 47ESTER INDUSTRIES LTD.
k) Revenue recognition
Revenue is recognized to the extent that it is probable that the economic benefits will flow to the Company and the revenue can be reliably measured.
Sale of Goods
Revenue from sale of goods is recognized when all the significant risks and rewards of ownership of the goods have been passed to the buyer. The company collects sales taxes and value added taxes (VAT) on behalf of the government and, therefore, these are not economic benefits flowing to the company. Hence, they are excluded from revenue. Excise duty deducted from revenue (gross) is the amount that is included in the revenue (gross) and not the entire amount of liability arising during the year.
Export Benefit
Export Benefits constituting import duty benefits under Duty Exemption Pass Book (DEPB), Duty Draw back and advance license scheme are accounted for on accrual basis. Export benefits under Duty Exemption Pass Book (DEPB) & Duty Draw back are considered as other operating income.
Interest
Revenue is recognised on a time proportion basis taking into account the amount outstanding and the rate applicable.
Dividends
Dividend income is recognized when the company’s right to receive dividend is established by the reporting date.
Policy for Insurance Claims
Claims receivable on account of insurance are accounted for to the extent the Company is reasonably certain of their ultimate collection.
l) Foreign currency transactions
Initial Recognition
Foreign currency transactions are recorded in the reporting currency, by applying to the foreign currency amount the exchange rate between the reporting currency and the foreign currency at the date of the transaction.
Conversion
Foreign currency monetary items are reported using the closing rate. Non-monetary items which are carried in terms of historical cost denominated in a foreign currency are reported using the exchange rate at the date of the transaction; and non-monetary items which are carried at fair value or other similar valuation denominated in a foreign currency are reported using the exchange rates that existed when the values were determined.
Exchange Differences
i) Exchange differences arising on long-term foreign currency monetary items related to acquisition of a fixed asset are capitalized and depreciated over the remaining useful life of the asset. For this purpose, the Company treats a foreign currency monetary item as “long-term foreign currency monetary item”, if it has a term of 12 months or more at the date of its origination. In accordance with MCA circular dated 09 August 2012, exchange differences for this purpose, are total differences arising on long-term foreign currency monetary items for the year.
ii) All other exchange differences are recognized as income or as expenses in the period in which they arise.
Forward Exchange Contracts not intended for trading or speculation purposes
The premium or discount arising at the inception of forward exchange contracts is amortised as expense or income over the life of the contract. Exchange differences on such contracts are recognised in the Statement of profit and loss in the year in which the exchange rates change. Any profit or loss arising on cancellation or renewal of forward exchange contract is recognised as income or as expense for the year.

48 ESTER INDUSTRIES LTD. 27th Annual Report 2012-13
m) Retirement and other employee benefits
i. Retirement benefits in the form of Superannuation Fund (being funded to LIC), Provident Fund (where contributed to the Regional Provident Fund Commissioner) and employee state insurance are defined contribution schemes. The Company has no obligation, other than the contribution payable to the respective authorities. The Company recognizes contribution payable to respective authorities as an expenditure, when an employee renders the related service. If the contribution payable to the scheme for service received before the balance sheet date exceeds the contribution already paid, the deficit payable to the scheme is recognized as a liability after deducting the contribution already paid. If the contribution already paid exceeds the contribution due for services received before the balance sheet date, then excess is recognized as an asset to the extent that the pre payment will lead to, for example, a reduction in future payment or a cash refund.
ii. Gratuity liability is defined benefit obligation and is provided for on the basis of an actuarial valuation on projected unit credit method made at the end of each financial year.
iii. Retirement benefit in the form of provident Fund (Where administered by trust created and managed by Company) is a defined benefit obligation of the company and the contributions are charged to Statement of profit & loss of the year when the contribution to the respective funds are due. Shortfall in the funds, if any, is adequately provided for by the company based on the actuarial valuation on projected unit credit method carried out at the end of each financial year.
iv. Short term compensated absences are provided for based on estimates. Long term compensated absences are provided for based on actuarial valuation. The actuarial valuation is done as per projected unit credit method. The Company presents the leave as a current liability in the balance sheet, to the extent it does not have an unconditional right to defer its settlement for 12 months after the reporting date.
v. Actuarial gains/losses are immediately taken to Statement of profit and loss and are not deferred.
n) Income Taxes
Tax expense comprises of current and deferred tax. Current income tax is measured at the amount expected to be paid to the tax authorities in accordance with the Income Tax Act, 1961. Deferred income taxes reflects the impact of current year timing differences between taxable income and accounting income for the year and reversal of timing differences of earlier years.
Deferred tax is measured based on the tax rates and the tax laws enacted or substantively enacted at the balance sheet date. Deferred tax assets are recognised only to the extent that there is reasonable certainty that sufficient future taxable income will be available against which such deferred tax assets can be realised. If the company has unabsorbed depreciation and carry forward of tax losses, all deferred tax assets are recognised only if there is virtual certainty supported by convincing evidence that such deferred tax assets can be realised against future taxable profits.
At each balance sheet date the Company re-assesses unrecognized deferred tax assets. It recognises unrecognized deferred tax assets to the extent that it has become reasonably certain or virtually certain, as the case may be that sufficient future taxable income will be available against which such deferred tax assets can be realised.
The carrying amount of deferred tax assets are reviewed at each balance sheet date. The Company writes-down the carrying amount of a deferred tax asset to the extent that it is no longer reasonably certain or virtually certain, as the case may be, that sufficient future taxable income will be available against which deferred tax asset can be realised. Any such write-down is reversed to the extent that it becomes reasonably certain or virtually certain, as the case may be, that sufficient future taxable income will be available.
MAT credit is recognised as an asset only when and to the extent there is convincing evidence that the company will pay normal income tax during the specified period. In the year in which the Minimum Alternative tax (MAT) credit becomes eligible to be recognized as an asset in accordance with the recommendations contained in guidance note issued by the Institute of Chartered Accountants of India, the said asset is created by way of a credit to the Statement of profit and loss and shown as MAT Credit Entitlement. The Company reviews the same at each balance sheet date and writes down the carrying amount of MAT Credit Entitlement to the extent there is no longer convincing evidence to the effect that Company will pay normal Income Tax during the specified period.

27th Annual Report 2012-13 49ESTER INDUSTRIES LTD.
o) Borrowing Costs
Borrowing cost includes interest, amortization of ancillary costs incurred in connection with the arrangement of borrowings.
Borrowing costs directly attributable to the acquisition, construction or production of an asset that necessarily takes a substantial period of time to get ready for its intended use or sale are capitalized as part of the cost of the respective asset. All other borrowing costs are expensed in the period they occur.
p) Provisions
A provision is recognised when an enterprise has a present obligation as a result of past event and it is probable that an outflow of resources will be required to settle the obligation, in respect of which a reliable estimate can be made. Provisions are not discounted to its present value and are determined based on best management estimate required to settle the obligation at the balance sheet date. These are reviewed at each balance sheet date and adjusted to reflect the current management estimates. Provision for expenditure relating to voluntary retirement is made when the employee accepts the offer of early retirement.
q) Segment Reporting Policies
Identification of segments:
Primary Segment
Business Segment
The Company’s operating businesses are organized and managed separately according to the nature of products, with each segment representing a strategic business unit that offers different products and serves different markets. The identified segments are Manufacturing & Sale of Polyester film and Engineering plastics.
Secondary Segment
Geographical Segment
The analysis of geographical segments is based on the geographical location of the customers.
The geographical segments considered for disclosure are as follows:
• SaleswithinIndiaincludesalestocustomerslocatedwithinIndia.
• SalesoutsideIndiaincludesalestocustomerslocatedoutsideIndia.
Inter Segment Transfers:
Inter Segment transfers of goods, as marketable products produced by separate segments of the Company for captive consumption, are not accounted for in the books of account of the Company. For the purpose of segment disclosures, however, inter segment transfers have been taken at cost.
Allocation of common costs:
Common allocable costs are allocated to each segment in proportion to the turnover of the segment, except where a more logical allocation is possible.
Unallocated items:
Corporate income and expense are considered as a part of un-allocable income & expense, which are not identifiable to any business segment.
The company prepares its segment information in conformity with the accounting policies adopted for preparing and presenting the financial statements of the company as a whole.
r) Cash and Cash Equivalents
Cash and cash equivalents in the balance sheet comprise cash at bank and in hand and short-term investments with an original maturity of three months or less.

50 ESTER INDUSTRIES LTD. 27th Annual Report 2012-13
s) Contingent liabilities
A contingent liability is a possible obligation that arises from past events whose existence will be confirmed by the occurrence
or non-occurrence of one or more uncertain future events beyond the control of the company or a present obligation that is
not recognized because it is not probable that an outflow of resources will be required to settle the obligation. A contingent
liability also arises in extremely rare cases where there is a liability that cannot be recognized because it cannot be measured
reliably. The company does not recognize a contingent liability but discloses its existence in the financial statements.
t) Earnings Per Share
Basic earnings per share are calculated by dividing the net profit or loss for the year attributable to equity shareholders (after
deducting preference dividends and attributable taxes) by the weighted average number of equity shares outstanding during
the period. Partly paid equity shares are treated as a fraction of an equity share to the extent that they were entitled to
participate in dividends relative to a fully paid equity share during the reporting period. The weighted average numbers of
equity shares outstanding during the period are adjusted for events of bonus issue; bonus element in a rights issue to existing
shareholders; share split; and reverse share split (consolidation of shares).
For the purpose of calculating diluted earnings per share, the net profit or loss for the year attributable to equity shareholders
and the weighted average number of shares outstanding during the period are adjusted for the effects of all dilutive potential
equity shares.
u) Measurement of EBITDA
As permitted by the guidance note on revised schedule VI to the Companies Act, 1956, the company has elected to present
earnings before interest expense, tax, depreciation and amortization (EBITDA) as a separate line item on the face of the
statement of profit & loss. The company measures EBITDA on the basis of profit / (loss) from continuing operations. In its
measurement, the company includes interest income but does not include depreciation and amortization expenses, finance
cost and tax expenses.
3. Share capital
(Rs. In lacs)
As at As at
March 31, 2013 March 31, 2012
Authorized shares (No.)
150,000,000 (previous year: 150,000,000) equity shares of Rs. 5/- each 7,500.00 7,500.00
600,000 (previous year: 600,000) cumulative convertible preference shares of
Rs. 50/- each
300.00 300.00
8,000,000 (previous year: 8,000,000) redeemable cumulative preference shares
of Rs. 50/- each
4,000.00 4,000.00
Issued, subscribed & fully paid up shares (No.)
62,893,706 (previous year: 62,893,706) equity shares of Rs. 5/- each fully paid 3,144.69 3,144.69
a) Terms / rights attached to equity shares
The Company has only one class of equity share having a par value of Rs. 5 per share. Each equity shareholder is entitled for one
vote per share. The Company declares and pays dividend in Indian rupees.
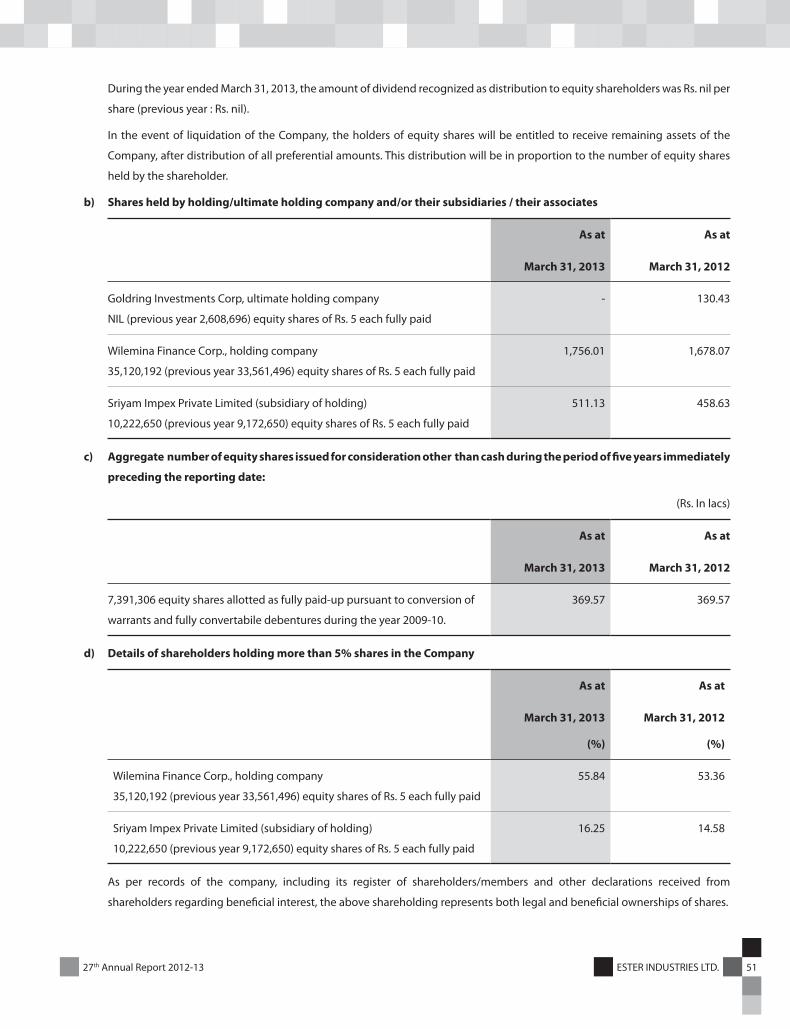
27th Annual Report 2012-13 51ESTER INDUSTRIES LTD.
During the year ended March 31, 2013, the amount of dividend recognized as distribution to equity shareholders was Rs. nil per
share (previous year : Rs. nil).
In the event of liquidation of the Company, the holders of equity shares will be entitled to receive remaining assets of the
Company, after distribution of all preferential amounts. This distribution will be in proportion to the number of equity shares
held by the shareholder.
b) Shares held by holding/ultimate holding company and/or their subsidiaries / their associates
As at As at
March 31, 2013 March 31, 2012
Goldring Investments Corp, ultimate holding company
NIL (previous year 2,608,696) equity shares of Rs. 5 each fully paid
- 130.43
Wilemina Finance Corp., holding company
35,120,192 (previous year 33,561,496) equity shares of Rs. 5 each fully paid
1,756.01 1,678.07
Sriyam Impex Private Limited (subsidiary of holding)
10,222,650 (previous year 9,172,650) equity shares of Rs. 5 each fully paid
511.13 458.63
c) Aggregate number of equity shares issued for consideration other than cash during the period of five years immediately
preceding the reporting date:
(Rs. In lacs)
As at As at
March 31, 2013 March 31, 2012
7,391,306 equity shares allotted as fully paid-up pursuant to conversion of
warrants and fully convertabile debentures during the year 2009-10.
369.57 369.57
d) Details of shareholders holding more than 5% shares in the Company
As at As at
March 31, 2013
(%)
March 31, 2012
(%)
Wilemina Finance Corp., holding company
35,120,192 (previous year 33,561,496) equity shares of Rs. 5 each fully paid
55.84 53.36
Sriyam Impex Private Limited (subsidiary of holding)
10,222,650 (previous year 9,172,650) equity shares of Rs. 5 each fully paid
16.25 14.58
As per records of the company, including its register of shareholders/members and other declarations received from
shareholders regarding beneficial interest, the above shareholding represents both legal and beneficial ownerships of shares.

52 ESTER INDUSTRIES LTD. 27th Annual Report 2012-13
4. Reserves & surplus
(Rs. In lacs)
As at As at
March 31, 2013 March 31, 2012
Capital reserve 5,778.57 5,778.57
Capital redemption reserve 335.37 335.37
Securities premium account 2,718.77 2,718.77
Revaluation reserve
Balance as per last financial statement 548.63 563.22
Less: transferred to profit and loss account 14.60 14.59
534.03 548.63
General reserve
Balance as per last account 1,503.67 1,503.67
Add: transferred from profit and loss account - -
1,503.67 1,503.67
Surplus / (Deficit) in the statement of profit and loss
Balance as per the last financial statement 12,373.89 13,765.80
Add: profit / (loss) for the year (526.99) (1,391.91)
Net surplus in the statement of profit & loss 11,846.90 12,373.89
Total reserve & surplus 22,717.31 23,258.90
5. Long-term borrowings
(Rs. In lacs)
Non-Current Portion Current maturities
As at As at As at As at
March 31, 2013 March 31, 2012 March 31, 2013 March 31, 2012
Secured
Term loans from banks 1,658.51 3,050.46 2,467.34 2,301.88
Term loans from body corporate - 43.51 43.51 107.26
Vehicle loans 98.45 113.67 78.34 80.00
Buyers' credit for capital goods 14,203.46 13,588.47 - -
15,960.42 16,796.11 2,589.19 2,489.14
Amount Disclosed under the head "other current
liabilities" (Refer note 10)
(2,589.19) (2,489.14)
Total Long-term borrowings 15,960.42 16,796.11 - -

27th Annual Report 2012-13 53ESTER INDUSTRIES LTD.
I. Term loans
a) From Bank of Baroda of Rs. 1712.00 lacs (Previous year Rs. 862.39 lacs) for Corporate Office project is secured by mortgage
created by way of deposit of title deeds in respect of the immoveable property (land and building) at Gurgaon. The term
loan bears floating interest at the rate base rate plus 4.25% pa. As per sanction, the term loans are repayable in 71 monthly
installments starting from 1st April 2012. The outstanding amount as on 31st March 2013 is repayable in 59 monthly installments
starting from 1st April 2013.
b) From State bank of Bikaner and Jaipur of Rs. 160.82 lacs (Previous year Rs. 211.50 lacs) is secured by first exclusive charge by
way of hypothecation of Oil Fired Heater, Reclaim Co-extruder and In-Line Coater and further secured by irrevocable guarantee
of Wilemina Finance Corp. (Holding company). The term loan bears floating interest at the base rate plus 3.25% pa. The Term
Loans are repayable in 20 quarterly installments starting from Dec’ 2011. The outstanding amount as on 31st March 2013 is
repayable in 14 quarterly installments starting from 1st April 2013.
c) From consortium member banks of Rs. 2253.03 lacs (Previous Year Rs.4278.45 lacs) are secured by first mortgage created by
way of deposit of title deeds in respect of the immovable properties at Khatima, both present & future and first charge by way
of hypothecation of Company’s all movable assets (save and except inventories, book debts, vehicles acquired through vehicles
loans and machinery acquired through term loan taken from banks / body corporate on exclusive charge basis), ranking pari
passu inter-se and further secured by irrevocable guarantee of Wilemina Finance Corp. (Holding company). The term loans bear
floating interest rate ranging from Base Rate plus 2.75% - 4.25% pa. These term loans are repayable in 28 quarterly installments
starting from 1st April 2012. The outstanding amount as on 31st March 2013 is repayable in 24 quartery installments starting
from 1st April 2013.
Term Loans from banks are further secured by second charge by way of hypothecation of stocks of raw material, finished goods,
semi finished goods, stores and spares, book debts and other receivables (both present and future).
d) From Body Corporate (Tata Capital Limited) is secured by first exclusive charge by way of hypothecation of Off Line Coater
and further secured by irrevocable guarantee of Mr. Arvind Kumar Singhania (Chairman of the Company) and Wilemina
Finance Corp. (Holding company). The term loan from body corporate bears floating interest at the rate 16.50% pa. These
term loan is repayable in 36 monthly installments starting from Feb’ 2011. The outstanding amount as on 31st March 2013 is
repayable in 10 monthly installments starting from 1st April 2013.
II. Vehicle loans are secured by hypothecation of specific vehicles acquired out of proceeds of the Loans. Vehicle loans bears interest
rates ranging from 9.65 to 11.00% pa. These loans are repayable in monthly installments till July’2016.
III. Buyers’ Credit for capital goods
a) Buyers’ credit amounting to Rs. 12,092.34 lacs (Previous Year Rs. 11,585.76 lacs) are against Letters of Undertaking (LOUs) /
Letter of Comfort (LOCs) issued by consortium of banks. LOUs / LOCs facility is secured by first mortgage created by way of
deposit of title deeds in respect of the immovable properties situated at Khatima, both present & future and first charge by way
of hypothecation of all movable assets (save and except inventories, book debts, vehicles acquired through vehicles loans and
machinery acquired through term loans taken from body corporate on exclusive charge basis), ranking pari passu inter-se and
further secured by irrevocable guarantee of Wilemina Finance Corp. (Holding company).
b) Buyers’ Credit amounting to Rs. 1,082.36 lacs (Previous Year Rs. 1,012.91 lacs) are against LOUs / LOCs issued by Union Bank
of India (UBI). LOUs / LOCs facility from UBI is secured by first exclusive charge by way of hypothecation of Metallizer (Topmet
2850) and further secured by irrevocable guarantee of Wilemina Finance Corp. (Holding company).
c) Buyers’ Credit amounting to Rs. 1,028.76 lacs (Previous Year Rs. 989.80 lacs) are against LOUs / LOCs issued by State bank of
Bikaner & Jaipur (SBBJ). LOUs / LOCs facility from SBBJ is secured by first exclusive charge by way of hypothecation of Oil
Fired Heater, Reclaim Co-extruder and In-Line Coater, and further secured by irrevocable guarantee of Wilemina Finance Corp.
(Holding company).

54 ESTER INDUSTRIES LTD. 27th Annual Report 2012-13
Company has availed LOUs / LOCs facilities from the banks to avail the Buyers’ Credit of Rs. 14,203.46 lacs (Previous Year - Rs. 13,588.47
Lacs). LOU / LOC facilities to the extent of Rs.13,121.10 Lacs (previous Year- Rs 12,575.56) is sanctioned to the company as a sub limit
of term loans upto a period of 3 years till September 2014.
LOCs / LOUs facilities are sanctioned to the company as a sub limit of term loan, bears interest rate ranging from 0.92% to 1.95%
Liability towards Buyers’ Credit under LOCs / LOUs will be liquidated out of the proceeds of term loans that are repayable over a
period of seven years.
6. Deferred tax liability
(Rs. In lacs)
As at As at
March 31, 2013 March 31, 2012
Deferred tax liabilities
Fixed assets: Impact of difference between tax depreciation and depreciation/
amortization charged for the financial reporting
4,237.16 3,655.39
Gross deferred tax liability 4,237.16 3,655.39
Deferred tax assets
Provision for doubtful debts and advances - -
Effect of expenditure debited to profit and loss account in the current year but
allowed for tax purposes in following years
2,341.71 1,506.04
Gross deferred tax assets 2,341.71 1,506.04
Net deferred tax liability / (asset) 1,895.45 2,149.35
7. Provisions
(Rs. In lacs)
As at As at
March 31, 2013 March 31, 2012
Long term provisions
Provision for gratuity (refer note 29) 436.89 392.72
Total long term provision 436.89 392.72
Short term provisions
Provision for taxation (net of advance tax payments) 74.96 74.96
Provision for wealth tax 1.92 7.07
Provision for gratuity (refer note 29) 32.71 17.52
Provision for leave benefits 116.09 108.37
Total short term provision 225.68 207.92
Total provisions 662.57 600.64

27th Annual Report 2012-13 55ESTER INDUSTRIES LTD.
8. Short Term Borrowings
(Rs. In lacs)
As at As at
March 31, 2013 March 31, 2012
Secured
Working capital loan from banks 6,773.59 3,084.24
Bills discounting 3,015.91 2,231.11
Buyers' credit for raw material 760.81 1,630.93
Acceptances 4,380.06 4,133.33
Total short term borrowings 14,930.37 11,079.61
Working capital loan and bills discounting: These loans are secured by first charge by way of hypothecation of stocks of raw materials, finished goods, semi finished goods, stores and spares, book debts and other receivables (both present and future) and further secured by irrevocable guarantees of Wilemina Finance Corp. (Holding company). Working Capital and Bill discounting facilities are further secured by way of second charge in respect of immovable properties and movable fixed assets.
The working capital loans from banks bear floating interest rate ranging from Base Rate plus 2.50% to 2.75% pa.
Buyers’ Credit for raw material are against LOUs / LOCs issued by consortium of banks. The LOUs / LOCs facilities is sanctioned to the Company as a sub limit of Non Fund (LCs) based facility. The facility is secured by first charge by way of hypothecation of stocks of raw materials, finished goods, semi finished goods, stores and spares, book debts and other receivables (both present and future) and further secured by irrevocable guarantees of Wilemina Finance Corp. (Holding company). Buyers’ credit for raw material bears interest rate ranging from 1.03% to 1.66%.
9. Trade Payable(Rs. In lacs)
As at As at
March 31, 2013 March 31, 2012
Trade payables
Total outstanding dues of other than micro & small enterprises 2,053.56 1,796.18
Total outstanding dues of micro & small enterprises (refer note 33) 28.76 64.53
Total trade payables 2,082.32 1,860.71
10. Other current liability
(Rs. In lacs)
As at As atMarch 31, 2013 March 31, 2012
Current maturities of term loans from banks 2,467.34 2,301.88 Current maturities of term loans from body corporate 43.51 107.26 Current maturities of vehicle loans 78.34 80.00 Interest accrued but not due on borrowings 63.50 106.70 Deposits from dealer / customer & others 2.58 2.58 Advances from customers 259.31 356.13 Investor education & protection fund will be credited by this amount (as & when due) - Unpaid Dividend
63.58 69.23
Others payables- dues to statutory authorities 200.49 114.88 - others 733.04 683.52
3,911.69 3,822.18 Total other liabilities 3,911.69 3,822.18

56 ESTER INDUSTRIES LTD. 27th Annual Report 2012-13
11.
Fixe
d as
sets
(Rs.
in la
cs)
Des
crip
tion
Gro
ss b
lock
Acc
umul
ated
dep
reci
atio
n / a
mor
tisa
tion
Net
blo
ck
Apr
il 1,
201
2A
ddit
ions
Ded
ucti
ons
Mar
ch 3
1, 2
013
Apr
il 1,
201
2Cu
rren
t ye
arD
educ
tion
sM
arch
31,
201
3M
arch
31,
201
3M
arch
31,
201
2
Tang
ible
ass
ets:
Land
- fr
eeho
ld (i
i) 1
,504
.36
- -
1,5
04.3
6 -
- -
- 1
,504
.36
1,5
04.3
6
Build
ings
(ii)
5,3
48.9
0 1
,843
.27
23.
58
7,1
68.5
9 1
,529
.09
168
.45
13.
79
1,6
83.7
5 5
,484
.84
3,8
19.8
1
Plan
t & m
achi
nery
(i),
(ii) &
(iii)
56,
977.
58
3,1
71.9
1 3
8.00
6
0,11
1.49
2
8,05
5.78
2
,494
.24
28.
19
30,
521.
83
29,
589.
66
28,
921.
80
Furn
iture
& fi
xtur
es 1
99.2
2 1
83.8
5 9
4.97
2
88.1
0 9
2.76
1
1.72
5
4.42
5
0.06
2
38.0
4 1
06.4
6
Leas
e ho
ld im
prov
emen
ts 1
45.8
1 -
145
.81
- 9
9.67
3
8.86
1
38.5
3 -
- 4
6.14
Offi
ce e
quip
men
ts 5
13.7
7 1
02.1
8 1
03.3
6 5
12.5
9 2
93.9
5 4
3.76
8
3.67
2
54.0
4 2
58.5
5 2
19.8
2
Vehi
cles
5
05.7
2 1
00.5
0 3
7.17
5
69.0
5 1
42.9
9 5
1.06
1
1.97
1
82.0
8 3
86.9
7 3
62.7
3
Inta
ngib
le a
sset
s:
Soft
war
e 3
16.8
2 9
0.62
0
.38
407
.06
253
.29
65.
03
0.3
6 3
17.9
6 8
9.10
6
3.53
Tota
l 6
5,51
2.18
5
,492
.33
443
.27
70,
561.
24
30,
467.
53
2,8
73.1
2 3
30.9
3 3
3,00
9.72
3
7,55
1.52
3
5,04
4.65
Prev
ious
yea
r
6
4,20
2.40
1
,916
.93
607
.17
65,
512.
18
27,
879.
09
2,6
68.1
4 7
9.70
3
0,46
7.53
3
5,04
4.65
3
6,32
3.31
(i)
(a)
Am
ount
of b
orro
win
g co
st a
ggre
gatin
g Rs
. 108
.20
lacs
(Pre
viou
s ye
ar R
s.5.3
4 la
cs) h
ave
been
cap
italis
ed d
urin
g th
e ye
ar.
Build
ing
- Rs.
85.1
6 la
cs (p
revi
ous Y
ear -
NIL
)
Plan
t & M
achi
nery
- R
s. 20
.73
lacs
(pre
viou
s Yea
r Rs.
5.34
lacs
)
Offi
ce E
quip
men
t - R
s. 2.
31 la
cs (p
revi
ous Y
ear -
NIL
)
(b)
Fore
ign
Exch
ange
Flu
ctua
tion
aggr
egat
ing
Rs. 6
14.8
8 la
cs o
n pl
ant &
mac
hine
ry (P
revi
ous
year
NIL
) ha
ve b
een
capi
talis
ed d
urin
g th
e ye
ar.
(ii)
(a)
Gro
ss b
lock
of fi
xed
asse
ts in
clud
es R
s. 72
99.5
3 la
cs (p
revi
ous Y
ear R
s.7,2
99.5
3 la
cs) b
eing
the
amou
nt a
dded
on
reva
luat
ion
of fi
xed
asse
ts o
n 31
-10-
1992
Reva
luat
ion
was
car
ried
out
by a
n ex
tern
al v
alue
r as
per
“Exi
stin
g U
se V
alue
” met
hod
usin
g pr
evai
ling
mar
ket
pric
es o
f the
ass
ets
and
whe
re s
uch
pric
es w
ere
not
avai
labl
e, R
BI in
dice
s w
ere
used
.
Det
ails
of a
dditi
ons
due
to re
valu
atio
n du
ring
1992
are
as
follo
ws:
Land
- R
s. 39
.93
Lacs
(pre
viou
s ye
ar R
s. 39
.93
lacs
)
Build
ing
- Rs.
526.
23 L
acs
(pre
viou
s ye
ar R
s. 52
6.23
lacs
)
Plan
t and
mac
hine
ry
- Rs.
6733
.37
Lacs
(pre
viou
s ye
ar R
s. 67
33.3
7 la
cs)
(iii)
Plan
t & m
achi
nery
Rs.
NIL
(pre
viou
s ye
ar R
s. 44
8.05
lacs
) hav
e be
en a
djus
ted
for r
emis
sion
of l
iabi
lity
tow
ards
tech
nici
an fe
e &
oth
er e
xpen
ses.

27th Annual Report 2012-13 57ESTER INDUSTRIES LTD.
12. Non-current Investments
(Rs. In lacs)
As at As at
March 31, 2013 March 31, 2012
A. Other than trade - quoted (Valued at cost unless stated otherwise)
Equity shares
- 100 (previous year 100) equity shares of Rs.10 each fully paid up in Pearl Polymers Ltd. 0.04 0.04
- NIL (previous year 200) equity shares of Rs.10 each fully paid up in Polyplex Corporation Ltd. - 0.05
- 50 (previous year 50) equity shares of Rs.10 each fully paid up in J.K.Synthetics Ltd. 0.03 0.03
- NIL (previous year 200) equity shares of Rs.10 each fully paid up in Reliance Industries Ltd. - 0.14
- 100 (previous year 100) equity shares of Rs.10 each fully paid up in Haryana Petrochemicals Ltd. 0.04 0.04
- 100 (previous year 100) equity shares of Rs.10 each fully paid up in Sanghi Polyester Ltd. 0.08 0.08
- 360 (previous year 360) equity shares of Rs.5 each fully paid up in Venlon Enterprises Ltd. 0.10 0.10
- NIL (previous year 196) equity shares of Rs.10 each fully paid up in Nirlon Ltd. - 0.02
- 100 (previous year 100) equity shares of Rs.10 each fully paid up in Modipon Ltd. 0.11 0.11
- NIL (previous year 100) equity shares of Rs.10 each fully paid up in Garware Polyester Ltd. - 0.01
- NIL (previous year 100) equity shares of Rs.10 each fully paid up in SRF Ltd. - 0.02
- NIL (previous year 100) equity shares of Rs.10 each fully paid up in Uflex Industries Ltd. - 0.05
- NIL (previous year 200) equity shares of Rs.10 each fully paid up Jindal Poly Films Ltd. - 0.03
- NIL (previous year 30,000) equity shares of Rs.10 each fully paid up in Ispat Industries Limited - 7.17
- NIL (previous year 1000) equity shares of Rs.10 each fully paid up in Bajaj Hindustan Limited - 5.40
0.40 13.29
Less: provision for diminution in the value of Investments 0.22 4.88
0.18 8.41
B. Other than trade - unquoted (Valued at lower of cost or fair value)
Units of mutual fund
- NIL (previous year 21,824.53) units of SBI- Magnum Comma Fund - Growth Plan of Rs. 22.91
each fully paid up (units purchased during the year Rs.Nil (previous Year Rs.Nil )
- 5.00
- NIL (previous year 50000) units in Baroda Pioneer Infrastructure Fund - Growth Plan of Rs. 10 each
fully paid up (units purchased during the previous year Rs. Nil (previous year Rs. 5.00 lacs)).
- 5.00
- NIL (previous year 100,000) units in Baroda Pioneer PSU Equity Fund - Growth Plan of Rs. 10
each fully paid up (units purchased during the year Rs. Nil (previous year Rs. 10.00 lacs)).
- 10.00
- NIL (previous year 100,000) units in SBI- PSU Fund Growth of Rs. 10 each fully paid up
(units purchased during the year Rs. Nil (previous year Rs. 10.00 lacs)).
- 10.00
- NIL (previous year 108,342) units in SBI- PSU Fund Growth Plan of Rs. 9.23 each fully paid up
(units purchased during the year Rs. Nil (previous year Rs. 10.00 lacs)).
- 10.00
- NIL (previous year 14,612.83) units in DSP Blackrock balanced Fund- Growth Plan of Rs. 68.43
each fully paid up (units purchased during the year Rs. Nil (previous year Rs. 10.00 lacs)).
- 10.00
- NIL (previous year 20,633.45) units in DSP Blackrock Top 100 Eq Fund- Growth Plan of Rs. 96.93
each fully paid up (units purchased during the year Rs. Nil (previous year Rs. 20.00 lacs)).
- 20.00
Preference shares
- 20,000 (previous year 20,000) preference shares of Rs.10 each fully paid up Ispat Industries Limited 4.78 4.78
4.78 74.78
Less : provision for diminution in the value of Investment Ispat Industries Limited 3.25 2.78
1.53 72.00
C. In subsidiary companies (Valued at cost unless stated otherwise)
Other than trade (unquoted, fully paid up)
- 25000 (previous year 25000) equity shares of Rs. 1 each fully paid Ester International [USA] Ltd. 9.69 9.69
(a company under the same management under section 370(1B) of the companies Act, 1956.)
Less : provision for diminution in the value of Investment 9.69 9.69
- -
1.71 80.41
Aggregate amount of quoted investments (market value Rs 0.034 lacs, (previous year Rs. 7.14 lacs)
(net of provision)
0.18 8.41
Aggregate amount of unquoted investments (net of provision) 1.53 72.00
Total investment net of provisions 1.71 80.41

58 ESTER INDUSTRIES LTD. 27th Annual Report 2012-13
13. Loans & advances
(Rs. In lacs)
As at As at
March 31, 2013 March 31, 2012
Non-current
Unsecured, considered good
Capital advances 242.20 1,162.53
Prepaid expenses 64.31 12.88
Deposits-others 428.18 294.90
Loans and advances to related parties (Refer note 34) 66.71 63.70
Total (A) 801.40 1,534.01
Current
Unsecured, considered good
Advances recoverable in cash or in kind or for value to be received 489.27 850.88
Prepaid expenses 350.52 432.97
Advance tax & tax deducted at source (net of provision of tax) 195.70 182.28
Balances with statutory / Government Authorities 208.29 1,387.57
Loans to employees 62.30 57.68
Deposits-others 47.96 13.06
Unsecured, considered doubtful
Advances recoverable in cash or in kind or for value to be received 31.91 31.91
1,385.95 2,956.35
Less: provision for doubtful advances 31.91 31.91
Total (B) 1,354.04 2,924.44
Total (A+B) 2,155.44 4,458.45
14. Other assets
(Rs. In lacs)
As at As at
March 31, 2013 March 31, 2012
Non-current
Others - -
Other bank balances (refer note 17) 9.61 57.19
Total other non-current assets 9.61 57.19
Current
Asset held for disposal (at net book value or estimated net realizable value,
which ever is less)
0.51 0.20
Interest receivable on deposits 29.47 42.15
Export benefit receivable 385.85 297.08
Unamortized premium on forward contracts 62.12 44.17
Total other current assets 477.95 383.60
Total other assets 487.56 440.79

27th Annual Report 2012-13 59ESTER INDUSTRIES LTD.
15. Inventory (at lower of cost or net relizable value)
(Rs. In lacs)
As at As at
March 31, 2013 March 31, 2012
Raw materials {including stock in transit Rs. 978.93 lacs
(previous year Rs. 777.95 lacs)}
5,376.04 3,303.66
Work in process 436.25 1,127.68
Finished goods {including stock in transit Rs. 1156.34 lacs
(previous year Rs. 853.95 lacs)}
5,292.08 5,028.64
Stores and spares {including stock in transit Rs. 0.21 lacs
(previous year Rs. 14.58 lacs)}
1,165.74 971.05
Total inventories 12,270.11 10,431.03
16. Trade receivables
(Rs. In lacs)
As at As atMarch 31, 2013 March 31, 2012
Outstanding for a period exceeding six months from the date they are due for paymentUn-secured, considered good 10.84 23.26 Doubtful 20.93 -
31.77 23.26 Less: Provision for doubtful trade receivables 20.93 - Total (A) 10.84 23.26 Other receivablesSecured, considered good 1,545.61 1,647.28 Un-secured, considered good 9,345.72 6,750.11 Total (B) 10,891.33 8,397.39 Total (A+B) 10,902.17 8,420.65
17. Cash and bank balances
(Rs. In lacs)
As at As atMarch 31, 2013 March 31, 2012
Cash and cash equivalentsCash on hand 6.08 12.71 Balances with banks in current accounts 915.22 939.67 Unpaid dividend accounts * 63.58 69.23 Total (A) 984.88 1,021.61 Other bank balanceShort term deposits pledged 37.00 106.44 Deposits with maturity of more than 3 months but up to 12 months 351.99 881.47 Deposits with original maturity of more than 12 months 61.26 164.54 Total (B) 450.25 1,152.45 Total Cash & Bank Balance (A+B) 1,435.13 2,174.06 Less:- Amount disclosed under non-current assets (refer note 14) (9.61) (57.19)Cash & Bank Balance 1,425.52 2,116.87
* These balances are not available for use by the Company as they represent corresponding unpaid dividend liabilities
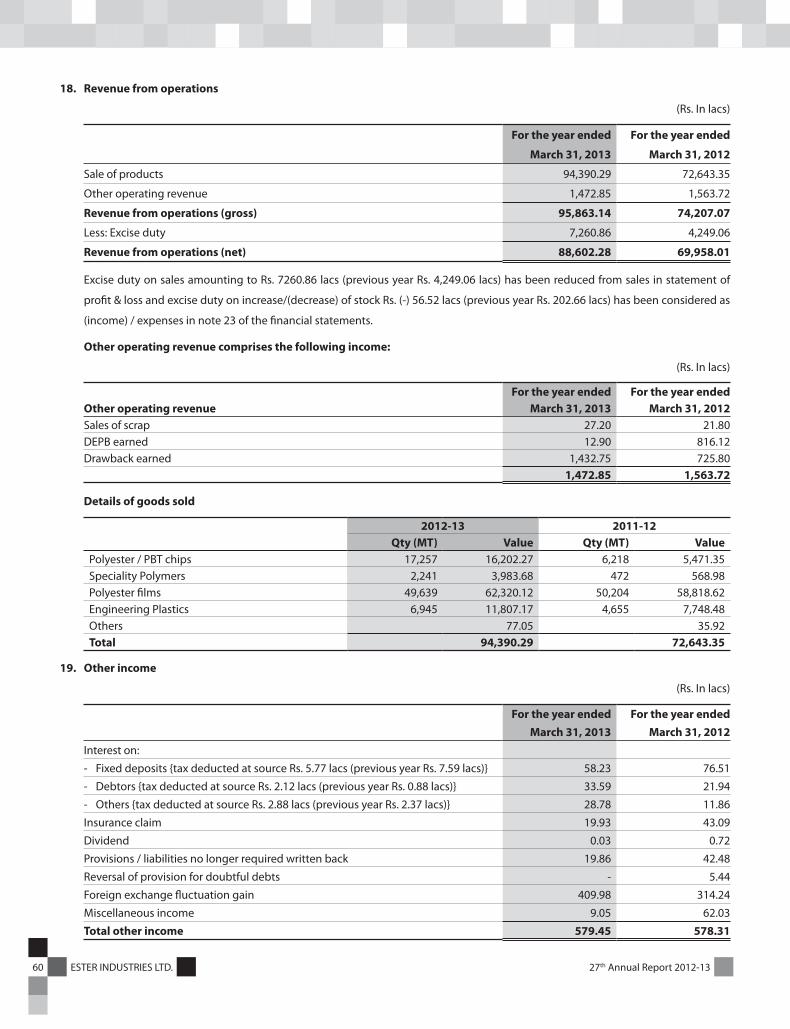
60 ESTER INDUSTRIES LTD. 27th Annual Report 2012-13
18. Revenue from operations
(Rs. In lacs)
For the year ended For the year ended
March 31, 2013 March 31, 2012
Sale of products 94,390.29 72,643.35
Other operating revenue 1,472.85 1,563.72
Revenue from operations (gross) 95,863.14 74,207.07
Less: Excise duty 7,260.86 4,249.06
Revenue from operations (net) 88,602.28 69,958.01
Excise duty on sales amounting to Rs. 7260.86 lacs (previous year Rs. 4,249.06 lacs) has been reduced from sales in statement of
profit & loss and excise duty on increase/(decrease) of stock Rs. (-) 56.52 lacs (previous year Rs. 202.66 lacs) has been considered as
(income) / expenses in note 23 of the financial statements.
Other operating revenue comprises the following income:
(Rs. In lacs)
For the year ended For the year endedOther operating revenue March 31, 2013 March 31, 2012Sales of scrap 27.20 21.80 DEPB earned 12.90 816.12 Drawback earned 1,432.75 725.80
1,472.85 1,563.72
Details of goods sold
2012-13 2011-12Qty (MT) Value Qty (MT) Value
Polyester / PBT chips 17,257 16,202.27 6,218 5,471.35Speciality Polymers 2,241 3,983.68 472 568.98Polyester films 49,639 62,320.12 50,204 58,818.62 Engineering Plastics 6,945 11,807.17 4,655 7,748.48 Others 77.05 35.92 Total 94,390.29 72,643.35
19. Other income
(Rs. In lacs)
For the year ended For the year ended March 31, 2013 March 31, 2012Interest on:
- Fixed deposits {tax deducted at source Rs. 5.77 lacs (previous year Rs. 7.59 lacs)} 58.23 76.51
- Debtors {tax deducted at source Rs. 2.12 lacs (previous year Rs. 0.88 lacs)} 33.59 21.94
- Others {tax deducted at source Rs. 2.88 lacs (previous year Rs. 2.37 lacs)} 28.78 11.86
Insurance claim 19.93 43.09
Dividend 0.03 0.72
Provisions / liabilities no longer required written back 19.86 42.48
Reversal of provision for doubtful debts - 5.44
Foreign exchange fluctuation gain 409.98 314.24
Miscellaneous income 9.05 62.03
Total other income 579.45 578.31

27th Annual Report 2012-13 61ESTER INDUSTRIES LTD.
20. Cost of raw material consumed
(Rs. In lacs)
For the year ended For the year ended
March 31, 2013 March 31, 2012
Cost of raw material consumed 64,490.13 51,833.23
Total 64,490.13 51,833.23
Details of raw material consumed
2012-13 2011-12
Qty (MT) Value Qty (MT) Value
PTA 59,108.73 38,003.85 51,632.51 32,137.17
MEG 23,179.27 13,829.02 20,434.62 12,072.16
PBT chips 3,765.80 4,790.89 2,575.18 3,339.67
NYLON 1,630.69 2,151.38 1,015.79 1,361.57
BUTANE DIOL 431.95 657.06 - -
NDC 169.60 545.30 - -
Others 4,512.63 2,922.66
Total 64,490.13 51,833.23
Inventory of Raw material
(Rs. In lacs)
2012-13 2011-12
Value Value
PTA 2,250.14 893.02
MEG 275.79 311.54
PBT chips 569.78 625.84
NYLON 437.88 382.56
BUTANE DIOL 212.43 -
Others 1,630.02 1,090.70
5,376.04 3,303.66
21. (Increase) / Decrease in Inventories
(Rs. In lacs)
For the year ended For the year ended (Increase) /
DecreaseMarch 31, 2013 March 31, 2012
Closing stock
- Finished goods 5,292.08 5,028.23 263.85
- Work in process 436.25 1,127.68 (691.43)
5,728.33 6,155.91 (427.58)
Opening stock
- Finished goods 5,028.23 2,945.39 2,082.84
- Work in process 1,127.68 735.66 392.02
6,155.91 3,681.05 2,474.86
Total (Increase) / Decrease 427.58 (2,474.86)

62 ESTER INDUSTRIES LTD. 27th Annual Report 2012-13
Inventory of finished goods
2012-13 2011-12
Qty (MT) Value Qty (MT) Value
Polyester chips 1,117.97 970.95 594.00 479.31
Speciality Polymers 371.15 622.62 370.00 365.04
Polyester films 1,809.29 2,260.66 1,821.00 2,144.32
Engineering plastics 200.40 302.72 181.00 271.32
Recycled polyester chips 1,263.02 1,135.13 2,215.00 1,768.65
5,292.08 5,028.64
Inventory of work in progress
2012-13 2011-12
Value Value
Polyester chips 206.40 267.36
Polyester films 154.70 824.61
Engineering plastics 75.15 35.71
436.25 1,127.68
22. Employee benefit expenses
(Rs. In lacs)
For the year ended For the year ended
March 31, 2013 March 31, 2012
Salaries, wages & bonus 2,494.94 1,899.95
Contribution to provident and other funds 237.57 207.77
Gratuity (refer note 29) 93.72 34.91
Staff welfare expenses 393.97 339.57
3,220.20 2,482.20
23. Other Expenditure
(Rs. In lacs)
For the year ended For the year ended
March 31, 2013 March 31, 2012
Manufacturing expenses
Consumption of stores and spare parts 1,136.62 1,119.64
Consumption of packing material 1,686.15 1,699.52
Power & fuel 6,486.87 5,365.94
Material handling charges 255.75 215.89
Increase / (decrease) in excise duty on closing stock (56.52) 202.66
Total manufacturing expenses (A) 9,508.87 8,603.65
Selling expenses
Freight 3,230.78 2,717.15
Commission and brokerage (other than sole selling agents) 409.37 381.53
Discount, claims and rebates 171.78 163.89
Others 0.68 -
Total selling expenses (B) 3,812.61 3,262.57

27th Annual Report 2012-13 63ESTER INDUSTRIES LTD.
For the year ended For the year ended
March 31, 2013 March 31, 2012Administration and other expenses
Rent 123.01 123.85 Rates and taxes 25.85 70.42 Insurance 209.70 217.07 Repairs & maintenance- Building 26.27 33.29 - Plant & machinery 186.92 153.21 - Others 138.03 123.75 Travelling & conveyance 748.21 686.44 Communication costs 106.40 130.69 Legal & professional charges 431.31 494.15 Printing & stationery 22.17 29.26 Donations (other than political parties) 8.80 73.30 Directors sitting fees 4.40 4.30 Auditors' remuneration - Statutory audit fee 16.00 13.50 - Limited review fee 12.00 8.50 - Out of pocket expenses 0.98 0.92 Loss on sale of DEPB license - 13.71 Loss on fixed assets sold / discarded 83.69 15.31 Loss on sale of Investments 8.32 - Bad debts, advances & irrecoverable balances written off 89.83 0.20 Provision for Obsolete inventory 4.03 - Premium on forward contract amortised 267.21 140.72 Miscellaneous expenses 484.77 390.53
Total Administrative & other expenses (C) 2,997.90 2,723.12 Total other expenses (A+B+C) 16,319.38 14,589.34
24. Finance cost
(Rs. In lacs)
For the year ended For the year endedMarch 31, 2013 March 31, 2012
Interest - on term loans 537.03 823.82 - on working capital 1,125.33 802.72 - on buyer's credit facilities 335.64 355.69 Exchange fluctuation component of borrowing cost (refer note 2(b)) - 906.01 Bank charges 648.81 661.24
2,646.81 3,549.48
25. Earning per share (EPS)
Year ended Year ended
March 31, 2013 March 31, 2012
Net profit/(loss) for calculation of basic /diluted EPS (Rs. in lacs) (526.99) (1,391.91)
Weighted average number of equity shares in calculating basic & diluted EPS 62,893,706 62,893,706
Basic / diluted EPS (in Rs.) (0.84) (2.21)

64 ESTER INDUSTRIES LTD. 27th Annual Report 2012-13
26. Capital commitments
(Rs. In lacs)
As at As atMarch 31, 2013 March 31, 2012
Estimated amount of contracts remaining to be executed on capital account and
not provided for
391.61 10,392.81
Capital Commitments are on account of upgradation of slitter used in polyster film lines and other assets.
27. Contingent liabilities not provided for
(Rs. In lacs)
As at As atMarch 31, 2013 March 31, 2012
(a) Excise Duty and Customs Duty pending hearing of appeals/writ petitions:(i) Cenvat credit disallowed on inputs (for the period March 1990 to Mar
1991) not covered under rule 57A, mainly Santotherm, Diethyl Glycol, Delion etc. Disallowance was due to use of inputs for manufacture of exempted goods.
8.06 8.06
(ii) Removal of PET chips (exempted goods) from bonded warehouse without payment of duty.
3.00 3.00
(iii) Goods sold from depot at higher value than one declared at factory gate price for the period Jun 1988 to Mar 1992.
25.46 25.46
(iv) Cenvat credit disallowed on inputs like DMT, additives etc. for the manufacturing of polyester chips. Disallowance was due to use of inputs for manufacturing of exempted goods.
164.20 164.20
(v) Reversal of Cenvat credit availed on HSD. Department disallowed credit alleging that cenvat credit has been wrongly availed on HSD.
206.92 206.92
(vi) Cenvat credit availed on raw material. Disallowance on account of credit availed fully on raw material and not on pro-rata basis for clearance of dutiable goods i.e. polyester films.
11.72 11.72
(vii) Availment of credit on import of Dimethyl Terephalate. Disallowance was due to use of inputs for manufacturing of exempted goods.
57.71 57.71
(viii) Other Miscellaneous Cases 33.82 33.82 (ix) Cenvat credit of Rs. 0.59 lacs not admissible on shape & section as capital
goods and Rs. 2.5 lacs recoverable against shortage of cenvatable inputs. 3.09 3.09
(x) Demand raised on account of excess / shortfall in stocks alleged by preventative staff.
12.95 12.95
(xi) Demand raised for differential amount of Custom Duty on import of PBT chips. 188.36 188.36 Total (a) 715.29 715.29 (b) Show cause notices related to Service Tax & Excise rebate on export 13.54 13.75 (c) Income Tax:
(i) Demand raised during assessment (A.Y. 1989-90) - 1.84 (ii) Disallowance of advertisement expenditure pursuant to rule 6B of IT
rules, 1962 in the revised return of income which is based on the auditor's report in respect of A.Y. 1990-91, 1993-94 to 1997-98 by ITAT.
1.68 1.68
(iii) Disallowance of club expenditure on the contention that they are not wholly and exclusively for the business needs of the company in respect of A.Y. 1990-91, 1993-94 to 1994-95 & A.Y. 2005-06 by ITAT.
1.80 1.80
(iv) Disallowance of 50% of entertainment expenses on the contention that there has been no participation of the employee for incurring such expenditure in respect of A.Y. 1993-94 to 1997-98 by ITAT.
5.10 5.10
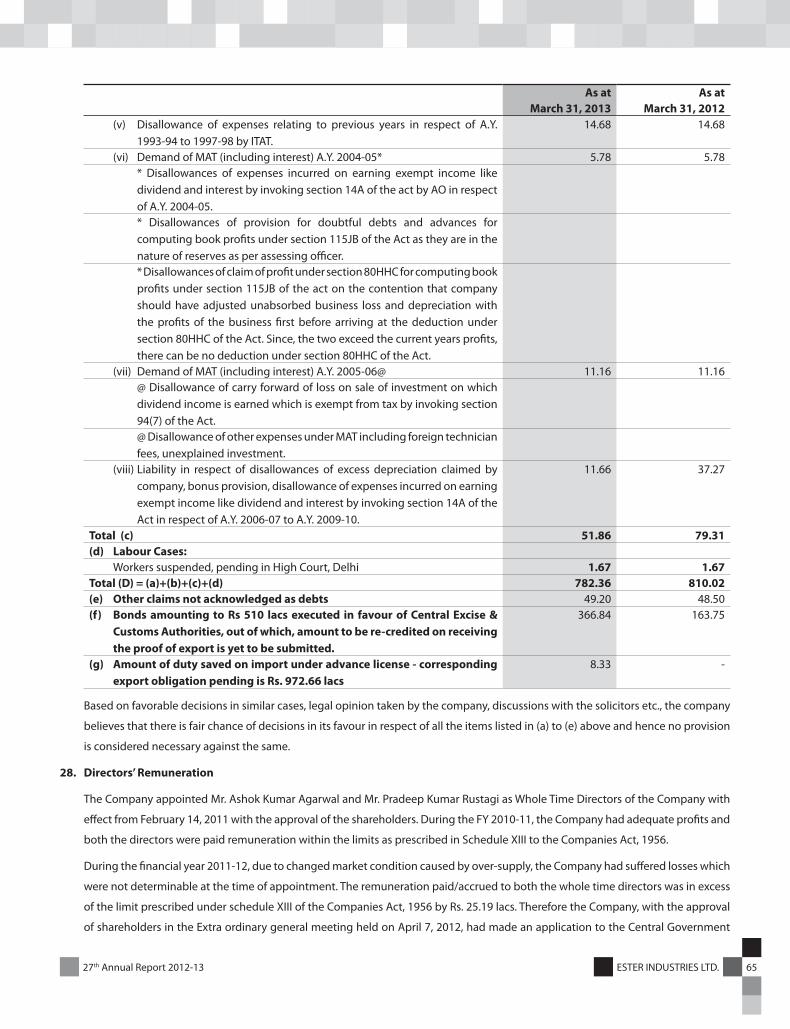
27th Annual Report 2012-13 65ESTER INDUSTRIES LTD.
As at As atMarch 31, 2013 March 31, 2012
(v) Disallowance of expenses relating to previous years in respect of A.Y. 1993-94 to 1997-98 by ITAT.
14.68 14.68
(vi) Demand of MAT (including interest) A.Y. 2004-05* 5.78 5.78 * Disallowances of expenses incurred on earning exempt income like dividend and interest by invoking section 14A of the act by AO in respect of A.Y. 2004-05.* Disallowances of provision for doubtful debts and advances for computing book profits under section 115JB of the Act as they are in the nature of reserves as per assessing officer.* Disallowances of claim of profit under section 80HHC for computing book profits under section 115JB of the act on the contention that company should have adjusted unabsorbed business loss and depreciation with the profits of the business first before arriving at the deduction under section 80HHC of the Act. Since, the two exceed the current years profits, there can be no deduction under section 80HHC of the Act.
(vii) Demand of MAT (including interest) A.Y. 2005-06@ 11.16 11.16 @ Disallowance of carry forward of loss on sale of investment on which dividend income is earned which is exempt from tax by invoking section 94(7) of the Act.@ Disallowance of other expenses under MAT including foreign technician fees, unexplained investment.
(viii) Liability in respect of disallowances of excess depreciation claimed by company, bonus provision, disallowance of expenses incurred on earning exempt income like dividend and interest by invoking section 14A of the Act in respect of A.Y. 2006-07 to A.Y. 2009-10.
11.66 37.27
Total (c) 51.86 79.31 (d) Labour Cases:
Workers suspended, pending in High Court, Delhi 1.67 1.67 Total (D) = (a)+(b)+(c)+(d) 782.36 810.02 (e) Other claims not acknowledged as debts 49.20 48.50 (f) Bonds amounting to Rs 510 lacs executed in favour of Central Excise &
Customs Authorities, out of which, amount to be re-credited on receiving the proof of export is yet to be submitted.
366.84 163.75
(g) Amount of duty saved on import under advance license - corresponding export obligation pending is Rs. 972.66 lacs
8.33 -
Based on favorable decisions in similar cases, legal opinion taken by the company, discussions with the solicitors etc., the company
believes that there is fair chance of decisions in its favour in respect of all the items listed in (a) to (e) above and hence no provision
is considered necessary against the same.
28. Directors’ Remuneration
The Company appointed Mr. Ashok Kumar Agarwal and Mr. Pradeep Kumar Rustagi as Whole Time Directors of the Company with
effect from February 14, 2011 with the approval of the shareholders. During the FY 2010-11, the Company had adequate profits and
both the directors were paid remuneration within the limits as prescribed in Schedule XIII to the Companies Act, 1956.
During the financial year 2011-12, due to changed market condition caused by over-supply, the Company had suffered losses which
were not determinable at the time of appointment. The remuneration paid/accrued to both the whole time directors was in excess
of the limit prescribed under schedule XIII of the Companies Act, 1956 by Rs. 25.19 lacs. Therefore the Company, with the approval
of shareholders in the Extra ordinary general meeting held on April 7, 2012, had made an application to the Central Government

66 ESTER INDUSTRIES LTD. 27th Annual Report 2012-13
seeking its approval for the payment of remuneration in case of losses. The said application has been approved by the Central
Government on July 17, 2012.
The remuneration paid to Mr. Ashok Kumar Agarwal and Mr. Pradeep Kumar Rustagi during the current financial year has been
accrued / paid in accordance with the approval given by the Central Government.
Further in respect of managerial remuneration of Rs. 15.50 lacs paid during earlier years and not sanctioned by the department of
company affairs, an interim stay has been granted by the Hon’ble High Court of Delhi on the writ petition filed by the Company.
29. Gratuity and other post employment benefits plan
Gratuity
The Company has a defined benefit gratuity plan. Gratuity is computed as 15 days salary, for every completed year of service or
part thereof in excess of 6 months and is payable on retirement/termination/resignation. The benefit vests on the employees after
completion of 5 years of service. The Gratuity liability has not been externally funded. Company makes provision of such gratuity
liability in the books of accounts on the basis of actuarial valuation as per the projected unit credit method.
The following tables summaries the components of net benefit expense recognized in the Statement of profit and loss and the
unfunded status and amounts recognized in the balance sheet for the Gratuity.
Statement of profit and loss
Net employee benefit expense recognised in employee cost
(Rs. In Lacs)
GratuityMarch 31, 2013 March 31, 2012
Current service cost 38.40 33.14 Interest cost on benefit obligation 32.82 33.70 Net actuarial loss recognised in the year 22.50 (31.93)Net benefit expense 93.72 34.91
Balance sheet
Details of provision for Gratuity
(Rs. In Lacs)
March 31, 2013 March 31, 2012Defined benefit obligation 469.60 410.24 Plan liability 469.60 410.24
Changes in the present value of the defined benefit obligation are as follows:
(Rs. In Lacs)
March 31, 2013 March 31, 2012Opening defined benefit obligation 410.24 396.44 Interest cost 32.82 33.70 Current service cost 38.40 33.14 Benefits paid (34.36) (21.12)Actuarial losses on obligation 22.50 (31.93)Closing defined benefit obligation 469.60 410.23
Since the entire amount of plan obligation is unfunded therefore changes in the fair value of plan assets, categories of plan assets as a
percentage of the fair value of total plan assets and Company’s expected contribution to the plan assets in the next year is not given.

27th Annual Report 2012-13 67ESTER INDUSTRIES LTD.
The principal assumptions used in determining gratuity benefit obligations for the Company’s plans are shown below:
March 31, 2013 March 31, 2012
% %
Discount rate 8.00 8.50
Increase in compensation cost 5.50 6.00
Employee turnover – Age Group
Up to 30 years 3 3
30 – 44 years 2 2
Above 44 years 1 1
The estimates of future salary increases, considered in actuarial valuation, take account of inflation, seniority, promotion and other
relevant factors, such as supply and demand in the employment market.
Amounts for the current and previous four years are as follows:
(Rs. In lacs)
Gratuity
March 31, 2013 March 31, 2012 March 31, 2011 March 31, 2010 March 31, 2009
Defined benefit obligation 469.60 410.24 396.44 333.16 306.32
Deficit 469.60 410.24 396.44 333.16 306.32
Experience adjustments on plan
liabilities Loss/(Gain)
20.86 (30.33) 29.30 (10.11) 25.24
Contribution to Defined Contribution Plans:
(Rs. In lacs)
March 31, 2013 March 31, 2012Superannuation fund 77.18 73.06Provident fund contribution to Government authority 84.68 75.93
Provident Fund
The company has set up provident fund trust which is managed by the company, and as per the guidance note on implementing AS-
15, employee benefits (revised 2005) issued by the accounting standard board (ASB), provident fund trust set up by employers, which
required interest shortfall to be met by employer, needs to be treated as defined benefit plan.
Changes in the present value of the projected benefit obligation are as follows:
(Rs. In lacs)
Projected Benefit Obligation March 31, 2013 March 31, 2012
Projected Benefit Obligation at Beginning of year 465.54 365.95
Current Service Cost 74.17 56.67
Interest Cost 39.57 31.11
Contributions by plan participants / employees 87.59 65.55
Actuarial (Gain) / Loss due to Interest guarantee 7.57 0.00
Benefits Paid (97.63) (170.38)
Past Service Cost -- --
Settlements / Transfer In 6.36 115.90
Projected Benefit Obligation at End of year 583.17 464.80
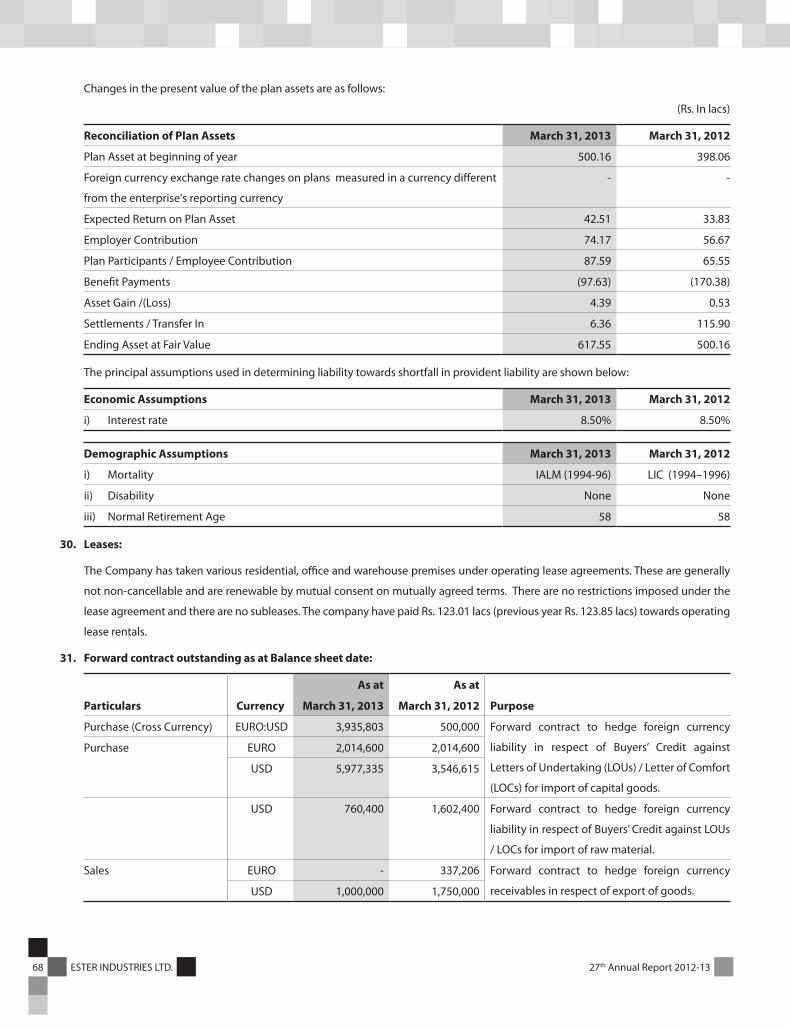
68 ESTER INDUSTRIES LTD. 27th Annual Report 2012-13
Changes in the present value of the plan assets are as follows:
(Rs. In lacs)
Reconciliation of Plan Assets March 31, 2013 March 31, 2012
Plan Asset at beginning of year 500.16 398.06
Foreign currency exchange rate changes on plans measured in a currency different
from the enterprise's reporting currency
- -
Expected Return on Plan Asset 42.51 33.83
Employer Contribution 74.17 56.67
Plan Participants / Employee Contribution 87.59 65.55
Benefit Payments (97.63) (170.38)
Asset Gain /(Loss) 4.39 0.53
Settlements / Transfer In 6.36 115.90
Ending Asset at Fair Value 617.55 500.16
The principal assumptions used in determining liability towards shortfall in provident liability are shown below:
Economic Assumptions March 31, 2013 March 31, 2012
i) Interest rate 8.50% 8.50%
Demographic Assumptions March 31, 2013 March 31, 2012
i) Mortality IALM (1994-96) LIC (1994–1996)
ii) Disability None None
iii) Normal Retirement Age 58 58
30. Leases:
The Company has taken various residential, office and warehouse premises under operating lease agreements. These are generally
not non-cancellable and are renewable by mutual consent on mutually agreed terms. There are no restrictions imposed under the
lease agreement and there are no subleases. The company have paid Rs. 123.01 lacs (previous year Rs. 123.85 lacs) towards operating
lease rentals.
31. Forward contract outstanding as at Balance sheet date:
As at As at
Particulars Currency March 31, 2013 March 31, 2012 Purpose
Purchase (Cross Currency) EURO:USD 3,935,803 500,000 Forward contract to hedge foreign currency
liability in respect of Buyers’ Credit against
Letters of Undertaking (LOUs) / Letter of Comfort
(LOCs) for import of capital goods.
Purchase EURO 2,014,600 2,014,600
USD 5,977,335 3,546,615
USD 760,400 1,602,400 Forward contract to hedge foreign currency
liability in respect of Buyers’ Credit against LOUs
/ LOCs for import of raw material.
Sales EURO - 337,206 Forward contract to hedge foreign currency
receivables in respect of export of goods. USD 1,000,000 1,750,000
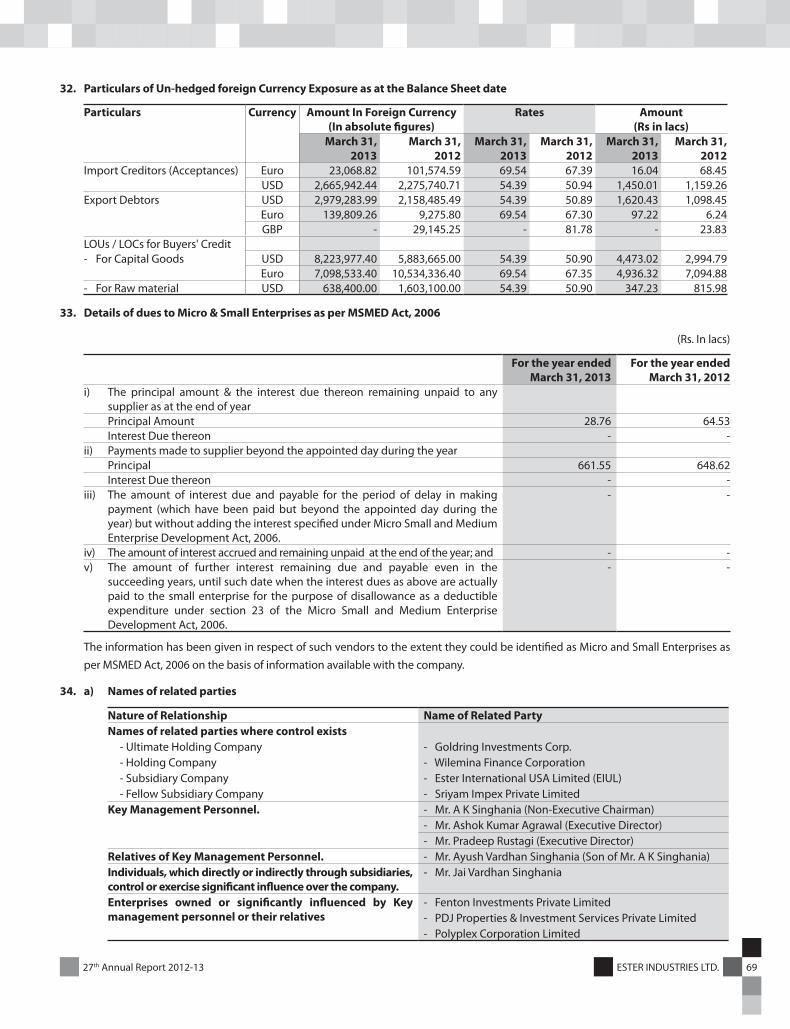
27th Annual Report 2012-13 69ESTER INDUSTRIES LTD.
32. Particulars of Un-hedged foreign Currency Exposure as at the Balance Sheet date
Particulars Currency Amount In Foreign Currency(In absolute figures)
Rates Amount (Rs in lacs)
March 31, 2013
March 31, 2012
March 31, 2013
March 31, 2012
March 31, 2013
March 31, 2012
Import Creditors (Acceptances) Euro 23,068.82 101,574.59 69.54 67.39 16.04 68.45 USD 2,665,942.44 2,275,740.71 54.39 50.94 1,450.01 1,159.26
Export Debtors USD 2,979,283.99 2,158,485.49 54.39 50.89 1,620.43 1,098.45 Euro 139,809.26 9,275.80 69.54 67.30 97.22 6.24 GBP - 29,145.25 - 81.78 - 23.83
LOUs / LOCs for Buyers' Credit- For Capital Goods USD 8,223,977.40 5,883,665.00 54.39 50.90 4,473.02 2,994.79
Euro 7,098,533.40 10,534,336.40 69.54 67.35 4,936.32 7,094.88 - For Raw material USD 638,400.00 1,603,100.00 54.39 50.90 347.23 815.98
33. Details of dues to Micro & Small Enterprises as per MSMED Act, 2006
(Rs. In lacs)
For the year endedMarch 31, 2013
For the year endedMarch 31, 2012
i) The principal amount & the interest due thereon remaining unpaid to any supplier as at the end of yearPrincipal Amount 28.76 64.53Interest Due thereon - -
ii) Payments made to supplier beyond the appointed day during the yearPrincipal 661.55 648.62Interest Due thereon - -
iii) The amount of interest due and payable for the period of delay in making payment (which have been paid but beyond the appointed day during the year) but without adding the interest specified under Micro Small and Medium Enterprise Development Act, 2006.
- -
iv) The amount of interest accrued and remaining unpaid at the end of the year; and - -v) The amount of further interest remaining due and payable even in the
succeeding years, until such date when the interest dues as above are actually paid to the small enterprise for the purpose of disallowance as a deductible expenditure under section 23 of the Micro Small and Medium Enterprise Development Act, 2006.
- -
The information has been given in respect of such vendors to the extent they could be identified as Micro and Small Enterprises as per MSMED Act, 2006 on the basis of information available with the company.
34. a) Names of related parties
Nature of Relationship Name of Related PartyNames of related parties where control exists
- Ultimate Holding Company - Goldring Investments Corp.- Holding Company - Wilemina Finance Corporation- Subsidiary Company - Ester International USA Limited (EIUL)- Fellow Subsidiary Company - Sriyam Impex Private Limited
Key Management Personnel. - Mr. A K Singhania (Non-Executive Chairman)- Mr. Ashok Kumar Agrawal (Executive Director)- Mr. Pradeep Rustagi (Executive Director)
Relatives of Key Management Personnel. - Mr. Ayush Vardhan Singhania (Son of Mr. A K Singhania)Individuals, which directly or indirectly through subsidiaries, control or exercise significant influence over the company.
- Mr. Jai Vardhan Singhania
Enterprises owned or significantly influenced by Key management personnel or their relatives
- Fenton Investments Private Limited- PDJ Properties & Investment Services Private Limited- Polyplex Corporation Limited

70 ESTER INDUSTRIES LTD. 27th Annual Report 2012-13
b) Related party transaction
(Rs. in lacs)
Nature of TransactionsHolding
Company Subsidiaries
Key Management
Personnel
Relative of Key
Management Personnel
Enterprises owned or significantly
influenced by key management
personnel or their relatives Total
Transactions during the year
Managerial Remuneration
Ashok K. Agrawal - 69.35 - - 69.35
- (65.98) - - (65.98)
Pradeep Rustagi - 68.30 - - 68.30
- (63.21) - - (63.21)
Rent Paid
Fenton Investment Pvt. Ltd. 20.22 20.22
(19.55) (19.55)
Salary Paid
Ayush Vardhan Singhania - - 21.08 - 21.08
- - (12.00) - (12.00)
Material Sold
Polyplex Corporation Limited - - - 10.00 10.00
- - - (0.32) (0.32)
Material Purchased
Polyplex Corporation Limited - - - 20.58 20.58
- - - (0.17) (0.17)
Balances Outstanding as at year end
Balance payable
Ester International USA Limited 60.00 - - - 60.00
(60.00) - - - (60.00)
Balance Recoverable
Ester International USA Limited 66.71 - - - 66.71
(63.70) - - - (63.70)
Security deposit
Fenton Investments Pvt.Ltd. - - - 4.50 4.50
- - - (4.50) (4.50)
Payable for purchase of goods
Polyplex Corporation Limited 1.43 1.43
- -
Receivable for sale of goods
Polyplex Corporation Limited - - - - -
- - - (0.32) (0.32)
Guarantees given against Loans Taken (jointly and severally) by the Company
- Wilemina Finance Corporation 31,959.19 31,959.19
(29,656.80) (29,656.80)
- A.K.Singhania 43.51 43.51
(150.77) (150.77)
- Previous year figures are given in brackets.
- No amount has been written off or provided for in respect of transactions with the related parties.

27th Annual Report 2012-13 71ESTER INDUSTRIES LTD.
35. Segment Reporting
The Company operates in two segments manufacturing and sale of polyester film and engineering plastics. The Company has chosen
business segments as its primary segments considering the dominant source of nature of risks and returns, internal organization and
management structure. A brief description of the reportable segment is as follows:
Polyester Film : Polyester Films that are used in primarily flexible packaging and other industrial application. Polyester Film is known
for high tensile strength, chemical and dimensional stability, transparency, reflective, gas and aroma barrier properties and electrical
insulation. PET Chips is the main raw material used to manufacture the film.
Engineering Plastics : Engineering Plastics are group of plastic materials that exhibit superior mechanical and thermal properties over
the more commonly used commodity plastics. Engineering Plastics are equipped with certain electrical properties which enable it to
be used in specific industries such as automotive, telecommunication, electrical, electronics and lighting, consumer durable etc.
A. Segment Disclosure
(Rs. In lacs)
Particulars Polyester Film Engineering Plastics TotalMarch 31,
2013March 31,
2012March 31,
2013March 31,
2012March 31,
2013March 31,
2012REVENUEExternal Sales 78,074.21 62,921.17 10,528.07 7,036.84 88,602.28 69,958.01 Inter Segment Sales - - - - - - Total Revenue 78,074.21 62,921.17 10,528.07 7,036.84 88,602.28 69,958.01 SEGMENT RESULT 4,551.59 4,083.32 566.95 348.97 5,118.54 4,432.29 Unallocated Corporate Expenses 3,544.37 3,557.74 Operating Profit 1,574.17 874.55 Finance Costs 2,646.81 3,549.48 Other Income 291.75 578.31 Profit Before Tax / (Loss) (780.89) (2,096.62)Income Taxes (253.90) (704.70)Net Profit / (Loss) (526.99) (1,391.92)OTHER INFORMATION Segment assets 47,141.86 46,548.95 5,884.43 4,176.86 53,026.29 50,725.81 Unallocated corporate assets 12,278.53 11,922.27 Total assets 65,304.82 62,648.08 Segment liabilities 5,255.38 5,415.54 1,248.38 1,137.00 6,503.76 6,552.54 Unallocated corporate liabilities 32,939.06 29,691.97 Total liabilities 39,442.82 36,244.51 Capital expenditure 972.75 2,848.54 10.63 15.97 983.38 2,864.51 Unallocated Capital expenditure 2,689.24 811.84 Total Capital expenditure 3,672.62 3,676.35 Depreciation/Amortisation 2,494.06 2,309.29 63.70 59.08 2,557.76 2,368.37 Unallocated Depreciation/Amortisation 300.76 285.17 Total Depreciation/Amortisation 2,858.52 2,653.54 Non-cash expenses other than depreciation and amortisation
- - - - - -
Unallocated Non-cash expenses other than depreciation and amortisation
- -
Total Non-cash expenses other than depreciation and amortisation
- -

72 ESTER INDUSTRIES LTD. 27th Annual Report 2012-13
B. INFORMATION ABOUT SECONDARY SEGMENTS
a) Revenue as per Geographical Markets
(Rs. In lacs)
March 31, 2013 March 31, 2012
India * 59,622.02 41,833.74
Outside India 28,980.26 28,124.27
Total 88,602.28 69,958.01
* Includes Deemed export with in India
b) Carrying amount of Segment Assets (Trade receivable) by geographical location of assets
(Rs. In lacs)
March 31, 2013 March 31, 2012
India 6,650.23 4,431.88
Outside India 4,251.94 3,988.77
Total 10,902.17 8,420.65
Rest of the current assets are common and not segregable geographical segment wise.
c) The Company has common fixed assets located in India, for producing goods for Domestic Market and Overseas Market.
Hence, separate figures for fixed assets / additions to fixed assets cannot be furnished.
36. Value of imports calculated on CIF basis
(Rs. in lacs)
March 31, 2013 March 31, 2012
Raw Materials 9,804.78 3,281.76
Stores & Spare Parts 715.68 769.73
Capital Goods 573.58 1,468.58
Total 11,094.04 5,520.07
37. Net dividend remitted in foreign exchange
March 31, 2013 March 31, 2012
Period to which it relates - April 1, 2010 to
March 31, 2011
Number of non-resident shareholders (in absolute no’s) - 4
Number of equity shares held on which dividend was due - 36,170,192
Amount remitted (USD) (in absolute no’s) - 1,593,576
Amount remitted in Rs in lacs - 723
38. Earning in foreign currency:
(Rs. in lacs)
March 31, 2013 March 31, 2012
FOB value of Export of Goods 27,674.39 27,195.93
Total 27,674.39 27,195.93
(FOB Value of Exports does not include Deemed Exports of Rs. 271.11 lacs (previous year Rs.132.81 lacs).

27th Annual Report 2012-13 73ESTER INDUSTRIES LTD.
39. Imported and indigenous raw material and spare parts consumed
March 31, 2013 March 31, 2012
Percentage Value Percentage Value
Raw Material
Imported 16.83 10,850.83 12.23 6,337.46
Indigenous 83.17 53,639.30 87.77 45,495.77
Total 100.00 64,490.13 100.00 51,833.23
Stores & spares
Imported 49.91 567.25 47.55 532.41
Indigenous 50.09 569.36 52.45 587.24
Total 100.00 1,136.61 100.00 1,119.65
40. Expenditure in foreign currency:
(Rs. in lacs)
For the year ended
March 31, 2013
For the year ended
March 31, 2012
Bank charges 56.74 68.25
Legal & professional 78.63 68.33
Expense on foreign technicians 36.76 28.48
Commission and brokerage 307.66 237.18
Traveling expenses 102.08 89.94
Discount, claims and rebates 30.02 77.15
Miscellaneous expenses 37.19 49.65
TOTAL 649.08 618.98
41. The Board of Directors in its meeting held on January 17, 2013 accorded the approval of Scheme of amalgamation of Sriyam Impex
Private Limited (“the Promoter group company”) with Ester Industries Limited (“the Company”) subject to regulatory and other
approvals. In this process the company have filed an application with stock exchange for obtaining “No Objection” and in principle
approval.
42. Previous year figure have been regrouped / reclassified whenever considered necessary, so as to confirm with the current year’s
classification.
As per our report of even date
For S.R. BATLIBOI & CO. LLP For and on behalf of the board of directors Chartered Accountants of Ester Industries Limited Firm Registration No. 301003E
per Manoj Gupta Ashok NewatiaPartner DirectorMembership no. 83906
Place : New Delhi Pradeep Rustagi Diwaker DineshDate : May 24, 2013 Executive Director & CFO Company Secretary

74 ESTER INDUSTRIES LTD. 27th Annual Report 2012-13
SUBSIDIARY DETAILS UNDER SECTION 212(3) OF THE COMPANIES ACT, 1956
A] Name of the Subsidiary Company : Ester International [USA] Ltd.
B] Financial Year of the Subsidiary Company ended on : 31st March 2013
C] Shares of the Subsidiary held by Ester Industries Limited, on the above date: :
a] Number and Face Value : 25,000 Equity
Shares of USD 1 each
b] Extent of holding : 100%
D] The net aggregate amount of Profit/[Losses] of the Subsidiary Company so far as
it concerns the members of Ester Industries Limited:
a] not dealt with in the accounts of Ester Industries Limited, for the year ended
31.03.2013 amounted to
i] for the subsidiary Financial Year ended on the respective date : US $ [2025]
equivalent to Rs. 1.10 Lac
ii] for the previous Financial years of the Subsidiary since it became the
Holding Company’s Subsidiary
: US $ [183,679.00]
equivalent to Rs. 90.42 Lac
b] dealt with in the accounts of Ester Industries Limited, for the year ended
31.03.2013 amounted to
i] for the Subsidiary’s Financial Year : NIL
ii] for the previous Financial Years of the Subsidiary since it became the
Holding Company’s Subsidiary
: NIL
E] Changes in the interest of Ester Industries Ltd. between the end of the Subsidiary
Financial Year and 31.03.2013
: NIL
F] Material Changes between the end of the Subsidiary’s Financial year and
31.03.2013
: NIL
1) Fixed Assets
2) Investments
3) Monies lent by the Subsidiary
4) Monies borrowed by the Subsidiary Company other than for meeting Current
Liabilities
For and on behalf of the board of directors of Ester Industries Limited
Ashok Newatia Director
Place : New Delhi Pradeep Rustagi Diwaker DineshDate : May 24, 2013 Executive Director & CFO Company Secretary

27th Annual Report 2012-13 75ESTER INDUSTRIES LTD.
AUDITOR’S REPORT TO THE BOARD OF DIRECTORS OF ESTER INDUSTRIES LIMITED ON THE CONSOLIDATED FINANCIAL STATEMENT OF ESTER INDUSTRIES LIMITED AND ITS SUBSIDIARIES
To The Board of Directors of Ester Industries Limited
1. We have audited the attached consolidated balance sheet
of Ester Industries Limited (the ‘Ester’ Group) as at March 31,
2013, and also the consolidated statement of profit and loss
and the consolidated cash flow statement for the year ended
on that date annexed thereto. These financial statements are
the responsibility of the Ester Group’s management and have
been prepared by the management on the basis of separate
financial statements and other financial information
regarding components. Our responsibility is to express an
opinion on these financial statements based on our audit.
2. We conducted our audit in accordance with the auditing
standards generally accepted in India. Those Standards
require that we plan and perform the audit to obtain
reasonable assurance about whether the financial
statements are free of material misstatement. An audit
includes examining, on a test basis, evidence supporting
the amounts and disclosures in the financial statements. An
audit also includes assessing the accounting principles used
and significant estimates made by management, as well as
evaluating the overall financial statement presentation. We
believe that our audit provides a reasonable basis for our
opinion.
3. We report that the consolidated financial statements
have been prepared by the Ester Group's management in
accordance with the requirements of Accounting Standards
(AS) 21, Consolidated financial statements, notified pursuant
to the Companies (Accounting Standards) Rules, 2006, (as
amended).
4. Based on our audit and on consideration of reports of other
auditors on separate financial statements and on the other
financial information of the components, and to the best of
our information and according to the explanations given
to us, we are of the opinion that the attached consolidated
financial statements give a true and fair view in conformity
with the accounting principles generally accepted in India:
(a) in the case of the consolidated balance sheet, of the
state of affairs of the Ester Group as at 31st March 2013;
(b) in the case of the consolidated statement of profit and
loss, of the loss of the Ester Group for the year ended on
that date; and
(c) in the case of the consolidated cash flow statement, of
the cash flows of the Ester Group for the year ended on
that date.
For S.R. BATLIBOI & CO. LLP
Chartered Accountants
Firm registration number: 301003E
per Manoj Gupta
Place : New Delhi Partner
Date : May 24, 2013 Membership Number: 83906
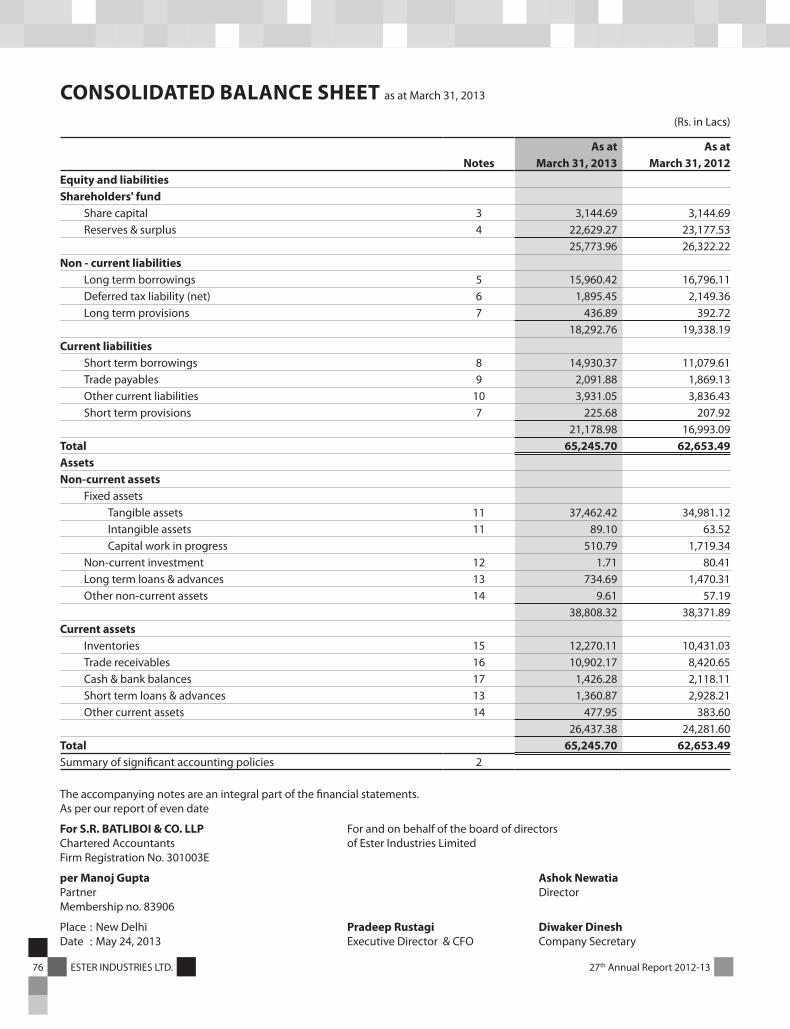
76 ESTER INDUSTRIES LTD. 27th Annual Report 2012-13
CONSOLIDATED BALANCE SHEET as at March 31, 2013
(Rs. in Lacs)
As at As at Notes March 31, 2013 March 31, 2012
Equity and liabilitiesShareholders' fund
Share capital 3 3,144.69 3,144.69 Reserves & surplus 4 22,629.27 23,177.53
25,773.96 26,322.22 Non - current liabilities
Long term borrowings 5 15,960.42 16,796.11 Deferred tax liability (net) 6 1,895.45 2,149.36 Long term provisions 7 436.89 392.72
18,292.76 19,338.19 Current liabilities
Short term borrowings 8 14,930.37 11,079.61 Trade payables 9 2,091.88 1,869.13 Other current liabilities 10 3,931.05 3,836.43 Short term provisions 7 225.68 207.92
21,178.98 16,993.09 Total 65,245.70 62,653.49 AssetsNon-current assets
Fixed assetsTangible assets 11 37,462.42 34,981.12 Intangible assets 11 89.10 63.52 Capital work in progress 510.79 1,719.34
Non-current investment 12 1.71 80.41 Long term loans & advances 13 734.69 1,470.31 Other non-current assets 14 9.61 57.19
38,808.32 38,371.89 Current assets
Inventories 15 12,270.11 10,431.03 Trade receivables 16 10,902.17 8,420.65 Cash & bank balances 17 1,426.28 2,118.11 Short term loans & advances 13 1,360.87 2,928.21 Other current assets 14 477.95 383.60
26,437.38 24,281.60 Total 65,245.70 62,653.49 Summary of significant accounting policies 2
The accompanying notes are an integral part of the financial statements. As per our report of even date
For S.R. BATLIBOI & CO. LLP For and on behalf of the board of directors Chartered Accountants of Ester Industries Limited Firm Registration No. 301003E
per Manoj Gupta Ashok NewatiaPartner DirectorMembership no. 83906
Place : New Delhi Pradeep Rustagi Diwaker DineshDate : May 24, 2013 Executive Director & CFO Company Secretary

27th Annual Report 2012-13 77ESTER INDUSTRIES LTD.
CONSOLIDATED STATEMENT OF PROFIT AND LOSS for the year ended March 31, 2013
(Rs. in Lacs)
Notes For the year ended For the year ended
March 31, 2013 March 31, 2012
Revenue from operations (gross) 18 95,863.14 74,207.07
Less: - Excise duty 7,260.86 4,249.06
Revenue from operations (net) 88,602.28 69,958.01
Other income 19 579.45 578.31
Total revenues (I) 89,181.73 70,536.32
Expenses
Cost of material consumed 20 64,490.13 51,833.23
(Increase) / decrease in inventories of finished goods & work in progress
21 427.58 (2,474.86)
Employee benefits expense 22 3,220.20 2,482.20
Other expenses 23 16,320.47 14,590.34
Total expenses (II) 84,458.38 66,430.91
Earnings before interest, tax, depreciation and amortization {EBITDA} (I)-(II)
4,723.35 4,105.41
Depreciation and amortisation expense 11 2,873.12 2,668.13
Less: Transferred from revaluation reserve 14.60 2,858.52 14.59 2,653.54
Finance costs 24 2,646.83 3,549.48
Profit / (loss) before tax (782.00) (2,097.61)
Tax expense
Current tax - -
Deferred tax (253.90) (704.70)
Total tax expenses (253.90) (704.70)
Profit / (loss) after tax (528.10) (1,392.91)
Earnings per share
Basic & diluted (in Rs.) 25 (0.84) (2.21)
{Nominal value per share Rs. 5 (previous year Rs. 5)}
Summary of significant accounting policies 2
The accompanying notes are an integral part of the financial statements. As per our report of even date
For S.R. BATLIBOI & CO. LLP For and on behalf of the board of directors Chartered Accountants of Ester Industries Limited Firm Registration No. 301003E
per Manoj Gupta Ashok NewatiaPartner DirectorMembership no. 83906
Place : New Delhi Pradeep Rustagi Diwaker DineshDate : May 24, 2013 Executive Director & CFO Company Secretary

78 ESTER INDUSTRIES LTD. 27th Annual Report 2012-13
CONSOLIDATED CASH FLOW STATEMENT for the year ended March 31, 2013
(Rs. in Lacs)
For the year ended For the year endedMarch 31, 2013 March 31, 2012
Cash flow from operating activitiesNet profit / (loss) before tax (782.00) (2,097.61)Adjustments for:
Depreciation/Amortisation 2,858.52 2,653.54 Loss on Fixed Assets Sold/Discarded (net) 83.69 15.31 Interest Expense 1,998.00 1,982.23 Interest income (120.60) (110.31)Dividend income (0.03) (0.72)Premium on forward contracts amortised 267.21 140.72 Unrealized foreign exchange loss (net) 54.27 1,310.58 Bad debts, advances and irrecoverable balances written off (net) 89.83 0.20 Provision for Obsolete Inventories 4.03 - Loss on sale of Investment 8.32 - Provisions / liabilities no longer required written back (19.86) (42.48)
Operating Profit before Working Capital Changes 4,441.38 3,851.45 Movements in working capital :
Decrease / (Increase) in trade receivables (2,447.81) 3,682.65 Decrease / (Increase) loans and advances/other current assets 2,110.11 (615.95)Decrease / (Increase) in Inventories (1,843.11) (2,993.49)Increase/ (Decrease) in Trade & Other Payables/ Provisions 8.43 1,132.90
Cash Generated from Operations 2,269.00 5,057.56 Direct Taxes Paid - (310.77)
Net cash flow from operating activities (a) 2,269.00 4,746.79 CASH FLOW FROM INVESTING ACTIVITIES
Purchase of Fixed Assets (3,672.62) (3,676.35)Sale of Fixed Assets 28.65 64.11 Deposits (238.18) (1,099.92)Proceeds of deposits matured 940.38 1,077.82 Sale of investment 70.38 10.00 Interest Received 133.28 81.25 Dividend Received 0.03 0.72
Net cash flow from /(used) in investing activities (b) (2,738.08) (3,542.37)CASH FLOW FROM FINANCING ACTIVITIES
Net proceeds from short term borrowings 3,834.91 1,219.57 Proceeds from long term borrowings 1,279.94 2,328.40 Repayment of long term borrowings (2,630.57) (974.56)Interest Paid (2,041.20) (1,991.27)Dividend Paid (5.65) (1,447.11)
Net cash flow from /(used) in financing activities ( c) 437.43 (864.97)Net increase/(decrease) in cash and cash equivalents (a+b+c) (31.65) 339.44 Cash and cash equivalents at the beginning of the year 1,022.85 693.59 Foreign Currency Translation difference (5.56) (10.18)Cash and cash equivalents at the end of the year 985.64 1,022.85 Components of cash and cash equivalents
Cash on Hand 6.08 12.71 Balances with Scheduled Banks :- On current Accounts 915.22 939.67 - On Term Deposits 450.25 1,152.44 - On Unpaid Dividend Accounts* 63.58 69.23 Balances with other bank:- On current Accounts 0.76 1.24
Cash & Bank Balances 1,435.89 2,175.30 Less: Fixed deposits not considered as cash and cash equivalents- Deposit Pledged with banks 37.00 106.44 - Deposit having maturity period more than 3 months 413.25 1,046.01
985.64 1,022.85
* These balances are not available for use by the Company as they represent corresponding unpaid dividend liabilities
As per our report of even date
For S.R. BATLIBOI & CO. LLP For and on behalf of the board of directors Chartered Accountants of Ester Industries Limited Firm Registration No. 301003E
per Manoj Gupta Ashok NewatiaPartner DirectorMembership no. 83906
Place : New Delhi Pradeep Rustagi Diwaker DineshDate : May 24, 2013 Executive Director & CFO Company Secretary

27th Annual Report 2012-13 79ESTER INDUSTRIES LTD.
NOTES TO CONSOLIDATED FINANCIAL STATEMENT for the year ended March 31, 2013
1. Principles of consolidation
a) The consolidated financial statement relate to Ester Industries Limited and its wholly owned subsidiary companies. The
consolidated financial statements have been prepared on the following basis:
The financial statement of the parent company and its subsidiaries have been combined on a line by line basis by adding together
the book value of like items of assets, liabilities, Income and expenses. Intra group balances and intra group transaction and
resulting unrealized profits are eliminated in full as per Accounting Standard – 21, consolidated Financial statement notified
under companies accounting standard rules, 2006 (as amended). Unrealized losses resulting from intra group transaction are
also eliminated unless cost cannot be recovered.
The financial statement of the subsidiary companies used in the consolidation is drawn for the same period as that of the
parent company i.e. March 31, 2013.
b) Details of subsidiary company which is considered in the consolidation and the parent company’s holding therein are as under:
Sl. No. Name of the subsidiary company Country of incorporation Extent of holding (%) As on March 31, 2013
1. Ester International (USA) Limited USA 100%
The consolidated financial have been prepared using uniform accounting policies for like transaction and other events in
similar circumstances and are presented in the same manner as the parent company’s separate financial statement.
2. Statement of significant accounting policies
a) Basis of preparation
The financial statements of the company have been prepared in accordance with generally accepted accounting principles
in India (Indian GAAP). The company has prepared these financial statements to comply in all material respects with the
accounting standards notified under the Companies (Accounting Standards) Rules, 2006,(as amended) and the relevant
provisions of the Companies Act,1956. The financial statements have been prepared under the historical cost convention on an
accrual basis except in case of assets for which revaluation is carried out. The accounting policies adopted in the preparation of
financial statements are consistent with those of previous year, except for the change in accounting policy explained below.
b) Change in accounting policy
Pursuant to clarification issued by Ministry of Corporate Affairs, Government of India dated August 9, 2012, the Company
has changed the accounting policy in respect of foreign exchange fluctuation as prescribed under para 4(e) of Accounting
Standard 16 "Borrowing Costs". Accordingly, foreign exchange fluctuations amounting to Rs. 614.88 lacs has been capitalised
and added to the cost of fixed assets. Hitherto followed, loss of the Company would have been higher by Rs. 587.77 lacs (net of
tax of Rs. Nil) and net block of fixed assets would have been lower by Rs. 587.36 lacs (net of depreciation of Rs. 27.52 lacs).
c) Use of estimates
The preparation of financial statements in conformity with Indian GAAP requires the management to make judgments,
estimates and assumptions that affect the reported amounts of revenues, expenses, assets and liabilities and the disclosure
of contingent liabilities, at the end of the reporting period. Although these estimates are based on the management's best
knowledge of current events and actions, uncertainty about these assumptions and estimates could result in the outcomes
requiring a material adjustment to the carrying amounts of assets or liabilities in future periods.
d) Tangible fixed Assets
Tangible fixed assets are stated at cost, less accumulated depreciation and impairment losses, if any, except Land, Building

80 ESTER INDUSTRIES LTD. 27th Annual Report 2012-13
and Plant & Machinery, which had been revalued on 31.10.1992 by a Government registered valuer on the basis of the then
replacement value. The cost comprises purchase price, borrowing costs if capitalization criteria are met and directly attributable
cost of bringing the asset to its working condition for the intended use. Any trade discounts and rebates are deducted in
arriving at the purchase price.
Expenditure directly relating to construction activity is capitalized (net of income, if any). Indirect expenditure specifically
attributable to construction of a project or to the acquisition of the fixed assets or bringing it to working condition is capitalised
as part of Construction project or as a part of Fixed assets. Other indirect expenditure incurred during the construction period
which is not related to construction activity nor is incidental thereto is charged to Statement of profit and loss.
Gains or losses arising from derecognition of fixed assets are measured as the difference between the net disposal proceeds
and the carrying amount of the asset and are recognized in the Statement of profit and loss when the asset is derecognized.
Subsequent expenditure related to an item of fixed asset is added to its book value only if it increases the future benefits
from the existing asset beyond its previously assessed standard of performance. All other expenses on existing fixed assets,
including day-to-day repair and maintenance expenditure and cost of replacing parts, are changed to the Statement of profit
and loss for the period during which such expenses are incurred.
e) Depreciation
i. Depreciation on fixed assets (other than lease hold improvements) is provided using Straight Line Method as per rates
prescribed under Schedule XIV of the Companies Act, 1956. The management of the Company is of the view that this
depreciation rate fairly represents the useful life of the assets except for the following assets where a higher rate is used:
Rates (SLM) Schedule XIV Rates (SLM)
Batteries under UPS project (Plant and Machinery) 19.60% 5.28%
ii. Fixed assets costing below Rs.5000 are depreciated at the rate of 100%.
iii. Depreciation on the revalued portion of fixed assets is adjusted against the revaluation reserve.
iv. Depreciation on the amount of additions made to fixed assets due to up gradations / improvements is provided over the
remaining useful life of the asset to which it relates.
v. Depreciation on fixed assets added/disposed off during the year is provided on pro-rata basis.
vi. Lease hold improvements are amortised over a primary period of lease i.e 9 years or useful life, whichever is lower.
f) Intangibles
Software costs relating to acquisition of initial software license fee and installation costs are capitalized in the year of purchase.
Software’s are amortized on a straight-line basis over its useful life, which is considered to be of a period of three years.
g) Impairment of assets
i) The carrying amounts of assets are reviewed at each balance sheet date if there is any indication of impairment based
on internal/external factors. An impairment loss is recognized wherever the carrying amount of an asset exceeds its
recoverable amount. The recoverable amount is the greater of the asset’s net selling price and value in use. In assessing
value in use, the estimated future cash flows are discounted to their present value a pre-tax discount rate that reflects
current market assessment of the time value of money and risks specific to asset.
ii) After impairment, depreciation is provided on the revised carrying amount of the asset over the remaining useful life.
h) Leases
27th Annual Report 2012-13 81ESTER INDUSTRIES LTD.
Where the Company is the lessee
Leases where the lessor effectively retains substantially all the risks and benefits of ownership of the leased item are classified
as operating leases. Operating lease payments are recognized as an expense in the Statement of profit and loss on a straight-
line basis over the lease term.
i) Investment
Investments that are readily realizable and intended to be held for not more than a year are classified as current investments.
All other investments are classified as long-term investments. Current investments are carried at lower of cost and fair value
determined on an individual investment basis. Long-term investments are carried at cost. However, provision for diminution in
value is made to recognize a decline other than temporary in the value of such investments.
j) Inventories
Inventories are valued as follows:
Raw materials, Components and stores & spares
Lower of cost and net realizable value. However, materials and other items held for use in the production of inventories are not
written down below cost if the finished products, in which they will be incorporated, are expected to be sold at or above cost.
Cost of raw materials, components and stores & spares is determined on a moving weighted average basis.
Work-in-progress and finished goods
Lower of cost and net realizable value. Cost includes direct materials and labour and a proportion of manufacturing overheads
based on normal operating capacity. Cost of finished goods includes excise duty. Cost is determined on moving weighted
average basis.
Net realizable value is the estimated selling price in the ordinary course of business, less estimated costs of completion and
estimated costs necessary to make the sale.
k) Revenue recognition
Revenue is recognized to the extent that it is probable that the economic benefits will flow to the Company and the revenue
can be reliably measured.
Sale of Goods
Revenue from sale of goods is recognized when all the significant risks and rewards of ownership of the goods have been
passed to the buyer. The company collects sales taxes and value added taxes (VAT) on behalf of the government and, therefore,
these are not economic benefits flowing to the company. Hence, they are excluded from revenue. Excise duty deducted from
revenue (gross) is the amount that is included in the revenue (gross) and not the entire amount of liability arising during the
year.
Export Benefit
Export Benefits constituting import duty benefits under Duty Exemption Pass Book (DEPB), Duty Draw back and advance
license scheme are accounted for on accrual basis. Export benefits under Duty Exemption Pass Book (DEPB) & Duty Draw back
are considered as other operating income.
Interest
Revenue is recognised on a time proportion basis taking into account the amount outstanding and the rate applicable.
Dividends

82 ESTER INDUSTRIES LTD. 27th Annual Report 2012-13
Dividend income is recognized when the company's right to receive dividend is established by the reporting date.
Policy for Insurance Claims
Claims receivable on account of insurance are accounted for to the extent the Company is reasonably certain of their ultimate
collection.
l) Foreign currency transactions
Initial Recognition
Foreign currency transactions are recorded in the reporting currency, by applying to the foreign currency amount the exchange
rate between the reporting currency and the foreign currency at the date of the transaction.
Conversion
Foreign currency monetary items are reported using the closing rate. Non-monetary items which are carried in terms of
historical cost denominated in a foreign currency are reported using the exchange rate at the date of the transaction; and non-
monetary items which are carried at fair value or other similar valuation denominated in a foreign currency are reported using
the exchange rates that existed when the values were determined.
Exchange Differences
i) Exchange differences arising on long-term foreign currency monetary items related to acquisition of a fixed asset are
capitalized and depreciated over the remaining useful life of the asset. For this purpose, the Company treats a foreign
currency monetary item as “long-term foreign currency monetary item”, if it has a term of 12 months or more at the date
of its origination. In accordance with MCA circular dated 09 August 2012, exchange differences for this purpose, are total
differences arising on long-term foreign currency monetary items for the year.
ii) All other exchange differences are recognized as income or as expenses in the period in which they arise.
Forward Exchange Contracts not intended for trading or speculation purposes
The premium or discount arising at the inception of forward exchange contracts is amortised as expense or income over the life
of the contract. Exchange differences on such contracts are recognised in the Statement of profit and loss in the year in which
the exchange rates change. Any profit or loss arising on cancellation or renewal of forward exchange contract is recognised as
income or as expense for the year.
m) Retirement and other employee benefits
i. Retirement benefits in the form of Superannuation Fund (being funded to LIC), Provident Fund (where contributed to the
Regional Provident Fund Commissioner) and employee state insurance are defined contribution schemes. The Company
has no obligation, other than the contribution payable to the respective authorities. The Company recognizes contribution
payable to respective authorities as an expenditure, when an employee renders the related service. If the contribution
payable to the scheme for service received before the balance sheet date exceeds the contribution already paid, the
deficit payable to the scheme is recognized as a liability after deducting the contribution already paid. If the contribution
already paid exceeds the contribution due for services received before the balance sheet date, then excess is recognized
as an asset to the extent that the pre payment will lead to, for example, a reduction in future payment or a cash refund.
ii. Gratuity liability is defined benefit obligation and is provided for on the basis of an actuarial valuation on projected unit
credit method made at the end of each financial year.
iii. Retirement benefit in the form of provident Fund (Where administered by trust created and managed by Company) is a
defined benefit obligation of the company and the contributions are charged to Statement of profit & loss of the year

27th Annual Report 2012-13 83ESTER INDUSTRIES LTD.
when the contribution to the respective funds are due. Shortfall in the funds, if any, is adequately provided for by the
company based on the actuarial valuation on projected unit credit method carried out at the end of each financial year.
iv. Short term compensated absences are provided for based on estimates. Long term compensated absences are provided
for based on actuarial valuation. The actuarial valuation is done as per projected unit credit method. The Company
presents the leave as a current liability in the balance sheet, to the extent it does not have an unconditional right to defer
its settlement for 12 months after the reporting date.
v. Actuarial gains/losses are immediately taken to Statement of profit and loss and are not deferred.
n) Income Taxes
Tax expense comprises of current and deferred tax. Current income tax is measured at the amount expected to be paid to the
tax authorities in accordance with the Income Tax Act, 1961. Deferred income taxes reflects the impact of current year timing
differences between taxable income and accounting income for the year and reversal of timing differences of earlier years.
Deferred tax is measured based on the tax rates and the tax laws enacted or substantively enacted at the balance sheet date.
Deferred tax assets are recognised only to the extent that there is reasonable certainty that sufficient future taxable income
will be available against which such deferred tax assets can be realised. If the company has unabsorbed depreciation and carry
forward of tax losses, all deferred tax assets are recognised only if there is virtual certainty supported by convincing evidence
that such deferred tax assets can be realised against future taxable profits.
At each balance sheet date the Company re-assesses unrecognized deferred tax assets. It recognises unrecognized deferred
tax assets to the extent that it has become reasonably certain or virtually certain, as the case may be that sufficient future
taxable income will be available against which such deferred tax assets can be realised.
The carrying amount of deferred tax assets are reviewed at each balance sheet date. The Company writes-down the carrying
amount of a deferred tax asset to the extent that it is no longer reasonably certain or virtually certain, as the case may be, that
sufficient future taxable income will be available against which deferred tax asset can be realised. Any such write-down is
reversed to the extent that it becomes reasonably certain or virtually certain, as the case may be, that sufficient future taxable
income will be available.
MAT credit is recognised as an asset only when and to the extent there is convincing evidence that the company will pay
normal income tax during the specified period. In the year in which the Minimum Alternative tax (MAT) credit becomes eligible
to be recognized as an asset in accordance with the recommendations contained in guidance note issued by the Institute of
Chartered Accountants of India, the said asset is created by way of a credit to the Statement of profit and loss and shown as MAT
Credit Entitlement. The Company reviews the same at each balance sheet date and writes down the carrying amount of MAT
Credit Entitlement to the extent there is no longer convincing evidence to the effect that Company will pay normal Income Tax
during the specified period.
o) Borrowing Costs
Borrowing cost includes interest, amortization of ancillary costs incurred in connection with the arrangement of borrowings.
Borrowing costs directly attributable to the acquisition, construction or production of an asset that necessarily takes a
substantial period of time to get ready for its intended use or sale are capitalized as part of the cost of the respective asset. All
other borrowing costs are expensed in the period they occur.
p) Provisions
A provision is recognised when an enterprise has a present obligation as a result of past event and it is probable that an outflow
of resources will be required to settle the obligation, in respect of which a reliable estimate can be made. Provisions are not

84 ESTER INDUSTRIES LTD. 27th Annual Report 2012-13
discounted to its present value and are determined based on best management estimate required to settle the obligation
at the balance sheet date. These are reviewed at each balance sheet date and adjusted to reflect the current management
estimates. Provision for expenditure relating to voluntary retirement is made when the employee accepts the offer of early
retirement.
q) Segment Reporting Policies
Identification of segments:
Primary Segment
Business Segment
The Company’s operating businesses are organized and managed separately according to the nature of products, with each
segment representing a strategic business unit that offers different products and serves different markets. The identified
segments are Manufacturing & Sale of Polyester film and Engineering plastics.
Secondary Segment
Geographical Segment
The analysis of geographical segments is based on the geographical location of the customers.
The geographical segments considered for disclosure are as follows:
• SaleswithinIndiaincludesalestocustomerslocatedwithinIndia.
• SalesoutsideIndiaincludesalestocustomerslocatedoutsideIndia.
Inter Segment Transfers:
Inter Segment transfers of goods, as marketable products produced by separate segments of the Company for captive
consumption, are not accounted for in the books of account of the Company. For the purpose of segment disclosures, however,
inter segment transfers have been taken at cost.
Allocation of common costs:
Common allocable costs are allocated to each segment in proportion to the turnover of the segment, except where a more
logical allocation is possible.
Unallocated items:
Corporate income and expense are considered as a part of un-allocable income & expense, which are not identifiable to any
business segment.
The company prepares its segment information in conformity with the accounting policies adopted for preparing and
presenting the financial statements of the company as a whole.
r) Cash and Cash Equivalents
Cash and cash equivalents in the balance sheet comprise cash at bank and in hand and short-term investments with an original
maturity of three months or less.
s) Contingent liabilities
A contingent liability is a possible obligation that arises from past events whose existence will be confirmed by the occurrence
or non-occurrence of one or more uncertain future events beyond the control of the company or a present obligation that is
not recognized because it is not probable that an outflow of resources will be required to settle the obligation. A contingent

27th Annual Report 2012-13 85ESTER INDUSTRIES LTD.
liability also arises in extremely rare cases where there is a liability that cannot be recognized because it cannot be measured
reliably. The company does not recognize a contingent liability but discloses its existence in the financial statements.
t) Earnings Per Share
Basic earnings per share are calculated by dividing the net profit or loss for the year attributable to equity shareholders (after
deducting preference dividends and attributable taxes) by the weighted average number of equity shares outstanding during
the period. Partly paid equity shares are treated as a fraction of an equity share to the extent that they were entitled to
participate in dividends relative to a fully paid equity share during the reporting period. The weighted average numbers of
equity shares outstanding during the period are adjusted for events of bonus issue; bonus element in a rights issue to existing
shareholders; share split; and reverse share split (consolidation of shares).
For the purpose of calculating diluted earnings per share, the net profit or loss for the year attributable to equity shareholders
and the weighted average number of shares outstanding during the period are adjusted for the effects of all dilutive potential
equity shares.
u) Measurement of EBITDA
As permitted by the guidance note on revised schedule VI to the Companies Act, 1956, the company has elected to present
earnings before interest expense, tax, depreciation and amortization (EBITDA) as a separate line item on the face of the
statement of profit & loss. The company measures EBITDA on the basis of profit / (loss) from continuing operations. In its
measurement, the company includes interest income but does not include depreciation and amortization expenses, finance
cost and tax expenses.
3. Share capital
(Rs. In lacs)
As at As at
March 31, 2013 March 31, 2012
Authorized shares (No.)
150,000,000 (previous year: 150,000,000) equity shares of Rs. 5/- each 7,500.00 7,500.00
600,000 (previous year: 600,000) cumulative convertible preference shares
of Rs. 50/- each
300.00 300.00
8,000,000 (previous year: 8,000,000) redeemable cumulative preference shares
of Rs. 50/- each
4,000.00 4,000.00
Issued, subscribed & fully paid up shares (No.)
62,893,706 (previous year: 62,893,706) equity shares of Rs. 5/- each fully paid 3,144.69 3,144.69
a) Terms / rights attached to equity shares
The Company has only one class of equity share having a par value of Rs. 5 per share. Each equity shareholder is entitled for one
vote per share. The Company declares and pays dividend in Indian rupees.
During the year ended March 31, 2013, the amount of dividend recognized as distribution to equity shareholders was Rs. nil per
share (previous year : Rs. nil).

86 ESTER INDUSTRIES LTD. 27th Annual Report 2012-13
In the event of liquidation of the Company, the holders of equity shares will be entitled to receive remaining assets of the
Company, after distribution of all preferential amounts. This distribution will be in proportion to the number of equity shares
held by the shareholder.
b) Shares held by holding/ultimate holding company and/or their subsidiaries / their associates
As at As at
March 31, 2013 March 31, 2012
Goldring Investments Corp, ultimate holding company
NIL (previous year 2,608,696) equity shares of Rs. 5 each fully paid
- 130.43
Wilemina Finance Corp., holding company
35,120,192 (previous year 33,561,496) equity shares of Rs. 5 each fully paid
1,756.01 1,678.07
Sriyam Impex Private Limited (subsidiary of holding)
10,222,650 (previous year 9,172,650) equity shares of Rs. 5 each fully paid
511.13 458.63
c) Aggregate number of equity shares issued for consideration other than cash during the period of five years immediately
preceding the reporting date:
(Rs. In lacs)
As at As at
March 31, 2013 March 31, 2012
7,391,306 equity shares allotted as fully paid-up pursuant to conversion of
warrants and fully convertabile debentures during the year 2009-10.
369.57 369.57
d) Details of shareholders holding more than 5% shares in the Company
As at As at
March 31, 2013
(%)
March 31, 2012
(%)
Wilemina Finance Corp., holding company
35,120,192 (previous year 33,561,496) equity shares of Rs. 5 each fully paid
55.84 53.36
Sriyam Impex Private Limited (subsidiary of holding)
10,222,650 (previous year 9,172,650) equity shares of Rs. 5 each fully paid
16.25 14.58
As per records of the company, including its register of shareholders/members and other declarations received from
shareholders regarding beneficial interest, the above shareholding represents both legal and beneficial ownerships of shares.

27th Annual Report 2012-13 87ESTER INDUSTRIES LTD.
4. Reserves & surplus
(Rs. In lacs)
As at As at
March 31, 2013 March 31, 2012
Capital reserve 5,778.57 5,778.57
Capital redemption reserve 335.37 335.37
Securities premium account 2,718.77 2,718.77
Revaluation reserve
Balance as per last financial statement 548.63 563.22
Less: transferred to statement of profit and loss account 14.60 14.59
534.03 548.63
General reserve
Balance as per last account 1,503.67 1,503.67
Add: transferred from statement of profit and loss account - -
1,503.67 1,503.67
Foreign Exchange Translation reserve
Balance as per last account (2.14) 8.04
Add: Addition during the year - -
Less: Reduction during the year 5.56 10.18
(7.70) (2.14)
Surplus / (Deficit) in the statement of profit and loss
Balance as per the last financial statement 12,294.66 13,687.57
Add: profit / (loss) for the year (528.10) (1,392.91)
Net surplus in the statement of profit & loss 11,766.56 12,294.66
Total reserve & surplus 22,629.27 23,177.53
5. Long-term borrowings
(Rs. In lacs)
Non-Current Portion Current maturities
As at As at As at As at
March 31, 2013 March 31, 2012 March 31, 2013 March 31, 2012
Secured
Term loans from banks 1,658.51 3,050.46 2,467.34 2,301.88
Term loans from body corporate - 43.51 43.51 107.26
Vehicle loans 98.45 113.67 78.34 80.00
Buyers' credit for capital goods 14,203.46 13,588.47 - -
15,960.42 16,796.11 2,589.19 2,489.14
Amount Disclosed under the head "other
current liabilities" (Refer note 10)
(2,589.19) (2,489.14)
Total Long-term borrowings 15,960.42 16,796.11 - -

88 ESTER INDUSTRIES LTD. 27th Annual Report 2012-13
I. Term loans
a) From Bank of Baroda of Rs. 1712.00 lacs (Previous year Rs. 862.39 lacs) for Corporate Office project is secured by mortgage
created by way of deposit of title deeds in respect of the immoveable property (land and building) at Gurgaon. The term
loan bears floating interest at the rate base rate plus 4.25% pa. As per sanction, the term loans are repayable in 71 monthly
installments starting from 1st April 2012. The outstanding amount as on 31st March 2013 is repayable in 59 monthly installments
starting from 1st April 2013.
b) From State bank of Bikaner and Jaipur of Rs. 160.82 lacs (Previous year Rs. 211.50 lacs) is secured by first exclusive charge by
way of hypothecation of Oil Fired Heater, Reclaim Co-extruder and In-Line Coater and further secured by irrevocable guarantee
of Wilemina Finance Corp. (Holding company). The term loan bears floating interest at the base rate plus 3.25% pa. The Term
Loans are repayable in 20 quarterly installments starting from Dec’ 2011. The outstanding amount as on 31st March 2013 is
repayable in 14 quarterly installments starting from 1st April 2013.
c) From consortium member banks of Rs. 2253.03 lacs (Previous Year Rs.4278.45 lacs) are secured by first mortgage created by
way of deposit of title deeds in respect of the immovable properties at Khatima, both present & future and first charge by way
of hypothecation of Company’s all movable assets (save and except inventories, book debts, vehicles acquired through vehicles
loans and machinery acquired through term loan taken from banks / body corporate on exclusive charge basis), ranking pari
passu inter-se and further secured by irrevocable guarantee of Wilemina Finance Corp. (Holding company). The term loans bear
floating interest rate ranging from Base Rate plus 2.75% - 4.25% pa. These term loans are repayable in 28 quarterly installments
starting from 1st April 2012. The outstanding amount as on 31st March 2013 is repayable in 24 quartery installments starting
from 1st April 2013.
Term Loans from banks are further secured by second charge by way of hypothecation of stocks of raw material, finished goods,
semi finished goods, stores and spares, book debts and other receivables (both present and future).
d) From Body Corporate (Tata Capital Limited) is secured by first exclusive charge by way of hypothecation of Off Line Coater
and further secured by irrevocable guarantee of Mr. Arvind Kumar Singhania (Chairman of the Company) and Wilemina
Finance Corp. (Holding company). The term loan from body corporate bears floating interest at the rate 16.50% pa. These
term loan is repayable in 36 monthly installments starting from Feb’ 2011. The outstanding amount as on 31st March 2013 is
repayable in 10 monthly installments starting from 1st April 2013.
II. Vehicle loans are secured by hypothecation of specific vehicles acquired out of proceeds of the Loans. Vehicle loans bears interest
rates ranging from 9.65 to 11.00% pa. These loans are repayable in monthly installments till July’2016.
III. Buyers’ Credit for capital goods
a) Buyers’ credit amounting to Rs. 12,092.33 lacs (Previous Year Rs. 11,585.76 lacs) are against Letters of Undertaking (LOUs) /
Letter of Comfort (LOCs) issued by consortium of banks. LOUs / LOCs facility is secured by first mortgage created by way of
deposit of title deeds in respect of the immovable properties situated at Khatima, both present & future and first charge by way
of hypothecation of all movable assets (save and except inventories, book debts, vehicles acquired through vehicles loans and
machinery acquired through term loans taken from body corporate on exclusive charge basis), ranking pari passu inter-se and
further secured by irrevocable guarantee of Wilemina Finance Corp. (Holding company).
b) Buyers’ Credit amounting to Rs. 1,082.36 lacs (Previous Year Rs. 1,012.91 lacs) are against LOUs / LOCs issued by Union Bank
of India (UBI). LOUs / LOCs facility from UBI is secured by first exclusive charge by way of hypothecation of Metallizer (Topmet
2850) and further secured by irrevocable guarantee of Wilemina Finance Corp. (Holding company).
c) Buyers’ Credit amounting to Rs. 1,028.76 lacs (Previous Year Rs. 989.80 lacs) are against LOUs / LOCs issued by State bank of

27th Annual Report 2012-13 89ESTER INDUSTRIES LTD.
Bikaner & Jaipur (SBBJ). LOUs / LOCs facility from SBBJ is secured by first exclusive charge by way of hypothecation of Oil
Fired Heater, Reclaim Co-extruder and In-Line Coater, and further secured by irrevocable guarantee of Wilemina Finance Corp.
(Holding company).
Company has availed LOUs / LOCs facilities from the banks to avail the Buyers’ Credit of Rs. 14,203.46 lacs (Previous Year - Rs.
13,588.47 Lacs). LOU / LOC facilities to the extent of Rs.13,121.10 Lacs (previous Year- Rs 12,575.56 lacs) is sanctioned to the
company as a sub limit of term loans upto a period of 3 years till September 2014.
LOCs / LOUs facilities are sanctioned to the company as a sub limit of term loan, bears interest rate ranging from 0.92% to 1.95%
Liability towards Buyers’ Credit under LOCs / LOUs will be liquidated out of the proceeds of term loans that are repayable over
a period of seven years.
6. Deferred tax liability
(Rs. In lacs)
As at As at
March 31, 2013 March 31, 2012
Deferred tax liabilities
Fixed assets: Impact of difference between tax depreciation and depreciation/
amortization charged for the financial reporting
4,237.16 3,655.39
Gross deferred tax liability 4,237.16 3,655.39
Deferred tax assets
Provision for doubtful debts and advances - -
Effect of expenditure debited to profit and loss account in the current year but
allowed for tax purposes in following years
2,341.71 1,506.03
Gross deferred tax assets 2,341.71 1,506.03
Net deferred tax liability / (asset) 1,895.45 2,149.36
7. Provisions
(Rs. In lacs)
As at As at
March 31, 2013 March 31, 2012
Long term provisions
Provision for gratuity (refer note 29) 436.89 392.72
Total long term provision 436.89 392.72
Short term provisions
Provision for taxation (net of advance tax payments) 74.96 74.96
Provision for wealth tax 1.92 7.07
Provision for gratuity (refer note 29) 32.71 17.52
Provision for leave benefits 116.09 108.37
Total short term provision 225.68 207.92
Total provisions 662.57 600.64

90 ESTER INDUSTRIES LTD. 27th Annual Report 2012-13
8. Short Term Borrowings
(Rs. In lacs)
As at As atMarch 31, 2013 March 31, 2012
SecuredWorking capital loan from banks 6,773.59 3,084.24 Bills discounting 3,015.91 2,231.11 Buyers' credit for raw material 760.81 1,630.93 Acceptances 4,380.06 4,133.33 Total short term borrowings 14,930.37 11,079.61
Working capital loan and bills discounting: These loans are secured by first charge by way of hypothecation of stocks of raw materials, finished goods, semi finished goods, stores and spares, book debts and other receivables (both present and future) and further secured by irrevocable guarantees of Wilemina Finance Corp. (Holding company). Working Capital and Bill discounting facilities are further secured by way of second charge in respect of immovable properties and movable fixed assets.
The working capital loans from banks bear floating interest rate ranging from Base Rate plus 2.50% to 2.75% pa.
Buyers’ Credit for raw material are against LOUs / LOCs issued by consortium of banks. The LOUs / LOCs facilities is sanctioned to the Company as a sub limit of Non Fund (LCs) based facility. The facility is secured by first charge by way of hypothecation of stocks of raw materials, finished goods, semi finished goods, stores and spares, book debts and other receivables (both present and future) and further secured by irrevocable guarantees of Wilemina Finance Corp. (Holding company). Buyers’ credit for raw material bears interest rate ranging from 1.03% to 1.66%.
9. Trade Payable(Rs. In lacs)
As at As atMarch 31, 2013 March 31, 2012
Trade payablesTotal outstanding dues of other than micro & small enterprises 2,063.12 1,804.60 Total outstanding dues of micro & small enterprises (refer note 33) 28.76 64.53 Total trade payables 2,091.88 1,869.13
10. Other current liability
(Rs. In lacs)
As at As atMarch 31, 2013 March 31, 2012
SecuredCurrent maturities of term loans from banks 2,467.34 2,301.88 Current maturities of term loans from body corporate 43.51 107.26 Current maturities of vehicle loans 78.34 80.00 Interest accrued but not due on borrowings 63.50 106.70 UnsecuredDeposits from dealer / customer & others 2.58 2.58 Advances from customers 259.31 356.13 Investor education & protection fund will be credited by this amount (as & when due) - Unpaid Dividend
63.58 69.23
Others payables- dues to statutory authorities 279.85 189.15 - others 673.04 623.50
3,931.05 3,836.43 Total other liabilities 3,931.05 3,836.43

27th Annual Report 2012-13 91ESTER INDUSTRIES LTD.
11.
Fixe
d as
sets
(Rs.
in la
cs)
Des
crip
tion
Gro
ss b
lock
Acc
umul
ated
dep
reci
atio
n / a
mor
tisa
tion
Net
blo
ck
Apr
il 1,
201
2A
ddit
ions
Ded
ucti
ons
Mar
ch 3
1, 2
013
Apr
il 1,
201
2Cu
rren
t ye
arD
educ
tion
sM
arch
31,
201
3M
arch
31,
201
3M
arch
31,
201
2
Tang
ible
ass
ets:
Land
- fr
eeho
ld (i
i) 1
,504
.36
- -
1,5
04.3
6 -
- -
- 1
,504
.36
1,5
04.3
6
Build
ings
(ii)
5,3
48.9
0 1
,843
.27
23.
58
7,1
68.5
9 1
,529
.09
168
.45
13.
79
1,6
83.7
5 5
,484
.84
3,8
19.8
1
Plan
t & m
achi
nery
(i),
(ii) &
(iii)
56,
977.
58
3,1
71.9
1 3
8.00
6
0,11
1.49
2
8,05
5.78
2
,494
.24
28.
19
30,
521.
83
29,
589.
66
28,
921.
80
Furn
iture
& fi
xtur
es 1
99.2
2 1
83.8
5 9
4.97
2
88.1
0 9
2.76
1
1.72
5
4.42
5
0.06
2
38.0
4 1
06.4
6
Leas
e ho
ld im
prov
emen
ts 1
45.8
1 -
145
.81
- 9
9.67
3
8.86
1
38.5
3 -
- 4
6.14
Offi
ce e
quip
men
ts 5
13.7
7 1
02.1
8 1
03.3
6 5
12.5
9 2
93.9
5 4
3.76
8
3.67
2
54.0
4 2
58.5
5 2
19.8
2
Vehi
cles
5
05.7
2 1
00.5
0 3
7.17
5
69.0
5 1
42.9
9 5
1.06
1
1.97
1
82.0
8 3
86.9
7 3
62.7
3
Inta
ngib
le a
sset
s:
Soft
war
e 3
16.8
2 9
0.62
0
.38
407
.06
253
.29
65.
03
0.3
6 3
17.9
6 8
9.10
6
3.53
Tota
l 6
5,51
2.18
5
,492
.33
443
.27
70,
561.
24
30,
467.
53
2,8
73.1
2 3
30.9
3 3
3,00
9.72
3
7,55
1.52
3
5,04
4.65
Prev
ious
yea
r
6
4,20
2.40
1
,916
.93
607
.17
65,
512.
18
27,
879.
09
2,6
68.1
4 7
9.70
3
0,46
7.53
3
5,04
4.65
3
6,32
3.31
(i)
(a)
Am
ount
of b
orro
win
g co
st a
ggre
gatin
g Rs
. 108
.20
lacs
(Pre
viou
s ye
ar R
s.5.3
4 la
cs) h
ave
been
cap
italis
ed d
urin
g th
e ye
ar.
Build
ing
- Rs.
85.1
6 la
cs (p
revi
ous Y
ear -
NIL
)
Plan
t & M
achi
nery
- R
s. 20
.73
lacs
(pre
viou
s Yea
r Rs.
5.34
lacs
)
Offi
ce E
quip
men
t - R
s. 2
.31
lacs
(pre
viou
s Yea
r - N
IL)
(b)
Fore
ign
Exch
ange
Flu
ctua
tion
aggr
egat
ing
Rs. 6
14.8
8 la
cs o
n pl
ant &
mac
hine
ry (P
revi
ous
year
NIL
) ha
ve b
een
capi
talis
ed d
urin
g th
e ye
ar.
(ii)
(a)
Gro
ss b
lock
of fi
xed
asse
ts in
clud
es R
s. 72
99.5
3 la
cs (p
revi
ous Y
ear R
s.7,2
99.5
3 la
cs) b
eing
the
amou
nt a
dded
on
reva
luat
ion
of fi
xed
asse
ts o
n 31
-10-
1992
Reva
luat
ion
was
car
ried
out
by a
n ex
tern
al v
alue
r as
per
“Exi
stin
g U
se V
alue
” met
hod
usin
g pr
evai
ling
mar
ket
pric
es o
f the
ass
ets
and
whe
re s
uch
pric
es w
ere
not
avai
labl
e, R
BI in
dice
s w
ere
used
.
Det
ails
of a
dditi
ons
due
to re
valu
atio
n du
ring
1992
are
as
follo
ws:
Land
- R
s. 39
.93
Lacs
(pre
viou
s ye
ar R
s. 39
.93
lacs
)
Build
ing
- Rs.
526.
23 L
acs
(pre
viou
s ye
ar R
s. 52
6.23
lacs
)
Plan
t and
mac
hine
ry
- Rs.
6733
.37
Lacs
(pre
viou
s ye
ar R
s. 67
33.3
7 la
cs)
(iii)
Plan
t & m
achi
nery
Rs.
NIL
(pre
viou
s ye
ar R
s. 44
8.05
lacs
) hav
e be
en a
djus
ted
for r
emis
sion
of l
iabi
lity
tow
ards
tech
nici
an fe
e &
oth
er e
xpen
ses.

92 ESTER INDUSTRIES LTD. 27th Annual Report 2012-13
12. Non-current Investments
(Rs. In lacs)
As at As at
March 31, 2013 March 31, 2012
A. Other than trade - quoted (Valued at cost unless stated otherwise)
Equity shares
- 100 (previous year 100) equity shares of Rs.10 each fully paid up in Pearl Polymers Ltd. 0.04 0.04
- NIL (previous year 200) equity shares of Rs.10 each fully paid up in Polyplex Corporation Ltd. - 0.05
- 50 (previous year 50) equity shares of Rs.10 each fully paid up in J.K.Synthetics Ltd. 0.03 0.03
- NIL (previous year 200) equity shares of Rs.10 each fully paid up in Reliance Industries Ltd. - 0.14
- 100 (previous year 100) equity shares of Rs.10 each fully paid up in Haryana Petrochemicals Ltd. 0.04 0.04
- 100 (previous year 100) equity shares of Rs.10 each fully paid up in Sanghi Polyester Ltd. 0.08 0.08
- 360 (previous year 360) equity shares of Rs.5 each fully paid up in Venlon Enterprises Ltd. 0.10 0.10
- NIL (previous year 196) equity shares of Rs.10 each fully paid up in Nirlon Ltd. - 0.02
- 100 (previous year 100) equity shares of Rs.10 each fully paid up in Modipon Ltd. 0.11 0.11
- NIL (previous year 100) equity shares of Rs.10 each fully paid up in Garware Polyester Ltd. - 0.01
- NIL (previous year 100) equity shares of Rs.10 each fully paid up in SRF Ltd. - 0.02
- NIL (previous year 100) equity shares of Rs.10 each fully paid up in Uflex Industries Ltd. - 0.05
- NIL (previous year 200) equity shares of Rs.10 each fully paid up Jindal Poly Films Ltd. - 0.03
- NIL (previous year 30,000) equity shares of Rs.10 each fully paid up in Ispat Industries Limited - 7.17
- NIL (previous year 1000) equity shares of Rs.10 each fully paid up in Bajaj Hindustan Limited - 5.40
0.40 13.29
Less: provision for diminution in the value of Investments 0.22 4.88
0.18 8.41
B. Other than trade - unquoted (Valued at lower of cost or fair value)
Units of mutual fund
- NIL (previous year 21,824.53) units of SBI- Magnum Comma Fund - Growth Plan of Rs. 22.91
each fully paid up (units purchased during the year Rs.Nil (previous Year Rs.Nil )
- 5.00
- NIL (previous year 50000) units in Baroda Pioneer Infrastructure Fund - Growth Plan of Rs. 10
each fully paid up (units purchased during the previous year Rs. Nil (previous year Rs. 5.00 lacs)).
- 5.00
- NIL (previous year 100,000) units in Baroda Pioneer PSU Equity Fund - Growth Plan of Rs. 10
each fully paid up (units purchased during the year Rs. Nil (previous year Rs. 10.00 lacs)).
- 10.00
- NIL (previous year 100,000) units in SBI- PSU Fund Growth of Rs. 10 each fully paid up
(units purchased during the year Rs. Nil (previous year Rs. 10.00 lacs)).
- 10.00
- NIL (previous year 108,342) units in SBI- PSU Fund Growth Plan of Rs. 9.23 each fully paid up
(units purchased during the year Rs. Nil (previous year Rs. 10.00 lacs)).
- 10.00
- NIL (previous year 14,612.83) units in DSP Blackrock balanced Fund- Growth Plan of Rs. 68.43
each fully paid up (units purchased during the year Rs. Nil (previous year Rs. 10.00 lacs)).
- 10.00
- NIL (previous year 20,633.45) units in DSP Blackrock Top 100 Eq Fund- Growth Plan of Rs.
96.93 each fully paid up (units purchased during the year Rs. Nil (previous year Rs. 20.00 lacs)).
- 20.00
Preference shares
- 20,000 (previous year 20,000) preference shares of Rs.10 each fully paid up Ispat Industries Limited 4.78 4.78
4.78 74.78
Less : provision for diminution in the value of Investment Ispat Industries Limited 3.25 2.78
1.53 72.00
1.71 80.41
Aggregate amount of quoted investments (market value Rs 0.034 lacs, (previous year Rs. 7.14 lacs)
(net of provision)
0.18 8.41
Aggregate amount of unquoted investments (net of provision) 1.53 72.00
Total investment net of provisions 1.71 80.41

27th Annual Report 2012-13 93ESTER INDUSTRIES LTD.
13. Loans & advances
(Rs. In lacs)
As at As at
March 31, 2013 March 31, 2012
Non-current
Unsecured, considered good
Capital advances 242.20 1,162.53
Prepaid expenses 64.31 12.88
Deposits-others 428.18 294.90
Total (A) 734.69 1,470.31
Current
Unsecured, considered good
Advances recoverable in cash or in kind or for value to be received 496.10 854.65
Prepaid expenses 350.52 432.97
Advance tax & tax deducted at source (net of provision of tax) 195.70 182.28
Balances with statutory / Government Authorities 208.29 1,387.57
Loans to employees 62.30 57.68
Deposits-others 47.96 13.06
Unsecured, considered doubtful
Advances recoverable in cash or in kind or for value to be received 31.91 31.91
1,392.78 2,960.12
Less: provision for doubtful advances 31.91 31.91
Total (B) 1,360.87 2,928.21
Total (A+B) 2,095.56 4,398.52
14. Other assets
(Rs. In lacs)
As at As at
March 31, 2013 March 31, 2012
Non-current
Other bank balances (refer note 17) 9.61 57.19
Total other non-current assets 9.61 57.19
Current
Asset held for disposal (at net book value or estimated net realizable value,
which ever is less)
0.51 0.20
Interest receivable on deposits 29.47 42.15
Export benefit receivable 385.85 297.08
Unamortized premium on forward contracts 62.12 44.17
Total other current assets 477.95 383.60
Total other assets 487.56 440.79

94 ESTER INDUSTRIES LTD. 27th Annual Report 2012-13
15. Inventory (at lower of cost or net relizable value)
(Rs. In lacs)
As at As at
March 31, 2013 March 31, 2012
Raw materials {including stock in transit Rs. 978.93 lacs (previous year Rs. 777.95 lacs)} 5,376.04 3,303.66
Work in process 436.25 1,127.68
Finished goods {including stock in transit Rs. 1156.34 lacs (previous year Rs. 853.95 lacs)} 5,292.08 5,028.64
Stores and spares {including stock in transit Rs. 0.21 lacs (previous year Rs. 14.58 lacs)} 1,165.74 971.05
Total inventories 12,270.11 10,431.03
16. Trade receivables
(Rs. In lacs)
As at As at
March 31, 2013 March 31, 2012
Outstanding for a period exceeding six months from the date they are due for
payment
Un-secured, considered good 10.84 23.26
Doubtful 20.93 -
31.77 23.26
Less: Provision for doubtful trade receivables 20.93 -
Total (A) 10.84 23.26
Other receivables
Secured, considered good 1,545.61 1,647.28
Un-secured, considered good 9,345.72 6,750.11
Total (B) 10,891.33 8,397.39
Total (A+B) 10,902.17 8,420.65
17. Cash and bank balances
(Rs. In lacs)
As at As at
March 31, 2013 March 31, 2012
Cash and cash equivalents
Cash on hand 6.08 12.71
Balances with banks in current accounts 915.98 940.91
Unpaid dividend accounts * 63.58 69.23
Total (A) 985.64 1,022.85
Other bank balance
Short term deposits pledged 37.00 106.44
Deposits with maturity of more than 3 months but up to 12 months 351.99 881.47
Deposits with original maturity of more than 12 months 61.26 164.54
Total (B) 450.25 1,152.45
Total Cash & Bank Balance (A+B) 1,435.89 2,175.30
Less:- Amount disclosed under non-current assets (refer note 14) (9.61) (57.19)
Cash & Bank Balance 1,426.28 2,118.11
* These balances are not available for use by the Company as they represent corresponding unpaid dividend liabilities

27th Annual Report 2012-13 95ESTER INDUSTRIES LTD.
18. Revenue from operations
(Rs. In lacs)
For the year ended For the year ended
March 31, 2013 March 31, 2012
Sale of products 94,390.29 72,643.35
Other operating revenue 1,472.85 1,563.72
Revenue from operations (gross) 95,863.14 74,207.07
Less: Excise duty 7,260.86 4,249.06
Revenue from operations (net) 88,602.28 69,958.01
Excise duty on sales amounting to Rs. 7260.86 lacs (previous year Rs. 4,249.06 lacs) has been reduced from sales in statement of
profit & loss and excise duty on increase/(decrease) of stock Rs. (-) 56.52 lacs (previous year Rs. 202.66 lacs) has been considered as
(income) / expenses in note 23 of the financial statements.
Other operating revenue comprises the following income:
(Rs. In lacs)
For the year ended For the year ended Other operating revenue March 31, 2013 March 31, 2012Sales of scrap 27.20 21.80 DEPB earned 12.90 816.12 Drawback earned 1,432.75 725.80
1,472.85 1,563.72
Details of goods sold
2012-13 2011-12Qty (MT) Value Qty (MT) Value
Polyester / PBT chips 17,257 16,202.27 6,218 5,471.35Speciality Polymers 2,241 3,983.68 472 568.98Polyester films 49,639 62,320.12 50,204 58,818.62 Engineering Plastics 6,945 11,807.17 4,655 7,748.48 Others 77.05 35.92 Total 94,390.29 72,643.35
19. Other income
(Rs. In lacs)
For the year ended For the year ended March 31, 2013 March 31, 2012Interest on:
- Fixed deposits {tax deducted at source Rs. 5.77 lacs (previous year Rs. 7.59 lacs)} 58.23 76.51
- Debtors {tax deducted at source Rs. 2.12 lacs (previous year Rs. 0.88 lacs)} 33.59 21.94
- Others {tax deducted at source Rs. 2.88 lacs (previous year Rs. 2.37 lacs)} 28.78 11.86
Insurance claim 19.93 43.09
Dividend 0.03 0.72
Provisions / liabilities no longer required written back 19.86 42.48
Reversal of provision for doubtful debts - 5.44
Foreign exchange fluctuation gain 409.98 314.24
Miscellaneous income 9.05 62.03
Total other income 579.45 578.31

96 ESTER INDUSTRIES LTD. 27th Annual Report 2012-13
20. Cost of raw material consumed
(Rs. In lacs)
For the year ended For the year ended
March 31, 2013 March 31, 2012
Cost of raw material consumed 64,490.13 51,833.23
Total 64,490.13 51,833.23
Details of raw material consumed
2012-13 2011-12
Qty (MT) Value Qty (MT) Value
PTA 59,108.73 38,003.85 51,632.51 32,137.17
MEG 23,179.27 13,829.02 20,434.62 12,072.16
PBT chips 3,765.80 4,790.89 2,575.18 3,339.67
NYLON 1,630.69 2,151.38 1,015.79 1,361.57
BUTANE DIOL 431.95 657.06 - -
NDC 169.60 545.30 - -
Others 4,512.63 2,922.66
Total 64,490.13 51,833.23
Inventory of Raw material
(Rs. In lacs)
2012-13 2011-12
Value Value
PTA 2,250.14 893.02
MEG 275.79 311.54
PBT chips 569.78 625.84
NYLON 437.88 382.56
BUTANE DIOL 212.43 -
Others 1,630.02 1,090.70
5,376.04 3,303.66
21. (Increase) / Decrease in Inventories
(Rs. In lacs)
For the year ended For the year ended (Increase) /
DecreaseMarch 31, 2013 March 31, 2012
Closing stock
- Finished goods 5,292.08 5,028.23 263.85
- Work in process 436.25 1,127.68 (691.43)
5,728.33 6,155.91 (427.58)
Opening stock
- Finished goods 5,028.23 2,945.39 2,082.84
- Work in process 1,127.68 735.66 392.02
6,155.91 3,681.05 2,474.86
Total (Increase) / Decrease 427.58 (2,474.86)
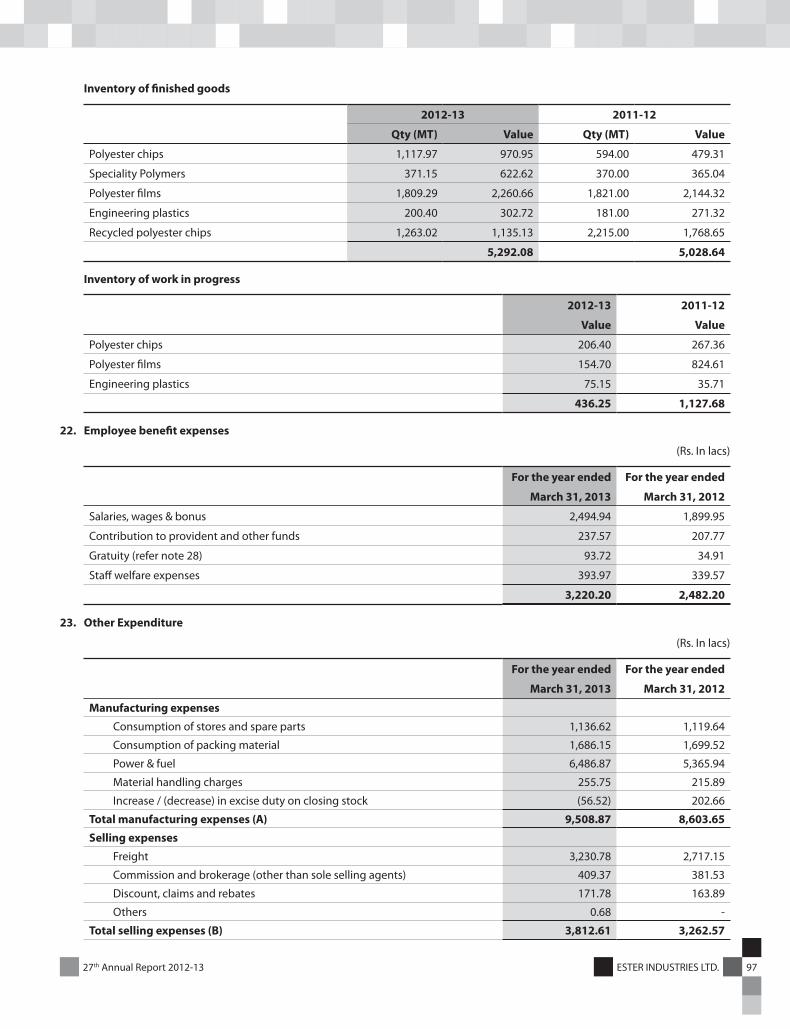
27th Annual Report 2012-13 97ESTER INDUSTRIES LTD.
Inventory of finished goods
2012-13 2011-12
Qty (MT) Value Qty (MT) Value
Polyester chips 1,117.97 970.95 594.00 479.31
Speciality Polymers 371.15 622.62 370.00 365.04
Polyester films 1,809.29 2,260.66 1,821.00 2,144.32
Engineering plastics 200.40 302.72 181.00 271.32
Recycled polyester chips 1,263.02 1,135.13 2,215.00 1,768.65
5,292.08 5,028.64
Inventory of work in progress
2012-13 2011-12
Value Value
Polyester chips 206.40 267.36
Polyester films 154.70 824.61
Engineering plastics 75.15 35.71
436.25 1,127.68
22. Employee benefit expenses
(Rs. In lacs)
For the year ended For the year ended
March 31, 2013 March 31, 2012
Salaries, wages & bonus 2,494.94 1,899.95
Contribution to provident and other funds 237.57 207.77
Gratuity (refer note 28) 93.72 34.91
Staff welfare expenses 393.97 339.57
3,220.20 2,482.20
23. Other Expenditure
(Rs. In lacs)
For the year ended For the year ended
March 31, 2013 March 31, 2012
Manufacturing expenses
Consumption of stores and spare parts 1,136.62 1,119.64
Consumption of packing material 1,686.15 1,699.52
Power & fuel 6,486.87 5,365.94
Material handling charges 255.75 215.89
Increase / (decrease) in excise duty on closing stock (56.52) 202.66
Total manufacturing expenses (A) 9,508.87 8,603.65
Selling expenses
Freight 3,230.78 2,717.15
Commission and brokerage (other than sole selling agents) 409.37 381.53
Discount, claims and rebates 171.78 163.89
Others 0.68 -
Total selling expenses (B) 3,812.61 3,262.57

98 ESTER INDUSTRIES LTD. 27th Annual Report 2012-13
For the year ended For the year ended
March 31, 2013 March 31, 2012Administration and other expenses
Rent 123.01 123.85 Rates and taxes 25.85 70.42 Insurance 209.70 217.07 Repairs & maintenance- Building 26.27 33.29 - Plant & machinery 186.92 153.21 - Others 138.03 123.75 Travelling & conveyance 748.21 686.44 Communication costs 106.40 130.69 Legal & professional charges 431.31 494.15 Printing & stationery 22.17 29.26 Donations (other than political parties) 8.80 73.30 Directors sitting fees 4.40 4.30 Auditors' remuneration - Statutory audit fee 17.08 14.52 - Limited review fee 12.00 8.50 - Out of pocket expenses 0.98 0.92 Loss on sale of DEPB license - 13.71 Loss on fixed assets sold / discarded 83.69 15.31 Loss on sale of Investments 8.32 - Bad debts, advances & irrecoverable balances written off 89.83 0.20 Provision for Obsolete inventory 4.03 - Premium on forward contract amortised 267.21 140.72 Miscellaneous expenses 484.78 390.51
Total Administrative & other expenses (C) 2,998.99 2,724.13 Total other expenses (A+B+C) 16,320.47 14,590.34
24. Finance cost
(Rs. In lacs)
For the year ended For the year endedMarch 31, 2013 March 31, 2012
Interest - on term loans 537.03 823.82 - on working capital 1,125.33 802.72 - on buyer's credit facilities 335.64 355.69 Exchange fluctuation component of borrowing cost (refer note 2(b)) - 906.01 Bank charges 648.83 661.24
2,646.83 3,549.48
25. Earning per share (EPS)
Year ended Year ended
March 31, 2013 March 31, 2012
Net profit/(loss) for calculation of basic /diluted EPS (Rs. in lacs) (528.10) (1,392.91)
Weighted average number of equity shares in calculating basic & diluted EPS 62,893,706 62,893,706
Basic / diluted EPS (in Rs.) (0.84) (2.21)

27th Annual Report 2012-13 99ESTER INDUSTRIES LTD.
26. Capital commitments
(Rs. In lacs)
As at As atMarch 31, 2013 March 31, 2012
Estimated amount of contracts remaining to be executed on capital account and
not provided for
391.61 10,392.81
Capital Commitments are on account of upgradation of slitter used in polyster film lines and other assets.
27. Contingent liabilities not provided for
(Rs. In lacs)
As at As atMarch 31, 2013 March 31, 2012
(a) Excise Duty and Customs Duty pending hearing of appeals/writ petitions:(i) Cenvat credit disallowed on inputs (for the period March 1990 to Mar
1991) not covered under rule 57A, mainly Santotherm, Diethyl Glycol, Delion etc. Disallowance was due to use of inputs for manufacture of exempted goods.
8.06 8.06
(ii) Removal of PET chips (exempted goods) from bonded warehouse without payment of duty.
3.00 3.00
(iii) Goods sold from depot at higher value than one declared at factory gate price for the period Jun 1988 to Mar 1992.
25.46 25.46
(iv) Cenvat credit disallowed on inputs like DMT, additives etc. for the manufacturing of polyester chips. Disallowance was due to use of inputs for manufacturing of exempted goods.
164.20 164.20
(v) Reversal of Cenvat credit availed on HSD. Department disallowed credit alleging that cenvat credit has been wrongly availed on HSD.
206.92 206.92
(vi) Cenvat credit availed on raw material. Disallowance on account of credit availed fully on raw material and not on pro-rata basis for clearance of dutiable goods i.e. polyester films.
11.72 11.72
(vii) Availment of credit on import of Dimethyl Terephalate. Disallowance was due to use of inputs for manufacturing of exempted goods.
57.71 57.71
(viii) Other Miscellaneous Cases 33.82 33.82 (ix) Cenvat credit of Rs. 0.59 lacs not admissible on shape & section as capital
goods and Rs. 2.5 lacs recoverable against shortage of cenvatable inputs. 3.09 3.09
(x) Demand raised on account of excess / shortfall in stocks alleged by preventative staff.
12.95 12.95
(xi) Demand raised for differential amount of Custom Duty on import of PBT chips. 188.36 188.36 Total (a) 715.29 715.29 (b) Show cause notices related to Service Tax & Excise rebate on export 13.54 13.75 (c) Income Tax:
(i) Demand raised during assessment (A.Y. 1989-90) - 1.84 (ii) Disallowance of advertisement expenditure pursuant to rule 6B of IT
rules, 1962 in the revised return of income which is based on the auditor's report in respect of A.Y. 1990-91, 1993-94 to 1997-98 by ITAT.
1.68 1.68
(iii) Disallowance of club expenditure on the contention that they are not wholly and exclusively for the business needs of the company in respect of A.Y. 1990-91, 1993-94 to 1994-95 & A.Y. 2005-06 by ITAT.
1.80 1.80
(iv) Disallowance of 50% of entertainment expenses on the contention that there has been no participation of the employee for incurring such expenditure in respect of A.Y. 1993-94 to 1997-98 by ITAT.
5.10 5.10

100 ESTER INDUSTRIES LTD. 27th Annual Report 2012-13
As at As atMarch 31, 2013 March 31, 2012
(v) Disallowance of expenses relating to previous years in respect of A.Y. 1993-94 to 1997-98 by ITAT.
14.68 14.68
(vi) Demand of MAT (including interest) A.Y. 2004-05* 5.78 5.78 * Disallowances of expenses incurred on earning exempt income like dividend and interest by invoking section 14A of the act by AO in respect of A.Y. 2004-05.* Disallowances of provision for doubtful debts and advances for computing book profits under section 115JB of the Act as they are in the nature of reserves as per assessing officer.* Disallowances of claim of profit under section 80HHC for computing book profits under section 115JB of the act on the contention that company should have adjusted unabsorbed business loss and depreciation with the profits of the business first before arriving at the deduction under section 80HHC of the Act. Since, the two exceed the current years profits, there can be no deduction under section 80HHC of the Act.
(vii) Demand of MAT (including interest) A.Y. 2005-06@ 11.16 11.16 @ Disallowance of carry forward of loss on sale of investment on which dividend income is earned which is exempt from tax by invoking section 94(7) of the Act.@ Disallowance of other expenses under MAT including foreign technician fees, unexplained investment.
(viii) Liability in respect of disallowances of excess depreciation claimed by company, bonus provision, disallowance of expenses incurred on earning exempt income like dividend and interest by invoking section 14A of the Act in respect of A.Y. 2006-07 to A.Y. 2009-10.
11.66 37.27
Total (c) 51.86 79.31 (d) Labour Cases: Workers suspended, pending in High Court, Delhi 1.67 1.67 Total (D) = (a)+(b)+(c)+(d) 782.36 810.02 (e) Other claims not acknowledged as debts 49.20 48.50 (f) Bonds amounting to Rs 510 lacs executed in favour of Central Excise &
Customs Authorities, out of which, amount to be re-credited on receiving the proof of export is yet to be submitted.
366.84 163.75
(g) Amount of duty saved on import under advance license - corresponding export obligation pending is Rs. 972.66 lacs
8.33 -
Based on favorable decisions in similar cases, legal opinion taken by the company, discussions with the solicitors etc., the company
believes that there is fair chance of decisions in its favour in respect of all the items listed in (a) to (e) above and hence no provision
is considered necessary against the same.
28. Directors’ Remuneration
The Company appointed Mr. Ashok Kumar Agarwal and Mr. Pradeep Kumar Rustagi as Whole Time Directors of the Company with
effect from February 14, 2011 with the approval of the shareholders. During the FY 2010-11, the Company had adequate profits and
both the directors were paid remuneration within the limits as prescribed in Schedule XIII to the Companies Act, 1956.
During the financial year 2011-12, due to changed market condition caused by over-supply, the Company had suffered losses which
were not determinable at the time of appointment. The remuneration paid/accrued to both the whole time directors was in excess
of the limit prescribed under schedule XIII of the Companies Act, 1956 by Rs. 25.19 lacs. Therefore the Company, with the approval
of shareholders in the Extra ordinary general meeting held on April 7, 2012, had made an application to the Central Government
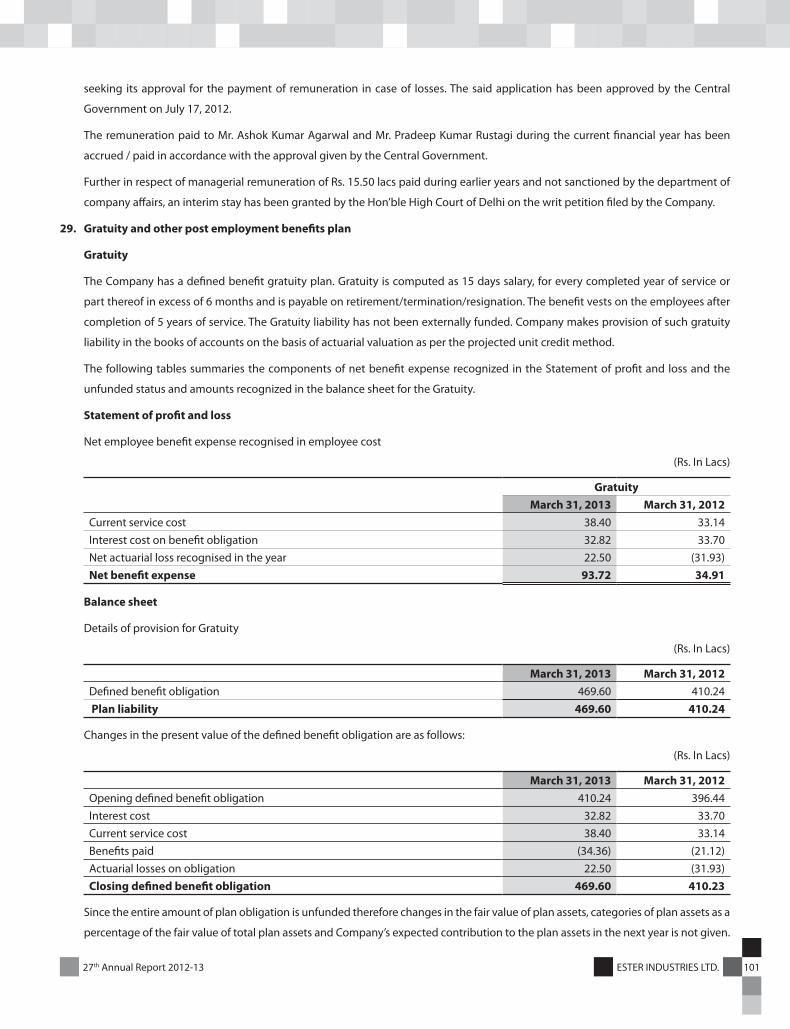
27th Annual Report 2012-13 101ESTER INDUSTRIES LTD.
seeking its approval for the payment of remuneration in case of losses. The said application has been approved by the Central
Government on July 17, 2012.
The remuneration paid to Mr. Ashok Kumar Agarwal and Mr. Pradeep Kumar Rustagi during the current financial year has been
accrued / paid in accordance with the approval given by the Central Government.
Further in respect of managerial remuneration of Rs. 15.50 lacs paid during earlier years and not sanctioned by the department of
company affairs, an interim stay has been granted by the Hon’ble High Court of Delhi on the writ petition filed by the Company.
29. Gratuity and other post employment benefits plan
Gratuity
The Company has a defined benefit gratuity plan. Gratuity is computed as 15 days salary, for every completed year of service or
part thereof in excess of 6 months and is payable on retirement/termination/resignation. The benefit vests on the employees after
completion of 5 years of service. The Gratuity liability has not been externally funded. Company makes provision of such gratuity
liability in the books of accounts on the basis of actuarial valuation as per the projected unit credit method.
The following tables summaries the components of net benefit expense recognized in the Statement of profit and loss and the
unfunded status and amounts recognized in the balance sheet for the Gratuity.
Statement of profit and loss
Net employee benefit expense recognised in employee cost
(Rs. In Lacs)
GratuityMarch 31, 2013 March 31, 2012
Current service cost 38.40 33.14 Interest cost on benefit obligation 32.82 33.70 Net actuarial loss recognised in the year 22.50 (31.93)Net benefit expense 93.72 34.91
Balance sheet
Details of provision for Gratuity
(Rs. In Lacs)
March 31, 2013 March 31, 2012Defined benefit obligation 469.60 410.24 Plan liability 469.60 410.24
Changes in the present value of the defined benefit obligation are as follows:
(Rs. In Lacs)
March 31, 2013 March 31, 2012Opening defined benefit obligation 410.24 396.44 Interest cost 32.82 33.70 Current service cost 38.40 33.14 Benefits paid (34.36) (21.12)Actuarial losses on obligation 22.50 (31.93)Closing defined benefit obligation 469.60 410.23
Since the entire amount of plan obligation is unfunded therefore changes in the fair value of plan assets, categories of plan assets as a
percentage of the fair value of total plan assets and Company’s expected contribution to the plan assets in the next year is not given.

102 ESTER INDUSTRIES LTD. 27th Annual Report 2012-13
The principal assumptions used in determining gratuity benefit obligations for the Company’s plans are shown below:
March 31, 2013 March 31, 2012
% %
Discount rate 8.00 8.50
Increase in compensation cost 5.50 6.00
Employee turnover – Age Group
Up to 30 years 3 3
30 – 44 years 2 2
Above 44 years 1 1
The estimates of future salary increases, considered in actuarial valuation, take account of inflation, seniority, promotion and other
relevant factors, such as supply and demand in the employment market.
Amounts for the current and previous four years are as follows:
(Rs. In lacs)
Gratuity
March 31, 2013 March 31, 2012 March 31, 2011 March 31, 2010 March 31, 2009
Defined benefit obligation 469.60 410.24 396.44 333.16 306.32
Deficit 469.60 410.24 396.44 333.16 306.32
Experience adjustments on
plan liabilities Loss/(Gain)
20.86 (30.33) 29.30 (10.11) 25.24
Contribution to Defined Contribution Plans:
(Rs. In lacs)
March 31, 2013 March 31, 2012Superannuation fund 77.18 73.06Provident fund contribution to Government authority 84.68 75.93
Provident Fund
The company has set up provident fund trust which is managed by the company, and as per the guidance note on implementing AS-
15, employee benefits (revised 2005) issued by the accounting standard board (ASB), provident fund trust set up by employers, which
required interest shortfall to be met by employer, needs to be treated as defined benefit plan.
Changes in the present value of the projected benefit obligation are as follows:
(Rs. In lacs)
Projected Benefit Obligation March 31, 2013 March 31, 2012
Projected Benefit Obligation at Beginning of year 465.54 365.95
Current Service Cost 74.17 56.67
Interest Cost 39.57 31.11
Contributions by plan participants / employees 87.59 65.55
Actuarial (Gain) / Loss due to Interest guarantee 7.57 0.00
Benefits Paid (97.63) (170.38)
Past Service Cost -- --
Settlements / Transfer In 6.36 115.90
Projected Benefit Obligation at End of year 583.17 464.80

27th Annual Report 2012-13 103ESTER INDUSTRIES LTD.
Changes in the present value of the plan assets are as follows:
(Rs. In lacs)
Reconciliation of Plan Assets March 31, 2013 March 31, 2012
Plan Asset at beginning of year 500.16 398.06
Foreign currency exchange rate changes on plans measured in a currency
different from the enterprise's reporting currency
- -
Expected Return on Plan Asset 42.51 33.83
Employer Contribution 74.17 56.67
Plan Participants / Employee Contribution 87.59 65.55
Benefit Payments (97.63) (170.38)
Asset Gain /(Loss) 4.39 0.53
Settlements / Transfer In 6.36 115.90
Ending Asset at Fair Value 617.55 500.16
The principal assumptions used in determining liability towards shortfall in provident liability are shown below:
Economic Assumptions March 31, 2013 March 31, 2012
i) Interest rate 8.50% 8.50%
Demographic Assumptions March 31, 2013 March 31, 2012
i) Mortality IALM (1994-96) LIC (1994–1996)
ii) Disability None None
iii) Normal Retirement Age 58 58
30. Leases:
The Company has taken various residential, office and warehouse premises under operating lease agreements. These are generally
not non-cancellable and are renewable by mutual consent on mutually agreed terms. There are no restrictions imposed under the
lease agreement and there are no subleases. The company have paid Rs. 123.01 lacs (previous year Rs. 123.85 lacs) towards operating
lease rentals.
31. Forward contract outstanding as at Balance sheet date:
As at As at
Particulars Currency March 31, 2013 March 31, 2012 Purpose
Purchase (Cross Currency) EURO:USD 3,935,803 500,000 Forward contract to hedge foreign currency
liability in respect of Buyers' Credit against
Letters of Undertaking (LOUs) / Letter of
Comfort (LOCs) for import of capital goods.
Purchase EURO 2,014,600 2,014,600
USD 5,977,335 3,546,615
USD 760,400 1,602,400 Forward contract to hedge foreign currency
liability in respect of Buyers' Credit against
LOUs / LOCs for import of raw material.
Sales EURO - 337,206 Forward contract to hedge foreign currency
receivables in respect of export of goods. USD 1,000,000 1,750,000

104 ESTER INDUSTRIES LTD. 27th Annual Report 2012-13
32. Particulars of Un-hedged foreign Currency Exposure as at the Balance Sheet date
Particulars Currency Amount In Foreign Currency(In absolute figures)
Rates Amount (Rs in lacs)
March 31, 2013
March 31, 2012
March 31, 2013
March 31, 2012
March 31, 2013
March 31, 2012
Import Creditors (Acceptances) Euro 23,068.82 101,574.59 69.54 67.39 16.04 68.45 USD 2,665,942.44 2,275,740.71 54.39 50.94 1,450.01 1,159.26
Export Debtors USD 2,979,283.99 2,158,485.49 54.39 50.89 1,620.43 1,098.45 Euro 139,809.26 9,275.80 69.54 67.30 97.22 6.24 GBP - 29,145.25 - 81.78 - 23.83
LOUs / LOCs for Buyers' Credit- For Capital Goods USD 8,223,977.40 5,883,665.00 54.39 50.90 4,473.02 2,994.79
Euro 7,098,533.40 10,534,336.40 69.54 67.35 4,936.32 7,094.88 - For Raw material USD 638,400.00 1,603,100.00 54.39 50.90 347.23 815.98
33. Details of dues to Micro & Small Enterprises as per MSMED Act, 2006
(Rs. In lacs)
For the year endedMarch 31, 2013
For the year endedMarch 31, 2012
i) The principal amount & the interest due thereon remaining unpaid to any supplier as at the end of yearPrincipal Amount 28.76 64.53Interest Due thereon - -
ii) Payments made to supplier beyond the appointed day during the yearPrincipal 661.55 648.62Interest Due thereon - -
iii) The amount of interest due and payable for the period of delay in making payment (which have been paid but beyond the appointed day during the year) but without adding the interest specified under Micro Small and Medium Enterprise Development Act, 2006.
- -
iv) The amount of interest accrued and remaining unpaid at the end of the year; and - -v) The amount of further interest remaining due and payable even in the
succeeding years, until such date when the interest dues as above are actually paid to the small enterprise for the purpose of disallowance as a deductible expenditure under section 23 of the Micro Small and Medium Enterprise Development Act, 2006.
- -
The information has been given in respect of such vendors to the extent they could be identified as Micro and Small Enterprises as
per MSMED Act, 2006 on the basis of information available with the company.
34. a) Names of related parties
Nature of Relationship Name of Related PartyNames of related parties where control exists
- Ultimate Holding Company - Goldring Investments Corp.- Holding Company - Wilemina Finance Corporation- Fellow Subsidiary Company - Sriyam Impex Private Limited
Key Management Personnel. - Mr. A K Singhania (Non-Executive Chairman)- Mr. Ashok Kumar Agrawal (Executive Director)- Mr. Pradeep Rustagi (Executive Director)
Relatives of Key Management Personnel. - Mr. Ayush Vardhan Singhania (Son of Mr. A K Singhania)Individuals, which directly or indirectly through subsidiaries, control or exercise significant influence over the company.
- Mr. Jai Vardhan Singhania
Enterprises owned or significantly influenced by Key management personnel or their relatives
- Fenton Investments Private Limited- PDJ Properties & Investment Services Private Limited- Polyplex Corporation Limited

27th Annual Report 2012-13 105ESTER INDUSTRIES LTD.
b) Related party transaction
(Rs. in lacs)
Nature of TransactionsHolding
Company Subsidiaries
Key Management
Personnel
Relative of Key
Management Personnel
Enterprises owned or significantly
influenced by key management
personnel or their relatives Total
Transactions during the year
Managerial Remuneration
Ashok K. Agrawal - 69.35 - - 69.35
- (65.98) - - (65.98)
Pradeep Rustagi - 68.30 - - 68.30
- (63.21) - - (63.21)
Rent Paid
Fenton Investment Pvt. Ltd. 20.22 20.22
(19.55) (19.55)
Salary Paid
Ayush Vardhan Singhania - - 21.08 - 21.08
- - (12.00) - (12.00)
Material Sold
Polyplex Corporation Limited - - - 10.00 10.00
- - - (0.32) (0.32)
Material Purchased
Polyplex Corporation Limited - - - 20.58 20.58
- - - (0.17) (0.17)
Balances Outstanding as at year end
Security deposit
Fenton Investments Pvt.Ltd. - - - 4.50 4.50
- - - (4.50) (4.50)
Payable for purchase of goods
Polyplex Corporation Limited 1.43 1.43
- -
Receivable for sale of goods
Polyplex Corporation Limited - - - - -
- - - (0.32) (0.32)
Guarantees given against Loans Taken (jointly and severally) by the Company
- Wilemina Finance Corporation 31,959.19 31,959.19
(29,656.80) (29,656.80)
- A.K.Singhania 43.51 43.51
(150.77) (150.77)
- Previous year figures are given in brackets.
- No amount has been written off or provided for in respect of transactions with the related parties.
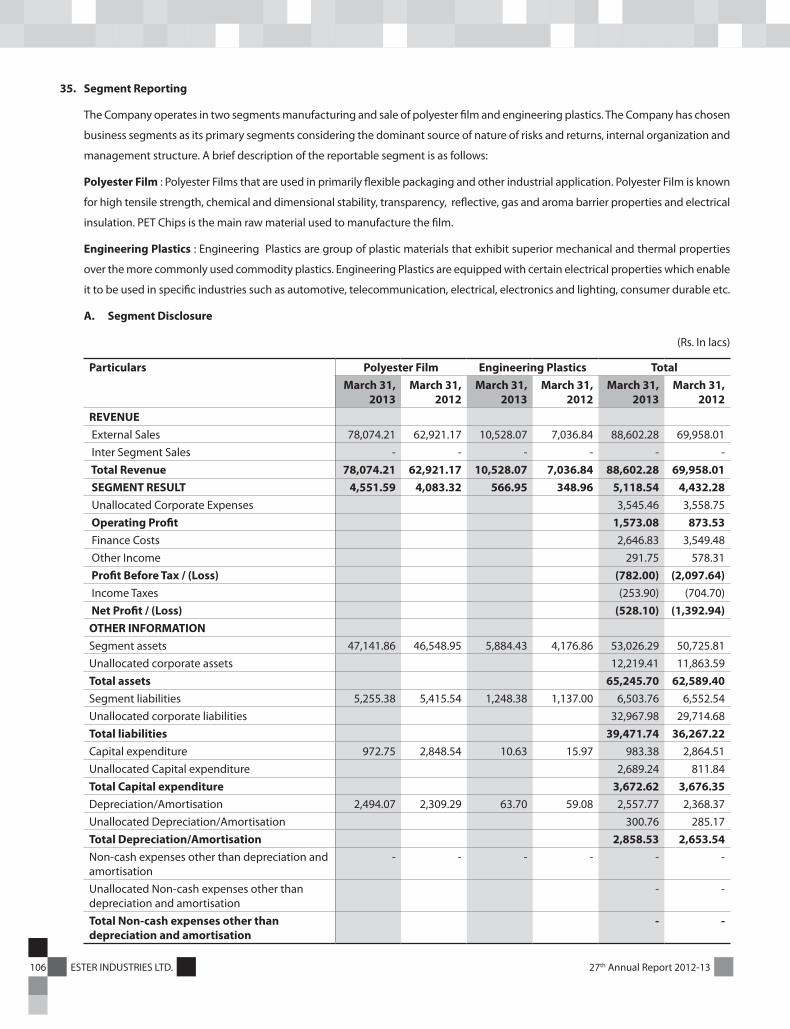
106 ESTER INDUSTRIES LTD. 27th Annual Report 2012-13
35. Segment Reporting
The Company operates in two segments manufacturing and sale of polyester film and engineering plastics. The Company has chosen
business segments as its primary segments considering the dominant source of nature of risks and returns, internal organization and
management structure. A brief description of the reportable segment is as follows:
Polyester Film : Polyester Films that are used in primarily flexible packaging and other industrial application. Polyester Film is known
for high tensile strength, chemical and dimensional stability, transparency, reflective, gas and aroma barrier properties and electrical
insulation. PET Chips is the main raw material used to manufacture the film.
Engineering Plastics : Engineering Plastics are group of plastic materials that exhibit superior mechanical and thermal properties
over the more commonly used commodity plastics. Engineering Plastics are equipped with certain electrical properties which enable
it to be used in specific industries such as automotive, telecommunication, electrical, electronics and lighting, consumer durable etc.
A. Segment Disclosure
(Rs. In lacs)
Particulars Polyester Film Engineering Plastics TotalMarch 31,
2013March 31,
2012March 31,
2013March 31,
2012March 31,
2013March 31,
2012REVENUE External Sales 78,074.21 62,921.17 10,528.07 7,036.84 88,602.28 69,958.01 Inter Segment Sales - - - - - - Total Revenue 78,074.21 62,921.17 10,528.07 7,036.84 88,602.28 69,958.01 SEGMENT RESULT 4,551.59 4,083.32 566.95 348.96 5,118.54 4,432.28 Unallocated Corporate Expenses 3,545.46 3,558.75 Operating Profit 1,573.08 873.53 Finance Costs 2,646.83 3,549.48 Other Income 291.75 578.31 Profit Before Tax / (Loss) (782.00) (2,097.64) Income Taxes (253.90) (704.70) Net Profit / (Loss) (528.10) (1,392.94)OTHER INFORMATION Segment assets 47,141.86 46,548.95 5,884.43 4,176.86 53,026.29 50,725.81 Unallocated corporate assets 12,219.41 11,863.59 Total assets 65,245.70 62,589.40 Segment liabilities 5,255.38 5,415.54 1,248.38 1,137.00 6,503.76 6,552.54 Unallocated corporate liabilities 32,967.98 29,714.68 Total liabilities 39,471.74 36,267.22 Capital expenditure 972.75 2,848.54 10.63 15.97 983.38 2,864.51 Unallocated Capital expenditure 2,689.24 811.84 Total Capital expenditure 3,672.62 3,676.35 Depreciation/Amortisation 2,494.07 2,309.29 63.70 59.08 2,557.77 2,368.37 Unallocated Depreciation/Amortisation 300.76 285.17 Total Depreciation/Amortisation 2,858.53 2,653.54 Non-cash expenses other than depreciation and amortisation
- - - - - -
Unallocated Non-cash expenses other than depreciation and amortisation
- -
Total Non-cash expenses other than depreciation and amortisation
- -

27th Annual Report 2012-13 107ESTER INDUSTRIES LTD.
B. INFORMATION ABOUT SECONDARY SEGMENTS
a) Revenue as per Geographical Markets
(Rs. In lacs)
March 31, 2013 March 31, 2012
India * 59,622.02 41,833.74
Outside India 28,980.26 28,124.27
Total 88,602.28 69,958.01
* Includes Deemed export with in India
b) Carrying amount of Segment Assets (Trade receivable) by geographical location of assets
(Rs. In lacs)
March 31, 2013 March 31, 2012
India 6,650.23 4,431.88
Outside India 4,251.94 3,988.77
Total 10,902.17 8,420.65
Rest of the current assets are common and not segregable geographical segment wise.
c) The Company has common fixed assets located in India, for producing goods for Domestic Market and Overseas Market.
Hence, separate figures for fixed assets / additions to fixed assets cannot be furnished.
36. The Board of Directors in its meeting held on January 17, 2013 accorded the approval of Scheme of amalgamation of Sriyam Impex
Private Limited (“the Promoter group company”) with Ester Industries Limited (“the Company”) subject to regulatory and other
approvals. In this process the company have filed an application with stock exchange for obtaining “No Objection” and in principle
approval.
37. Previous year figure have been regrouped / reclassified whenever considered necessary, so as to confirm with the current year’s
classification.
As per our report of even date
For S.R. BATLIBOI & CO. LLP For and on behalf of the board of directors Chartered Accountants of Ester Industries Limited Firm Registration No. 301003E
per Manoj Gupta Ashok NewatiaPartner DirectorMembership no. 83906
Place : New Delhi Pradeep Rustagi Diwaker DineshDate : May 24, 2013 Executive Director & CFO Company Secretary
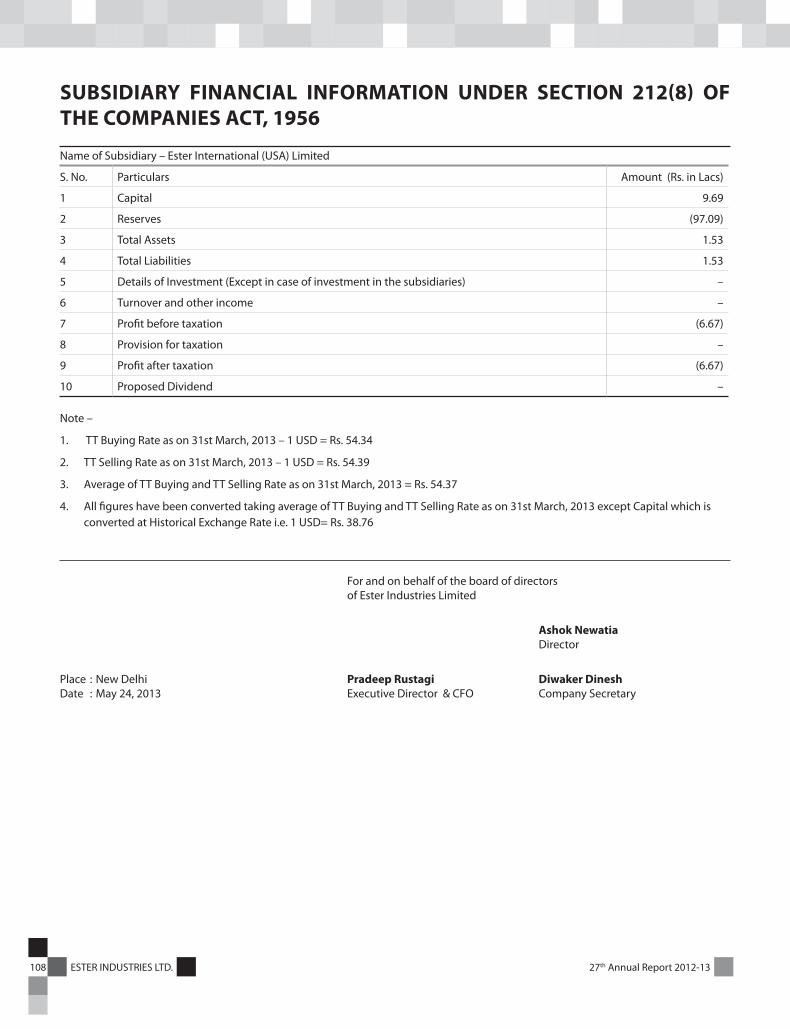
108 ESTER INDUSTRIES LTD. 27th Annual Report 2012-13
SUBSIDIARY FINANCIAL INFORMATION UNDER SECTION 212(8) OF THE COMPANIES ACT, 1956
Name of Subsidiary – Ester International (USA) Limited
S. No. Particulars Amount (Rs. in Lacs)
1 Capital 9.69
2 Reserves (97.09)
3 Total Assets 1.53
4 Total Liabilities 1.53
5 Details of Investment (Except in case of investment in the subsidiaries) –
6 Turnover and other income –
7 Profit before taxation (6.67)
8 Provision for taxation –
9 Profit after taxation (6.67)
10 Proposed Dividend –
Note –
1. TT Buying Rate as on 31st March, 2013 – 1 USD = Rs. 54.34
2. TT Selling Rate as on 31st March, 2013 – 1 USD = Rs. 54.39
3. Average of TT Buying and TT Selling Rate as on 31st March, 2013 = Rs. 54.37
4. All figures have been converted taking average of TT Buying and TT Selling Rate as on 31st March, 2013 except Capital which is converted at Historical Exchange Rate i.e. 1 USD= Rs. 38.76
For and on behalf of the board of directors of Ester Industries Limited
Ashok Newatia Director
Place : New Delhi Pradeep Rustagi Diwaker DineshDate : May 24, 2013 Executive Director & CFO Company Secretary

27th Annual Report 2012-13 109ESTER INDUSTRIES LTD.
E-MAIL REGISTRATION FORMDear Shareholder
Green Initiative in Corporate Governance: Go Paperless The Ministry of Corporate Affairs (‘Ministry’) has taken a “Green Initiative in Corporate Governance” by allowing paperless compliances by companies through electronic mode. In accordance with the circulars no. 17/2011 dated 21.04.2011 and 18/2011 dated 29.04.2011 issued by the Ministry, companies can now send documents like Notice of Annual General Meeting, Annual Report, Postal Ballot Notice or any other notice/intimation etc. to their shareholders through electronic mode, to their registered e-mail addresses.
We invite you to take part in this opportunity to contribute to the Corporate Social Responsibility initiative of the Company. We therefore request you to register your Email Id by sending this form duly filled in and signed to the Company’s Registrar & Share Transfer Agent “M/s MCS LIMITED” or your concerned Depository Participant.
IF SHARE(S) IS/ARE HELD IN PHYSICAL MODEPlease send the form to the Registrar at following address-MCS LimitedUnit – Ester Industries LimitedF – 65, Okhla Industrial Area, Phase - I,New Delhi – 110 020
IF SHARE(S) IS/ARE HELD IN DEMAT (ELECTRONIC) MODEPlease send the form to your concerned Depository Participantwhere you maintain your Demat Account.
Dear Sir/Madam,
Green Initiative in Corporate Governance
I agree to receive all communication from the Company in electronic mode. Please register my following e-mail id in your records for sending communication through e-mail -
E-mail ID to be registered
Name of Sole/Joint Holder(s) Folio No./DP ID and Client ID Signature
Date ………………………………
Important Notes:
1) After registration, all the communication will be sent to your registered e-mail Id. However, you can anytime ask for physical copy of the document.
2) The form is also available on the website of the Company viz www.esterindustries.com
3) Shareholders are requested to keep company informed as and when there is any change in the e-mail address. Unless the email Id given hereunder is changed by you by sending another communication in writing, the company will continue to send the notices/documents to you on the above mentioned email ID.

110 ESTER INDUSTRIES LTD. 27th Annual Report 2012-13
SPACE LEFT INTENTIO
NALLY

27th Annual Report 2012-13 111ESTER INDUSTRIES LTD.
Registered Office: Sohan Nagar, P.O. Charubeta, Khatima – 262 308, District Udham Singh Nagar, Uttarakhand
PROXY FORMD. P. Id No. Folio No.
Client Id No. No. of Shares
I/We.. . . . . . . . . . . . . . . . . . . . . . . . . . . . . . . . . . . . . . . . . . . . . . . . . . . . . . . . . . . . .R/o..…………………………………………………………………………………... ……………………………………………………………being a Member/Members of ESTER INDUSTRIES LIMITED hereby appoint Mr./Ms. ……………….………………….………..……. R/o …………………....………………………….………….….. or failing him/her Mr./Ms …………………………..…………………………… R/o ……………………………….………..………………….... as my/our Proxy to attend and vote for me/us on my/our behalf at the 27th Annual General Meeting of the Company to be held on Monday, the 30th Day of September, 2013 at 11.30 AM at Sohan Nagar, P.O. Charubeta, Khatima – 262 308, District Udham Singh Nagar, Uttarakhand and/or any adjournment thereof.
Signed this ……..…day of ……………. 2013.
Signed by the said ___________________________________________________
Note: 1. A proxy need not be a member of the Company.
2. A Proxy can not speak at the meeting or vote on show of hand.
3. This form duly completed and signed as per specimen signature registered with the Company should be deposited at the Registered Office of the Company not less than 48 hours before the time fixed for the commencement of the Meeting.
4. Strike out whichever is not applicable.
Registered Office: Sohan Nagar, P.O. Charubeta, Khatima – 262 308, District Udham Singh Nagar, Uttarakhand
27th ANNUAL GENERAL MEETINGATTENDANCE SLIP
DULY FILLED IN ATTENDENCE SLIP SHALL BE HANDED OVER AT THE ENTRANCE OF THE MEETING HALL
D. P. Id No. Folio No.
Client Id No. No. of Shares
I/We hereby record my/our presence at the 27th Annual General Meeting of the Company to be held on Monday, the 30th Day of September 2013 at 11.30 AM at Sohan Nagar, P.O. Charubeta, Khatima – 262 308, District Udham Singh Nagar, Uttarakhand.
Name of the Shareholder(IN CAPITAL LETTER)
Name of Proxy(IN CAPITAL LETTER)
SIGNATURE/S OF THE SHAREHOLDER/S OR PROXY
(To be signed at the time of handing over the slip)
Re. 1/-
Revenue
Stamp

112 ESTER INDUSTRIES LTD. 27th Annual Report 2012-13
SPACE LEFT INTENTIO
NALLY


