pakistan: issues and options in the energy sector · report no. 2953-pak pakistan: issues and...
TRANSCRIPT

Report No. 2953-PAK
Pakistan: Issues and Optionsin the Energy Sector
June 5, 1980
Energy Department
FOR OFFICIAL USE ONLY
Doent of the Wor fan
Thts doumen has a restrted dstrbtion and may be used by repontson In the performame of heir ofci duties Its contents rnay nototherWe be dsdosed wiout World Bank auhorization.
Pub
lic D
iscl
osur
e A
utho
rized
Pub
lic D
iscl
osur
e A
utho
rized
Pub
lic D
iscl
osur
e A
utho
rized
Pub
lic D
iscl
osur
e A
utho
rized
Pub
lic D
iscl
osur
e A
utho
rized
Pub
lic D
iscl
osur
e A
utho
rized
Pub
lic D
iscl
osur
e A
utho
rized
Pub
lic D
iscl
osur
e A
utho
rized
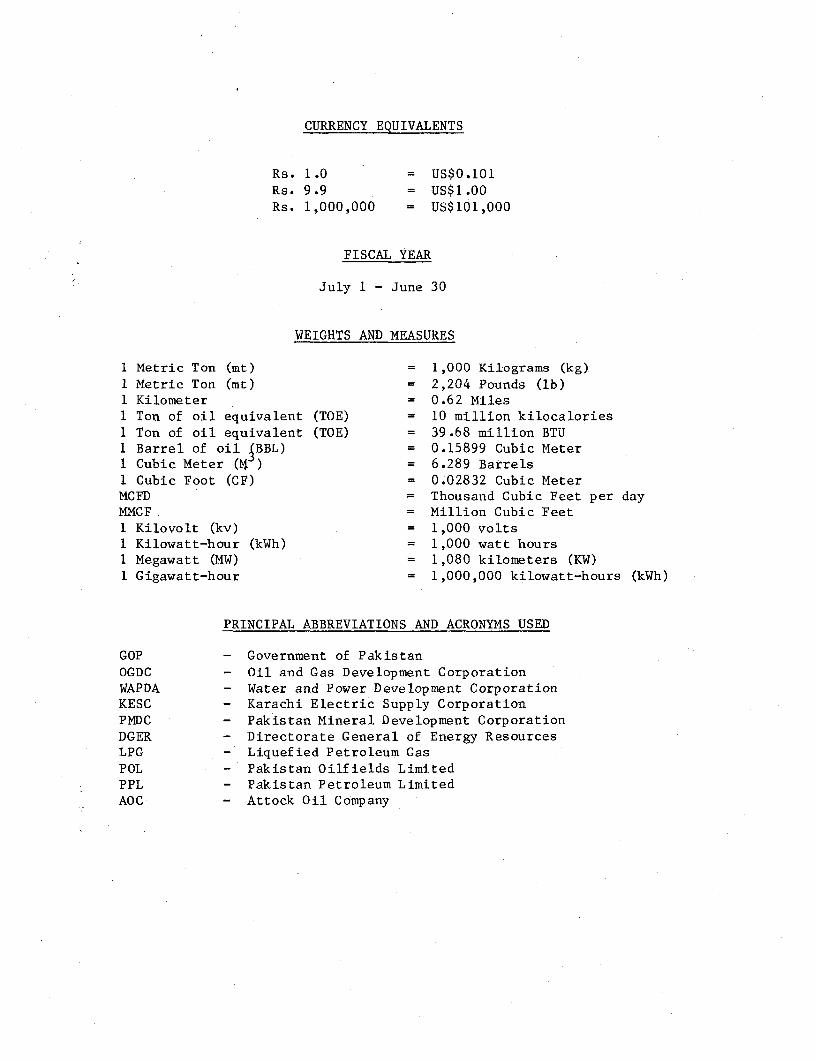
CURRENCY EQUIVALENTS
Rs. 1.0 = US$0.101Rs. 9.9 = US$1.00
Rs. 1,000,000 = US$101,000
FISCAL YEAR
July 1 - June 30
WEIGHTS AND MEASURES
1 Metric Ton (mt) = 1,000 Kilograms (kg)1 Metric Ton (mt) = 2,204 Pounds (lb)1 Kilometer = 0.62 Miles1 Ton of oil equivalent (TOE) = 10 million kilocalories1 Ton of oil equivalent (TOE) = 39.68 million BTU1 Barrel of oil NBBL) = 0.15899 Cubic Meter1 Cubic Meter (1 ) = 6.289 Barrels1 Cubic Foot (CF) = 0.02832 Cubic MeterMCFD = Thousand Cubic Feet per dayMMCF = Million Cubic Feet1 Kilovolt (kv) = 1,000 volts1 Kilowatt-hour (kWh) = 1,000 watt hours1 Megawatt (MW) = 1,080 kilometers (KW)1 Gigawatt-hour = 1,000,000 kilowatt-hours (kWh)
PRINCIPAL ABBREVIATIONS AND ACRONYMS USED
GOP - Government of PakistanOGDC - Oil and Gas Development CorporationWAPDA - Water and Power Development CorporationKESC - Karachi Electric Supply CorporationPNDC - Pakistan Mineral Development CorporationDGER - Directorate General of Energy ResourcesLPG - Liquefied Petroleum GasPOL - Pakistan Oilfields LimitedPPL - Pakistan Petroleum LimitedAOC - Attock Oil Company

PAKISTAN FOR OFFICIAL USE ONLY
ENERGY SECTOR MEMORANDUM
Table of ContentsPige No.
1. SUMMARY AND MAJOR ISSUES ... I.................. 1
Overview * ******* **........... *..................................... 1
Commercial Energy .................. . ....................... 1
Non-Commercial Energy ........ .......................... 5Sector Investment Requirements ............................ 5
Sector Issues ........ .................................... . 6
- Institutional Framework ..... ........................ . 6- Energy Pricing ...... 0....... ..................................... 6
- Other Issues ......................................... 9
2. THE EVOLUTION OF ENERGY DEMAND ............................ 10
Background ................................................... 10
Commercial Energy Consumption ............................. 11
- Consumption of Petroleum Products ... . ................. 13- Consumption of Natural Gas ....... .. .................. 15
- Consumption of Coal ................ .. ................ 15
- Consumption of Electricity ........... . .............. 16
Non-Commercial Energy ..................................... 17
- Firewood ....................................................... 17
- Bagasses .............................................. 18
- Dung Cakes ....... ............... ..................... 18
3. COMMERCIAL ENERGY SUPPLY .................................. 19
Background .... ........................................... .... 19
The Supply of Petroleum Products ........... .. ............. 19
- Crude Oil ............................................ 19
- Refined Products ..................................... 21
The Supply of Natural Gas ................................. 23The Supply of Coal ........................................ 24The Supply of Nuclear Fuels ............................... 25The Supply of Electricity ................................. 26
- Hydro Electricity .................................... 26
- Thermal Electricity . .......... .. ..................... 27- Transmission and Distribution ........................ 28
This report was prepared by Mr. Masood Ahmed, Energy Department. It incor-porates the findings of a series of missions to Pakistan made by staff of
the Energy Department and the South Asia Region during 1979 and 1980. Unlessotherwise stated, the statistics used in this report are based on data fromthe Government of Pakistan's Energy Data Book (1977) and Energy Year Book(1979).L This document has a restricted distribution and may be used by recipients only in the performance
of their official duties. Its contents may not otherwise be disclosed without World Bank authorization.

-2-
Table of Contents (Continued) Page No.
4. ENERGY PRICING, TAXES AND SUBSIDIES ....................... 29
Background ................................................ 29Petroleum Products .................. 29
- Producer Prices ...................................... 29- Ex-refinery Prices ................................... 30- Consumer Prices ...................................... 30- Fiscal Contribution of the Sector .................... 31
Natural Gas ............................................... 33
- Produder Prices ...................................... 33- Consumer Prices ...................................... 33- Taxes ................................................ 35- Liquid Petroleum Gas ................................. 35
The Power Sector .......................................... 35Coal ...................................................... 38Firewood .................................................. 38
5. ENERGY SECTOR ORGANIZATION AND INSTITUTIONS .... ........... 40
Background ................................................ 40The Hydrocarbons Sector ................................... 40
- Ministry of Petroleum and Natural Resources .... ...... 40- The Oil and Gas Development Corporation .... .......... 41- The Pakistan Mineral Development Corporation .... ..... 41- Other Organizations .................................. 42
The Power Sector ......................................... 42
- Water and Power Development Authority .... ............ 43- Karachi Electric Supply Corporation .................. 43- Others ............................................... 43
The Directorate of Energy Resources (DGER) .... ............ 43Energy Planning ........................................... 44
6. FUTURE DEMAND FOR ENERGY .................................. 45
Overview .................................................. 45The Demand for Petroleum .................................. 45The Demand for Natural Gas ................................ 47The Demand for Coal ....................................... 47Electricity Demand ........................................ 48Firewood .................................................. 49Energy Conservation and Demand Management ................. 49

- 3-
Table of Contents (Continued) Page No.
7. FUTURE ENERGY SUPPLY ...................................... 52
Overview .................................................. 52
Petroleum Supply ....... ............... .................... 53
- Crude Oil ............................................ 53- Refined Products ..................................... 53
Natural Gas Supply ........................................ 54The Supply of Electricity ................................. 54
- Generation Capacity .................................. 54- Transmission and Distribution ........................ 55
Renewable Energy Sources .................................. 56
- Biogas ............................................... 56- Micro-hydro ....... ............. .. .................... 57- Solar Energy ....... ............ .. .................... 57- Other Sources ...... ............. .. ................... 57
The Medium Term Perspective ............................... 58
8. ENERGY SECTOR INVESTMENT REQUIREMENT ...................... 59
The Power Sector .......................................... 59The Oil and Gas Sector .................................... 60
9. POTENTIAL BANK INVOLVEMENT ................................ 63
Previous Bank Group Involvement ........................... 63
Proposed Strategy ....... .................... .............. 64
-4-
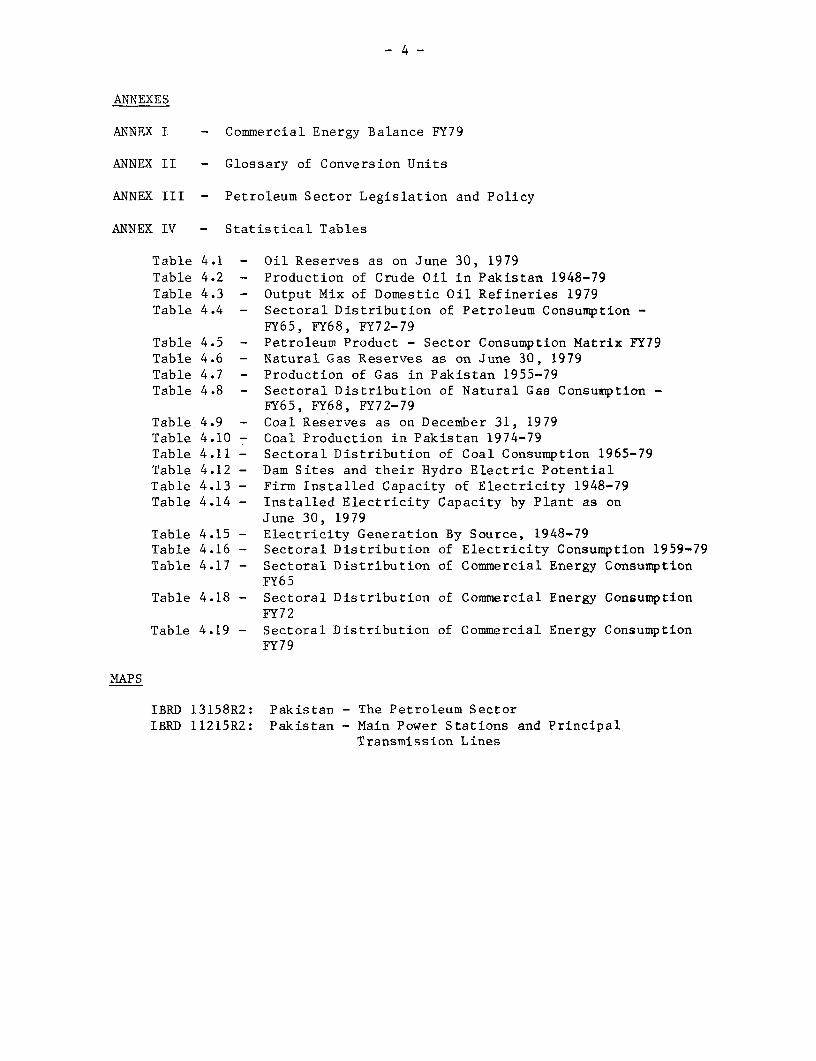
ANNEXES
ANNEX I - Commercial Energy Balance FY79
ANNEX II - Glossary of Conversion Units
ANNEX III - Petroleum Sector Legislation and Policy
ANNEX IV - Statistical Tables
Table 4.1 - Oil Reserves as on June 30, 1979Table 4.2 - Production of Crude Oil in Pakistan 1948-79Table 4.3 - Output Mix of Domestic Oil Refineries 1979Table 4.4 - Sectoral Distribution of Petroleum Consumption -
FY65, FY68, FY72-79Table 4.5 - Petroleum Product - Sector Consumption Matrix FY79Table 4.6 - Natural Gas Reserves as on June 30, 1979Table 4.7 - Production of Gas in Pakistan 1955-79Table 4.8 - Sectoral Distribution of Natural Gas Consuwption -
FY65, FY68, FY72-79Table 4.9 - Coal Reserves as on December 31, 1979Table 4.10 - Coal Production in Pakistan 1974-79Table 4.11 - Sectoral Distribution of Coal Consumption 1965-79Table 4.12 - Dam Sites and their Hydro Electric PotentialTable 4.13 - Firm Installed Capacity of Electricity 1948-79Table 4.14 - Installed Electricity Capacity by Plant as on
June 30, 1979Table 4.15 - Electricity Generation By Source, 1948-79Table 4.16 - Sectoral Distribution of Electricity Consumption 1959-79Table 4.17 - Sectoral Distribution of Commercial Energy Consumption
FY65Table 4.18 - Sectoral Distribution of Commercial Energy Consumption
FY72Table 4.19 - Sectoral Distribution of Commercial Energy Consumption
FY79
MAPS
IBRD 13158R2: Pakistan - The Petroleum SectorIBRD 11215R2: Pakistan - Main Power Stations and Principal
Transmission Lines

SUMMARY AND MAJOR ISSUES
Overview
1.01 In 1979, primary commercial energy consumption in Pakistan wasestimated at 11.3 million TOE, implying a per capita consumption levelequivalent to roughly one-tenth the world average and one-half the averagefor all developing countries. Non-commercial energy sources, mainly woodand animal or vegetable wastes, supplied an estimated additional 7.5 to8.5 million TOE, and, although their share in total energy supply has beendeclining over time, firewood remains the largest single source of energyin the country. Within the commercial energy sector, despite progressivesubstitution of petroleum products by natural gas and hydroelectric power,the main indigenous fuels, the share of petroleum in energy supply was still38 percent in 1979. And the absolute consumption of petroleum products hascontinued to grow at a fairly rapid annual rate of 5.0%. As 90 percent ofpetroleum supply is met from imports, the impact of the post-1973 increases ininternational oil prices has been particularly severe on Pakistan's balance ofpayments. The net import bill for oil and oil products has increased from $50million in FY73 to $540 million in FY79 which is equivalent to 45 percent ofthe FY79 current account deficit and a third of the value of all merchandiseexports in that year.
1.02 Further scope for substitution of oil by gas and other indigenousenergy sources is limited, as over half of total oil consumption is in thetransport sector where alternative sources cannot generally be used economi-cally. However, domestic production of oil is expected to more than doubleby 1985 and the prospects for discovering additional recoverable reserves aregood. Consequently, during the next five years, approximately half of theincrease in total petroleum consumption, projected to grow at an averageannual rate of 6 percent, can be expected to be met from increased domesticproduction. In the longer term, a reduction in the import bill, and even aperiod of self-sufficiency in petroleum supply by 1990, are possible outcomesof the recently increased level of exploration activity in the country.
1.03 Realization of this optimistic scenario will, however, require aseries of government actions aimed at strengthening the sector's existinginstitutional framework and at developing the country's energy planningcapability in order to be able to assess the huge and difficult investmentdecisions on hydro-power, nuclear energy, natural gas, coal and oil develop-ment as well as to implement an appropriate longer term energy pricing policy.Substantial foreign assistance will also be required for financing plannedinvestments in the energy sector.
Commercial Energy
1.04 Pakistan's domestic energy resources are characterized by sizablereserves of natural gas, substantial hydro potential, but only limited knownreserves of crude oil, coal, and uranium or other mineral ores which might beused as nuclear fuels. Consequently, even prior to 1973, the main thrust of

- 2 -
government policy had been to increase the share of natural gas and hydropower in meeting the country's energy requirements. Since 1973, this policyhas been pursued with renewed emphasis and the net result has been a progres-sive reduction in the share of total energy supplied by oil and coal and aconcomitant increase in the share of natural gas and hydroelectricity. Inspite of these efforts, oil and oil products remain the largest single commer-cial energy source in the country, accounting for 38 percent of total supplyin 1979, followed closely by natural gas (36%) and hydroelectricity (21%).
1.05 Other than increasing the supply of alternative fuels, the Govern-ment has also reacted to the post-1973 increases in international oil pricesby increasing domestic energy prices and by promoting domestic explorationfor oil. Consumer prices for petroleum products have been raised on severaloccasions since 1973, but this has only been partially successful in curbingdemand, because the-Government has sought to protect certain economic sectorsand lower income groups from the full impact of higher prices and has con-sequently, until very recently, continued to subsidize the consumptionof diesel (used mainly for transport) and kerosene (used for cooking andlighting by low income groups) which together account for nearly 60% oftotal petroleum consumption. This situation has been somewhat altered bythe sharp increase in petroleum product prices announced in December 1979,but relative prices for both refined petroleum products and for other fuelscontinue to exhibit a variety of distortions and their early rectificationis a major issue in the future development of the energy sector.
1.06 As a result of these pricing distortions, and because total energyconsumption in the transport and residential sectors has been growing atrates well above the national average of 7.25% per year since 1972, theconsumption of petroleum products in these sectors has also grown at ratesabove the national average of 5.0% -- in the transport sector at over 10%per year, and in the residential sector at just under 9% a year. Indeed, ithas only been possible to restrain the overall rate of growth of petroleumconsumption to the above figure because of progressive substitution awayfrom oil and largely to gas in the industrial sector and for electricitygeneration where oil consumption has declined in absolute terms at annualrates of 4% and 24%, respectively. However, further possibilities for sub-stitution in these sectors are limited, and their net impact is likely to besmall because their combined share in total petroleum consumption is alreadyless than 6%.
1.07 Recognizing that oil and oil products will continue to play animportant role in supplying the country's energy requirements for the mediumterm and that the historic policy of almost exclusive dependence on importsto meet petroleum supply will become both increasingly expensive and subjectto interruptions of supply due to external conditions, the Government hasincluded as a major element in its energy policy the promotion of domesticoil exploration and production. In 1976, legislation governing privateexploration activity was amended to provide clear-cut incentives for foreigninvestment; the lack of such incentives was a major cause of the inadequateand sporadic nature of domestic oil exploration in the 1960s. The Governmentalso began the process of strengthening the state-owned Oil and Gas Development

- 3 -
Corporation (OGDC) to enable it to act as an effective partner in jointventures with foreign companies and to implement a much expanded public sectorexploration program. The results of these initiatives have been encouraging,both in terms of the increased level of private investment in oil explorationand in the form of higher domestic crude oil production which has increased by50 percent since 1975. These developments form the basis of the overall opti-mism about Pakistan's energy situation and prospects that is one of the majorconclusions of this report. However, the full realization of the potential ofPakistan's indigenous petroleum resources continues to depend critically onimprovements in the organizational and decision making structure of the publicand semi-private petroleum sector organizations. Adequate resources and theirefficient allocation, a clearer definition of the respective roles envisagedfor the public and private sector in the national exploration program, and thedevelopment of an integrated and rationalized downstream refinery strategy areall issues which need to be urgently addressed.
1.08 Pakistan's total commercial energy requirement is projected togrow at just over 8% per year from 480 trillion BTU in FY79 to 780 trillionBTU in FY85. This estimate is based on an anticipated GDP growth rate ofabout 5.5% over this period and on an historic energy/GDP elasticity valueof 1.45 1/. The consumption of different fuels will grow at different ratesaround this average. The bulk of additional energy demand will continue tobe met from increases in the supply of natural gas and hydroelectricity andconsumption of these two energy resources is forecast to grow at approximately10% and 12% per annum, respectively. Coal and nuclear power are expected toplay a marginal role as sources of energy over the next five years althoughtheir contribution to national energy supply could increase substantially inthe latter half of this decade; and though the consumption of LiquefiedPetroleum Gas (LPG) is expected to increase rapidly, its contribution willcontinue to be small in relation to total energy supply. 2/ The consumptionof oil and oil products is expected to increase at about 6% per year over thisperiod, a rate which is below the projected rate of growth of overall energyconsumption but somewhat higher than the rate at which the consumption ofpetroleum products has been rising to date. This is a reflection of thechanged sectoral consumption pattern of petroleum products and the limitedpotential for further substitution away from oil in the short term. Thisimplies that by 1985 Pakistan will require about 6 million tons of oil and oilproducts, and to meet this demand increased amounts of crude oil will have tobe imported unless indigenous crude oil in known fields is brought intoproduction and recent discoveries are evaluated and developed rapidly.
1.09 Increasing domestic production of crude oil from its present levelof 10,500 barrels/day (0.5 million tons/year) will depend, in the short term,primarily on increased production from three known fields, Tut, Adhi andMeyal, which currently account for 85% of all domestic oil production. Onthe basis of present production levels and the estimated pace of development
1/ Between FY72 and FY79 a GDP growth rate of 5.0% was accompanied by anannual growth in total primary commercial energy consumption of 7.25%.
2/ For a discussion of the medium term options facing Pakistan in thedevelopment of its energy sector strategy, see also paras. 7.22-24.

-4 -
drilling activity, the annual production of indigenous crude oil from dis-covered fields is conservatively projected to increase to about 1.6 milliontons in 1985, which would be sufficient to meet over half the projectedincrease in petroleum demands over this period and would reduce Pakistan'snet oil import bill in that year by an estimated $225 million in 1980 prices.
1.10 Further reductions in the oil import requirement could result fromproduction at one other field at Dhodak which has yet to be fully appraisedbut where results to date have been promising. However, Pakistan's continuingdependency on imported crude oil will be critically determined by the successof current exploration activity being undertaken by foreign explorationcompanies and the OGDC. Estimates of the extent of Pakistan's oil reservesvary widely, partly due to the slow pace of exploration activity over the pasttwenty years, with Government estimates being a high 184 million barrels (25million tons). 1/ However, the success rate so far for oil and gas explorationactivity has been good. Given the expected increase in exploration activityand a modest degree of success, substantial inroads can be expected to be madeinto the country's oil import bill in the late 1980s.
1.11 The supply of other primary energy sources is also projected toincrease. Natural gas production has been increasing rapidly and with thecommissioning of additional processing and transmission facilities is expectedto continue to do so. Total proven remaining 'recoverable' reserves areestimated at 15.9 trillion cubic feet (286 million TOE) which would meetforeseeable internal demand until the end of this century. This figure wouldincrease by the extent of the reserves proven at Dhodak and Pirkoh which arestill being subjected to detailed geological examination.
1.12 Pakistan's hydro potential is estimated at about 20,000 MW but itsdevelopment is hampered by geographic problems of distance from load centres,difficult terrain and by seasonal variation and silting in the major rivers.With the full development of the Tarbela, Mangla and Warsak projects by 1985,installed hydro capacity will increase from the current level of 1,567 MW to3,300 MW, leaving considerable room for further expansion as demand grows.The Government is also working on developing an indigenous hydro technologybased on simple design and low costs that could make numerous micro-hydrosites in the 100-200 KW range economic and affordable.
1.13 Although the contribution of coal to national energy supply hashistorically been declining and only small increases in the supply of coalare projected for the immediate future, the potential for exploiting thisindigenous resource is large. Pakistan's coal reserves have *not been ade-quately delineated and the proven reserves figure (100 million tons) isexpected to amount for only a small fraction (about 10-15%) of the remainingrecoverable reserves. In spite of their largely poor quality these reserveshave the potential for use in electric power generation and further work isurgently required to develop an integrated national strategy for theirexploitation.
1/ This excludes an estimated additional 200 million barrels at Dhodak,
which have yet to be proven.

-5-
Non-Commercial Energy
1.14 Non-commercial energy sources have traditionally supplied more thanhalf of the country's total energy requirements and currently account foran estimated 40 percent of them. However, data on their consumption by fueltype or sector of use are inevitably sparse. In 1974/75 national con-sumption of non-commercial fuels was estimated at 7.4 million TOE, of whichfirewood (54%), dungcakes (16%) and bagasses (17%) were the major sources.In the case of firewood, nearly all of the total consumption of 11 milliontons was met through the unregulated use of trees and shrubs outside theofficially classified forestry areas. The damaging effects of this large-scale deforestation have not been documented but they urgently need furtherstudy and attention. Non-commercial fuel consumption is primarily forresidential use (80%), with bagasses being the only fuel consumed principallyfor industrial energy in sugar processing. Non-commercial fuels will continueto meet a large part of the energy needs of rural households in the future,although their consumption is expected to continue growing at a slower pacethan commercial energy consumption. The government has recently been analyz-ing and experimenting with the more productive utilization of existing fuels,such as animal dung for biogas generation, and with the potential for non-conventional energy sources, including the development of geothermal, solarand wind energy. A hundred demonstration biogas plants are being set upthroughout the country and the technical and economic feasibility of usingwind and solar energy for cooking and pumping water in rural areas is beingtested. Although many of these developments are as yet at an exploratorystage and unlikely to have a significant impact on the overall energy picturein the near future, the potential savings from more efficient utilization offirewood for residential use are large and the prospects for biogas generatingplants are promising.
Sector Investment Requirements
1.15 The development of indigenous energy resources will require large-scale investment in this sector and the government has recognized this byallocating Rs 33.5 billion (US$ 3.4 billion) for investments in the energysector during the Fifth Plan Period (FY79-83). This is equivalent to 22% ofall public investment during this period, a proportion which is substantiallyhigher than in previous years and well above the average for developingcountries as a whole (15%). The bulk of this planned investment (87%) will befor the development of the power sector, but Rs 5.6 billion (US$570 million)would be spent on developing oil and gas, with about Rs 4 billion earmarkedfor investment in exploration and development by the Oil and Gas DevelopmentCorporation. Private sector investment in the exploration and development ofdomestic oil and gas resources is expected to total about $150 million overthe Plan Period, which is markedly higher than in the past but still repre-sents a modest effort in relation to the costs associated with what wouldconstitute an adequate programme for the development of indigenous hydrocarbonenergy resources.

-6-
Sector Issues
1.16 Considerable progress has been made since 1973 in improving andstrengthening the institutional framework of the energy sector, in raisingenergy prices to reflect real opportunity costs, in developing and promotingdomestic oil exploration and production and in analyzing and experimentingwith the more efficient utilization of traditional energy sources (such asbiogas from animal manure) and the application of new ones such as solar ormicro-hydro energy. Nevertheless, if the optimistic energy outlook envisagedin this report is to be realized, the Government will have to take steps todevelop a national energy planning capability, rectify a series of anomalies(particularly with regard to relative energy pricing) and further strengtheninstitutions in the hydrocarbon sector as well as in the power sector and thefield of renewable energy development. Some of these issues are summarizedbelow. 1/
Institutional Framework
1.17 In the oil and gas sector, some institutional strengthening hasalready taken place and OGDC is now being developed as a commercially-orientedinstitution (5.04, 8.06) with overall guidance and support being provided bythe Ministry of Petroleum and Natural Resources (5.03). Nevertheless, thereis a need to ensure that this momentum is not dissipated through shortagesof either trained personnel or adequate funding. Competent technical staffrequired for exploration and drilling, for whom a buoyant market exists in theGulf States, have been difficult to find and to keep and it is important thattheir remuneration package reflects market conditions of supply and demand.It is also important that OGDC continue to adopt modern management techniquesand consider the functional separation of its operational activities from theother responsibilities it has to discharge in its capacity as a national oilcompany (5.04). The Government should also consider the clearer definitionof the respective roles envisaged for the public, semi-private and privatesectors in the petroleum exploration and development field.
1.18 The development of coal resources will also depend criticallyon institutional strengthening and the formulation of an integrated nationalcoal policy. The Pakistan Mineral Development Corporation is well run andhas qualified and experienced technical staff, but its influence is limitedto the small share of coal produced by the public sector (20%). A mechanismwill have to be developed for providing technical assistance and extensionservices in modern mining techniques to the numerous small private mineoperators which supply the bulk of the country's coal requirements, if thefull potential of the country's coal resources is to be realized.
1.19 In the power sector, a rationalization of the existing institutionalframework is required to enable the sector to cope with the demands that willbe made upon it in the 1980's. After 1982, the country will have an inte-grated national power network which should be planned for as a whole (7.12);
1/ For a more detailed discussion of these issues, see paragraph referredto in parentheses.

-7-
yet WAPDA and KESC,the main power generating authorities, continue to plan fortheir own systems largely independently of each other (6.19). Furthermore,the methodology used for demand forecasting and the short time horizon overwhich these forecasts are made, precludes them being used as a basis forplanning the scope and timing of power capacity expansion plans (6.19). Thereis an urgent need to strengthen the planning function in the power sector andto decide on where a national power planning unit should be located.
1.20 A number of government and autonomous bodies have been involved withthe development of renewable energy resources (7.17-20) which is perhaps asit should have been in the initial stages of analysis and experimentation.However, there now exists a need for the Government to take stock of thework that has been done in this field, to identify the most promising avenuesfor further analysis and to allocate funds for the development of renewableresources in accordance with these priorities (7.22).
1.21 Finally the absence of a well defined energy planning organizationthat could coordinate the investment, pricing and conservation policies ofthe different energy subsectors has posed a serious problem in the past(5.15). The Government has recently taken steps to rectify this by appointinga high level inter-ministerial committee, chaired by the Minister of Finance,to develop and recommend policies for energy development and utilization.However, it will require continued Government attention and support to ensurethat the secretariat for this committee is adequately staffed and funded toenable the effective build-up of a national energy planning capability (5.16).
Energy Pricing
1.22 In spite of recent Government action to increase domestic energyprices and rationalize their structure, there remains a need to develop along-term pricing policy which, within the Government's broader objectives,provides adequate incentives to developing existing hydrocarbon resources inan optimal manner, reflects more precisely the economic costs of bringingenergy products to the consumer, and establishes interfuel price relationshipsmore closely on the basis of the opportunity cost of competing fuels.
1.23 In particular, in the oil and gas sector the following pricingissues deserve consideration:
(i) The wellhead price of natural gas is too low to provide anyincentives for new exploration. Gas exploration outside theOGDC has now come to a standstill and although proven reservesare high, this issue may require examination in the near futureif additional reserves are to be developed (4.12).
(ii) Ex-refinery prices of petroleum products have historically beentoo low to provide revenues adequate to cover operating costsof the country's two principal refineries, and the presentsystem, whereby the Government reimburses the refineries'operating shortfall, does not encourage improved operatingefficiency. Although the recent increase in ex-refinery prices

-8 -
has rectified this problem it is important to ensure that
future increases in refinery costs are translated rapidlyinto the structure of ex-refinery prices (4.05).
(iii) Consumer prices for some petroleum products (such askerosene) and for natural gas in some consuming sectors(such as for households and cement production) have beenkept at or below import parity opportunity costs whileother products (such as gasoline) have been traditionallypriced at much higher levels. The prevalence of crosssubsidies has aggravated imbalances in the demand for lightand middle distillates in the petroleum sector which haveto be met by the import/export of refined products whichis costly in terms of storage, transport and handling(4.06).
(iv) Finally, the pricing of Liquified Petroleum Gas (LPG),which is a potential substitute for kerosene, gasolineand diesel, requires close attention. At present, LPG ispriced at a higher level than either of these products,but given the expected increases in LPG supply, projectedto grow to 250,000 tons by 1985, consideration should begiven to encouraging its substitution for diesel, gasolineand kerosene which already have to be imported in refinedform to meet high and rapidly increasing domestic consump-tion levels (4.15). This could be done by lowering LPGprices while raising the price of its substitutes.
1.24 In the power sector, the current tariff structure is complex anddistorted. Energy and minimum charges are generally not directly related tothe costs of supplying electricity to consumers. In particular, capacity orKW charges are well below long-run marginal costs and low voltage consumersare charged significantly below the cost of supply (4.16). The Governmenthas recognized the extent and seriousness of these distortions and has commis-sioned a study in collaboration with the Bank, to prepare a revised tariffstructure for the power sector. This study has now been completed and itrecommends a series of changes to the existing power tariff which would bothraise average costs and restructure individual tariffs to correspond moreclosely to the marginal costs of supply to different consumer categories(4.17).
1.25 A number of other issues also exist with regard to power sectorpricing. Capacity charges in industry would still be well below supply costsand should be raised in subsequent tariff revisions (4.17), and the questionof the treatment of losses in tariff calculations (4.18), the economic valueof natural gas used in thermal electricity generation (4.19), the questionof uniform national tariffs and the implications for cross subsidization ofdifferent consumer groups and regions (4.20) and the present policy withregard to connection charges (4.21) need to be examined further.

-9-
Other Issues
1.26 A related issue in the power sector is the high and increasingpercentage of system losses (including losses through the theft of power)which now amount to a third of total electricity generation. The governmenthas now embarked on a large program of extension and reinforcement for itssecondary transmission network, which should help reduce these losses to about25% of total generation in FY85, but this will require continued governmentattention.
1.27 In the case of refined petroleum product consumption, the long termimplications of the continued divergence between, the structure of demand andthe output mix of domestic refineries, which has been caused in part by theGovernment's historical demand management and relative pricing policies, needsto be critically assessed; in particular, with regard to the strategy to beadopted for the expansion of domestic refinery capacity (3.08, 4.07, 7.07).
1.28 Finally, the Government should now take steps to capture the momentumgenerated by its effective media campaign for energy conservation and toensure that the efficiency of energy utilization, particularly in the indus-trial and residential sectors, is improved to reflect higher energy costs.The commercial energy/ GDP coefficient for the period 1973-79 is still high(1.45) and reductions in its value would have important benefits in terms ofrelaxing the tight balance of payments situation that will be the majorconstraint to Pakistan's economic development in the 1980's (6.16-20). 1/
1/ See Pakistan Economic Development and Prospects, (1980, Bank report).

- 10 -
THE EVOLUTION OF ENERGY DEMAND
Background
2.01 In 1948, the first year after Pakistan's independence, per capitaenergy consumption in the country was estimated at 0.1 TOE, of which only 30percent was met from commercial energy sources, mainly coal and oil. By 1979this picture had altered dramatically. Energy consumption per capita hadincreased to 0.25 TOE and the share of commercial energy sources doubled to60 percent of this total. Commercial energy consumption had therefore risenat a much more rapid rate, more than quadrupling in per capita terms from 0.03TOE to 0.14 TOE and registering an eleven fold increase in absolute termsfrom 0.95 million TOE to 11.3 million TOE over the same period. In spite ofthis rapid growth, commercial energy consumption in Pakistan is still low byinternational standards, with per capita consumption levels in 1977 beingestimated at approximately one-tenth the world average and one-half theaverage for all developing countries.
2.02 Notwithstanding the marked reduction in the share of total energysupplied by non-commercial fuels, firewood remained, in 1979, the single mostimportant energy source contributing over half of non-commercial energy supplyand about 23% of total energy supply; just ahead of the contribution of themost important commercial energy source -- petroleum (22%); and the mainindigenous commercial fuel, natural gas (21%). The remaining 34% was suppliedby hydroenergy (12%) and coal (3%) in the commercial sector, and bagasses(7%), animal manure (7%) and a variety of other non-commercial fuels based onvegetable residues.
2.03 The major energy consuming sectors in 1979 were residential demandfor cooking and lighting (44%), followed by industry (34%) and transport(12%). However, this overall consumption pattern subsumes two very differentpictures of energy consumption once commercial and non-commercial energysources are separated. The household sector derives three-quarters of itsenergy from non-commercial fuels and is in turn responsible for over 80% ofall non commercial energy consumption, but accounts for less than 20% of theconsumption of commercial energy sources. On the other hand, the industrialsector gets over three quarters of its energy from commercial energy sourcesand is responsible for about 45% of their consumption, but of less than 20% ofthe consumption of non-commercial fuels. The other major sectors only consumecommercial fuels and consequently their shares in commercial energy consump-tion far exceed the proportion of total energy which they consume.
2.04 The existence of these differences, the fact that the data on non-commercial energy supply and consumption in Pakistan are both more sparse andless reliable, and the fact that the difficulties of aggregating energyconsumption from different sources without making allowances for differencesin the end use efficiency of consumption for different fuels in differentsectors, are compounded when non-commercial energy sources, such as bagassesand dung cakes, are included with commercial hydrocarbons, suggests that anexamination of the disaggregated demand pattern for commercial and non-commercial energy sources separately may prove more instructive.

- 11 -
Commercial Energy Consumption
2.05 The growth in commercial energy consumption in Pakistan can be attri-buted to three major factors. First, the diversification of the Pakistanieconomy from being almost entirely agrarian to one where nearly two-thirdsof GDP and 45% of total employment is generated outside the agriculturalsector in more energy intensive activities. Second, within the agriculturalsector, although the overall intensity of commercial energy consumptionremained low -- this sector was responsible for the production of two-thirdsof national output but only 10 percent of national commercial energy con-sumption in 1979 - increases in output over the past two decades have beenclosely associated with energy intensive mechanization and artificial irriga-tion. The incremental commercial energy consumption/output growth ratio inthis sector has averaged 2.3 over the period FY65-79 - well above thecorresponding value for any other sector. 1/ Finally, the increasing urban-ization of the economy, with the share of urban population increasing from18% in 1951 to 27% in 1977, has resulted in reduced access to traditional,non commercial sources of energy and caused a more rapid rate of growth ofcommercial energy consumption than would have been implied by rising realincomes alone.
2.06 Increases in the overall level of commercial energy demand havebeen accompanied by changes in the sectoral composition of that demand.The household sector has steadily increased its share in total commercialenergy consumption because of the factors listed above; but the growthof consumption in the other sectors has been more varied. Between 1965and 1972, the shares of industry and agriculture in total commercial energyconsumption increased, largely because output in these sectors was growingat rapid rates. Since FY72, however, economic growth in Pakistan has beenslowed down by political and industrial unrest which adversely affectedindustrial output, investment and productivity, and by droughts, floodingand other problems which have reduced agricultural output growth. Onemanifestation of these troubles has been slower growth in commercial energyconsumption in these sectors, and a consequent decline of their shares inthe total.
1/ The corresponding values for the industrial and transport sectors are1.3 and 1.6, respectively. However, these estimates should be treated asindicative of broad orders of magnitude only because of the broad natureof sectoral classification and the consequent variety of activitieswithin each sector, and because of the progressive reallocation of energyconsumption over time from "other or unallocated" to the consumingsectors as data collection and analysis improved, which may have affectedthe estimated rate of growth of energy consumption in different sectorsdisproportionately. Nevertheless, the Revised Action Program for Agri-culture and Water Resources Development carried out by WAPDA, withUNDP and Bank assistance, brings out the high capital intensity ofPakistan's agricultural development and strategy. More emphasis offimproved agriculture practices, including water management, would makePakistan's agricultural development somewhat less energy intensive.

- 12 -
Table 2.1
Percentage Distribution of Commercial Energy Consumption
Average Annual Growth RateSector FY65 FY72 FY79 1965-72 1972-79
Industrial and Commercial 43 47 44 8.5 5.3Agricultural 8 11 9 11.5 5.0Transport 17 17 21 6.3 10.4Residential 10 11 18 7.6 14.7Govt./Other 22 14 8 -0.5 -0.1
TOTAL 100 100 100 6.6 7.25
Notes: (1) Percentage share of each sector includes both direct consump-tion of primary energy and prorated share of energy consumedthrough electricity generation.
(2) Hydro and nuclear energy converted at 12,000 BTU/kWh toapproximate heat rate of thermal generation.
(3) Excludes use of gas as feedstock in fertilizer production.
(4) In view of the high proportion of "other" or unallocatedconsumption in the figures for the earlier years and thepossible reallocation of consumption to other sectors withimproved data collection, the sectoral growth rates forenergy consumption in the sixties should be treated asindicative of orders of magnitude only.
2.07 In spite of these problems, total commercial energy consumptionhas continued to grow at a higher rate (7.25%) in the seven years since1972 than it had done in the preceding seven years. This is partlybecause the last two years, FY78-79, have seen a revival of industrialand agricultural activity which has offset, to some extent, the somewhatlackluster performance of earlier years, and partly because incomes in theresidential sector and output in the transport sector have continued togrow rapidly and resulted in rapid growth in energy consumption in thesesectors.
2.08 One of the implications of these changes in the intersectoralpattern of commercial energy consumption, has been that commercial energy/GDPelasticity for the economy as a whole has remained at a relatively high levelin the seventies in spite of the manifold increases in world energy prices. 1/
1/ This is partly the result of the Government's domestic pricing policywhich has entailed domestic energy prices being raised only gradually tointernational levels and whose impact on curbing energy demand in thisperiod has, therefore, been limited (See Chapter 4 below).

- 13 -
Between FY72 and FY79 an annual average GDP growth rate of about 5.0% has beenassociated with a 7.25% growth rate for commercial energy consumption whichresults in an uncompensated energy output elasticity estimate of 1.45 for thisperiod, a figure which is marginally higher than the corresponding value forthe previous seven years (1.36). Although this figure is not unreasonablyhigh for a country at Pakistan's stage of economic development, the fact thatno reduction in the value has been made to reflect the changed world energysituation suggests that improvements in energy utilization efficiency andmeasures to conserve energy could play an important role in the Government'sdemand management policies in the eighties. 1/
2.09 Changes in the intersectoral energy consumption pattern have alsohad an important effect on the demand pattern for different commercial fuels.The transport sector relies almost exclusively on petroleum products forenergy, whereas industry relies mainly on natural gas (48%) and electricity
(34%). Agricultural energy consumption derives primarily from electricity(75%) but also from oil (25%); and the household sector relies on electricity(46%), oil (37%) and gas (15%). As a result of these differences, the patternof demand for the four major fuels -- petroleum, natural gas, coal andelectricity -- has evolved along different lines.
Consumption of Petroleum Products
2.10 Between FY65 and FY79 the total consumption of petroleum products inPakistan increased from 2.1 to 3.9 million metric tons per annum. As thefollowing figures show, this overall increase was accompanied by a substantialreallocation of petroleum consumption across sectors.
Table 2.2
Sectoral Distribution of Petroleum Consumption in Pakistan(percent)
TotalAgri- Other/ Consumption
Year Domestic Industry culture Transport Power Govt. (000 Tons)FY65 11.6 13.7 6.5 35.9 1.2 31.5 2106.7FY72 13.7 9.6 10.3 40.1 3.6 22.7 2782.5FY79 17.4 5.2 6.0 57.4 0.4 13.6 3890.7
Annual Average Growth Rate: (%)
FY65-72 7.0 -1.0 11.2 6.1 21.0 -0.7 4.1FY72-79 8.7 -3.9 -2.9 10.4 -23.7 -2.7 5.0-------------------------------------------------------------------- __-------__------
1/ In Thailand, for example, the value of the commercial energy/GDP coeffi-cient has been successfully reduced from 2.06 in the period 1968-73,to 1.08 for the five year period thereafter.

- 14 -
2.11 The main trends to note here are the absolute decline in industrialoil consumption even prior to the 1973 oil crisis; the continued increasein petroleum consumption in the transport and residential sectors wherehigher oil prices in the seventies have not stopped oil consumption fromincreasing proportionately more than in the previous decade; and, the reversalof earlier trends in the agricultural and power sectors where consumptionlevels have been sharply reduced in the seventies. An important featureof the current sectoral consumption pattern is that the transport sector --where interfuel substitution possibilities are more limited -- accounts forover half of total consumption, and household demand -- largely kerosene forcooking and lighting purposes -- for another 18 percent. Oil consumptionin industry, agriculture and for power generation is already small and thepotential savings from curbing demand in these sectors are limited. Thisfactor has an important bearing on the appropriate demand management policiesthat the Government can adopt, and it also affects the structure and growthof demand for the various petroleum products.
Table 2.3
Demand for Petroleum Products
Percentage Share and Historic Growth Rates
Share of FY79 Average Annual Growth RateProduct Consumption FY65-72 FY72-79
Aviation fuels 8.6 9.3 8.5Gasoline - regular 10.1 ] 4.6 5.8
- premium 2.9 T 11.6Diesel - light 6.3 ] -2.6
high speed 40.6 8.5 9.7Kerosene 17.8 5.9 7.4Fuel Oil 13.7 -.0.5 -4.5
TOTAL 100.0 4.1 5.0
2.12 Kerosene and high speed diesel, two products which together accountfor 60 percent of all petroleum consumption, have also been experiencing veryrapid rates of demand growth, which is partly a result of the price subsidi-zation of these products. Whereas some justifications for such a policyexist, insofar as kerosene is used mostly for cooking and heating by rural andpoorer urban households which do not have access to natural gas or electricity,and diesel is the predominant fuel for public transport, the continuationof these marked diversities in product demand growth has major implicationsfor the operation of domestic refining capacity, especially if the demandfor fuel oil continues to decline in the future. 1/
1/ See also paras. 3.08, 4.07, 7.06.

- 15 -
Consumption of Natural Gas
2.13 The consumption of natural gas, the main indigenous fuel inPakistan, has increased rapidly from a low initial figure of 9 MMCFD in1955 to 510 MMCFD in FY79. Natural gas is used principally for thermalelectricity generation and as an industrial fuel, but a fifth of total gasconsumption is as feedstock for the fertilizer industry. The evolution ofthe current sectoral pattern and associated historical growth rates arepresented below.
Table 2.4
Sectoral Distribution of Gas Consumption in Pakistan
Sector Percentage Consumption Annual Average Growth Ratein FY79 FY65-72 FY72-79
Residential 6.50 27.5 27.0Commercial 3.25 18.3 17.0Industry 48.23 13.2 7.8Power 29.19 8.3 1.3All Energy (87.18) 10.8 7.4Fertilizer Feedstock 12.82 38.5 8.6
Total Consumption 186.15 12.4 7.6(billion cu. feet)
2.14 Continued rapid growth in gas consumption by the residential andcommercial sectors has significantly increased their share but they stillaccount for less than 10 percent of total consumption. The use of gas asfeedstock in the fertilizer industry has also increased at an above-averagerate and has resulted in total gas consumption rising at a higher rate thanits use as a source of energy.
Consumption of Coal
2.15 Recorded coal consumption in Pakistan has remained roughly constantat about 1.3 million tons since 1965 and consequently its importance as anational energy source has declined considerably. 1/ Prior to the availabilityof gas and the use of diesel powered locomotives, the major users of coal werethermal electricity generation plants, the railway, and the fertilizer, cementand brickmaking industries. Currently, its use is restricted largely to thebrickmaking industry in areas where natural gas is not available, with smallamounts being used for power generation and by households for cooking andheating. The sectoral consumption pattern for coal is presented below.
1/ Official records may understate actual consumption because of unreplortedproduction of coal from some small private mines. Preliminary resultsof a survey recently carried out by the PMDC suggest that actual totalcoal consumption in the country may be the order of 1.8 million tonsper year. However, this does not alter significantly the share oftotal energy supplied from coal.

- 16 -
Table 2.5
Sectoral Distribution of Coal ConsumptionAnnual Average Growth
Precentage Share in: Rates 1965-79Sector 1965 1971 1978-9 %
Brick kilns 70.1 75.2 94.4 + 2.3Power 12.0 9.5 2.3 -10.5Domestic 2.5 2.2 2.4 - 0.3Other 1/ 15.4 13.1 1.0 -17.5
Total (000 tons) 1251.3 1417.6 1386.8 0.0
Consumption of Electricity
2.16 Electricity consumption has been increasing at about 10% a yearsince 1965 and is currently estimated at about 9 billion kWh. 2/ Industrialand agricultural electricity consumption accounts for 60% of the total buthousehold demand, which has been growing at one and a half times the averagerate, now accounts for a quarter of total consumption and this share isprojected to increase in the future. Sectoral consumption growth rates inthe seventies differ markedly from those of earlier years. The growth ratefor household electricity consumption has doubled, but for the industrialand agricultural sectors, which had been growing at above-average rates inthe sixties, consumption growth rates in this decade have fallen sharply toreflect their slower overall output growth.
Table 2.6
Sectoral Distribution of Electricity Consumption
Annual Average Growth RatePercentage Distribution (%)
Sector FY65 FY72 FY79 FY65-72 FY72-79
Residential 13.5 12.2 23.3 9.8 18.6Commercial 5.3 7.1 7.4 16.6 8.6Industrial 52.4 53.4 39.7 12.2 3.3Agriculture 17.4 18.6 20.1 13.0 8.8Street Lighting 1.0 0.6 1.4 4.1 18.6Bulk and others 10.4 8.1 8.1 8.0 7.6
Total Million kWh 2437.9 5332.8 8976.9 11.8 7.7
1/ Much of the consumption in the "other" category for the earlier years wasfor the railways which were coal-fueled in that period. More disaggregatedconsumption data for those years are not available.
2/ Based on number of units sold; excludes power theft estimated at about1.5 billion kWh.

- 17 -
Non-Commercial Energy
2.17 Although non-commercial energy sources have traditionally suppliedmore than half of the country's total energy requirements and currentlyaccount for an estimated 40% of them, data on their consumption by type offuel or sector of use are inevitably sparse. The most comprehensive bodyof data derives from a survey done in 1974-5 by the Energy Resources Cellof GOP which covered 18,300 households and 4,960 shops and workshops. Theresults of this survey showed that an estimated 7.43 million TOE of non-commercial fuels were used in the country during FY75. Over 80 percent ofthis consumption was for residential use, industrial consumption beinglimited to firewood (largely for tobacco curing) and bagasses (used as fuelin the sugar industry). About 17% of the total consumption of non-commercialfuels was in urban areas.
Table 2.8
Consumption of Non-Commercial Fuels 1974-75Percentage Consumed In Total Consumption BTU9 %
Fuel Residential Commercial Industrial (000 tons) xlO Share
Dung cakes 100 - - 5535 95800 15.5Firewood 96 3 1 10923 159808 54.2Charcoal 37 63 - 41 767 0.3Bagasses 5 - 95 2922 48596 16.5Cotton sticks 100 - - 1580 18808 6.4Sawdust 100 - - 146 3807 1.3Shrubs 100 - - 1579 16473 5.6Weeds 100 - - 61 845 0.3Tobacco sticks 100 - - 13 138 0.1
TOTAL 82 1.85 16.01 - 295042 100
Source: Energy Resources Cell, Government of Pakistan.
Firewood
2.18 Over half of all energy derived from non-commercial sources isfrom firewood, and this makes firewood the single most important indigenousenergy source in terms of both commercial and non-commercial energy. Onthe basis of data collected by the Goverment, the production of firewoodfrom registered plantations was 120,000 tons in FY75, only a minute fractionof total consumption which was estimated by the ERC survey to be about 11million tons in that year. The implications of this disparity are serious.Although recorded forest areas (8.8 million ha) represent about 10% of theland area of the country, most are range lands and unproductive scrub forests.The productive forests mainly comprise scattered mountain coniferous forestsin the north of the country, totalling some 1.8 million ha. Development oftimber production in these forests has been severely constrained by thedifficult topography, inaccessibility, the need to protect the watersheds,
- 18 -
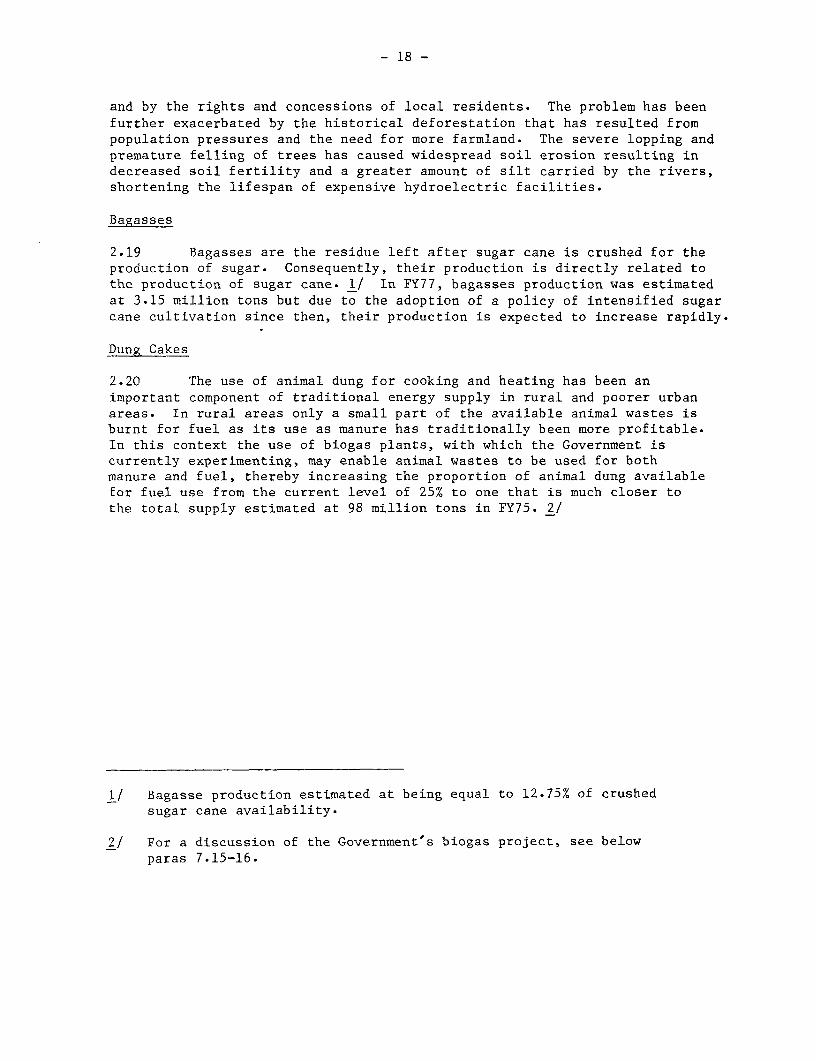
and by the rights and concessions of local residents. The problem has beenfurther exacerbated by the historical deforestation that has resulted frompopulation pressures and the need for more farmland. The severe lopping andpremature felling of trees has caused widespread soil erosion resulting indecreased soil fertility and a greater amount of silt carried by the rivers,shortening the lifespan of expensive hydroelectric facilities.
Bagasses
2.19 Bagasses are the residue left after sugar cane is crushed for theproduction of sugar. Consequently, their production is directly related tothe production of sugar cane. 1/ In FY77, bagasses production was estimatedat 3.15 million tons but due to the adoption of a policy of intensified sugarcane cultivation since then, their production is expected to increase rapidly.
Dung Cakes
2.20 The use of animal dung for cooking and heating has been animportant component of traditional energy supply in rural and poorer urbanareas. In rural areas only a small part of the available animal wastes isburnt for fuel as its use as manure has traditionally been more profitable.In this context the use of biogas plants, with which the Government iscurrently experimenting, may enable animal wastes to be used for bothmanure and fuel, thereby increasing the proportion of animal dung availablefor fuel use from the current level of 25% to one that is much closer tothe total supply estimated at 98 million tons in FY75. 2/
1/ Bagasse production estimated at being equal to 12.75% of crushedsugar cane availability.
2! For a discussion of the Government's biogas project, see belowparas 7.15-16.

- 19 -
COMMERCIAL ENERGY SUPPLY
Background
3.01 Pakistan's domestic energy resources are relatively unusual inbeing characterized by sizeable reserves of natural gas, substantial hydropotential but only limited known reserves of crude oil, coal, and uranium orother mineral ores which might be used as nuclear fuels. Consequently, evenprior to 1973, the main thrust of government policy had been to increase theshare of natural gas and hydro power in meeting the country's energy require-ments. Since 1973, this policy has been pursued with renewed emphasis, andwith the modification that the government has also taken measures to step upthe level of domestic exploration for oil in an attempt to reduce its depend-ance on imported energy sources. This is particularly important in view ofthe fact that in spite of a progressive reduction in the share of totalcommercial energy that is supplied by oil, oil and oil products still remainthe largest single source of commercial energy supply in Pakistan -- account-ing for 38 percent of the total supply in FY79.
Table 3.1
Commercial Energy Supply by Source
Annual Average GrowthPercentage of Total Supply Rates (%)
Source FY65 FY72 FY79 FY65-72 FY72-79
Petroleum Products 49 42 38 4.2 5.8Natural Gas 1/ 26 35 36 11.2 7.6Coal 16 8 5.5 -3.5 0.1Hydroelectricity 9 15 21 15.2 12.2LPG 0 2/ 0.3 n.a. 36.0Nuclear 0 0.4 0.2 n.a. 0.0TOTAL 100 100 100 6.6 7.3
1/ Excludes non-energy use of gas as feedstock for fertilizer.
2/ Less than 0.1%.
The Supply of Petroleum Products
3.02 Crude Oil. Historically the supply of crude oil in Pakistan hasbeen characterized by an almost exclusive reliance on imports. In FY79,domestic crude production at 0.51 million tons accounted for about 12 percentof the total crude requirements of domestic refineries. Even this level hadbeen reached after a sharp reversal of earlier trends which had resulted indomestic crude production steadily falling from 460,000 tons in 1965 to325,000 tons in FY75.

- 20 -
3.03 The low level of crude oil production is attributable mainly to theinadequacy of domestic exploration activity in the thirty year period priorto 1977, which was itself a function of the relatively low level of inter-national oil prices prior to 1973 and the lack of adequate incentives for oiland gas exploration provided by the Government. In the 30 years from 1947 to1977 only 160 exploration and development wells were drilled in Pakistan byforeign oil companies, and a further 20 by the state owned Oil and Gas Devel-opment Corporation (OGDC). Furthermore, the pace of exploration activity hasbeen uneven. Exploration activity by foreign companies reached a peak in1958 (following discoveries of large gas reserves at Sui) but fell sharplyagain from 1960 onwards. During the 1960s most of the exploratory drillingwas carried out by OGDC, but with only limited success in detecting increasedreserves of crude oil.
3.04 However, the changed economics of oil exploration since 1973 meanthat increased domestic oil exploration in Pakistan has become more impor-tant and more viable. The country's geological structure, though complex andvaried, is in many respects similar to that of Iran and Iraq where substantialoil pools have been discovered, and 80 percent of its total land area of310,000 square miles is characterized by sedimentary basins which have thepotential for generating and accumulating hydrocarbons. Further substantia-tion is provided by the relatively high success rate enjoyed by whateverexploration activity there has been in Pakistan. One in six wildcat wellsdrilled in the country has had significant hydrocarbon shows, compared toa world average of one in ten. Estimates of total oil reserves vary widelyand are not well determined. The Government has estimated remaining recover-able reserves to be in the order of 184 million barrels (25 million tons), butthe proving up of estimated reserves at Dhodak would increase this figure to384 million barrels (52 million tons). 1/ Although these reserves are smallby international standards, they would still satisfy Pakistan's own consump-tion requirements for well over a decade.
3.05 The government has recognized the need to stimulate privateexploration activity in the petroleum sector as a vital component of itsstrategy for increased domestic oil production and, to this end, in 1976it amended the legislation governing the petroleum sector to provide theclear cut incentives which had hitherto been lacking. 2/ This amendmentdefined the tax and oil pricing basis on which production sharing agreementscould be negotiated, and provided for further incentives by limiting themaximum share of government in gross profits to 55 percent, allowing conces-sionary import duties on exploration equipment and assuring the repatriationof annual net profits. 3/ Maximum emphasis has, therefore, been laid on
1/ See Annex 4, Table 1 for field-specific reserve estimates.
2/ 1976 Amendment of Pakistan Petroleum (Production) Rules, 1949 andForeign Private Investment (Promotion and Protection) Act 1976.
3/ A detailed description of petroleum legislation is attached asAnnex III.
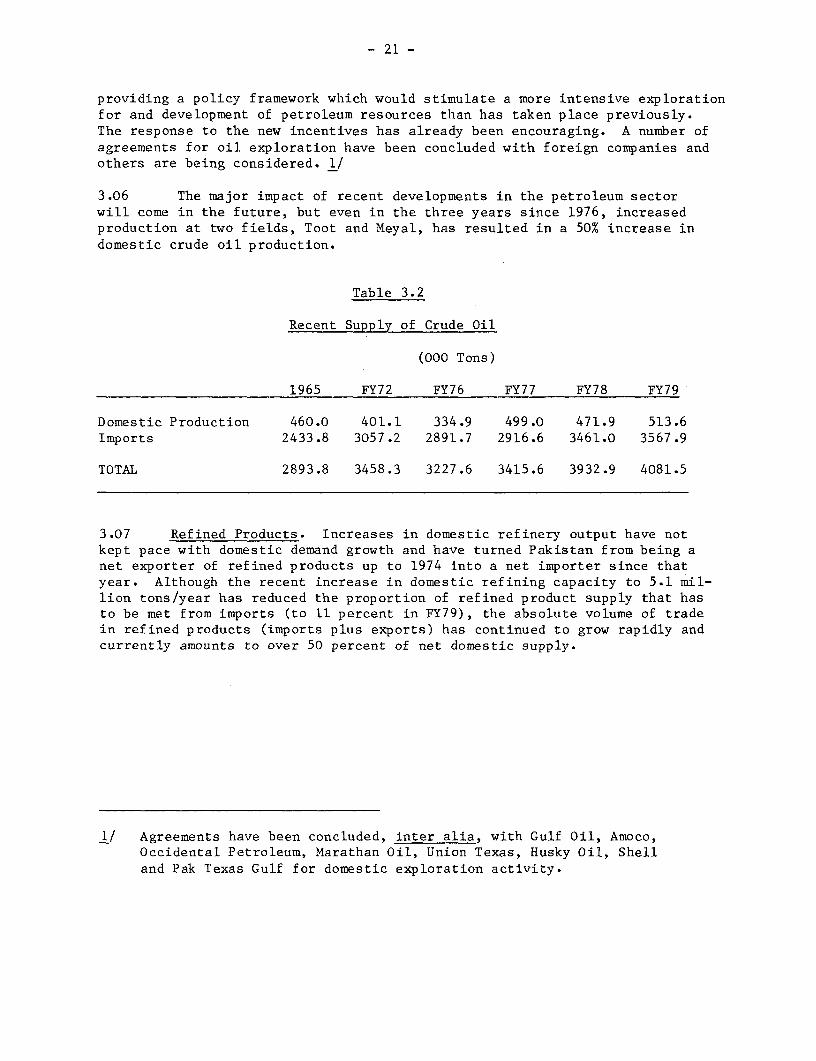
- 21 -
providing a policy framework which would stimulate a more intensive explorationfor and development of petroleum resources than has taken place previously.The response to the new incentives has already been encouraging. A number ofagreements for oil exploration have been concluded with foreign companies andothers are being considered. 1/
3.06 The major impact of recent developments in the petroleum sectorwill come in the future, but even in the three years since 1976, increasedproduction at two fields, Toot and Meyal, has resulted in a 50% increase indomestic crude oil production.
Table 3.2
Recent Supply of Crude Oil
(000 Tons)
1965 FY72 FY76 FY77 FY78 FY79
Domestic Production 460.0 401.1 334.9 499.0 471.9 513.6Imports 2433.8 3057.2 2891.7 2916.6 3461.0 3567.9
TOTAL 2893.8 3458.3 3227.6 3415.6 3932.9 4081.5
3.07 Refined Products. Increases in domestic refinery output have notkept pace with domestic demand growth and have turned Pakistan from being anet exporter of refined products up to 1974 into a net importer since thatyear. Although the recent increase in domestic refining capacity to 5.1 mil-lion tons/year has reduced the proportion of refined product supply that hasto be met from imports (to 11 percent in FY79), the absolute volume of tradein refined products (imports plus exports) has continued to grow rapidly andcurrently amounts to over 50 percent of net domestic supply.
I/ Agreements have been concluded, inter alia, with Gulf Oil, Amoco,Occidental Petroleum, Marathan Oil, Union Texas, Husky Oil, Shelland Pak Texas Gulf for domestic exploration activity.

- 22 -
Table 3.3
Recent Supply of Refined Petroleum Products
(000 Tons)
1965 FY72 FY76 FY77 FY78 FY79
(i) Domestic Production 2793.1 3170.8 2957.9 2889.8 3731.8 3782.6
(ii) Imports 123.1 418.7 896.1 1058.5 1091.0 1403.9
(iii) Exports 639.6 726.1 454.3 519.9 1023.8 928.8
(iv) Domestic Supply 2276.6 2863.4 3399.7 3428.4 3799.0 4257.7
(v) Ratio of Domestic Prod.to Domestic Supply 1.23 1.11 0.87 0.84 0.98 0.89
(vi) Ratio of Absolute Trade(ii+iii) to Domestic Supply 0.34 0.40 0.40 0.46 0.56 0.55
3.08 Some trade in refined products is inevitable and even profitablefor most countries, but in Pakistan's case it also reflects fundamentalimbalances between the mix of domestic refinery output and the structure ofproduct demand. The demand for kerosene and diesel has been growing at rateswell above the average, while furnace oil consumption has declined in absoluteterms (para. 2.10 above). Consequently, the share of these products in thestructure of domestic demand has incressingly diverged from the relativelyunaltered mix of domestic refinery output. As a result, large quantitiesof diesel and kerosene are currently imported and substantial surpluses offurnace oil and naphtha are exported. With production increasing from thePotwar oil fields, the surplus of fuel oil and naphtha is projected toincrease and the location of the Attock Oil Refinery, which uses domesticcrude, at Rawalpindi, means that arrangements will have to be made to trans-port these products to Karachi for eventual export. The high prices at whichPakistan has been able to export naphtha and furnace oil on the spot marketin recent years has to some extent offset the equally high prices it has hadto pay for importing refined products. Nevertheless, the net refined productimport bill is high (US$155 in FY79) and rising (up from US$92 million inFY78). An assessment of the refinery mix problem, and the implicationsfor future refinery investment, is urgently required as part of a nationalenergy planning effort.

- 23 -
Table 3.4
Structure of Petroleum Product Supply FY79
Domestic DomesticOutput Percentage Supply Percentage Net Imports
Product 000 Tons Share 000 Tons Share 000 Tons
Aviation Fuels 520.1 (13.8) 337.8 (7.9) -182.3Motor Spirits 479.9 (12.7) 516.4 (12.1) 36.5Kerosene 154.2 (4.1) 689.7 (16.2) 535.5Diesel 1074.5 (28.4) 1867.4 (43.9) 792.9Furnace Oil 1212.3 (32.1) 592.5 (13.9) -619.8LPG 34.3 (0.9) 34.3 (0.8) --
Naphtha 119.2 (3.2) 31.4 (7.4) - 87.8Other Non-Fuel 188.1 (5.0) 188.1 (4.4) --
TOTAL 3782.6 (100) 4257.6 (100) 475.0
The Supply of Natural Gas
3.09 Natural gas was first discovered in the mid-fifties and for morethan two decades has been an important component of Pakistan's primaryenergy resources. The principal producing field is that of Sui in BaluchistanProvince, which began production in 1958 and which is currently responsiblefor over 90% of Pakistan's annual gas production of 200 billion cubic feet(5.0 million TOE). Remaining recoverable reserves from the Sui reservoirare estimated at 6.83 trillion cubic feet (172 million TOE). The nextlargest field, Mari, is being utilized for the production of nitrogenousfertilizer. The remaining gas fields are much smaller and account for lessthan 8% of total production. Taking these other fields into account, theremaining recoverable reserves are estimated at 15.9 trillion cubic feet (286million TOE); this figure will rise by the extent of the reserves proven atDhodak and Pirkoh which are still being evaluated, and should meet forsee-able internal demand until at least the end of this century. 1/ Since FY72the production of associated gas, from the fields at Meyal and Dhulian, hasincreased at a slightly higher rate than overall gas supply and becauseof its higher calorific value its share in terms of energy supply has risenmarginally faster.
1/ See Annex 4, Table 6 for field-specific estimates of natural gasreserves.

- 24 -
Table 3.5
Natural Gas Supply FY65-79(billion cubic feet)
Share of Associatedin Total (%)
Non-Associated Associated Total Volume BTUs
FY65 50.94 4.38 55.32 8 9FY72 114.37 10.42 124.79 8 10FY79 200.13 20.26 220.39 9 11
Annual Average Growth Rate
FY72-79 8.4 10 8.5 - -
The Supply of Coal
3.10 Recorded coal production in Pakistan has remained roughly constantat about 1.3 million tons and there has been a consequent decline in itsimportance as an energy source. This has been due to a variety of historicaland institutional reasons. Prior to the 1973 increase in international oilprices, most developing countries had only limited incentives to develop theirindigenous coal resources. In Pakistan's case this situation was furtherexacerbated by the discovery and development of large reserves of natural gasand by the poor quality and limited nature of proven coal reserves; variouslyestimated at between 100-170 million tons. Nearly all of these reserves areof poor quality lignite or sub-bituminous coal with limited coking potential,a low heating value (average 8,500 BTU/lb) and a high sulfur and ash content.Much of this coal is subject to spontaneous combustion when stacked anddeteriorates when exposed to the atmosphere, further restricting its wide-spread use as fuel. The development of the coal mining industry has also beenhampered by its fragmented institutional structure. About 80% of the currentproduction of coal is from small, private mines which employ rudimentarymining techniques and have historically suffered from shortages of reinvestedcapital and qualified technical personnel.
3.11 The Government recognises these problems and is also aware of theincreased attractiveness of developing indigenous coal reserves that hasresulted from the changed international energy situation. In spite of theirpoor quality, these reserves have the potential for exploitation and use in,inter alia, mine-mouth power generation plants, and the Government has commis-sioned a feasibility study for such a plant at Lakhra, where the largestknown reserves are found. Preliminary results of this study, which is beingcarried out with Japanese assistance, confirm the economic and financialviability of establishing a 250MW plant which could, if additional indicatedreserves are proven, be expanded to an ultimate capacity of 100OMW to meetthe power requirements of the lower Sind area. The Government is also workingon a plan to produce 0.1 million t.p.a. of medium coking coal from the Sharighcolleries in Baluchistan for use in the Karachi Steel Mill Complex.

- 25 -
3.12 These developments are welcome steps in the full utilization ofindigenous coal reserves, but an integrated development strategy for coalstill needs to be formulated. In particular, further work needs to be urgentlydone on delineating the extent and potential of Pakistan's coal reserves,estimates of which vary widely. The Geological Survey of Pakistan has recentlyestimated the country's total coal resources at 508 million tons (proven - 102m.t.; indicated - 217 m.t.; possible 189 m.t.), but these do not includeadditional possible reserves of 370 million tons in operating coal fieldswhich have not been subjected to any detailed geological investigation. 1/Studies should also be made to determine whether, with the utilization ofmodern mining techniques, some of the better and deeper situated reserves ofcoal could be economically utilized for local residential use, which wouldhave the additional benefit of alleviating some of the ill effects of uncheckedfirewood consumption.
Table 3.6
Coal Production and Imports
Production Imports Total Supply(000 tons)
FY65 1243 37.3 1280.3FY72 1214 32.2 1246.2FY79 1387 - 1387.0
The Supply of Nuclear Fuels
3.13 In 1976, the uranium resources of Pakistan at a cut-off grade of0.1% U 0 were calculated to be 150,000 tonnes of mineralized material contain-ing 18? Ponnes of uranium. The presence of uranium in the Neogene Siwaliksandstones of Dera Ghazi Khan has been known for several years but severalanomalies have also been located in the Potwar area near Islamabad. The mainagency responsible for the development of indigenous uranium resources is thePakistan Atomic Energy Commission, whose other responsibilities also includeplanning for the overall development of nuclear powered electricity generationin the country. So far, Pakistan's experience with nuclear electricitygeneration has been limited to a small 137MW heavy water reactor that has beenin operation at Karachi since 1971. This plant has contributed more than2,700 GWh to the KESC grid, but due to difficulties in obtaining adequate fuelsupplies its output has dropped from a peak of 610 GWh in FY76 to 106 GWh inFY79.
1/ See Annex 4, Table 9 for a field specific estimate of coal reserves.

- 26 -
The Supply of Electricity
3.14 Rapid increases in generating capacity and an increased relianceon hydro power have been the major characteristics of electricity supply inPakistan over the past two decades. In 1965, total generating capacity wasjust under 900 MW of which only 30 percent was based on hydro energy. Since
then, total capacity has nearly quadrupled to 3,353 MW and a much fasterincrease in hydro-based capacity to 1567 MW has raised its share in the totalto 47 percent. Because of higher plant utilization--60 percent as opposed to52 percent for thermal plants--the share of hydro energy in terms of units of
electricity generated has risen even higher to 58 percent of the FY79 total
figure of 14,174 GWh.
Table 3.7
Electricity Generation By Source
Hydro Thermal Nuclear Total
FY65 GWh 1362 1814 -- 3176% 42.9 57.1 -- 100
FY72 GWh 3679 3789 104 7572X 48.6 50.0 1.4 100
FY79 GWh 8252 5836 106 14174% 58.2 41.1 0.7 100
Annual averagegrowth rates
FY65-72 15.3 11.1 -- 13.2
FY72-79 12.2 6.4 0.2 9.4
Hydroelectricity
3.15 Efforts to harness the large hydroelectric potential of the Indus
and Jhelum rivers, which provide for almost all of the country's total pres-ently estimated economically feasible hydro potential of 20,000 MW, had beenan important element of national energy policy well before 1973, and thisstrategy has been given an added impetus by increases in the price of alter-native hydrocarbon fuels for thermal electricity generation. However, thelong gestation period required for the development of hydroelectric schemesimplies that any increases in the share of hydroelectricity in meeting thecountry's electricity requirement that has occurred in the past five years,is more the result of large investments made in this sector in the 1960's

- 27 -
than a response to post 1973 higher oil prices. To this extent, Pakistanwas fortunate in being able to reap in the 1970's, when hydro-generationhad become relatively more attractive, the benefits of earlier investmentsin developing the country's hydroelectric potential. 1/
3.16 The bulk of the existing hydro capacity is located at two sites--Tarbela (which accounts for 45 percent of the total) and Mangla (38 percent). 2/The remainder is shared by ten much smaller sites, all of which are alsolocated in the hilly northern part of the country. This geographical concen-tration of existing and potential hydroenergy sites away from the southernpart of the country which is the major market for electric power consumption,poses one of the problems with regard to the full utilization of Pakistan'shydroenergy resources. The long distances over which electricity must betransmitted from the place of generation to the place of consumption togetherwith inadequate distribution facilities, have resulted in high transmissionlosses and raised costs, and made even more important the concomittant develop-ment of an adequate high voltage transmission and distribution network. Twofurther considerations also need to be mentioned. The first of these relatesto the significant seasonal variation in the flow of the relevant rivers whichresults in large differences between installed and firm capacity for thegeneration stations. 3/ The second factor, about which little is known atpresent, is the relatively high siltation rates which may limit the life ofexisting and planned reservoirs; there are some estimates that the Tarbelareservoir will lose 90% of its capacity over the next fifty years and the oneat Mangla 30% over the same period. In spite of these limitations, hydroelec-tricity has developed as a major source of commercial energy. It continuesto provide one of the most promising avenues for the further development ofindigenous energy resources at both existing and new sites. 4/
Thermal Electricity
3.17 Thermal electricity is generated at 22 power stations in the centraland southern regions of the country, with a total capacity of 1649 MW. Theseplants vary in size from 1.5 MW to 265 MW, with the three largest stations--the natural gas power stations at Multan and Faisalabad, and the thermal powerstation at Guddu--accounting for 694 MW or 42% of the total. Since the early1960's, the main fuel for thermal electricity generation has been indigenousnatural gas, but prior to 1973 the system's reliance on oil had been increasing.Since then, the Government has acted to reduce the share of petroleum as a
1/ See Annex 4, Table 11 for a site-specific list of hydroelectricpotential.
2/ See Annex 4, Table 13 for a distribution of installed generating capa-city by plant.
3/ Of the votal main flow of the river Indus at Attock, about 72% or88 x 10 cubic meters occurs in the four months between June andSeptember.
4/ Seasonal variation in river flows at the Kalabagh site (7.11) would belower because of its location further downstream from Tarbela.

- 28 -
petroleum as a thermal fuel and in FY79 less than 16,000 tons of oil were usedfor thermal generation. As the following figures show, thermal electricitygeneration now relies almost exclusively on natural gas as an energy sourceand this pattern is likely to continue in the future.
Table 3.8
Fuel Consumption Mix for Thermal Power Generation(Percentage Share)
Source FY65 FY72 FY73 FY74 FY75 FY76 FY77 FY78 FY79
Oil 4.1 8.9 6.8 14.8 19.9 11.7 10.1 2.4 1.0Coal 10.3 3.9 2.3 1.8 1.3 1.4 1.4 0.8 0.8Gas 85.6 87.2 90.9 83.4 78.8 86.9 88.5 96.8 98.2Total 100 100 100 100 100 100 100 100 100
Transmission and Distribution
3.18 The two main power generation and transmission authorities arethe Water and Power Development Corporation (WAPDA) which is responsible for80 percent of national supply and the Karachi Electric Supply Corporation(KESC) which produces and distributes the remainder in the districts ofKarachi and Lasbella. WAPDA and KESC are presently inter-connected by two132 kV transmission lines of limited capacity which do not allow for sub-stantial power interchanges. WAPDA's own transmission network which hasrecently been increased to about 81,000 km, relies almost exclusively on low-voltage lines. Less than 1550 km of these lines carry power at 220 kv orabove and over 81 percent are energized at 11 kv only. The length of theselines and the loads carried at relatively low voltage levels have contributedto the high system losses which currently amount to a third of total generatedunits. This problem has been further aggravated by theft and bad meteringwhich is estimated to account for a third of all losses. Total losses haveincreased at a rate of about 11% per annum between FY71 and FY78, reachinga peak of 37.6% of generated units in FY77. In that year, about 400 MW ofgenerating capacity was needed to compensate for losses in excess of normaloperations.
3.19 Since then, there has been some reduction in system losses bothbecause of tighter financial control and because the Government is engagedin a major program of rehabilitation and improvement for the primary andsecondary transmission and distribtuion systems. 1/
3.20 About a fifth of the country's population, or about 2.5 millionhouseholds, currently have access to the national electricity grid. TheGovernment has, in recent years, pursued an active rural electrificationpolicy. By March 1979, 8,294 villages had been connected to the electricitynet.work; thirty percent since 1977. During the next five years, the Govern-ment plans to add 1,000 villages to this number every year.
1/ See below paras. 7.11-13.

- 29 -
ENERGY PRICING, TAXES AND SUBSIDIES
Background
4.01 Prior to 1973, energy prices had, in general, been kept at fairlylow levels, although certain petroleum products. e.g. gasoline, had tradi-tionally been subject to high indirect taxation on social and fiscal grounds.This policy reflected the government's underlying belief that rapid growth inenergy consumption was a necessary concomitant of the industrial expansion andagricultural mechanization that were the bases of its development strategy.
4.02 Since 1973 this policy has been modified to take into account notonly the higher price that has had to be paid for imports of crude oil andrefined petroleum products, but also the impact that higher international oilprices have on the opportunity cost of the major indigenous commercial fuels--natural gas and hydroelectric power. Energy prices have been gradually raisedto near international levels although the Government has endeavored to protectcertain key sectors (such as transport and industry) and lower income consumersfrom the impact of higher energy prices. The Government has also increasedthe well head prices for new domestic oil discoveries to promote investmentin domestic oil exploration, and this has already had an encouraging response,but a similar action is also required in the natural gas sector where privateexploration activity has now come virtually to a standstill. In addition, inthe power sector, prices to certain categories of consumers are still wellbelow the long-run marginal cost, particularly with regard to capacity expan-sions, and a series of anomalies continue to exist in relative interfuelpricing, both within the spectrum of refined petroleum products (e.g. gasolineversus diesel) and outside it (e.g. natural gas versus fuel oil in industry).These issues are discussed further below.
Petroleum Products
4.03 Producer Prices. In order to provide the incentives to encouragefurther exploration and development of indigenous oil resources, the Govern-ment, in a new policy initiative in 1975, established that well-head pricesfor oil in new concession agreements with petroleum exploration companieswould be based on international price levels. There has already been anencouraging response to the assurance of increased wellhead prices fromforeign petroleum companies and it is anticipated that increased explorationactivity by these companies will lead to new oil discoveries. "Old oil"wellhead prices were also revised within the framework of the negotiationswith Attock Oil Company and Pakistan Oilfields Limited on further developmentof Meyal, the largest proven oilfield in Pakistan. Nevertheless, this issuerequires further Government attention to ensure that the possibilities forsecondary or tertiary oil recovery from depleted fields are not being over-looked because the current level of wellhead prices is too low to cover thehigher cost associated with enhanced recovery techniques, even though thesetechniques would be economically justified.

- 30 -
4.04 Ex-refinery Prices. Pakistan's refineries were on a self-financingbasis until 1973. Since then, ex-refinery prices have been closely regulatedand have lagged behind the successive increases in international crude prices.The Government has been reimbursing the shortfall in the operating expensesof the country's principal refineries through a system of equalization paymentswhich assure the refineries a 15% return on paid up capital. These paymentshave not imposed a net fiscal burden on the Central Government since they arefinanced principally by a sizeable "development surcharge" tax on motorgasoline. However, this fixed return formula with its associated governmentcontribution is cumbersome and provides little incentive to improve operatingefficiency.
4.05 The Government recognizes the need to place the refineries on aself-financing basis, and has recently increased ex-refinery prices by about50% towards this end. There is now a need to ensure that future increasesin the cost of crude oil are also rapidly reflected in the structure ofex-refinery prices.
Table 4.1
Ex-Refinery Prices of Selected Petroleum Products
Price in Rs/LiterProduct December, 1979 March, 1980 % Increase
Gasoline - Regular 1.61 2.35 46Gasoline - Premium 1.90 4.40 132Kerosene 0.77 1.26 64High Speed Diesel 1.05 1.95 86Furnace Oil (Rs/ton) 625.10 925.10 48
4.06 Consumer Prices. Current prices of petroleum products to theconsumer are characterized by: (i) retail prices which overall now moreclosely reflect the economic cost of importing, refining and distributingpetroleum products; (ii) cross subsidization of individual refinery productsin which higher-priced motor gasoline subsidizes in part the prices ofkerosene and light diesel oil; and (iii) geographical price equivalence ofpetroleum products throughout Pakistan.
4.07 Since 1973, retail prices for petroleum products have been revisedon nine separate occasions, the most recent of which raised prices by anaverage of 30 percent in December 1979. The current price of regular gasoline,$1.63 per U.S. gallon, is considerably higher than import parity but stillbelow the retail price in countries such as India ($2.10) and the Philippines($2.15) which are equally dependent on crude oil imports; high speed diesel,a key input in the transportation sector and responsible for 40% of totalconsumption, is now priced at over import parity (although this was previouslynot the case) but still substantially below gasoline. This differential

- 31 -
between gasoline and diesel prices, currently $0.67 per U.S. gallon, whichhas historically been an element of petroleum pricing policy in Pakistan, isdifficult to explain on the basis of relative refining costs, and the continuedmerit of such a policy, intended to help public transport users, needs to bereexamined. On ths other hand, the prices of kerosene and furnace oil, inspite of having been increased fivefold, are still at or below import paritylevels. Kerosene prices, in particular, continue to be subsidized by theGovernment to the extent of $0.48 per U.S. gallon. These differences are duelargely to the distorted pricing structure that characterized refined petroleumproducts prior to 1973 and which has since been partly corrected by differ-ential price increases. Although this system of cross subsidies can arguablybe justified on the basis of the Government's wider social and economic goals,its continued viability in the face of budgetary constraints and the changingpattern of refinery product demand rests on frequent and realistic adjustmentsthat reflect future increases in the cost of importing crude oil and refinedpetroleum products.
Table 4.2
Re'tail Prices of Selected Petroleum Products in Pakistan Jan. 1980
Current PercentagePrice Increase Comparative Prices
Product $/US gallon Since Oct. 73 Philippines India Sri Lanka
Gasoline-regular 1.63 210 2.15 2.10 2.00Gasoline-premium 2.33 296 2.25 - -Kerosene 0.76 352 1.17 0.76 0.72Light Diesel Oil O.76 415 1.15 0.66 0.82High Speed Diesel 0.96 280 - 0.79 0.72Furnace Oil($/ton) 126.3 420 224.0 188.5 187.5
4.08 Finally, the geographical equivalence system, which has been inexistence since 1966, also needs to be monitored to ensure that the benefitsof this system (for example, to very poor regions) are not countermanded byabuses in the distribution system for refinery products. Inland freightmargins which have recently been revised, need to continue to accuratelyreflect actual transportation costs.
4.09 Fiscal Contribution of the Sector. Traditionally, tax revenuesfrom the sale of certain refinery products, particularly motor gasoline,have been used, in part, to subsidize kerosene and diesel which are bothimport deficit products. These revenues have so far been adequate to coverthese costs as well as meeting shortfalls in refinery operations and inlandfreight margins. The determination of the final sales price for the differentproducts is based on five elements which are all fixed by the Government.These are: (i) the ex-refinery price; (ii) excise or customs duty; (iii)distributors' margin; (iv) a petroleum development surcharge; and (v) an

- 32 -
inland freight margin, out of which the marketing companies recover actualtransportation expenses. The petroleum development surcharge, which isequal to the differential margin between the sales price and the "prescribedprice" available to the oil marketing companies, acts as a price stabilizationmeasure which may lead either to Government revenues or to refunds to refine-
ries, the latter being the case since 1973. The sum of these five elementsprovides the "fixed sales price" for each refinery product.
Table 4.3
Structure of Petroleum Product Prices as of Dec. 1, 1979(Rs/Liter)
Customs Duty& Development Marketing
Product Ex-Refinery Surcharge Costs 1/ Fixed Price
Gasoline-regular 1.61 1.37 0.22 3.20
Gasoline-premium 1.90 1.67 0.23 3.80
Kerosene 0.77 0.07 0.16 1.00
High Speed Diesel 1.05 0.38 0.13 1.56
Furnace Oil (Rs/ton) 625.10 114.78 60.12 800.00
4.10 The revenue generated from the sale of petroleum products is of twokinds. Excise duty revenues, which increased from Rs 763 million in FY76 toRs 900 million in FY78, contribute to the Federal Government's general taxrevenues. 2/ Development surcharge receipts, however, have been used forthree specific purposes since the oil crisis:
(i) to cover the costs of refinery operations which have beenrunning at a loss;
(ii) to subsidize domestic prices of deficit import products(primarily kerosene); and
(iii) to cover the full transportation expenses of the marketingcompanies since the inland freight margins have been, forthe most part, insufficient to meet actual expenses.
1/ Marketing Costs = Distribution Margin + Dealers' Commission + InlandFreight Margin.
2/ Estimates for FY79 and FY80 are Rs 1,000 million and Rs 500 million.

- 33 -
Any residual development surcharge receipts becomes a part of CentralGovernment revenues. The utilization of the development surcharge receiptsbetween 1976-78 is summarized below:
Table 4.4
Utilization of Development Surcharge Receipts
(Rs. million)
Total Storage Deficit Freight Net Government ReceiptsFY Revenue Refinery Charges Imports Pool ( + Surplus - Deficit)
1976 850 248 0 190 320 + 921977 738 109 26 175 185 +2431978 810 339 30 267 260 - 851979 1/ 1025 386 30 218 300 + 91
4.11 During FY76 and FY77, development surcharge tax revenues weresufficient to cover the operating shortfalls of the refineries and marketingcompanies, as well as to provide a net contribution to government revenues;significantly this contribution was largest in 1977 when refinery operationswere placed for a brief period on a self-financing basis. Though losses wereincurred in 1978, the total revenue generated from the development surchargetax in 1979 is estimated to have been sufficient to cover the cumulativerequirements of refinery operations, the inland freight pool and the sub-sidization of deficit import product prices.
Natural Gas
4.12 Producer Prices. The current wellhead price for natural gasprovides no incentive for new exploration for natural gas -- which hasnow come to a standstill with the exception of OGDC's exploration program-- and acts as a disincentive to develop further known resources. Althoughsupplies of natural gas in Pakistan are relatively abundant in being able tomeet the projected growth in domestic demand in the medium-term, the regula-tion of natural gas prices at very low levels requires examination in thefuture, if additional reserves are to be developed for future domestic demandand for possible export markets.
4.13 Consumer Prices. Natural gas consumer prices have been fixedhistorically at a level somewhat below that of fuel oil in order to providean adequate incentive for its utilization. As such this has been a key policytool of the Government in bringing about a rapid expansion in the use ofnatural gas in the industrial, commercial and power sectors during the pasttwo decades. Since 1973, gas prices have risen roughly in line with domestic
1/ Budgeted. It is estimated that there will be no surplus or deficitin FY80.
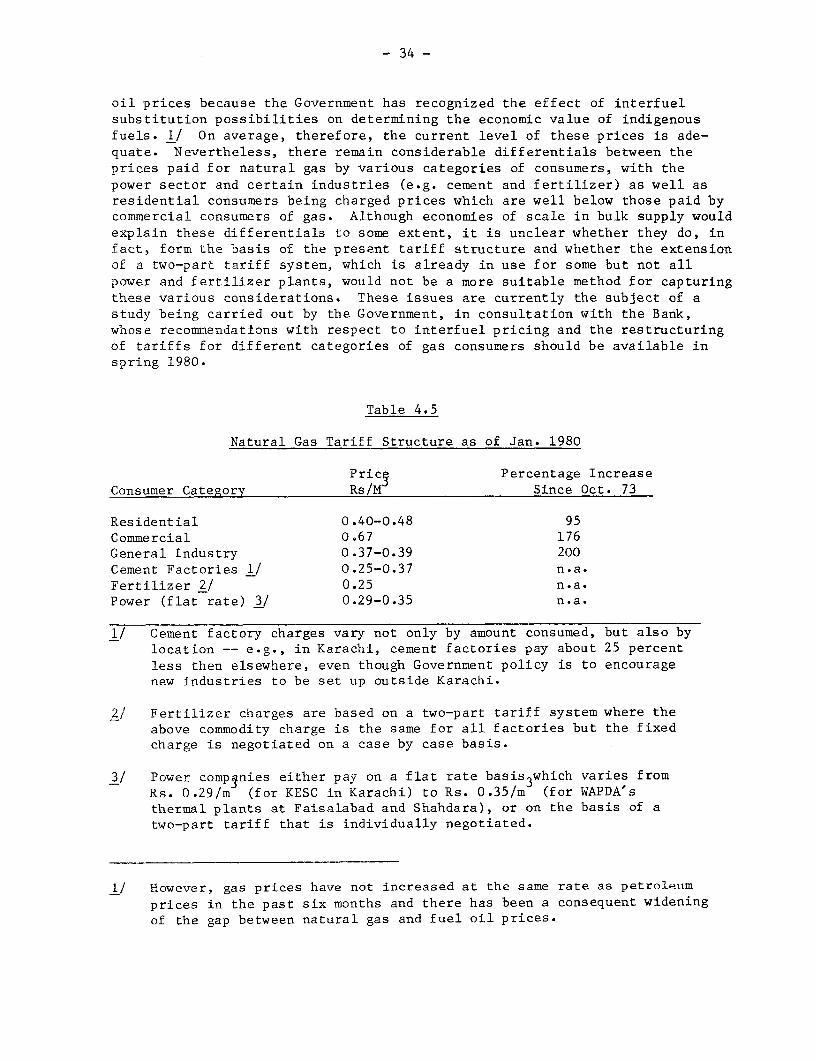
- 34 -
oil prices because the Government has recognized the effect of interfuelsubstitution possibilities on determining the economic value of indigenousfuels. 1/ On average, therefore, the current level of these prices is ade-quate. Nevertheless, there remain considerable differentials between theprices paid for natural gas by various categories of consumers, with thepower sector and certain industries (e.g. cement and fertilizer) as well asresidential consumers being charged prices which are well below those paid bycommercial consumers of gas. Although economies of scale in bulk supply wouldexplain these differentials to some extent, it is unclear whether they do, infact, form the basis of the present tariff structure and whether the extensionof a two-part tariff system, which is already in use for some but not allpower and fertilizer plants, would not be a more suitable method for capturingthese various considerations. These issues are currently the subject of astudy being carried out by the Government, in consultation with the Bank,whose recommendations with respect to interfuel pricing and the restructuringof tariffs for different categories of gas consumers should be available inspring 1980.
Table 4.5
Natural Gas Tariff Structure as of Jan. 1980
Pric5 Percentage IncreaseConsumer Category Rs/M Since Oct. 73
Residential 0.40-0.48 95Commercial 0.67 176General Industry 0.37-0.39 200Cement Factories 1/ 0.25-0.37 n.a.Fertilizer 2/ 0.25 n.a.Power (flat rate) 3/ 0.29-0.35 n.a.
1/ Cement factory charges vary not only by amount consumed, but also bylocation -- e.g., in Karachi, cement factories pay about 25 percentless then elsewhere, even though Government policy is to encouragenew industries to be set up outside Karachi.
2/ Fertilizer charges are based on a two-part tariff system where theabove commodity charge is the same for all factories but the fixedcharge is negotiated on a case by case basis.
3/ Power companies either pay on a flat rate basis3which varies fromRs. 0.29/m (for KESC in Karachi) to Rs. 0.35/m3 (for WAPDA'sthermal plants at Faisalabad and Shahdara), or on the basis of atwo-part tariff that is individually negotiated.
1/ However, gas prices have not increased at the same rate as petroleum
prices in the past six months and there has been a consequent wideningof the gap between natural gas and fuel oil prices.

- 35 -
4.14 Taxes. Other than financing the cost of transmission and distribu-tion facilities, the large gap between consumer and producer prices fornatural gas is captured by a development surcharge tax component whichhas been an important source of tax revenues for the Federal Governmentand by an excise duty which is earmarked for the budget of the provincialgovernments. The revenues thus generated are shown below for FY76-78.
Table 4.6
Revenues from Natural Gas Sales
(Rs Million)
Year Excise Duty Development Surcharge
FY76 290 290FY77 310 390FY78 (est.) 320 480
4.15 Liquid Petroleum Gas (LPG). The pricing of LPG, which is a potentialsubstitute for kerosene, gasoline and diesel, requires further examination.At present LPG is priced at a higher level than either of these products,but given the expected increase in LPG supply from refineries (projectedto grow to about 250,000 tons by 1985) and the possibilities of additionalLPG distillation from the production of associated gas at Dhulian and Meyal,which has a high propane and butane content (4.8% and 3.0%, respectively),consideration should be given to the possibility of encouraging its sub-stitution, through reduced prices, for diesel and kerosene, both of whichalready have to be imported in refined form to meet high and rapidly growingdomestic consumption levels. This issue is also being examined within thecontext of the interfuel pricing study (para 4.12) and firm recommendationsshould await the study's completion.
The Power Sector
4.16 Electric power pricing has historically been outside the sphere ofgeneral energy product pricing, and while governed by similar social andpolitical considerations, it has largely been based on the need to ensure anadequate financial return for the power generating authorities. Althoughthe power authorities are now better able to contribute to their investmentprograms from their own resources, both the level and structure of electricitytariffs has become unnecessarily complex and badly distorted over time. Thecurrent tariff structure is characterized by a variety of energy and minimumcharges which are generally not directly related to the costs of supplyingelectricity to consumers. In particular, present capacity or kW charges arewell below the long-run marginal costs (LRMC), although energy or kWh chargesare not very different from the best estimates of the LRMC of energy. Further,

- 36 -
low voltage consumer charges are significantly below the costs of supply -particularly for domestic consumers and tubewells in the agricultural sector.The main features of the existing tariff structure for WAPDA, the main elec-tricity authority, are summarized in Table 4.7 below.
4.17 The Government has recognized the extent and seriousness of thesedistortions and has commissioned a study, in collaboration with the Bank,to propose a revised tariff for the power sector. The final draft of thisstudy has now been completed. 1/ The principal changes in the existing tariffstructure that are proposed therein relate to raising the target averageprice for FY81 to Rs 0.482 per kWh sold by WAPDA (an increase of 37.6% over
the actual average revenue per kWh sold in FY79) and restructuring individualtariffs to correspond more closely to the LRMC of supply within a less complexcategorization than is presently the case. Nevertheless, in spite of theseproposed changes, power tariffs will continue to have a number of anomalieswhich should be addressed in subsequent tariff revisions, mainly because itis felt necessary to avoid large and sudden price rises. In particular, inindustry although capacity charges have been raised they are still considerablybelow the LRMC for appropriate voltage levels and subsequent tariff revisionsshould focus on raising kW charges still further. The tariff for privatetubewells should also be raised. Five further issues also remain to beresolved in subsequent tariff revisions in the future.
4.18 First, the question of losses needs further analysis. While lossesare planned to drop from 34% of generation in 1979 to 25% by 1985, it isdebatable whether such losses (which are considerably higher than normallyaccepted levels) should be incorporated in the calculation of supply costs.Automatically passing on technical losses to the consumer removes the util-ity's incentive to reduce these losses.
4.19 Second, the marginal opportunity cost, or economic value of naturalgas used in the power sector must be more accurately determined to provide abetter estimate of kWh costs. The results of the interfuel pricing study nowunderway should be of great value in resolving this problem (para 4.12).
4.20 Third, the question of uniform national tariffs and appropriatetariffs in the KESC area needs to be explored. Since KESC has a well estab-lished market with high load density and relatively small needs for newinvestment, their tariffs are lower than WAPDA's and the quality of supply isat least as good. This could cause discontent among WAPDA consumers who haveto subsidize rural and tubewell consumers while also helping to finance aheavy investment program.
1/ Pakistan, WAPDA Electricity Tariff Study prepared by Mr. M. Munasinghe,World Bank Energy Department, in collaboration with the WAPDA TariffStudy Group, February 1980.

- 37 -
Table 4.7 SuLnrarv of Main Features of the ExistingWAPDDA Iariffs (as of JUlY 1, 1.979)
EXISTING TARTFF
Energy Charge Capacity Charge Energy 4/ Capacity
Category of Consumer (Paise/KEW) I' (Rs. /KW/Month)
Al. Domestic 31 first 40 KWH35 balance
(Rs.5/month minimum)A2. co-ercial 85 first 100 WH
95 balance(Rs.15/month minimum)
Industrial- 42.8(p)375/) ~430
B1. 70 KW connected 52 20.00-25.00load (minimum charge)
B2. up to 500 KW con- 36 50.00nected load
B3. Supply of 11KV 35 45.00 { 32.;(p) 27629, 6 Ccp
B4. Supply at 33KV, 266KV, or 132KV 42.00 29.2(p)
27.5(C?) 225
Bulk SupplyCl. Supply at 400 V.
(a)2/ 32(b)21 40 i 42.8(P)4(c)3/ 35 45.00 J 37.5(430
C2. Supply at 11KV(a)2/ 28(b)2/ 35(c)3/ 34 .41.00 32.1(p) 276) 27.5(o,) 27
C3. Supply at 33KV,
66KV, and 132KV 29.2(p)
(a) 34 39.50 27.5(op) 225(b) .33 J (66/132KV)
Tubewells
Dl. for reclamation 31.0and drainage 42.8(p) 430
D2. for agriculture 37.5(op)and irrigation(i) in N.W. Frontier 13.0 9.(ii)other areas 19.0 11
1/ A fuel adjustmcnt surcharge is added to the energy clharges lIlsted iti this F
2| Includes Licensees and Non-Licensees.3/ Includes railways, cantonment boards, and other institutions with their own
distribution facilities.4/ (p)=peak; (op)-off-peak.5/ No adlustment made for diversity factor,
Source: Pakistan, WAPDA Electricity Tariff Study, op. cit.

- 38 -
4.21 Fourth, WAPDA's connection policy must be reexamined. This wasnot done at the time of the tariff study, because a simultaneous change intariff structure as well as connection policy would have greatly increasedcustomer resistance. The tariff revision was considered a first priority.Nevertheless, the appropriateness of the present policy of passing on the full
connection charges, even to poor consumers, and whether some of these costsshould be included in the kWh charges, must be reviewed in the future.
4.22 Finally, in subsequent tariff revisions, many items of data, includ-
ing the demand forecast and load factors need to be more accurately estimated.
Coal
4.23 Coal prices are not controlled by the Government. Private mineowners, who are responsible for 75 percent of the indigenous supply of coal,
set their prices on the basis of market conditions and the Pakistan MineralDevelopment Corporation (PMDC), which produces the remainder, sets its priceson the basis of open tenders. Average prices of different categories of coalsold by the PMDC in FY79 varied from Rs 180 per ton to Rs 380 per ton depend-ing on the quality of the mine and its proximity to local markets. Inform-ation on the average price of privately mined coal, which constitutes thebulk of total supply, is not available, and given the currently relativelyminor contribution of coal as a commercial energy source, the Government hasnot attempted to regulate or monitor coal prices in any detail.
Table 4.7
PMDC Coal Prices, FY79
Colliery Rs/Ton
Makerwal 383Gullakhel 181Sor Range (Ex-mine) 356Degari (Ex-mine) 271Shaigh 271
Firewood
4.24 Data on firewood prices are sparse and unreliable and, in any case,excludes the "free" use of firewood through informal collection for self use.Furthermore, there is considerable variation in firewood prices in differentareas and at different times of the year. Nevertheless, on the basis of thedata which are available, firewood prices appear to be high in terms of theirenergy content. On the basis of a study being done by the ERC, the averageprice of a maund (40 kg) of firewood is estimated to be between Rs 20 and 25,which translates into a cost of Rs 48.51 per million BTU, a figure which ishigher than the equivalent cost of kerosene at Rs 6.5/gallon. This implies

- 39 -
that the potential for substitution of firewood by other fuels exists,particularly in isolated areas where firewood is often consumed only becausealternative fuels are not available. However, this substitution would notaffect those consumers who obtain firewood at no monetary cost and it is thisfree use which poses the major problem with regard to the long-term forestryprogram.

- 40 -
ENERGY SECTOR ORGANIZATION AND INSTITUTIONS
Background
5.01 Historically, the Government has been closely involved with thedevelopment of the country's energy resources, although prior to 1972 theextent of its involvement in the power sector was much greater than was thecase for the petroleum, gas and coal industries where the private sectorplayed a more active part. Since the Economic Reforms Order of 1972, Govern-ment participation has increased appreciably in the oil and gas sector whileits close involvement in the development of the power sector has continued.
5.02 Prior to March 1977, a single government ministry was responsiblefor all fuel, water, power and natural resources. Since then, however, theseresponsibilities have been split between two different ministries, oneresponsible for petroleum and natural resources and the other for water andpower. An Energy Resources Cell has also been active, since 1974, in thecollection and analysis of data relating to the energy sector. Details ofthese bodies and their subsidiary organizations are presented below.
The Hydrocarbons Sector
Ministry of Petroleum and Natural Resources
5.03 The Ministry of Petroleum and Natural Resources has official juris-diction over the development of oil, gas, coal and non-fuel mineral resourcesin Pakistan. In practice, it is more closely concerned with developments inthe oll and gas sector and this is reflected in its organizational structure.The Ministry is composed of four directorates responsible for Petroleum Con-P_esscns, Oil Operations, Gas Operations and Energy Resources. Their respec-tivre 5ol,eres of authority are as follows:
(a) Petroleum Concessions: negotiating and granting of concessionsto exploration companies (including OGDC and joint venturecompanies); monitoring the progress of exploration activitiesin the country, especially expenditure schedules; administrationof legislation, tax regime, investment incentives and otherrelated sectoral matters;
(b) Oil Operations: oil pricing policy (wellhead, retail ex-refineryprices) including inland freight margins and development sur-charge; supervision of refineries, especially financial perform-ance; scheduling of oil tanker movements in and out of Pakistanto meet estimated requirements of various sectors of the economy;
(c) Gas Operations: functions of this directorate parallel those ofoil operations; and

- 41 -
(d) Energy Resources: this directorate was formerly the EnergyResources Cell. Its functions and responsibilities arediscussed in para. 5.15 below.
The Oil and Gas Development Corporation (OGDC)
5.04 The OGDC was established in 1961 as a fully owned Government companywith a mandate to explore and develop the country's oil and gas resources.However, prior to 1975 its activities had been constrained by a lack of ade-quate funding and a shortage of financial and technical expertise. In 1975OGDC was substantially reorganized and its budget increased; it has sincethen embarked on an extensive program of equipment modernization with strongGovernment support. Official allocations to the OGDC budget in FY77 aloneamounted to about 45 percent of the total funds it had received between 1961and 1976. OGDC has now begun to contribute more effectively to the develop-ment of known fields (mainly at Toot and Dhodak) as well as to explorationin prospective areas, either on its own or in collaboration with foreign oilcompanies. However, a shortage of trained and experienced technical staff,required for the implementation of an exploratory program, and the high rateof staff turnover (not least because of the buoyant demand from nearby Gulfstates) continue to pose a constraint to OGDC's expansion. This problem hasbeen partly circumvented through the use of consultant firms. Nevertheless,the Government will have to ensure that OGDC's remuneration policies reflectmarket conditions for different categories of skilled personnel and areflexible enough to accommodate changes in these conditions in the future.Steps should also be taken to accelerate the adoption of modern managementtechniques, such as management information, budgeting, accounting and costcontrol systems and the setting up of an ongoing training program for OGDCstaff at all levels. OGDC should also consider the separation of itsoperational functions from the other responsibilities it has to discharge asa national oil company. One method of achieving this would be through thesetting up of operational subsidiaries in the fields of geophysics, drillingand well servicing which could operate on a semi-autonomous basis.
The Pakistan Mineral Development Corporation (PMDC)
5.05 PMDC was formed in July 1974 as a specialized public sector agencyunder the Ministry of Petroleum and Natural Resources, to undertake mineralexploration and development on a national basis. PMDC has a large staff ofmining engineers, geologists and other qualified technical staff, but itsinfluence in the coal mining industry is limited to the small share of coalproduced by the public sector (about 20%). PMDC currently operates 4 coalmines with a total output of 230,000 tons but, as part of its longer term planto increase public sector coal production to 1.7 million t.p.a. by the middleof the decade, it plans to nearly treble the production from these existingmines to 630,000 tons. The rest of the increased production would come fromthe Lakhra coal field to be developed in conjunction with WAPDA.

- 42 -
Other Organizations
5.06 Oil and natural gas production is at present primarily the respon-sibility of two companies, Pakistan Petroleum Limited (PPL) and PakistanOilfields Limited (POL), both with majority private ownership. PPL, in whichBurmah Oil Company (BOC) holds 70% of the equity, is principally involved inthe development of the Sui gas field. POL's main activity is to undertakeexploration and production in the Potwar area where it is currently developingthe Meyal field; 60% of POL's equity is held by Attock Oil Company (AOC). 1/The remaining production has been undertaken by the government-owned corpor-ation, OGDC. Since 1947, the bulk of the exploration activity has beenundertaken by PPL, POL, AOC, BOC, and OGDC.
5.07 Pakistan's requirements for refined petroleum products are met bythree refineries: Pakistan Refinery Ltd. (PRL), the state-owned NationalRefinery Ltd. (NRf), which are both located in Karachi and refine importedcrude oil, and the AOC refinery which refines indigenous crude oil. 2/ Themarketing companies in Pakistan are the state-owned Pakistan State Oil Company(PSO), and the privately-owned Pakistan Burmah Shell and Caltex; their marketshares are respectively 60 percent, 28 percent and 12 percent. Petroleumproducts are distributed within Pakistan principally by rail, a smaller pro-portion by road and a very minor amount by pipeline.
5.08 There are two principal gas transmission companies, the Sui GasTransmission Company (SGTC) which transports gas by pipeline from the Suifield to the Karachi area in the south, and the Sui Northern Gas Pipeline,Ltd. (SNGPL) which provides transmission lines that extend to the northernpart of Pakistan. Both these transmission companies, originally in privatehands, are now controlled by the Government with an 87% and 70% sharerespectively in each of these companies. SNGPL also distributes gas in thenorthern region, while SGTC sells gas to two distribution companies, theIndus Gas Company and the Karachi Gas Company, both of which are governmentcontrolled.
The Power Sector
5.09 The two main Acts pertaining to the power sector are the ElectricityAct of 1910 (as modified in 1964) and the Water and Power Development Author-ity (WAPDA) Act of 1958. The Electricity Act is a statutory instrumentgoverning the sector and inter alia enables the Government to issue licensesfor the generation and distribution of electric power in various areas of thecountry.
1/ Attock Oil Company is a London-based Company in which 51% of the equityis owned by a Saudi-Kuwaiti investment group and the remaining 49% byAttock Petroleum Limited.
2/ Hitherto fully-owned by AOC. An agreement has now been reached on
future ownership in which AOC would retain 60% equity and the remaining40% would be subscribed by the public.

- 43 -
Water' and Power Development Authority (WAPDA)
5.10 The WAPDA Act inter alia confers on WAPDA the power and obligationsof a licensee under the Electricity Act. Under the Indus Water Treaty of 1960between India and Pakistan, WAPDA was designated as the agency responsible forimplementing a series of civil engineering works to aid in the replacement ofriver flows diverted to irrigation uses in India. The extensive program ofworks known as the Indus Basin Project is of a multipurpose nature and in-cludes a large power component. The Project includes two of the largestearth-rockfill storage dams in the world at Mangla and Tarbela, permittingthe installation of 800 MW of generating capacity at Mangla and 2,100 MW atTarbela.
5.11 Agricultural development in the Indus Basin and WAPDA's powersystem are closely related, with irrigation pumps absorbing 27% of the powersystem's output, thus depending heavily.on the generating capacity of Manglaand Tarbela.
5.12 WAPDA is the major partner in the power sector, accounting for 80%of the public power supply in Pakistan. At the end of FY79, WAPDA's installedcapacity totalled 2,676 MW, of which 1,567 MW were hydro. Whereas WAPDA hasbuilt up an institutional capacity for master planning in the water sector,it has yet to develop similar strength in its power sector operations.
Karachi Electric Supply Corporation, Ltd. (KESC)
5.13 Under the Electricity Act, KESC was granted a license to generateand distribute electric power in the Karachi area. KESC is a private stockcompany with GOP directly holding 12% of the shares and Government controlledbanks and insurance companies holding 81%. The remaining share capital isheld by private individuals. KESC's management is competent and its systemis well run. KESC accounts for almost all of the remaining 20% of the publicpower supply in Pakistan. At the end of FY79, KESC's installed capacitytotalled 645 MW, of which 493 MW were steam thermal, 137 MW nuclear, and15 MW diesel.
Others
5.14 Similarly, various other licenses were conferred under the Elec-tricity Act to various companies for distribution of electricity purchased inbulk from WAPDA. Bulk purchases from WAPDA for this purpose account for about13% of WAPDA's sales. The principal licensees distributing power generatedby WAPDA are the Multan Electric Supply Company (MESCO), and the RawalpindiElectric Power Company (REPCO). In addition, licenses are issued for theinstallation of captive generating plant, mainly for industrial purposes.The total installed capacity of such plant amounted to about 230 MW at theend of FY79.

- 44 -
The Directorate of Energy Resources (DGER)
5.15 DGER was initially set up as the Energy Resources cell in 1974, toact as the counterpart agency to the UNDP sponsored Energy Resources SurveyProject. Since the completion of that report, DGER has been responsible forthe compilation and analysis of historical data relating to energy supply andconsumption by source and sector of use. These results were published as an"Energy Data Book" -- a comprehensive and excellent body of energy data forthe period 1948 to 1977, which has subsequently been updated to 1979. DGER'swork to date has been commendable, especially in view of the constraints ofexperienced staff that it has had to face. However, its responsibilities todate have been primarily those of data collection and it has only recentlybeen given the mandate to become more actively involved in the wider issuesof energy planning and conservation.
Energy Planning
5.16 One of the issues relating to the institutional structure of theenergy sector in Pakistan has been the absence of a well defined energyplanning organization that could coordinate the investment, pricing andconservation policies of the different energy sub-sectors. Such a body isrequired particularly because the electric power sector and the hydrocarbonsector now function under two separate ministries. The Government has recog-nized that there is a need to improve the organization of energy planning inthe country and has recently set up a high level inter-ministerial committeeto develop and recommend policies on a whole host of energy planning issues.This committee, which is chaired by the Minister of Finance, has as itsmembers the senior civil servants from all the major energy producing orconsuming ministries and it will rely upon the Directorate of EnergyResources for technical support in drawing up its policies and for ensuringtheir effective implementation.
5.17 These actions are important steps in setting up a national energyplanning capability but it is important to ensure that this momentum is notdissipated over time, as has sometimes been the case with previous attemptsto set up ministerial committees to develop and monitor energy policy bothin Pakistan and elsewhere. It is equally important that the DGER be giventhe additional technical and financial resources that will enable them todischarge effectively their newly expanded role as an energy planning secre-tariat. In this context, the Government could consider a technical assistanceproject to help DGER develop and utilize the necessary technical expertise.

- 45 -
FUTURE DEMAND FOR ENERGY
Overview
6.01 Energy consumption in Pakistan will continue to grow at a rapidrate during the 1980s primarily because the Government is aiming for a higherrate of GDP growth than in the 1970s, and because this higher growth isexpected to emanate largely from an increase in industrial activity and fur-ther agricultural mechanization, both of which will be energy-intensive innature. Energy consumption in the transport sector, too, will continue togrow at historically high levels and the demand for energy consuming amenitieswill increase with rising real incomes. The continued substitution of commer-cial for noncommercial energy in the short term will result in higher growthrates for commercial energy consumption than for all energy sources takentogether.
6.02 Between FY72 and FY79, a 7.25 percent annual average increase inprimary commercial energy consumption was associated with a GDP growth rateof about 5%, resulting in a commercial energy/GDP growth coefficient value of1.45 which is higher than the corresponding value for middle and high incomecountries. If this coefficient value continues to hold in the future, andthere is little evidence that it would be lowered significantly in the shortterm, and if GDP growth during the next decade averages between 5.25 and 5.75percent per annum, commercial energy consumption will grow at an average rateof about 7.6 to 8. 3 percent per annum.
6.03 Within this overall figure, the consumption of different fuelswill grow, as it has done in the past, at widely varying rates. The bulkof additional energy demand up to 1985 will continue to be met from increasedconsumption of natural gas and hydroelectric power, forecast to grow atapproximately 10% and 12% per annum, respectively. Coal and nuclear power areexpected to play a marginal role as sources of energy in the immediate futurealthough their contribution could increase significantly in the latter half ofthis decade and in the 1990's; and, though the consumption of LPG is expectedto increase rapidly, its contribution to total energy supply will continue tobe small. The consumption of oil and oil products is expected to increase atabout 6% per year, a rate which is below the projected rate of growth ofoverall commercial energy consumption but marginally higher than the rate atwhich the consumption of petroleum products has been rising to date. This isa reflection of the changed sectoral consumption pattern for petroleum productsand the limited possibilities for further substitution away from oil in theshort term.
The Demand for Petroleum
6.04 Primary consumption of oil and oil products will grow from 4.3 mil-lion tons in FY79 to 6.03 million tons in FY85--an annual average growth rateof 6%. The sectoral consumption pattern for petroleum products will continueto evolve broadly around historical trends, with the exception that the abso-lute decline in petroleum product consumption in the agricultural and powersectors can no longer be expected to mitigate the overall rate of demand

- 46 -
growth: in agriculture, because higher output growth should offset anyreductions in demand that will accompany further village electrification andthe concomitant shift from diesel to electric tubewells; and in the powersector because oil consumption for thermal electricity generation is alreadyminiscule (15,500 tons or 1% of the total energy consumed in thermal powergeneration) and accounts for less than 0.5% of total petroleum consumption.Any further decreases, if they take place at all, will only have a marginalimpact on the overall rate of growth of petroleum consumption.
6.05 Industrial oil consumption may show a further decline as the supplyof gas and electricity, the main substitutes, increases, but again the impacton total consumption will be small. In the domestic and transport sectors,oil consumption will continue to increase at above average rates, and theshare of other or unallocated consumption should register a further decline.
Table 6.1
Projected Sectoral Consumption of Petroleum Products 1/
Percentage Consumed Annual AverageFY79 FY85 Growth Rate FY79-85
Sector Actual Projected Projected
Domestic 17.4 18.6 7%Industry 5.2 3.5 -0.5%Agriculture 6.0 5.4 4%Transport 57.4 64.0 8%Power 0.4 0.2 0Other 13.6 8.3 -2%
1/ These projections are "best estimates" on the basis of available dataand should be treated as indicative only.
6.06 Differences in sectoral consumption growth will have an importantimpact on the structure of petroleum product demand in the 1980s. Above-average growth in the transport and domestic sectors will mean continuedrapid growth for the major products they consume--high speed diesel, gasoline,aviation fuel and kerosene. The consumption of light diesel oil, the mainagricultural fuel, is expected to register a modest increase and fuel oil con-sumption is expected to stabilize at about the present levels. Applying theexpected growth rates of sectoral consumption to the proportion in which theyconsume various refinery products results in the following projected demandpattern for these products.

- 47 -
Table 6.2
Projected Demand for Petroleum Products
Percentage Consumption Annual Average GrowthFY79 FY85 Rate FY79-85
Product Actual Proiected Projected
Aviation fuels 8.6 9.4 8%Gasoline-regular 10.1 12.2 8%Gasoline-premium 2.9 3.3 8%Diesel-light 6.3 5.5 4%Diesel-high speed 40.6 41.6 6.7%Kerosene 17.8 18.5 6.8%Fuel oil 13.7 9.5 0%
6.07 The share of motor spirits and kerosene (which are already deficitproducts) in total petroleum consumption is projected to increase stillfurther and that of fuel oil and light diesel oil to register a furtherdecline.
The Demand for Natural Gas
6.08 The consumption of natural gas (including its use as feedstock forfertilizer) is projected to increase at about 10 percent per annum over thenext decade, a rate which is higher than the 7.6% historic consumption growthrate for the seventies. However, the use of gas as an energy source isexpected to grow at a somewhat lower rate of about 9%. This is due to theprojected increases in gas consumption by the fertilizer industry, whereconsumption growth has always been greater and where large increases indomestic fertilizer production capacity are planned in the near future. Thesectoral consumption pattern for gas consumption is likely to evolve on thebasis of present trends with the residential and commercial sectors increasingtheir share within the energy users, and fertilizer feedstock increasing itsshare in gas consumption for all purposes. The total number of gas consumers,425,000 at the end of FY78, is projected to increase to 814,000 by the end ofFY83 (equivalent to a 14 percent annual average rate of growth) and extra-polating this trend to FY85 suggests that their number will exceed onemillion in that year.
The Demand for Coal
6.09 The consumption of coal is projected to register only a smallincrease from its current level of 1.4 million tons to about 1.7 milliontons in 1985. However, beyond that date coal consumption could rise rapidlyas the 250MW mine-mouth power generating station at Lakhra began operation.In the longer run, coal consumption, particularly in the brick kiln industrywhich currently accounts for 90% of total coal usage, will depend criticallyon the Government's supply and pricing policy for natural gas which is themain competing fuel.

- 48 -
Electricity Demand
6.10 Sales of electric power in Pakistan are projected to grow at anannual rate of 12 percent in the short term (until 1983) and at 9 percentfor the remainder of the decade. This rate is considerably higher than the8% average historic growth rate that has characterized electric power salesin the period FY71-78 for two main reasons. First, the years FY76/77 wereperiods of industrial stagnation and political unrest which resulted inatypical patterns of electricity consumption (with sales growing at a meager1.6% and 3%, respectively) and led to a reduced average growth rate for the1970's. Second, maximum demand during this period was constrained by gener-ation capacity shortages and therefore understated the latent demand forelectric power consumption. These constraints were to a large extent overcomeby the recent commissioning of the first four units at Tarbela and there wasa concomitant growth in sales of 19% in FY78--as indication of this latentdemand which suggests that the projected rate of demand growth at 12% may,even with revised pricing, prove to be conservative.
6.11 Although electricity sales are projected to grow at about 12%, aplanned reduction in the high existing level of system losses (33% in FY79)through rehabilitation and improvement of WAPDA's secondary transmission anddistribution system, should enable the rate of growth of electricity gener-ation and maximum demand to be kept at about 9% over this period. Thisimplies that by FY85, maximum demand and generation for the integratedWAPDA/KESC system will rise by about 60% from the present level to 4,280 MWand 23,512 GWh respectively. 1/ Approximately 65% or 14,000 GWh of this willbe met from planned increases in hydro generation capacity. The favorableimpact of this increase in hydroenergy supply on the country's balance ofpayments situation can be crudely estimated on the basis of the value ofsavings in hydrocarbon fuel usage for thermal plants. Hydrogeneration inthat year alone would save the equivalent of 4.2 million tons of oil with aFY79 value of US$525 million.
6.12 The government has set itself ambitious targets with regard tonew connections to the electricity system. During the course of the FiveYear Plan Period FY79-83, WAPDA's yearly targets for new connectionshave been set as follows:
Category Yearly Target
General consumers 140,000Industial 11,000Agricultural 14,000Villages 1,000
In addition, 30,000 new consumers are expected to be added every year tothe KESC system.
1/ Based on FY79 generation figures supplied by the Energy Resources Cell.See also para. 3.11.

- 49 -
6.13 The Government's rural electrification policy has been rationalizedto take into account economic criteria for setting priorities in villageselection. The emphasis now is on maximizing the potential number of benefi-ciaries rather than, as was sometimes the case in the past, maximizing thenumber of villages without any other considerations. Successful implementa-tion of the rural electrification campaign would by 1985 double the proportionof the rural population with access to electricity from the present estimatedlevel of about 10 to 15%. Concentration of the electrification program insweet groundwater areas would have a major impact on private tubewell develop-ment and thus on agricultural growth, but regional balance considerations willalso need to be considered in the selection of rural electrification schemes.
Firewood
6.14 Despite progressive substitution by commercial energy sources,firewood demand will continue to grow rapidly with population growth.Tentative estimates of fuelwood consumption growth place it at about 30million cubic meters in the year 2000. If this demand is to be met entirelyfrom fuelwood plantations, and the serious ecological implications of notdoing so severely limit the Government's freedom to maneuver in this area, afivefold increase in the current fuelwood planting program to 135,000 ha/yearis required. The Government has recognized the inadequacy of the existingplantation program and is making efforts to increase the size and scope ofthis program but this is an area which will require continued attention andsupport.
Energy Conservation and Demand Management
6.15 Rapid projected increases in commercial energy consumption makethe need for adopting appropriate energy conservation measures and promotingmore efficient energy utilization methods an important element of the demandmanagement strategy that Pakistan should adopt with regard to the developmentof this sector. So far, the emphasis has been on ensuring an adequate supplyof energy to the industrial and agricultural sectors and stimulating thedevelopment of indigenous resources to reduce national dependance on importedenergy sources.
6.16 As an initial reaction to the energy crisis, this policy has beenadequate and the bold steps that the Government has taken in raising theoverall level of energy prices should, in themselves, encourage greaterefficiency in energy utilization. The Government, through the DGER, hasalso recently embarked on a nationwide media based campaign to directlyencourage energy conservation. Although the long term impact of this campaignin moderating the growth of energy demand will only be felt in the future,its program of popular songs and slogans endorsed by well-known media person-alities has already succeeded in raising the level of public awareness ofthe issues and needs for conserving not only imported petroleum but alsoindigenous fuels, such as natural gas. DGER has also recently organizeda national symposium on energy conservation at which delegates from leadingpublic and private sector agencies and academic institutions examined theprospects for more efficient energy utilization in the different consumingsectors.

- 50 -
6.17 However, further work now needs to be done in consolidating thesegains through a series of specific policy measures that would directly improvethe efficiency of energy consumption. As a first step in this process, theGovernment should identify the sectors and processes where the largest poten-tial gains lie in terms of improved energy consumption efficiency. Preliminaryanalysis, based on the sectoral energy consumption growth rates 1/, and theshares of the different sectors in total commercial energy consumption,suggests that either the industrial sector or the residential sector couldprove to be useful starting points for such an exercise. Industrial energyconsumption accounts for nearly half of all commercial energy demand and,whereas the Government has been rightly concerned with reviving privateinvestment and industrial output after the politically difficult years of themid-1970s, an attempt could now be made in ensuring that the anticipatedexpansion of industrial activity in the 1980's took adequate consideration ofthe changed energy situation. In this context, an energy audit of a sample ofthe industrial sector could be considered as a means of identifying specificareas for improvement. In the residential sector, improved access to moreenergy efficient cooking utensils would have widespread benefits which wouldspill over into the noncommercial energy sector where energy transformationtechniques have traditionally been less efficient. Evidence from othercountries suggests that relatively simple and low cost improvements to stovedesign can yield large benefits in a short period, and consideration should begiven to the early introduction and promotion of this technology.
6.18 Further work also needs to be done in developing integrated andconsistent projections of national energy demand which could form the basisfor planned investments in the energy sector. To date, no central organiza-tion has been charged with the responsibility for producing such integratedenergy demand forecasts and consequently, the process for ranking investmentpriorities across the different energy subsectors and even for justifyingindividual projects within these sectors, has sometimes been of an ad hocnature. Demand forecasting for specific fuels has traditionally been done bythe various organizations that are responsible for their development, which,in itself, is not a bad system for they are often best informed and equippedto make such detailed projections. What has been lacking, however, is a bodywhich could integrate these projections and produce a set of data which wouldbe both internally consistent and take into account broader considerationssuch as the likely impact of changes in sectoral growth rates, energy conser-vation measures and interfuel competition and relative pricing.
6.19 This problem is particularly acute for the power sector where thelong lead time associated with the development of new projects implies thatreliable forecasts for maximum demand and generation growth be made availablefor at least a five to ten year time horizon, if power demand growth is to beused as a basis for justifying the size and timing of the power sector invest-ment program. Both the methodology for projecting power demand, which islargely unrelated to historic and present economic development trends, andthe short-term horizon over which these projections are made--currently firm
1/ See para. 2.06 above.

- 51 -
projections are only available to 1983--deserve urgent attention. The problemis further exacerbated by the fact that WAPDA and KESC, who are responsiblefor making these projections, continue to do so quite independently of eachother, even though the completion of a bulk power "expressway" connectingthese systems should, after 1982, result in a fully integrated nationalelectricity network which should be planned for as such. Ideally, powersector planning should be based on the increasingly detailed application forprogressively shorter time horizons of a long-term plan based on more generaltrends. As an interim approach, however, the Government should consider theintroduction of a five year rolling horizon for detailed power demand fore-casting with a more general extrapolation of these trends for a further fiveyears. Furthermore, power planning should now be carried out for the nationalsystem as a whole with the responsibility and the manpower for this taskbeing located in one unit which could be housed, inter alia, in either theenergy section of the Planning Commission or the Ministry of Water and Power,or the Directorate of Energy Resources, or devolved to WAPDA.
6.20 In the other energy subsectors, too, there is a need to rationalizeand improve system planning and demand forecasting techniques. In the caseof petroleum products, forecasts are made by the Ministry of Petroleum andNatural Resources, the Oil Companies Advisory Committee and other privatesector organizations. The coordination between these bodies should beimproved to avoid duplication and ensure consistency. In the case of naturalgas and coal, improvements could be made in relating their forecasted consump-tion to anticipated developments in the supply of competing fuels. And inthe case of firewood and other noncommercial energy sources, the sparcity ofdata on current consumption levels implies that improvements to this database are a necessary pre-requisite for formulating any reliable projectionsof demand.

- 52 -
FUTURE ENERGY SUPPLY
Overview
7.01 To meet the projected demand for energy, commercial energy supplywill have to increase from 12.1 million TOE in FY79 to 19.6 million TOE in1985. Much of this increase will come from additions to hydroelectric capacityand natural gas production and the share of these fuels in overall commercialenergy supply is projected to increase further. Oil and oil products willcontinue to supply 33 percent of the country's commercial energy needs in 1985and their absolute consumption in that year will be 40 percent higher than itis today. However, the overall energy development scenario remains optimistic.Not only will the major indigenous commercial fuels - natural gas and hydro-electricity - increase their share in total energy supply at the expense ofpetroleum and replace it as the single most important source of commercialenergy, but also projected increases in domestic crude oil production shouldfurther reduce the country's dependence on imported energy sources and resultin valuable savings of foreign exchange.
7.02 In the medium term (beyond 1985) the development of indigenouscoal resources could make a substantial contribution to national energy supplyand there are also a number of promising developments in the field of non-com-mercial energy which could further moderate the rate of growth of commercialenergy demand. However, this will depend on the early formulation of anintegrated national coal development strategy and important decisions willalso have to be taken on two other primary energy sources - hydroelectricityand nuclear power - which have long gestation periods but could significantlyalter the structure of national energy supply in the 1970's.
Table 7.1
Projected Supply of Commercial Energy
Source Percentage Share Annual AverageFY79 FY85 Growth Rate FY79-85
(Actual) (Projected) (Projected)
Petroleum 38.1 33.4 6.0Natural Gas 35.5 36.8 9.0Coal 5.4 4.3 4.5LPG 0.3 0.6 20Hydro 20.5 24.8 11.7Nuclear 0.2 0.1 0
Total (BTU x 10 ) 482191 778000 8.25

- 53 -
Petroleum Supply
7.03 Crude Oil. Unless domestic production of crude oil increases fromits present level of 0.5 million tons per year, Pakistan will have to import,by 1985, about 5.5 million tons of crude oil and refined products annually ata minimum cost of about $1.2 billion in FY80 prices. Furthermore, quite apartfrom the higher prices that will have to be paid for imported oil, there maybe difficulties in obtaining adequate and uninterrupted supplies. Effortsto increase domestic crude oil production gain additional importance as aresult of these factors.
7.04 In the short term, Pakistan's success in reducing its dependance onimported crude oil will be determined by its ability to bring four potentialfields into full production: Toot and Meyal, which are already producing;Adhi, which is expected to start producing by April 1980, although initiallyfrom a single well; and Dhodhak, which has yet to be developed. In 1978 itwas estimated that the production from these fields could be increased to 2.4million tons per year by FY83. This would have entailed a doubling of outputat existing fields supplemented by an additional one million tons of outputper year from Dhodhak. It was recognized then that estimates of the productionpotential of the Dhodhak field, which could not be made accurately withoutadditional seismic surveying and drilling, were the key variable influencingoil production in the short run.
7.05 During the last year, however, technical difficulties with theOGDG drilling program at Toot and delays in the completion of predevelopmentwork at Dhodhak suggest that this earlier forecast needs to be revised withrespect to timing. On the basis of present production levels and the paceof development drilling activity, it is now estimated that production ofcrude oil from the Toot, Meyal and Adhi field will increase to about 1.6million tons in 1985, which is sufficient to meet over half the projectedincrease in petroleum demand over this period and would reduce Pakistan'snet oil import bill in that year by an estimated $225 million in FY80 prices.
7.06 In the medium term, Pakistan's continuing dependency on importedcrude oil will be critically determined by the success of current explorationactivity being undertaken by foreign exploration companies and by OGDC. Givena modest degree of success for the expected increased level of exploration,further reductions in the import bill could result by the late 1980s. It isconceivable that by the late 1980s Pakistan could achieve a period of self-sufficiency in crude oil supply.
7.07 Refined Products. Total refining capacity is expected to increasefrom its present level of 5.1 million tons per year, as a result of the 25,000barrels/day expansion program for the Attock Oil Refinery in Rawalpindi.This expansion, which is planned in two stages, will increase that refinery'soutput to 1.3 million tons by 1985 and result in total refinery output growingto about 6 million tons in that year. Although this should help to alleviatelargely the overall shortage of refining capacity that has characterized therecent supply of refined products, it will not directly solve the problem ofthe existing imbalance between the structure of product demand and domesticrefinery output mix which was discussed earlier. 1/ However, the government
1/ See also paras 3.08, 4.07.

- 54 -
has recently announced that a Vis-Breaker project is being commissioned toincrease the share of high-speed diesel which is one of the major deficitproducts in the output mix of domestic refineries. This project, which shouldbe in operation by 1982, will help in providing additional middle distillateproducts but a supply-oriented approach can only form part of the solution toa problem which has been caused largely by the government's historical demandmanagement and refined product pricing policies. As such, it is imperativethat the Government also adopt appropriate policies to influence the structureof product demand in tandem with the measures that have been taken to influencethe mix of domestic refinery output. The Government has also taken steps toimprove the transportation facilities for refined petroleum products. A 16"products pipeline is being constructed between Karachi and Multan, and itscompletion in 1981 should ease the strain on the railways for movement ofthese products.
Natural Gas Supply'
7.08 Since it is expected that relatively abundant supplies of naturalgas will continue to be available in Pakistan, at least in the medium term,production levels will be determined by the growth in local demand and theexpansion in transmission and distribution facilities to keep pace with thisdemand. Demand growth has been projected at about 10% per annum over the nextfive years and planned expansions in transmission capacity should be adequateto meet these needs. However, a better knowledge of potential gas use isessential and a study of this should be launched soon. Total transmissioncapacity is expec5ed to increase from the FY78 level of 22.2 million m /dayto 26.9 million m /day in FY83. A gas transmission pipeline is also plannedto link Quetta, the capital of Baluchistan Province, to the national networkand the number of consumers nationwide is projected to double by 1985.
The Supply of Electricity
7.09 Generation Capacity. The power capacity expansion program has onlybeen clearly formulated to 1983, the end of the Fifth Plan period. Giventhe long lead time that would be required to bring on stream any new unitsthat are not part of this plan, and on the basis of the estimated completiondates for further expansion at Tarbela, projections for power capacity can bemade for 1985. Any projections beyond that date, however, must necessarily bespeculative given the lack of adequate information, and only general orders ofmagnitude can be determined on the basis of current and projected demand trends.
7.10 By 1983, total capacity is projected to increase by 2,090 MW toabout 5,440 MW. Of this, 1,330 MW will be expansions to hydro capacity andthe remainder thermal. Thermal capacity expansion continues to form a partof the government's power sector development strategy because of the existingand expected substantial variation of hydro output between the high water andlow water months, referred to earlier. 1/ Consequently, during the high water
1/ See para. 3.16.

- 55 -
months hydro capability would be fully utilized and thermal generation reduced,whereas in the low water months hydro capacity would operate on base andthermal plants would be utilized essentially to cover intermediate and peakdemand.
Generation Capacity Expansion Program
Source FY79 % share FY83 % shareMW MW
Hydro 1,567 47 2,897 53Thermal 1,649 49 2,409 44Nuclear 137 4 137 3
Total 3,353 5,443
7.11 Between 1983 and 1985, the completion of units 9-12 at Tarbelawill add another 700 MW to hydro capacity and additions of 400 MW to thermalcapacity are also planned which will raise total generating capacity to 6,500MW in that year. Beyond 1985, the structure and timing of capacity expansionis as yet undetermined. WAPDA has allocated $20 million in the current planperiod for a study to examine and rank the major potential hydro projects anda feasibility study of the Kalabagh hydro project (1,750 MW) is also beingcommissioned. Other studies underway relate to the option of adding furthercapacity at Tarbela, to the possibility of using coal from the Lakhra fieldfor a mine-mouth thermal station and to the construction of a 600 MW nuclearplant at Chashma. However, these proposals are still at a preliminary stageand subject to reconsideration.
7.12 Transmission and Distribution. Expansion and rehabilitation ofthe transmission and distribution system are vital to achieve the objectivesset by the government and to reduce the high system losses described earlier.Extra High Voltage system studies carried out by consultants have shownjustification for a 500 kV transmission system which should be built fromTarbela to the Hyderabad/Karachi area in order to fully integrate the hydro-electric sources in the north with the thermal plants and market in the centerand south. Such an interconnection would allow the full use of the hydrocapability during the high water months (July-September) and would givethermal support to the system from the center and the south during low watermonths (March-May). This interconnection, which constitutes a "bulk powerexpressway", would also reduce fuel expenses (for spinning reserves) andgenerating capacity requirements through the pooling of the reserves of WAPDAand KESC.
7.13 During the period FY79-83 two 500 kV lines will be completed fromTarbela to Faisalabad (the first is already operational but energized at 220kV, and the second will be operational in FY83. One of these lines will beextended from Faisalabad to Hyderabad/Karachi with intermediate substationsat Multan and Guddu, for completion in FY83. Again, initial operation isenvisaged at 220 kV. The entire 500 kV interconnection will be converted to500 kV operation with the commissioning of the last Tarbela unit (Unit 12)scheduled for November 1983.

- 56 -
7.14 In addition, a substantial program to extend, to convert to highervoltage, and to reinforce the 220 kV, 132 kV and 66 kV system is required.These improvements to the secondary transmission system are essential toimprove voltage conditions, reduce losses, and to meet the planned increasein new connections.
Renewable Energy Sources
7.15 Interest in harnessing the potential of renewable energy sourcessuch as solar, wind, biogas and geothermal energy has a fairly recent originin Pakistan, as in most other developing and developed countries. Conse-quently, a strategy for the development of these sources is still at anexperimental stage and they are unlikely to have a substantial impact on theenergy supply and consumption pattern in the immediate future. Nevertheless,some of the results that have been obtained to date are promising and suggestthat, especially in the provision of energy to isolated rural areas where theextension of the conventional energy network is uneconomic, there is somepotential for the application of three such sources in particular - biogas,micro-hydro and solar energy.
Biogas
7.16 The raw materials used for biogas generation, animal manure orcrop residues, have traditionally been used as either fuel or fertilizerin Pakistan. Cowdung is estimated to supply annually about 1.15 millionTOE of energy, largely for residential consumption in rural areas. Althoughthis accounts for over 15% of the total energy supplied by all forms ofnoncommercial energy sources, it is only a small proportion of the energythat could be supplied from this source because over 80% of the availablesupply of cow manure is currently used as fertilizer. The advantage ofbiogas plants is that with the application of a relatively simple technologythis choice would be rendered irrelevant and the supply of animal manurecould be used both as fuel and as fertilizer.
7.17 Whenever organic waste decays in an anaerobic environment, methanegas is generated. This is combustible and can be used as a fuel. As anadditional benefit, the slurry left behind in the fermentation chamber afterthe gas has been generated is at least as effective a form of fertilizer, asthe initial manure. There is now a rich and varied literature on the economicsof biogas plants and their application to rural areas in southern and easternAsia. In Pakistan, the Government estimates that the construction of a 2000cubic ft/day biogas plant, which would satisfy the basic energy needs of asmall village, could result in annual savings of Rs 110,000 in terms ofreduced kerosene consumption at a total capital cost of construction anddistribution of Rs 75,000. Plant operational costs are low and time spent inthe collection of animal manure is a cost that is incurred under both systems.
7.18 The Energy Resources Cell, which is responsible for the develop-ment of nonconventional energy sources, has already set up demonstrationbiogas plants throughout the country but these have been smaller units

- 57 -
designed for use at the household level. Moreover, five village level biogasplants are to be installed by June 1980 and their social and economic accept-ability is to be closely monitored. It is important that this initial momentumbe maintained through adequate government funding and support, to determinewhether the widespread use of biogas as a rural energy source is as promisinga development in the field of nonconventional energy as it appears.
Micro-hydro
7.19 In the northern areas of Pakistan there are numerous sites with apotential for installing small hydroelectric generators in the 100-200 kWrange, but their conventional development can only be achieved at high unitcosts. The Appropriate Technology Development Organization of the Governmentof Pakistan is working on an indigenous technology for their utilizationwhich would be based on a simple design and low cost civil works that couldbe carried out by the local residents and which would make their developmenteconomical and affordable. The results from the few pilot plants that havebeen set up appear promising but this work is still at an exploratory stageand requires further critical examination.
Solar Energy
7.20 Research into the development and application of solar energyconversion has been done in Pakistan by academic institutions - such as someengineering colleges and universities; semi-autonomous government bodies -the Pakistan Council of Scientific and Industrial Research and the AtomicEnergy Centre; and by the Energy Resources Cell and other government depart-ments. Again, these developments are at an exploratory stage but useful workhas been done in the application of solar energy for cooling and heatingwater, desalination of sea water, electricity generation through photovoltaiccells in rural areas, and for conversion into mechanical energy for pumpingwater. In this field, there is now a need for government to attempt to con-solidate and evaluate the disparate work of many different institutions, toidentify the most promising avenues for further development, and to allocatefuture funds on the basis of this set of priorities. This will improveinter-organizational coordination and reduce the duplication and waste thatare potential hazards of the existing system.
Other Sources
7.21 The Government has also experimented with other nonconventionalenergy forms, but so far with only limited success. In 1967, six windmillswere installed by WAPDA in Sind and Baluchistan provinces and this area hasbeen followed up periodically; a study done by the Energy Resources Cell in1976 showed that the widespread application of wind energy was neither tech-nically nor economically feasible at that time. However, this conclusionneeds to be reexamined in the light of the recent doubling of internationaloil prices and the technological improvements that have taken place in thisfield.
7.22 Finally, with regard to geothermal energy, a few springs inBaluchistan and northern Pakistan have been identified as potential sourcesfor electricity generation but this has yet to be confirmed by further

- 58 -
analysis. Overall however, the potential for increased use of nonconventionalenergy sources remains good, with biogas plants providing perhaps the mostpromising results in the near future. There is now a need for Government totake stock of the activities of different organizations that are involved inthis field. There has perhaps been a tendency to try and work on all thingsat once in the past, and now the more promising avenues should get a largershare of government funding and government support.
The Medium-Term Perspective
7.23 One of the major conclusions of this report is that the prognosisfor energy supply in Pakistan over this decade is a reasonably optimisticone. However, this is not meant to detract from the real and often difficultdecisions that will have to be made by the Government during the first half ofthis decade on developing a national energy strategy for the 1990's. Thesedecisions will have to be made soon because the supply of oil and gas willbecome more uncertain and more expensive in the 1990's and because of the longgestation periods associated with projects to increase the supply of othercompeting fuels, particularly hydroelectricity and nuclear energy. In boththese areas the decisions that have to be taken will have an important bearingon the structure of future energy supply.
7.24 In the first of these fields, hydroelectric power, further work isrequired on reassessing and developing the country's hydro potential in thelight of recent increases in the price of competing fuels, and on ranking themajor potential hydro projects on the basis of relative costs and projectedload growth. In the case of nuclear energy, the problems are as much politicalin nature as economic. On the basis of existing data, a case might be madefor the installation of substantial nuclear generating capacity in the 1990'swhen the remaining reserves of indigenous natural gas may become scarce enoughto discourage their use for electric power generation. However, considerablework needs to be done on comparing the costs of generating electricity fromnuclear power versus the use of natural gas, and the cost of installingadditional hydro capacity. There is also a need to develop an integratedpolicy for the exploitation of the country's coal resources which woulddetermine inter alia, the respective roles of the public and private sectorin the coal industry; the policy with regard to the supply and pricing ofcompeting fuels; and the incentives that would be offered to consumers ofalternative fuels who shifted to coal.
7.25 The Government is cognizant of these problems and it has set asidesubstantial financial resources to examine these issues. 1/ Nevertheless, thedevelopment of an integrated national energy strategy continues to dependcritically on the establishment of an effective energy planning organization,the need for which has been discussed earlier as have the steps been taken bythe Government towards the establishment of such a capability (paras. 5.15-16).
1/ See para. 7.10 above.

- 59 -
ENERGY SECTOR INVESTMENT REQUIREMENT
8.01 The planned development of indigenous energy resources will requirelarge scale investment in this sector and the Government has recognized thisby allocating Rs 33.5 billion (US$3.4 billion) for investments in the energysector during the Fifth Plan period (FY79-83). This is equivalent to 22% ofall public investment during this period, a proportion that is substantiallyhigher than in previous years and well above the average for developingcountries as a whole (about 15%). The bulk of this planned investment (87percent) will continue to be for the development of the power sector, butRs 5.6 billion ($570 million) have been earmarked for public investment inexploration and development in the oil and gas sector.
8.02 Since the publication of the Fifth Plan document in 1978, minormodifications have been made to the energy sector investment program toaccount for a revision of the forecasts for maximum demand and generationgrowth in the power sector and to take account of the anticipated increase inprivate investment in exploration and development in the oil and gas sector.The Government is currently reviewing and updating its planned investmentprogram for the energy sector. The results of this exercise are expectedshortly but were not available at the time of writing this report. Conse-quently, the following discussion of the Government's investment programshould be treated as indicative only.
The Power Sector
8.03 The main changes that have been made to the power sector investmentprogram since the publication of the Fifth Plan Document relate to postponingbeyond FY83 some of the thermal projects that had been proposed therein, in-cluding the proposed nuclear plant at Chashma, and strengthening further theallocation for rehabilitation of the secondary transmission and distributionsystem. Total expenditures over the period FY79-83 (including escalation andinterest during construction) are now estimated at US$2,700 million with a 30percent foreign exchange component. The distribution of planned investments.is summarized below.

- 60 -
TABLE 8.1
Power Sector Investment Program FY79-83
MillionRupees US$
GenerationOn going projects 4,590 464New projects 4,945 499
Total 9,535 963 36%
Primary Transmission
On going projects 2,789 282New projects 1,455 147Total 4,244 429 16%
Secondary Transmission
Transmission 2,809 284Substations 2,975 300Total 5,784 584 22%
Distribution and Rural Electrification 5,308 536 20%
Miscellaneous 453 46 2%
Tubewell Electrification 1,000 101 4%
Total FY79-83 26,324 2,659 100%
Foreign Exchange (8,944) (903)
8.04 The balance between generation, transmission and distribution hasbeen greatly improved and is now appropriate to the system's relative needs.The average investment per incremental kW of demand is about $1,000 andcorresponds to an historic cost of about $660 (FY78). This increase is notunreasonable given the system characteristics and the extensive rehabilitationwork that is planned._
The Oil and Gas Sector
8.05 The oil and gas sector investment program, which has been extendedto FY84, is more tentative than is the case for the power sector. This ispartly due to the greater uncertainties that surround the pace of progressin exploration activity and partly due to the more important role that theprivate sector is envisaged to play in developing oil and gas resources. Thenature, extent and timing of private sector investment activity can only beforecast in more general terms, given the relatively short history of theprivate sector's reinvolvement in developing indigenous reserves of oil andgas.

- 61 -
Table 8.2
Oil and Gas Sector Investment Program FY79-84
MillionRupees US$
Exploration and DevelopmentOGDC 3,960 400Private 1,385 140Total 5,345 540 61%
ProductionMari Field 129 13Sui Field 218 22Meyal Field 495 50
Total 842 85 10%
Pipelines and RefineriesProducts line 495 50Attock Expansion 248 25PRL Vis-breaker 346 35Dhodak Topping Plant 198 20Total 1,287 130 15%
Marketing 248 25 3%
Gas Transmission and Distribution 990 100 11%
Total 8,712 880 100%
8.06 Nevertheless, a key element in the Government's investment strategycontinues to be the encouragement of participation by foreign and local oilcompanies in domestic exploration activity, and their investment over thisperiod is expected to amount to $140 million. However, although this rep-resents a significant increase over the past, the overall amount is stillrelatively modest and would not be sufficient in itself to maintain an adequatelevel of exploration activity. For this reason, the other element of govern-ment investment strategy has been to strengthen OGDC to enable it to playan important complementary role in attaining the overall required level ofexploration and development. OGDC's planned investment program over thisperiod amounts to about $400 million and represents a nearly threefold increaseover the government's total contributions to this organization since itsinception. Furthermore, this figure does not take into account any additionalresources that OGDC could mobilize from other lending agencies to help financethe development of future fields once the production potential of such fieldshas been adequately proven. Overall, the plan will permit a sizeable level ofexploration and development drilling to be undertaken and its implementationwill be facilitated by the recent acquisition of modern drilling rigs andother auxiliary equipment.

- 62 -
8.07 The rest of the government's investment plan - i.e. in production,pipelines and refinery capacity, and gas transmission and distribution faci-lities - involves a relatively smaller level of investment which is necessaryto meet the forecast growth in domestic demand for petroleum products andnatural gas, respectively. This investment would be financed partly frominternal cash generation of the different operating companies and from localborrowing; except for the remaining government equity contribution for theproducts pipeline, the planned investment would impose little burden ongovernment resources. The proposed investment in refinery expansion reflectsPakistan's more pressing short-term need to add secondary refining capacityto existing facilities rather than any new refining capacity which wouldonly exacerbate the growing imbalance between petroleum products supply andconsumption patterns.

- 63 -
POTENTIAL BANK INVOLVEMENT
Previous Bank Group Involvement
9.01 The Bank Group has long been involved with the development of energyresources in Pakistan. The bulk of Bank investment in the energy sector hasbeen for the development of the country's large hydro electric potential andfor concomitant improvements and expansions to the power transmission anddistribution network. The Bank has also assisted in financing natural gastransportation and distribution facilities, and in the preservation andexpansion of the country's forestry resources. Through this involvement, theBank has helped the Government to strengthen the institutional framework ofthe energy sector and to move towards the rationalization of energy tariffs.
9.02 In the electric power sector, the Bank's participation in the IndusBasin Development Projects assisted in the construction of hydrogenerationfacilities at Mangla and Tarbela, which together account for 83% of thecountry's total hydroelectric generation capacity. Between 1955 and 1967,the Bank also made a series of four loans/credits to the Karachi ElectricSupply C'orporation for thermal generation facilities. Since 1970, the Bankhas been more directly involved with the Government's program to upgrade thepower transmission and distribution network. Three loans/credits totalling$118 million have been made to WAPDA to augment its transmission substationcapacity; finance part of a 500 kV transmission system that would eventuallycreate the backbone of a high voltage national power network; and to rehabili-tate and improve its secondary transmission network which would reduce thepresent high level of system losses and thereby enable existing generationplants to meet a higher level of power demand.
9.03 In the oil and gas sector, the Bank has been actively involved withthe development of Pakistan's natural gas transportation and distributionnetwork through five loans totalling $116 million to the Sui Gas TransmissionCompany and to the Sui Northern Pipeline Ltd. Bank involvement in petroleumdevelopment is much more recent. Through the Toot Oil and Gas DevelopmentProject, approved in December 1978, the Bank made a credit of US$30 millionto the Oil and Gas Development Corporation which would assist in increasingdomestic oil production, primarily from the Toot field; provide the means ofevaluating the potential of the recently discovered Dhodak field and preparefor its rapid exploitation; and assist in strengthening OGDC's capabilitiesin the effective conduct of oil operations. Through an IFC project approvedin 1979, the Bank Group has assisted in the expansion of domestic petroleumrefinery capacity to meet the anticipated growth of refined product demandand alleviate the cost of their imports.
9.04 Through an agricultural and forestry project, the Hazara ForestryProject, approved in December 1978, the Bank is assisting in the conservationand rehabilitation of the country's forestry resources. However, the informaluse of forestry resources continues to pose a serious ecological and environ-mental problem that should be more directly addressed in the future.

- 64 -
9.05 On the whole these projects have been satisfactorily executed,although institutional weaknesses have sometimes resulted in delays in projectimplementation. The Bank's contribution to improving the institutional andorganizational framework for the development of indigenous energy resourceshas been through including under its projects, the provision of management,accountancy and technical consultancy services to the main energy sectororganizations.
9.06 The Bank has also helped the Government to appraise its policieswith regard to energy pricing. Historical traditions and social considerationshave combined to result in a pricing structure that is complex and subject tomany distortions, but in the recent past the Government has sought to rectifythese anomalies and develop a more rationalized framework for energy productpricing which more accurately reflects relative economic costs. The Bank hasassisted in these efforts by collaborating or financing two studies of energytariffs in Pakistan. A power tariff study has just been completed and pro-posals for a revised power structure are under consideration; and an energypricing study is underway and should be completed by April 1980.
Proposed Strategy
9.07 No major change is proposed in the scope of Bank involvement in thedevelopment of indigenous energy resources. However, some shifts in emphasisare both desirable and necessary in view of the changed world energy situationand the Government's own energy sector strategy. Power sector lending andrelated technical assistance will continue to be the major vehicle for Bankinvestment in this area and should continue to address such issues as improve-ments in operating efficiency, tariff policy, load forecasting techniques,investment strategy and general institutional strengthening in the powersector. These issues are a major constraint to the development of an effectiveand efficient national power system.
9.08 In the oil and gas sector, Bank involvement will continue to grow.This is a reflection of the important role that increased domestic crude oilproduction is envisaged to play in meeting Pakistan's energy requirements inthe 1980's. Bank assistance will be required not only to finance the muchexpanded exploration and development program, but also to continue the institu-tion building role for OGDC which is necessary for its effective functioning.Bank assistance may also be required for the Government's program of furtherdelineating and confirming its natural gas reserves, the extent of which wouldhave a critical bearing on the Government's gas utilization policy and,through that, on the country's overall energy development strategy.
9.09 In the case of coal, there is now a potential for Bank involvementto assist the Government in delineating and developing indigenous reserves.Financial assistance may be required for the development of the Lakhra coalproject but Bank involvement would be equally valuable in helping the Govern-ment formulate an integrated development policy for coal and to determine theextent and potential of indigenous coal reserves.

- 65 -
9.10 The Bank is also prepared to work with the Government in addressingmore directly the issues of energy conservation, non-conventional energyresources and firewood conservation and supply. At this stage, it is unlikelythat the first area could be addressed within a project framework, although anenergy audit of the industrial sector could be financed through a subcomponentof an energy sector loan. Also as a project sub component, the Bank may beprepared to consider funding the construction and monitoring of experimentalBiogas plants, which form an important facet of the Government's own plans fornon-conventional energy development. Firewood and forestry resources couldbe addressed directly through project lending. Through the Hazara ForestryProject, the Bank has already started to work in this sector and furtherassistance can follow and build upon the successful implementation of thisproject.
9.11 Finally, external technical assistance in developing an effectiveinstitutional framework for national energy planning could have large payoffsfor the country. There is already a good data base and the Government hasindicated willingness to tackle national energy problems in an integratedcontext. The Bank's role could be to join with other agencies, such as theUNDP, and to provide the Government with technical assistance in developing aspecific institutional and organizational structure that could transform theseaspirations into an effective energy planning system. This could be achievedwithin the context of sector lending operations either as a separate technicalassistance project or as a subcomponent of a larger Bank project in the oiland gas or power sector.

- 66 -
ANNEX I
PAKISTAN
Commercial Energy Balance FY79
9(BTU xlO )
Supply ConsumptionPetroleum
Domestic Refinery Output (indigenous crude) 18,922Domestic Refinery Output (imported crude) 127,580Refined Product Imports 60,617Opening Stock 9,804Exports - 34,300Net supply 182,623Losses - 16,191Consumption 166,432of which: domestic 29,425
industry 8,376agriculture 10,110transport 95,612power generation 664other/Government 22,245
Natural Gas
Non-associated production 183,714Associated 22,286Processing Losses - 13,883Feedstock - 21,974Net Supply 170,143Losses - 12,936Consumption 157,207of which: domestic 11,868
commercial 5,941industrial 85,510power generation 53,888
Coal
Production 25,988Consumption 25,988of which: domestic 552
industry 24,675power generation 531others 230

- 67 -
Supply Consumption
LPG
Production 1,552Losses 11Consumption 1,542
of which: domestic 1,000transport 542
Electricity
Hydro power 98,784Nuclear 1,271Thermal (carried over from other primary
sources - oil, coal, gas) 55,084
Less auxiliary losses for hydro and nuclear - 306Net supply 154,833of which, allocable to; domestic 36,078
commercial 11,458industrial 61,468
agriculture 31,121others 14,708
Total
Net supply: Oil 182,623Gas 170,143Coal 25,988LPG 1,542Hydro 98,578Nuclear 1,171
480,045Less losses - 29,126
Consumption 450,919
of which: domestic 78,923commercial 17,399industry 180,029agriculture 41,231
transport 96,154other 37,183

- 68 -
ANNEX II
GLOSSARY OF CONVERSION UNITS
HEAT CONVERSIONSCommercial fuels:
Gas Btu/Ft3Sui Standard Natural Gas 980Sui Raw Natural Gas 933Mari Natural Gas 723Associated Gas 1,I00
oil BtullbIndigenous Crude Oil 19,000Imported Crude Oil 19,643Avgas 19,800JP-l 19,000JP-4 I18,7I5Motor Spirit 20,300H.O.B.C 20,200Diesel Oil 19,550Furnace Oil 18,500Kerosene 19,600Naptha 20,300L.P.G. 20,556
Electricity Btu/KwhElectricity 12,000
Coal Btul/b.Indigenous Coal 8,500Imported Coal 12,500
Non-Commercial FuelsFirewood (Urban) 7,650
(Rural) 6,263Dung Cake 3,754Bagasses 7,545Cotton Sticks I 5,400Shrubs 4,732Saw dust (Bura) 11,034Weeds 6,285Tobacco Sticks 4,732Charcoal 8,500
*Firewood, being purchased and used by the urban population, is of better quality than that ofcollected and burnt by the rural population.

- 69 -
ANNEX III
GOVERNMENT PETROLEUM LEGISLATION AND POLICY
1. Legislation governing the oil and gas sector is guided by theRegulation of Mines and Oilfields and Mineral Development (Government Control)Act 1948, which confers upon the Central Government the power to establishrules concerning the terms and conditions of concessions, the control ofproduction and distribution, pricing and other related matters. Theserules are known as the Pakistan Petroleum (Production) Rules and came intoforce in September 1949. The specific terms of the concession agreements,as they relate to working obligations, were negotiated with the individualexploration companies on a "case by case" basis.
2. The regulation was amended in 1976 in order to provide the clear-cut incentives that had hitherto been lacking and which would lead to anacceleration in the pace of gas and oil exploration activities in Pakistan.Specifically, the Amendment introduced two new features:
(a) production sharing agreements between the governmentand private companies;
(b) incentives to petroleum exploration companies. Theseinclude, inter alia, the following:
(i) royalty tax 1/ equal to 12-1/2 percent of the wellheadvalue, which can be included as part of the aggregatepayments to the government;
(ii) these latter payments were not to exceed 55 percent,nor be less than 50 percent 2/ of gross profits;
(iii) a concessionary 5-1/4 percent customs duty rate onimported machinery and equipment, effective for aperiod up to 24 months.
3. The other salient features of the petroleum concession agreementsare:
(a) a minimum expenditure to be incurred by the explorationcompany within a specified time period;
1/ Royalty payments, equal to 12-1/2 percent of the wellhead value, wereone of the clauses of the oil prospecting licenses and oil mining leasesof the 1949 Pakistan Petroleum Rules.
2/ Hitherto, the sum of payments to the Government and taxes on income inrespect of profits was not to be less than 50 percent but could exceed55%.

- 70 -
ANNEX III
(b) the government exercises the right to acquire participationin a commercial discovery by reimbursing a portion of theexpenditure;
(c) international market price for the wellhead price of crudeoil, reduced by transportation and other costs to the pointof sale;
(d) remittance of annual net profits.
4. Maximum emphasis has, therefore, been laid first on providing apolicy framework, which would stimulate a more intensive exploration forand development of.petroleum resources than has taken place previously. Toachieve the latter objective, the Government has not only provided the incen-tives to attract foreign private investment for oil and gas exploration,but has also reorganized and strengthened the technical and managerial exper-tise of the state-owned Oil and Gas Development Corporation (OGDC) in orderthat it might more effectively contribute to the development of known fields(Toot and Dhodak primarily) as well as to exploration in prospective areasby itself or in joint ventures with foreign oil companies.

ANNEX IV
TABLE 4.1
OIL RESERVES POSITION AS ON 30TH JUNE, 1979
Unit: Thousand U.S. Barrels
Field Oil in Place Recoverable Cummulative RemainingReserves Production Recoverable Reserves
Dhullan 91,500 43,500 40,009 3,491
Balkassar 101,500 33,000 29,831 3,169
Joyamir 10,590 4,950 4,675 275
Meyal 265,000 160,000 13,750 146,250
Tut 75.000 35,000 3,778 31,222
TOTAL: 543,590 276,450 92,043 184,407
Dodak (Not yet proven) 200,000 200,000 - 200,000
Source: GOP, Energy Year Book

- 72 -
ANNEX IVTAOLE 4. 2
FIELD.WISE PRODUCTION OF CRUDE OIL IN PAKISTAN
Unit U. S. Barrt1s
,ef Kihau- L.,au lji xrA .y a ,>'.-:r Y.B l .a ~s -a K a r. a Tn-' M,ey,< Tolal
1948 .. .. 18,000 115,000 195,000 231,000 - - 539,000
1949 ., .. .. 17,000 97,000 171,000 569,C00 - - - 854,000
19iO .. .. .. 1s,000 79,w00 61,000 598,000 - - - 756,000
1951 .. .. .. 16,000 92,000 74.000 587,000 - - 7G9,000
1952 .. .. . . 15,000 297,000 106,000 888,101 I 1,30,10i
1953 .. .. 13,000 511,00) 98,000 1,181,231 - _ 1,803,231
1954 .. .. 12,00t0 710,000 )90,000 1,132,232 - - - 1.944,232
1955 .. .. .. 14,000 831,000 87,000 1,130,215 - - - 2,062,215
1956 .. .. .. 12,000 870,000 9S,000 1,136,170 3,366 - - 2,119,536
1957 .. .. 13,000 963,000 90,000 1,132,865 4,553 - - 2,203,413
1953 ..8 . 13,000 992,000 125,000 1,131,492 21788 --- 2,264,280
1959 .. .. .. 14,000 1,077,000 71,000 1,149,321 25,606 2,326,927
1959-60 .. .. 13,033 1,177,904 87,402 657,375 30,020 - < ,965,734
3960-61 .. .. 7,530 1,500,361 86,691 655,672 33,694 - 2,283,998
1i61-6? .. .. 7.S31 1,763,304U 108,607 658,099 34,847 2 - ,572,688
1962-63 . 4,185 2,217,845 94,340 654 S666 34,446 - 3,005,482
1963-64 .. 4,471 2,247,090 135,988 757,961 21,769 - - 3,167.279
1964-65 .. .. ,101 2,262,914 165,289 773,981 12,928 - - 3,223.213
1965-66 .. .. 7,594 2.391,131 138,150 774,451 3,567 - 3, 31 ,893
1i66-57 .. .. 7,611 2,254,573 161,003 722,091 - - 3,145,278
1967-68 .. .. 3,202 2,271,631 163,834 679,029 -- 110,15i - 3,227,851
1968-69 .. .. 2,355 2,197,996 183,826 613,955 - 225,194 26.,726 3,48V,052
1969-70 .. . . 2,240 1,944,648 190,754 550,748 294,531 323,998 3,5 6,,l19
1970-71 .. .. 2,003 1,645,394 213,797 558,375 - 200,,172 7u6,764 3.3.6,505
1971-:72 .. .. 2.415 1_257,523 163,834 502.96) - * 78, 1, 2i 902,157 30 7)7,815
1972-73 . .. 2,908 1,124,950 167,456 540,027 - 302,292 921,263 3:Ou6,896
1973-74 , .. 2,435 803,279 164,066 722,306 - 257,436 905,696 7,855,213
1974-75 .. . 2,144 618,827 172.934 561,205 - 187,389 90 0,345 2,443,345
1975-76 * . .. 2,657 381,788 171,805 469,102 - 20C,902 1.285,493 2,511,747
1976-77 . ,. 1,927 264,435 195,935 419,714 - 446,306 2,414,703 3",743,020
1977-78 1,815 172,158 143,474 324,186 - 508,178 2,387,559 3,539,3701O7F_7O 20 1A 1,RQ1 Q,Q25? ?2] ,5nA - AIR ,57 2,517,5QL -4,7ln,934

- 73 -
ANNEX IVTable 4.3
PETROLEUM SUPPLYOUTPUT MIX FOR DONESTIC REFINERIES
FY79
Percentage Distribution of OutputProduct P.R.L. N.R.L. A.R.L. Total
Motor spirits 11.9 7.6 31.9 12.7
Aviation fuels 18.3 11.6 1.4 13.8
Diesel oil 28.0 28.4 30.0 28.4
Kerosene 1.3 5.1 12.5 4.1
Furnace oil 39.0 28.0 16.3 32.1
LPG 0.6 0.7 3.1 0.9
Naptha 0.7 7.4 - 3.2
Other non-energy 0.2 11.2 4.8 5.0
Gross Output 1881.8 1442.1 458.7 3782.6(000 tons)
Percent 49.8 38.1 12.1 100
Notes: (1) Totals may not add due to rounding.
(2) P.R.L. = Pakistan Refinery Limited. Refinery at Karachi;capacity 2.05 million tons. Shareholders: 42%Foreign (Shell-15%, Burmah Oil-15%, Caltex-12%);29%' Pakistani Private; 18% Pakistan State Oil;11% Government of Pakistan.
N.R.L. = National Refinery Limited; Refinery at Karachi;capacity 2.13 million tons. Shareholders: 100%local of which GOP 64.7%, Pakistani Private 35.3%.
A.R.L. = Attock Oil Company; Refinery at Rawalpindi;capacity 0.6 million tons. Shareholders: 100%Foreign.

ANNEX IV
Table 4.4Sectoral Distribution of Petroleum Consumption in Pakistan
FY65, FY68 and FY72-79
Year Domestic Industry Agriculture Transport Power Other/Govt. Total000 000 000 000 000 000 000Tons % Tons % Tons % Tons % Tons % Tons % Tons
1964-5 253.4 11.6 287.2 13.7 136.5 6.5 738.8 35.9 26.1 1.2 664.7 31.5 2106.7 100
1967-8 280.6 11.9 294.8 12.5 168.8 7.2 906.9 38.6 6.2 0.3 693.5 29.5 2350.9 100
1971-2 381.0 13.7 267.9 9.6 287.2 10.3 1116.2 40.1 99.6 3.6 630.6 22.7 2782.5 100
1972-3 396.3 13.8 247.4 8.6 323.3 11.3 1182.9 41.3 77.1 2.7 638.8 22.3 2865.9 100
1973-4 451.7 15.3 220.1 7.4 237.0 8.0 1258.7 42.5 202.9 6.9 558.1 19.9 2958.6 100
1974-5 538.0 15.8 225.8 6.6 270.7 7.9 1416.8 41.5 308.4 9.0 553.9 19.2 3413.6 100
1975-6 495.9 15.3 194.6 6.0 249.7 7.7 1536.5 47.4 156.9 4.8 608.7 18.8 3242.1 100
1976-7 577.8 17.1 238.7 7.1 243.3 7.2 1617.0 47.7 162.5 4.8 547.7 16.1 3386.9 100
1977-8 629.1 17.5 224.0 6.2 264.2 7.4 1907.8 53.0 34.9 1.0 540.4 15.0 3600.5 100
1978-9 680.9 17.4 202.8 5.2 234.6 6.0 2223.6 57.4 15.5 0.4 533.3 13.6 3890.7 100
Annual average growth rate
FY65-72 7.0 -1.0 11.2 6.1 21.0 -0.7 4.1
FY72-79 8.7 -3.9 -2.9 10.4 -23.7 -2.7 5.0
Source: Director General Energy Resources, GOP, Energy Year Book 1979,

ANNEX IVTABLE 4.5
POL CONSUMPTION 1978-79 Unit MetricTonsUi:(KJ x 109)I
Product Domestic Industry Agriculture Transport Power Other Govt Total
Aviation Fuels -10 - 334,676 _ - 334,666(0) - (14,244) (14,244)
M.S _- - 390,761 - _ 390,761(18,451) (18,451)
H.O.B.C. - - - 114,712 - - 114,712(5,390) (5,390)
S.K. 680,914 102 - _ 12,629 693,645(31,043) (5) (575) (31,623)
H,S.D. 51 43,852 - 1,325,732 12,882 196,627 1,579,144(2) (1,994) (60,285) (586) (8,941) (71,808)
L.D.O. - 1,887 234,563 6,796 282 2,397 245,925(86) (10,666) (309) (13) (109) (11,183)
F.O. 9 156,921 - 50,919 2,357 321,680 531,886(0) (6,752) (2,191) (101) (13,842) (22,886)
TOTAL: 680,974 202,752 234,563 2,223,596 15,521 533,333 3,890,739(31,045) (8,837) (10,666) (100,870) (700) (23,467) (175,585)
Source: Oil Companies Advisory Committee.
1/ 1KJ = 0.948 BTU

ANNEX IV
TABLE: 4.6 76
NATURAL GAS RESERVES AS ON 30th JUNE, 1979(Proven and Probable) Unit: (MMCFT)
Field Gas in place Originally Recover- Cumulative Remaining Market-able Reserves Production able Reserves
Sui. 11,830,000 8,624,441 1,797,558 6,826,883Zin. 1,000,000 100,000 - 100,000Uch. 2,500,000 2,500,000 - 2,500,000Khairpur. 1,000,000 1,000,000 - 1,000,000Kandkot. 406,606 406,606 - 406,606Mazaranl. 91,000 91,000 - 91,000Marl. 5,234,000 3,942,000 117,502 3,824,498Sari. 46,400 29,000 15,143 13,857Hundi. 80,000 50,000 -Dhulian/Meyal. - 1,378,294 238,097 1,140,197(Associated).
TOTAL 21,288,006 18,121,341 2,168,300 15,953,041
New Discoveries (Not yet evaluated)
Dhodak 4,500,000 4,500,000 - 4,500,000Pirkoh 6,000,000 6,000,000 - 6,000,000
Source: GOP, Energy Year Book and Staff Estimates.

AINNEX IV77
TABLE 4.7
PRODU(I 'f1N OF (6AS IN PARKI.STIAN
Unit :MM('CF T
Natural Gas Assoiated TotalYear _
Field ias at 933 Field Gas at 933 Fikdd Gas at 933
1955 .. .. 1,535 ^ 1,535 3 4 1,538 1,539
195rf . . .. 8,025 8,025 485 572 8,510 8,597
1957 .. .. 11,838 11,838 829 977 12,667 12,815
1958 . .. 15,202 15-202 1,276 1,504 16478 16.706
1959 17,414 17,414 1,'22 1,441 18,636 18,855
1959-60 .. .. .. 19,966 19,966 1,615 1,904 21,581 21,870
1960-61 .. .. .. 24,813 24,813 3,786 3,285 27,599 28,098
1961-62 .. .. 28,548 28,54S 3,525 4,156 32,073 32.,704
1962-63 . ., 32,776 32,776 3,776 4,452 36,552 37,228
19'.3-64 .. .. 41,601 41,601 4,120 4,857 45,721 46,458
1964-65 .. .. .. 50,940 50.940 4,379 5,163 55,31' 56,103
1955-66 .. .. 61,124 61,124 4,895 5,771 66,019 66,895
1966-67 .. .. .. 67,116 67,116 5,114 6,029 72,230 73,145
1967-S . . .. 7i,037, 71,037 5,337 6,2wQ 76.374 '77,329
1968-69 . . .. .. 89,23 88,117 5,009 5,9"6 94,232 94,023
1969-70 .. .. .. 103,692 101,454 7,516 8,861 ill,208 110,315
1970-71 .. .. .. 108,462 105,823 9,811 11,567 118,273 117,390
1971-72 .. .. .. 114,371 112,185 10,415 12,279 124,786 124,464
1972-73 .. .. .. 132,640 130,223 10,454 12,325 143,094 142,548
1973-74 .. .. .. 154,249 151,782 g8,912 10,507 163,161 162,289
1974-75 .. .. .. 166,149 163,610 9,806 11,561 1'i5,955 175,171
1 975-76 .. .. .. 165,042 159,092 11,171 13,170 176,213 172,262
1976-77 .. .. .. 174,790 167,680 16,079 18,957 190,869 186,637
1977-78 183,152 180,187 15,915 18,763 199,067 198,9501978-79 200,128 196,906 20,260 23,887 220,388 220,793
Source: Gas Producing Companies.Note.--933 Btu/cubic feet (Sui quality).

ANNEX IVTable 4.8
Sectoral Distribution of Natural Gas Consumption in Pakistan
FY65, FY68 and FY72-79 Btiilion Cubic Feet
Feedstock for
Year Residential Commercial Industry Power All Energy Fertilizer 1/ Total
1964-5 0.41 0.60 22.30 23.46 47.77 1.37 49.14
1967-8 0.76 1.10 35.73 27.91 65.50 1.84 67.36
1971-2 2.26 1.95 53.15 40.79 98.15 13.37 111.51
1972-3 2.98 2.31 62.09 43.33 11011 16.61 127.31
1973-4 3.92 2.98 71.03 48.55 126.48 18.02 144.50
1974-5 5.07 3.52 77.64 51.80 138.03 18.72 156.75
1975-6 6.21 4.21 78.01 49.52 137.95 18.98 156.92 X
1976-7 7.50 4.68 76.92 60.84 149.94 19.09 169.03
1977-8 9.81 5.30 84.93 60.33 160.37 19.12 179.49
1978-9 12.11 6.06 89.79 54.34 162.30 23.85 18-6.15
Annual average growth rates
FY65-72 27.5 18.3 13.2 8.3 10.8 38.5 12.4
FY72-79 27.0 17.0 7.8 1.3 7.4 8.6 7.6
1/ Feedstock consumption assumed as 60 percent of total consumption in fertilizer industry.
Source: Energy Year Book 1979, DGER, GOP.

ANNEX IV
Table 4.9
Coal Reserves As On Dec. 31, 1979
Field ~~~~~~~Reserves in Million of Tons
Proven Indicated Possible Total
A. Geological Survey
Makerwal/Gullakhel 1 5 10 16
Salt Range 6 60 20 86
Sor Range-Degari 12 33 - 45
Khost-Sharigh-Harnai 10 50 = 60
Mach 6 15 = 21
Lakhra 62 44 134 240
Jhampir-Meting 5 10 25 40
A Total 102 217 189 508
B. PMDC Estimates
SorRange-Kutch - - 30 30
Dukki _ _ 40 40
Pir Ismail Ziarat - - 100 100
Thatta - - 200 200
B Total - - 370 370
GRAND TOTAL 102 217 559 878
Notes: A - Based on results of Geological Survey of Pakistan
B - Additional reserves estimated by PMDC in coal fields whichare currently operating but have not been subjected to de-tailed geological investigation.
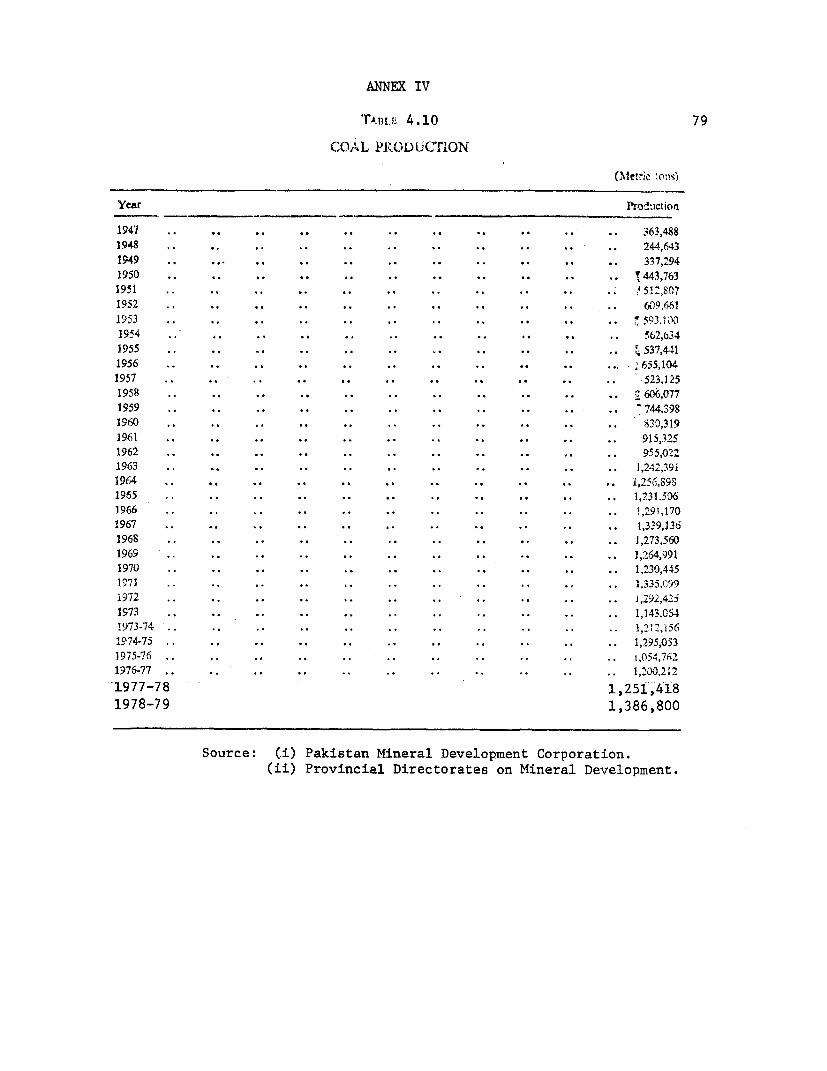
ANNEX IV
TAxi.f.: 4. 10 79
COAL PRODU(MON
Olelrx
Year r1oltiction
1947 363,4881948 244,643
VA9 317,294
1950 443,763
1951 512,807
1952 W,9,66!
1953 593. 1 001954 562,634
1955 537,441
1956 655,104
1957 523,125
1958 60�,077
1959 744.3981960 S30,31919(i 915,325
1962 955,022
1963 1,-442,391
19CA 1,2556,898
1965 1,231,506
1966 1'291,170
1967 t,3--9,136
1968 1,273,560
1969 1,264,991
1970 1,230,445
13171 1,335,09
1972 !,D2,425
1973 1,143,0�41973-74 1,21 --. i 56
1974-75 1,295,053
1975476 054,762
1976-771977-78 1,251,418
1978-79 1,386,800
Source: (i) Pakistan Mineral Development Corporation.(ii) Provincial Directorates on Mineral Development.

ANNEX IV
80TABLE 4.11
COAL CONSUMPTION BY SECTOR 1965-1979 1/
(Metric Tcns)
Year Power Brick Domestic Others TotalGeneration Kilns
1965 .. .. .. 149,736 877,508 30,969 193,051 1,251,264
1966 .. .. 146,668 1,085,047 30,980 191,852 1,454,547
1967 . . 144,534 951,842 32,006 203,283 1,331,665
1968 .. 144,534 1,053,011 34,068 198,284 1,429,897
1969 .. 144,534 1,099,475 33,032 193,925 1,470,966
1970 .. .. .. 134,211 1,145,929 30,969 185,877 1,496,986
1971 .. .. 134,272 1,065,397 30,969 186,914 1,417,552
1972 56,777 1,170,701 33,032 49,553 .1,310,063
1973 .. .. .. .. .. 56,777 1,170,726 33,032 41,293 1,238,828
1974 .. .. 56,777 1,064,371 33,032 36,131 1,190,311
1974-75 .. 45,723 1,120,291 55,883 25,808 1,247,705
1975-76 40,143 974,065 40,554 9,957 1,073,152
1976-77 51,531 1,107,800 40,881 23,130 1,223,342
1977-78 25,439 1,186,041 38,938 14,613 1,266,031
1978-79 28,418 1,316,667 29,457 12,258 1,386,800
Source: (1) Pakistan Mineral Development Corporation "Study onMarketing of Coal, By ESSEJAY CONSULTANT LTD.
(2) Provincial Directorates of Mineral Development.
1/ Excludes unreported consumption currently estimated at 0.5 million t.p.a.

ANNEX IV
TAB3LE 4.12
DAM SITES IN PAKISTAN AND THIEIR POWER POTENTIALS
SI. Mzirxc of the Darn River Basin, Nearest Type fit. Ft. Length Powe,,r C--ap-aNo. City city (M W)1. An,.ehar . .Kabutl Pi-er . Swat Peshawar. Rock fill. 920 850 1,270
2. J~~azarwsi .. .. ~~Kabul iZivcr .. . Swat. Peshaiwar. Eardh Rock. 90 -2,O
.3. 13uuj1,i ljppQl ~nuus Irndiis. 1,1.404. K oLdIa. Iielutln . . .. lhluml. MuzaiTfarabad.--5. D)hc,k Mitfa . .. East Side .. .. .. ldLus. Koahaagh.-- ,06. Geriala . Tribn!lrries .. . Hqro. Attock. -375 40,000107, iKalabla . Urpper rndus -. . Indus. KvIabagh. E.R. 285 6,900) 1,1258. Kahani . . abol Rivler .. .. Swat. Saidui Sharif. -- 480 -110
9. Kenlangari . . Kabul River .. . Swvat. Saidu Sharif. G-E. R. 580-70I10. KiKapulu . .Upper Indus . .. S11yok. Skardau. -- 60031. Mlakhad .. .East S;de Tributaries .. susn. Kalabagh. -280 (12. Mfanva . .JhiOun . . .jlbelur. Islamiabad. E. R.380 1,0 ,Q13. Mun1da . Kabul River .. .. Swat. Peshawar. F, R. 660 7614, Panuiar . .. ielln , . .Jhelumn. islarnabad. -- - 1,5o015. Sazj>al . . East Side Tributaries J. laro. Attock. E. R. 165 5,800 2,250I 6. St ki Kinari . hehlar . . Kandar. Muza.ffaraba-d. - - - 50017. TL:rbela .. . Upper Indus .. . Indus. Attock. P. R. 465 8,700 2,50(1 8, Warsak .. . Kabul Rtwur . . Kabul Peshawar. E- G. 250 650 2JO.19. K-'hajori .. Katch Wcst Side Tributaries . Gom'al. D. 1. Khian. A. G 500 630 12720. J(atli .. - . Somu . . Panch. Rawalpindi. E. 350 - 22021. Kbha,zana R. . abil River . Panij-Kora. Sai'Iu Sharif. E. R. 520 -170.
2 2. M)ok Abbaki . .. East S'ide Tributarieis . Soann. Kaiabagh. E. R. 295 -105
20,777
6Source Nuclfear Powver IPlarning Study for Pakistan by Internaticnal Atomic Energy Agency Viernna, 1975.
0:,l'-

82
ANNEX IV
TAaL _4.13
FIRM INSTALLED CAPACITY OF ELECTRICrTY 1948 T01978-79
Year Hydle Thermal Nuclear Toral
1948 . .. .. .. .. .. 10.70 57.91 - 63.611949 .. .. .. .. , 10.70) 62.95 - 73.651950 . .. .. . .. .. 10.70 75.75 - 86.451951 *- .. .. 20.70 34.96 - 105.661952 .. .. 42.70 87.34 - 130.04953 . .. .. .. .. .. .. 42.70 100.98 - 143.68
1954 . .. .. .. .. .. 62.70 100.90 - 1(3.601955 .. .. .. .. 62.70 105.42 - I6. "1i56 . .. .. .. .. 62.70 144.00 - 206.71957 .. .. .. .. .. 64.70 151.38 - 216.081958 .. . . .. . 66.70 161.70 -- 228.401959 .. .. .. . 79.40 161.73 0 241 . 101960 .. .. .. .. .. 239.90 253.42 - 493.321961 .. .. .. .. 253.40 268.48 - 21. 88
62 .... .. .. .. 253.40 331.48 - 524. 81963 .. .. .. .. .. 267.20 458.68 - 725.881964 .. .. .. .. .. 267.20 475.30 _ 742.501964-65 .. .. .. .. .. 267.00 631.75 - 898.751965-66 .. .. .. .. .. 26i.00 692.95 - 947.951966-67 .. .. .. .. 467.00 843.95 - 1,310.951967-68 .. .. .. .. .. 567.00 843.95 - 1,410.952968-69 .. .. .. .. . 567.00 902.95 - 1,469.951969-70 .. .. .. .. .. 667.00 1,057.95 - 1,724.951970-71 .. .. .. .. .. 667.00 1,052.55 137.0* 1,719.551971-72 .. .. .. .. .. 667.00 1,058.25 137.00 1,862.251972-73 .. .. .. .. .. 767.00 1,067.75 137.00 1,971.751973-74 .. .. .. .. 867.00 1,067.75 137.00 2,671.7519,4-75 .. .. .. .. .. 867.00 1,426.40 137.W0 2,430.41975-76 .. .. .. .. .. 867.00 1,523.73 137.00 2,527.731976-77 .. .. .. .. .. 1,568.00 1,629. 29 137.00 3,334.8S1978-79 1.,567.20 1,648.83 137.00 3,353.03
* 125 MNW7 capacity is utilized for power supply to KESCO System.
Source. (I) Electric Stnnly of Pak-itan Statistics(1955-57)by COntral EngIn ring,Athcri-ty.
(2) Electric Companies.

ANNEX TV
TABLE :4.14 83INSTALLED CAPACITY OF ELECTRICITY BY PLANT AS ON 30T1] JUNE, 1979.
(Unit: MW)Plant Capacity
HYDEL (WAPDA)Warsak. 160.00Dargai. 20.00Malalcand. 19.6Rasul. 22.0Shadiwal. 13.5Chichoki Mallian. 13.2Nandipur. 13.8Kurramgarhi. 4.0Renala. 1.1Mangla. 600.00Tarbela. 700.00
Sub-Total: 1567.2
THERMALWAPDA
G.T.P.S. Shahdara. 85.00S.P.S. Faisalabad. 132.00G.T.P.S. Faisalabad. 200.00O.T.P.S. Faisalabad. (Abdullahpur) 15.40N.G.P.S. Multan. 265.70T.P.S. Guddu. 229.00T.P.S. Sukkar. 50.00N.G.P.S. Hyderabad. 43.70G.T.P.S. Kotri. 30.00T.P.S. Quetta. 57.95
KESCOWest Wharf A-STN. 15.00West Wharf B-STN. 30.00West Wharf BX-STN. 66.00Korangi Creek-STN 1, 2. 132.00 KTPS 382.00Korangi Creek CX-STN-3. 125.00Korangi Creek CX-STN-4. 125.00Duei Fuel Power Station. 15.00
REPCOL.S.G.P. 3.30N.B.B. 2.28O.B.B. 2.00P.C.1 1.50
MESCON.G.T. 23.00
Sub-Total 1648.83
NUCLEAR 137.00
G. TOTAL: 3,353.03
Sources: WAPDA, KESCO, REPCO, MESCO.

ANNEX IV
TAIBLE 4.1584
GENERATION OF ELE2TRI'C1.GTY BY SOURCE (PUBLIC UTILMIES)'19-48 -- 1978/79)
Unit: GW\\'H
TIdustrialYears Hydel Thermal Nuclear Import Total (a) Establish- Grand
nilt (b) Total
1948 .. . .. 23.53 94.37 -- 73.00 19090 24 214.90194Q .. . . . . 5.79 115.06 - 62.00 212.85 38 250.ss1950 . . Z0.49 05. .! - 74.00 230.10 56 286.101951 .. .. .. .. 58.62 147.51 - 77.00 283.13 85 .-S.131952 .. .. .. .. 102.37 179.53 - 41.00 322.90 12 447g901953 .. .. .. .. 184.88 199.92 - 17.00 401.80 161 652.801954 .. .. .. .. 242.25 2-2-6.71 - 22.00 490.96 189 679.961955 .. .. .. .. 2G7.,6 286.23 - 21.00 614.59 218 332.591956 .. .. .. .. 417.96 307.64 - 17,00 742.60 235 97'7.601957 .. .. .. .. 437.15 393.04 - 21.00 851.19 363 1214.191958 .. *- - - 450.00 616.00 - 1.056.00 403 1469.001959 . . .. 511.00 615.00 - - 1,126.00 4SO 1606.001959-60 .. .. 507.00 540.00 - -- 1,047.00 540 1587.001960-G1 .. .. .. 645.00 653.00 - - 1.298.00 534 1832.001.1-62 .. .. 9.-940, o 747.00 - 1,692.00 539 2231.001962-63 .. .. .. 1176.00 995.00 - - 2.17 .00 535 2706.00
1963-64 .. ., .. 1366.00 1346.00 - -- 2,712.00 540 325.2 001964-65 .. .. .. 1362. 00 1814.00 - 3,176.00 N.A. N.A.
1965-66 .. .. . 1425.00 i 2273.00 - -- 3,698.00 - -
1966,-67 .. .. .. 1530.00 2395 .00 - - 3,925.00 -_
1967-68 .. .. .. 2482. 00 2195.00 - -- 4,677. of - -
1968-09 .. .. . 2792.00 2726. 0 - 5,51 8. 00 - -
19. iu .. ..'- .. _315.001~ 3.) - : - 6.300 N.A. 1N.A.
1970-7! .. .. .. 3449.00 3752 1 - 7,202 - -
1971-72 . .. . . 3679.03 3789 104 7.572 - -
1972-73 .. .. .. 4335.00 3738 304 - 8.377 - -
1973-74 .. .. .. 4141.00 4464 459 - 9,064 - -
1974-7 .. .. .. 4359.00 4977 605 -- 9,941 - -
1975-76 .. .. .. 5435.00 4274 610 - 10,319 -
1976-77 .. .. .. 5185.Go 5271 421 - 10.S77 - _
1977-78 7442.00 4702 231 - 23,375 - -
1978-79 8232.00 5836 106 - 14,174 - -
(a) Includes import from India from 1948-57. Source: (1) Electric Supplyof Pakistan
(b) Data on Electricity Generation by Statistics (1956-Industrial-Establishment is available 57) by Centralup to 1963-64. Engineering
Authority.(2) Nuclear Power
Planning Studyfor Pakistan byInternationalAtomic EnergyAgency Vienna 75.
(3) Electricity Companies.
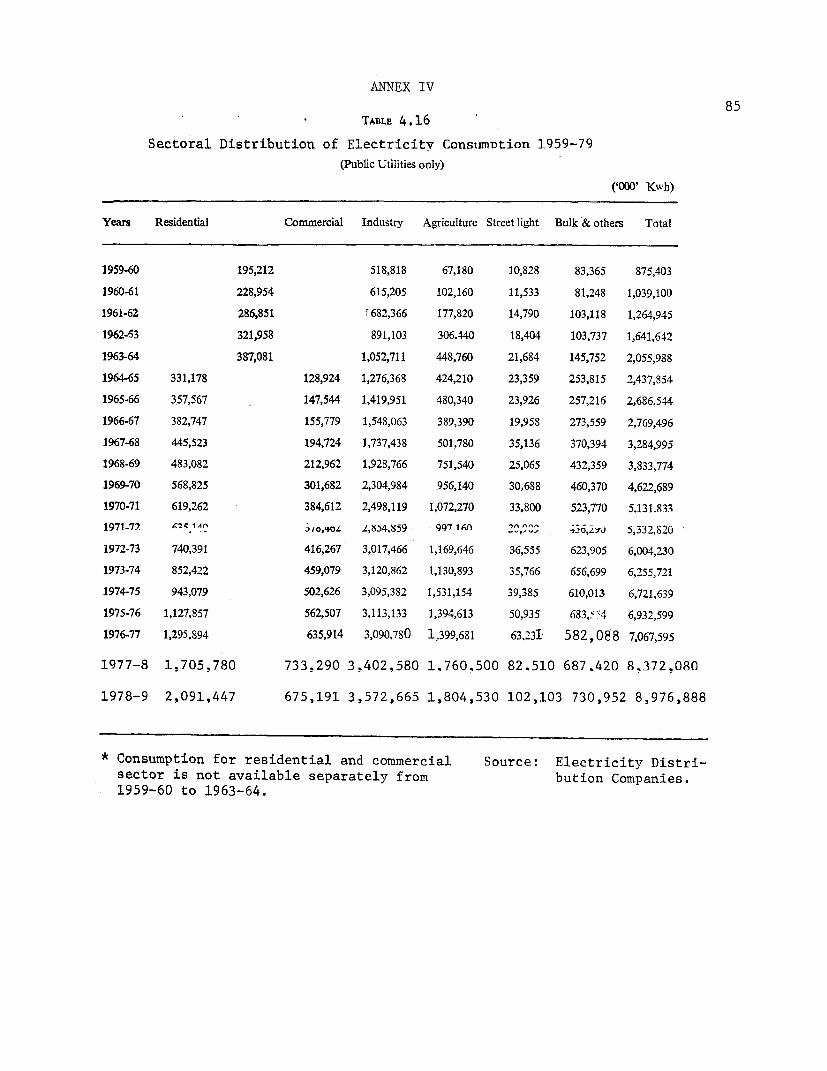
ANNEX IV85
TALE 4.16
Sectoral Distribution of Electricitv ConsuMDtion 1959-79
(Public Utilities only)
('000' Kwh)
Years Residential Commercial Industry Agriculture Street light Bulk & others Total
1959-60 195,212 518,818 67,180 10,828 83,365 875,403
1960-61 228,954 615,205 102,160 11,533 81,248 1,039,100
1961-62 286,851 F682,366 177,820 14,790 103,118 1,264,945
1962-63 321,958 891,103 306.440 18,404 103,737 1,641,642
1963-64 387,081 1,052,711 448,760 21,684 145,752 2,055,988
1964-65 331,178 128,924 1,276,368 424,210 23,359 253,815 2,437,854
1965-66 357,567 147,544 1,419,951 480,340 23,926 257,216 2,686,544
1966-67 382,747 155,779 1,548,063 389,390 19,958 273,559 2,769,496
1967-68 445,523 194,724 1,737,438 501,780 35,136 370,394 3,284,995
1968-69 483,082 212,962 1,928,766 751,540 25,065 432,359 3,833,774
1969-70 568,825 301,682 2,304,984 956,140 30,688 460,370 4,622,689
1970-71 619,262 384,612 2,498,119 1,072,270 33,800 523,770 5.131.R33
1971-77 KI An050 z84.5 g971n _sv Js-8 s31971-72 ~~~~C1Afl -~ I AfL ,.4.859 997, 1E "' 46i' ,332,S20
1972-73 740,391 416,267 3,017,466 1,169,646 36,555 623,905 6,004,230
1973-74 852,422 459,079 3,120,862 1,130,893 35,766 656,699 6,255,721
1974-75 943,079 502,626 3,095,382 1,531,154 39,385 610,013 6,721,639
1975-76 1,127,857 562,507 3,113,133 1,394,613 50,935 683,~ -r 6,932,599
1976-77 1,295,894 635,914 3,090,780 1,399,681 63.231 582,088 7,067,595
1977-8 1,705.780 733.290 3.402.580 1.760.500 82.510 687.420 8,372,080
1978-9 2,091,447 675,191 3,572,665 1,804,530 102,103 730,952 8,976,888
* Consumption for residential and commercial Source: Electricity Distri-
sector is not available separately from bution Companies.
1959-60 to 1963-64.

ANNEX IV
Table 4.17Sectoral Consum-;)tio4 o_Co-mmercial_Enercgv
1964/65 h x 9
Source Residential Commercial Indu-trial Agriculture Transport Ot±ar Govt. X t I
Direct
Oil 10949 - 11789 5882 31847 27375 87842Gas 397 585 21317 - - - 22299Coal 680 - 19293 7538 27511LPG
Indirect
Share in TotalElectricityConsumption 14% 5% 52% 18% - 11% 100%
BTU EquivalentConsumed 6044 2159 22453 7771 4751 43178
TOTAL 18070 2744 74852 13653 31847 39664 180830
Percentage Share 10% 1.5% 41.4% 7.5% 17.6% 22% 100%
Notes: 1) BTU equivalent of electricity consumption is based on conversion factor of 12,000 BTU/KWH for hydel andthermal to approximate actual heat rate of tLermal generation. Auxiliary and T & D losses are allocatedon a pro rata basis to the consuming sectors.
2) Totals may not add up due to rounding.
Source: Government of Pakistan. Energy Data Book and other statistics supplied by Energy Resources Cell, ilinisLryof Petroleum and Naturil Resources.
coON

ANNEX IVTable 4.18
Sectoral Consumto)ti of fCcmLmercial ZUL'=rN
12L -72 31U' 9Z2~T BILl-cU;
Source Residential Commercial TnCdUtrial Agriculture Trans?ort Other Govt. Toti l
Direct
Oil 16463 - 11065 12371 48031 26236 114166'
Gas 2216 1906 50986 - - 55108
Coal 526 - 18121 - 3180 -21827
LPG 120 - 60 - 180
Indirect
Share in TotalElectricityConsumption 12.2% 7.1% 53.4% 18.6% - 8.7% 100%
BTU EcuivalentConsumed 10933 6469 48744 16947 8017- 91110
TOTAL 30258 8375 128916 29318 48091 37433 282391
Percentage Share 11x 3% 44% 11% 18% 13% 100%
Notes: 1) BTU equivalent of electricity consumption is basad on conversion factor of 12,000 BTU/KWH- for hydel aAd
thermal to approximate actual heat rate of thermal generation. All T & D losses and auxillary losses
for thermal geiiration are aI-cated on a pro rata basis to the consuming sectors.
2) Totals may not add up due to rounding.
Source: Government of Pakistan. Energy Year Book 1979 and other statistics supplied by Energy Resources Cell, Ministry
of Petroleum and Natural Resources.
CO

ANNEX IVTable 4.19
Sectoral Consumption of Commercial Energy
1978-79
BTU x 109Residential Commercial Industrial Agriculture Transport Other Govt. Total
Direct
Oil 29425 - 8376 10110 95612 22245 165768Gas 11868 5941 85510 - - - 103319Coal 552 - 24675 - 230 25457LPG 1000 - 542 - 1542
Indirect
Share in TotalElectricityConsumption 23.3% 7.4% 39.72% 20.1% - 9.5% 100%BTU EquivalentConsumed 36078 11458 61468 31121 - 14708 154833
TOTAL 78923 17399 180029 41231 96154 37183 450919
Percentage Share 17.5% 3.9% 39.9% 9.1% 21.3% 8.3% 100%
Notes: 1) BTU equivalent of electricity consumption is based on conversion factor of 12,000 BTU/KWH for hydel andthermal to approximate actual heat rate of thermal generation. All T & D losses and auxiliary losses forthermal generation are allocated on a pro rata basis to the consuming sectors.
2) Totals may not add up due to rounding.
Source: Government of Pakistan. Energy Year Book 1979 and other statistics supplied by Energy Resources Cell,Ministry of Petroleum and Natural Resources.
co

IBRD 13158R2MAY 1979
62° 66° 70° 74°
l U. S. S.RPAKISTAN 6 7 U S. HINA
THE PETROLEUM SECTOR \ ,-'_- -. -
NATURAL GAS PIPELINES J IAMM UNATURAL GAS PIPELINES UNDER CONSTRUCTION e f AND 360
KASHMI~NATURAL GAS FIELDS 9 < K
OIL FIELDS o ,
REFINERIES
ROADS . ,' L,
RAILWAYS r- .0 C
-~ RIVERS 0 O-JA°rdrn
- - INTERNATIONAL BOUNDARIES S e,, or a an af't-. Pesh r
z t t > / SA a e~~~~~~X~ 1Arwp lk rQGj 532'~~~~~~~~~~~~~~~~~~~~~~~~~~~~~~~~~~~~~~~~~~~~~~~~~~~~~~~~~~~~~~~~~~~~~~~~~~~~~~~~~'
a uo ore320~~~~~~~~~~~~~~~~~~~~~~~~~
ont m tyLE
e Kundi
'I~~~~~~~~~~~~~~~~~~~~~~~~~8
IRAN ,/0 ]00 200 300 400
KILOMAETERS
01 ~~100 200 300
0 ~ ~ (~~--*--~~~L.J ~U. S. S.R. C
241- ~ ~ ~ i 10
abian 5ec, 7 K ~~~~~~~~~~~~~"-O~~~~5
PAKIS
1., /~~~IND

IBRD 11215R262= 660 70 s 740 FEBRUARY 1979|
Ip - U 5 5 R 2JCHINA PAKISTAN fC-J' \
MAIN POWER STATIONS AND .PRINCIPAL TRANSMISSION LINES J A M M U
PROPOSED GilgitOR UNDER ''
CONSTRUCTION °0UNTIL 1983: EXISTING: k1Trrrrr
o Grid station or town OR T. Trr AND
- - 500 KV transmission lines / 1R I, ApprooO
220 KV transmission lines ,l Cotrol…- 66/132 KV tronsmission lines Dorga: Tar
340 . * Hydroelectric stations 34-
A .* Thermal stations ISLA8AD"
* lNuclear power station _ 7MAA2RW
Gas fielas KurromGrr
Coal fields . h hlRS ~ or
~~-'-,-~~ Rivers
International boundaries h w
Sorg 6a . <la Sh7a Ku
DEMOCRATIC REPUBLIC - °2MWA ca_ 6w LokhPol S 85MW30° OF 4 / -O_HAsNAI COAE F/fiDa CW / ><SahiSil /
-300 OF30AFGHANISTAN QuetiwAR!COALnFgjC
M sstung0 /ahwlar
\ =_ j CMOA-CH/ Si3,bi bK w ,i 25 -
+Klat 21t
', Shik+rpiff~j~< 22O C ( r Khan
Larkana4/ GS5ohr*
g ' % g / 8 it e /X o,, IN D I A
Oad~ TTTTTT'
) I ~~~~~~~~~02260
~ 0-N~woba Khas/7 f r ( rw ( g \ 30 MW\". HalaRd. S _
arrgb/sn S&a 4 ' tq g <8 / Gis BHUTAN
\\ 2 ~~~~~~RAN -9 tA/ ->Frt9
Karacht\~ JtsI FIR MEYAIG - ~0I N D I A
-25 2 T° / 740
,o lo,o 200 3 ,00 400 2 L 2-0 oF Coet,''
O lOo ~~~ ~ ~~~~~?0 300 k\ ,.
I \ \E,JE5~~~~~~~~~R I LANKAA
62° 7