page 6 an aacc publication volume 46, number 5 building a
TRANSCRIPT

June 2020
ClinicalLaboratory
News
An AACC Publication | Volume 46, Number 5
Building a Better
DRUG TESTING SYSTEM
cfDNA: New Tool for Organ Transplantation
Raising the Bar for Specimen Labeling
PAGE 6
EXPANDING SARS-COV-2
TESTING CAPACITY
Study shows pooling samples can save kits, time

© 2020 Promega Corporation. All Rights Reserved. 57578641
Don’t settle for just a supplier. Find a custom manufacturing partner.
Your specifications. Your format. Our scientists waiting to help.
Selecting a supplier for your molecular diagnostic applications can be a challenge—especially a supplier who can adapt to your specific needs. Work with a manufacturing partner you can be certain about. With our breadth of technologies and rapid response manufacturing, Promega is here to support your molecular testing needs.
100+GLOBAL IVD COMPANIES
Supplied
cGMPManufacturing
15Locations
ISO CERTIFIED
Learn more here:promega.com/CustomManufacturing

1JUNE 2020 CONTENTSwww.aacc.org
@ CLN_AACC
The full text of Clinical Laboratory News can be found on EBSCO’s
CINAHL Complete database and is also
searchable via the EBSCO Discovery Service™
EDITORIAL STAFFManaging Editor Bill MaloneSenior Editor Genna RollinsSenior Manager, Communications and PRChristine DeLong
BUSINESS STAFFBusiness Communications SpecialistAna Zelada
Board of EditorsChairDanyel Tacker, PhD, DABCC, FAACC
West Virginia University, Morgantown, W.Va.MembersDustin Bunch, PhD, DABCC
Nationwide Children’s Hospital, Columbus, OhioSara Love, PhD, DABCC
Hennepin Healthcare, Minneapolis, Mn.Mark Marzinke, PhD, DABCC, FAACC
Johns Hopkins University School of Medicine, Baltimore, Md.
Alison Woodworth, PhD, DABCC, FAACCUniversity of Kentucky Healthcare, Lexington, Ky.
Melanie L. Yarbrough, PhD, DABCC, DABMMWashington University School of Medicine, St. Louis, Mo.
AACC OfficersPresident Carmen L. Wiley, PhD, DABCC, FAACCPresident-Elect David G. Grenache, PhD, DABCC, MT(ASCP), FAACCTreasurer Steven Kazmierczak, PhD, DABCC, FAACCSecretary Anthony A. Killeen, MD, BCh, PhD, DABCC, FAACCPast President Dennis J. Dietzen, PhD, DABCC, FAACC
Advertising SalesThe Townsend Group2025 M Street, NW, Suite 800, Washington, DC 20036www.townsend-group.comPhone: +1 202.367.1259Kevin McDonnell, National Sales ManagerEmail: [email protected]
SubscriptionsAACC900 Seventh St., NW, Suite 400Washington, DC 20001Phone: +1 202.857.0717 or +1 800.892.1400Email: [email protected]
Editorial CorrespondenceBill Malone, Managing EditorPhone: +1 202.835.8756 or +1 800.892.1400Email: [email protected]
Clinical Laboratory News is published monthly (10 times per year—Jan/Feb., March, April, May, June, July/August, Sept., Oct., Nov., and Dec.) by the American Association for Clinical Chemistry. 900 Seventh St., NW, Suite 400, Washington, DC 20001. Phone: +1 202.835.8756 or +1 800.892.1400 Fax: +1 202.877.5093. Contents copyright © 2020 by the American Association for Clinical Chemistry, Inc., except as noted. Printing in the U.S.A. POSTMASTER: Send address changes to AACC, 900 Seventh St. NW, Suite 400, Washington, DC 20001.
Design and Production Management
Most, if not all digital microscopy systems feature remote review, which … enables technologists to perform complete blood counts with differentials even when they aren’t in the hematology area. p32
Departments 02 Federal Insider 04 Bench Matters 06 The Sample 27 Regulatory Roundup 30 Industry Playbook 32 Ask the Expert
Features 8 Advancing Standards for Specimen Labeling and Tracking
Strategic use of data puts the high bar of a 0% error rate in sight
12 Monitoring the Health of Solid Organs After Transplantation Using Cell-Free DNA
Diagnostics based on cfDNA could make tissue biopsy obsolete
20 Strategies to Optimize Drug TestingData paired with education, communication, and relationship-building drive success
Cov
er: F
G T
rad
e /
Get
ty Im
ages
; MF3
d /
Get
ty Im
ages
8 12
20

2 JUNE 2020
Federal Insider
jpg
fact
ory
/ G
etty
Imag
es
■NIH LAUNCHES $1.5 BILLION INNOVATION INITIATIVE FOR COVID-19 DIAGNOSTICS
The National Institutes of Health (NIH) announced a plan to
speed development of tests for SARS-CoV-2 that will infuse $1.5 billion in federal stimulus funding into a new initiative called Rapid Acceleration of Diagnostics. The program aims to accelerate innovative technologies for rapid and widely accessible COVID-19 related testing, with the goal of making millions of accurate and easy-to-use tests per week available in the U.S. by the end of summer 2020.
NIH also said it will help move technologies more swiftly through the
development pipeline toward com-mercialization. The plan calls for NIH to work closely with the Food and Drug Administration, the Centers for Disease Control and Prevention, and the Biomedical Advanced Research and Development Authority.
According to NIH, the initiative will complement research currently underway that is focused on prevention and treatment of COVID-19, including the recently announced Accelerating COVID-19 Therapeutic Interventions and Vaccines public-private partner-ship to coordinate the international pandemic research response.
“We need all innovators, from the basement to the boardroom, to come together to advance diagnostic tech-nologies, no matter where they are
in development,” said NIH Director Francis Collins, MD, PhD.
Part of the new program will be competitive. NIH is asking scientists with rapid testing technology to enter a national COVID-19 test-ing challenge for a share of up to $500 million. The technologies will be put through a competition in a rapid, three-phase selection process to identify the best candidates for at-home or point-of-care tests for COVID-19. NIH will match � nal-ists with technical, business, and manufacturing experts to increase the odds of success. If selected technolo-gies are already relatively far along in development, NIH will put these on a separate track that focuses on rapid commercialization.
CMS Relaxes Rules Around COVID-19 TestingThe Centers for Medicare and Medicaid Services (CMS) continued its efforts to open up access for testing related to the novel coronavirus pandemic with a new set of waivers and rules around ordering and performing tests for COVID-19, the illness caused by the SARS-CoV-2 virus.
Notably, CMS will no longer require a written order from the treating physician or other practitioner for bene� ciaries to get COVID-19 tests, nor for in� uenza tests meant to rule out other infections. The caveat: CMS still expects the person ordering the test to be authorized to do so under state law. Further complicating the picture, CMS rules also note that if a laboratory receives a test without a provider’s order, the performing laboratory must “directly notify the patient of the results consistent with other applicable laws, as well as meet other applicable test result reporting requirements.” In formulating policies around test ordering, laboratories will need to heed governors’ executive orders and other rules that dictate how tests can be
ordered on a state-by-state basis.CMS also now will pay hospitals and practitioners to assess bene� ciaries and
collect laboratory samples for COVID-19 testing under a separate payment when that is the only service a patient receives. In addition, CMS will cover antibody-based tests authorized by the Food and Drug Administration (FDA). For its part, FDA recently tightened policies around serological tests for COVID-19, requiring developers to obtain emergency use authorizations, submit their validation data within 10 business days, and meet new test performance thresholds, including 90% sensitivity and 95% speci� city.
Other CMS rule changes include: an allowance for alternate specimen collection devices and media to collect and transport COVID-19 samples; permission for laboratories within a hospital campus to hold a single CLIA certi� cate for multiple laboratory sites, such as parking lot testing; payment for specimens a technician collects at a patient’s home, or for FDA-authorized self-collection kits used by the patient; and a clari� cation that pharmacists can both collect samples and, if their pharmacy has a CLIA license, perform certain tests.

Focus on rewriting the future.
We’re inspired by our customers’ passion to drive science forward. That’s why we take an innovative approach to our work, just like you do.
Milli-Q® lab water solutions are constantly raising the bar to simplify maintenance, reduce water consumption and streamline data management – so you can keep your focus on the future of your work, not your lab water.
To fi nd out more, visit:
SigmaAldrich.com/EmpoweringFocus
The Life Science Business of Merck KGaA, Darmstadt, Germany operates as MilliporeSigma in the US and Canada.
MilliporeSigma, the vibrant M and Milli-Q are trademarks of Merck KGaA, Darmstadt, Germanyor its affi liates. All other trademarks are theproperty of their respective owners. Detailed information on trademarks is availablevia publicly accessible resources.
© 2020 Merck KGaA, Darmstadt, Germanyand/or its affi liates. All Rights Reserved.

4
BenchMatters
JUNE 2020
Mary Kathryn Bohn, BS, PhD candidate
As clinical laboratorians, we know that the test results and reference intervals (RIs) reported to
patient medical records should re� ect the preanalytical, analytical, and postanalytical conditions at any given laboratory. However, most clinicians and patients are not aware that test results can vary depending on the method used. Moreover, laboratories operating within the same healthcare system, and even using the same analytical platform, might report different RIs for a given test. This lack of harmonization signi� cantly increases the risk of inappropriate as well as inconsistent test result interpretation, potentially leading to erroneous or missed diagnoses and unnecessary interventions. In recent years, more patients having direct access to their medical data combined with tighter integration of healthcare networks has underscored why harmonization matters. As laboratory professionals, we play a leading role in advocating for and achieving harmonized patient care.
Harmonization in laboratory medicine involves the total testing process, from collecting samples to reporting and interpreting results. However, past harmonization efforts have mainly been limited to achieving method standardization in the analytical phase of testing.
GAINS FROM ASSAY STANDARDIZATION Result comparability across healthcare centers depends on standardizing laboratory measurements and tracing them to common reference materials. Without standardization, harmonization of RIs would not be feasible or appropriate. Recent method standardization efforts have been successful for many analytes, including cholesterol, creatinine, glucose, hemoglobin A1c, and sodium. For these standardized assays, RI harmonization across laboratories is very possible and arguably critical to clinical service. RI harmonization is also possible for nonstandardized assays that demonstrate good concordance between analytical platforms.
Unfortunately, despite these improvements, different RIs continue to be used across laboratories. The delay in developing and implementing harmonized RIs lies mostly in the challenge of recruiting a large representative healthy population to establish RIs. This critical gap limits our ability to deliver uniform laboratory service across healthcare networks and urgently needs to be addressed.
A TREASURE TROVE OF DATAAs challenging as the journey to RI harmonizations has been, the big data era in which we now find ourselves
poses new opportunities to achieve harmonization in laboratory medicine.
The principle of using exten-sive laboratory datasets to assist in clinical service is not new, but novel applications for using this treasure trove of information keep unfolding as new software and statistical pro-grams are developed. In the context of harmonization, outpatient data extracted from the laboratory infor-mation systems (LIS) of multiple clinical laboratories can be extremely useful in assessing inter-laboratory differences and establishing harmo-nized RIs. For example, data for a given assay and time period can be extracted from the LIS of several laboratories, re� ecting their unique preanalytical, analytical, and popu-lation demographics. RIs can then be established based on outpatient data for each center as well as all centers combined (i.e. harmonized) and compared against each other to determine whether RI harmoniza-tion is feasible.
A NEW METHODMany approaches for establishing RIs based on outpatient data have been described in the literature. Older graphical models such as the Hoffman and Bhattacharya methods have often been questioned due to their inherent subjectivity, while newer methods such as the Arzideh method reported by the German Society for Clinical Chemistry and Laboratory Medicine show greater promise (Clin Chem Lab Med 2007;45:1043–57). Specifically, this new automated approach statistically isolates the healthy population in an outpatient dataset to derive accu-rate and robust RIs, demonstrating remarkable comparability to health-associated data. It is also uniquely suited to harmonization, eliminating
Harnessing the Power of Big Data Analytics to Achieve Reference Interval Harmonization in Clinical Laboratories
Khosrow Adeli, PhD, FCACB, DABCC

5JUNE 2020
As manufacturers’ platforms become more standardized and novel data-driven tools emerge, the prospect of RI harmonization in laboratory medicine appears much closer. We urge laboratories to collaborate and consider using big data analytic tools like the Arzideh method to assess the feasibility of RI harmonization in their regions. Of course, for some assays, different methods generate vastly different results and harmonization is not feasible. In these cases, method-speci� c RIs should be considered and implemented across centers that use the same analytical platform/method. Conversely, if methods are traceable to a common reference standard, the fea-sibility of RI harmonization is higher and should be considered a priority for laboratories globally. Only then will harmonized patient care at the level of clinical laboratories be possible and ultimately result in enhanced patient safety and a higher quality of health-care for all.
the need to recruit a large healthy population and allowing for robust assessment of large datasets rep-resentative of multiple analytical platforms and geographic regions.
In our experience, we applied the Arzideh method to large outpatient datasets (up to 14 million results per test) extracted from community reference laboratory centers across Canada that use different analyti-cal platforms for common labora-tory tests (i.e. electrolytes, hepatic enzymes, and renal markers). When we applied this method to each center separately and to all centers combined, we observed only mini-mal differences in estimated refer-ence limits. These � ndings highlight the use of big data in and the overall feasibility of harmonizing RIs in clinical laboratories for certain tests. We plan to expand this study to other analytes as well as verify estab-lished harmonized RIs using healthy adult samples.St
ígur
Már
Kar
lsso
n /H
eim
smyn
dir
/ G
etty
Imag
es
Mary Kathryn Bohn, BS, is a PhD candidate with the CALIPER Project at The Hospital for Sick Children and the University of Toronto in Ontario, Canada. +EMAIL: [email protected]
Khosrow Adeli, PhD, FCACB, DABCC, is head and professor of clinical biochemistry and pediatric laboratory medicine and senior scientist in molecular medicine at The Hospital for Sick Children and University of Toronto in Ontario, Canada. He also serves as president-elect of the International Federation of Clinical Chemistry and Laboratory Medicine. +EMAIL: [email protected]
AACC COVID-19 ResourcesFind the latest AACC research, education, news, and advocacy updates. www.aacc.org/coronavirus

6 JUNE 2020
SThe Sample
wild
pix
el /
Get
ty Im
ages
■PREANALYTICS MATTER IN DIAGNOSING GESTATIONAL DIABETES MELLITUS
Researchers at Australian Capital Territory (ACT) Pathology
demonstrated that preanalytical blood sample processing protocols have “critical importance” in accu-rately diagnosing gestational diabetes mellitus (GDM) (Diabetes Care 2020; doi.org/10.2337/dc20-0304). Their � ndings, comparing two large groups of women whose blood was processed under different procedures,
con� rm modeling predictions and prior small studies that investigated the effect of preanalytical procedures on GDM diagnoses.
Until 2017, preanalytical process-ing requirements for one-step, three-point 75-g oral glucose tolerance testing (OGTT) in much of Australia involved collecting the three samples (fasting, 1-hr, 2-hr) and sending them together to a lab for processing. In 2017, ACT Pathology implemented stricter protocols that required all samples to be centrifuged within 10 minutes of collection.
The authors compared the effect of this change by examining fast-ing, 1-hr, and 2-hr sample results in 7,509 women tested under the old protocol (January 2015 to May 2017), and 4,808 tested under the new protocol (June 2017 to October 2018).
They found that early centrifu-gation of samples led to a signi� -cant, almost double, increase in the GDM diagnosis rate, from 11.6% to 20.6%. GDM diagnosis rates based on values from fasting and 1-hr samples increased by 127% and
Sample Pooling Effectively Expands SARS-CoV-2 Testing CapacityResearchers at Saarland University in Saarbrücken, Germany, report that sample pooling for SARS-CoV-2 testing in asymptomatic individuals when the rate of community infection is low significantly expands testing capacity and saves test kits while appropriately detecting positive cases (Lancet Infect Disease 2020; doi.org/10.1016/S1473-3099(20)30362-5).
The authors’ procedure involves pooling samples before reverse transcriptase-polymerase chain reaction (RT-PCR) ampli� cation, then only conducting
individual tests when the pooled sample yields positive results. They evaluated the effect of this approach on the sensitivity of RT-PCR by
comparing cycle threshold (Ct) values of pools that tested positive with Ct values of individual samples that tested positive.
In pool sizes from 4 to 30 samples per pool, the Ct values of positive pools ranged from 22 to 29 for the E-gene
(envelope protein) assay, and from 21 to 29 for the S-gene (spike protein) assay. The Ct values were lower for both assays in
retested individual positive samples. In both pooled and individual samples the Ct values were below 30 and “easily categorized as positive,”
according to the authors. The authors also successfully created sub-pools to further reduce the
number of individual tests performed after a positive pool result. For example, by breaking 30-sample pools into 3 sub-pools of 10 samples each,
in an 8-day period 1,191 samples required just 267 tests to detect 23 positive cases, a prevalence of 1.93% at a time when the rate of positive tests in their institution was 4.24%.
The investigators cautioned that borderline positive single samples might not be detected in large pools. This normally occurs in samples from convalescent patients 14–21 days after they become symptomatic.
The authors are now using this method to screen residents and staff in nursing and residential care homes in Saarland.

7JUNE 2020
66%, respectively; the diagnosis rate based on 2-hr samples increased a statistically insigni� cant 15%. The mean fasting, 1-hr, and 2-hr values in mmol/L under the old protocol were 4.41, 6.99, and 6.05, respectively, versus 4.65, 7.33, and 6.21, respec-tively, under the new early centrifu-gation protocol.
“It is clear that the preanalytical blood sampling protocol for OGTTs during pregnancy needs attention and standardization,” concluded the authors.
■POLYGENIC RISK SCORE IDENTIFIES MEN AT ELEVATED RISK FOR ABDOMINAL AORTIC ANEURYSM
A polygenic risk score (PRS) based on 29 mutations
identi� ed more men at risk of abdominal aortic aneurysm (AAA) than would be identi� ed under
current screening recommendations. Extending current guidelines to include testing for those with high PRS “would signi� cantly increase the yield of current screening,” said the authors of a study presented at the American Heart Association’s Vascular Discovery: From Genes to Medicine Scienti� c Sessions 2020 (Presentation 170).
Current AAA screening recom-mendations call for a one-time ultrasound in men ages 65–75 with a history of smoking. The survival rate once an AAA ruptures is only about 20%, so better identifying individuals at risk remains a priority.
The authors used electronic health data to identify participants with and without AAA in the Million Veteran Program (MVP), a national genomic research initiative. They tested 18 million genotyped and imputed DNA variants for association with AAA using logistic
regression modeling, then used external datasets to replicate these � ndings. Finally, they tested and vali-dated a series of AAA PRSs using an independent set of MVP participants.
From 7,642 AAA cases and 172,172 controls, the research-ers identi� ed 14 novel AAA loci implicating already established risk factors like lipids (LPA, PCSK9) and smoking (CHRNA3). A one standard deviation increase in the 29-variant PRS was associated with a 32% increased risk of AAA. Men older than age 50 with the 5% highest PRS had an AAA prevalence of 7.8%, which is higher than that observed in AAA screening trials upon which current guidelines were based.
The researchers acknowledged the need for more investigation to understand how well the PRS cap-tures risk in diverse ethnic groups, as Caucasian men predominate in the MVP.

8 JUNE 2020
BY KIMBERLY SCOTT
ADVANCING STANDARDS FOR SPECIMEN
LABELINGAND
TRACKINGStrategic use of data puts the high bar of a 0% error rate in sight

9JUNE 2020
Left
: And
rew
Bro
okes
/ G
etty
Imag
es; R
ight
: Gre
g G
ibso
n
Journal of Applied Laboratory Medicine (2017;2:244-58).
The Clinical and Laboratory Standards Institute (CLSI) in 2011 developed a standard to reduce the unacceptably high incidence of misla-beled specimens in clinical laboratories. The standard, “AUTO12–Specimen Labels: Content and Location, Fonts, and Label Orientation,” speci� es locations and formats for the required human-readable elements that must appear on the label for each clinical laboratory specimen. The standard also speci� es rules for truncation for long patient names, the location and size of the bar code on each label, a list of the most commonly used variable elements that can appear on specimen labels, and the required orientation of labels on specimen tubes. That stan-dard is still in effect.
The Joint Commission in 2014 acknowledged the issue of specimen
identi� cation errors and released two National Safety Goals to address this problem. The � rst goal called for healthcare providers to use two patient-speci� c identi� ers, such as name and date of birth, to ensure each patient receives the correct medication or treatment. The second goal was to make sure the correct patient gets the correct blood when they get a transfusion.
But while standards are in place nationwide for specimen labeling and handling, the incidence of patient identi� cation errors—including misla-beled and misidenti� ed specimens—remains much too high, say experts. The best data on errors in U.S. labo-ratories comes from three separate College of American Pathologists (CAP) Q-Probe studies, in which the reported rates of mislabeled specimens were 0.39/1000 in 120 institutions (2006), 0.92/1000 in 147
ASARS-CoV-2 specimen labeling mix-up that resulted in an infected individual erroneously
receiving a negative result highlights the very real consequences of errors that can occur during the pre-analytical phase of laboratory testing.
In February, the University of California San Diego (UCSD) Medical Center collected samples from four individuals who were in quarantine after returning from China and sent the specimens to the Centers for Disease Control and Prevention (CDC) for testing. Some confusion in differences between the two orga-nizations’ labeling systems resulted in miscommunication about the test results, with CDC incorrectly advising that all four patients tested nega-tive for the virus, according to news reports.
As the four individuals were being transported from the UC San Diego Health hospital back to Marine Corps Air Station Miramar to wait out a 14-day government-mandated quar-antine, word came that one of the individuals had in fact tested positive. That individual was then returned to the hospital and placed in isolation.
The episode underscores a � nding that is becoming more relevant as clinical laboratories have rushed to offer testing for the new coronavirus and to come to terms with stressed supply chains and unusual sample collection procedures: that improv-ing communication and collaboration with those outside labs remains the best strategy to ensure accuracy and protect patients.
A REALITY CHECK ON LABELING STANDARDSClinical laboratories have been working for decades to overcome the problem of specimen labeling errors. Researchers estimate that more than 160,000 adverse patient events occur each year in the United States because of patient specimen identi� cation errors involving clinical laboratories, while 11% of all trans-fusion deaths occur as a result of phlebotomists not properly identify-ing patients or mislabeling tubes of blood, according to an article in The

10 JUNE 2020
And
rew
Bro
okes
/ G
etty
Imag
es
the potential for error in manual POC tests still exists, she added, especially if there is not an interface between the POCT device and the EMR. In addi-tion, errors can occur in other parts of the preanalytic process, such as speci-men collection and reagent storage.
While the goal may be to get to 0% labeling and identi� cation errors, the human component means the pos-sibility of an error probably will never be eliminated, said Suh-Lailam. “It’s not foolproof,” she said. “If you scan the wrong thing, you’ll get the wrong information.”
Ultimately, the extent to which a laboratory minimizes errors in labeling and specimen identi� cation comes down to how closely the lab follows CLIA regulations and the CLSI standards, the amount of automation the lab employs, and the policies and procedures the lab has in place for its preanalytic processes.
“Because of the potential patient adverse consequences associated with mislabeled specimens such as transfusion-related death, medication errors, and misdiagnosis, every labeling error should be treated seriously,” said Sandhu.
USING DATA TO DRIVE BETTER PRACTICESIf the standards have not changed, but the errors remain—what is the next step beyond improving communi-cation to minimize errors in speci-men labeling and handling? Some laboratories organize their efforts in this area according to the Six Sigma approach. David Rogers, senior opera-tions director for support services at
clinical labs (2008), and 1.12% of blood bank specimens in 122 clinical labs (2010) (CLN 2014;4:12–13).
Over the past decade, laboratories have tried many interventions deemed to be effective in reducing specimen error rates. But how effective are they really? A 2016 study concluded that computer-generated identi� cation systems and interdisciplinary coopera-tion can signi� cantly reduce patient identi� cation errors (PLoS One 2016;11:e0160821).
For the article in The Journal of Applied Laboratory Medicine, researchers conducted a review of published studies to determine which interventions resulted in substan-tial decreases in specimen labeling errors. Speci� cally, they evaluated the effectiveness of four categories of laboratory practices to reduce the incidence of specimen labeling errors involving blood or any other type of patient specimen. The four categories were: improved communication and collaboration between laboratory and healthcare professionals, education and training of healthcare staff responsible for specimen collection, audit and feedback of labeling errors and real-time event reporting, and implementa-tion of new technology.
The authors concluded that improved communication and collabo-ration between laboratory and other healthcare professionals in the form of multidisciplinary teams was the top recommendation for decreasing specimen identi� cation errors. While the other evaluated practices also led to a decrease in specimen labeling errors, the investigators couldn’t make a recommendation in favor or against the effectiveness of those practices because of insuf� cient data.
Paramjit Sandhu, MD, an epi-demiologist at CDC in Atlanta and author of the study, told CLN that despite CLSI standards and improve-ments in bar-coding, the rate of errors probably is even higher than what is known. “In general, published error rates are usually underreported because of inadequate detection methods and reluctance to publish or otherwise share errors,” he said. “Accreditation organizations like The Joint Commission and CAP continually reinforce patient safety goals and standards. However,
despite those efforts, labeling errors remain one of the leading types of preanalytical errors associated with ancillary services.”
Is it possible to get to a 0% error rate? According to Sandhu, a 0% error rate should be a goal, though he noted that specimen mislabeling can occur during multiple continu-ally changing steps of the preanalytic phase of the total testing process. Errors can occur at the time of speci-men collection, from an incorrect bar code read, or due to labeling mix-ups right before or after sample collec-tion and during laboratory accession-ing of a specimen.
UNIQUE CHALLENGES FOR POINT-OF-CARE TESTINGPoint-of-care testing (POCT) is mostly automated and uses bar-coded patient identi� cation and bar code scanners with a test device at or close to a patient, but that doesn’t mean these systems are perfect. Typically, device manufacturers build in tools that detect certain preanalytic errors, said Brenda Suh-Lailam, PhD, DABCC, FAACC, director of clinical chemis-try and point-of-care testing at the Ann and Robert H. Lurie Children’s Hospital of Chicago.
“When preanalytic errors do happen, the system should render the test invalid,” she explained. “The healthcare provider would need to recollect the sample and repeat the test.”
Automation, bar-coding, and interfaces with electronic medical records (EMR) have helped reduce specimen collection labeling errors, but

11JUNE 2020
ARUP Laboratories in Salt Lake City, explained ARUP’s success with using Six Sigma to ensure that specimens are labeled, transported, and handled properly. ARUP also invests in keeping staff focused on detecting errors.
“We look for opportunities to improve each process,” he said. “First, we identify the steps that go into a process, such as selecting the correct patient and printing the associated label, and then we establish checks for each step of the labeling process. We have built in detection processes on the front end and secondary detec-tions within the individual testing labs on the back end.”
When ARUP receives a speci-men, the processing staff use unique identi� ers, such as a client’s accession number or a medical record number (MRN), to query the system to ensure the correct label is printed. The system used in specimen processing defaults to query unique identi� ers in order to eliminate risks associ-ated with using patient names. Other
AACCCERTIFICATE PROGRAMSExpand your career opportunities by earning an online certifi cate from AACC
Further your skills in:> Laboratory Management> Laboratory Testing
> Laboratory Technology
Earn between 7.5–13 ACCENT credits at your own pace www.aacc.org/cert_prog
REGISTER TODAY
To enroll by phone, call 800.892.1400 or 202.857.0717
processes involved require process-ing staff to electronically con� rm orders to received specimens. Before a specimen is sent on for testing, at least four identi� ers are double-checked during the labeling process. The most common are patient name, client accession or other container ID, MRN, collection date and time, and order. The labeled tube is then routed through an automated delivery system to the proper lab.
“We have a program that incentiv-izes our employees to � nd and report any labeling discrepancies,” said Rogers. “We � nd it motivates our staff to check labels very carefully and, more importantly, report issues to facilitate optimal tracking and trending of the individual processes moving forward.”
For tests that require complex collections and/or multiple specimens, such as adrenal function testing, addi-tional secondary checks are required. For example, when two or more specimens are processed for these tests, a noti� cation report goes to lab review
staff and to support services. These individuals must certify and document electronically that they have reviewed the specimens and they are labeled correctly.
“In addition to implementing quality checks during the individual processing and labeling steps, we target additional processes and reviews where they are needed the most and where they will be most effective,” explained Rogers. “That’s what our data does for us. By engaging all staff in these efforts, and through effective tracking and trending, we have been able to pinpoint scenarios that inher-ently present higher risks, and we have identi� ed staff whose speci� c task it is to secondarily review the associated specimens to ensure they are labeled correctly. Any lab can do this—it’s all about effectively using the available data, not the size of the lab.”
Kimberly Scott is a freelance writer who lives in Lewes, Delaware. +EMAIL: [email protected]

12 JUNE 2020
BY SABRINA K. PATTAR, MSC, AND STEVEN C. GREENWAY, MD
Monitoring Organ Health After Transplantation Using
CELL-FREEDNADIAGNOSTICS
BASED ON CFDNA COULD MAKE TISSUE
BIOPSY OBSOLETE

13JUNE 2020
Costly and invasive tissue biopsies to detect allograft rejection after transplanta-tion have numerous
limitations. Assays based on cell-free DNA (cfDNA)—circulating fragments of DNA released from cells, tissues, and organs as they undergo natural cell death—have been intensively studied recently and could ultimately improve our ability to detect rejection, implement earlier changes in management, and even enhance the long-term survival of transplanted organs.
CfDNA assays that circumvent the need for whole-genome sequencing (WGS) and the need for a priori knowl-edge of donor and/or recipient genotypes have powerful logistical advantages and are currently under clinical scrutiny. In addition, improving knowledge of the organ-speci� c kinetics of donor-derived cfDNA (dd-cfDNA) following transplantation has also helped optimize these assays. Laboratories also have intro-duced alternative methods for quantifying dd-cfDNA, such as digital droplet polymerase chain reaction (PCR) and organ-speci� c DNA methylation patterns. As such, the � eld of minimally invasive diagnostics based upon cfDNA is increas-ingly promising, one day potentially replacing traditional tissue biopsies.
THE ROLE OF CFDNA IN ORGAN REJECTIONRejection, referring to injury of a donated organ caused by the recipient’s immune system, can cause allograft dysfunction and even patient death. T-cell mediated acute cellular rejection (ACR) occurs most often within the � rst 6 months post-transplant (1). ACR involves accumula-tion of CD4+ and CD8+ T-cells in the interstitial space of the allograft as the recipient’s immune system recognizes antigens on the donated organ as foreign. These T-cells initiate an immune cascade that ultimately leads to programmed cell death (apoptosis) of the targeted cells. As these cells die, genomic DNA is cleaved and fragments of dd-cfDNA, measur-ing approximately 140 base pairs (bp) in length, are released to join the pool of recipient cfDNA in the blood and ulti-mately excreted in the urine (2).
Circulating cfDNA has recently been leveraged as a diagnostic tool to replace invasive biopsies in other areas of medicine, including analyzing fetal DNA fragments within the maternal circulation

14 JUNE 2020
Prev
ious
Pag
e: E
R Pr
oduc
tions
Lim
ited
/ G
etty
Imag
es
in quiescent bilateral and single-lung transplants can be explained by the difference in cellular turnover, being 107 vs. 58 cells/second, respectively (21). By contrast, in a quiescent transplanted heart, the cellular turnover rate is only 8 cells/second (21-23). Thus, an understanding of the expected levels of dd-cfDNA associated with a given solid organ is essential to facilitate development of organ-speci� c assays that detect rejection. Once the kinetics of cfDNA release for a particular organ are understood, several methods exist for quantifying the relative amount of dd-cfDNA.
STRATEGIES TO DISTINGUISH RECIPIENT- VS. DONOR-DERIVED CFDNADonor-Recipient Sex-MismatchFor organ transplants in which the donor is male and the recipient is female, laboratories can leverage this sex mismatch to calculate dd-cfDNA levels from within the recipient’s total cfDNA pool (17). Researchers � rst demonstrated the feasibility of this approach in urine samples taken from female renal transplant recipients who had received a kidney from male donors and when they experienced rejection demonstrated elevated levels of dd-cfDNA in their urine that speci� cally contained regions found on the Y chromosome (17). Although this approach allows for con� dent diagnosis of rejection in the allograft, sex-mismatch between the donor and recipient is relatively infrequent and not universally applicable.
Donor-Recipient DNA Sequence DifferencesAn organ transplant can also be regarded as a genome transplant, as the cells within a transplanted organ contain the genetic information of its donor. As such, the concept of genome transplant dynamics (GTD) relies on the presence of genetic differences between the donor and recipient at a particular locus, which then can be leveraged to identify the origin of the circulating cfDNA (20-24). Ideally, the recipient would be homozygous for a single base (for example, AA) and at the same locus the donor would be homozygous for a different base (for example, GG).
to identify genetic abnormalities in utero and sequencing circulat-ing DNA released from tumor cells to identify cancer-related muta-tions. In both these cases as well as in transplantation, high-throughput sequencing that identi� es and quanti� es DNA sequence differ-ences distinguishes between the two different populations of cfDNA derived from distinct sources (2). Three characteristics of cfDNA make it an excellent noninvasive candidate biomarker to detect rejection after solid organ transplantation: It can be obtained from a simple blood draw, its concentration accurately mea-sured, and its nucleotide sequence easily identi� ed. Using cfDNA as a biomarker for ACR is also advanta-geous since it is derived from the injured cells of the donated organ and therefore should represent a direct measure of cell death occurring in the allograft. Furthermore, cfDNA maintains all of the genetic features of the original genomic DNA, allowing the genetic material released from the donated organ to be differentiated from the cfDNA derived from cells of the recipient that are undergoing natural apoptosis (3).
Frequent and accurate monitor-ing of allograft health is essential for transplant recipients’ long-term sur-
vival. For heart transplantation (HT), endomyocardial
biopsy (EMB) is the current gold
standard for detecting ACR (4). However, EMBs are costly with signi� cant limitations, many of which are
common to all organ biopsies
(5-7). Moreover, the invasive nature
of EMBs puts HT patients at risk for
complications (6,8,9). Unfortunately, currently avail-
able noninvasive methods including echocardiography or magnetic reso-nance imaging (MRI) lack suf� cient speci� city and sensitivity to reliably detect rejection (10-13). Blood-based
biomarkers, such as cfDNA, represent a promising alternative that could be readily implemented into clinical practice (14-17).
KINETICS OF CFDNA DURING QUIESCENCE AND REJECTIONSince cfDNA originates from the nat-urally occurring process of apoptosis, all individuals have detectable levels of cfDNA in their blood (18). For healthy individuals, the majority of circulating cfDNA comes from hema-topoietic cells that have undergone natural death related to cellular turn-over. Levels of cfDNA � uctuate for multiple reasons including infection, surgery, trauma, or even exhaustive exercise (2,19). Therefore, developing a cfDNA-based assay to detect rejec-tion requires assessing the expected kinetics of dd-cfDNA release into the recipient’s circulation post-transplant. This consideration is especially impor-tant since the release of dd-cfDNA over time post-transplant is organ-speci� c (20-22).
For example, at 1 day post-HT the average level of dd-cfDNA is 3.8 ± 2.3% (20). However, by 7 days the level of dd-cfDNA has declined rapidly and remains consistently low (<1%). During an episode of acute rejection in the heart, the level of dd-cfDNA was found to increase to 4%–5% from a baseline of about 0.06% observed during quiescence.The kinetics of dd-cfDNA observed in the circulation of HT recipients was similar to that observed after renal transplantation (22).
In contrast, recipients of bilateral lung transplants were found to have an average dd-cfDNA fraction of 26 ± 14% on the � rst postoperative day. Furthermore, the reduction in dd-cfDNA was characterized by levels of dd-cfDNA that declined rapidly within the � rst week but then slowed and generally remained at 1%–3% (21). However, similar to heart and kidney transplants during an episode of acute rejection, the level of dd-cfDNA increased signi� cantly, climb-ing to an average of 14%–15%.
Differences in tissue mass and rates of cellular turnover account for this variability in the levels of dd-cfDNA released early post-transplant and dur-ing quiescence. For example, differ-ences in circulating dd-cfDNA levels
Levels of cfDNA fluctuate
for multiple reasons including infection, surgery, trauma, or
even exhaustive exercise.

15JUNE 2020
INVASIVE APPROACH NON-INVASIVE APPROACHES
Blood Sample
Urine Sample
Blood Blood Sample
Donor- and Recipient-derived cfDNA
Transplant Recipient
Tissue Biopsy(ex: EMB)
Histological Analysis0R 1R
2R 3R
and Recipient-
Donor-Recipient Sex-Mismatch
DonorcfDNA
RecipientcfDNA
Digital Droplet PCR
Organ-Specific Methylation Patterns
Donor-Recipient DNA SNP/CNV
Differences
Recipient SNP/CNV Recipient
DNA SNP/CNV DNA SNP/CNV DifferencesDifferences
Given the genetic heterogeneity between individuals, tens of thou-sands of potentially informative loci across the genome can be interrogated using high-throughput sequencing to distinguish dd-cfDNA from recipient cfDNA (20,24). This concept was � rst illustrated using banked samples from cardiac donors to obtain a priori donor genotypes for each donor-recipient pairing. After extracting and sequencing cfDNA from each recipient, the fraction of donor-speci� c molecules was determined. In samples taken during or imme-diately preceding a biopsy-proven rejection event, the proportion of donor-speci� c single nucleotide poly-morphisms (SNPs) was found to have increased from <1% to >3%–4% (24).
This early retrospective study has now been validated prospec-tively. Adult and pediatric heart and lung transplant recipients were recruited and genotypes for each donor-recipient pair were obtained
through WGS with an average of 53,423 informative SNP markers identi� ed (20). Overall, early detec-tion of acute rejection was superior to that of AlloMap, the � rst Food and Drug Administration-approved non-invasive approach to detecting ACR after HT based on transcriptome analysis (25).
Research also has shown that WGS not only provides information about a graft but also a patient’s virome and overall state of immunosuppression. This represents a potentially great advantage unobtainable by other assays (26-28).
However, WGS faces challenges that could prevent it from being implemented routinely in clinical practice. For example, while a recipi-ent’s genetic information can be easily obtained, this is not always true for a donor. Moreover, WGS is costly, labor intensive, and time-consuming.
An alternative method employs a panel of genotyped polymorphic
SNPs identi� ed within the pool of extracted cfDNA thereby eliminating the need for a priori knowledge of a donor’s speci� c genotype (29). Unlike kidney and liver transplants, which often occur between closely related individuals, the donor-recipient pairs for heart and lung transplants typi-cally are not related. GTD requires genotyping of both the transplant recipient and donor. However, in practice, donor genotype information is often unavailable. Here, we address this issue by developing an algorithm that estimates dd-cfDNA levels in the absence of a donor genotype. Our algorithm predicts heart and lung allograft rejection with an accu-racy that is similar to conventional GTD. We furthermore re� ned the algorithm to handle closely related recipients and donors, a scenario that is common in bone marrow and kidney transplantation. We show that it is possible to estimate dd-cfDNA in bone marrow transplant patients
F1 Detecting Rejection
Methods to detect rejection following solid organ transplantation include invasive and non- or minimally invasive assays. Levels of donor-derived cfDNA can be quanti� ed in blood or urine based on genetic or epigenetic differences. EMB, endomyocardial biopsy. Modi� ed from Pattar and Greenway (7).
INVASIVE APPROACH NONINVASIVE APPROACHES

16 JUNE 2020
who are unrelated or who are siblings of the donors, using a hidden Markov model. Therefore, algorithms have been developed for heart and lung transplants which assume that the donor’s genotype occurs at the same frequency as the general population. Based on these frequencies and com-parison to the known genotype of the recipient, the fraction of dd-cfDNA can be reliably estimated from the total pool of cfDNA isolated from a recipient’s plasma sample.
In the case of lung transplanta-tion, this single-genome model, when compared to the methodology using both donor and recipient genotypes, was found to provide comparable fractions of dd-cfDNA. However, when researchers applied this same algorithm to HT, the estimated levels of dd-cfDNA were not as strongly correlated as in lung transplants. This might be related to the lower abso-lute amounts of dd-cfDNA present after HT. This is another example of organ-speci� c cfDNA kinetics that can in� uence assay results and must be taken into account (30).
In the case of renal transplanta-tion, prospective studies have been conducted to ascertain the utility of dd-cfDNA levels, identi� ed using known donor-speci� c SNPs, as a viable marker for rejection. In one such study, 384 kidney recipients were recruited from 14 clinical sites to provide blood samples at scheduled intervals and at times of clinically indicated biopsies (31). Overall, the study focused on the correlation between the histology in 107 biopsy specimens from 102 patients and the levels of dd-cfDNA found in matched plasma samples. More speci� cally, 27 biopsy samples from 27 patients with active rejection were obtained along with 80 biopsy samples from 75 patients without active rejection.
In this study, active rejection included acute antibody-mediated rejection (AMR), chronic AMR, and ACR. The assay used in this study employed a 1% cutoff for the fraction of dd-cfDNA to indicate the presence or absence of active rejection and was found to have 85% speci� city (95% CI, 79%–91%) and 59% sensitivity (95% CI, 44%–74%). The sensitivity of this assay was greater
for discriminating between active and absent AMR, as the use of a cutoff of 1% dd-cfDNA was found to have an 83% speci� city (95% CI, 78%–89%) and 81% sensitivity (95% CI, 67%–100%). Notably, in both cases, the sensitivity declined substantially when the fraction of dd-cfDNA exceeded 3%.
To improve speci� city and sensitivity of a non-invasive cfDNA-based assay to detect rejection following renal transplanta-tion, investigators also have surveyed the absolute amount of dd-cfDNA (32-33). By interrogating the absolute amount of dd-cfDNA, one can elimi-nate the arti� cial changes in the frac-tion of dd-cfDNA due to increases in total cfDNA levels caused by non-rejection events, such as infec-tion, trauma, or exercise, potentially creating a more accurate assay.
To investigate this possibility, one study employed 32 informative copy number variants (CNVs) based on population frequencies, as opposed to relative proportions of donor and recipient SNPs at given loci (32). All CNVs not present within a recipi-ent’s genome but present within the extracted cfDNA were therefore assumed to represent dd-cfDNA.
Interestingly, while the speci� c-ity and sensitivity improved overall with the use of absolute dd-cfDNA levels, this assay also had a greater capacity to distinguish between the presence and absence of active AMR, as opposed to cases of active ACR. In addition, serum creatinine levels were not suf� cient in discriminat-ing between active rejection and quiescence, likely because it is more indicative of glomerular function as opposed to kidney tissue damage (31-33).
Another study explored the absolute levels of dd-cfDNA in kidney transplant recipients related to levels of tacrolimus, an immunosuppressant (33). Here, the researchers found that the absolute amount of dd-cfDNA was sub-stantially higher in patients with lower tacrolimus levels (<8 μg/L) in comparison to those with higher drug
levels. These data suggest that dd-cfDNA levels also have the potential to detect allograft injury resulting from inadequate immunosuppression.
Laboratories also have proposed alternatives to WGS. Our group explored targeted sequencing of 124 highly polymorphic (minor allele frequency [MAF] >0.4) SNPs using a commercially available panel, next-generation sequencing, and a novel algorithm (34). This approach signi� cantly reduced the total amount of sequencing required, decreasing costs and assay time, and enabling rapid analysis. However, since this assay relies upon differences in MAF between individuals, it would not be robust for closely related donor–recipient pairs, such as seen in living-related kidney donation. It remains to be validated for detecting moderate or greater rejection events.
Laboratories also have explored using polymorphic SNPs to quantify dd-cfDNA combined with the tech-nology of digital droplet PCR (30,35-37). Using 41 highly polymorphic SNPs, stable kidney and HT recipi-ents showed dd-cfDNA fractions of 2%–3% with stable liver transplant recipients having a level of 7% (35).
For a discussion of organ-speci� c methylation patterns in cfDNA, see a supplementary section in the online version of the article on www.aacc.org/publications/cln.
CONCLUSIONSThe use of a costly and invasive tissue biopsy to detect allograft rejection
Algorithms have been developed
for heart and lung transplants which assume that the
donor’s genotype occurs at the same frequency as the
general population.

17JUNE 2020
has signi� cant limitations. As such, a minimally invasive assay that can directly and accurately assess the health of the entire transplanted organ represents a holy grail in solid organ transplantation.
The use of cfDNA after trans-plantation has shown some initial promise, but further study and validation is required to improve our understanding of both the basic biol-ogy of cfDNA as well as its behavior post-transplant. At this time, it is clear that important organ-speci� c differ-ences exist, and patterns of cfDNA release may also differ depending on the type of rejection event. However, cfDNA represents one of the most promising technologies yet developed to complement or even ultimately replace the tissue biopsy.
Sabrina Pattar, MSc, is a graduate student in the department of biochemistry and molecular biology in the Cumming School of Medicine at the University of Calgary in Calgary, Alberta, Canada.
Steven Greenway, MD, is an assistant professor in the department of biochemistry and molecular biology at the Cumming School of Medicine at the University of Calgary and a pediatric cardiologist at Alberta Children’s Hospital in Calgary, Alberta, Canada.+EMAIL: [email protected]
REFERENCES 1. Cornell LD, Smith RN, Colvin RB.
Kidney Transplantation: Mechanisms of Rejection and Acceptance. Annu Rev Pathol Mech Dis 2008;3: 189–220.
2. Lehmann-Werman R, Neiman D, Zemmour H, et al. Identi� cation of tissue-speci� c cell death using methylation patterns of circulating DNA. Proc Natl Acad Sci USA 2016; 113:E1826–34.
3. Naesens M, Sarwal MM. Molecular diagnostics in transplantation. Nat Rev Nephrol 2010;6:614–28.
4. Sakakibara S, Konno, S. Endomyocardial Biopsy. Jpn Heart J 1962;3:537–43.
5. Khan T, Selvakumar D, Trivedi S, et al. The value of endomyocardial biopsy in diagnosis and guiding therapy. Pathology 2017;49:750–6.
6. McMinn J F, Lang NN, McPhadden
A, et al. Biomarkers of acute rejection following cardiac transplantation. Biomark Med 2014;8:815–32.
7. Pattar, SK, Greenway, SC. Circulating nucleic acids as biomarkers for allograft injury after solid organ transplantation: current state-of-the-art. Transplant Research and Risk Management 2019;11:17–27.
8. Baraldi-Junkins C, Levin HR, Kasper EK, et al. Complications of endomyocardial biopsy in heart transplant patients. J. Heart Lung Transplant 1993;12:63–7.
9. Mason JW. Techniques for right and left ventricular endomyocardial biopsy. Am J Cardiol 1978;41: 887–92.
10. Kindel SJ, Hsu HH, Hussain T, et al. Multimodality Noninvasive Imaging in the Monitoring of Pediatric Heart Transplantation. J Am Soc Echocardiogr 2017;30:859–70.
11. Lunze FI, Colan SD, Gauvreau K, et al. Tissue Doppler imaging for rejection surveillance in pediatric heart transplant recipients. J Heart Lung Transplant 2013;32:1027–33.
12. Greenway SC, Dallaire F, Kantor PF, et al. Magnetic resonance imaging of the transplanted pediatric heart as a potential predictor of rejection. World J Transplant 2016;6:751–8.
13. Butler CR, Savu A, Bakal JA, et al. Correlation of cardiovascular magnetic resonance imaging � ndings and endomyocardial biopsy results in patients undergoing screening for heart transplant rejection. J Heart Lung Transplant 2015;34:643–50.
14. Strimbu K, Tavel JA. What are biomarkers? Curr Opin HIV AIDS 2010;5:463–6.
15. Huo Q, Zhou M, Cooper DKC, et al. Circulating miRNA or circulating DNA-Potential biomarkers for organ transplant rejection. Xenotransplantation 2018;e12444.
16. Duong Van Huyen JP, Tible M, Gay A,et al. MicroRNAs as non-invasive biomarkers of heart transplant rejection. Eur Heart J 2014;35:3194–202.
17. Sigdel TK, Vitalone MJ, Tran TQ, et al. A Rapid Noninvasive Assay for the Detection of Renal Transplant Injury. Transplantation 2013;96:97–101.
18. Yamani, M. H. & Taylor, D. O. Heart Transplantation. In Current Clinical Medicine 180–186
(Elsevier, 2010). doi:10.1016/B978-1-4160-6643-9.00027-8.
19. Atamaniuk J, Vidotto C, Tschan H, et al. Increased Concentrations of Cell-Free Plasma DNA after Exhaustive Exercise. Clin Chem 2004;50:1668–70.
20. De Vlaminck I, Valantine HA, Snyder TM, et al. Circulating cell-free DNA enables noninvasive diagnosis of heart transplant rejection. Sci Transl Med 2014;6:241ra77.
21. De Vlaminck I, Martin L, Kertesz M, et al. Noninvasive monitoring of infection and rejection after lung transplantation. Proc Natl Acad Sci U S A. 2015;2015;112:13336–41.
22. Gielis EM, Beirnaert C, Dendooven A, et al. Plasma donor-derived cell-free DNA kinetics after kidney transplantation using a single tube multiplex PCR assay. PLoS One 2018;13:e0208207.
23. Bergmann O, Bhardwaj RD, Bernard S, et al. Evidence for cardiomyo-cyte renewal in humans. Science 2009;324:98–102.
24. Snyder TM, Khush KK, Valantine HA, et al. Universal noninvasive detection of solid organ transplant rejection. Proc Natl Acad Sci U S A. 2011;108:6229–34.
25. Pham MX, Teuteberg JJ, Kfoury AG, et al. Gene-Expression Pro� ling for Rejection Surveillance after Cardiac Transplantation. N Engl J Med 2010;. 362:1890–900 (2010).
26. Lorio MA, Rosa R, Suarez JF, et al. In� uence of immune activation on the risk of allograft rejection in human immunode� ciency virus-infected kidney transplant recipients. Transpl Immunol 2016;38:40–3.
27. Simonetta F, Pradier A, Masouridi-Levrat S, et al. Torque Teno Virus Load and Acute Rejection After Orthotopic Liver Transplantation. Transplantation 2017;101:e219–21.
28. Mendez-Eirin E, Barge-Caballero E, Paniagua-Martin M, et al. Impact of Cytomegalovirus Infection on Long-Term Heart Transplant Outcome. J Heart Lung Transplant 2017; 36:S89.
29. Sharon E, Shi H, Kharbanda S 4 et al. Quanti� cation of transplant-derived circulating cell-free DNA in absence of a donor genotype. PLOS Comput Biol 2017;13:e1005629.
30. Schütz E, Fischer A, Beck J, et al. Graft-derived cell-free DNA, a noninvasive early rejection and

18 JUNE 2020
graft damage marker in liver transplantation: A prospective, observational, multicenter cohort study. PLoS Med 2017;14:e1002286.
31. Bloom RD, Bromberg JS, Poggio ED, et al. Cell-Free DNA and active rejection in kidney allografts. J Am Soc Nephrol. 2017;28:2221–32.
32. Whitlam JB, Ling L, Skene A, et al. Diagnostic application of kidney allograft-derived absolute cell-free DNA levels during transplant dysfunction. Am J Transplant. 2019;19:1037–49.
33. Oellerich M, Shipkova M, Asendorf T, et al. Absolute quanti� cation of donor‐derived cell‐free DNA as a marker of rejection and graft injury in kidney transplantation: Results from a prospective observational study. Am J Transplant 2019;19:3087–99.
34. Gordon PM, Khan A, Sajid U,et al. An Algorithm Measuring Donor Cell-Free DNA in Plasma of Cellular and Solid Organ Transplant Recipients
Get free continuing education credit for reading this article.
AACC designates 0.5 ACCENT ® credit hours.
Visit www.aacc.org/pub lications/cln/accent for more information.
0.5
That Does Not Require Donor or Recipient Genotyping. Front Cardiovasc Med. 2016;3:33.
35. Beck J, Bierau S, Balzer S, et al. Digital droplet PCR for rapid quanti� cation of donor DNA in the circulation of transplant recipients as a potential universal biomarker of graft injury. Clin Chem 2013;59:1732–41.
36. Boer K, Baan CC, van Donk, N, et al. Donor-Derived Cell-Free DNA as Minimally Invasive Tool to Diagnose Acute Rejection after Kidney Transplantation. Transplantation 2018;102:S689.
37. Zou J, Duffy B, Steward N, et al. Detection of donor cell-free DNA using digital PCR in lung transplant recipients with graft rejection and infection. Hum Immunol 2015;76:68.
38. Tsuji J, Weng Z. Evaluation of preprocessing, mapping and postprocessing algorithms for analyzing whole genome bisul� te
sequencing data. Brief Bioinform 2016;17:938–52.
39. Lehmann-Werman R, Magenheim J, Moss J, et al. Monitoring liver damage using hepatocyte-speci� c methylation markers in cell-free circulating DNA. JCI insight 2018;21: pii: 120687.


20 JUNE 2020
OPTIMIZEStrategies to

21JUNE 2020
FG T
rad
e /
Get
ty Im
ages
BY DEBORAH LEVENSON
Controlled substance monitoring and other drug testing give clinicians valuable informa-tion about how patients adhere to treatment regimens or might be misusing or even
abusing drugs. But keeping up with a continually changing drug testing environment challenges most clinicians. New drugs—sold illicitly—keep coming to market. Meanwhile, testing methods have variable performance, and drug testing recommendations evolve. Given all these factors, clinicians need help not only understanding how tests work and how the body metabolizes drugs but also reminders that laboratorians are partners in patient care, according to laboratorians specializing in drug monitoring and toxicology.
“Sometimes physicians can underestimate the com-plexity of the current drug testing environment,” said Jaime Noguez, PhD, director of chemistry and toxicol-ogy at University Hospitals Cleveland Medical Center and assistant professor of pathology at Case Western
Reserve University. “You can’t just rely on a one-size-� ts-all approach to drug testing,” Noguez added. She urged labo-ratorians to work with physicians to make sure labs offer useful drug tests, education, and resources.
DEFINING KNOWLEDGE GAPSMisunderstanding of assays’ advantages, disadvantages, and limitations drives inappropriate drug orders, said William Clarke, PhD, DABCC, FAACC, professor of pathology at Johns Hopkins University School of Medicine in Baltimore and co-author of the AACC Academy’s practice guideline on monitoring pain management drugs. For example, clini-cians who know that an opiate assay will test for presence of various drugs might not realize the assay does not dif-ferentiate between morphine and heroin.
Providers also have varying degrees of understanding of drugs’ metabolic pathways.
Some clinicians might dismiss results that seemingly make no sense and want to retest patients. Labs should
Data paired with education, communication, and relationship-building drive success
OPTIMIZEDrug Testing

22 JUNE 2020
clinical indications and educational and reference documents. They cover topics such as drug detection win-dows in urine and blood, differences in cutoffs for screening and con� r-matory drug tests, and metabolism pathways for common drugs.
Noguez also participates in a health system-wide drug testing over-sight committee with laboratory staff, hospital leadership, and practicing
clinicians in various specialties. The committee discusses test utilization and new testing needs and works together to design new drug panels. The goal is to arrive at consensus before rolling out new tests and work-� ows, Noguez explained.
USING DATAClinical laboratorians also use data to support testing decisions and commu-nications with clinicians. For example, Noguez regularly uses lab information system (LIS) data on test volume and utilization to guide test menu and work� ow changes. Data that show inappropriate ordering by certain physicians or groups can be fodder for educational discussions about proper test utilization, said Jannetto and Langman. Data also inform establish-ment of hard stops to inappropriate ordering by particular groups, Noguez added.
Colantonio uses various groups’ data in discussions with them about how to set up work� ows for the new MS lab, which will not be automated.
Noguez also pulls LIS data to learn about local positivity rates for pre-scription and illicit drugs in various patient populations. Data patterns can reveal new drugs of abuse and trends in older ones and inform care by ED, pain management, and addiction specialists, Colantonio noted.
Lynch, whose hospital offers high-resolution testing for acute drug poisoning, uses LIS data to graph
encourage conversations about poten-tial reasons for odd results. David Colantonio, PhD, DABCC, FAACC, listed a few: genetic polymorphisms, slow-clearing metabolite products, differences in speed of metabolism, or co-administration of drugs that cross-react with an assay. With mass spec-trometry (MS) testing especially, labs can measure parent compounds and metabolites and tease out reasons for
discrepant results, added Colantonio, clinical biochemist at The Ottawa Hospital, lab director at Pembroke Regional Hospital, and assistant professor of pathology and laboratory medicine at the University of Ottawa in Ontario, Canada.
Kara Lynch, PhD, warned of another potential pitfall for both clinicians and laboratorians: outdated immunoassay panels that test for illicit drugs no longer common in an area. Labs with public health respon-sibilities should review their panels against current reality, said Lynch, who is an associate clinical profes-sor at University of California San Francisco (UCSF) and co-director of the core laboratory at Zuckerberg San Francisco General Hospital and Trauma Center.
SETTING UP SUCCESSLabs have many tactics for driving appropriate test orders. At Mayo Clinic in Rochester, Minnesota, clini-cians soon will be able to order drug screens via an order entry system driven by algorithms to arrive at the best orders. They will answer a series of questions that lead them to appropriate tests, said Loralie Langman, PhD, DABCC, director of the clinical and forensic toxicology laboratory at Mayo, and Paul Jannetto, PhD, DABCC, MT(ASCP), FAACC, co-director of Mayo’s toxicology and drug monitoring lab and metals labora-tory. Both are co-authors of the AACC
Academy’s practice guideline on moni-toring pain management drugs.
Mayo’s lab report prominently displays interpretive information stating results are consistent with use of particular drugs within the last 3 days. That way, clinicians get the most important information even if they don’t read the entire list of analytes and associated results, Langman noted.
At UCSF, Lynch’s lab simpli� es clinician ordering with a choice of a urine drug screen, a comprehensive MS test with hundreds of compounds, and a list of individual immunoassays. Rules and automatic re� ex testing are written into urine test order-ing processes and differ by needs of different locations and departments. For example, screening orders from the emergency department (ED) and inpatient units do not get automatic MS con� rmatory testing because patients usually are gone before results are ready. Meanwhile, posi-tive urine screen results from clinics automatically re� ex to con� rma-tory testing because clinics might be checking for compliance to prescribed medications. Some immunoassay tests prone to false positives—like a test for amphetamine—are also re� exed to con� rmatory testing.
Lynch’s lab uses MS for con� r-matory testing more sparingly than reference labs because Zuckerberg San Francisco General serves a public health role and operates within a limited budget, she added.
Noguez’s lab has a dedicated phone line and email address that pathologists monitor daily to answer questions about test selection and result interpretation in one-on-one conversations with physicians, nurses, and medical assistants. She also gives lectures. Some are recorded and posted online, along with guides to ordering the right test for speci� c
“Sometimes physicians can underestimate the complexityof the current drug testing environment.”
— Jaime Noguez, PhD

Features of AACC’s Universal Sample Bank include: > Individual pre-COVID-19 samples available
> Serum/plasma from 700+ healthy individuals
> Ethnically and geographically diverse adult population (18+)
> IRB-approved collection protocol
> Available in serum or lithium heparin plasma
> Comprehensive donor data with health screening information
> Results of HbA1c, Creatinine, and NT-proBNP screens
AACCUniversal Sample Bank
AACC members who purchase the sample sets for academic research purposes will receive a significant discount.
International shipping now available.
For more information visit www.aacc.org/samplebank.
Disclaimer: AACC collected 60 mL of blood from volunteer donors attending the AACC Annual Meeting in Atlanta, GA in order to establish the 99th percentile for cardiac troponin in a healthy population. After collection, the blood was processed on site, divided into equal sample sizes and then transported to CDC for storage at -80°C. Samples were de-identified and no test results will be provided to donors. Sets of donor samples are being offered to IVD manufacturers of cardiac troponin assays for purchase. AACC has undertaken this activity as part of its mission to further scientific research. THE DONOR SAMPLES ARE PROVIDED “AS IS”. AACC DISCLAIMS ALL WARRANTIES INCLUDING IMPLIED WARRANTIES OF MERCHANTABILITY AND FITNESS FOR A PARTICULAR PURPOSE.
AACC’s Universal Sample Bank offers pre-screened and well-characterized sample sets at a competitive price.
The sample set can be used in a variety of clinical studies, including clinical assay development, standardization, and reference range studies.

24 JUNE 2020
the prevalence of drugs that UCSF’s tests target. She also uses outside data on local drug use and overdoses. The data come from a collabora-tive group including her local poison control system, public health depart-ment, medical examiner’s of� ce, city toxicology lab, and needle exchange programs, which monitor local drug use and overdoses. All these partners share information.
BUILDING RELATIONSHIPS Building relationships and rapport with physicians and other staff is key to educating them and achieving proper test utilization. All the indi-viduals CLN interviewed emphasized the importance of accepting oppor-tunities to discuss drug testing and participating in hospital initiatives related to optimizing utilization.
Lab tours “are an amazing way to build professional bridges with vari-ous types of staff,” including clinical groups, pharmacists, and nurses who are often unaware of lab processes, Colantonio added. Tours include explanations of different aspects of the lab’s work� ow and of what goes
into validating tests and monitoring their quality. Colantonio spends extra time in areas of the lab especially of interest to a group.
The tours also spur trust and understanding when LIS problems delay results, openness to discussing discrepant results, and speci� c questions about test variability and measurements. Conversations have even led to a few published case studies, including one about a high-dose phenobarbital that can con-vert to its prodrug primidone (Ther Drug Monit 2013;35:145–9).
Leading physician rounds is an excellent way to � nd out what clini-cians need. When Colantonio reads an article that speaks to questions he commonly encounters in rounds, he will send it to interested parties. Residents especially like his handouts with tables of common cross-reac-tions, he noted.
Clarke stays plugged into clini-cal groups that need education. In collaboration with pain management and addiction specialists, he helped develop Johns Hopkins’ standards and guidelines for pain management.
By request, he speaks about available tests and their limits at the hospital’s regularly scheduled pain conference and during grand rounds.
Colantonio and Noguez also suggested involving clinicians from various specialties on lab utilization committees. They can tell labs what tests are not helpful, which new tests might be, and can give valuable insights that lead to effective changes in ordering. In addition, Colantonio recommended offering tailored train-ings to emergency, clinical pharmacol-ogy, and toxicology residents, both via lectures and one-on-one interactions. Clarke also favors the one-on-one approach, especially when offered proactively. “Be old fashioned. Go to them,” he advised.
“You have to understand clinicians’ needs. Sometimes you don’t know what they don’t know,” Clarke added. He has worked at his institution for 20 years and is “still meeting groups of clinicians I need to connect with.”
Deborah Levenson is a freelance writer in College Park, Maryland. +EMAIL: [email protected]
FG T
rad
e /
Get
ty Im
ages

WE ARE ALL INIt has never been more vital for us to come together as one global laboratory medicine community. Be a force for change as we take on the greatest clinical science challenges facing our world today. This is our time to:
DISCOVER critical research advancing the field from 350+ expert speakers and 300 scientific sessions covering infectious disease, emerging diagnostics, genomics and more.
EXPLORE 200+ product and technology innovations at the world’s largest exposition for clinical laboratory science.
CONNECT with global leaders working in clinical chemistry, molecular diagnostics, mass spectrometry and other areas of laboratory science.
Join us. Register today at meeting.aacc.org. Save with the lowest rates available until October 29.
meeting.aacc.org
DECEMBER 13 -17 • CHICAGO, IL USA

APPLICATIONS ACCEPTED: JUNE 1– SEPTEMBER 14, 2020
LEARN MORE AT www.aacc.org/CPP
Point-of-Care Testing Professional Certifi cation documents that healthcare professionals working in point-of-care testing have proven expertise in this area and are among the top in their fi eld.
This certifi cation is valuable for those in the clinical setting as well as industry and academia.
The exam tests mastery and knowledge of: • Test Selection• Quality Management• US Regulatory Compliance and Safety
POINT-OF-CARE TESTING ProfessionalCertifi cation

27JUNE 2020
RegulatoryRoundup
dra
gan
a991
/ G
etty
Imag
es
■ WITH NEW FDA APPROVAL, ROCHE’S HPV TEST CAN BE USED ON THE COBAS 6800/8800
The Food and Drug Administration (FDA) has
approved Roche’s cobas HPV test for use on the company’s fully automated, high-throughput cobas 6800/8800 systems. This test identi-� es women at risk for cervical cancer
by detecting the presence of high-risk human papillomavirus (HPV) DNA in cervical samples. Speci� cally, the test detects HPV genotypes 16 and 18—the two genotypes responsible for about 70% of all cervical cancers—and reports the 12 other high-risk HPV types as a combined result, all in one test and from one patient sample. FDA originally approved this test for the cobas 4800 system in 2011 using
data from the ATHENA (Addressing the Need for Advanced HPV Diagnostics) trial. For this most recent approval, the agency considered data from the registrational IMPACT (Improving Primary Screening and Colposcopy Triage) trial, which enrolled almost 35,000 women in the U.S. for the purpose of clinically validating the cobas HPV for use on the cobas 6800/8800 systems.
FDA Authorizes SARS-CoV-2 Tests That Use Samples Self-collected by PatientsIn an effort to lower the risk of infection for healthcare professionals involved in sample collection for SARS-CoV-2 testing, as well as to save personal protective equipment, the Food and Drug Administration (FDA) has granted emergency use authorizations (EUAs) to two SARS-CoV-2 tests that use self-collected samples. One of these tests is the first that FDA has authorized to offer a home collection option for SARS-CoV-2. Specifically, FDA reissued the EUA for LabCorp’s COVID-19 RT-PCR test to permit testing of samples self-collected by patients at home using LabCorp’s Pixel by LabCorp COVID-19 test home collection kit. This kit provides patients with a specific Q-tip style cotton nasal swab and saline for sample collection. Once patients self-swab to collect their nasal sample, they
mail their sample in an insulated package to LabCorp for testing. LabCorp intends to make the Pixel home collection kits available to consumers
in most states with a doctor’s order. Now that this is an option for COVID-19 testing, however,
AACC is concerned that consumers will not be able to collect nasopharyngeal samples correctly and that this could cause false negative results. In a letter to FDA, the association has therefore asked the agency to consider issuing a warning about home-collected samples for COVID-19 testing. As AACC states in the letter, “We share FDA’s goal of expanding consumer access to COVID-19 testing and are con� dent in LabCorp’s ability to obtain analytically correct results from the test. However, serious preanalytical concerns associated with home specimen collection kits
exist that must be taken into consideration before deploying these kits widely and allowing physicians to make clinical
decisions based on results gained from this … approach.”The second self-collection test that FDA has authorized—
developed by Rutgers University’s cell and DNA biorepository, RUCDR In� nite Biologics, in collaboration with Spectrum Solutions
and Accurate Diagnostic Labs—uses saliva samples that patients self-collect at testing sites by spitting into a sealable tube. This saliva-based test is currently available through RWJBarnabas Health network, New Jersey’s most comprehensive healthcare system.

29
mon
keyb
usin
essi
mag
es /
Get
ty Im
ages
JUNE 2020
■ FDA APPROVES FOUNDATION MEDICINE’S CO-DIAGNOSTIC FOR BILE DUCT CANCER
Foundation Medicine has received Food and Drug Administration
(FDA) approval for FoundationOne CDx, a companion diagnostic for Incyte’s Pemazyre (pemigatinib), which is a selective � broblast growth factor receptor (FGFR) inhibitor approved for adults with previously treated, unresectable locally advanced or metastatic cholangiocarcinoma with a FGFR2 fusion or other related rearrangement. FGFR2 fusions and related rearrangements occur in 10%–16% of intrahepatic cholangio-carcinoma patients. FoundationOne CDx is a comprehensive genomic pro� ling assay that identi� es patients with these FGFR2 fusions or related rearrangements who might bene� t from treatment with Pemazyre.
Previously, FDA had already approved FoundationOne CDx as a companion diagnostic for 20 unique therapies across multiple other solid tumor types. Using next-generation sequencing, the test analyzes DNA isolated from formalin-� xed paraf� n embedded tumor tissue specimens to detect substitutions, insertion and deletion alterations, and copy number alterations in 324 genes and select gene rearrangements, as well as genomic signatures including microsatellite instability and tumor mutational burden.
■ FDA PROPOSES RECLASSIFICATION OF HCV TESTS FROM CLASS III TO II
The Food and Drug Administration (FDA) has
proposed reclassifying two types of hepatitis C virus (HCV) diagnostic tests from class III to II. The two types of HCV devices that FDA is propos-ing to reclassify are nucleic acid-based HCV RNA devices intended for the qualitative or quantitative detection or genotyping of HCV RNA and cer-tain HCV antibody devices intended for the qualitative detection of antibodies to HCV. If this reclassi� ca-tion is � nalized, manufacturers would
be able to submit these tests through FDA’s 510(k) pathway for clearance instead of through the premarket approval pathway. For both HCV test types, FDA reviewed medical device reporting databases and found that there are a low number of reported events for these devices relative to the number of tests conducted using them. All recalls of these devices have also been resolved without any identi-� ed patient harm. When taken all together, FDA believes this indicates a good safety record for these HCV tests and that special controls under the class II device designation will effectively mitigate the risks associ-ated with these devices.
■ SIEMENS HEALTHINEERS GETS FDA NOD FOR POINT-OF-CARE BLOOD GAS ANALYZER
The Food and Drug Administration has cleared
Siemens Healthineers’ RAPIDPoint
500e Blood Gas analyzer, a point-of-care instrument that is intended to help diagnose and monitor critically ill patients. The analyzer, is already available in countries requiring the CE mark. Using 100 μL of whole blood or pleural � uid, this instrument gener-ates a full panel of blood gas, elec-trolyte, metabolite, carbon monoxide (CO)-oximetry, and neonatal bilirubin results in approximately 1 minute. As a fully cartridge-based analyzer it does not have any maintenance require-ments; the measurement cartridge includes the planar sensors, sample probe, and CO-oximetry chamber, all of which are replaced with every new cartridge. The RAPIDPoint 500e also includes Integri-sense Technology, which performs frequent quality and blood integrity checks before, during, and after every patient sample and features three levels of independent automatic quality control, multiple calibration routines, and advanced software algorithms.

30 JUNE 2020
IndustryPlaybook
feel
life
/ G
etty
Imag
es
■ONE DROP BUYS SANO FOR DIGITAL TECHNOLOGY PLATFORM
The digital healthcare solutions company One Drop announced
its acquisition of Sano Intelligence, a company structured around health sensing technology. One Drop will acquire all assets and intellectual property of Sano Intelligence to expand its platform in digital health. The companies plan to develop adaptive, personalized integrated health solutions for real-time patient monitoring via their mobile devices.
Through the agreement, One Drop will make use of Sano’s silicon-sensing production infrastructure to manufacture a painless stick-on device that will assist patients in better understanding and tracking their blood glucose levels. The aim is to enable patients to discover any abnormalities in their health early on to prevent progression to more severe conditions.
One Drop will increase commer-cialization of the sensing technology by offering end-to-end employer and
payor offerings, digital-only offer-ings, and even retail availability. The company also plans to hire Sano employees as part of the acquisition.
■CO-DIAGNOSTICS PARTNERS WITH PROMEGA FOR LOGIX SMART COVID-19 TEST
Co-Diagnostics has partnered with Promega to rapidly
advance production and manufacture
Gilead Science, Second Genome Ink $38 Million AgreementIn a 4-year agreement, Gilead Science and Second Genome have partnered to advance microbiome-based research for inflammatory diseases. Through the partnership, Second Genome will provide its Microbiome Analytics Platform to help Gilead identify biomarkers that track responses to five experimental medicines for inflammation, fibrosis, and other diseases. Additionally, both companies hope to identify new biomarkers for the treatment of inflammatory bowel disease (IBD).
“There is a growing body of evidence that the microbiome plays an important role in disease progression and treatment response in in� ammatory diseases,” said William Lee, PhD, executive vice president of research at Gilead. “We look forward to working with Second Genome to investigate the microbiome’s role in in� ammatory disease and particularly IBD, where patients can face signi� cant challenges in achieving long-term remission with conventional therapies.”
According to the terms of the agreement, Second Genome will receive $38 million from Gilead, with a promise of an extra $1.5 billion if the � ve medicines get approved for market sale. The company will also receive up to $300 million for IBD programs. In return, Gilead will claim all rights for each drug produced from the partnership.
of its Logix Smart COVID-19 test. Since Co-Diagnostics received Food and Drug Administration emergency use authorization, domestic demand for the test has increased quickly. As part of the agreement, Promega will therefore help Co-Diagnostics expand manufacturing of the test kits across the U.S. and internationally.
“Promega has shown its dedi-cation to customer satisfaction

31JUNE 2020
Index to Advertisers
Kamiya Biomedical Company .....................................................C4www.k-assay.com
MilliporeSigma ....................................................................... 3www.sigmaaldrich.com
Nova Biomedical .................................................................. 19www.novabiomedical.com
Promega ..............................................................................C2www.promega.com
Quidel .................................................................................. 29www.quidel.com
Surmodics ............................................................................C3www.surmodics.comFa
tCam
era
/ G
etty
Imag
es
time and again, with branches in 16 countries and over 50 global distributors. We are confident they will be instrumental in helping Co-Diagnostics meet the grow-ing demand for our products as we connect with even more laboratories and testing centers in the United States and abroad,” said Dwight Egan, CEO of Co-Diagnostics.
The Logix Smart COVID-19 test recently acquired CE Mark approval to be sold as an in vitro diagnostic test to private and public clinical laboratories. The test, which detects RNA from the SARS-CoV-2 virus, has shown 100% sensitivity in patients who show common symp-toms, according to the company.
■GENETIC TESTING AGREEMENT FOR LYSOSOMAL STORAGE DISORDERS
To improve diagnosis of lysosomal storage disorders
(LSD) in children, Axovant Gene Therapies and Invitae are collaborat-ing in the Detect Lysosomal Storage Diseases (Detect) program, which will focus on genetic testing to advance treatment of conditions including GM1 gangliosidosis and GM2 gangliosidosis, more commonly known as Tay-Sachs/Sandhoff disease.
Studies have shown that LSDs are misdiagnosed in a majority of patients, and if not treated early, these inherited metabolic disorders have the ability to cause premature deaths. The Detect program aims to increase genetic testing and turnaround time of results to diag-nose patients sooner for earlier treat-ment and prevention. The program will target 53 LSD-speci� c genes to ensure accurate diagnosis. Through the agreement, Invitae will offer test-ing and counseling free of charge for patients affected by LSDs.
Axovant is currently targeting GM1 gangliosidosis through its AXO-AAV-GM1 clinical program at the National Institutes of Health and is seeking clearance through the Food and Drug Administration’s investigational new drug pathway for its AXO-AAV-GM2 clinical trial.
■ARCHERDX AND ILLUMINA PARTNER FOR WORLDWIDE IN VITRO DIAGNOSTICS
A rcherDX has entered a multiyear agreement with
Illumina in a bid to expand its companion diagnostics offerings. Through the partnership, Illumina plans to help ArcherDx commercial-ize its in vitro diagnostic kits in laboratories and hospitals worldwide.
The collaboration aims to place Archer FusionPlex research products globally while also increasing access to in vitro diagnostic tests performed on Illumina’s NextSeq 550Dx and MiSeqDx systems. The deal could also help ArcherDx receive Food and Drug Administration approval for its tumor Strata� de genomic compan-ion diagnostic for monitoring cancer treatments through patient blood or tissue samples, according to the companies.
“Creating broad access to clinically relevant genomic information is core to our company’s mission, and we expect this commercial partnership with Illumina will accelerate that pro-cess,” ArcherDX CEO Jason Myers, PhD, said in a statement. “Illumina’s
next-generation sequencing instru-ments are ubiquitous in thousands of clinical and research settings due to their accuracy, speed, and user experience.”
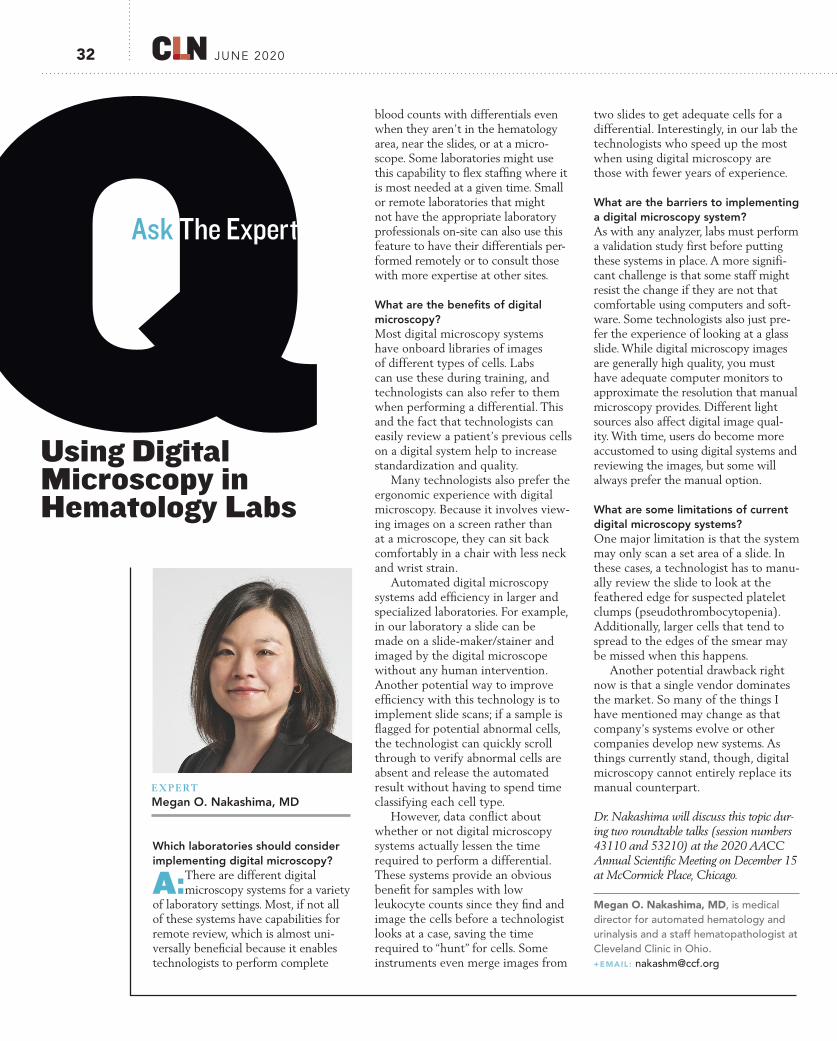
32 JUNE 2020
QAsk The Expert
Which laboratories should consider implementing digital microscopy?
A:There are different digital microscopy systems for a variety
of laboratory settings. Most, if not all of these systems have capabilities for remote review, which is almost uni-versally bene� cial because it enables technologists to perform complete
Using Digital Microscopy in Hematology Labs
EXPERT
Megan O. Nakashima, MD
blood counts with differentials even when they aren’t in the hematology area, near the slides, or at a micro-scope. Some laboratories might use this capability to � ex staf� ng where it is most needed at a given time. Small or remote laboratories that might not have the appropriate laboratory professionals on-site can also use this feature to have their differentials per-formed remotely or to consult those with more expertise at other sites.
What are the bene� ts of digital microscopy?Most digital microscopy systems have onboard libraries of images of different types of cells. Labs can use these during training, and technologists can also refer to them when performing a differential. This and the fact that technologists can easily review a patient’s previous cells on a digital system help to increase standardization and quality.
Many technologists also prefer the ergonomic experience with digital microscopy. Because it involves view-ing images on a screen rather than at a microscope, they can sit back comfortably in a chair with less neck and wrist strain.
Automated digital microscopy systems add ef� ciency in larger and specialized laboratories. For example, in our laboratory a slide can be made on a slide-maker/stainer and imaged by the digital microscope without any human intervention. Another potential way to improve ef� ciency with this technology is to implement slide scans; if a sample is � agged for potential abnormal cells, the technologist can quickly scroll through to verify abnormal cells are absent and release the automated result without having to spend time classifying each cell type.
However, data con� ict about whether or not digital microscopy systems actually lessen the time required to perform a differential. These systems provide an obvious bene� t for samples with low leukocyte counts since they � nd and image the cells before a technologist looks at a case, saving the time required to “hunt” for cells. Some instruments even merge images from
two slides to get adequate cells for a differential. Interestingly, in our lab the technologists who speed up the most when using digital microscopy are those with fewer years of experience.
What are the barriers to implementing a digital microscopy system?As with any analyzer, labs must perform a validation study first before putting these systems in place. A more signifi-cant challenge is that some staff might resist the change if they are not that comfortable using computers and soft-ware. Some technologists also just pre-fer the experience of looking at a glass slide. While digital microscopy images are generally high quality, you must have adequate computer monitors to approximate the resolution that manual microscopy provides. Different light sources also affect digital image qual-ity. With time, users do become more accustomed to using digital systems and reviewing the images, but some will always prefer the manual option.
What are some limitations of current digital microscopy systems?One major limitation is that the system may only scan a set area of a slide. In these cases, a technologist has to manu-ally review the slide to look at the feathered edge for suspected platelet clumps (pseudothrombocytopenia). Additionally, larger cells that tend to spread to the edges of the smear may be missed when this happens.
Another potential drawback right now is that a single vendor dominates the market. So many of the things I have mentioned may change as that company’s systems evolve or other companies develop new systems. As things currently stand, though, digital microscopy cannot entirely replace its manual counterpart.
Dr. Nakashima will discuss this topic dur-ing two roundtable talks (session numbers 43110 and 53210) at the 2020 AACC Annual Scientific Meeting on December 15 at McCormick Place, Chicago.
Megan O. Nakashima, MD, is medical director for automated hematology and urinalysis and a staff hematopathologist at Cleveland Clinic in Ohio. +EMAIL: [email protected]