oregon state university utility pole research...
TRANSCRIPT

Oregon State University Utility Pole Research Cooperative _________________________________________________________
1
Oregon State University Utility Pole Research Cooperative
Department of Wood Science & Engineering
Oregon Wood Innovation Center 34th Annual Report November 13th 2014
By:
J.J. Morrell, M. Konkler, J. Cappellazzi, C. Freitag, C. Love

34th Annual Report 2014 ___________________________
Table of Contents Executive Summary…………………………………………………6 Objective I……………………………………………………………..8 DEVELOP SAFER CHEMICALS FOR CONTROLLING-……………………................................................8 INTERNAL DECAY OF WOOD POLES-……………………………..............................................................8 A. Develop Improved Fumigants for Control of Internal Decay……………………………………….8 1. Performance of Dazomet With or Without Copper Based Accelerants………………..……...9
2. Performance of Dazomet in Powdered and Rod Forms in Douglas-fir Pole Sections……..10 3. Performance of Dazomet in Granular and Tube Formulations……………………………….11
B. Performance of Water Diffusible Preservatives as Internal Treatments………………………..12 1. Performance of Copper Amended Fused Boron Rods………………………………………..13 2. Performance of Fused Borate Rods in Internal Groundline Treatments of Douglas-fir Poles……………………………………………………………………………………………….14 3. Effect of Glycol on Movement of Boron from Fused Boron Rods………………………........14 4. Performance of Fluoride/Boron Rods in Douglas-fir Poles……………………………………15 5. Performance of Sodium Fluoride Rods as Internal Treatment in Douglas-fir Poles……….16 6. Potential for Boron Movement from Poles……………………………………………………...17 7. Thresholds for Boron and Copper in Internal Treatments…………………………………….22 C. Tests Including Both Fumigants and Diffusibles…………………………………………………..31 1. Full Scale Field Trial of All Internal Remedial Treatments…………………………………….31 2. Performance of Internal Remedial Treatments in Arid Climates: Rocky Mountain Power Test……………………………………………………………………………………......32 Literature Cited……………………………………………………………………………………………43
Objective II……………………………………………………..……46 IDENTIFY CHEMICALS FOR PROTECTING EXPOSED WOOD SURFACES IN POLES……………….46 A. Effect of Boron Pretreatment on Performance of Preservative Treated Douglas-fir Poles…..46 Literature Cited……………………………………………………………………………………….......53
Objective III………………………………………………………….54 EVALUATE PROPERTIES AND DEVELOP IMPROVED SPECIFICATIONS FOR WOOD POLES.……54 A. Effects of Polyurea Coating on Performance of Douglas-fir in Tropical Above Ground Exposures…………………………………………………………………………………………….54 B. Preservative Migration in Poles Treated with Pentachlorophenol………………………………62 C. Incidence of Soft Rot Attack on Preservative Treated Douglas-fir Poles: A Preliminary Survey………………………………………………………………………………………………..63 D. Performance of Southern Pine Stakes Treated with Pentachlorophenol in Diesel or HTS Solvent…………………………………………………………………………………………67 E. Effects of Solvents on Performance of Copper Naphthenate and Pentachlorophenol……....70 F. Performance of Fire Retardant Treatments……………………………………………………….90 Literature Cited…………………………………………………………………………………………...96
Objective IV……………………………………………………...….99 PERFORMANCE OF EXTERNAL GROUNDLINE PRESERVATIVE SYSTEMS………………………….99 A. Previous External Groundline Treatment Tests…………………………………………………..99 B. Performance of a Boron/Fluoride Paste on Douglas-fir, Western redcedar, and Southern Pine Poles……………………………………………………………………………………………99 C. Performance of External Groundline Treatments in Drier Climates…………………………...101 D. Develop Thresholds for Commonly Used External Preservative Systems……………………116 E. Effect of External Barriers on Pole Performance………………………………………………...117

Oregon State University Utility Pole Research Cooperative _________________________________________________________
3
F. Establish a Field Trial of Current Linear System…………………………………………………118 Literature Cited……………………………………………………………………………………….….119
Objective V…………………………………………………………123 PERFORMANCE OF COPPER NAPHTHENATE TREATED WESTERN WOOD SPECIES……………123 A. Performance of Copper Naphthenate Treated Western Redcedar Stakes in Soil Contact.123 B. Field Performance of Copper Naphthenate Treated Douglas-fir Poles in Western Washington…………………………………………………………………………………………..126
Objective VI………………………………………………………...127 ASSESS THE POTENTIAL ENVIRONMENTAL IMPACTS OF WOOD POLES…………………………..127 A. Migration of Copper from Copper Naphthenate Treated Douglas-fir Poles during Storage. 127 Literature Cited…………………………………………………………………………………………..134

34th Annual Report 2014 ___________________________
COOPERATORS American Transmission Company
Arizona Public Service
Bonneville Power Administration
Brooks Manufacturing Inc.
Copper Care Wood Preservatives Inc.
Dr. Wolman, GMBH
Fortis Alberta
Genics Inc.
Intec Services Inc. (Pole Care Inc.)
ISK Biocides
McFarland Cascade
Nisus
Osmose Utilities Services, Inc.
Pacific Gas and Electric
PacifiCorp
Poles Inc.
Portland General Electric Company
Puget Sound Energy Services
Rio Tinto Minerals
Salt River Project
Snohomish County Public Utility District
Stella-Jones Inc.
The Pentachlorophenol Working Group
Western Wood Preservers Institute
Wood Care Systems
Xcel Energy

Oregon State University Utility Pole Research Cooperative _________________________________________________________
5
PERSONNEL ADVISORY COMMITTEE
Gerald Rhode American Transmission Company Mike Woodward Arizona Public Service Robert Ochs Bonneville Power Administration Shannon Terrell/Dwayne Carter Brooks Manufacturing Inc. William Abbott Copper Care, Inc. Dr. Manfred Jung Dr. Wolman GmbH Tom Jantzen Fortis Alberta Brent Elton/Jeff Johnson Genics Inc Andy Kudick/Rob Nelson Intec Services Inc. (Pole Care Inc.) Anthony Accampo ISK BioSciences Jeff Lloyd/Ken Loughlin Nisus Tom Pope/Doug Herdman Osmose Utilities Services, Inc. Larry Shiba/Michael Pallatroni Pacific Gas & Electric Dave Asgharian/Chuck Wright PacifiCorp Randy Gross Poles Inc. George Jones/Jerry Donovan Portland General Electric Company Helen Turner Puget Sound Energy Mark Manning Rio Tinto Minerals Larry White/Yancy Gill Salt River Project Steve Stangvik Snohomish County PUD Jon Younce/Kyle Cassidy/Bryan Sible Stella-Jones Inc. Michael Hoffman The Pentachlorophenol Working Group Dallin Brooks/Butch Bernhardt Western Wood Preservers Institute James Renfroe Wood Care Systems Jeff Goodson Xcel Energy
RESEARCH
Principle Investigators Jeffery J. Morrell Scott Leavengood Professor Director
Department of Wood Science and Engineering Oregon Wood Innovation Center Oregon State University Faculty Research Assistants Graduate Students
Jed Cappellazzi Greeley Beck Camille Freitag Joseph Hulbert Connie Love David King Matt Konkler Paola Torres
Shahlinney Lipeh Visiting Scientists Selim Uysal Femi Owofadeju

34th Annual Report 2014 ___________________________
Executive Summary
The Utility Pole Research Cooperative currently has 11 Utility members and 14 Associate members. Membership continues to fluctuate, primarily in the Associate member category. This is largely because of acquisitions and mergers.
Coop progress and results under each of six objectives will be summarized here.
The goals of Objective I are to develop data on internal remedial treatments. This past year, we evaluated the dry climate internal remedial test in Utah. This test was established to develop better data on chemical performance in the absence of moisture. MITC and metham sodium performed as expected and the absence of moisture has not negatively affected performance. Dazomet has performed acceptably when applied with an accelerant but there is much less MITC movement when dazomet is applied alone. Movement from borate from rods has also been limited, reflecting very dry conditions. The results illustrate performance differences with climate and suggest the need to modify treatment patterns under these conditions to place treatments further down the pole where moisture conditions are likely to be more suitable for chemical movement.
We also explored the potential for synergy between copper and boron using procedures previously developed for establishment of boron and fluoride thresholds. Results indicate little or no interaction between these two chemicals in terms of fungal control. Consequently, we will continue to examine internal system performance using these two active ingredients with separate fungal thresholds.
The goal of Objective II is to develop improved methods for limiting fungal decay in field-drilled bolt holes. This past year, we examined pre-treating poles with boron and over-treating with copper naphthenate. This approach, already successfully used for railroad ties, has not been explored with larger utility poles. Douglas-fir poles were pressure treated with boron followed by copper naphthenate and set in the ground at our field site. Boron levels were assessed prior to installation and one year later. Boron did not penetrate deeply in the two months prior to installation nor did it substantially move afterwards. Boron levels near groundline were lower than 0.9 m above groundline, suggesting boron was being lost to surrounding soil. We will continue to monitor these tests while exploring other methods to deliver larger quantities of boron to poles prior to conventional treatment.
Objective III addresses a variety of issues related to pole performance. We continue to evaluate polyurea coatings as barriers for aboveground wood exposure. Results with coated Douglas-fir cross arm samples suggest that fungi were eventually able to penetrate non-treated wood, although the process took 4 years. Results indicate that polyurea coatings cannot be used without supplemental protection to the underlying wood.

Oregon State University Utility Pole Research Cooperative _________________________________________________________
7
Evaluations of wood treated with pentachlorophenol in biodiesel-amended solvents continue. This year, we examined potential for downward movement of solvents in poles in service. Substantial differences in oil contents were noted between samples removed from 1.2 m above and at groundline. These results are preliminary and we intend to sample additional poles with and without biodiesel to determine differential migration patterns. We also continued to evaluate the condition of stakes treated with pentachlorophenol in a biodiesel-amended oil and found that material performance did not differ from stakes treated using conventional solvents. These results are consistent with previous tests. Finally, we established a large field trial to examine solvent effects on copper naphthenate and pentachlorophenol performance. These results will be presented in future reports.
We also evaluated our new fire test using non-fire protected pole sections and poles with a polyurea barrier to gauge our ability to deliver fire exposures similar to those produced by a quick burning brush fire. Results indicated that a 5 to 10 minute fire exposure was sufficient to create deep char. The polyurea barrier failed to protect the pole section. We have a number of other treatments that will be evaluated in 2015 using this test methodology.
Objective IV examines external groundline preservative performance. We present data from the 30 month sampling of our large field trial in Arizona. Treatments continue to perform as expected with copper based components remaining near the surface and boron migrating deeper. Boron diffusion is more restricted than in previous tests under wetter conditions. As with our other dry climate field trials, results suggest the need for different protection patterns that extend further below the groundline where moisture conditions are suitable for both fungal decay and chemical movement.
Objective V examines the copper naphthenate performance in service. We continue to evaluate our small scale trial of copper naphthenate treated western redcedar. These result show that copper naphthenate provided excellent protection. We have also previously examined the condition of copper naphthenate treated poles in service and plan to resume investigations in 2015.
Objective VI examines the potential for preservative migration from poles in storage. We have used data collected from copper naphthenate poles in storage to develop estimates of copper migration from poles over time under varying rainfall regimes. We have also examined the worst-case levels of copper that might develop beneath these poles and assessed different storage methods to reduce copper movement. These data, along with previous tests on pentachlorophenol and ammoniacal copper zinc arsenate treated poles, provide tools for utilities to examine pole storage practices to minimize risk of chemical loss.

34th Annual Report 2014 ___________________________
OBJECTIVE I
DEVELOP SAFER CHEMICALS FOR CONTROLLING
INTERNAL DECAY OF WOOD POLES Remedial treatments continue to play a major role in extending the service life of wood poles. While the first remedial treatments were broadly toxic, volatile chemicals, treatments have gradually shifted to more controllable treatments. This shift has resulted in the availability of a variety of internal treatments for arresting fungal attack. Some treatments are fungitoxic based upon movement of gases through the wood, while others are fungitoxic based upon movement of boron or fluoride in free water. Each system has advantages and disadvantages in terms of safety and efficacy. In this section, we discuss the active field tests of the newer formulations as well as additional work to more completely characterize the performance of several older treatments.
A. Develop Improved Fumigants for Control of Internal Decay
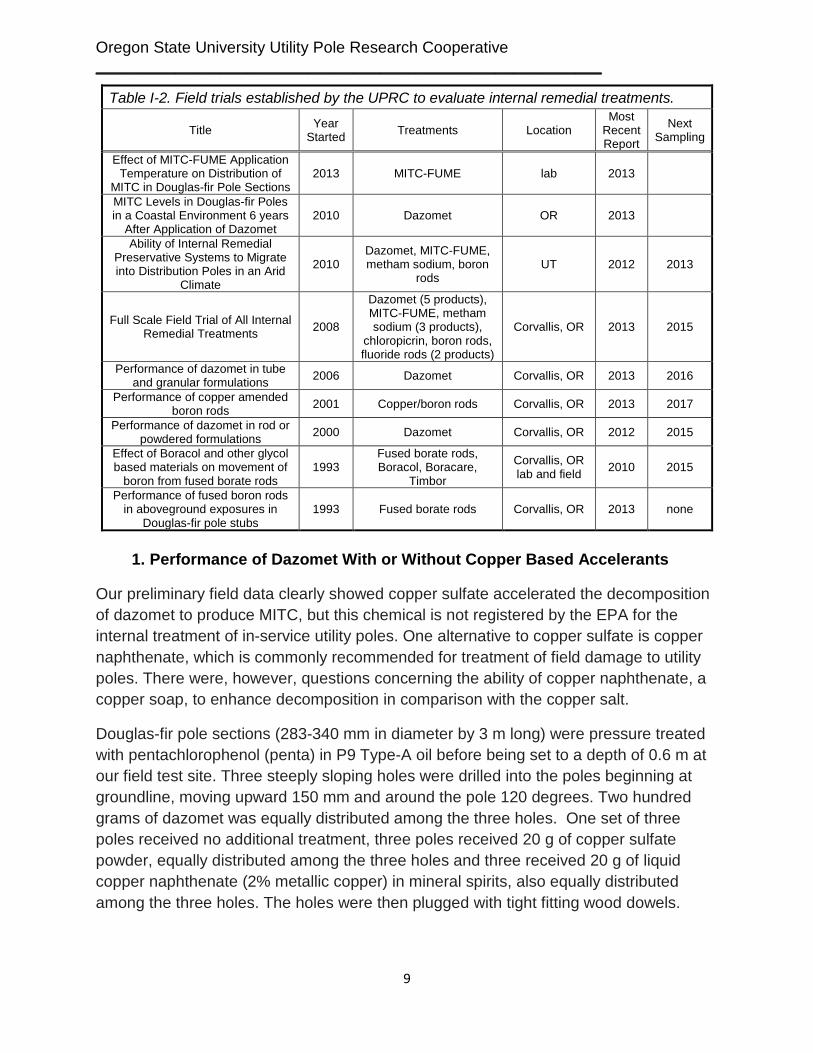
While there are a variety of methods used to control internal decay around the world, fumigants remain the most widely used systems in North America. Historically, two fumigants were registered for wood, metham sodium (32.1% sodium n-methyldithiocarbamate) and chloropicrin (96% trichloronitromethane) (Table I-1). Of these, chloropicrin was the most effective, but both systems were prone to spills and carried the risk of worker contact. Utility Pole Research Cooperative (UPRC) research identified two alternatives, methylisothiocyanate (MITC) and dazomet. Both chemicals are solid at room temperature, reducing the risk of spills and simplifying cleanup of any spills that occur. MITC was commercialized as MITC-FUME, while dazomet has been labeled as Super-Fume, UltraFume and DuraFume (Table I-1). An important part of the development process for these systems has been continuing performance evaluations to determine when retreatment is necessary and to identify factors that might affect performance. A list of active and inactive tests for Objective I can be found in Table I-2.
Table I-1. Characteristics of fumigants used for internal remedial treatment of utility poles in North America
Trade Name Active Ingredient Conc. (%) Toxicity (LD50) Manufacturer
TimberFume trichloronitromethane 97 205 mg/kg Osmose Utilities Services, Inc. WoodFume
sodium n-methyldithiocarbamate 32.1 1700-1800 mg/kg
Osmose Utilities Services, Inc. ISK Fume ISK Biosciences
SMDC-Fume Copper Care Wood Preservatives, Inc.
MITC-FUME methylisothiocyanate 96 305 mg/kg Osmose Utilities Services, Inc. Super-Fume
Tetrahydro-3,5-dimethyl-2H-1,3,5-thiodiazine-2-
thione 98-99
320 mg/kg oral Pole Care Inc.
UltraFume 2260 mg/kg dermal Copper Care Wood Preservatives, Inc.
DuraFume Osmose Utilities Services, Inc.
Oregon State University Utility Pole Research Cooperative _________________________________________________________
9
1. Performance of Dazomet With or Without Copper Based Accelerants
Our preliminary field data clearly showed copper sulfate accelerated the decomposition of dazomet to produce MITC, but this chemical is not registered by the EPA for the internal treatment of in-service utility poles. One alternative to copper sulfate is copper naphthenate, which is commonly recommended for treatment of field damage to utility poles. There were, however, questions concerning the ability of copper naphthenate, a copper soap, to enhance decomposition in comparison with the copper salt.
Douglas-fir pole sections (283-340 mm in diameter by 3 m long) were pressure treated with pentachlorophenol (penta) in P9 Type-A oil before being set to a depth of 0.6 m at our field test site. Three steeply sloping holes were drilled into the poles beginning at groundline, moving upward 150 mm and around the pole 120 degrees. Two hundred grams of dazomet was equally distributed among the three holes. One set of three poles received no additional treatment, three poles received 20 g of copper sulfate powder, equally distributed among the three holes and three received 20 g of liquid copper naphthenate (2% metallic copper) in mineral spirits, also equally distributed among the three holes. The holes were then plugged with tight fitting wood dowels.
Table I-2. Field trials established by the UPRC to evaluate internal remedial treatments.
Title Year Started Treatments Location
Most Recent Report
Next Sampling
Effect of MITC-FUME Application Temperature on Distribution of
MITC in Douglas-fir Pole Sections 2013 MITC-FUME lab 2013
MITC Levels in Douglas-fir Poles in a Coastal Environment 6 years
After Application of Dazomet 2010 Dazomet OR 2013
Ability of Internal Remedial Preservative Systems to Migrate into Distribution Poles in an Arid
Climate
2010 Dazomet, MITC-FUME, metham sodium, boron
rods UT 2012 2013
Full Scale Field Trial of All Internal Remedial Treatments 2008
Dazomet (5 products), MITC-FUME, metham sodium (3 products),
chloropicrin, boron rods, fluoride rods (2 products)
Corvallis, OR 2013 2015
Performance of dazomet in tube and granular formulations 2006 Dazomet Corvallis, OR 2013 2016
Performance of copper amended boron rods 2001 Copper/boron rods Corvallis, OR 2013 2017
Performance of dazomet in rod or powdered formulations 2000 Dazomet Corvallis, OR 2012 2015
Effect of Boracol and other glycol based materials on movement of
boron from fused borate rods 1993
Fused borate rods, Boracol, Boracare,
Timbor
Corvallis, OR lab and field 2010 2015
Performance of fused boron rods in aboveground exposures in
Douglas-fir pole stubs 1993 Fused borate rods Corvallis, OR 2013 none

34th Annual Report 2014 ___________________________
Levels of MITC were above the toxic threshold in the interior of poles near groundline for all treatments for 8 years. Both copper amendments enhanced decomposition to MITC. The test was sampled for 15 years when MITC levels had fallen below threshold at most locations and were barely above threshold near the groundline of the copper naphthenate treatment. The final report can be found in the 2012 UPRC Annual Report.
2. Performance of Dazomet in Powdered and Rod Forms in Douglas-fir Pole Sections
Date Established: March 2000
Location: Peavy Arboretum, Corvallis, OR
Pole Species, Treatment, Size Douglas-fir, penta
Circumference @ GL (avg., max., min.) 84, 104, 65 cm Dazomet was originally supplied in a powdered formulation intended for application to agricultural fields where it could be tilled into the soil. Once in contact with the soil, dazomet would rapidly react with moisture to release MITC, killing potential pathogens prior to planting. The drawbacks to the use of powdered formulations for treatment of internal decay in wood poles include the risk of spillage during application, as well as the potential for the presence of chemical dusts that can be inhaled. In early trials, we produced dazomet pellets by wetting the powder and compressing the mixture into pellets, but these were not commercially available. The desire for improved handling characteristics, however, encouraged development of a rod form. These rods simplified application, but we wondered whether the decreased wood/chemical contact associated with the rods might reduce dazomet decomposition, thereby slowing fungal control. Penta treated Douglas-fir pole sections (206-332 mm in diameter by 3 m long) were set to a depth of 0.6 m at the Corvallis test site. Three steeply angled holes were drilled into each pole beginning at groundline and moving upward 150 mm and around 120 degrees. The holes received either 160 g of powdered dazomet, 107 g of dazomet rod plus 100 g of copper naphthenate (2% as Cu), 160 g of dazomet rod alone, 160 g of dazomet rod amended with 100 g of copper naphthenate, 160 g of dazomet rod amended with 100 g of water, or 490 ml of metham sodium. Pre-measured aliquots of the amendments were placed into the treatment holes on top of the fumigants. Each treatment was replicated on five poles.
Chemical distribution was assessed periodically for 12 years after treatment and remained above threshold in both the inner and outer portions of poles receiving all treatments except metham sodium. The last complete report on this test can be found in the 2012 UPRC Annual Report and the test will next be sampled in 2015.

Oregon State University Utility Pole Research Cooperative _________________________________________________________
11
3. Performance of Dazomet in Granular and Tube Formulations
Date Established: August 2006
Location: Peavy Arboretum, Corvallis, OR
Pole Species, Treatment, Size Douglas-fir, penta
Circumference @ GL (avg., max., min.) 89, 97, 81 cm
Dazomet has been successfully applied to in-service utility poles for over a decade; however, one concern with this system is the risk of spilling the granules during application. In previous tests, we explored the use of dazomet in rod form, but this does not appear to be a commercially viable product. As an alternative, dazomet could be placed in degradable tubes that encase the chemical prior to application. The tubes could also affect subsequent dazomet decomposition and the release of MITC. In order to investigate this possibility, the following trial was established.
Penta treated Douglas-fir pole sections (250-300 mm in diameter by 2.1 m long) were set to a depth of 0.6 m at the Peavy Arboretum test site. Three 22 mm diameter by 375 to 400 mm long steeply-angled holes were drilled into the poles beginning at groundline and moving upward 150 mm and 120 degrees around the pole.
Seventy grams of dazomet was pre-weighed into plastic bottles. The content of one bottle was added to each of the three holes in each of 10 poles. The holes in 10 additional poles each received a 400 to 450 mm long by 19 mm diameter paper tube containing 60 g of dazomet. The tubes were gently rotated as they were inserted to avoid damaging the paper. The holes in one half of the poles treated with either granular or tubular dazomet were then treated with 7 g of 2% copper naphthenate (as Cu) in mineral spirits (Tenino Copper Naphthenate). The holes were plugged with tight fitting plastic plugs. A second set of poles was treated one year later with an improved Super-Fume tube system using these same procedures. The newest tubes were constructed of degradable perforated plastic which will break down over time and not require removal before re-treating the poles.
MITC distribution was assessed 1, 2, 3, 5 and 7 years after treatment by removing increment cores from three locations around the pole 150 mm below groundline, at groundline, as well as 300, 450 and 600 mm above groundline. The outer treated zone of the core was removed and then the inner and outer 25 mm of each core was placed in ethyl acetate, extracted for 48 hours at room temperature and then the extract was removed and analyzed by gas chromatography for MITC. The remainder of each core was placed on 1.5% malt extract agar and observed for evidence of fungal growth. Any fungal growth was examined for characteristics typical of basidiomycetes, a class of fungi containing many important wood decay fungi.

34th Annual Report 2014 ___________________________
The dazomet in plastic tube treatments were installed approximately one year after the granular and paper tube treatments. MITC levels in these poles have tended to be slightly lower than those found with the other treatments. The plastic tubes, which contained significantly smaller doses of dazomet, were also exposed to slightly different rainfall regimes than the other two application methods. It is possible that the plastic limited dazomet decomposition but it is more likely that dose and environmental conditions explain the lower MITC levels in these poles.
The results are consistent with our previous dazomet trials and suggest that tubes might be an alternative method for applying the granular system. These tests will next be sampled in 2016 at the 10 year point.
B. Performance of Water Diffusible Preservatives as Internal Treatments
While fumigants have long been an important tool for utilities seeking to prolong the service lives of wood poles by limiting the extent of internal decay, some users have expressed concern about the risk associated with these chemicals. Water diffusible preservatives such as boron and fluoride have been developed as potentially less toxic alternatives to fumigants (Table I-3). Boron has a long history of use as an initial treatment of freshly sawn lumber to prevent infestations by various species of powder post beetles in both Europe and New Zealand (Becker, 1976, Cockcroft and Levy, 1973; Dickenson et al., 1988; Dietz and Schmidt, 1988, Dirol, 1988, Edlund et al., 1983; Ruddick and Kundzewicz, 1992, Smith and Williams, 1967; Williams and Amburgey, 1987). This chemical has also been used more recently for treatment of lumber in Hawaii to limit attack by the Formosan subterranean termite. Boron is attractive as a preservative because it has exceptionally low toxicity to non-target organisms, especially humans, and because it has the ability to diffuse through wet wood. In principle, a decaying utility pole should be wet, particularly near the groundline and this moisture can provide the vehicle for boron to move from the point of application to wherever decay is occurring. Boron is available for remedial treatments in a number of forms, but the most popular are fused borate rods which come as pure boron or as boron plus copper (Morrell et al., 1992, 1995; Morrell and Schneider, 1995; Schneider et al., 1993). These rods are produced by heating boron to its molten state, then pouring the molten boron into a mold. The cooled boron rods are easily handled and applied. In theory, the boron is released as the rods come in contact with water.
Fluoride has also been used in a variety of preservative formulations since the 1930’s when fluor-chrome-arsenic-phenol was employed as an initial treatment. Fluoride, in rod form, has long been used to treat the area under tie plates in railroad tracks and has been used as a dip-diffusion treatment in Europe. Fluoride can be corrosive to metals, although this should not be a problem in the groundline area. It might be advisable to

Oregon State University Utility Pole Research Cooperative _________________________________________________________
13
avoid application near iron base attachments. Sodium fluoride is also formed into rods for application, although fluoride rods are less dense than boron rods.
Both of these chemicals have been available for remedial treatments for several decades, but widespread use of these systems has only occurred in the last decade and most of this application has occurred in Europe.
Table I-3. Characteristics of water diffusible treatments used for arresting internal decay in utility poles. Trade Name Active
Ingredient Conc. (%) Toxicity (LD50) Manufacturer
Impel Rods Bor8-Rods boron 96.65 >2000 mg/kg Pole Care Inc. Wood
Care Systems Pole Saver
Rods boron/fluoride 58/24 >2000 mg/kg Preschem Ltd.
Flurods fluoride 98 105 mg/kg Osmose Utilities Services Inc.
Cobra-Rods boron/copper 95.3/2.9 10000 mg/kg
oral 5000 mg/kg dermal
Genics Inc.
1. Performance of Copper Amended Fused Boron Rods
Date Established: November 2001
Location: Peavy Arboretum, Corvallis, OR
Pole Species, Treatment, Size Douglas-fir, penta and Douglas-fir creosote
Circumference @ GL (avg., max., min.) 78, 102, 66 cm
The ability of boron and copper to move from fused rods was assessed by drilling holes perpendicular to the grain in penta treated Douglas-fir poles beginning at the groundline and then moving upward 150 mm and either 90 or 120 degrees around the pole. The poles were treated with either 4 or 8 copper/boron rods or 4 boron rods. The holes were then plugged with tight fitting plastic plugs. Chemical movement was assessed 1, 2, 3, 5, 7 and 9 years after treatment by removing increment cores from locations 150 mm below groundline as well as at groundline, and 300 or 900 mm above this zone. The outer, 25 mm of treated shell was discarded, and the core was divided into inner and outer halves. The cores from a given zone on each set of poles were combined and then ground to pass a 20 mesh screen. Ground wood was hot water extracted prior to analysis according to procedures described in American Wood Protection Standard (AWPA) A2 Method 16, the Azomethine-H assay (AWPA, 2004). The results were expressed on a kg boric acid equivalent (BAE)/cubic meter of wood basis. Previous studies in our laboratory indicate the threshold for protection of Douglas-fir heartwood against internal decay is approximately 0.5 kg/m3 BAE (Freitag and Morrell 2005). This test was not sampled this past year and will not be sampled until 2016.

34th Annual Report 2014 ___________________________
2. Performance of Fused Borate Rods in Internal Groundline Treatments of
Douglas-fir Poles Date Established: May 1993
Location: Peavy Arboretum, Corvallis, OR
Pole Species, Treatment, Size Douglas-fir, penta
Circumference @ GL (avg., max., min.) 101, 114, 89 cm Thirty penta treated Douglas-fir poles (283-364 mm in diameter by 2 m long) were set to a 0.6 m depth at the Peavy Arboretum test site. Three 19 mm diameter by 200 mm long holes were drilled perpendicular to the grain beginning at groundline and moving around the pole 120 degrees and upward 15 cm. Each hole received either 1 or 2 boron rods (180 or 360 g of rod, respectively). The holes were then plugged with tight fitting wooden dowels. Each treatment was replicated on 10 poles.
The poles were sampled 1, 3, 4, 5, 7, 10, 12, 15 and 20 years after treatment by removing increment cores from sites located 15 cm below groundline as well as 7.5, 22.5, 45, and 60 cm above the groundline. The cores were divided into inner and outer segments which were combined according to treatment and height, then ground to pass a 20 mesh screen, extracted and analyzed for boron using the Azomethine H method. Boron levels were expressed on a kg/m3 of boron as BAE. Previous studies in our laboratory indicate that the threshold for protection of Douglas-fir heartwood against internal decay is approximately 0.5 kg/m3 BAE.
The results indicate boron remains in the treated zone of the poles at levels capable of conferring protection against fungal attack 20 years after treatment.
3. Effect of Glycol on Movement of Boron from Fused Boron Rods
Date Established: March 1995
Location: Peavy Arboretum, Corvallis, OR
Pole Species, Treatment, Size Douglas-fir, penta
Circumference @ GL (avg., max., min.) 87, 99, 81 cm
While boron has been found to move with moisture through most pole species (Dickinson et al., 1988; Dietz and Schmidt, 1988; Dirol, 1988; Edlund et al., 1983; Ruddick and Kundzewicz, 1992), our initial field tests showed slower movement in the first year after application. One remedy to the initial slow movement that has been used in Europe has been the addition of glycol to the treatment holes. Glycol is believed to stimulate movement through dry wood that would normally not support diffusion (Edlund et al., 1983).

Oregon State University Utility Pole Research Cooperative _________________________________________________________
15
Penta treated Douglas-fir pole sections (259 to 315 mm in diameter by 2.1 m long) were set to 0.6 m depth at the Peavy Arboretum test site, which receives 1050 mm average yearly precipitation with 81% falling between October and March.
Four 19 mm diameter holes were drilled at a 45° downward sloping angle in each pole, beginning 75 mm above the groundline, then moving 90 degrees around and up to 230, 300, and 450 mm above the groundline. An equal amount of boron (227 g BAE) was added to each pole, but was delivered in different combinations of boron, water, or glycol. The boron rods were 100 mm long by 12.7 mm in diameter and weighed 24.4 g each. An equal weight of boron rod, composed of one whole rod and a portion of another, were placed in each hole followed by the appropriate liquid supplement or were left dry. The holes were plugged with tight fitting wooden dowels. Each treatment was replicated on five poles.
The pole sections were sampled 1, 2, 3, 5, 7, 10, 12 and 15 years after treatment by removing two increment cores 180 degrees apart from 300 mm below the groundline, and cores from three equidistant locations around the pole 150 and 300 mm above the groundline. The treated portion of the cores was discarded, then the remainder of each core was divided into zones corresponding to 0-50 (O), 51-100 (M), and 101-150 (I) mm from the edge of the treated zone. The zones from the same depth and height from a given treatment were combined and ground to pass a 20 mesh screen. The resulting sawdust was then extracted and analyzed using the Azomethine-H method.
The results indicate that adding glycol or water based boron to boron rods at the time of treatment resulted in much more rapid boron movement, thereby increasing the rate of fungal control. The additives also appeared to enhance boron longevity in the poles, providing an enhanced protective period in comparison to treatments with rods only.
As a result, supplemental applications in conjunction with boron rods should especially be considered where these formulations are being applied to actively decaying wood where considerable additional damage might occur while the boron diffuses from the rods into the surrounding wood.
This test was last sampled in 2010 and will be revisited in 2015.
4. Performance of Fluoride/Boron Rods in Douglas-fir Poles
Date Established: August 1993
Location: Peavy Arboretum, Corvallis, OR
Pole Species, Treatment, Size Douglas-fir, penta
Circumference @ GL (avg., max., min.) 80, 88, 74 cm

34th Annual Report 2014 ___________________________
Fluoride/boron rods are used in Australia for remedial treatment of internal decay in Eucalyptus poles. Although not labeled for wood treatment in the U.S, these rods have potential for use in this country. The rods contain 24.3% sodium fluoride and 58.2% sodium octaborate tetrahydrate (Preschem, Ltd). The rods have a chalk-like appearance. In theory, the fluoride/boron mixture should take advantage of the properties of both chemicals which have relatively low toxicity and can move with moisture through the wood.
Penta treated Douglas-fir poles (235-275 mm in diameter by 3.6 m long) were set to a depth of 0.6 m and a series of three steeply sloping holes were drilled into each pole, beginning at groundline and moving upward 150 mm and around the pole 90 or 120 degrees. A total of 70.5 or 141 g of boron/fluoride rod (3 or 6 rods per pole) were equally distributed among the three holes plugged with tight fitting wooden dowels. Each treatment was replicated on five poles.
Chemical movement has been assessed 1, 2, 3, 5, 7, 10, 12 and 15 years after treatment. The test was discontinued in 2008, but it showed that the boron moved well from these rods, while the fluoride movement was more variable. This likely reflected the lower levels of fluoride in the system. The results suggested that higher dosages of fluoride would be needed to produce toxic levels in the poles.
5. Performance of Sodium Fluoride Rods as Internal Treatments in Douglas-fir Poles
Date Established: May 1995
Location: Peavy Arboretum, Corvallis, OR
Pole Species, Treatment, Size Douglas-fir, penta
Circumference @ GL (avg., max., min.) 97, 97, 81 cm
Fluoride has a long history of use as a water diffusible wood preservative and was long an important component in Fluor-Chrome-Arsenic-Phenol as well as in many external preservative pastes (Becker, 1976). Like boron, fluoride has the ability to move with moisture, but a number of studies have suggested it tends to remain at low levels in wood even under elevated leaching conditions. Fluoride has also long been used in rod form for protecting the areas under tie plates on railway sleepers (ties) from decay. These rods may also have some application for internal decay control in poles.
Fifteen penta treated Douglas-fir pole sections (259-307 mm in diameter by 2.4 m long) were set in the ground to a depth of 0.6 m at the Peavy Arboretum test site. Three 19 mm diameter by 200 mm long holes were drilled beginning at groundline and moving

Oregon State University Utility Pole Research Cooperative _________________________________________________________
17
around the pole 120 degrees and upward 150 mm. Each hole received either one or two sodium fluoride rods. The holes were then plugged with tight fitting wooden dowels. Eight poles were treated with one rod per hole and seven poles were treated with two rods per hole. After three years, five of the poles were destructively sampled. The remaining five poles from each treatment will be sampled in subsequent years. This test was last sampled in 2010 and will be revisited in 2015.
6. Potential for Boron Movement from Poles
Fused boron rods have a long history of successful usage, first in Europe and later in North America for arresting internal decay in windows, timbers and utility poles (Dickinson et al., 1988; Dietz and Schmidt, 1988; Dirol, 1988; Ruddick and Kundzewicz, 1992). Boron has exceptional activity against insects and is also effective against most conventional wood decay fungi. Boron rods are attractive for these applications because they introduce a highly concentrated rod of boron directly inside the wood where the decay is presumably occurring. A variety of field trials have shown that subsequent boron diffusion from the rods and into the surrounding wood is primarily a function of wood moisture content, although wood permeability can also affect the rate of movement (Morrell et al., 1990; 1992). Field trials have shown that protective levels of boron remain in Douglas-fir poles up to 15 years after rod application.
While boron rods have excellent potential for remedial treatment of utility poles and large timbers where wood moisture levels are suitable for adequate diffusion, the ability of boron to diffuse with moisture means that it can also diffuse out of the wood and into the surrounding environment (Smith and Williams, 1967). While the overall levels of boron applied to poles are relatively small and boron is a naturally occurring element, there is general concern over uncontrolled releases of any pesticide into the environment. As a result, it is important to begin to quantify the potential for movement of boron from fused boron rods in poles into the surrounding environment.
In this report, we evaluate boron levels in Douglas-fir poles treated with fused boron rods as well as the soil surrounding these poles to determine potential boron migration.
Pole Installation: The poles were installed at a site located near Corvallis, Oregon that receives approximately 1,100 mm of rainfall per year. The climate is Mediterranean with warm dry summers and cool, wet winters. The site has a Scheffer climate index of approximately 45 (Scheffer, 1971) and Olympic silty-clay loam soil. The top 200 mm is slightly acidic (pH 5.4) and has approximately 12 mm of humus. Organic matter and nitrogen content are 4.71% and 0.14% respectively. Brush on the site is controlled through regular mowing coupled with periodic glyphosate application (Monsanto Chemical Co, St. Louis, MO).

34th Annual Report 2014 ___________________________
Penta treated Douglas-fir pole stubs (280-300 mm in diameter by 2.1 m long) were set to a depth of 0.6 m. Three steeply sloping treatment holes (19 mm x 350 mm long) were drilled into the poles beginning at groundline and moving upward 150 mm and around the pole 120 degrees. The boron rods were added to the holes at a total dosage of 238 g (345 g BAE basis) per pole. The holes were plugged with plastic plugs.
Boron Analysis: Chemical movement in the poles was assessed 18, 30, 42, and 54 months after treatment by removing increment cores from three equidistant sites beginning 150 mm below ground, then 0, 300, 450, and 600 mm above groundline. The outer, preservative-treated shell was removed, and then the outer and inner 25 mm of each core was retained for chemical analysis. The core segments from a given height on a pole were ground to pass a 30 mesh screen and the resulting dust was extracted in hot water. The resulting extract was analyzed using the azomethine H/carminic acid method (AWPA, 2012). Boron content was expressed on a kg/m3 of boron on a BAE basis. The data were used to develop boron distribution maps at various locations in the pole. The amount of boron present in the wood and the surrounding soil were then estimated on a wt/wt basis based upon the original dosage (345 g on a bae basis) and assumed densities of 448 kg/m3 for the wood and either 1620 or 2160 kg/m3 for the soil using several scenarios:
1. All boron remained in the pole within a zone extending 300 mm above groundline to the butt
2. Boron diffused to a steady state within the wood and into the soil for a distance of approximately 150 mm around the pole
3. Boron diffused to a steady state within the wood and into the soil for a distance of 300 mm around the pole
These approaches are predicated on the premise that boron diffused at a steady rate from the treatment hole, into the wood and finally the surrounding soil. It was also assumed that boron will diffuse into the soil at the same rate without interacting with soil components. We also recognize the potential for boron to interact with soil elements or for it to diffuse through soil at a much more rapid rate than it might in wood.
Soil Analysis: Boron levels in soils were assessed 58 months after treatment by collecting soil from immediately adjacent to the poles, as well as 150 and 300 mm away. Additional soil samples were taken from a site immediately adjacent to, but uphill from the poles to provide insights into background levels at the site. Soils were air-dried, then sieved through a 20 mesh screen to remove rocks and other materials. The soils were acid digested and the resulting extract was analyzed for boron by Ion-Coupled Plasma Spectroscopy (Anonymous, 1989; Gaviak et al., 1994). The results from soils around the poles were compared with those for soil removed uphill from the test where no

Oregon State University Utility Pole Research Cooperative _________________________________________________________
19
boron had been used. These results were compared with those predicted using the three scenarios for boron distribution outlined above.
The threshold for boron for protection against internal decay has been calculated at 0.5 kg/m3. This value is based upon carefully controlled trials of wafers treated to specific levels with boron (Freitag and Morrell, 2005). The boron levels in poles receiving boron rods tended to be below the threshold 300 or more mm above the groundline, regardless of sampling time or core position (inner/outer) (Table I-4, Figure I-1). While boron is water diffusible, it has only a limited ability to diffuse upward. Boron levels 150 mm below groundline and at groundline were above the threshold in the inner zone 18 months after treatment, but below the threshold in the outer zone. The difference reflects the tendency of the sloping treatment holes to direct chemical downward toward the center of the pole. Boron levels were above the threshold for both the inner and outer zones 30 months after treatment, but still below threshold in the outer zone 150 mm below groundline. Boron levels were all well above threshold both below and at groundline 42 and 54 months after treatment. These results are consistent with previous tests showing that uniform movement of boron requires several years (Freitag et al., 2000; Morrell et al., 1990, 1992; Morrell and Schneider, 1995). If these trends continue, we would expect to find elevated boron levels in the poles for 5 to 7 more years. The overall trends indicate that the boron based systems are producing protective levels within the groundline zone, but diffusion above this zone is very limited.
Table I-4. Boron concentrations in Douglas-fir poles 18 to 54 months after application of boron rods
Months after Treatment
Boron Content (kg/m3 BAE) -150 mm Groundline 300 mm above
Avg. Inner Outer Inner Outer Inner Outer 18 2.59 (1.44) 0.37 (0.35) 7.68 (10.11) 0.16 (0.20) 0.02 90.03) 0.97 (2.17) 4.61 30 6.67 (8.01) 0.39 (0.40) 1.30 (0.47) 2.14 (3.60) 0.16 (0.13) 0.15 (0.14) 1.80 42 5.49 (5.77) 0.98 (0.88) 6.30 (7.76) 3.09 (3.91) 0.53 (0.74) 0.72 (1.25) 2.85 54 3.34 (2.06) 1.12 (1.42) 3.57 (2.76) 0.84 (0.46) 0.47 (0.87) 0.13 (0.18) 1.58
One way to approach the potential for boron movement from the wood and into the surrounding soil is to determine a mass balance. This approach is not without risk of error since it assumes that boron will move from the rods and into the wood, through the oil treated shell and into the surrounding soils at a uniform rate, but it also represents the simplest approach to determine how much boron might be present in a given area.
For this purpose, we considered the volume of the wood in the treated zone, which we considered to be 300 mm above the groundline to the butt of the pole or approximately 950 mm. We considered the possibility that small amounts of boron might be wicked upward by adding 50 mm to the upper zone. The total volume of this area for the poles in question would be 0.0636 m3. Since the total amount of boron applied was 0.345 kg

34th Annual Report 2014 ___________________________
in the treated zone, the average boron distribution, assuming that no boron migrated from the wood would be 5.42 kg boron/m3 of wood (on a BAE basis). This would be approximately 1.68% BAE (wt/wt basis) which represents about 3 times the threshold of 0.5% bae (wt/wt) (Williams and Amburgey, 1987). Average boron levels detected in the poles between 18 and 54 months ranged from 1.58 to 4.61 kg/m3 with the highest level detected 18 months after treatment. Boron levels varied between 1.58 and 2.85 kg/m3 over the next 36 months. The highest levels were detected 150 mm below the groundline toward the pole centers, reflecting the tendency of the application pattern to direct boron in this direction. Levels in individual samples removed from the same location but on different poles varied widely, as evidenced by high standard deviations. This is typical of field trials of this nature and reflects the variability of the wood coupled with the relatively small wood sample analyzed. The results indicate that boron levels remain below those that would develop through uniform diffusion. The results suggest that using an averaging approach to determine distribution may not be suitable. Another problem with the current approach is our limited sampling zone. Boron should move downward in poles, but our sampling was limited to the zone 150 mm below the groundline and ignored the zone below that level. We plan to remove selected boron rod-treated poles to sample this deeper zone to determine if boron levels are correspondingly higher as a result of downward migration. The other short-coming of averaging boron distribution is the lack of data on boron content of the treated zone. In our tests, we routinely remove the treated zone and analyze the remaining untreated wood. This approach is taken because boron is primarily intended as a remedial treatment for the non-treated heartwood. Boron content of the treated zone is largely ignored in our tests as well as in previous studies. We plan additional trials to determine the ability of boron to diffuse through an oil treated shell.
Background levels of boron at the test site ranged from 0.6 to 0.8 ppm (Table I-5). Analysis of soil immediately adjacent to the poles as well as 150 mm away produced results that were similar to those found in control soil samples removed up-gradient from the test site. If boron had moved uniformly into the soil, concentrations would have approached 2000 ppm within 150 mm of the pole. Clearly, this did not occur. While this does not necessarily mean that boron is not migrating from the poles, it is clearly not migrating at levels that would alter the concentrations surrounding the pole. One possible explanation is that the boron is migrating so quickly into the surrounding soil that it is not detectable; however, that seems less likely, given the lack of noticeable difference in boron level immediately adjacent to the pole. Boron may also be retained more closely by the preservative treated shell and this possibility is supported by the exceptional length of time that boron can be found in Douglas-fir heartwood after rod application. The widely spaced distribution of poles that could be treated with boron rods also reduces the risk of developing elevated boron levels in any given soil. The results; however, also suggest the need for a more detailed examination of boron

Oregon State University Utility Pole Research Cooperative _________________________________________________________
21
diffusion from rods into poles and the surrounding soil given the inability to account for all of the material applied.
Table I-5. Boron content in soil samples removed immediately adjacent to or 150 mm away from penta-treated Douglas-fir poles 60 months after internal application of boron rods.
Pole # Boron Content (ppm)a
Adjacent to pole 150 mm from pole Pole 408 0.6 0.5 Pole 415 0.6 0.6 Pole 428 0.6 0.5 Pole 448 0.9 0.7 Pole 454 0.7 0.6
aBoron content up-gradient ranged from 0.6 to 0.8 ppm (as elemental Boron)
Figure I-1. Boron levels in Douglas-fir poles 18 to 54 months after application of fused boron rods where dark blue indicates levels below the threshold for fungal attack and trends towards red indicate increasing boron levels.
Analysis of boron levels in poles 18 to 54 months after boron rod application illustrated the difficulty of predicting distribution; however, the lack of increase in boron concentration in the soil suggests that the boron is not migrating from the wood at high levels. The limited data on boron levels in the surrounding soil led us to suspect that boron had primarily moved downward into the pole. We normally do not sample more than 150 mm below the groundline because of the logistics of digging, however, we removed two poles treated with Impel rods to explore boron levels further down the pole. The poles were removed from the ground and increment cores were taken at groundline as well as 150 and 300 mm below groundline. The cores were divided into thirds and then ground and analyzed as previously described. Boron levels at groundline were above the threshold in the middle and inner zones in one pole but not

34th Annual Report 2014 ___________________________
the other. Boron levels 150 and 300 mm below ground were all below the threshold (Table I-6). Boron distribution maps of the two poles samples clearly show the differences in distribution; however, they also show that very little boron is present below the groundline (Figure I-2). The field site tends to be very wet during the winter months and presents an excellent environment for boron diffusion from the wood. Our results suggest that boron moving from the poles is lost fairly rapidly into the surrounding soils and does not build up to levels that would be of concern, even immediately adjacent to the pole.
Table I-6. Boron levels at or below the groundline in Douglas-fir poles 60 months after application of fused boron rods.
Pole # Boron Content (kg/m3 BAE)
Groundline ‒150 mm ‒300 mm Outer Middle Inner Outer Middle Inner Outer Middle Inner
408 0.42 2.28 3.16 0.13 0.26 0.45 0.05 0.10 0.13 428 0.20 0.28 0.33 0.14 0.20 0.33 0.08 0.10 0.16
Figure I-2. Boron levels at or below the groundline in two Douglas-fir poles 60 months after application of fused boron rods (kg/m3).
7. Thresholds for Boron and Copper in Internal Treatments
Copper and boron are the two most common components in a variety of wood preservatives. Boron diffuses with moisture from the point of application and either inhibits or kills decay fungi established in wood. Copper components are believed to move inward a short distance from the surface and provide a barrier against renewed
408
-150 -100 -50 0 50 100 150-300
-250
-200
-150
-100
-50
0
0.0 0.4 0.8 1.2 1.6 2.0 2.4
428
-150 -100 -50 0 50 100 150-300
-250
-200
-150
-100
-50
0
Dis
tanc
e fr
om g
roun
dlin
e (m
m)
Distance from pith (mm)

Oregon State University Utility Pole Research Cooperative _________________________________________________________
23
fungal attack. Copper and boron are used together in a number of external preservative pastes as well as at least one internal treatment. Over the years, there have been claims that copper and boron act synergistically to produce more effective protection than might be found with either compound alone. Many preservative systems incorporate multiple components, often with different modes of action, to overcome the diverse array of decay agents present in the soil.
For many years we have reported results of our external and internal remedial treatment tests using the thresholds for individual components acting alone due to the lack of data supporting claims of synergy. This past year we explored the potential interactions between boron and water-soluble copper in Douglas-fir using procedures previously employed to establish thresholds for boron and fluoride as remedial treatments.
Douglas-fir sapwood wafers (10 x 12 x 30 mm long) were cut from defect free lumber that had been collected directly from a mill without receiving any fungicidal treatment and kiln dried prior to use. A hole was drilled in the center of one wide face of each wafer (0.5 mm diameter by 3 mm deep), then the wafers were oven dried at 60° C before being allocated to treatment groups, each with 30 wafers (10 not exposed to fungi and 20 exposed to fungi).
The wafers were placed in beakers containing the appropriate treatment solution and a vacuum was drawn for 20 minutes (21 in Hg). Pressure was increased and held for 1 hour. The pressure was released, the wafers were removed, wiped clean, and weighed. The difference between initial and post treatment weight was used to calculate net retention. Three wafers were removed from each treatment group and oven-dried (60° C) for later analysis. The remaining wafers were placed in plastic bags and stored at 5° C until needed. These procedures were used to prepare blocks containing 0.15, 0.30, 0.45, or 0.6 kg/m³ BAE alone (using disodium octaborate tetrahydrate) or in combination with 0.05, 0.15, 0.30, or 0.45 kg/m³ of copper as copper sulfate (Table I-7).
Cultures of Gloeophyllum trabeum (Isolate Mad 617) and Postia placenta (Isolate Mad 698) were grown on 1.5% malt extract in liquid culture until abundant mycelia were present, then the mycelium were collected by filtration through cheesecloth and rinsed with sterile, distilled water to remove as much malt extract as possible. The washed mycelium were resuspended in sterile distilled water and briefly macerated in a blender to fragment the hyphae. This suspension was used to inoculate the Douglas-fir wafers. Both fungi cause brown rot decay. Gloeophyllum trabeum was selected because it is a common aboveground wood decay fungus and has some tolerance to boron (Williams and Amburgey, 1987). Postia placenta is a well-known copper tolerant fungus.
The test wafers were warmed to room temperature and then sterilized by exposure to 2.5 mrads of ionizing radiation from a cobalt 60 source. The wafers were placed (hole

34th Annual Report 2014 ___________________________
side up) on plastic mesh atop 3 layers of moistened filter paper in glass petri dishes. One hundred µl of fungal mycelium of a given species was added to the hole drilled in each wafer. The petri plates were sealed with wax film to retard drying and then incubated in the dark at 28° C for 75 or 127 days (Figure I-3). These time points were selected by assessments of weight losses of non-chemically treated controls established by using the same procedure.
Figure I-3. Example of treated wafers cut in half to show the fungal inoculum hole and a petri plate containing wafers used to evaluate interactions between boron and copper against decay fungi. At every time-point, 10 wafers were removed from each treatment/fungal combination, weighed to determine final moisture content, and oven dried (60° C) before being weighed to determine fungal associated mass loss. Similar samples not inoculated with either fungus were sampled after 127 days to assess the potential for non-fungal associated weight loss. Each boron/copper treatment combination was assessed on 10 wafer/fungus/time points, while non-fungal controls were assessed on 7 wafers per treatment, all sampled at 127 days.
Wafers for chemical analysis were ground to pass a 20 mesh screen. The ground wood was analyzed for Cu by x-ray fluorescence spectroscopy using a Spectro-Titan x-ray fluorescence analyzer. DOT treated samples were extracted in hot water for 45 minutes and the resulting extract was analyzed for boron using the azomethine H method.

Oregon State University Utility Pole Research Cooperative _________________________________________________________
25
Table I-7. Retentions of copper and boron (kg/m3). Target Cu Actual Cu Target B Actual B
0.00 0.00 0.00 0.04 0.05 0.09 0.00 0.04 0.15 0.21 0.00 0.03 0.30 0.36 0.00 0.02 0.45 0.45 0.00 0.02 0.00 0.00 0.15 0.23 0.05 0.08 0.15 0.24 0.15 0.23 0.15 0.27 0.30 0.35 0.15 0.25 0.45 0.48 0.15 0.23 0.00 0.00 0.30 0.79 0.05 0.08 0.30 0.42 0.15 0.21 0.30 0.43 0.30 0.37 0.30 0.42 0.45 0.51 0.30 0.40 0.00 0.00 0.45 0.88 0.05 0.03 0.45 0.59 0.15 0.18 0.45 0.52 0.30 0.31 0.45 0.55 0.45 0.41 0.45 0.48 0.00 0.02 0.60 0.85 0.05 0.01 0.60 0.98 0.15 0.15 0.60 0.91 0.30 0.29 0.60 0.87 0.45 0.36 0.60 0.76
Weight losses for non-fungal inoculated controls ranged from -1.2 to 3.8% over the 127 day exposure (Table I-8). Weight gains tended to occur in samples treated with the lowest boron concentration. Weight losses in other treatments suggest that the methodology allowed for some migration of chemical from the blocks.
Weight losses for non-treated control wafers were 20.2 and 14.4% after 75 days of exposure to P. placenta and G. trabeum, respectively (Table I-8). Losses increased to 33.3 and 19.7% for the same fungi after 52 additional days. While mass losses were lower than might be found in more aggressive decay tests such as the AWPA standard E10 soil block test, it is important to note that the AWPA test exposes blocks to fully established fungal mycelium growing on non-durable wood on soil. Our method exposed fragments of mycelium in a hole drilled into blocks. These conditions are similar to non-treated wood exposed in a check. Weight losses indicate that both fungi were capable of considerable wood damage under less than ideal conditions.

34th Annual Report 2014 ___________________________
-5
0
5
10
15
20
25
30
0 0.1 0.2 0.3 0.4 0.5 0.6
Wei
ght l
oss (
%)
Target retention (Kg/m3 BAE)
75 days
00.050.150.30.45
Target retention
(Kg/m3 Cu)
(a)
0
5
10
15
20
25
30
-0.05 0.05 0.15 0.25 0.35 0.45
Wei
ght l
oss (
%)
Target retention (Kg/m3 Cu)
75 days
00.150.30.450.6
Target retention
(Kg/m3 BAE)
(b)
Oregon State University Utility Pole Research Cooperative _________________________________________________________
27
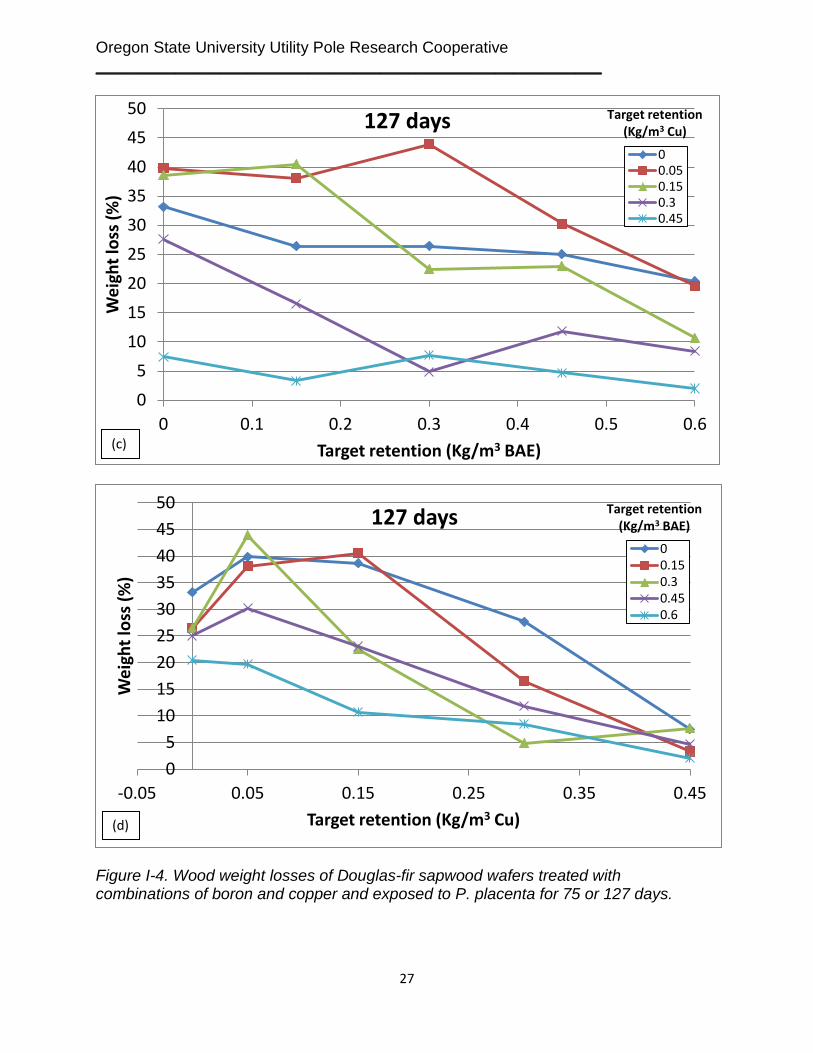
Figure I-4. Wood weight losses of Douglas-fir sapwood wafers treated with combinations of boron and copper and exposed to P. placenta for 75 or 127 days.
05
101520253035404550
0 0.1 0.2 0.3 0.4 0.5 0.6
Wei
ght l
oss (
%)
Target retention (Kg/m3 BAE)
127 days 00.050.150.30.45
Target retention (Kg/m3 Cu)
(c)
05
101520253035404550
-0.05 0.05 0.15 0.25 0.35 0.45
Wei
ght l
oss (
%)
Target retention (Kg/m3 Cu)
127 days 00.150.30.450.6
Target retention (Kg/m3 BAE)
(d)

34th Annual Report 2014 ___________________________
0
2
4
6
8
10
12
14
16
18
20
0 0.1 0.2 0.3 0.4 0.5 0.6
Wei
ght l
oss (
%)
Target retention (Kg/m3 BAE)
75 days 00.050.150.30.45
Target retention (Kg/m3 Cu)
(a)
0
2
4
6
8
10
12
14
16
18
20
0 0.1 0.2 0.3 0.4
Wei
ght l
oss (
%)
Target retention (Kg/m3 Cu)
75 days 00.150.30.450.6
Target retention (Kg/m3 BAE)
(b)

Oregon State University Utility Pole Research Cooperative _________________________________________________________
29
Figure I-5. Wood weight losses of Douglas-fir sapwood wafers treated with combinations of boron and copper and exposed to G. trabeum for 75 or 127 days.
0
5
10
15
20
25
30
0 0.1 0.2 0.3 0.4 0.5 0.6
Wei
ght l
oss (
%)
Target retention (Kg/m3 BAE)
127 days 00.050.150.30.45
Target retention (Kg/m3 Cu)
(c)
0
5
10
15
20
25
30
0 0.1 0.2 0.3 0.4
Wei
ght l
oss (
%)
Target retention (Kg/m3 Cu)
127 days
00.150.30.450.6
Target retention
(Kg/m3 BAE)
(d)

34th Annual Report 2014 ___________________________
Table I-8. Wood weight losses of Douglas-fir wafers treated with combinations of boron and copper prior to exposure to G. trabeum or P. placenta for 75 or 127 days in an aboveground decay test.
Fungus Time
(days)
Cu Conc. (%)
Mass Loss (%)a
B 0.00 kg/m3 B 0.15 kg/m3 B 0.30 kg/m3 B 0.45 kg/m3 B 0.60 kg/m3
G. trabeum
75
0 14.4 11.9 7.8 6.6 3.5 0.05 15.1 17.7 16.8 11.8 6.1 0.15 1.4 5.6 4.0 5.5 4.2 0.30 -0.2 3.8 2.7 2.0 1.3 0.45 -0.1 3.2 2.5 1.9 1.4
127
0 19.7 17.6 10.4 12.7 9.8 0.05 23.8 26.4 20.6 15.3 8.4 0.15 7.7 14.3 8.6 11.1 11.9 0.30 -0.8 3.8 2.6 2.5 1.6 0.45 -0.9 2.8 3.2 2.4 1.9
P. placenta
75
0 20.2 21.5 16.5 19.0 10.9 0.05 26.1 21.4 20.8 21.9 10.2 0.15 22.0 17.2 19.1 19.5 4.3 0.30 8.3 3.3 15.1 3.3 2.6 0.45 -0.1 3.2 2.8 5.4 2.0
127
0 33.2 26.4 26.4 25.0 20.4 0.05 39.8 38.1 43.9 30.2 19.6 0.15 38.6 40.5 22.5 23.0 10.7 0.30 27.6 16.5 4.8 11.9 8.4 0.45 7.5 3.3 7.7 4.7 2.0
aValues represent means of 10 replicates per fungus/treatment/time point. Small amounts of copper added to the blocks was associated with increased weight loss, particularly with P. placenta after 127 days (Figure I-4). The potential for low levels of toxicants to stimulate fungal activity and the occurrence of this phenomena with P. placenta is consistent with its well-known copper tolerance. Increasing copper levels further was associated with decreased weight loss although average weight losses of 7.5% were found with P. placenta. G. trabeum tended to be much more sensitive to copper and failed to produce substantial weight losses on blocks treated to retentions of 0.30 or 0.45 kg/m³.
Adding low levels of boron to blocks was not associated with increased mass loss suggesting that boron had no stimulatory effect on fungal growth at the levels evaluated. Mass losses were higher with P. placenta and there was no evidence of complete protection against fungal attack at the highest concentration tested (0.6 kg/m³ BAE).
Adding low levels of copper (0.05 kg/m³) to boron treated wood was associated with increased weight losses in wafers treated to 0.15, 0.30, or 0.45 kg/m³ BAE of DOT, although the effect was minimal at 0.45 kg/m³ for both test fungi. This stimulatory effect was also present for the 0.15 kg/m³ copper/boron series for P. placenta but not G. trabeum. Increases in copper to 0.45 kg/m³ resulted in reduced mass losses for both fungi with G. trabeum weight losses largely ceasing at 0.30 kg/m³ (Figure I-5). Postia placenta was completely controlled with the highest level of both components applied.

Oregon State University Utility Pole Research Cooperative _________________________________________________________
31
It is important to note that all of the chemical levels evaluated are extremely low, but are within the range found in wood treated with copper/boron formulations. Results show relatively low levels of copper and boron can inhibit fungal attack out of direct soil contact, but there is no evidence of synergy and some suggestion that low levels of copper might be stimulatory. These results must be viewed with caution given the tests artificial nature, but suggests little interaction between copper and boron in these systems.
C. Tests Including Both Fumigants and Diffusibles.
1. Full Scale Field Trial of All Internal Remedial Treatments
Date Established: March 2008
Location: Peavy Arboretum, Corvallis, OR
Pole Species, Treatment, Size Douglas-fir, penta
Circumference @ GL (avg., max., min.) 102, 117, 86 cm
Over the past three decades, we have established numerous field trials to assess the efficacy of internal remedial treatments. These tests were primarily designed to assess liquid fumigants. Over time we have established a variety of tests for solid fumigants and water diffusible pastes and rods. The methodologies in these tests have often varied in terms of treatment and sampling patterns employed to assess chemical movement. While varying methodologies may seem minor, they can make it difficult to compare data from different trials. We addressed this issue by establishing a single large scale test of all EPA registered internal remedial treatments at our Peavy Arboretum test site, Corvallis OR.
Penta treated Douglas-fir pole stubs (280-300 mm in diameter by 2.1 m long) were set to a depth of 0.6 m. Three (for poles treated with diffusible rods) and four (for poles treated with fumigants) steeply sloping treatment holes (19 mm x 350 mm long) were drilled into the poles beginning at groundline and moving upward 150 mm and around the pole 120 degrees. Various remedial treatments were added to the holes at the recommended dosage for a pole of this diameter. Treatment holes were sealed with removable plastic plugs. Copper naphthenate (2% Cu) was added to all dazomet treatments. Accelerant was poured onto the dazomet in the treatment holes until the visible fumigant appeared saturated.
Chemical movement in the poles was assessed 18, 30, 42 and 54 months after treatment by removing increment cores from three equidistant sites beginning 150 mm below ground, then 0, 300, 450 and 600 mm above groundline. An additional height of 900 mm above groundline was sampled for the fumigant treated poles. The outer,

34th Annual Report 2014 ___________________________
preservative-treated shell was removed, and the outer and inner 25 mm was retained for chemical analysis using a method appropriate for each treatment. The fumigants were analyzed by gas chromatography. Chloropicrin was detected using an electron capture detector while the MITC based systems were analyzed using a flame-photometric detector. The remainder of each core was plated on malt extract agar and observed for fungal growth. Boron based systems were analyzed using the Azomethine-H method; while fluoride based systems were analyzed using neutron activation analysis. These poles were not sampled in 2014; they will be assessed in 2016.
2. Performance of Internal Remedial Treatments in Arid Climates: Rocky Mountain Power Test
Date Established: August 2010
Location: Utah
Pole Species, Treatment, Size Pine, cedar, Douglas-fir, penta, creo, cellon
Circumference @ GL (avg., max., min.) 87, 107, 71 cm
Internal remedial treatments are widely used to arrest internal fungal decay in poles. These treatments have proven to be highly effective, rapidly eliminating fungi and protecting against reinvasion for periods ranging from 7 to 10 or more years. While these treatments are highly effective, nearly all of the testing has been performed in wet temperate climates with little data on the efficacy of these treatments under the drier conditions common to most of the western United States. While decay risk is also lower in these locations, the absence of moisture in wood at the time of treatment can result in inadequate release of fungicidal compounds. Moisture can be a critical requirement for decomposition of dazomet to produce MITC and it is essential for diffusion of boron from fused boron rods.
Douglas-fir, western redcedar and lodgepole pine poles located 220 kilometers south of Salt Lake City, Utah were selected for this study (Table I-9). Poles were selected on the basis of accessibility and absence of prior internal treatment. The high desert site receives little rainfall (Salt Lake gets an average of 400 mm of rain and 1400 mm of snow/year). The research area receives 150-200 mm of precipitation, primarily as snow, per year.
Each pole was sounded, then inspection/treatment holes were drilled beginning at groundline adjacent to the largest check and moving around the pole 120 degrees and upward 150 mm. Poles were treated, following label recommendations, with dazomet, dazomet with 1% copper naphthenate (10% w/w), MITC-FUME, metham sodium, fused borate rods (one 75 mm long rod/hole) with water (10% w/w), fused borate rods without water or were left untreated. Treatment holes were sealed with tight fitting plastic plugs.

Oregon State University Utility Pole Research Cooperative _________________________________________________________
33
Table I-9 Characteristics of poles evaluated in the Rocky Mountain Power System OSU Pole
# RMP Pole
# Species Primary Treatment
YI Class Length Treatment
301 196502 L. pine penta 1981 5 40
dazomet
308 193501 L. pine penta 1981 5 35 315 191505 L. pine penta 1981 4 40 322 301701 cedar creosote 1999 4 40 331 303900 Douglas-fir cellon (penta) 1996 5 35 336 197705 cedar penta 1999 4 40 303 195501 L. pine penta 1971 4 35
dazomet + CuNaph
310 193500 L. pine penta 1980 5 35 317 191503 L. pine penta 1983 4 35 324 301702 cedar creosote 1999 5 30 329 301906 Douglas-fir penta 1999 4 30 338 197700 Douglas-fir penta 2008 4 35 306 194501 L. pine penta 1981 5 40
metham sodium
320 191600 L. pine penta 1983 4 40 332 194406 Douglas-fir penta 2000 5 30 334 199406 cedar penta 2005 4 40 341 194901 cedar penta 2002 4 45 307 194508 L. pine penta 1971 5 35
Control 321 197504 L. pine penta 1981 5 40 335 199312 cedar penta 2007 3 40 305 195503 L. pine penta 1984 4 40
MITC-FUME
312 192500 L. pine penta 1981 5 35 319 191500 L. pine penta 1983 5 40 326 301930 Douglas-fir penta 1995 4 35 328 301905 cedar creosote 1999 5 30 340 186200 cedar penta 2006 4 35
The treatments applied were:
Dazomet with accelerant (2% elemental copper)
Dazomet with no accelerant
MITC-FUME
Metham sodium
Fused boron rods with water
Fused Boron rods without water
Non-treated control
Poles were sampled 14 and 26 months after treatment by removing increment cores from three equidistant locations around a pole at heights of 150 mm below groundline, at groundline, as well as 300, 450, 600 and 900 mm above groundline. The treated shell was discarded and the outer and inner 25 mm was removed. Core segments from poles
34th Annual Report 2014 ___________________________
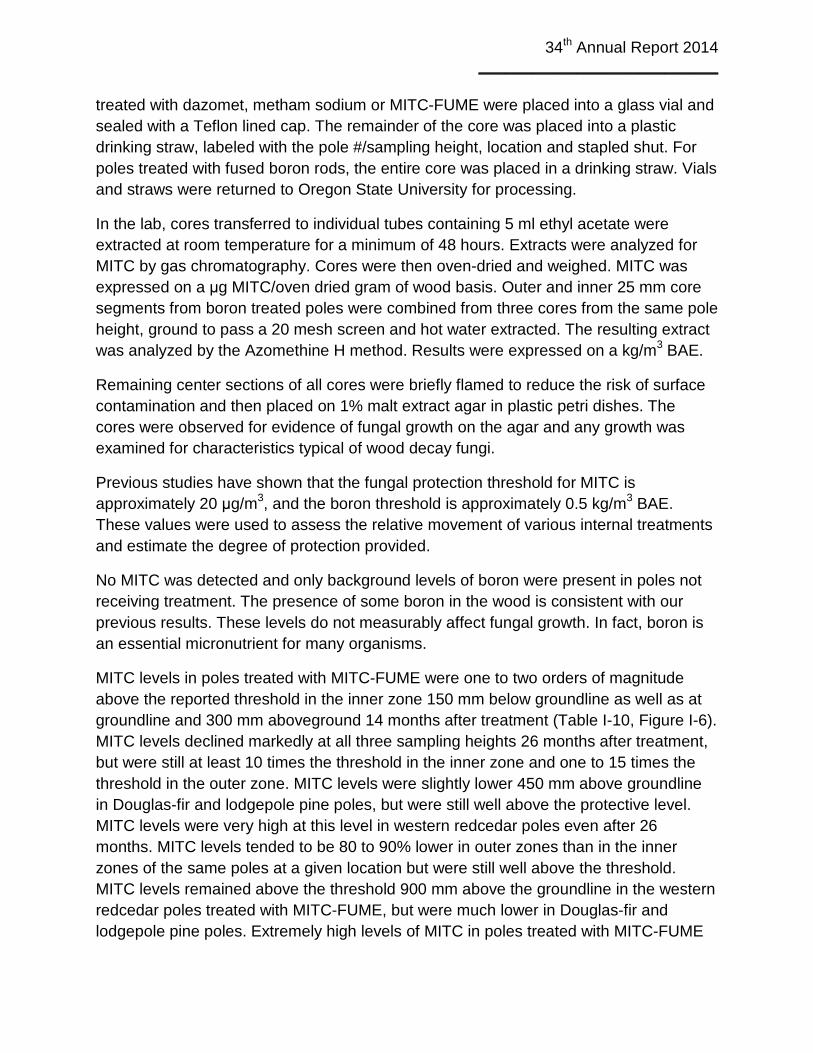
treated with dazomet, metham sodium or MITC-FUME were placed into a glass vial and sealed with a Teflon lined cap. The remainder of the core was placed into a plastic drinking straw, labeled with the pole #/sampling height, location and stapled shut. For poles treated with fused boron rods, the entire core was placed in a drinking straw. Vials and straws were returned to Oregon State University for processing.
In the lab, cores transferred to individual tubes containing 5 ml ethyl acetate were extracted at room temperature for a minimum of 48 hours. Extracts were analyzed for MITC by gas chromatography. Cores were then oven-dried and weighed. MITC was expressed on a μg MITC/oven dried gram of wood basis. Outer and inner 25 mm core segments from boron treated poles were combined from three cores from the same pole height, ground to pass a 20 mesh screen and hot water extracted. The resulting extract was analyzed by the Azomethine H method. Results were expressed on a kg/m3 BAE.
Remaining center sections of all cores were briefly flamed to reduce the risk of surface contamination and then placed on 1% malt extract agar in plastic petri dishes. The cores were observed for evidence of fungal growth on the agar and any growth was examined for characteristics typical of wood decay fungi.
Previous studies have shown that the fungal protection threshold for MITC is approximately 20 μg/m3, and the boron threshold is approximately 0.5 kg/m3 BAE. These values were used to assess the relative movement of various internal treatments and estimate the degree of protection provided.
No MITC was detected and only background levels of boron were present in poles not receiving treatment. The presence of some boron in the wood is consistent with our previous results. These levels do not measurably affect fungal growth. In fact, boron is an essential micronutrient for many organisms.
MITC levels in poles treated with MITC-FUME were one to two orders of magnitude above the reported threshold in the inner zone 150 mm below groundline as well as at groundline and 300 mm aboveground 14 months after treatment (Table I-10, Figure I-6). MITC levels declined markedly at all three sampling heights 26 months after treatment, but were still at least 10 times the threshold in the inner zone and one to 15 times the threshold in the outer zone. MITC levels were slightly lower 450 mm above groundline in Douglas-fir and lodgepole pine poles, but were still well above the protective level. MITC levels were very high at this level in western redcedar poles even after 26 months. MITC levels tended to be 80 to 90% lower in outer zones than in the inner zones of the same poles at a given location but were still well above the threshold. MITC levels remained above the threshold 900 mm above the groundline in the western redcedar poles treated with MITC-FUME, but were much lower in Douglas-fir and lodgepole pine poles. Extremely high levels of MITC in poles treated with MITC-FUME

Oregon State University Utility Pole Research Cooperative _________________________________________________________
35
are consistent with previous studies showing that this chemical rapidly moves at very high levels throughout the wood.
MITC levels in poles treated with metham sodium were 7 to 15 times the threshold in the inner zone of cores removed 150 mm below groundline, a bit lower at groundline and were elevated at 300 or 450 mm above groundline 14 months after treatment (Figure I-7). MITC levels were sharply lower 26 months after treatment at or below groundline, but were above the threshold in the inner zones 300 to 900mm above groundline. MITC levels in the outer zones tended to be much lower than those in the inner zones. These trends are consistent with previous studies and reflect the fact that the treatment was directed toward the pole center. MITC levels tended to be higher in Douglas-fir poles than either western redcedar or lodgepole pine. Metham sodium tends to release high levels of MITC shortly after treatment, then chemical levels decline within 2 to 3 years. Results at 14 and 26 months are consistent with these performance characteristics.
Poles treated with dazomet alone contained extremely low levels of MITC that only exceeded the threshold for fungal protection at a few locations, even below the groundline where moisture levels were expected to be adequate for dazomet decomposition (Figure I-8). The results indicate that conditions were not suitable for dazomet decomposition when no copper accelerant was added.
MITC levels in poles treated with dazomet plus copper naphthenate were higher than those found with dazomet alone 14 months after treatment, but much lower than those found with either metham sodium or MITC-FUME (Figure I-9). MITC levels were above the toxic threshold in the inner zone 150 mm below groundline and at groundline, but not in the outer zone at either level. MITC was detectable further up the pole, but levels were below the threshold. MITC levels increased markedly 26 months after treatment at groundline and below, especially in Douglas-fir poles. The results illustrate the benefits of the copper naphthenate accelerant for improving dazomet decomposition to MITC, but they also indicate that the resulting chemical levels are much lower than levels found in previous studies in wetter locations.
In addition to the substantial differences in MITC levels between the four fumigant treatments, MITC levels in the outer zones were far lower than those in the interior. While an inner/outer gradient is consistent with previous studies showing the tendency of angled treatment holes to direct chemical toward the pole center, the differences observed were far greater than those observed in studies in wetter climates. Reasons

34th Annual Report 2014 ___________________________
14 0 (0) 0 (0) 0 (0) 0 (0) 0 (0) 0 (0) 0 (0) 8 (14) 0 (0) 0 (0) 0 (0) 0 (0)26 0 (0) 0 (0) 0 (0) 0 (0) 0 (0) 0 (0) 0 (0) 0 (0) 0 (0) 0 (0) 0 (0) 0 (0)14 0 (0) 0 (0) 0 (0) 0 (0) 0 (0) 0 (0) 0 (0) 0 (0) 0 (0) 0 (0) 0 (0) 0 (0)26 0 (0) 0 (0) 0 (0) 0 (0) 1 (2) 0 (0) 0 (0) 0 (0) 0 (0) 0 (0) 0 (0) 0 (0)14 10 (12) 1 (3) 16 (25) 3 (8) 9 (17) 0 (0) 5 (7) 3 (4) 3 (5) 1 (3) 2 (4) 0 (0)26 10 (16) 2 (5) 39 (72) 2 (4) 7 (11) 2 (5) 25 (57) 2 (6) 5 (6) 0 0 1 (4) 0 (0)14 0 (0) 0 (0) 0 (0) 0 (0) 0 (0) 0 (0) 0 (0) 0 (0) 0 (0) 0 (0) 0 (0) 0 (0)26 0 (0) 0 (0) 1 (2) 0 (0) 0 (0) 0 (0) 0 (0) 0 (0) 0 (0) 0 (0) 0 (0) 0 (0)14 0 (0) 0 (0) 0 (0) 0 (0) 0 (0) 0 (0) 2 (5) 0 (0) 5 (10) 20 (59) 1 (3) 0 (0)26 6 (12) 3 (5) 15 (13) 4 (7) 5 (8) 1 (4) 0 0 0 (1) 12 (12) 0 0 27 (64) 4 (9)14 19 (12) 0 (0.0) 33 (14) 0 (0.0) 11 (13) 9 (16) 158 (193) 0 (0) 16 (18) 0 (0) 14 (24) 0 (0)26 341 (559) 0 0 10 (4) 0 0 12 (11) 9 (16) 98 (153) 6 (11) 50 (87) 5 (9) 0 0 0 014 67 (72) 12 (24) 54 (69) 1 (3) 18 (7) 3 (7) 10 (6) 0 (0) 3 (4) 0 (0) 0 (0) 0 (0)26 679 (757) 75 (97) 323 (513) 153 (337) 145 (159) 75 (118) 35 (52) 91 (188) 49 (69) 74 (88) 74 (139) 164 (235)14 17 (17) 7 (21) 31 (27) 0 (0) 2 (3) 2 (6) 0 (0) 0 (0) 0 (0) 1 (4) 0 (0) 0 (0)26 43 (58) 8 (9) 52 (73) 1 (2) 12 (16) 0 0 5 (14) 0 0 0 0 0 0 2 (5) 1 (2)14 155 (215) 15 (12) 64 (34) 29 (21) 148 (18) 48 (44) 239 (127) 34 (36) 121 (79) 22 (25) 34 (30) 9 (15)26 7 (3) 0 0 10 (6) 2 (3) 36 (27) 3 (6) 34 (19) 3 (5) 40 (17) 2 (3) 39 (26) 2 (4)14 290 (355) 37 (5) 124 (54) 76 (50) 96 (82) 88 (137) 497 (306) 5 (8) 187 (154) 4 (7) 19 (14) 0 (0)26 8 (9) 0 (0) 6 (5) 7 (8) 104 (86) 23 (14) 78 (20) 7 (7) 132 (92) 16 (21) 44 (44) 4 (6)14 158 (165) 169 (336) 108 (75) 48 (53) 181 (209) 14 (21) 23 (25) 48 (44) 2 (5) 34 (45) 0 (0) 6 (12)26 5 (8) 0 (0) 44 (40) 3 (4) 105 (155) 4 (6) 35 (34) 2 (5) 26 (51) 12 (21) 11 (28) 3 (7)14 1537 (887) 227 (255) 2954 (3080) 439 (890) 3902 (2648) 527 (594) 3019 (2235) 557 (556) 2083 (1094) 329 (473) 183 (158) 94 (201)26 222 (126) 28 (30) 297 (84) 91 (69) 387 (370) 193 (162) 488 (554) 217 (224) 369 (338) 220 (200) 234 (283) 197 (125)14 3616 (2938) 420 (530) 6911 (2969) 332 (381) 2136 (1589) 178 (304) 462 (783) 67 (62) 96 (137) 3 (6) 0 (0) 0 (0)26 840 (340) 323 (414) 1316 (234) 173 (151) 369 (82) 162 (91) 273 (243) 54 (53) 116 (81) 42 (9) 13 (12) 27 (47)14 1549 (1454) 149 (130) 5647 (7469) 195 (239) 833 (1278) 85 (218) 60 (157) 487 (1371) 0 (0) 8 (17) 1 (2) 0 (0)26 557 (377) 300 (412) 755 (556) 263 (288) 543 (336) 145 (195) 133 (180) 37 (58) 6 (13) 10 (14) 2 (4) 2 (3)
Table I-10. MITC levels at selected distances above or below the groundline in western redcedar, Douglas-fir or lodgepole pines poles 14 or 26 months after application of MICT-FUME, metham sodium or dazomet with or without an accelerant.
TreatmentWood
speciesn
months after
treatment
Height above groundline (mm)-150 0 300 450 600 900
inner outer inner outer inner outer inner outer inner outer inner outer
cedar 1
2
cedar 2
DF 1
3
cedar 1
DF 2
3
pine 3
cedar 2
DF 1
control
dazomet
dazomet + Cu
metham sodium
pine
pine
pine
MITC-FUME
cedar 2
DF 1
pine 3

Oregon State University Utility Pole Research Cooperative _________________________________________________________
37
for these differences are unclear, although they may reflect the presence of much drier wood or the high summer temperatures to which these poles were exposed. Elevated temperatures could increase chemical movement out of the pole. Regardless of the cause, results indicate that dazomet is ineffective without added accelerant and is unlikely to be useful when applied aboveground in these regions.
Boron levels in poles treated with fused boron rods alone tended to be extremely low 14 and 26 months after treatment (Table I-11). Only 3 assays indicated the presence of boron at protective levels and the level in one (6.23 kg/m3 in the inner assay zone at groundline) suggests that the sample came in contact with the original boron rod. The addition of water to treatment holes at the time of application should have improved release to some extent; however, boron levels remained well below the threshold in most poles. Boron requires moisture for movement. These data clearly indicate that pole moisture levels were too low to allow boron movement from rods. If boron based materials are used in poles in drier climates, it will be important to place the chemicals well below the groundline where there is a potential for subsurface moisture to create conditions suitable for boron diffusion to occur. This may require a reconsideration of the treatment pattern used for these systems.
The results indicate MITC movement from MITC-FUME and metham sodium treated poles was not affected by low moisture levels in poles in a dry climate. Dazomet and boron rods were both substantially affected by low pole moisture contents, which suggests the need for changes in how these systems are employed in drier climates. Placement of dazomet in holes above groundline is not advisable in these poles unless there is evidence that external wetting occurs. Further studies are planned to determine if there are other methods for enhancing dazomet decomposition in dry climates.

34th Annual Report 2014 ___________________________
Cedar
-150 -100 -50 0 50 100 150
Hei
ght a
bove
gro
undl
ine
(mm
)
0
200
400
600
800
1000
Doug-fir
Distance from pith (mm)-150 -100 -50 0 50 100 150
0
30 60 90 120 150 180 210 240 270 300
Pine
-150 -100 -50 0 50 100 150
MITC (ug/g oven dry wood)
14 months
Cedar
-150 -100 -50 0 50 100 150
Hei
ght a
bove
gro
undl
ine
(mm
)
0
200
400
600
800
1000
Doug-fir
Distance from pith (mm)-150 -100 -50 0 50 100 150
30 60 90 120 150 180 210 240 270 300
Pine
-150 -100 -50 0 50 100 150
MITC (ug/g oven dry wood)
26 months
Figure I-6. Diagram showing MITC levels about the groundline in poles 14 or 26 months after application of MITC-FUME. Red colors indicate elevated levels above the toxic threshold.

Oregon State University Utility Pole Research Cooperative _________________________________________________________
39
MITC (ug/g oven dry wood)
Cedar
-150 -100 -50 0 50 100 150
Hei
ght a
bove
gro
undl
ine
(mm
)
0
200
400
600
800
1000
30 60 90 120 150 180 210 240 270 300
Doug-fir
Distance from pith (mm)-150 -100 -50 0 50 100 150
Pine
-150 -100 -50 0 50 100 150
14 months
MITC (ug/g oven dry wood)
Cedar
-150 -100 -50 0 50 100 150
Hei
ght a
bove
gro
undl
ine
(mm
)
0
200
400
600
800
1000
0
30 60 90 120 150 180 210 240 270 300
Doug-fir
Distance from pith (mm)-150 -100 -50 0 50 100 150
Pine
-150 -100 -50 0 50 100 150
26 months
Figure I-7. Diagram showing MITC levels about the groundline in poles 14 or 26 months after application of metham sodium. Red colors indicate elevated levels above the toxic threshold.

34th Annual Report 2014 ___________________________
MITC (ug/g oven dry wood)
Cedar
-150 -100 -50 0 50 100 150
Hei
ght a
bove
gro
undl
ine
(mm
)
0
200
400
600
800
1000
0 30 60 90 120 150 180 210 240 270 300
Doug-fir
Distance from pith (mm)-150 -100 -50 0 50 100 150
Pine
-150 -100 -50 0 50 100 150
14 months
MITC (ug/g oven dry wood)
Cedar
-150 -100 -50 0 50 100 150
Hei
ght a
bove
gro
undl
ine
(mm
)
0
200
400
600
800
1000
0 30 60 90 120 150 180 210 240 270 300
Doug-fir
Distance from pith (mm)-150 -100 -50 0 50 100 150
Pine
-150 -100 -50 0 50 100 150
26 months
Figure I-8. Diagram showing MITC levels about the groundline in poles 14 or 26 months after application of dazomet without accelerant. Red colors indicate elevated levels above the toxic threshold.

Oregon State University Utility Pole Research Cooperative _________________________________________________________
41
MITC (ug/g oven dry wood)
Cedar
-150 -100 -50 0 50 100 150
Hei
ght a
bove
gro
undl
ine
(mm
)
0
200
400
600
800
1000
0 30 60 90 120 150 180 210 240 270 300
Doug-fir
Distance from pith (mm)-150 -100 -50 0 50 100 150
Pine
-150 -100 -50 0 50 100 150
14 months
MITC (ug/g oven dry wood)
Cedar
-150 -100 -50 0 50 100 150
Hei
ght a
bove
gro
undl
ine
(mm
)
0
200
400
600
800
1000
0 30 60 90 120 150 180 210 240 270 300
Doug-fir
Distance from pith (mm)-150 -100 -50 0 50 100 150
Pine
-150 -100 -50 0 50 100 150
26 months
Figure I-9. Diagram showing MITC levels about the groundline in poles 14 or 26 months after application of dazomet with copper naphthenate accelerant. Red colors indicate elevated levels above the toxic threshold

34th Annual Report 2014 ___________________________
1426 0.16 0.23 0.18 0.22 0.06 0.04 0.09 0.08 0.09 0.05 0.09 0.3014 0.05 0.03 0.01 0.06 0.02 0.08 0.03 0.05 0.07 0.04 0.05 0.1026 0.19 0.26 0.07 0.36 0.14 0.37 0.14 10.13 0.19 0.61 0.15 1.6414 0.00 0.03 0.00 0.00 0.00 0.00 0.00 0.00 0.00 0.00 0.00 0.002614 0.00 0.01 0.00 0.00 0.00 0.00 0.03 0.02 0.02 0.02 0.00 0.0326 0.12 0.01 0.10 0.55 0.14 0.05 0.03 0.06 0.04 0.14 0.03 0.0314 0.06 (0.06) 0.04 (0.02) 0.01 (0.02) 0.03 (0.00) 0.03 (0.03) 0.04 (0.02) 0.03 (0.00) 0.07 (0.01) 0.00 (0.00) 0.08 (0.01) 0.02 (0.03) 0.07 (0.01)26 0.13 (0.00) 0.63 (0.56) 0.12 (0.05) 0.25 (0.08) 0.06 (0.07) 0.29 (0.10) 0.08 (0.06) 0.20 (0.03) 0.12 (0.02) 0.27 (0.13) 0.10 (0.06) 0.27 (0.02)14 0.01 0.04 0.01 0.00 0.00 0.03 0.00 0.01 0.00 0.03 0.01 0.0226 0.18 0.09 6.23 0.06 0.14 0.09 0.06 0.10 0.08 0.18 0.05 0.0914 0.26 (0.38) 0.02 (0.02) 0.05 (0.01) 0.01 (0.02) 0.06 (0.03) 0.04 (0.04) 0.02 (0.02) 0.02 (0.02) 0.02 (0.02) 0.03 (0.02) 0.03 (0.04) 0.03 (0.02)26 0.16 (0.13) 0.08 (0.05) 0.06 (0.06) 0.20 (0.09) 0.14 (0.07) 0.09 (0.04) 0.08 (0.03) 0.08 (0.06) 0.15 (0.07) 0.07 (0.03) 0.27 (0.34) 0.07 (0.07)14 0.74 (1.00) 0.02 (0.02) 0.05 (0.02) 0.06 (0.01) 0.02 (0.03) 0.29 (0.32) 0.03 (0.02) 0.01 (0.02) 0.03 (0.04) 0.03 (0.03) 0.04 (0.01) 0.05 (0.03)26 0.49 (0.46) 0.40 (0.25) 0.42 (0.37) 0.32 (0.01) 0.19 (0.02) 0.32 (0.04) 0.28 (0.04) 0.38 (0.06) 0.30 (0.17) 0.30 (0.15) 0.17 (0.01) 0.31 (0.19)14 0.06 0.22 0.07 0.00 0.01 0.00 0.06 0.02 0.00 0.00 0.00 0.0026 0.38 0.16 0.08 0.31 0.06 0.16 0.10 0.18 0.13 0.14 0.05 0.1714 0.57 (0.96) 0.02 (0.02) 0.10 (0.02) 0.02 (0.02) 0.01 (0.01) 0.03 (0.03) 0.03 (0.03) 0.01 (0.01) 0.03 (0.06) 0.02 (0.02) 0.02 (0.02) 0.02 (0.03)26 0.31 (0.17) 0.07 (0.05) 0.21 (0.25) 0.12 (0.07) 0.08 (0.09) 0.07 (0.11) 0.12 (0.11) 0.06 (0.00) 0.07 (0.06) 0.09 (0.08) 0.26 (0.24) 0.74 (1.10)
Table I-11. Boron levels at selected distances above or below the groundline of western redcedar, Douglas-fir or lodgepole pine poles 14 or 26 months after application of fused borate rods with or without added water.
2
1
3
MITC-FUME
pine 1
DF
pine
cedar
DFFused
boron rods + water
cedar
DF
pine
cedar
Control
Fused boron rods
pine
3
inner outer inner outer
1
1
1
2
1
-150 0 TreatmentWood
species nHeight above groundline (mm)300
months after
treatment inner outer600 900
inner outer inner outer inner outer450

Oregon State University Utility Pole Research Cooperative _________________________________________________________
43
Literature Cited American Wood Preservers’ Association (AWPA). 2004. Standard A2. Analysis of waterborne preservatives and fire-retardant formulations. Method 16. Determination of boron in treated wood- using Azomethine H or carminic acid. In: AWPA Book of Standard, Selma, Alabama. Pages 241-243. Becker, G. 1976. Treatment of wood by diffusion of salts. International Research Group on Wood Preservation. Documents No. IRG/WP/358. Stockholm, Sweden. Becker, 1973. Fluorine compounds for wood preservation. J. Institute Wood Science 6(2):51-62. Chen, H., R. Rhatigan, and J.J. Morrell. 2003. A rapid method for fluoride analysis of treated wood. Forest Products Journal 53(5):43-45. Cockcroft, R. and J.F.Levy. 1973. Bibliography on the use of boron compounds in the preservation of wood. J. Institute of Wood Science 6(3):28-37. Dickinson, D.J., P.I. Morris, and B. Calver. 1988. The secondary treatment of creosoted electricity poles with fused boron rods. International Research Group on Wood Preservation document No. IRG/WP/3485. Stockholm, Sweden. 3 pages. Dietz, M.G. and E.L. Schmidt. 1988. Fused borate and bifluoride remedial treatments for controlling decay in window millwork. Forest Products Journal 38 (5):9-14. Dirol, D. 1988. Borate diffusion in wood from rods and a liquid product: application to laminated beams. International Research Group on Wood Preservation document No. IRG/WP/3482. Stockholm, Sweden. 11 pages. Edlund, M.L., B. Henningsson, A. Kaarik, and P.-E. Dicker. 1983. A chemical and mycological evaluation of fused borate rods and a boron/glycol solution for remedial treatment of window joinery. International Research Group on Wood Preservation document No. IRG/WP/3225. Stockholm, Sweden. 36 pages. Fahlstrom, G.B. 1964. Threshold values for wood preservatives. Forest Products Journal 14:529-530. Forsyth, P.G. and J.J. Morrell. 1992. The effect of selected additives and conditions on the decomposition of Basamid in Douglas-fir heartwood. International Research Group on Wood Preservation. Document No. IRG/WP/3698-92. Stockholm, Sweden. 11 p. Forsyth, P.G. and J.J. Morrell. 1993. Preliminary field trials using the solid fumigant Basamid amended with selected additives. Forest Products Journal 43(2)41-44.

34th Annual Report 2014 ___________________________
Forsyth, P.G. and J.J. Morrell. 1995. Decomposition of Basamid in Douglas fir heartwood: Laboratory studies of potential wood fumigant. Wood and Fiber Science 27:183-197. Forsyth, P.G., J.J. Morrell and H. Chen. 1998. Rates of MITC release from Basamid applied to Douglas-fir poles. Forest Products Journal 48(2):40-43. Freitag, C. and J.J. Morrell. 2005. Development of threshold values for boron and fluoride in nonsoil contact applications. Forest Products Journal 55(4):97-101. Freitag, C.M., R. Rhatigan and J.J. Morrell. 2000. Effect of glycol additives on diffusion of boron through Douglas-fir. International Research Group on Wood Preservation Document No. IRG/WP/30235. Stockholm, Sweden. 8 pages Gaviak, R.G., D.A. Horneck, and R.O. Miller. 1994. Plant, soil and water reference methods for the Western region. Western States Proficiency testing program soil and plant analytical methods Version 4.00. WREP 125. Pages 120-122. Graham, R.D. 1983. Improving the performance of wood poles. Proceedings American Wood Preservers Association 79:222-228. Jin, Z. and J.J. Morrell. 1997. Effect of mixtures of basamid and metham sodium on production of MITC in Douglas-fir and southern pine. Holzforschung, 51:67-70. Leutritz , J., Jr. and G.Q. Lumsden. 1962. The groundline treatment of standing southern pine poles. Proceedings American Wood Preservers Association 58:79-86. McKern, J.A., A.L. Szalanski, J.W. Austin, M.T. Messenger, J. Mahn, and R.E. Gold. 2007. Phylogeography of termites (Isoptera) from Oregon and Washington. Sociobiology 50:607-622. Mankowski, M.N., E. Hansen, and J.J. Morrell. 2002. Wood pole purchasing, inspection and maintenance: a survey of utility practices. Forest Products Journal 52(11/12):43-50. Morrell, J.J. 1994. Decomposition of metham sodium to methylisothiocyanate as affected by wood species, temperature, and moisture content. Wood and Fiber Science 26:62-69. Morrell, J.J. 1996. Wood Pole Maintenance Manual: A guide to specification, inspection and maintenance. Research Contribution 14, Forest Research Laboratory, Oregon State University, Corvallis, Oregon. Morrell, J.J. and M.E. Corden. 1986. Controlling wood deterioration with fumigant: a review. Forest Products Journal 36(10):26-34.

Oregon State University Utility Pole Research Cooperative _________________________________________________________
45
Morrell, J.J., M.A. Newbill, and C.M. Sexton. 1992. Remedial treatment of Douglas-fir and southern pine poles with methylisothiocyanate. Forest Products Journal 42(10):47-54. Morrell, J.J., C.M. Sexton, and K. Archer. 1992. Diffusion of boron through selected wood species following application of fused borate rods. Forest Products Journal 42(7/8):41-44. Morrell, J.J., C.M. Sexton, and A.F. Preston. 1990. Effect of wood moisture content on diffusion of boron from fused borate rods. Forest Products Journal 40(4):37-40. Morrell, J.J. and P.F. Schneider. 1995. Performance of boron and fluoride based rods as remedial treatments in Douglas-fir poles. International Research Group on Wood Preservation Document No. IRG/WP/95-30070. Stockholm, Sweden. 11 pages. Petanovska-Ilievska, B.R. and L.B. Vodeb. 2002. Determination of dazomet in Basamid granular using reverse phase HPLC. Croatica Chemica Acta 75 (1):225-234. Ruddick, J.N.R. and A.W. Kundzewicz. 1992. The effectiveness of fused borate rods in preventing or eliminating decay in ponderosa pine and Douglas-fir. Forest Products Journal 42(9):42-46. Scheffer, T.C. 1971. A climate index for estimating potential for decay in wood structures aboveground. Forest Products Journal 21(10):25-31. Schneider, P.F., M.A. Newbill, and J.J. Morrell. 1993. Protection of pile tops using combinations of internal treatments and water-shedding caps. Document No. IRG/WP/93-30020. Stockholm, Sweden. 6 p. Smith, D. and A.I. Williams. 1967. Wood preservation by the boron diffusion process- the effect of moisture content on diffusion time. J. Institute of Wood Science 4(6):3-10. Williams, L.T. and T.L.Amburgey. 1987. Integrated protection against Lyctid beetle infestations. IV. Resistance of boron treated wood (Virola spp) to insect and fungal attack. Forest Products Journal 37(2):10-17.

34th Annual Report 2014 ___________________________
OBJECTIVE II
IDENTIFY CHEMICALS FOR PROTECTING EXPOSED WOOD SURFACES IN POLES
Preservative treatment of utility poles prior to installation provides an excellent barrier against fungal, insect, and marine borer attack; however, this barrier remains effective only while intact. Deep checks that form after treatment, field drilling holes for attachments including guy wires and communications equipment, cutting poles to height after setting and heavy handling of poles that result in fractures or shelling between the treated and non-treated zones can all expose non-treated wood to possible biological attack. AWPA standards currently recommend all field damage to treated wood have supplemental protection with solutions of copper naphthenate. While this treatment will never be as good as the initial pressure treatment, it provides a thin barrier that can be effective aboveground. Despite their merits, these recommendations are often ignored by field crews who dislike the liquid nature of the treatment and know it is highly unlikely that anyone will later check to confirm the treatment has been properly applied. In 1980, the Coop initiated a series of trials to assess the efficacy of various treatments for protecting field drilled bolt holes, non-treated western redcedar sapwood and non-treated Douglas-fir timbers above groundline. Many of these trials have been completed and have led to further tests assessing decay levels present in aboveground zones of poles in this region and develop accelerated test methods for assessing chemical efficacy. Despite the length of time this objective has been underway, aboveground decay and its prevention remain problematic for many utilities as they encounter increased restrictions on chemical use. The problem of aboveground decay facilitated by field drilling promises to grow in importance as utilities find a diverse array of entities operating under the energized phases of their poles with cable, telecommunications and other services that require field drilling for attachments. Developing effective, easily applied treatments for damage done as these systems are attached can result in substantial long-term savings and is the primary focus of this objective.
A. Effect of Boron Pretreatment on Performance of Preservative Treated Douglas-fir Poles
Douglas-fir heartwood has a well-deserved reputation for being difficult to impregnate with preservatives. Through-boring, radial drilling and deep incising can all improve treatment, but their application is generally limited to the groundline zone. While this represents the area with the greatest risk of internal decay, fungi can attack non-treated heartwood above this zone. Decay aboveground poses great future risk. Entities are attaching equipment to poles and almost all are field-drilling holes for these attachments. While most specifications require preservative treatment of field damage such as holes, these specifications are routinely ignored. Non-treated field-drilled holes represent access paths into non-treated heartwood. While holes are aboveground

Oregon State University Utility Pole Research Cooperative _________________________________________________________
47
where progression of fungal attack and decay is slower, these eventually become sites for decay. Under Objective II we have examined simple methods for treating holes with boron compounds and evaluated the potential for using preservative-coated bolts. None of these practices have been adopted or have led to changes in practices.
Another approach to reduce decay risk in non-treated heartwood might be to initially treat poles with water diffusible chemicals such as boron or fluoride prior to seasoning and treatment. Diffusible chemicals could move into heartwood as a pole dries and then be over-treated with conventional oil-borne preservatives such as copper naphthenate, penta or creosote.
We explored this possibility in the 1980s to reduce the risk of fungal colonization during air-seasoning, first with ammonium bifluoride (fluoride) and later with disodium octaborate tetrahydrate (DOT). Results with fluoride were initially promising. Poles were flooded with a 20% solution of ammonium bifluoride and exposed at four sites in the Pacific Northwest and California. Fungal colonization was assessed over a three year period by removing increment cores for culturing. Initially, the percentage of cores containing basidiomycetes was low at all sites, but steadily increased at the wetter sites (Table II-1). Results indicated that fluoride could initially limit fungal colonization, but eventually a more weather resistant treatment would be required.
Table II-1. Basidiomycete isolations from Douglas-fir poles sections with or without an ammonium bifluoride treatment after 1 to 3 years of exposure in various locations in the Pacific Northwest (from Morrell et al., 1989).
Seasoning Location
Cores Containing Basidiomycetes (%) Non-Treated Fluoride Treated
1 Yr 2 Yr 3 Yr 1 Yr 2 Yr 3 Yr Arlington,WA 39 74 71 14 38 69 Scappoose,OR 27 56 76 14 36 45 Eugene,OR 36 52 72 12 19 35 Oroville,CA 29 39 37 8 11 12
In a follow up study near Corvallis, OR, Douglas-fir pole sections were either dipped for 3 minutes in a 20% BAE solution of DOT or sprayed at 6 month intervals with a 10% solution of DOT and exposed for 1 to 3 years. Dip treated pole sections contained much lower basidiomycete levels 1 year after treatment than non-treated controls, while isolation levels were similar after 2 years of exposure (Table II-2). Spray treatments followed similar patterns, even when sprays were applied at 6 month intervals. Results indicate that boron and fluoride had potential to inhibit fungal attack, but their protection was limited and needed to be followed by traditional non-diffusible wood preservatives.
The potential for boron as a pre-treatment has also been explored on railroad ties in the southern United States. Extensive studies at Mississippi State University have clearly demonstrated that dip or pressure treatment with boron followed by air seasoning and

34th Annual Report 2014 ___________________________
creosote treatment markedly improved performance of ties; this approach is now widely used by mainline railroads. Boron may also have value as a pre-treatment for utility poles. In order to assess this potential, we have undertaken the following test.
Freshly peeled Douglas-fir pole sections (2.4 m long by 250-300 mm in diameter) were pressure treated with a 7% solution (BAE) of DOT, then six increment cores were removed from two sides near the middle of each pole. Cores were divided into 25 mm segments from surface to pith and combined by depth for each pole. Combined cores were ground to pass a 20 mesh screen before extraction in hot water and boron analysis according to AWPA Standard A2, Method 16. For this purpose, no AWPA retention is specified for borate. The current AWPA Standard for borate pre-treatment of ties specifies 2.7 kg/m3 of boron (as B2O3, equal to 4.9 kg/m3 BAE); however, our data suggests that the threshold of boron for protecting Douglas-fir from internal decay is far lower (0.8 kg/m3). Clearly, a proper treatment level will need to be determined. For the purposes of this discussion the tie level will be used, although it is probably too high.
Five poles not subjected to further treatment were set aside to air-dry. Five of the remaining ten poles were kiln dried to 25% moisture content 50 mm from the surface, and pressure treated with copper naphthenate to the AWPA U1 UC4B target retention of 0.095 pcf (as Cu). The remaining five poles were pressure treated with copper naphthenate to the same retention, but the poles were seasoned in the cylinder using the Boulton process. Following treatment, all poles were returned to OSU, sampled and analyzed for boron content as described above. Eight additional cores were taken from each copper naphthenate-treated pole so the outer 6 to 25 mm could be assayed for copper by x-ray fluorescence spectroscopy.
Boron retentions (as kg/m3 BAE) were highest in the outer 25 mm of each pole, ranging from 4.56 to 15.17 kg/m3 immediately after treatment but before drying (Table II-3). With the exception of one pole, retentions were extremely low in the next 25 mm inward and remained low toward the poles center. These results are typical of any short term pressure treatment of Douglas-fir poles.
If all boron in pole sections immediately after treatment were considered, poles would contain an average of 2.36 kg/m3 BAE, or about half the required level. These values are skewed by one pole that had extremely high boron levels in four of the six assay
Table II-2. Basidiomycete isolations from Douglas-fir poles sections with or without a disodium octaborate tetrahydrate treatment after 1 to 3 years of exposure in various locations in the Pacific Northwest (from Morrell et al., 1991).
Treatment Cores Containing Basidiomycetes (%)
Year 1 Year 2 Year 3 Control 23 59 87 Dip 9 47 30 Sprayed (0/6 mo) 19 43 61

Oregon State University Utility Pole Research Cooperative _________________________________________________________
49
zones. The remaining four poles had much lower boron levels. Chemical was largely confined to the outer 25 mm.
Table II-3. Boron levels in Douglas-fir poles immediately after pressure treatment with disodium octaborate tetrahydrate and prior to drying/treatment.
Pole # Boron Retention (kg/m3)
0-25 mm 25-50 mm 50-75 mm 75-100 mm 100-125 mm 125-150 mm 758 15.17 8.85 0.36 0.30 5.85 7.95 759 10.30 0.21 0.16 0.08 0.73 0.11 760 7.22 0.09 0.12 0.06 0.11 0.02 761 10.29 0.10 0.03 0.03 0.08 0.03 762 7.47 0.11 0.11 0.07 0.09 0.05 763 10.24 0.23 0.06 0.08 0.05 0.08 764 4.56 0.12 0.05 0.04 0.08 0.06 765 7.23 0.11 0.08 0.08 0.08 0.31 766 10.57 0.14 0.07 0.05 0.02 0.03 767 11.66 0.19 0.08 0.00 0.16 0.11 770 8.42 0.15 0.02 0.02 0.00 0.05 786 5.90 0.05 0.00 0.03 0.00 0.05 787 7.16 0.16 0.00 0.07 0.00 0.35 788 14.21 0.24 0.16 0.08 0.07 0.00 789 9.71 0.11 0.04 0.10 0.00 0.03
Average 9.34 0.72 0.09 0.07 0.49 0.61 Standard deviation 2.93 2.25 0.09 0.07 1.49 2.03
After kiln drying, boron levels were elevated in the outer 25 mm of pole sections, but declined sharply inward (Table II-4). Boron levels, if averaged across the entire pole cross section would average 1.02 kg/m3 BAE, far below the specified level. Boron levels in the outer 25 mm were lower after drying in nine of the ten pole sections and, in some cases, the differences were substantial (Table III-5). Some of these reductions may be attributed to differences in sampling locations at different time points as well as to movement of boron into the next 25 mm from the surface, but the levels of loss also suggest that some of the boron was lost from the wood during drying. The results suggest that drying schedules will have to be adjusted to reduce boron loss.
Boron should become more uniformly distributed as it diffuses inward from the surface. Boron levels in poles 2 months after treatment averaged 2.14 kg/m3 BAE, and levels were slightly higher in the 25 to 50 mm zone (Figure II-1). However, boron levels in four of the five poles in this treatment group remained very low 50 mm or further inward. The overall shape of the preservative gradient changed only slightly (Figure II-1). This suggests that the majority of boron remains in the outer pole zones.
Treated poles were set to 0.6 m depth at Peavy Arboretum, Corvallis OR. Five Boulton seasoned and copper naphthenate treated poles and five kiln dried and copper

34th Annual Report 2014 ___________________________
Table II-4. Boron levels in Douglas-fir poles after pressure treatment with disodium octaborate tetrahydrate and drying/treatment.
Boron Retention (kg/m3)
Pole # 0-50 mm 25-50 mm
50-75 mm
75-100 mm
100-125 mm
125-150 mm
759 3.21 0.42 0.01 0.02 0.12 1.80 760 4.22 0.60 0.06 0.00 0.01 0.05 762 6.60 0.14 0.03 0.00 0.00 0.06 763 4.04 0.12 0.01 0.01 0.02 0.03 764 3.37 0.26 0.02 0.03 0.08 0.07 766 3.50 0.07 0.01 0.01 0.00 0.01 767 3.74 0.15 0.08 0.03 0.01 0.02 770 4.30 1.06 0.12 0.06 0.31 0.13 788 14.82 0.63 0.03 0.01 0.00 0.00 789 6.17 0.45 0.04 0.00 0.02 0.02
Average 5.40 0.39 0.04 0.02 0.06 0.22 Standard deviation 3.50 0.31 0.03 0.02 0.10 0.56
naphthenate treated poles were installed. Boron content was assessed one year after treatment by removing increment core pairs from three equidistant points around each pole at groundline and 1.2 m. Coring holes were plugged with tight-fitting wooden dowels. Increment cores were divided into 25 mm segments from the outside towards the center. Core segments from a given height and zone were combined and ground to pass a 20 mesh screen. Ground wood was analyzed for boron as described above.
Table II-5. Differences in boron retentions in the outer 25 mm of poles immediately after treatment and after kiln drying
Pole # Boron Retention (kg/m3) in the outer 25 mm
Pre-Drying Post-Drying Difference 759 10.30 3.21 7.09 760 7.22 4.22 3.00 762 7.47 6.60 0.87 763 10.24 4.04 6.20 764 4.56 3.37 1.19 766 10.57 3.50 7.07 767 11.66 3.74 7.92 770 8.42 4.30 4.12 788 14.21 14.82 -0.61 789 9.71 6.17 3.54
Boron levels in the outer 25 mm of poles one year after treatment had declined in the poles (Figure II-2, Table II-6). The field site receives about 1200 mm of rainfall per year and tends to be extremely wet during the winter. Previous tests have shown that the interior pole moisture content at groundline tends to be above 30% most of the year, but only reach that level above groundline near the end of winter. Elevated moisture contents are expected to help boron diffuse and distribute evenly. Declines suggest that boron is moving out of poles and into surrounding soil. Boron levels in the outer 25 mm of wood 1.2 m above groundline were higher than those at groundline. This suggests

Oregon State University Utility Pole Research Cooperative _________________________________________________________
51
Figure II-1. Boron retentions in 25 mm increments inward from the surface in Douglas-fir poles immediately after pressure treatment with disodium octaborate tetrahydrate and again 2 months later.
that the boron was moving at the same rate out of soil contact. Boron levels were similar or slightly lower in the remaining 25 to 150 mm inward at both heights, suggesting there had been relatively little inward movement after installation. It is important to remember that the initial boron application levels could be increased by using a stronger treatment solution. Pole sections were treated with a process typically used on lumber for the Hawaiian market and solution concentrations might have been somewhat lower than needed. Lack of substantial boron redistribution suggests that other methods may be needed to ensure boron movement beyond the surface to protect the non-treated interior once the pole is placed in service.
We will continue to monitor boron levels in these poles over the next 4 years to determine if chemical redistribution occurs to produce levels that minimized the risk of internal fungal attack.
Figure II-2 Boron content at 25 mm increments from the surface of Douglas-fir poles one year after –pre-treatment with disodium octaborate tetrahydrate followed by either kiln drying or Boulton seasoning and copper naphthenate treatment.
0123456789
10
0-25 25-50 50-75 75-100 100-125 125-150
Boro
n Re
tent
ion
(kg/
m B
AE)
Distance from Pole Surface (mm)
Post Treatment2 Months
0
1
2
3
4
5
6
7
25 50 75 100 125 150
Boro
n Co
nten
t (kg
/m3 B
AE)
Distance from Surface (mm)
Boron Content
GL BoultonGL Kiln1.2 m Boulton1.2 m Kiln

34th Annual Report 2014 ___________________________
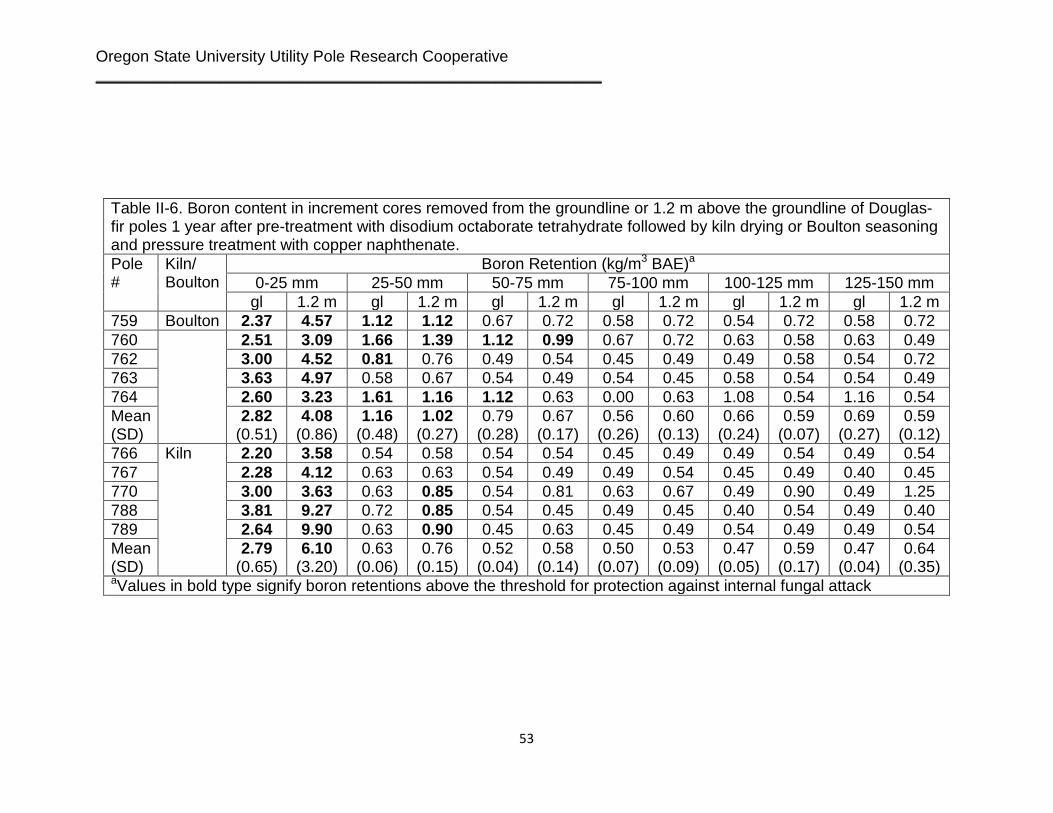
Oregon State University Utility Pole Research Cooperative _________________________________________________________
53
Table II-6. Boron content in increment cores removed from the groundline or 1.2 m above the groundline of Douglas-fir poles 1 year after pre-treatment with disodium octaborate tetrahydrate followed by kiln drying or Boulton seasoning and pressure treatment with copper naphthenate. Pole #
Kiln/ Boulton
Boron Retention (kg/m3 BAE)a
0-25 mm 25-50 mm 50-75 mm 75-100 mm 100-125 mm 125-150 mm gl 1.2 m gl 1.2 m gl 1.2 m gl 1.2 m gl 1.2 m gl 1.2 m
759 Boulton 2.37 4.57 1.12 1.12 0.67 0.72 0.58 0.72 0.54 0.72 0.58 0.72 760 2.51 3.09 1.66 1.39 1.12 0.99 0.67 0.72 0.63 0.58 0.63 0.49 762 3.00 4.52 0.81 0.76 0.49 0.54 0.45 0.49 0.49 0.58 0.54 0.72 763 3.63 4.97 0.58 0.67 0.54 0.49 0.54 0.45 0.58 0.54 0.54 0.49 764 2.60 3.23 1.61 1.16 1.12 0.63 0.00 0.63 1.08 0.54 1.16 0.54 Mean (SD)
2.82 (0.51)
4.08 (0.86)
1.16 (0.48)
1.02 (0.27)
0.79 (0.28)
0.67 (0.17)
0.56 (0.26)
0.60 (0.13)
0.66 (0.24)
0.59 (0.07)
0.69 (0.27)
0.59 (0.12)
766 Kiln 2.20 3.58 0.54 0.58 0.54 0.54 0.45 0.49 0.49 0.54 0.49 0.54 767 2.28 4.12 0.63 0.63 0.54 0.49 0.49 0.54 0.45 0.49 0.40 0.45 770 3.00 3.63 0.63 0.85 0.54 0.81 0.63 0.67 0.49 0.90 0.49 1.25 788 3.81 9.27 0.72 0.85 0.54 0.45 0.49 0.45 0.40 0.54 0.49 0.40 789 2.64 9.90 0.63 0.90 0.45 0.63 0.45 0.49 0.54 0.49 0.49 0.54 Mean (SD)
2.79 (0.65)
6.10 (3.20)
0.63 (0.06)
0.76 (0.15)
0.52 (0.04)
0.58 (0.14)
0.50 (0.07)
0.53 (0.09)
0.47 (0.05)
0.59 (0.17)
0.47 (0.04)
0.64 (0.35)
aValues in bold type signify boron retentions above the threshold for protection against internal fungal attack

34th Annual Report 2014 ___________________________
Literature Cited
Morrell, J.J., R.D. Graham, M.E. Corden, C.M. Sexton, and B.R. Kropp. 1989. Ammonium bifluoride treatment of air-seasoning Douglas-fir poles. Forest Products Journal 39(1):51-54.
Morrell, J.J., M.A. Newbill, and C.M. Sexton. 1991. Basidiomycete colonization of Douglas-fir poles after polyborate treatments. Forest Products Journal 41(6):28-30.

Oregon State University Utility Pole Research Cooperative _________________________________________________________
55
OBJECTIVE III
EVALUATE PROPERTIES AND DEVELOP IMPROVED SPECIFICATIONS FOR WOOD POLES
A well-treated pole will provide exceptional performance under most conditions, but a properly treated structure can also experience decay. While most of our efforts have concentrated on developing ways to arrest in-service decay, developing methods to prevent damage through improved initial specifications and identifying better methods for assessing in-service poles may produce greater savings for utilities. The goals of objective III are to develop new initial treatment methods, explore the potential for new species, assess various inspection tools and explore methods to produce more durable wood poles.
A. Effect of Polyurea Coatings on Performance of Douglas-fir in Tropical Aboveground Exposures
Preservative treatment provides excellent protection to wood in a variety of adverse environments and these processes have been used for over 150 years to prolong the useful life of wood products (Graham, 1973). A number of supplemental materials have been developed that are designed to retain chemical or limit contact between soil and treated wood. These materials prolong the useful life of the product while potentially reducing the environmental footprint associated with chemical treatments.
Barriers have a fairly long history of use in soil contact, where they have been shown to prolong the useful life of creosote treated pine as well as dip treated stakes (Baecker, 1993; Baecker and Behr, 1995, Behr and Baecker, 1994; Behr et al., 1996, 1997; Scheffer et al., 1997). Products have also been developed for protecting wood in aboveground exposures. In this case, the primary goal is to protect wood from avian attack, particularly by woodpeckers that are often not affected by the preservative treatment. One such product is a polyurea coating sprayed on the wood surface. This barrier is reported to bond with the wood surface and remain flexible over time. These barriers may also be useful for altering moisture uptake and, potentially protecting non-treated wood against fungal attack; however, there are few data on these applications.
In this report, we assess the ability of a polyurea coating to limit fungal and insect attack on Douglas-fir lumber and timbers.
We evaluated three separate trials examining resistance to termite attack, resistance to fungal attack out of soil contact, and finally, the condition of polyurea coatings after 4 years of tropical exposure.

34th Annual Report 2014 ___________________________
Termite tests: Douglas-fir lumber samples (37.5 by 87.5 by 125 mm long) that were non-treated, treated with penta to a 9.6 kg/m3 target retention, or dip treated with 10% sodium octaborate tetrahydrate (DOT) were left untreated or coated with a ~2 mm thick polyurea coating. The samples were exposed to formosan termite (Coptotermes formosanus) attack in an AWPA Standard E26 ground proximity test (AWPA, 2012). Briefly, hollow concrete blocks were placed on the ground, then untreated southern pine sapwood stakes (19 by 19 by 200 mm long) were driven into the ground to create pathways for termites to explore upward onto the concrete. Test specimens were placed on the blocks in a pattern where each piece was surrounded by 19 by 38 mm untreated pine sapwood (Figure III-1). Each treatment was evaluated on 10 replicates. The resulting assembly was covered with a wood box to prevent overhead wetting. The assembly was evaluated at six month intervals. The specimens were scraped clean of materials deposited by termites and visually rated using the following scale:
10 no attack although some slight grazing allowed
9.5 slight grazing
9.0 termite attack but little penetration
8.0 termite penetration
7.0 substantial termite attack
4.0 termite attack renders sample barely serviceable
0 sample destroyed
Additional untreated pine sapwood stakes were driven into the ground and the test blocks were placed on the concrete blocks along with untreated pine sapwood controls, again surrounded by 19 by 19 mm untreated pine sapwood.
Above ground Decay Exposures: Non-treated and penta treated Douglas-fir sections were obtained from a cooperator (100 by 100 by 600 mm long). Half of the specimens from each group were left as received and the remainder were coated with a ~2 mm thick polyurea coating. The samples were placed on racks approximately 600 mm above groundline at a site located outside Hilo, Hawaii. The site receives approximately 5 m of rainfall per year with daytime temperature around 28 C. Samples were exposed in an open field with extreme ultraviolet light exposure. Samples were visually assessed for internal decay presence semi-annually by probing the surface and examining coating condition; however, the large size of the specimens precluded substantial investigation of internal condition. At the 4 year exposure point, one sample from each treatment was removed and returned to the laboratory for further evaluation.
Each removed specimen was cut longitudinally into three roughly equal sections so that one surface contained all of the UV exposed face, another contained all of the bottom,

Oregon State University Utility Pole Research Cooperative _________________________________________________________
57
non-UV exposed face, and the middle piece contained parts of both. The exposed surfaces were photographed and a chisel was used to remove wood samples that were briefly flamed to minimize the presence of surface microflora. The flamed wood samples were placed on 1% malt extract agar in petri dishes. The plates were incubated at room temperature (20-23 C) for 4 weeks and any fungi growing from the wood shavings were examined under a microscope for characteristics typical of basidiomycetes, a class containing many important wood decay fungi.
Coating Assessment: An important question for coatings is their long term resistance to UV. Because the samples had one coated face exposed to UV and the other protected from this exposure, the specimens provided an excellent opportunity to assess changes in coating quality. The coating on the upper surface was easily separated from the wood beneath. The coating on the underside of the samples still tightly adhered to the wood. Chemical digestion of the wood was considered, but there was concern that the treatment might produce changes in the polyurea coating. Instead, the wood was cut as closely to the coating as possible, taking care to avoiding nicking or otherwise damaging the coating. The remaining wood was carefully sanded from the inner surface.
The coating was then cut into 175 mm long by 45 mm wide strips that were tested to failure in tension. Small pieces of coating were also examined under a light microscope to assess surface changes in the material.
Termite tests: Termites completely destroyed the non-treated feeder material around the test pieces after each 6 month interval, illustrating the aggressive termite attack possible at the site. Non-treated Douglas-fir samples without coating were similarly destroyed after six months in the first test (Table III-1). Non-treated samples that were coated with polyurea were also destroyed after the first 6 month exposure (Figure III-2). Termites had easily penetrated through the barrier and had largely hollowed out the interior. The results showed that workers were able to detect wood inside the coating even in the absence of exogenous moisture.
Penta-treated samples with or without coating were both free of attack after 6 months of exposure. Workers tended to cover the materials with fecal matter and generally avoided these samples. Similar results were found after an additional 12 months of exposure. Clearly, penta inhibited termite attack, even without the barrier.
The second test was designed to determine if DOT might have sufficient activity to limit termite attack through the polyurea coating. Samples subjected to a 3 minute dip in 10% DOT and a 30 day diffusion period were either exposed directly or coated with polyurea. In this case, the degree of attack was less aggressive than the first test. While most of the non-treated feeder material was attacked, the non-treated controls retained some integrity after 6 months of exposure (Mean Rating 4.4) (Table III-1). Non-coated DOT

34th Annual Report 2014 ___________________________
samples rated slightly higher (mean rating 6.6) suggesting that boron had some effect on termite attack. Coated samples had less attack at the 6 month point with average ratings of 8.8 and 9.3, respectively, for the non-coated and coated samples. There was definite evidence of penetration through the polyurea coating, but the samples remained largely sound. Termite attack at the site can vary periodically and, for this reason, the samples were reset with fresh feeder material and exposed for an additional 6 months. All of the samples had been completely destroyed at the next inspection (Figure III-3). These results suggest that the lack of attack on coated materials after 6 months in the second test reflected termite variability rather than any enhanced activity of the coating. The results indicate that dipping in boron had only a slight effect on the ability of the polyurea coating to protect the wood against termite attack. One possible improvement in this test would be to use pressure treatment in place of dip diffusion.
Table III-1. Ability of combinations of preservative treatment and polyurea coating to protect Douglas-fir lumber from Formosan termite attack in an AWPA Standard E21 test. Treatment Test Non-Coated Coated
6 Months 12 months 6 months 12 months Control 1 0 - 0 - Penta 1 10 10 10 10
Control 2 4.4 0 8.8 0 DOT 2 6.6 0 9.3 0
Values represent means of 10 replicates per treatment. Test 2 was initiated 12 months after Test 1. Above Ground Exposures: Coatings made it nearly impossible to inspect the condition of samples exposed aboveground (Figure III-4). The non-treated, non-coated samples began to decay after 24 months of exposure and fungal fruiting bodies were evident on some samples (Figure III-5). There was no evidence of decay on the non-coated penta-treated samples at any of the 7 inspections conducted over the 48 month exposure.
Dissection of samples provided more useful information on internal condition. In our initial assessments, it was hoped the coating might preclude the need for preservative treatment of moderately durable Douglas-fir samples. There was no evidence of decay in either coated or non-coated penta-treated samples. This result was not surprising since penta is widely used for treating Douglas-fir cross arms and provieds excellent long-term performance in this application. Dissection of the non-coated arm without initial treatment revealed extensive internal decay. The extent of decay is consistent with previous performance of Douglas-fir l-joints exposed at the same site that failed within 3 years of exposure. Interestingly, decay was noted on the top and bottom edges of the coated, non-treated sample. The barrier was originally purported to provide an envelope of protection; however, decay adjacent to the barrier suggests fungi were able to grow on the coating surface and penetrate inward (Figure III-6). Shallow decay presence (5-10 mm) indicates that the coating will not perform on non-treated wood.

Oregon State University Utility Pole Research Cooperative _________________________________________________________
59
Figure III-1. Example of a termite array containing coated and non-coated Douglas-fir lumber sections at the time of exposure.
Figure III-2. Examples of the undersides (top) and upper surfaces of coated and non-coated Douglas-fir lumber with and without penta treatment. From the left, the samples are coated/penta-treated, coated/non-treated, non-coated/penta-treated and non-coated/non-treated after 6 months of exposure to Formosan termite attack.

34th Annual Report 2014 ___________________________
Figure III-3. Cross sections cut through polyurea coated sections of non-treated Douglas-fir (left) and Douglas-fir dip-diffusion treated with borates prior to coating (right) after 1 year of exposure to Formosan termite attack.
Figure III-4. Example of Douglas-fir crossarms with and without polyurea coating immediately after exposure near Hilo, Hawaii.

Oregon State University Utility Pole Research Cooperative _________________________________________________________
61
Attempts to isolate decay fungi from the samples were not successful, despite the presence of visible decay. It is sometimes difficult to isolate fungi from wood in advanced stages of decay; however, the isolation attempts were made 25 to 30 mm away from these areas. The inability to isolate could reflect over-heating of the wood pieces prior to placing them on the agar or the presence of the fungus in a very limited area away from the zone of obvious damage. We will remove additional samples at the next inspection to better delineate the degree of fungal colonization.
Figure III-5. Example of a non-treated Douglas-fir crossarm section with visible decay after 4 years of exposure in Hilo, Hawaii.
Figure III-6. Sections cut from a non-treated Douglas-fir crossarm section with a polyurea coating after 48 months of exposure in Hawaii showing decay immediately adjacent to the coating (white arrows).

34th Annual Report 2014 ___________________________
Effect of UV exposure on Coating Integrity: The coating on the upper surfaces of non-treated samples had nearly completely detached from the wood surface, while the lower, non-UV exposed coating remained completely attached. We suspect that repeated heating and cooling of the upper surface gradually pulled the film from the wood. This effect was present on both the penta and non-treated samples, but it appeared to be more severe on the non-treated samples.
The upper, exposed surfaces of the aboveground samples showed clear evidence of UV damage. This effect appeared to be extremely shallow and there was no evidence that damaged materials were being exfoliated to expose new material to UV damage. However, thickness measurements of coatings removed from the upper and lower surfaces of samples removed from the site suggested decreased coating thickness on the upper surface (Table III-2). The effect was most noticeable on the non-treated sample which was more than 50% thinner on the upper surface. Coating thickness on the upper surface of the treated sample was 10% lower than on the bottom surface of the same piece. There was evidence that oil from the original penta treatment had bled to the surface of the treated coated samples. This may have contributed to the reduced loss in thickness.
The density values of the residual coating also tended to be lower on the upper surfaces of the samples, although the differences between upper and lower surfaces were not as substantial as those found with thickness. The results suggest that extreme UV exposure coupled with high rainfall removed weakened material and affected the coating over time.
Table III-2. Condition of polyurea coatings removed from the upper (UV exposed) and lower (Non-UV exposed) surfaces of non-treated and penta-treated Douglas-fir sections exposed for 48 months in Hilo, Hawaii.a
Treatment Top/Bottom Thickness (mm)
Density (g/cm3) Peak Load (N) None Top 0.89 0.88 257
Bottom 1.85 0.99 455 Penta Top 1.68 0.94 533
Bottom 1.85 1.05 709 aValues represent means of 2 samples per material exposure.
Peak loads for polyurea samples tested to failure in tension tended to be lower on non-treated samples than those from treated wood coated with the same material. Peak loads were also lower on the upper surfaces of treated and non-treated samples than on the bottom. These results suggest that UV exposure has had a detrimental effect on coating integrity.
Polyurea coatings provided some protection against fungal attack in non-soil contact exposures over a 48 month period, but fungi were eventually able to penetrate through

Oregon State University Utility Pole Research Cooperative _________________________________________________________
63
the barrier and invade the wood. The barriers provided little protection to non-treated wood against termite attack. The results indicate that these coatings work best when used in conjunction with preservative treated wood.
B. Preservative Migration in Poles Treated with Pentachlorophenol: Biodiesel has been used as a solvent or co-solvent for almost 6 years. Initially, there was considerable concern that the biodiesel would be more susceptible to biological degradation because trials of biodiesel alone had shown that it degraded more rapidly in soils. Laboratory and field tests of wood treated with penta in a biodiesel blend performed similarly to penta in traditional P9 Type A heavy oils. This system has been used in the western United States to treat thousands of Douglas-fir poles with penta and appears to be performing well. One aspect of treatment that has not yet been investigated is the mobility of the preservative system over time.
Several studies have shown that oil-borne preservatives migrate downwards in poles in service. They also migrate slowly out of the pole into the surrounding soil where they are rapidly degraded by native soil microflora. Previous studies have shown that preservatives such as penta are not detectable more than 300 mm away from a pole in service, reflecting biodegradation. Downward migration may, at first, appear to be detrimental to long term performance; however, it has a potential benefit to bolster preservative protection at groundline, where it is needed most. Migratory characteristics of newer biodiesel amended solvent systems have yet to be explored in poles. In this report, we describe very preliminary studies to examine a method for assessing oil retentions in Douglas-fir poles at various heights above groundline.
Douglas-fir poles treated with penta in a biodiesel blend oil (FPRL) and installed in 2009 in a line near Corvallis, Oregon were selected for sampling. The ANSI Class 2 poles ranged from 55 to 90 feet long. The poles were sampled by removing two increment cores from each of three equidistant points around each pole approximately 900 mm above and 600 mm below groundline. Cores were placed in plastic drinking straws, labeled and stapled shut. In a typical pole retention assay, the outer 6 mm and the next 19 mm inward from the pole surface was removed and combined for a given height on each pole. The outer 6 mm is normally discarded, but we felt it was important to examine oil movement on the pole surface. The inner 6 to 25 mm corresponds to the normal assay zone used for analyzing retention in Douglas-fir poles. A total of 8 poles were sampled.
The combined cores were extracted in toluene using procedures described in AWPA Standard A6-09. Briefly, cores were weighed and positioned in a stainless steel mesh basket that was placed into an extraction apparatus which was placed over a flask containing 200 ml of toluene. The assembly was connected to a condenser and the flask was heated for 5 hours. The solvent continually dripped over the cores, extracting

34th Annual Report 2014 ___________________________
any residual treatment into the toluene below. Cores were weighed before and after extraction and the difference was used to calculate total oil extracted. No attempt was made in this first assessment to analyze the solvent for penta and the values should be viewed as advisory for residual solvent at the two sampling heights.
Oil retentions were consistently higher in the outer 6 mm of all eight poles above and below groundline (Table III-3). This would be consistent with preservative retentions declining with distance inward from the surface. Retentions for most poles tended to be much lower 0.9 m above than below groundline, suggesting downward oil migration. These results would be consistent with previous studies using older oils that are no longer employed for wood treatment. These results are preliminary and we have not yet compared them with oil levels in poles treated with other solvent systems. This coming year, we plan to sample additional poles to determine if the migratory behavior of the newer oils is similar to the older solvent systems.
Table III-3. Retentions of oil in the outer 6 mm and next 6 to 25 mm above and below the groundline of Douglas-fir poles 5 years after installation in a line near Corvallis, Oregon.
Pole # Oil Retention (% Mass/Mass)
0.9 m above groundline 600 mm below groundline 0-6 mm 6-25 mm 0-6 mm 6 to 24 mm
ST35/5B 22.2 18.5 32.2 12.5 ST 35/6A 20.3 12.3 34.9 21.1 ST35/6B 28.6 17.5 41.8 31.0 ST/35/7A 43.0 39.2 46.8 44.2 ST35/7B 33.9 22.0 40.0 29.7
AB 10 /5A 21.4 10.8 42.4 29.2 AB10/6A 24.4 15.7 36.2 24.6 AB10/6B 31.1 17.0 41.2 33.5
Mean (SD) 28.1 (7.7) 19.1(8.8) 39.4 (4.7) 28.2 (9.3)
C. Incidence of Soft Rot Attack on Preservative Treated Douglas-fir Poles: A Preliminary Survey
Damage by soft rot fungi was first observed in 1850 by Schacht, although damage was not associated with fungal attack until the early 1950’s (Findlay and Savory, 1950; Savory, 1954). Since that time, soft rot fungi have been found in wood in a variety of environments including cooling towers, agricultural soils and above ground exposures less suitable for colonization by more conventional basidiomycetous fungi (Butcher, 1975; Friis-Hansen, 1975; Greaves, 1977; Leightley and Eaton, 1977; Levy, 1975; Nilson, 1973). Soft rot fungi have been found to be ubiquitous, although their roles in the overall degradation process are still not entirely defined.
The impact of soft rot attack varies with application but its presence can be especially important where wood is subjected to bending, such as utility poles. Most soft rot damage occurs near the wood surface where, coincidentally, 90% of a poles bending strength occurs. Thus, soft rot attack can profoundly affect pole properties at relatively

Oregon State University Utility Pole Research Cooperative _________________________________________________________
65
early stages of attack. In North America, southern pine is the predominant species used for supporting electrical distribution lines east of the Rocky Mountains. This species appears to be susceptible to soft rot attack, although there is some evidence that poles treated with chromated copper arsenate (CCA) only begin to experience substantial attack after 30 to 40 years in service (Zabel et al., 1985). As a result, pole excavation for belowground inspection and application of supplemental preservative pastes is an important component in the maintenance cycle for poles of this species (Morrell, 2012). These treatments are highly effective and markedly prolong useful pole life. While southern pine is an important species in parts of the US, other regions use Douglas-fir to support their electrical lines. This species is characterized by a thin sapwood surrounding a moderately durable heartwood core. Although untreated sapwood of Douglas-fir is susceptible to soft rot attack, field inspections reveal that preservative treated poles of this species remain relatively free of soft rot attack. This difference between southern pine and Douglas-fir may reflect differences in how they are specified within the AWPA Standards for pole treatments (AWPA, 2012). While the retentions are identical for both species when treated with waterborne CCA or ammoniacal copper zinc arsenate (ACZA), they differ for treatment with oil borne systems such as penta or copper naphthenate. For penta, the retentions in Douglas-fir are 50, 18 and 33% higher than those for southern pine for Use Categories 4A, 4B, and 4C, respectively. While these differences are relatively small, they appear to enhance resistance to soft rot attack. A further potential difference reflects the inherent difficulty of impregnating the sapwood of Douglas-fir. While the reported permeabilities of both species are similar (Siau, 1995), treatment processes for Douglas-fir poles are often 6 to 10 times longer than those used for southern pines. This inherent resistance to impregnation may then translate to a reduced tendency for preservative migration once in service.
While Douglas-fir is an important commercial utility pole species, there is relatively little data on its susceptibility to soft rot attack. Zabel et al. (1991) isolated soft rot fungi and assessed the degree of soft rot attack on Douglas-fir poles treated with penta in conventional heavy oil, liquefied petroleum gas or CCA. They found soft rot fungi commonly in CCA treated poles, but infrequently in penta treatments. These results were very different from those previously found on southern pine poles and suggested that the surface of a Douglas-fir pole presented a challenge to fungal colonization.
One aspect of the previous study of soft rot in Douglas-fir was the age of the poles, which had all been in service for less than 20 years. Soft rot attack tends to be progressive as preservatives deplete from the wood surface and fungi from the soil begin to move into the depleted wood. Thus, it might be more fruitful to examine poles that had been in service for longer periods. The Oregon State University field test site presents an excellent opportunity for such examinations. Poles have been installed at irregular intervals over a 34 year period. While most of these poles have been used in

34th Annual Report 2014 ___________________________
field trials of internal remedial treatments, previous studies suggest that these treatments will have minimal effect on fungal activity at the wood surface.
In this report, we describe a preliminary assessment of the presence of soft rot damage in Douglas-fir poles treated with either penta or ACZA.
The poles are at a site located near Corvallis, Oregon that receives 1,200 mm of rainfall per year. The climate is Mediterranean with warm dry summers and cool, wet winters. The site has a Scheffer climate index of 45 (Scheffer, 1971). The soil is Olympic silty-clay loam. The top 200 mm is slightly acidic (pH 5.4) and has approximately 12 mm of humus (Morrell et al., 1999). Organic matter and nitrogen content are 4.71% and 0.14%, respectively. Brush on the site is controlled through regular mowing coupled with periodic glyphosate application (Monsanto Chemical Co, St. Louis, MO).
Increment cores were removed from 24 Douglas-fir poles treated with either ACZA, or penta in heavy oil and installed in 1998, 1993, or 1981, respectively (Table III-4). Cores were removed from locations on each pole approximately 150 mm belowground. The cores were placed in plastic drinking straws, stapled shut and returned to the laboratory for analysis. The outer 6 mm of each core was removed for processing, using previously described procedures (Anagnost et al., 2000; Berlyn and Miksche, 1976). Briefly, the 6 mm segments were placed into 1.5 ml microcentrifuge tubes with a small vent hole in the lid. One ml of a 50:50 mixture of glacial acetic acid and 30% hydrogen peroxide was added to the tube, which was heated at 60 C for 42 hours. The tubes were centrifuged at 10,000 g for 2 minutes and the supernatant was removed. The fibers were washed several times by adding 1 ml of deionized water, vortexing the mixture and centrifuging again. The supernatant was removed and fresh distilled water was added. The samples were either examined directly or frozen until they could be examined.
The digested material was placed on a glass slide and observed under a light microscope. The defibrillated wood cells were examined for evidence of either diamond shaped cavities or cell wall thinning typical of Types 1 and 2 soft rot damage, respectively. Two slides were examined per prepared sample. The degree of soft rot damage, where present, was quantified by counting all the cells in 5 fields observed at low power under the light microscope and then counting the number of cells with soft rot damage. Results were expressed as a percentage of all cells observed.
No soft rot was found in the oldest poles treated with penta. These poles were initially treated with the intent of creating a relatively shallow zone of preservative penetration so that there would be a maximum of non-treated wood available for colonization by fungi invading through field drilled holes. As a result, we might expect these poles to be most susceptible to external fungal attack.

Oregon State University Utility Pole Research Cooperative _________________________________________________________
67
Soft rot cavities were detected on poles treated with penta and installed in 1993 as well as in the ACZA treated poles (Figure III-7). Cavities were elongated and very abundant in the affected cells. Soft rot cavities can have dramatic effects on wood properties and the degree of soft rot observed on cells from the ACZA poles suggest that the damage would have marked effects on pole flexural properties at groundline.
Table III-4. Characteristics of Douglas-fir poles sampled for the presence of soft rot cavities. Treatment
Year Installed Original Purpose of Test # poles sampled
ACZA 1998 Evaluation of MITC-FUME internal remedial treatment 15
Boron 1993 Evaluation of fused boron rods
5 Pentachlorophenol
in Heavy Oil 1981 Evaluation of treatments for field drilled bolt holes 5
Soft rot damage was detected on 40% penta-treated poles in service since 1993; however, a closer examination of the damage indicated that soft rot damage was only detected on 2.8% of the wood cells examined (Table III-5). This small percentage suggests that soft rot may have been present in a small number of cells near the wood surface. The preservative in these cells would be more likely to deplete into the surrounding soil, creating conditions for fungal colonization. Thus, while soft rot was present, it was likely to have only a small effect on material properties. Previous studies have shown that penta treated Douglas-fir poles were colonized by a limited soft rot microflora dominated by Phialemonium dimorphosporum (Zabel et al., 1991).
Soft rot damage tended to be more prevalent on poles treated with ACZA and installed in 1998. Four of the ten ACZA treated poles contained soft rot damage in the tracheids. While the incidence was similar to that found with the 1993 penta treated poles, the frequency of cells with soft rot damage was much higher, ranging from 9.7 to 86.7% of the cells examined on a given pole. An average of 18.7% of all cells examined exhibited some evidence of soft rot attack. These results suggest that the ACZA treated poles may need to be examined more closely as they age. While ACZA treatments have only been available since the1980s, previous tests with ammoniacal copper arsenate, its predecessor, suggest that older poles do experience soft rot attack (Rhatigan et al., 2002). However, ACZA is strongly immobilized in wood and should be more resistant to leaching (Lebow and Morrell, 1995).
Soft rot damage was found in tracheids removed from poles treated with either penta or ACZA, but the damage was more common in ACZA treated samples even though poles treated with this chemical were in service for a shorter period. Results suggest that belowground inspection of older ACZA poles may be useful for detecting soft rot attack before the damage becomes a problem.
Table III-5. Incidence of soft rot attack in Douglas-fir poles exposed near Corvallis, Oregon for

34th Annual Report 2014 ___________________________
16 to 33 years.
Initial Treatment Year Installed n Soft Rot Incidence Cells w/Soft Rot (%)a
ACZA 1998 15 40 18.7 Penta 1993 5 40 2.8 Penta 1981 5 0 0
aValues represent percentages of 230 cells for ACZA and 143 cells for penta.
Figure III-7. Examples of soft rot damage in cells removed from poles treated with (a and b) ACZA treated or (c and d) penta-treated Douglas-fir poles.
D. Performance of Southern Pine Stakes Treated with Pentachlorophenol in Diesel or HTS Solvent
There has been considerable controversy over the use of biodiesel as a co-solvent for treating wood with penta. Extensive laboratory trials indicated that the presence of biodiesel did not negatively affect penta performance in southern pine sapwood blocks, but the artificial nature of laboratory tests can sometimes produce anomalous or misleading results. The best way to evaluate preservative performance is to test under actual conditions at a number of sites with varying environmental conditions. This process can take years to produce meaningful results, but one way to accelerate the process is to use smaller test media with increased surface to volume ratios that magnify the decay effects. Fahlstrom stakes are an excellent example of this approach,
(a) (b)
(c) (d)

Oregon State University Utility Pole Research Cooperative _________________________________________________________
69
wherein traditional 19 mm by 19 mm stakes are replaced with 4 x 38 x 254 mm long stakes. The smaller stakes magnify any surface decay effects, producing results much earlier in an exposure process.
In this report, we describe field test results of Fahlstrom stakes treated with penta using diesel or a biodiesel amended solvent and exposed at 2 sites for 18 to 43 months.
Southern pine sapwood stakes were prepared and treated by Forest Products Research Laboratory Inc. personnel according to procedures described in AWPA Standard E7 and supplied to OSU for exposure. Stakes were treated with diesel or HTS solvent alone to serve as solvent controls. Additional sets of 20 stakes were treated to target retentions of 0.1, 0.2, 0.3 or 0.6 pcf of penta (1.6, 3.2, 4.8, and 9.6 kg/m3). An additional 30 stakes were treated to 0.6 pcf with penta in either diesel or HTS. The latter stakes were intended for periodic removal to assess preservative depletion. The treated stakes were allocated to two groups for exposure in Oregon or Hawaii.
The exposure site was sprayed with glyphosate prior to setting stakes. A synthetic landscape fabric was then placed on the site and a metal dibble was used to create holes for the stakes. While the fabric creates a slightly different exposure than allowing vegetation to accumulate around the stakes, we felt that it would avoid the need to mow or remove grass, thereby reducing the risk of stake damage. The treated stakes were then buried in soil to half their length approximately 8 inches apart. The Corvallis, Oregon site has a maritime climate and receives approximately 45 inches of rainfall per year, primarily between October and June. The Hilo, Hawaii site is sub-tropic and receives ~200 inches of rainfall per year. The site has a well-drained volcanic clay soil.
Stake condition was evaluated at the Corvallis site after 1 and 3.5 years while Hilo was assessed after 6, 12, 24, 31 and 43 months of exposure. Each stake was removed from the soil, wiped clean and probed with an awl for evidence of softening. Stake condition was rated on a scale from 10 to 0 as described in AWPA Standard E7 where:
Grade No. Description of Condition 10 Sound. Suspicion of decay permitted 9 Trace decay to 3% of cross section 8 Decay from 3 to 10% of cross section 7 Decay from 10 to 30% of cross section 6 Decay from 30 to 50% of cross section 4 Decay from 50 to 75% of cross section 0 Failure

34th Annual Report 2014 ___________________________
The Hilo test is completed, while the Corvallis test is on-going. The original site selected for the Corvallis exposure was too wet and there was little evidence of activity. As a result, stakes were removed after 14 months of exposure and reset at a well-drained site, but there was a 9 month lag when the stakes were stored out of ground.
The stakes were evaluated after 43 months of exposure using the scale above (Table III-6). The results indicate that the control and lower retentions of both diesel and HTS treated stakes have nearly all failed. While there were some slight differences in condition between stakes treated using HTS and conventional diesel oil, the variations in stake condition were high, making it difficult to determine if the differences were meaningful. Ratings in stakes treated to 0.6 pcf with either HTS or diesel were similar and suggest that the materials are performing similarly, albeit decaying at a much slower rate than was found at the Hilo site. These results are consistent with site conditions. The Hilo site receives approximately 4 times as much rain as Corvallis and temperatures are mild all year, while the Corvallis site is very dry in the summer when temperatures are more suitable for fungal attack.
Table III-6. Average conditions of Fahlstrom stakes treated to varying retentions with pentachlorophenol in either diesel or HTS and exposed in Corvallis, OR for 12 months.
Target Retention
(PCF) Carrier Replicates
Average Condition Rating1
12 months 42 months
- Diesel 10 9.4 (1.0) 1.8 (3.8) 0.1 Diesel 10 9.4 (1.0) 1.4 (3.0) 0.2 Diesel 10 10 (0) 6.5 (3.8) 0.3 Diesel 10 10 (0) 5.5 (4.1) 0.6 Diesel 25 10 (0) 8.6 (1.3) - HTS 10 9.9 (.03) 1.8 (3.8)
0.1 HTS 10 8.2 (3.1) 3.7 (4.2) 0.2 HTS 10 9.8 (0.4) 5.1 (4.5) 0.3 HTS 10 9.6 (1.0) 3.3 (4.3) 0.6 HTS 25 10 (0) 9.1 (0.4)
Values represent means, while figures in parentheses represent one standard deviation. Ratings are discontinuous with stakes being rated 10, 9, 7, 4 or 0 at each time point as per AWPA Standard E7.
E. Effect of Solvents on Performance of Copper Naphthenate and
Pentachlorophenol Over the past 6 years, we have performed a number of trials examining the effects of solvents on performance of both copper naphthenate and penta. The work originally began because of changes in the solvents used to solubilize penta for treatment of Douglas-fir. It was common practice for west coast treaters to take large blocks of penta, place them in the treating cylinder and circulate hot oil to dissolve the penta to the proper solution concentration. This required oils that had sufficient penta solvency, but this was generally not a problem. Changing supplies of petroleum based solvents
Oregon State University Utility Pole Research Cooperative _________________________________________________________
71
towards solvents with much lower penta solvency created a major concern for these treaters. One alternative was to use a penta concentrate that was then diluted with diesel oil; however, this solvent mixture had strong odors and the more volatile diesel made it difficult to utilize Boulton seasoning (boiling in oil under vacuum to season prior to treatment).
One solution to the problem was the inclusion of biodiesel in the blended oil. Biodiesel has the ability to solubilize sufficient quantities of penta and has an added benefit of sharply reducing solvent odors. The mixture could still meet the AWPA Solvent Standard P9 Type A; however, there was concern among some treaters about the efficacy of penta in biodiesel compared to that found in conventional petroleum based oil. Biodiesel is more rapidly degraded than petroleum-based oils in soil contact without biocide, but there were no data concerning the effects of the penta/oil combination.
An extensive laboratory and field study was undertaken to evaluate the efficacy of penta in conventional solvents, diesel with penta concentrate and penta in a biodiesel blend. These results indicated that the biodiesel performed similarly to other solvents in both the laboratory and field tests. Some biodiesel/copper naphthenate treatments were also included in these trials and they suggested that this solvent/preservative combination might be more susceptible to fungal attack. A larger trial was established and the results indicated that any amount of biodiesel negatively affected the performance of copper naphthenate. A number of steps were taken after these results were released. First, the chemical manufacturer and treater both voluntarily stopped using biodiesel based solvents for copper naphthenate treatment. In addition, two utilities who had purchased substantial quantities of copper naphthenate treated poles initiated a field assessment of selected poles in their systems to determine if poles with copper naphthenate in diesel were more sensitive to the development of early decay. These tests are on-going.
At the same time, there were concerns that the original field trials had only evaluated one biodiesel amended solvent system and that system might not be representative of other systems in use. For this reason, we undertook the following study.
Douglas-fir lumber was collected from a local mill shortly after sawing. The wood was primarily sapwood and had not been subjected to any prior chemical treatment. The lumber was kiln dried and then cut into 19 by 19 by 900 mm long stakes and 19 mm cubes that were free of knots, splits and other defects. The samples were weighed and allocated to treatment groups so that each group contained stakes and blocks with approximately similar density distributions. The samples were then treated with combinations of copper naphthenate or penta in mixtures of diesel alone or amended with 30, 50, 70 or 100% biodiesel. In addition, each biocide was examined in an aromatic oil, a paraffinic oil, FPRL oil, and penta concentrate. Penta target retentions
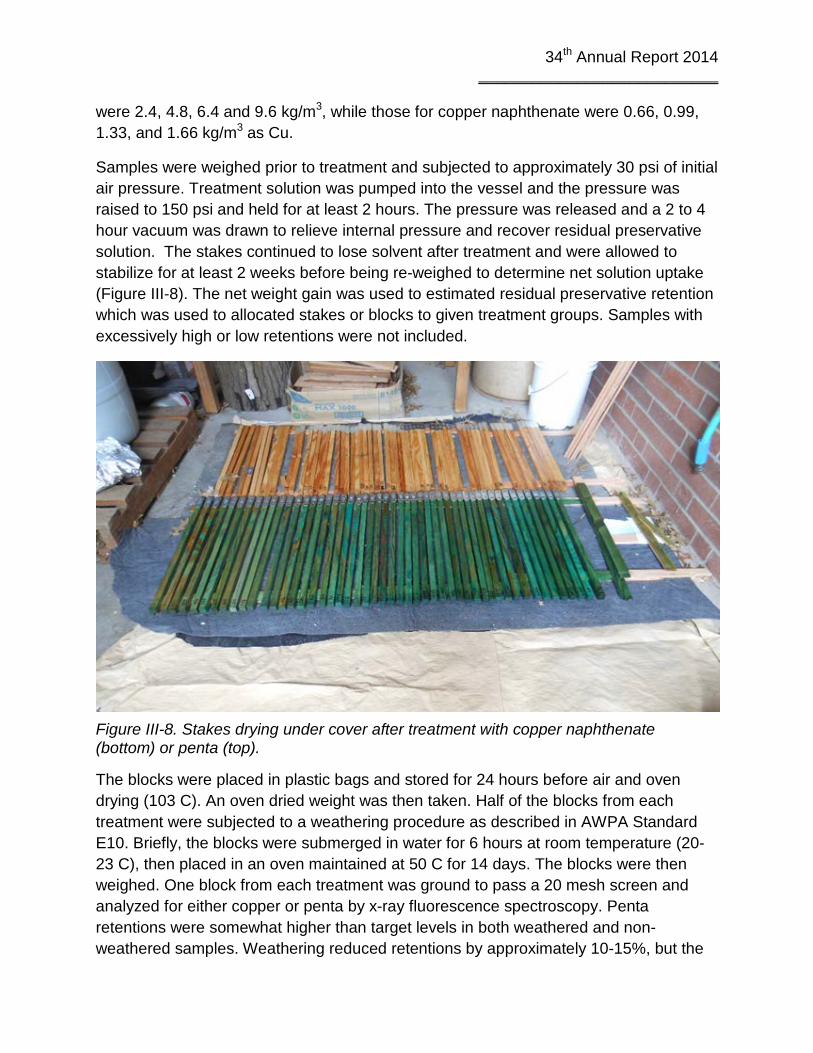
34th Annual Report 2014 ___________________________
were 2.4, 4.8, 6.4 and 9.6 kg/m3, while those for copper naphthenate were 0.66, 0.99, 1.33, and 1.66 kg/m3 as Cu.
Samples were weighed prior to treatment and subjected to approximately 30 psi of initial air pressure. Treatment solution was pumped into the vessel and the pressure was raised to 150 psi and held for at least 2 hours. The pressure was released and a 2 to 4 hour vacuum was drawn to relieve internal pressure and recover residual preservative solution. The stakes continued to lose solvent after treatment and were allowed to stabilize for at least 2 weeks before being re-weighed to determine net solution uptake (Figure III-8). The net weight gain was used to estimated residual preservative retention which was used to allocated stakes or blocks to given treatment groups. Samples with excessively high or low retentions were not included.
Figure III-8. Stakes drying under cover after treatment with copper naphthenate (bottom) or penta (top).
The blocks were placed in plastic bags and stored for 24 hours before air and oven drying (103 C). An oven dried weight was then taken. Half of the blocks from each treatment were subjected to a weathering procedure as described in AWPA Standard E10. Briefly, the blocks were submerged in water for 6 hours at room temperature (20-23 C), then placed in an oven maintained at 50 C for 14 days. The blocks were then weighed. One block from each treatment was ground to pass a 20 mesh screen and analyzed for either copper or penta by x-ray fluorescence spectroscopy. Penta retentions were somewhat higher than target levels in both weathered and non-weathered samples. Weathering reduced retentions by approximately 10-15%, but the

Oregon State University Utility Pole Research Cooperative _________________________________________________________
73
differences were not consistent with solvent type (Table III-7). Copper naphthenate treated samples were also above targets, but appeared to lose less during the weathering phase (Table III-8).
Weathered and non-weathered samples for soil block exposures were briefly soaked in distilled water, placed in plastic bags and subjected to 2.5 mrad of ionizing radiation from a cobalt-60 source. Following sterilization, blocks were exposed to Gloeophyllum trabeum (Pers ex Fr) Murrill (Isolate Madison 617), Antrodia xantha ((Fr.) Ryv. (Isolate ATCC 11086)), or Postia placenta (Fries) M. Larsen et Lombard (Isolate Madison 698). All three fungi are common brown rotters, with G. trabeum exhibiting tolerance to organic preservatives and the latter two exhibiting tolerance to copper based biocides (DaCosta and Kerruish, 1964; Zabel, 1954).
Table III-7. Pentachlorophenol retentions in Douglas-fir sapwood blocks treated using combinations of solvents and analyzed prior to or after weathering.
Pentachlorophenol Carrier
Biodiesel (%)
Target retentions (kg/m3)
0 2.4 4.8 7.2 9.6 0 2.4 4.8 7.2 9.6
Not Weathered Weathered
Diesel
0 0.0 3.2 5.6 - - 0.0 1.8 3.9 - - 30 0.0 3.3 6.7 9.6 12.9 0.0 2.6 5.7 7.6 11.3 50 0.0 4.3 5.5 9.5 14.0 0.0 3.7 5.3 7.5 10.6 70 0.0 3.8 5.7 12.7 11.6 0.0 3.2 5.5 8.5 11.3
Aromatic oil 0 0.0 3.6 7.8 7.7 14.7 0.0 2.8 4.8 7.1 13.8 Naphthenic 30 0.0 4.5 4.6 9.5 9.9 0.0 2.7 3.8 7.7 7.7 Paraffinic 30 0.0 4.2 4.9 6.3 8.9 0.0 4.7 4.2 6.1 6.9 FPRL oil 0 0.0 0.9 2.3 4.4 9.2 0.0 1.7 2.2 4.5 5.5
Ketone Bottoms 0 0.0 1.6 2.4 7.8 8.5 0.0 1.0 1.4 5.3 6.4 Water 0 0.0 - - - - 0.0 - - - -
Table III-8. Copper naphthenate retentions in Douglas-fir sapwood blocks treated using combinations of solvents and analyzed prior to or after weathering.
Copper Naphthenate
Carrier
Biodiesel (%)
Target retentions (kg/m3)
0 0.66 0.99 1.33 1.66 0 0.66 0.99 1.33 1.66 Not Weathered Weathered
Diesel
0 0.00 0.68 1.25 1.89 2.05 0.00 0.70 1.13 1.95 2.02 10 0.00 0.57 1.11 1.41 1.87 0.00 0.95 1.12 1.33 1.81 30 0.00 0.94 1.16 1.32 1.77 0.00 0.91 1.16 1.48 1.67 50 0.00 0.69 0.98 1.03 1.71 0.00 0.71 1.26 1.37 1.47
100 0.00 0.59 1.11 1.31 1.57 0.00 0.60 0.97 1.22 1.56 Water 0 0.00 - - - - 0.00 - - - -
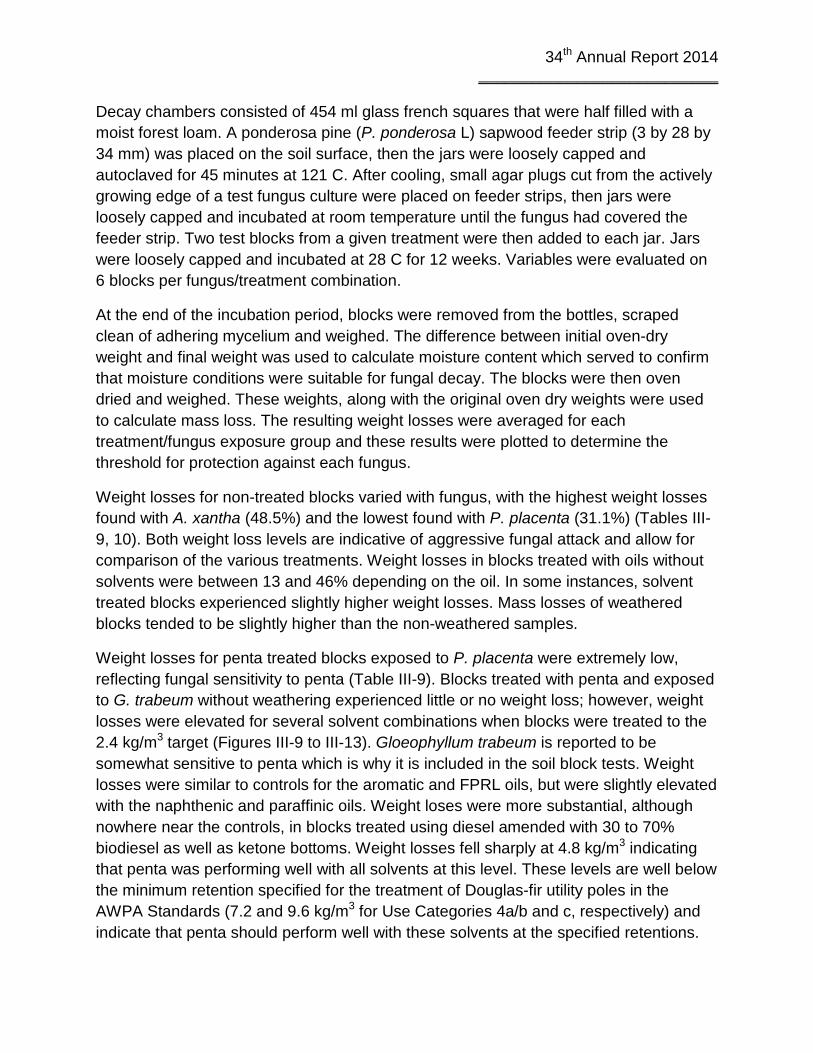
34th Annual Report 2014 ___________________________
Decay chambers consisted of 454 ml glass french squares that were half filled with a moist forest loam. A ponderosa pine (P. ponderosa L) sapwood feeder strip (3 by 28 by 34 mm) was placed on the soil surface, then the jars were loosely capped and autoclaved for 45 minutes at 121 C. After cooling, small agar plugs cut from the actively growing edge of a test fungus culture were placed on feeder strips, then jars were loosely capped and incubated at room temperature until the fungus had covered the feeder strip. Two test blocks from a given treatment were then added to each jar. Jars were loosely capped and incubated at 28 C for 12 weeks. Variables were evaluated on 6 blocks per fungus/treatment combination.
At the end of the incubation period, blocks were removed from the bottles, scraped clean of adhering mycelium and weighed. The difference between initial oven-dry weight and final weight was used to calculate moisture content which served to confirm that moisture conditions were suitable for fungal decay. The blocks were then oven dried and weighed. These weights, along with the original oven dry weights were used to calculate mass loss. The resulting weight losses were averaged for each treatment/fungus exposure group and these results were plotted to determine the threshold for protection against each fungus.
Weight losses for non-treated blocks varied with fungus, with the highest weight losses found with A. xantha (48.5%) and the lowest found with P. placenta (31.1%) (Tables III-9, 10). Both weight loss levels are indicative of aggressive fungal attack and allow for comparison of the various treatments. Weight losses in blocks treated with oils without solvents were between 13 and 46% depending on the oil. In some instances, solvent treated blocks experienced slightly higher weight losses. Mass losses of weathered blocks tended to be slightly higher than the non-weathered samples.
Weight losses for penta treated blocks exposed to P. placenta were extremely low, reflecting fungal sensitivity to penta (Table III-9). Blocks treated with penta and exposed to G. trabeum without weathering experienced little or no weight loss; however, weight losses were elevated for several solvent combinations when blocks were treated to the 2.4 kg/m3 target (Figures III-9 to III-13). Gloeophyllum trabeum is reported to be somewhat sensitive to penta which is why it is included in the soil block tests. Weight losses were similar to controls for the aromatic and FPRL oils, but were slightly elevated with the naphthenic and paraffinic oils. Weight loses were more substantial, although nowhere near the controls, in blocks treated using diesel amended with 30 to 70% biodiesel as well as ketone bottoms. Weight losses fell sharply at 4.8 kg/m3 indicating that penta was performing well with all solvents at this level. These levels are well below the minimum retention specified for the treatment of Douglas-fir utility poles in the AWPA Standards (7.2 and 9.6 kg/m3 for Use Categories 4a/b and c, respectively) and indicate that penta should perform well with these solvents at the specified retentions.

Oregon State University Utility Pole Research Cooperative _________________________________________________________
75
Weight losses for copper naphthenate treated blocks tended to be low in the non-weathered samples although some treatments appeared to be more sensitive to A. xantha at the lowest retention tests (0.66 kg/m3 Cu)(Table III-10). Both A. xantha and P. placenta are known to be tolerant of copper based biocides. Weight losses were much higher in copper naphthenate treated blocks subjected to weathering prior to fungal exposure. This effect was most apparent at the lowest retention level (0.66 kg/m3 Cu) and is consistent with previous trials. Weight losses were somewhat elevated for the lowest retention in pure diesel treatment and then declined with higher retentions. Weight losses in biodiesel amended solvents rose as the level of biodiesel in the solvent was increased (Figure III-14 to III-16). Weight losses remained elevated for blocks treated with copper naphthenate in the 70% biodiesel blend regardless of retention for P. placenta. It was not possible to calculate thresholds for blocks treated with copper naphthenate in some solvent combinations and exposed to A. xantha (Figures III-17 to III-21). These results suggest biodiesel reduces biocide efficacy. Interestingly, the use of pure biodiesel resulted in better protection at higher retentions. The current specified retentions for Douglas-fir poles for treatment with copper naphthenate in Use Categories 4a and 4b are 1.2 and 1.52 kg/m3, respectively. UC 4c requires 2.4 kg/m2 Cu, however, this retention is only specified for high hazard areas with known copper tolerance. The results reinforce the negative effects of biodiesel on resistance of copper naphthenate to copper tolerant fungi, but indicates conventional diesel performed well.
Similarly to decay-test soil blocks, stakes were weighed and sorted into treatment groups, then the middle 50 mm of each stake was cut and retained for analysis of residual preservative content by x-ray fluorescence spectroscopy. Penta treated stakes had retentions below the target levels for nearly all solvents except aromatic oil (Table III-11). Retentions with other solvent mixtures were generally within 15% of the target and there was a definite upward trend. The lower retentions, compared with soil blocks (Table III-12) may reflect the assay of the middle of the stake, while the entire soil block was assayed. These small blocks contain higher proportions of more easily treated end-grain. The center of the stake would primarily expose radial or tangential surfaces which are less receptive to treatment.
We are currently reviewing copper naphthenate retentions because disagreements between stake and block results suggest that there may be an analytical issue. We will report these in future reports along with performance data from long-term field trials.
The remaining 425 mm long stakes were allocated for exposure in either an open field or a forest at Peavy Arboretum, Corvallis, OR. Stakes were set to half their depth and will be evaluated for degree of decay and termite attack on an annual basis according to procedures described in AWPA Standard E7. These trials were designed to determine how changing solvents affect performance, but the results will take time to develop.
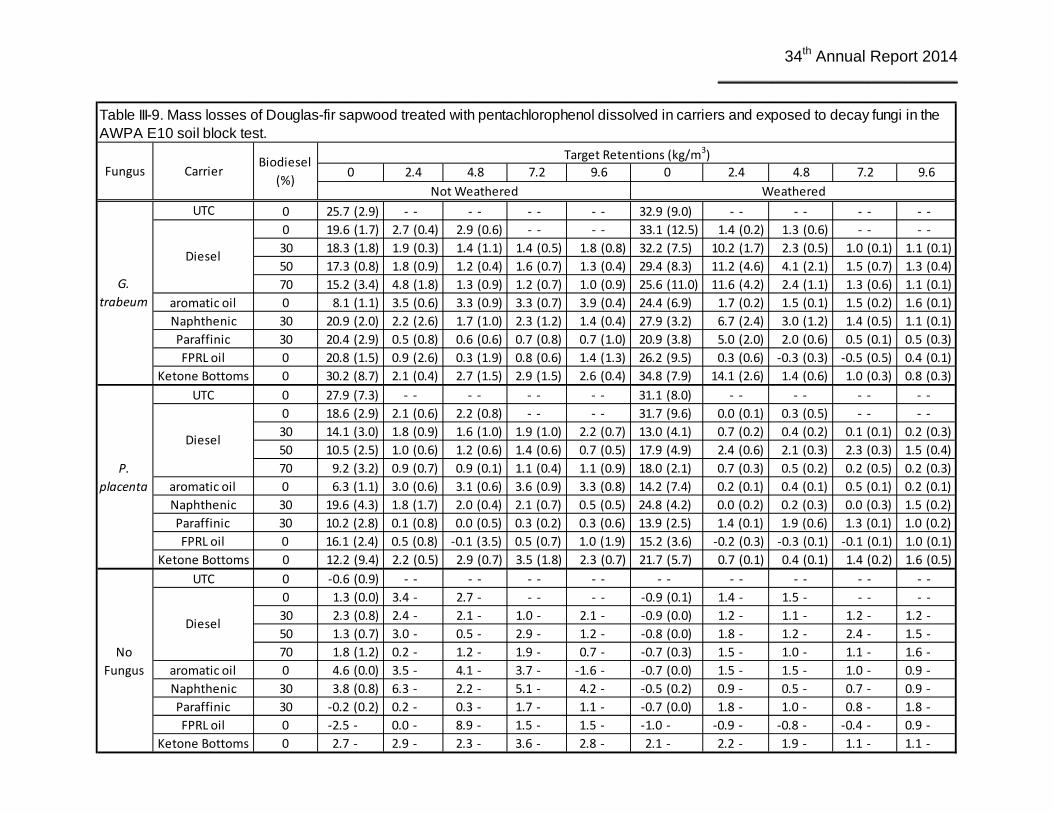
34th Annual Report 2014 ___________________________
UTC 0 25.7 (2.9) - - - - - - - - 32.9 (9.0) - - - - - - - -0 19.6 (1.7) 2.7 (0.4) 2.9 (0.6) - - - - 33.1 (12.5) 1.4 (0.2) 1.3 (0.6) - - - -30 18.3 (1.8) 1.9 (0.3) 1.4 (1.1) 1.4 (0.5) 1.8 (0.8) 32.2 (7.5) 10.2 (1.7) 2.3 (0.5) 1.0 (0.1) 1.1 (0.1)50 17.3 (0.8) 1.8 (0.9) 1.2 (0.4) 1.6 (0.7) 1.3 (0.4) 29.4 (8.3) 11.2 (4.6) 4.1 (2.1) 1.5 (0.7) 1.3 (0.4)70 15.2 (3.4) 4.8 (1.8) 1.3 (0.9) 1.2 (0.7) 1.0 (0.9) 25.6 (11.0) 11.6 (4.2) 2.4 (1.1) 1.3 (0.6) 1.1 (0.1)
aromatic oil 0 8.1 (1.1) 3.5 (0.6) 3.3 (0.9) 3.3 (0.7) 3.9 (0.4) 24.4 (6.9) 1.7 (0.2) 1.5 (0.1) 1.5 (0.2) 1.6 (0.1)Naphthenic 30 20.9 (2.0) 2.2 (2.6) 1.7 (1.0) 2.3 (1.2) 1.4 (0.4) 27.9 (3.2) 6.7 (2.4) 3.0 (1.2) 1.4 (0.5) 1.1 (0.1)Paraffinic 30 20.4 (2.9) 0.5 (0.8) 0.6 (0.6) 0.7 (0.8) 0.7 (1.0) 20.9 (3.8) 5.0 (2.0) 2.0 (0.6) 0.5 (0.1) 0.5 (0.3)FPRL oil 0 20.8 (1.5) 0.9 (2.6) 0.3 (1.9) 0.8 (0.6) 1.4 (1.3) 26.2 (9.5) 0.3 (0.6) -0.3 (0.3) -0.5 (0.5) 0.4 (0.1)
Ketone Bottoms 0 30.2 (8.7) 2.1 (0.4) 2.7 (1.5) 2.9 (1.5) 2.6 (0.4) 34.8 (7.9) 14.1 (2.6) 1.4 (0.6) 1.0 (0.3) 0.8 (0.3)UTC 0 27.9 (7.3) - - - - - - - - 31.1 (8.0) - - - - - - - -
0 18.6 (2.9) 2.1 (0.6) 2.2 (0.8) - - - - 31.7 (9.6) 0.0 (0.1) 0.3 (0.5) - - - -30 14.1 (3.0) 1.8 (0.9) 1.6 (1.0) 1.9 (1.0) 2.2 (0.7) 13.0 (4.1) 0.7 (0.2) 0.4 (0.2) 0.1 (0.1) 0.2 (0.3)50 10.5 (2.5) 1.0 (0.6) 1.2 (0.6) 1.4 (0.6) 0.7 (0.5) 17.9 (4.9) 2.4 (0.6) 2.1 (0.3) 2.3 (0.3) 1.5 (0.4)70 9.2 (3.2) 0.9 (0.7) 0.9 (0.1) 1.1 (0.4) 1.1 (0.9) 18.0 (2.1) 0.7 (0.3) 0.5 (0.2) 0.2 (0.5) 0.2 (0.3)
aromatic oil 0 6.3 (1.1) 3.0 (0.6) 3.1 (0.6) 3.6 (0.9) 3.3 (0.8) 14.2 (7.4) 0.2 (0.1) 0.4 (0.1) 0.5 (0.1) 0.2 (0.1)Naphthenic 30 19.6 (4.3) 1.8 (1.7) 2.0 (0.4) 2.1 (0.7) 0.5 (0.5) 24.8 (4.2) 0.0 (0.2) 0.2 (0.3) 0.0 (0.3) 1.5 (0.2)Paraffinic 30 10.2 (2.8) 0.1 (0.8) 0.0 (0.5) 0.3 (0.2) 0.3 (0.6) 13.9 (2.5) 1.4 (0.1) 1.9 (0.6) 1.3 (0.1) 1.0 (0.2)FPRL oil 0 16.1 (2.4) 0.5 (0.8) -0.1 (3.5) 0.5 (0.7) 1.0 (1.9) 15.2 (3.6) -0.2 (0.3) -0.3 (0.1) -0.1 (0.1) 1.0 (0.1)
Ketone Bottoms 0 12.2 (9.4) 2.2 (0.5) 2.9 (0.7) 3.5 (1.8) 2.3 (0.7) 21.7 (5.7) 0.7 (0.1) 0.4 (0.1) 1.4 (0.2) 1.6 (0.5)UTC 0 -0.6 (0.9) - - - - - - - - - - - - - - - - - -
0 1.3 (0.0) 3.4 - 2.7 - - - - - -0.9 (0.1) 1.4 - 1.5 - - - - -30 2.3 (0.8) 2.4 - 2.1 - 1.0 - 2.1 - -0.9 (0.0) 1.2 - 1.1 - 1.2 - 1.2 -50 1.3 (0.7) 3.0 - 0.5 - 2.9 - 1.2 - -0.8 (0.0) 1.8 - 1.2 - 2.4 - 1.5 -70 1.8 (1.2) 0.2 - 1.2 - 1.9 - 0.7 - -0.7 (0.3) 1.5 - 1.0 - 1.1 - 1.6 -
aromatic oil 0 4.6 (0.0) 3.5 - 4.1 - 3.7 - -1.6 - -0.7 (0.0) 1.5 - 1.5 - 1.0 - 0.9 -Naphthenic 30 3.8 (0.8) 6.3 - 2.2 - 5.1 - 4.2 - -0.5 (0.2) 0.9 - 0.5 - 0.7 - 0.9 -Paraffinic 30 -0.2 (0.2) 0.2 - 0.3 - 1.7 - 1.1 - -0.7 (0.0) 1.8 - 1.0 - 0.8 - 1.8 -FPRL oil 0 -2.5 - 0.0 - 8.9 - 1.5 - 1.5 - -1.0 - -0.9 - -0.8 - -0.4 - 0.9 -
Ketone Bottoms 0 2.7 - 2.9 - 2.3 - 3.6 - 2.8 - 2.1 - 2.2 - 1.9 - 1.1 - 1.1 -
9.6Not Weathered Weathered
G. trabeum
P. placenta
9.6 0 2.4 4.8 7.2
No Fungus
Diesel
Diesel
Diesel
7.2
Table III-9. Mass losses of Douglas-fir sapwood treated with pentachlorophenol dissolved in carriers and exposed to decay fungi in the AWPA E10 soil block test.
Fungus CarrierBiodiesel
(%)
Target Retentions (kg/m3)0 2.4 4.8

Oregon State University Utility Pole Research Cooperative _________________________________________________________
77
G. trabeum
UTC 0 25.7 (2.9) - - - - - - - - 32.9 (9.0) - - - - - - - -
UTC 0 27.9 (7.3) - - - - - - - - 31.1 (8.0) - - - - - - - -0 18.6 (2.9) 3.5 (1.3) 5.4 (1.1) 4.5 (1.2) 4.7 (0.9) 31.7 (9.6) 0.2 (0.2) 0.4 (0.1) 0.6 (0.1) 1.0 (0.1)10 8.5 (2.3) 3.6 (0.9) 3.9 (0.7) 3.5 (0.7) 3.2 (0.6) 31.9 (2.4) 0.0 (0.4) -0.5 (0.1) -0.6 (0.2) 0.0 (0.2)30 14.1 (3.0) 5.4 (2.9) 3.8 (0.7) 2.9 (0.4) 3.2 (0.9) 13.0 (4.1) 13.8 (10.0) 2.3 (2.2) 0.4 (0.3) 2.1 (2.9)50 10.5 (2.5) 7.4 (5.7) 2.8 (1.0) 2.4 (0.5) 3.1 (1.6) 17.9 (4.9) 10.0 (5.1) 10.9 (4.8) 6.9 (2.5) 7.5 (4.7)
100 7.3 (5.9) 5.3 (1.8) 6.2 (3.5) 3.0 (1.8) 3.1 (4.0) 16.1 (3.5) 9.9 (5.6) 0.6 (1.0) 1.3 (0.9) 0.5 (1.1)UTC 0 41.0 (8.3) - - - - - - - - 48.5 (10.7) - - - - - - - -
0 32.8 (4.7) 4.6 (0.9) 5.5 (1.0) 5.3 (0.6) 4.1 (0.5) 50.5 (4.5) 11.1 (8.6) 0.6 (0.1) 1.1 (0.9) 1.1 (0.5)10 24.7 (4.4) 6.9 (2.4) 4.3 (0.7) 3.7 (0.5) 3.5 (0.7) 45.7 (3.9) 16.3 (6.9) 8.4 (8.9) 1.6 (2.4) 0.6 (0.2)30 27.4 (2.2) 5.8 (3.1) 6.1 (3.1) 4.8 (1.9) 3.6 (0.9) 37.8 (7.1) 25.5 (5.5) 12.0 (10.0) 7.7 (1.5) 3.2 (4.6)50 21.0 (5.6) 11.6 (7.5) 8.0 (5.7) 3.5 (1.7) 1.7 (1.1) 32.5 (3.4) 21.9 (5.8) 11.8 (6.3) 2.3 (1.6) 2.2 (2.9)
100 17.4 (7.5) 8.7 (3.5) 4.1 (1.9) 3.4 (3.6) 3.1 (2.2) 20.0 (3.2) 20.6 (2.2) 6.1 (4.0) 8.4 (5.0) 1.1 (1.4)UTC 0 -0.6 (0.9) - - - - - - - - - - - - - - - - - -
0 1.3 (0.0) 1.4 - 4.7 - 4.9 - 3.6 - -0.9 (0.1) -0.7 - 0.2 - 0.3 - 0.4 -10 2.4 (1.5) 3.2 - 4.1 - 3.9 - 5.5 - -1.3 (0.0) -1.0 - -1.0 - -0.8 - -0.1 -30 2.3 (0.8) 1.6 - 3.0 - 2.5 - 4.2 - -0.9 (0.0) -0.7 - -0.8 - -0.9 - -0.7 -50 1.3 (0.7) 0.5 - -0.6 - 1.9 - 3.5 - -0.8 (0.0) -0.8 - -0.9 - -1.1 - -0.7 -
100 0.8 (1.0) -0.3 - -1.2 - -0.2 - -0.9 - -0.4 (0.1) -1.8 - -0.6 - 0.2 - 0.1 -
1.33 1.66Target Retentions (kg/m3)
Table III-10. Mass losses of Douglas-fir sapwood treated with copper naphthenate dissolved in carriers and exposed to decay fungi in the AWPA E10 soil block test.
Not Weathered Weathered0 0.66 0.99 1.33 1.66 0 0.66 0.99
P. placenta Diesel
A. xantha
No Fungus
Fungus CarrierBiodiesel
(%)
Diesel
Diesel

34th Annual Report 2014 ___________________________
Figure III-9. Weight losses of Douglas-fir sapwood blocks treated to different retentions of penta in diesel and tested directly or tested after weathering against G. trabeum using procedures described in AWPA Standard E10.
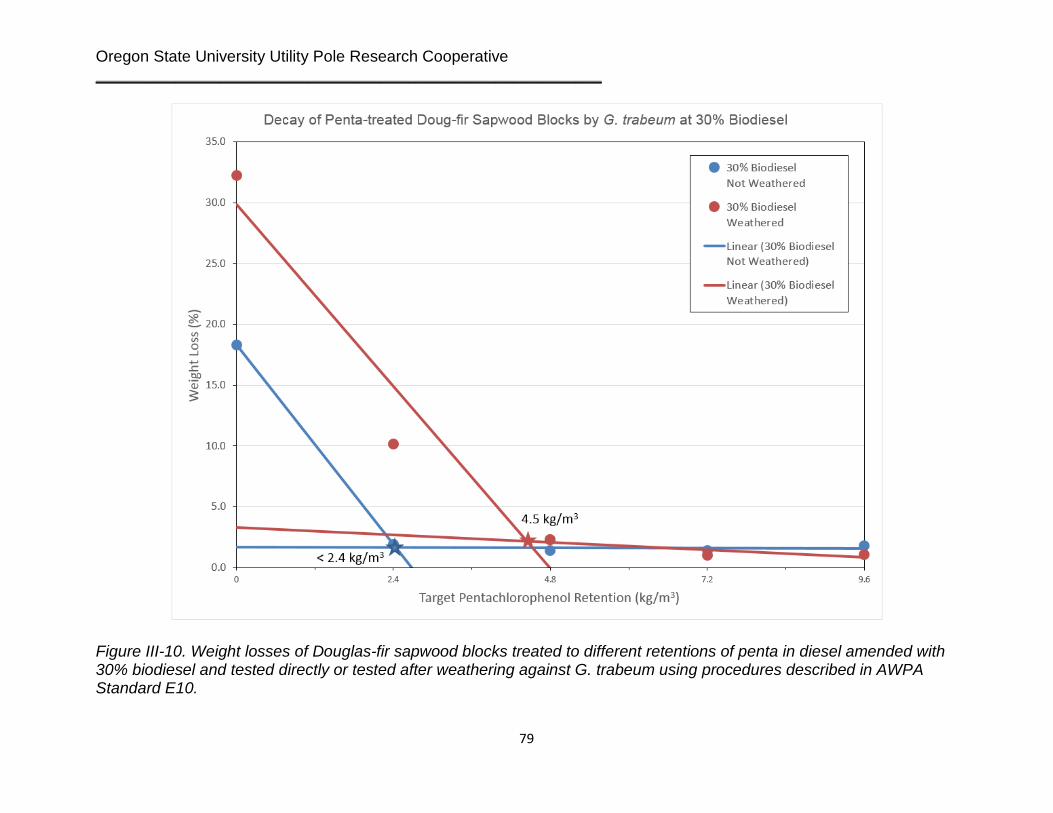
Oregon State University Utility Pole Research Cooperative _________________________________________________________
79
Figure III-10. Weight losses of Douglas-fir sapwood blocks treated to different retentions of penta in diesel amended with 30% biodiesel and tested directly or tested after weathering against G. trabeum using procedures described in AWPA Standard E10.

34th Annual Report 2014 ___________________________
Figure III-11. Weight losses of Douglas-fir sapwood blocks treated to different retentions of penta in diesel amended with 50% biodiesel and tested directly or tested after weathering against G. trabeum using procedures described in AWPA Standard E10.

Oregon State University Utility Pole Research Cooperative _________________________________________________________
81
Figure III-12. Weight losses of Douglas-fir sapwood blocks treated to different retentions of penta in diesel amended with 70% biodiesel and tested directly or tested after weathering against G. trabeum using procedures described in AWPA Standard E10.

34th Annual Report 2014 ___________________________
Figure III-13. Weight losses of Douglas-fir sapwood blocks treated to different retentions of penta in ketone bottoms and tested directly or tested after weathering against G. trabeum using procedures described in AWPA Standard E10.

Oregon State University Utility Pole Research Cooperative _________________________________________________________
83
Figure III-14. Weight losses of Douglas-fir sapwood blocks treated to different retentions of copper naphthenate in diesel amended with 30% biodiesel and tested directly or tested after weathering against P. placenta using procedures described in AWPA Standard E10.
Target Copper Retention (kg/m3)

34th Annual Report 2014 ___________________________
Figure III-15. Weight losses of Douglas-fir sapwood blocks treated to different retentions of copper naphthenate in diesel amended with 50% biodiesel and tested directly or tested after weathering against P. placenta using procedures described in AWPA Standard E10.
Target Copper Retention (kg/m3)

Oregon State University Utility Pole Research Cooperative _________________________________________________________
85
Figure III-16. Weight losses of Douglas-fir sapwood blocks treated to different retentions of copper naphthenate in diesel amended with 100% biodiesel and tested directly or tested after weathering against P. placenta using procedures described in AWPA Standard E10.
Target Copper Retention (kg/m3)

34th Annual Report 2014 ___________________________
Figure III-17. Weight losses of Douglas-fir sapwood blocks treated to different retentions of copper naphthenate in diesel and tested directly or tested after weathering against A. xantha using procedures described in AWPA Standard E10.
Target Copper Retention (kg/m3)

Oregon State University Utility Pole Research Cooperative _________________________________________________________
87
Figure III-18. Weight losses of Douglas-fir sapwood blocks treated to different retentions of copper naphthenate in diesel amended with 10% biodiesel and tested directly or tested after weathering against A. xantha using procedures described in AWPA Standard E10.
Target Copper Retention (kg/m3)

34th Annual Report 2014 ___________________________
Figure III-19. Weight losses of Douglas-fir sapwood blocks treated to different retentions of copper naphthenate in diesel amended with 30% biodiesel and tested directly or tested after weathering against A. xantha using procedures described in AWPA Standard E10.
Target Copper Retention (kg/m3)
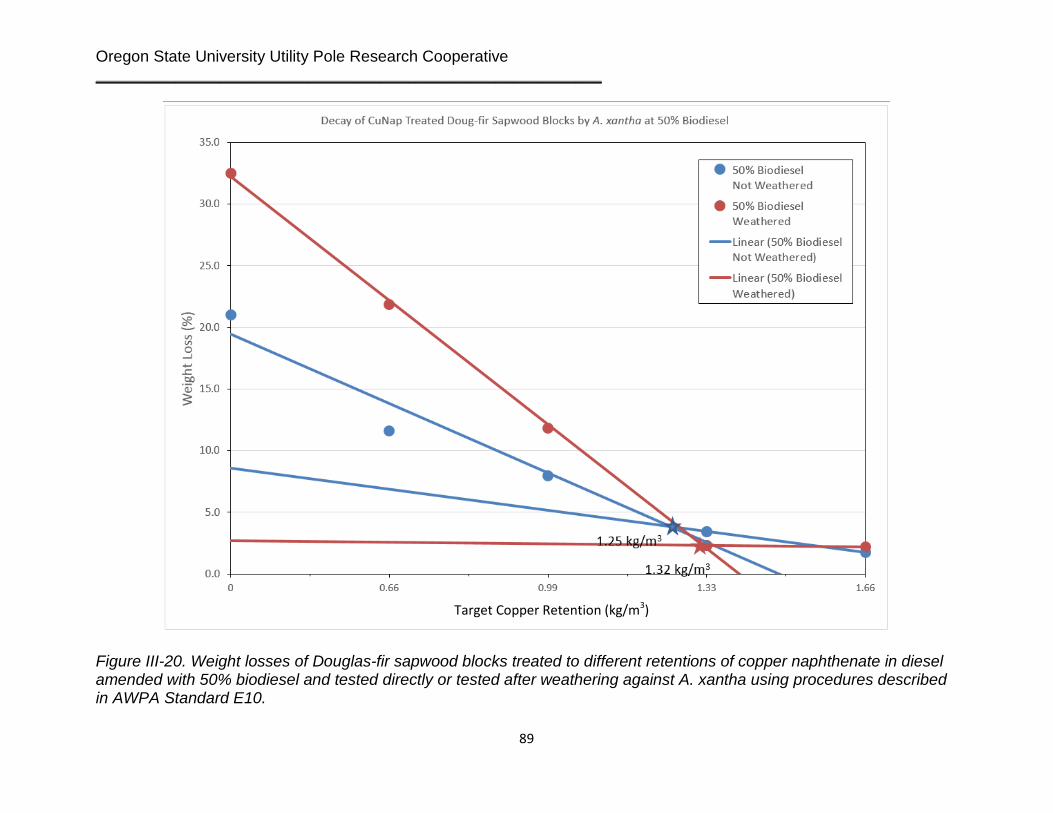
Oregon State University Utility Pole Research Cooperative _________________________________________________________
89
Figure III-20. Weight losses of Douglas-fir sapwood blocks treated to different retentions of copper naphthenate in diesel amended with 50% biodiesel and tested directly or tested after weathering against A. xantha using procedures described in AWPA Standard E10.
Target Copper Retention (kg/m3)

34th Annual Report 2014 ___________________________
Figure III-21. Weight losses of Douglas-fir sapwood blocks treated to different retentions of copper naphthenate in diesel amended with 100% biodiesel and tested directly or tested after weathering against A. xantha using procedures described in AWPA Standard E10.
Target Copper Retention (kg/m3)

Oregon State University Utility Pole Research Cooperative _________________________________________________________
91
F. Performance of Fire Retardant Treatments
Wildland fire continues to be a major concern for utilities across the Western U.S. and Canada. Decades of fire suppression have resulted in densely packed forests with high levels of combustibles that create an extreme fire hazard. The location of overland transmission lines through these forests creates a strong need for effective fire retardants.
In previous tests, we have evaluated the effectiveness of various fire retardant treatments on pole sections buried in the ground. While these tests were useful, they were highly variable. Our time frame for burning was limited to the end of the dry season and any changes in relative humidity or small amounts of rainfall could markedly alter results. As a result, our ability to evaluate fire retardants has been limited.
Several years ago, we explored using a portable burner in place of straw to deliver a measured level of heat to the poles. This approach allowed us to control the rate of fire and, with prior conditioning under low relative humidity conditions, to test poles with extremely low moisture contents typical of wood at the end of a dry summer. Our results were promising, but not completely reproducible. We have worked to make our method relatively simple so that it does not require highly specialized equipment. We are aware of at least one other effort to develop an ASTM standard for this purpose, but the equipment is elaborate and, at present, the test procedures would be limited to one or two facilities in the U.S. This would preclude more extensive testing. This past year, we worked to further develop our method.
Table III-11. Pentachlorophenol retentions in the middle sections of Douglas-fir sapwood stakes treated using different combinations of solvents. Pentachlorophenol
Carrier Biodiesel
(%) Target retentions (kg/m3)
0 2.4 4.8 7.2 9.6
Diesel
0 n/a - n/a - n/a - - - - - 30 -0.22 (0.08) 2.15 (0.27) 3.02 (0.64) 5.65 (0.76) 7.69 (1.45) 50 -0.20 (0.07) 1.91 (0.42) 3.76 (0.35) 4.71 (1.29) 6.86 (0.53) 70 -0.14 (0.29) 1.40 (0.25) 3.46 (0.78) 6.32 (0.81) 8.77 (1.93)
Aromatic oil 0 -0.18 (0.21) 3.14 (1.70) 4.88 (0.80) 7.74 (0.72) 9.96 (2.08) Naphthenic 30 0.07 (0.43) 1.94 (0.19) 3.72 (0.62) 5.92 (0.50) 7.17 (0.85) Paraffinic 30 0.20 (0.45) 1.44 (0.05) 3.62 (0.73) 5.48 (0.27) 7.01 (1.43) FPRL oil 0 0.19 (0.29) 3.11 (0.30) 4.17 (0.58) 1.56 (0.41) 8.30 (1.32)
Ketone Bottoms 0 0.29 (0.16) 1.58 (0.17) 3.27 (0.51) 5.99 (0.20) 7.85 (1.58) Water 0 0.0 - - - - - - - - -
aValues represent means of 5 analyses per treatment, while figures in parentheses represent one standard deviation.

34th Annual Report 2014 ___________________________
For the proposed test, freshly-treated, 1.3 m long penta-treated Douglas-fir pole cut-offs were obtained from a local treating plant. Increment cores were removed from each pole to measure penetration and retention. The initial testing utilized poles with no prior fire retardant treatment as well as pole sections with a polyurea wrap that is stapled or tacked to the pole.
Before testing, a 6 mm diameter thermocouple was inserted into the pole from the side opposite the flame to measure the temperature of the flame at the pole surface. The thermocouple was attached to a CR21X data logger that recorded temperature every 30 seconds.
Post sections were subjected to fire using a modified weed burner. A regulator controlled the flow of fuel and thus the size of the flame. Each post was placed in a stand approximately 115 mm from the torch so that the fire was in direct contact with an area approximately 10 by 60 mm wide on each pole (Figure III-22). A steel shield was placed behind the pole to reflect and magnify heating. Previous testing suggested that a fire exposure of approximately 5 minutes produced a degree of charring similar to that found in our most severe field fire test in 2008. Temperatures at the tip of the flame reached 890 C during the burn and thermocouples inserted into the post from the rear indicated pole interior temperatures approached 100 C after 1 minute. Internal pole temperatures were recorded during the 5 minute flame exposure.
At the conclusion of the torch exposure, samples were allowed to burn for 20 minutes. After cooling, pole sections were weighed and the damage was assessed by measuring the total area charred, the maximum depth of char and the average char depth in the affected area. The results were used to determine if coatings and wraps affected the flammability of penta-treated wood.
The preliminary trials involved 3 poles; two non-treated and one with a polyurea coating. The polyurea coating was stapled to the pole section with the seam at the back, away from the flame.
The non-coated samples reached 500 and 650 C over the 5 and 10 minute burns, respectively. While these temperatures were somewhat lower than those achieved in the earlier tests, they are well above the ignition temperature for wood (~252 C). The surface temperature of the polyurea wrapped pole had a maximum of just over 100 C. This suggests that the coating acted as a sacrificial shield.
The test procedures were generally reproducible; however, there were some variations in weather conditions that would need to be addressed (Figures III-23 to III-26). The 5 minute burn on the non-coated sample was performed on a very dry day, while the 10 minute burn and the test of the coated sample were performed on a day with more wind and humidity. It would be difficult to completely control for these conditions unless the

Oregon State University Utility Pole Research Cooperative _________________________________________________________
93
Figure III-22. Temperatures on the surface of poles subjected to a 5 minute burn test. Samples 271 and 272 were not protected and were subjected to 5 and 10 minute burns, respectively, while sample 273 had a polyurea shield and was subjected to a 5 minute burn.
tests were performed in a large climate controlled chamber. This would markedly complicate the test. It may, however, be possible to alter heating patterns to account for the humidity differences and to better shield the flame to avoid wind effects.
The depth of char increased on the surface directly exposed to the flame on the non-coated poles when flame time was increased from 5 to 10 minutes; however, the char depth on the back of the pole away from the direct flame was slightly lower on the pole subjected to the longer fire (Table III-12). The coated pole experienced considerably less charring on the flame exposed surface, although the coating had completely burned during the test. The back of the coated pole experienced charring similar to that found with the 10 minute burn on a non-coated pole. The coating rapidly degraded in the area subjected to direct flame and this appeared to open up the interior to additional heating, creating a chimney effect that shifted heat towards the back of the pole.
These initial tests validated our burning methodology. We will continue to test non-coated poles to more completely refine the test parameters before beginning to evaluate other coated systems.
Table III-12 Depth of charring on pentachlorophenol treated Douglas-fir poles with and without a protective coating and subjected to 5 or 10 minutes of flame.
Pole # Coating Burn Time (minutes)
Depth of char (mm) Front Back
271 No 5 5 8 272 No 10 10 5 273 Yes 5 3 10
0
100
200
300
400
500
600
700
0.0 5.0 10.0 15.0 20.0 25.0 30.0 35.0
Tem
pera
ture
°C
Time (min.)
Surface Temperature of Poles During Fire Test
271
272
273

34th Annual Report 2014 ___________________________
Figure III-23. Non-coated pole undergoing flame test.

Oregon State University Utility Pole Research Cooperative _________________________________________________________
95
Figure III-24. Non-coated pole continuing to burn after the flame was removed.
Figure III-25. Polyurea wrapped pole prior to application of fire.

34th Annual Report 2014 ___________________________

Oregon State University Utility Pole Research Cooperative _________________________________________________________
97
Figure III-26. Polyurea wrapped pole shortly after testing and then 20 minutes after the flame was removed showing extensive charring and loss of the coating.

34th Annual Report 2014 ___________________________
Literature Cited
American Wood Protection Association. 2012. Standard U1-12. Use Category System: User specification for treated wood. Book of Standards. AWPA, Birmingham, Alabama. Pages 45-50.
American Wood Protection Association. 2012. Standard A6-09. Standard method for the determination of retention of oil-type preservatives from small samples. AWPA, Birmingham, Alabama. Pages 221-223.
American Wood Protection Association. 2012. Standard E26 Standard field test for evaluation of wood preservatives intended for interior applications (UC1 and UC2): Termite ground proximity method. In: AWPA Book of Standards, AWPA, Birmingham, Alabama. Pages 514-520.
Anagnost, S.E., R.E. Mark, and R.B. Hanna. 2000. Utilization of soft rot cavity orientation for the determination of microfibril angle. Part 1. Wood and Fiber Science 32:81-87.
Baecker, A.A.W. 1993. A non-pressure method of protection based upon the hurdle theory to control the spectrum of internal environment. International Research Group on Wood Preservation Document No IRG/WP/2319, Stockholm, Sweden.
Baecker, A.A.W. and M. Behr. 1995. Biostatic film as a primary treatment against pole failure in soil. International Research Group on Wood Preservation Document No IRG/WP/95-40053, Stockholm, Sweden.
Behr, M. and A.A.W.Baecker. 1994. Quantification of creosote migration down wooden poles and the prevention of its depletion during flood irrigation. . International Research Group on Wood Preservation Document No IRG/WP/94-50032, Stockholm, Sweden.
Behr, M.R., G.D. Shelver, and A.A.W. Baecker. 1997. Transmission poles with sub-standard retentions protected by Field Liners outperform standard poles in service. International Research Group on Wood Preservation Document No IRG/WP/97-40095, Stockholm, Sweden.
Behr, M.R., G.D. Shelver, and A.A.W. Baecker. 1996. Field Liners TM prevent creosote migration from transmission poles during service. International Research Group on Wood Preservation Document No IRG/WP/96-40067, Stockholm, Sweden.
Berlyn, G.P. and J.P. Miksche. 1976. Botanical microtechnique and cytochemistry. Iowa State University Press, Ames, Iowa. 326 p.
Butcher, J.A. 1975. Factors affecting decay of softwoods by soft rot fungi. Record 1975 Annual Convention British Wood Preserver’s Association 10 p.

Oregon State University Utility Pole Research Cooperative _________________________________________________________
99
Findlay, W.P.K. and J.G. Savory. 1950. Breakdown of timber in water cooling towers. Intl. Botanical Congress Proceedings 7:315-316.
Fris-Hansen, H. 1975. Studies and experiences of occurrence and development of soft rot in salt-treated poles of pine (Pinus sylvestris) installed in Swedish transmission pole lines in the years 1940-1954. Swedish Wood Preservation Institute Nr 117. Stockholm, Sweden.
Graham, R.D. 1973. History of wood preservation. In: Wood deterioration and its prevention by preservative treatments (D.D. Nicholas, Ed). Syracuse University Press, Syracuse, NY. Volume 1, pages 1-32.
Graves, H. 1977. An illustrated comment on the soft rot problem in Australia and Papua New Guinea. Holzforschung 31:71-79.
Lebow, S.T. and J.J. Morrell. 1995. Interactions of ammoniacal copper zinc arsenate (ACZA) with Douglas-fir. Wood and Fiber Science 27:105-118.
Leightley, L.E. and R.A. Eaton. 1977. Mechanisms of decay of timber by aquatic microorganisms. Proceedings British Wood Preserving Association 9:1-26.
Levy, J.F. 1965. The soft rot fungi: their mode of action and significance in the degradation of wood. Advances in Botanical Research 2:323-357.
Morrell, J.J. 2012. Wood Pole Maintenance Manual: 2012 Edition. Research Contribution 51, Forest Research Laboratory, Oregon State University, Corvallis, OR.
Morrell, J.J., R.D. Graham, M.E. Corden, C.M. Sexton, and B.R. Kropp. 1989. Ammonium bifluoride treatment of air-seasoning Douglas-fir poles. Forest Products Journal 39(1):51-54.
Morrell, J.J., M.A. Newbill, and C.M. Sexton. 1991. Basidiomycete colonization of Douglas-fir poles after polyborate treatments. Forest Products Journal 41(6):28-30.
Morrell, J.J., D.J. Miller, and P.F. Schneider. 1999. Service life of treated and untreated fence posts: 1996 Post farm report. Research Contribution 26, Forest Research Laboratory, Oregon State University, Corvallis, OR. 24 p.
Nilsson, T. 1973. Studies on wood degradation and cellulolytic activity of micro-fungi. Studia Forestalia Suecica Nr 104. Stockholm, Sweden.
Rhatigan, R.G., C.M. Freitag, and J.J. Morrell. 2002. Performance of ammoniacal copper arsenate treated Douglas-fir poles. Proceedings American Wood Preservers’ Association 98:52-56.

34th Annual Report 2014 ___________________________
Savory, J.G. 1954. Breakdown of timber by Ascomycetes and Fungi Imperfecti. Annals of Applied Biology 41:336-347.
Schacht, 1950. Uber eigentumliche, bisher noch nicht beobachtete Erscheinigungen in der Verdickungsschichten gewisse Holzzellen. Botan. Zeitung 8.
Scheffer, T.C. 1971. A climate index for estimating potential for decay in wood structures above ground. Forest Products Journal 21(10):25-31.
Scheffer, T.C. and J.J. Morrell. 1997. Ability of polyethylene boots to protect the below ground portion of small stakes against decay. Forest Products Journal 47(5):42-44.
Siau, J.F. 1995 Wood: Influence of moisture on physical properties. Virginia Polytechnic Institute and State University, Blacksburg, VA. 227 pages.
Zabel, R.A., F.F. Lombard, C.J.K. Wang, and F.C. Terracina. 1985. Fungi associated with decay in treated southern pine utility poles in the eastern United States. Wood and Fiber Science 17:75-91.
Zabel, R.A., C.J. K. Wang, and S.E. Anagnost. 1991. Soft rot capabilities of the major microfungi isolated from Douglas-fir poles in the Northeast. Wood and Fiber Science 23:220-237.

Oregon State University Utility Pole Research Cooperative _________________________________________________________
101
OBJECTIVE IV
PERFORMANCE OF EXTERNAL GROUNDLINE PRESERVATIVE SYSTEMS While preservative treatments provide excellent long-term protection against fungal attack in a variety of environments, there are a number of service applications where treatments eventually lose efficacy. Soft rot fungi can then decay the wood surface, gradually reducing the effective circumference of the pole until replacement is required. In these instances, pole service life can be markedly extended by periodic belowground application of external preservative pastes that eliminate fungi near the wood surface and provide a protective barrier against fungal re-invasion from surrounding soil.
For many years, pastes incorporated a diverse chemical mixture including penta, potassium dichromate, creosote, fluoride and an array of insecticides. In the 1980s, the U.S. Environmental Protection Agency reexamined pesticide registrations and designated many compounds as restricted use. This action encouraged utilities and chemical suppliers to examine alternative preservatives. While these chemicals had prior applications as wood preservatives, there was little data supporting their use as preservative pastes. This lack of data led to the establishment of Objective IV. The primary goal of this objective is to assess laboratory and field performance of external preservative systems to protect belowground portions of wood poles.
A. Previous External Groundline Treatment Tests Over the past 20 years, we established a number of field trials for external groundline preservative pastes on pole stubs at our Peavy Arboretum field site or on poles in active utility lines. Most of these trials have been completed. A trial summary can be found in Table IV-1 along with references to the annual report in which results are presented.
B. Performance of a Boron/Fluoride Paste on Douglas-fir, Western Redcedar, and Southern Pine Poles
Preservative treatments provide an excellent barrier against fungal attack in soil contact, but, over time, the effectiveness of these treatments declines to the point where external decay can develop. This damage is often arrested by excavating to a depth of 300 to 450 mm around a structure, scraping away any soil/damaged wood, and applying a supplemental preservative. The treatment is covered with a barrier and the hole is back-filled. Supplemental systems often contain several components including some that coat the surface to prevent renewed attack and others that diffuse inward from the surface to arrest fungal growth already present in the wood (Love et al., 2004). Most external preservative systems used in North America contain copper as the surface barrier and either boron or fluoride as the diffusible component. Generally, these systems have
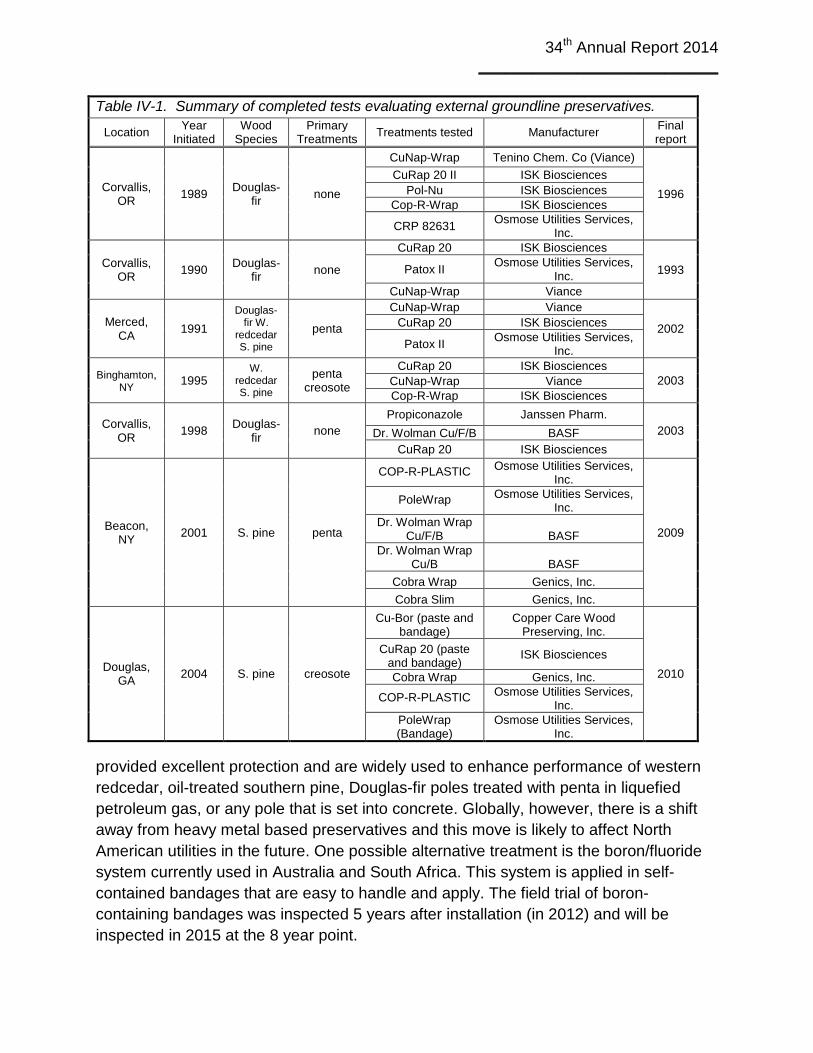
34th Annual Report 2014 ___________________________
Table IV-1. Summary of completed tests evaluating external groundline preservatives.
Location Year Initiated
Wood Species
Primary Treatments Treatments tested Manufacturer Final
report
Corvallis, OR 1989 Douglas-
fir none
CuNap-Wrap Tenino Chem. Co (Viance)
1996 CuRap 20 II ISK Biosciences
Pol-Nu ISK Biosciences Cop-R-Wrap ISK Biosciences
CRP 82631 Osmose Utilities Services, Inc.
Corvallis, OR 1990 Douglas-
fir none
CuRap 20 ISK Biosciences
1993 Patox II Osmose Utilities Services, Inc.
CuNap-Wrap Viance
Merced, CA 1991
Douglas-fir W.
redcedar S. pine
penta
CuNap-Wrap Viance
2002 CuRap 20 ISK Biosciences
Patox II Osmose Utilities Services, Inc.
Binghamton, NY 1995
W. redcedar S. pine
penta creosote
CuRap 20 ISK Biosciences 2003 CuNap-Wrap Viance
Cop-R-Wrap ISK Biosciences
Corvallis, OR 1998 Douglas-
fir none Propiconazole Janssen Pharm.
2003 Dr. Wolman Cu/F/B BASF CuRap 20 ISK Biosciences
Beacon, NY 2001 S. pine penta
COP-R-PLASTIC Osmose Utilities Services, Inc.
2009
PoleWrap Osmose Utilities Services, Inc.
Dr. Wolman Wrap Cu/F/B BASF
Dr. Wolman Wrap Cu/B BASF
Cobra Wrap Genics, Inc. Cobra Slim Genics, Inc.
Douglas, GA 2004 S. pine creosote
Cu-Bor (paste and bandage)
Copper Care Wood Preserving, Inc.
2010
CuRap 20 (paste and bandage)
ISK Biosciences
Cobra Wrap Genics, Inc.
COP-R-PLASTIC Osmose Utilities Services, Inc.
PoleWrap (Bandage)
Osmose Utilities Services, Inc.
provided excellent protection and are widely used to enhance performance of western redcedar, oil-treated southern pine, Douglas-fir poles treated with penta in liquefied petroleum gas, or any pole that is set into concrete. Globally, however, there is a shift away from heavy metal based preservatives and this move is likely to affect North American utilities in the future. One possible alternative treatment is the boron/fluoride system currently used in Australia and South Africa. This system is applied in self-contained bandages that are easy to handle and apply. The field trial of boron-containing bandages was inspected 5 years after installation (in 2012) and will be inspected in 2015 at the 8 year point.
Oregon State University Utility Pole Research Cooperative _________________________________________________________
103
C. Performance of External Groundline Treatments in Drier Climates External groundline preservatives are applied throughout the United States. We have previously established field trials in Oregon, California, Georgia and New York to assess the effectiveness of these systems under a range of environmental conditions. We have neglected to collect field performance data is drier climates. Conditions in these areas markedly differ from those in wetter climates. While soil moisture content near the surface may be low, subsurface moisture contents can be conducive to decay. Also, soil conditions may be more alkaline in arid climates. These characteristics may alter the performance of supplemental groundline treatments.
In order to assess this possibility, western pine, southern pine, western redcedar and Douglas-fir poles in both the Salt River Project and Arizona Public Service systems were selected for study (Table IV-2). The pole population consisted of poles treated with creosote or penta in AWPA Solvent Types A, B, and D. Solvent Types B and D are both volatile systems that evaporate from wood after treatment, leaving a clean and dry surface, while Solvent P9 Type A remains in the pole. There has been a long history of performance issues related to Solvent Types B and D use. The absence of residual solvent tends to render penta less effective against soft rot fungi and these poles tend to experience substantial surface degradation in relatively short times after installation. While neither Solvent Types B nor D are still being used to treat poles, hundreds of thousands of poles that were initially treated with these systems remain in service.
Seven treatments (Table IV-3) were applied to an equal number of poles of each species/solvent combination when possible. The exception was Bioguard Tri-Bor paste, which was applied only to Douglas-fir poles treated with penta in Solvent P9 type A. The area around each pole was excavated to a depth of 600 mm, and any decayed surface wood was removed. Pole circumference was measured to ensure that each pole retained sufficient section area to be kept in the system. Small pieces of surface wood were then removed from poles and placed in plastic bags for culturing. These wood samples were placed on malt extract agar in petri dishes and any fungi growing from the wood were examined microscopically. The goal was to characterize the surface flora present at the time of treatment and compare the flora over the next few years.
The systems were all supplied in paste form. The circumference of each pole was measured at groundline. The amount of paste applied to each pole was calculated using the products unit weight and recommended paste thickness (Table IV-3). The paste bucket was weighed and the paste was applied to poles from 75 mm above to 460 mm below groundline using the calculated paste dosage. The bucket was reweighed and the difference between initial and final weight was used to ensure that the calculated paste coverage per unit area was achieved. Pastes were covered with the recommended barrier and soil was replaced around the pole.

34th Annual Report 2014 ___________________________
Table IV-2. Characteristics of poles receiving external preservative treatments in the Phoenix, Arizona area. APS = Arizona Public Service, SRP = Salt River Project.
Species Primary Treatment Year Class/Length Site Treatment Fungal isolationsb
(before treatment)
SP penta 1997 1/40 APS Osmose EPa Non-decay
WP gas 1986 5/40 APS MP400-EXT
WP gas 1985 5/40 APS Bioguard
DF gas 1983 5/40 APS CuBor
WP gas 1983 5/40 APS Osmose EP Soft rot
WP gas 5/40 APS Control
WP gas 1983 5/40 APS COP-R-PLASTIC II
WP gas 1972 5/40 APS CuBor Soft rot
WP gas 1984 5/40 APS CuRap 20
WP gas 1981 5/40 APS CuRap 20
WP gas 1981 5/40 APS MP400-EXT
WP gas 1972 5/40 APS Osmose EP Soft rot
WP gas 1972 5/40 APS COP-R-PLASTIC II
WP gas 1972 5/40 APS Bioguard Soft rot
WP gas 1983 5/40 APS CuRap 20
WP gas 1983 5/40 APS CuRap 20
WP gas 1984 5/40 APS CuBor Decay
WP gas 1984 5/40 APS COP-R-PLASTIC II
DF gas 1984 5/40 APS Bioguard
DF gas 1962 5/35 APS MP400-EXT mold
DF creosote 1962 5/35 APS Osmose EP Soft rot
WP gas 1984 5/40 APS CuBor
WP gas 1984 5/40 APS COP-R-PLASTIC II
WP gas 1984 5/40 APS Bioguard
DF creosote 1962 5/35 APS CuRap 20 Decay and mold
DF creosote 1962 5/35 APS COP-R-PLASTIC II Decay and mold
DF creosote 1962 5/35 APS MP400-EXT Soft rot
DF creosote 1962 5/35 APS Control
WRC creosote 4/35 APS Bioguard WRC creosote 4/35 APS CuBor mold WRC penta 1987 5/40 APS Control Non-decay
WRC penta 1987 5/40 APS Osmose EP
WRC penta 1987 5/40 APS MP400-EXT Decay and soft rot
WP creosote 1989 5/40 APS Osmose EP mold
WP gas 1986 5/40 APS MP400-EXT
WP gas 1986 5/40 APS COP-R-PLASTIC II

Oregon State University Utility Pole Research Cooperative _________________________________________________________
105
Table IV-2 cont. Characteristics of poles receiving external preservative treatments in the Phoenix, Arizona area. APS = Arizona Public Service, SRP = Salt River Project.
Species Primary Treatment Year Class/Length Site Treatment Fungal isolationsb
(before treatment)
WP gas 1986 5/40 APS CuBor
DF gas 1986 5/40 APS CuRap 20
DF penta 1992 4/40 APS Bioguard
DF creosote 1992 4/40 APS Control
DF gas 1986 APS Control
WP gas 1986 5/40 APS Control
DF penta 2006 1/45 SRP MP400-EXT
DF penta 2002 3/45 SRP CuBor
DF penta 2002 3/45 SRP COP-R-PLASTIC II
DF penta 2001 3/45 SRP Bioguard
DF penta 2002 4/40 SRP Osmose EP
DF penta 2002 4/40 SRP CuRap 20
DF penta 2002 4/40 SRP MP400-EXT
DF penta 2002 4/40 SRP CuBor
DF penta 2001 4/40 SRP COP-R-PLASTIC II
DF penta 2001 4/40 SRP Bioguard
DF penta 2000 4/40 SRP Osmose EP
DF penta 1999 3/45 SRP Control
DF penta 1999 3/45 SRP CuRap 20
DF penta 1999 3/45 SRP MP400-EXT Soft rot
DF penta 1999 3/45 SRP Control
DF penta 1999 3/45 SRP CuBor
DF penta 1999 3/45 SRP COP-R-PLASTIC II
DF penta 1999 3/45 SRP Bioguard
DF penta 1999 3/45 SRP Osmose EP
DF penta 1999 3/45 SRP CuRap 20
DF penta 1999 3/40 SRP MP400-EXT
DF penta 2001 4/40 SRP Control
DF penta 2001 4/40 SRP CuBor
DF penta 1998 1/45 SRP COP-R-PLASTIC II
DF penta 1998 1/40 SRP Bioguard
DF penta 1998 4/40 SRP Osmose EP
DF penta 4/40 SRP Control Soft rot
DF penta 2002 1/40 SRP CuRap 20
DF penta 2002 4/40 SRP MP400-EXT
DF penta 2002 3/45 SRP Control
Table IV-2 cont. Characteristics of poles receiving external preservative treatments in the
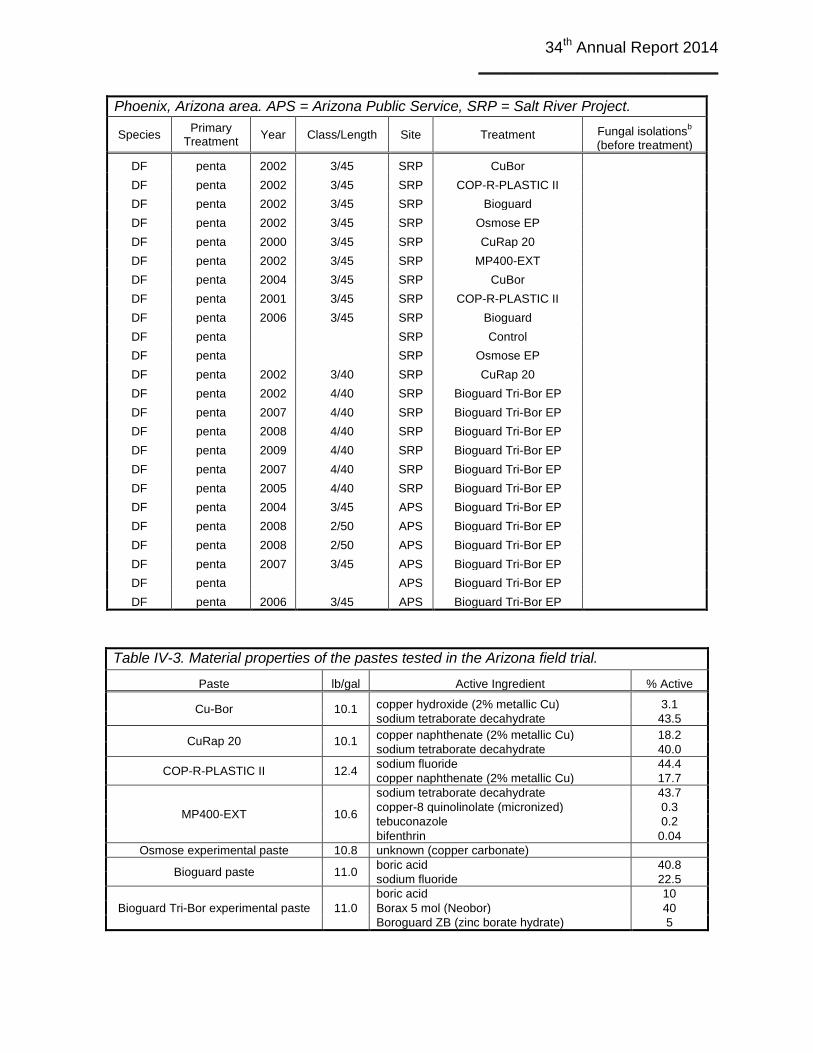
34th Annual Report 2014 ___________________________
Phoenix, Arizona area. APS = Arizona Public Service, SRP = Salt River Project.
Species Primary Treatment Year Class/Length Site Treatment Fungal isolationsb
(before treatment)
DF penta 2002 3/45 SRP CuBor DF penta 2002 3/45 SRP COP-R-PLASTIC II DF penta 2002 3/45 SRP Bioguard DF penta 2002 3/45 SRP Osmose EP DF penta 2000 3/45 SRP CuRap 20 DF penta 2002 3/45 SRP MP400-EXT DF penta 2004 3/45 SRP CuBor DF penta 2001 3/45 SRP COP-R-PLASTIC II DF penta 2006 3/45 SRP Bioguard DF penta SRP Control DF penta SRP Osmose EP DF penta 2002 3/40 SRP CuRap 20 DF penta 2002 4/40 SRP Bioguard Tri-Bor EP DF penta 2007 4/40 SRP Bioguard Tri-Bor EP DF penta 2008 4/40 SRP Bioguard Tri-Bor EP DF penta 2009 4/40 SRP Bioguard Tri-Bor EP DF penta 2007 4/40 SRP Bioguard Tri-Bor EP DF penta 2005 4/40 SRP Bioguard Tri-Bor EP DF penta 2004 3/45 APS Bioguard Tri-Bor EP DF penta 2008 2/50 APS Bioguard Tri-Bor EP DF penta 2008 2/50 APS Bioguard Tri-Bor EP DF penta 2007 3/45 APS Bioguard Tri-Bor EP DF penta APS Bioguard Tri-Bor EP DF penta 2006 3/45 APS Bioguard Tri-Bor EP
Table IV-3. Material properties of the pastes tested in the Arizona field trial.
Paste lb/gal Active Ingredient % Active
Cu-Bor 10.1 copper hydroxide (2% metallic Cu) 3.1 sodium tetraborate decahydrate 43.5
CuRap 20 10.1 copper naphthenate (2% metallic Cu) 18.2 sodium tetraborate decahydrate 40.0
COP-R-PLASTIC II 12.4 sodium fluoride 44.4 copper naphthenate (2% metallic Cu) 17.7
MP400-EXT 10.6
sodium tetraborate decahydrate 43.7 copper-8 quinolinolate (micronized) 0.3 tebuconazole 0.2 bifenthrin 0.04
Osmose experimental paste 10.8 unknown (copper carbonate)
Bioguard paste 11.0 boric acid 40.8 sodium fluoride 22.5
Bioguard Tri-Bor experimental paste 11.0 boric acid 10 Borax 5 mol (Neobor) 40 Boroguard ZB (zinc borate hydrate) 5

Oregon State University Utility Pole Research Cooperative _________________________________________________________
107
The degree of chemical migration was assessed 17 or 30 months after treatment by excavating one side of each pole, removing a small section of external barrier (100 by 100 mm) 150 mm below groundline and scraping away excess paste. Wraps on poles damaged by animal gnawing (Figure IV-1) were noted wherever present. Two sections of shavings were removed with a 38 mm diameter Forstner bit; the first sample from the outer surface to about 6 mm and the second continuing in the same hole to about 12 mm. A portion of the shavings were briefly flamed and placed on malt extract agar in Petri plates to determine soft rot fungal presence. The remainder of the shavings were ground to pass a 20 mesh screen. One half was analyzed for copper and boron, if necessary, and the other half was analyzed for any organic preservative present. An additional six increment cores were removed from the exposed zone. The cores were segmented: 0-6, 6-13, 13-25, 25-50 and 50-75 mm from the surface. Cores from each zone were combined and ground to pass a 20 mesh screen. It was necessary to combine wood from the 0-6 and 6-16 mm zones from several poles in a treatment to accumulate sufficient material for copper analysis. Wood from three poles from the same utility was combined for these zones resulting in two copper analyses per treatment. The resulting wood samples were analyzed for residual chemical using the most appropriate method. Boron was analyzed by the Azomethine-H method while copper was analyzed by x-ray fluorescence spectroscopy (XRF) or inductively-coupled plasma mass spectroscopy (ICP). Supplemental analysis of wood for boron by ICP was well correlated with the Azomethine-H analyses. We analyzed both cores and the shavings for copper and boron in order to determine whether the two sampling methods produced similar values. Bifenthrin was analyzed by gas chromatography-mass spectrometry (GC-MS), while tebuconazole was analyzed by high performance liquid chromatography (HPLC). The results have been expressed several ways because chemical distribution differed slightly with wood species and original treatment differences among the two utilities.
Figure IV-1. Poles in the APS system after excavation showing evidence of animal gnawing on the barrier bandage.

34th Annual Report 2014 ___________________________
Fluoride levels in poles treated with either Bioguard or COP-R-PLASTIC II (CRP II) 17 months after treatment were both above the threshold for protection against internal fungal attack in the outer 13 mm (0.15% wt/wt), and then declined with distance from the surface (Figure IV-2, Table IV-4). Fluoride levels were near the threshold in APS poles in the 13 to 25 mm assay zone 17 months after treatment, but were below the threshold further inward (Figure IV-3). Fluoride levels in Bioguard treated poles were slightly higher in the outer assay zone in APS poles but lower in SRP poles, although differences were not large. Levels further inward were below the threshold in poles from both utilities, suggesting that fluoride in Bioguard was not contributing markedly to performance. Fluoride has the ability to migrate into wood with moisture and eventually, as previous test results suggest, should become evenly distributed within pole cross sections. Data from Arizona suggests that this process is occurring more slowly under drier conditions.
In addition to different fluoride treatment levels, there appeared to be differences in levels by utility. Bioguard treatments were higher in APS poles (Figure IV-4). It is unclear why such differences might develop, although initial treatment and species may to contribute. SRP poles were all Douglas-fir penta in oil while APS poles were pine, western redcedar and Douglas-fir variously treated with creosote and penta in both oil and liquefied petroleum gas. It is possible that carriers influenced movement, although it is unclear why they might do so differentially. We will continue to monitor this test to
determine if these differences are real, or merely the result of natural pole variation.
Table IV-4. Fluoride levels in poles of various species 17 or 30 months after application of Bioguard or COP-R-PLASTIC II.1
Treatment Months Utility Fluoride Levels (% wt/wt)
Distance from the surface (mm) (0-13) (13-25) (25-50) (50-75)
Bioguard 17 APS 0.47 0.13 0.04 0.03
SRP 0.26 0.09 0.02 0.01
30 APS 0.63 0.07 0.00 0.00 SRP 0.17 0.07 0.03 0.01
COP-R- PLASTIC II
17 APS 0.19 0.01 0.00 0.00 SRP 0.25 0.09 0.00 0.00
30 APS Not Sampled SRP 1Numbers in bold are above the toxic threshold of 0.50% F for the outer zone and 0.15 for the three inner zones.

Oregon State University Utility Pole Research Cooperative _________________________________________________________
109
Analysis of boron from shavings or increment cores in the outer 13 mm did not differ markedly with treatment (Figure IV-5, Table IV-5). As a result, we elected to use core results for further discussion. Two different thresholds were used for assessing concentration. The higher threshold (0.275% BAE) was used in the 0 to 13 mm assay zone. Wood in this zone must be protected from soil inhabiting fungi adjacent to the pole; these fungi are also harder to control. The lower threshold (0.1% BAE) was used in the interior zones because this wood has a lower risk of fungal attack, typically from basidiomycetes more sensitive to boron.
Boron levels in poles treated with six different preservative pastes were at or above the threshold for protection against external fungal attack in the outer 25 mm, 17 months after application (Figure IV-6, 7). Boron levels were below the threshold in this zone in SRP poles 30 months after application of CuRap 20, but above that level for APS poles. Boron levels in SRP poles 13 to 25 mm inward were above the threshold, using the lower threshold target. Similar to fluoride, chemical levels differed between utilities. It is unclear why, but initial pole treatment is likely a factor. Boron levels at 50 mm declined, but were still above the threshold for protection against internal fungal attack for most treatments. This suggests that boron is moving short distances into poles; however, not as deeply as it might in wetter climates. Boron levels at 50 to 75 mm appear to be limited. Expectations for boron movement in this environment may need to be shifted, although lack of boron migration deeper in the pole in the 0 to 450 mm belowground zone suggests limited moisture availability for diffusion. Reduced moisture levels within the pole also suggests less of a need for preservatives. It is important to remember that moisture regimes in poles in this region are elevated further below the groundline. The ability to deliver protective levels of chemicals into this zone warrants further effort.

34th Annual Report 2014 ___________________________
Figure IV-2. Fluoride levels with distance inward from the surface in Douglas-fir, western redcedar and pine poles 17 or 30 months after treatment with Bioguard when all species are combined. Horizontal lines indicate fluoride thresholds for the outer zone (red) and inner three zones (brown).
Figure IV-3. Fluoride levels with distance inward from the surface in Douglas-fir, western redcedar and pine poles 17 or 30 months after treatment with Bioguard in a stacked bar
0.0
0.1
0.2
0.3
0.4
0.5
0.6
0.7
0.8
Bioguard 17 Months Bioguard 30 Months
Fluo
ride
(% F
)
(0-13)(13-25)(25-50)(50-75)
0.00
0.10
0.20
0.30
0.40
0.50
0.60
0.70
0.80
Bioguard 17 Months Bioguard 30 Months
Fluo
ride
(% F
)
(50-75)
(25-50)
(13-25)
(0-13)

Oregon State University Utility Pole Research Cooperative _________________________________________________________
111
graph when all species are combined showing the difference in total fluoride in the assay zones.
Figure IV-4. Stacked bar graphs showing fluoride levels with distance inward from the surface in Douglas-fir, western redcedar and pine poles 17 or 30 months after treatment with Bioguard with poles segregated by treatment and utility. There were interesting effects of initial treatment or wood species on the results (Figure IV-8). Boron levels in outer zones were higher in APS than SRP poles, except for the Osmose Experimental Paste, after 17 and 30 months. It is unclear why this occurred, but the differences suggest initial preservative treatment may influence performance of supplemental treatments. We attempted to examine the role of species in boron distribution; however, samples were combined by treatment for copper analysis making it impossible to discern the effect of species on boron levels, with the exception of the Bioguard treatment (Figure IV-9). These preliminary results suggest that field performance of external preservatives in drier climates differs with initial treatment, although all compounds effectively moved boron into the outer 50 mm of wood.
Copper was present in five of the external preservative pastes tested. For this test, a minimum protective threshold of 0.15% (wt/wt) was assumed. As noted in previous reports, there are no data on the effects of multiple component systems on the threshold of individual constituents; we have used the threshold for each component assuming that there is no interaction and data presented in objective I of this report support that premise for boron and copper. Copper analyses of wood obtained from cores and shavings were similar for both CRP II and Cu-Bor, but the results were lower in shavings from the outer 6 mm of poles treated with CuRap 20 after both 17 and 30
0.00
0.10
0.20
0.30
0.40
0.50
0.60
0.70
0.80
APS17 Months
APS30 Months
SRP17 Months
SRP30 Months
Fluo
ride
(% F
)
(50-75)
(25-50)
(13-25)
(0-13)

34th Annual Report 2014 ___________________________
months (Table IV-6, Figure IV-9). It is unclear why this occurred since results were similar in the inner pole zones receiving this treatment. Given general agreement between results, we elected to compare cores only. Copper was present above the threshold in outer pole zones receiving Cu-Bor and CuRap 20 after both 17 and after 30 months; CRP II was not inspected in this cycle, but was above the threshold at 17 months (Figures IV-10, 11). Copper levels declined in the outer pole zones treated with either CuRap 20 or CuBor between the 17 and 30 month inspections, consistent with previous field trials of copper based treatments. Copper levels again were below threshold in the next zone inward for all treatments, which is also consistent with previous field trials of copper treatments. Copper is added to external preservative barriers to protect against renewed fungal attack from the surrounding soil. It is not expected to move into the wood beyond the outer zone.
Copper values for MP400 EXT and Osmose Experimental Paste were modified from the 2012 report to express copper on an oxide basis- rather than elemental copper. This was done for consistency between pastes and resulted in a slight rise in copper levels for both systems 17 months after treatment. Copper concentrations for these pastes were determined by nitric acid digestion and ICP analysis because these pastes contain low levels of copper. Low levels of copper were detected in the outer zone of poles treated with MP400-EXT or Osmose Experimental Paste; however, oxine copper is much more active. Copper levels in SRP poles treated with the Osmose
Table IV-5. Boron levels at selected distances from wood surface in Douglas-fir, western redcedar or pine poles 17 or 30 months after treatment with each treatment. Data are combined for all species.
Treatment Months Utility Boron Concentration (% wt/wt BAE)
Distance from the surface (mm) (0-13) (13-25) (25-50) (50-75)
Cu-Bor 17 APS 1.03 0.20 0.04 0.01
SRP 0.53 0.41 0.14 0.02
30 APS 0.48 0.16 0.05 0.02 SRP 0.69 0.14 0.08 0.02
CuRap 20 17 APS 2.53 0.80 0.14 0.03
SRP 1.09 0.49 0.14 0.05
30 APS 1.01 0.68 0.45 0.23 SRP 0.16 0.16 0.09 0.03
Bioguard 17 APS 2.31 0.78 0.31 0.13
SRP 0.87 0.63 0.26 0.09
30 APS 3.29 0.89 0.07 0.01 SRP 0.46 0.39 0.22 0.10
TriBor 17 APS 2.23 1.02 0.17 0.02
SRP 1.65 0.61 0.19 0.07
30 APS 1.68 1.16 0.32 0.02 SRP 1.32 0.76 0.30 0.08
MP400-EXT 17 APS 2.04 0.66 0.18 0.11
SRP 1.02 0.47 0.15 0.03
30 APS 1.26 0.68 0.20 0.05 SRP 0.35 0.29 0.14 0.04
Osmose Exp 17 APS 1.08 0.15 0.02 0.01

Oregon State University Utility Pole Research Cooperative _________________________________________________________
113
SRP 1.15 0.46 0.15 0.02
30 APS 0.62 0.56 0.23 0.06 SRP 0.36 0.38 0.23 0.08
1Numbers in bold are above the toxic threshold of 0.275% BAE for the outer zone or 0.10 for the three inner zones.
Figure IV-5. Boron content in poles of various species treated with different boron containing pastes as analyzed by collection of shavings collected with a Forstner bit or increment core segments at 17 and 30 months after treatment.
Figure IV-6. Boron levels at various distances from the surface inward in poles of various species 17 or 30 months after treatment with six different boron-containing pastes. Horizontal lines are the toxic threshold of 0.275% BAE for the outer zone (red) or 0.10 for the three inner zones (brown).
0
0.5
1
1.5
2
2.5
17 30 17 30 17 30 17 30 17 30 17 30
Cu-Bor CuRap 20 Bioguard TriBor MP400-EXT Osmose Exp
Boro
n (%
BAE
)
Cores (0-13)Shavings (0-13)
0
0.5
1
1.5
2
2.5
17 30 17 30 17 30 17 30 17 30 17 30
Cu-Bor Cu-Rap Bioguard TriBor MP400-EXT Osmose Exp
Boro
n (%
BAE
)
(0-13)(13-25)(25-50)(50-75)

34th Annual Report 2014 ___________________________
Figure IV-7. Total boron measured in the outer 75 mm of poles 17 or 30 months after treatment with selected boron-containing pastes. Solid bars are above the toxic threshold of 0.275% BAE for the outer zone or 0.10 for the three inner zones.
Figure IV-8. Boron content in the outer 75 mm of poles of various species segregated by utility 17 or 30 months after application of various boron-containing pastes. Solid bars are above the toxic threshold of 0.275% BAE for the outer zone or 0.10 for the three inner zones.
0
0.5
1
1.5
2
2.5
3
3.5
17 30 17 30 17 30 17 30 17 30 17 30
Cu-Bor Cu-Rap Bioguard TriBor MP400-EXT Osmo
Boro
n (%
BAE
)
(50-75)(25-50)(13-25)(0-13)
Osmose Exp
00.5
11.5
22.5
33.5
44.5
APS
SRP
APS
SRP
APS
SRP
APS
SRP
APS
SRP
APS
SRP
APS
SRP
APS
SRP
APS
SRP
APS
SRP
APS
SRP
APS
SRP
17 30 17 30 17 30 17 30 17 30 17 30
Cu-Bor Cu-Rap Bioguard TriBor MP400-EXT Osmose Exp
Boro
n (%
BAE
)
(50-75)(25-50)

Oregon State University Utility Pole Research Cooperative _________________________________________________________
115
Experimental Paste were above the threshold. These results bear some explanation. MP400-EXT utilizes a micronized oxine copper component that is suspended rather than solubilized. The oxine copper is far more effective than copper naphthenate. There is some evidence that easily penetrates into southern pine, the copper does not penetrate into less permeable woods such as Douglas-fir. Therefore, copper penetration into the wood may be limited. Ultimately, this may not affect overall system performance because copper is only one component and, in combination with bifenthrin and tebuconazole, provides a surface barrier against renewed fungal attack. Boron is expected to migrate deeper into wood and arrest any existing fungal attack. Further evaluations will be required to determine if this premise is correct. Unlike boron, where the initial treatment influenced subsequent distribution of the remedial treatment, there were no consistent differences in copper levels among treatments by utility (Figure IV-12). The lack of difference may reflect shallow overall penetration of copper compared with the more mobile boron. Analyzing bifenthrin and tebuconazole in preservative treated wood is challenging. Obtaining a sufficient quantity of wood to extract and interference from the original preservative makes analysis difficult. In the case of tebuconazole, several alkanes eluted at the same time as the active ingredient. These compounds were likely residuals from the original solvent. Their presence made it difficult to quantify or to even say with
Figure IV-9. Copper levels in shavings vs. increment core segments removed from poles 17 or 30 months after treatment with various copper containing preservative pastes.
0.0
0.1
0.2
0.3
0.4
0.5
0.6
0.7
0.8
0.9
17 30 17 30
Cu-Bor CuRap 20
CuO
(%
)
Cores (0-6)
Shavings (0-6)
Cores (6-13)
Shavings (6-13)

34th Annual Report 2014 ___________________________
Figure IV-10. Copper levels at selected distances from the pole surface 17 or 30 months after application of copper containing preservative pastes. The horizontal line indicates the toxic threshold for the form of copper in these chemicals.
Table IV-6. Copper levels at selected distances from the wood surface in poles of various species 17 or 30 months after application of copper containing preservative pastes. Separated by utility.
Treatment Months Copper Levels (% wt/wt as CuO)
Distance from the surface (mm) Utility (0-6) (6-13) (13-25) (25-50) (50-75)
Cu-Bor 17 APS 0.31 0.00 0.00 0.00 0.00
SRP 0.35 0.03 0.01 0.00 0.00
30 APS 0.46 0.04 0.01 0.00 0.00 SRP 0.30 0.03 0.01 0.00 0.00
CuRap 20 17 APS 0.98 0.03 0.01 0.00 0.00
SRP 0.65 0.05 0.01 0.00 0.00
30 APS 0.55 0.10 0.01 0.00 0.00 SRP 0.28 0.03 0.01 0.00 0.00
MP400-EXT 17 APS 0.01* 0.01* 0.00 ----- -----
SRP 0.01* 0.00 0.00 ----- -----
30 APS 0.00 0.00 0.00 0.00 0.00 SRP 0.01 0.00 0.00 0.00 0.00
Osmose Exp 17 APS 0.04* 0.00 0.00 ----- -----
SRP 0.10* 0.00 0.00 ----- -----
30 APS 0.09 0.01 0.00 0.00 0.00 SRP 0.14 0.01 0.00 0.00 0.00
COP-R- PLASTIC II2
17 APS 0.49 0.07 0.01 0.00 0.00 SRP 0.64 0.14 0.01 0.00 0.00
30 APS Not Sampled SRP

Oregon State University Utility Pole Research Cooperative _________________________________________________________
117
1Numbers in bold are above the toxic threshold of 0.15% Cu. 2COP-R-PLASTIC II was not sampled at 30 months. * Numbers were corrected from the 2012 report to account for CuO, not Cu, concentration.
Figure IV-11. Stacked bar graph showing total copper levels in the outer 75 mm of poles 17 or 30 months after application of copper containing preservative pastes. Note that most copper is in the outer assay zone.
Figure IV-12. Copper levels in poles 17 or 30 months after treatment with selected copper containing preservative pastes segregated by treatment and utility.
0.0
0.2
0.4
0.6
0.8
1.0
1.2
17 30 17 30 17 30 17 30
Cu-Bor CuRap 20 MP400-EXT Osmose Exp
CuO
(%
)
(50-75)(25-50)(13-25)(6-13)(0-6)
0.0
0.2
0.4
0.6
0.8
1.0
1.2
APS SRP APS SRP APS SRP APS SRP APS SRP APS SRP APS SRP APS SRP
17 30 17 30 17 30 17 30
Cu-Bor CuRap 20 MP400-EXT Osmose Exp
CuO
(%
)
(50-75)(25-50)(13-25)(6-13)(0-6)

34th Annual Report 2014 ___________________________
certainty that tebuconazole was present. This problem occurred in zones away from the wood surface where tebuconazole was less likely to be present and where levels that could be determined by comparison with standards were extremely low. As a result, we have reported values in the 17 month data only where the levels of interference were low enough to allow for reliable quantification. For tebuconazole, this was the 0 to 6 mm assays zone. The 0-6 and 6 to13 mm zones were quantifiable for bifenthrin. Over the past year, we have worked to modify and improve analytical methods for both systems.
Both bifenthrin and tebuconazole were detected in the outer 6 mm of cores and shavings, but only shavings data are used for discussion (Table IV-7). Questions about detection and interference on samples further inward last year made it difficult to reliably say either compound was present more than 12 mm from the surface 17 months after treatment. Tebuconazole levels in the outer 6 mm ranged from 464 to 521 ppm, 17 months after treatment and 98 to 658 ppm after 30 months. These values are protective against fungal attack in laboratory soil block tests and indicate this component is present at levels that provide protection against decay fungi. Tebuconazole was detected at protective levels 13 to 25 mm from the surface in Douglas-fir poles 30 months after treatment but not in other species. The results indicate tebuconazole is moving into poles to provide a slightly deeper protective zone against renewed fungal attack.
Bifenthrin was detected in the two outer assay zones, although levels declined sharply in the second zone from the surface (Table IV-7). Bifenthrin is not widely used in the U.S. for wood treatment, but it is specified in Australia for treatment of framing lumber at a target retention of 12 ppm. If we use this value as a minimum threshold for protection, then the outer zones of poles treated with either MP400-EXT or Osmose Experimental Paste were above the protective threshold for all wood species 30 months after treatment. Levels in the next zone inward were below the threshold for both treatments 17 months after treatment, but were above the threshold 6 to 13 mm inward in Douglas-fir poles treated with either MP400-EXT or the Osmose Experimental Paste and in southern pine poles treated with the Osmose Experimental Paste system. The role of bifenthrin is difficult to quantify since copper, which can serve as a reasonable termiticide, is also present in both pastes. However, the presence of bifenthrin should enhance any protective effect.
These preliminary results suggest that copper, tebuconazole and bifenthrin form a barrier near the wood surface (0-13 mm) while boron diffuses more deeply into the wood. This pattern is similar to other multi-component external preservative barriers and indicates that this system should perform well as an external preservative paste.

Oregon State University Utility Pole Research Cooperative _________________________________________________________
119
Table IV-7. Bifenthrin and tebuconazole levels in the outer 13 mm of shavings removed from poles of various species 17 or 30 months after application of MP400-EXT or Osmose Experimental paste.
System Assay Zone (mm)
Chemical Retention (ppm)a
Bifenthrin Tebuconazole 17 mo 30 mo 17 mo 30 mo
MP400-EXT 0-6 65.9 44.8 521 417 6-13 8.2 5.7 N/A 104
O-EXP 0-6 39.8 34.2 462 572 6-13 3.4 3.9 N/A 235
aValues represent mean analyses of 2 to 6 samples. N/A signifies results that were inconclusive regarding the presence of a given compound.
D. Develop Thresholds for Commonly Used External Preservative Systems Over the past decade, we have assessed the ability of a variety of external preservative pastes and bandages to move into treated and non-treated wood. While these tests have produced data showing preservative can move into wood, short-comings of these data include difficulty in determining the chemical quantity required to confer protection.
This is a particularly difficult study topic because of groundline environments. In most cases, wood still contains some initial preservative treatment and the goal is to supplement that chemical loading. Simultaneously, the soil environment harbors aggressive microorganisms and fungi may already colonize the wood. Finally, previous threshold data has been developed for traditional wood decay fungi, while surface decay below ground is dominated by soft rot fungi. Soft rot fungi tend to be more chemically tolerant and their location within the wood cell wall makes them potentially less susceptible to chemical action. Finally, a number of these systems contain both water diffusible and oil soluble components which move at different rates into the wood.
In previous tests, we have attempted to develop threshold data on diffusible systems using blocks treated with various combinations of preservatives exposed in soil burial soft rot tests. These tests produced extremely variable results, likely due to chemical movement from the wood during the tests. While this would also happen to wood in service, the changing chemical environment during the test made it difficult to develop reasonable threshold estimates.
We continue to seek alternative methods for assessing thresholds on mobile chemicals in soil contact.
E. Effect of External Barriers on Pole Performance
Preservative treatment is a remarkably effective barrier against biological attack, but these chemicals can migrate into surrounding soil. A number of studies documenting chemical migration have shown migration occurring for short distances around a treated structure. Generally, the levels present do not pose environmental impact or disposal

34th Annual Report 2014 ___________________________
hazards. Despite these data, some utilities have explored the use of external barriers to contain any migrating preservative. These barriers, while not necessary in terms of environmental issues, may have a secondary benefit in terms of both retaining the original chemical and limiting the entry of moisture and fungi.
The potential for barriers to limit moisture uptake in poles was assessed on pole sections where two different barriers were installed in either soil or water. Poles were maintained indoors and were not subjected to overhead watering. Results showed that, even with barriers, considerable moisture wicked up poles and moisture contents at groundline were suitable for decay development. As might be expected, poles immersed in water wetted more quickly than those in wet soil; however, all poles were generally wet enough for decay to occur within two years of installation. These poles have subsequently been moved to our field site and set so the barriers extend 150 mm above the soil. These pole sections were then sampled for wood moisture content at groundline, 150 mm and 300 mm above groundline immediately after installation and two years after installation as described above.
In 2007, an additional set of penta-treated Douglas-fir pole stubs were encased in the newest generation of Biotrans liners and set into the ground at our Peavy Arboretum research site. Poles were sampled prior to installation to determine chemical penetration and retention and baseline moisture content. Five poles received a Biotrans liner extending 150 mm above groundline; five received a Biotrans liner extendeding 300 mm above groundline and eleven poles were left without liners. These poles will be samples in 2015.
F. Establish a Field Trial of Current Liner Systems
Liner systems have been employed for over a decade wherever utilities have concerns about the potential risk of preservative migration from treated wood. While these systems have been reported to improve overall treatment performance, insufficient data exist on the effects these systems have on preservative migration. In the fall of 2010 we installed a field test of poles with and without liners to address the following objectives:
- Assess the ability of external barriers to retard preservative migration from poles in soil contact.
-Determine the impact of external barriers on wood moisture contents above and below the barrier over time.
Douglas-fir pole sections (250-300 mm in diameter by 3.1 m long) were treated to 9.6 kg/m3 with penta and southern pine pole sections were treated with CCA to a retention of 9.6 kg/m3 or penta to a retention of 7.2 kg/m3. Additional non-treated poles were included as controls. Pole sections were sampled with an increment borer prior to

Oregon State University Utility Pole Research Cooperative _________________________________________________________
121
setting to determine initial preservative penetration. A sufficient number of cores were removed to determine retention per pole section. Pole sections were set to a depth of 0.9 m with or without field liners. Poles with liners were set so that the liner was 150 mm above groundline. Half of the poles will be used for preservative component migration potential into the surrounding soil, and the other half will be used for measuring wood moisture content above and below the barrier.
Soil samples were collected from 20 random locations at the test site prior to pole installation. Soil was removed from 0 to 25 mm, 25 to 50 mm, 50 to 75 mm and 75 to 150 mm belowground. Collected soil was air dried, screened through a #6 brass sieve and divided into two samples. The first was analyzed for copper, chromium and arsenic by ICP. The remaining sample was solvent extracted and, after cleaning, analyzed by GCMS for penta. These results were used to establish baseline levels of preservative in soil for comparison to soil samples removed in subsequent years.
Annually, during the first three years after installation, soil cores were removed immediately adjacent to the poles, 150 and 300 mm away. Soil cores were divided into zones as described above and analyzed for appropriate preservatives. Sample distance will be increased if we detect elevated chemical levels at the initial sampling sites. Poles were not sampled this past year, but will be revisited in 2015.
Literature Cited
American Wood Protection Association. 2012. Standard A2- 04 Standard methods for analysis of waterborne preservatives and fire-retardant formulations. Method 7. Determination of fluoride in wood and solutions. In: AWPA Book of Standards, AWPA, Birmingham, Alabama. Pages 236-237. American Wood Protection Association (AWPA). 2012b. Standard A2- 04 Standard methods for analysis of waterborne preservatives and fire-retardant formulations. Method 16. Determination of boron in treated wood using azomethine H or carminic acid. In: AWPA Book of Standards, AWPA, Birmingham, Alabama. Pages 191-193. American Wood Protection Association. 2012c. Standard A12-12. Wood densities for preservative retention calculations. In: AWPA Book of Standards, AWPA, Birmingham, Alabama. Pages 230-231. Baechler, R.H. and H.G. Roth. 1956. Laboratory leaching and decay tests on pine and oak blocks treated with several preservative salts. Proceedings American Wood Preservers’ Association 52:24-33.

34th Annual Report 2014 ___________________________
Baecker, A.A.W. 1993. A non-pressure method of protection based upon the hurdle theory to control the spectrum of internal environment. International Research Group on Wood Preservation Document No IRG/WP/2319, Stockholm, Sweden. Baecker, A.A.W. and M. Behr. 1995. Biostatic film as a primary treatment against pole failure in soil. International Research Group on Wood Preservation Document No IRG/WP/95-40053, Stockholm, Sweden. Becker, G. 1976. Treatment of wood by diffusion of salts. International Research Group on Wood Preservation Document No. IRG/WP/368. Stockholm, Sweden. 21 pages Becker, G. 1973. Fluorine compounds for wood preservation J. Institute of Wood Science 6(32):51-62. Becker, G. 1959. Beitrag zur Kenntnis der Wirksamkeit von Borverbindungen als Holzschutzmittel gegen Insekten und Pilze. Holz als Roh-und Werkstoff 17(12):484-489. Behr, M. and A.A.W.Baecker. 1994. Quantification of creosote migration down wooden poles and the prevention of its depletion during flood irrigation. International Research Group on Wood Preservation Document No IRG/WP/94-50032, Stockholm, Sweden. Behr, M.R., G.D. Shelver, and A.A.W. Baecker. 1997. Transmission poles with sub-standard retentions protected by Field Liners outperform standard poles in service. International Research Group on Wood Preservation Document No IRG/WP/97-40095, Stockholm, Sweden. Behr, M.R., G.D. Shelver, and A.A.W. Baecker. 1996. Field Liners TM prevent creosote migration from transmission poles during service. International Research Group on Wood Preservation Document No IRG/WP/96-40067, Stockholm, Sweden. Brooks, K. M. 2000. “Environmental impact of preservative-treated wood in a wetland boardwalk.” U.S. Department of Agriculture, Forest Service, Forest Products Laboratory Res. Pap. FPL-RP-582. Madison, WI. 136 pages. Chen, H., R. Rhatigan, and J.J. Morrell. 2003. A rapid method for fluoride analysis of treated wood. Forest Products Journal 53(5):43-45. Cockcroft, R. and J.F. Levy. 1973. Bibliography on the use of boron compounds in the preservation of wood. J. Institute of Wood Science 6(3):28-37. deJonge, J.T.1986. The efficacy of boron preparations. International Research Group on Wood Preservation Document No. IRG/WP/3400. Stockholm, Sweden. 7 pages Dickinson, D.J., P.I. Morris, and B. Calver. 1988. The secondary treatment of creosoted electricity poles with fused boron rods. International Research Group on Wood Preservation Document No. IRG/WP/3485. Stockholm, Sweden.3 pages

Oregon State University Utility Pole Research Cooperative _________________________________________________________
123
Dietz, M.G. and E.L. Schmidt. 1988. Fused borate and bifluoride remedial treatments for controlling decay in window millwork. Forest Products Journal 38(5):9-14. Edlund, M.L., B. Henningsson, A. Kaarik, and P.E. Dicker. 1983. A chemical and mycological evaluation of fused borate rods and a borate/glycol solution for remedial treatment of window joinery. International Research Group on Wood Preservation Document No. IRG/WP/3225. Stockholm, Sweden. 36 pages Fahlstrom, G.B. 1964. Threshold values for wood preservatives. Forest Products Journal 14:529-530 Findlay, W.P.K. 1953. The toxicity of borax to wood-rotting fungi. Timber Technology and Machine Woodworking 61(No 2168):275-276. Graham, R.D. 1973. History of wood preservation. In: Wood deterioration and its prevention by preservative treatments (D.D. Nicholas, Ed). Syracuse University Press, Syracuse, NY. Volume 1, pages 1-32. Love, C., C. Freitag, and J.J. Morrell. 2004. Performance of supplemental groundline preservative treatments on western redcedar and southern pine utility poles. Proceedings, International Conference on Utility Line Structures. March 29-31, 2004, Fort Collins Marriott, Fort Collins, Colorado. Pages 289-297. Morrell, J.J., H. Chen, and J. Simonsen. 2005. Migration of metals from Douglas-fir lumber treated with ACZA or pentachlorophenol using Best Management Practices: Preliminary tests. Proceedings 6th International Wood Preservation Symposium “Environmental and Wood Preservation. Cannes-Mandelieu, France. February 7-8, 2005. Document No. IRG/.WP/50224-4. International Research Group on Wood Preservation, Stockholm, Sweden. 13 pages Morrell, J.J. and J. Huffman. 2004. Copper, chromium, and arsenic levels in soil surrounding posts treated with chromated copper arsenate (CCA). Wood and Fiber Science 36:119-128. Morrell, J.J., D. Keefe, and R.T.Baileys. 2003. Copper, zinc, and arsenic in soil surrounding Douglas-fir poles treated with ammoniacal copper zinc arsenate (ACZA). J. Environmental Quality 32:2095-2099 Morrell, J.J. and P.F. Schneider. 1995. Performance of boron and fluoride based rods as remedial treatments of Douglas-fir poles. International Research Group on Wood Preservation. Document No. IRG/WP 95-300070. Stockholm, Sweden. 11 p.

34th Annual Report 2014 ___________________________
Panek, E., J.O. Blew, and R.H. Baechler. 1961. Study of groundline treatments applied to five pole species. USDA Forest Products Laboratory Report 2227. Madison, Wisconsin. 22 pages. Rhatigan, R.G., C.S. Love, and J.J. Morrell. 2002. Seasonal variations in moisture content of in-service poles in the Willamette Valley. In: Proceedings 7th International Conference on Utility Line Structures, March 25-27, 20002, Fort Collin, CO. EDM International, Ft. Collins, CO. Pages 69-77. Richards, C.A. 1924. The comparative resistance of 17 species of wood destroying fungi to sodium fluoride. Proceedings American Wood Preservers= Association 20:37-43. Roff, 1969. A sub-surface inoculation technique for study of boron-diffusion treatment to arrest incipient decay in wood., Bi-Monthly Research Notes, Canadian Forestry Service, Ottawa, Canada. Volume 25(2):13-14. Ruddick, J.N.R. and A.W. Kundzewicz. 1992. The effectiveness of fused borate rods in preventing or eliminating decay in ponderosa pine and Douglas-fir. Forest Products Journal 42(9):42-46. Scheffer, T.C. and J.J. Morrell. 1997. Ability of polyethylene boots to protect the below ground portion of small stakes against decay. Forest Products Journal. 47(5):42-44. Scheffer, T.C. 1971. A climate index for estimating potential for decay in wood structures above ground. Forest Products Journal 21(10):25-31. Sheard, L. 1990. Evaluation of Boracol, Boracol Rh, and Impel boron rods- a literature review. Unpublished Report. Danish Technological Institute, Taastrup, Denmark. 11 pages. Williams, L.H. and T.L. Amburgey. 1987. Integrated protection against lyctid beetle infestations. IV. Resistance of boron-treated wood (Virola spp.) to insect and fungal attack. Forest Products Journal 37(2):10-17.

Oregon State University Utility Pole Research Cooperative _________________________________________________________
125
OBJECTIVE V
PERFORMANCE OF COPPER NAPHTHENATE TREATED WESTERN WOOD SPECIES
Copper naphthenate has been available as a wood preservative since the 1940s, but commercial use for treating utility poles has only occurred in the last 20 years as utilities sought less restrictively labeled chemicals. Copper naphthenate is currently listed as a non-restricted use pesticide, meaning applicators do not require special licensing to apply this chemical. This has little bearing on the use of preservative treated wood, since there are no restrictions on who can use any preservative treated wood products currently on the market (although there are recommended practices for the use of each product). However, some users have sought to soften their environmental image by shifting to alternative preservatives such as copper naphthenate.
Copper naphthenate has a long history of successful use on southern pine. We performed a number of tests to ensure the suitability of this system for use on western

34th Annual Report 2014 ___________________________
wood species, notably Douglas-fir and western redcedar. Initial tests examined the copper naphthenate performance on western redcedar, but concerns about the effects of solvent substitutions on biocide performance encouraged us to set up field evaluations of copper naphthenate poles in service. Our first work examined the condition of Douglas-fir poles treated with copper naphthenate and diesel as the primary solvent and we found no evidence of early decay in poles exposed in Oregon or California. More recently, data suggesting that the addition of biodiesel as a co-solvent to reduce diesel odors had a negative effect on performance led us to evaluate poles in the Puget Sound area. We will continue to evaluate copper naphthenate performance to ensure that utilities are aware of the effects of process changes on performance.
A. Performance of Copper Naphthenate Treated Western Redcedar Stakes in Soil Contact
Copper naphthenate has provided reasonable protection in a variety of field stake tests, but there is relatively little long term data on western wood species. To help develop this information, we established the following test.
Western redcedar sapwood stakes (12.5 by 25 by 150 mm long) were cut from freshly sawn lumber and the outer surfaces of the above-ground zones of utility poles in service for approximately 15 years. The latter poles were butt-treated, but had not received any supplemental aboveground treatment.
Stakes were conditioned to 13% moisture content, weighed prior to pressure treatment with copper naphthenate diluted in diesel oil to produce target retentions of 0.8, 1.6, 2.4, 3.2, and 4.0 kg/m3. Each retention was replicated on ten freshly sawn and ten weathered stakes. In addition, sets of ten freshly sawn and weathered stakes were each treated with diesel oil alone or left without treatment to serve as controls.
Stakes were then exposed in a fungus cellar maintained at 30 C and approximately 90% relative humidity. Soil moisture cycled between wet and slightly dry to avoid favoring soft rot attack (which tends to dominate in soils that are maintained at high moisture levels). Annually the condition of each stake was visually assessed using a scale from 10 (completely sound) to 0 (completely destroyed).
In 2007, we replaced the decay chambers, which had degraded to the point where they did not tightly seal. This often resulted in drier conditions that were less conducive to decay. The new chambers created more suitable decay conditions evidenced by subsequent drops in ratings for all treatments.
Freshly sawn stakes continue to outperform weathered stakes at all retention levels (Figures V-1, 2). All freshly sawn stakes treated with copper naphthenate to retentions of 4.0 kg/m3 continue to provide excellent protection after 292 months, while the

Oregon State University Utility Pole Research Cooperative _________________________________________________________
127
conditions of stakes treated to the two lower retentions continued to decline over the past 2 years. Stakes treated to the two lowest retentions have declined to a rating near 5.0, suggesting decay significantly degraded the wood. Ratings for intermediate retention were just above 6.0, indicating treatment efficacy loss.
Weathered stakes exhibit greater degrees of damage at a given treatment level and their condition continues to decline. The three lowest retentions had ratings below 3.0 indicating they are no longer serviceable (Figure V-2). Stakes treated to these three retentions continue to decline. The conditions of stakes treated to the two higher retentions also declined slightly in the past year. Ratings for the highest retention are approaching 5.0, while those for the next highest retention have declined to below 4. Clearly, prior surface degradation from both microbial activity and UV light sharply reduced performance of the weathered material.
Weathered wood was included in this test because the cooperating utility planned to remove poles from service for re-treatment and reuse. While this process remains possible, it is clear the performance characteristics of weathered retreated material will differ substantially from those of freshly sawn material. The effects of these differences on overall performance may be minimal. Even if the outer, weathered wood were to degrade over time, this zone is relatively shallow on western redcedar and would not markedly affect overall pole properties.
Copper naphthenate should continue to protect weathered redcedar sapwood aboveground; allowing utility personnel to safely climb these poles. Any slight decrease in aboveground protection would probably take decades to emerge. As a result, retreatment of western redcedar still appears feasible for avoiding pole disposal and maximizing value of the original investment.
A more reasonable approach might be to remove weathered wood and treat the poles. This process would be very similar to processes that have been used for removing sapwood on freshly peeled poles to produce a so-called “redbird” pole. Since weathered wood is already physically degraded, it likely contributes little to overall material properties and its treatment serves little practical purpose. Removal of this more permeable and weaker wood would effectively reduce the pole class, but might result in a better performing pole. Resulting treatments on shaved poles might be shallower, but non-treated wood beneath is durable heartwood.
The results with freshly sawn and treated western redcedar clearly show good performance. These results are consistent with field performance of this preservative on western species. We continue to seek copper naphthenate treated Douglas-fir poles in the Northwest so that we can better assess the field performance of this system.

34th Annual Report 2014 ___________________________
Figure V-1. Condition of freshly sawn western redcedar sapwood stakes treated with selected retentions of copper naphthenate in diesel oil and exposed in a soil bed for 292 months.
0.0
1.0
2.0
3.0
4.0
5.0
6.0
7.0
8.0
9.0
10.0
0 50 100 150 200 250 300
Visu
al R
atin
g
Months
0.8 1.5 2.4 3.2 4.0 control diesel
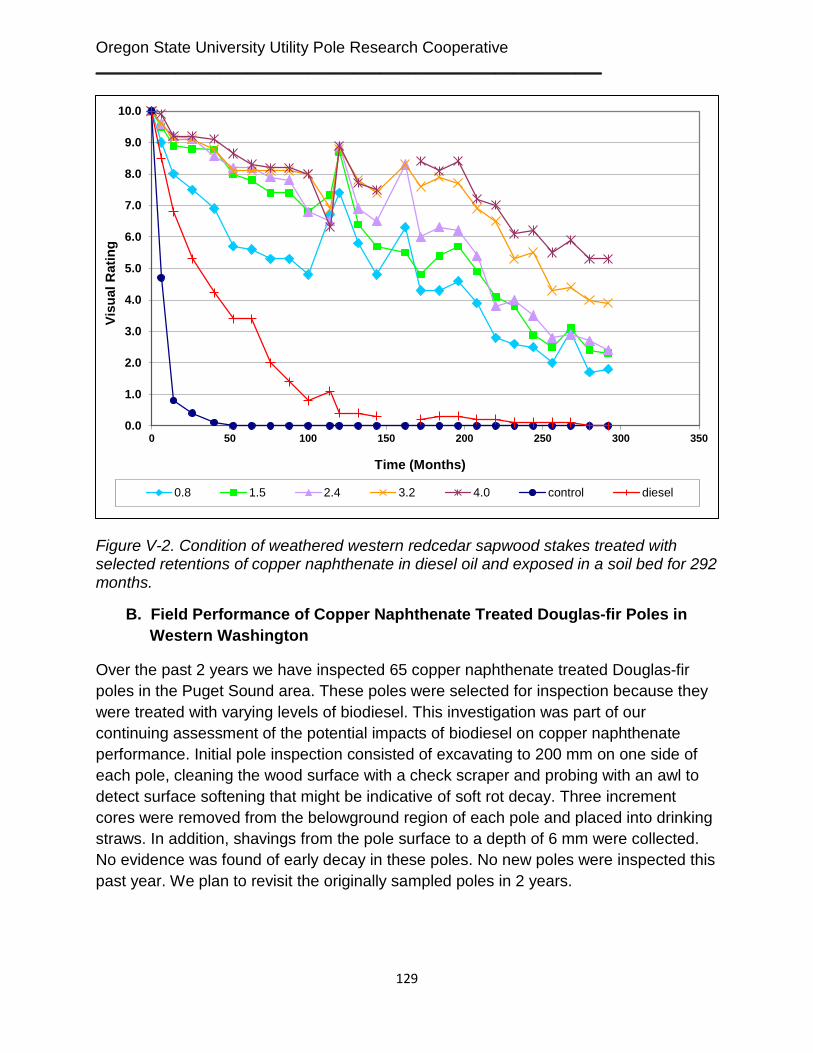
Oregon State University Utility Pole Research Cooperative _________________________________________________________
129
Figure V-2. Condition of weathered western redcedar sapwood stakes treated with selected retentions of copper naphthenate in diesel oil and exposed in a soil bed for 292 months.
B. Field Performance of Copper Naphthenate Treated Douglas-fir Poles in Western Washington
Over the past 2 years we have inspected 65 copper naphthenate treated Douglas-fir poles in the Puget Sound area. These poles were selected for inspection because they were treated with varying levels of biodiesel. This investigation was part of our continuing assessment of the potential impacts of biodiesel on copper naphthenate performance. Initial pole inspection consisted of excavating to 200 mm on one side of each pole, cleaning the wood surface with a check scraper and probing with an awl to detect surface softening that might be indicative of soft rot decay. Three increment cores were removed from the belowground region of each pole and placed into drinking straws. In addition, shavings from the pole surface to a depth of 6 mm were collected. No evidence was found of early decay in these poles. No new poles were inspected this past year. We plan to revisit the originally sampled poles in 2 years.
0.0
1.0
2.0
3.0
4.0
5.0
6.0
7.0
8.0
9.0
10.0
0 50 100 150 200 250 300 350
Visu
al R
atin
g
Time (Months)
0.8 1.5 2.4 3.2 4.0 control diesel

34th Annual Report 2014 ___________________________
OBJECTIVE VI
ASSESS THE POTENTIAL ENVIRONMENTAL IMPACTS OF WOOD POLES
Preservative treated wood poles provide excellent service under a diverse array of conditions, however increased sensitivity to all things chemical has raised questions concerning the use of preservatives on poles. While there are no data indicating preservative treated wood poles pose a risk to environments in which they are used, it is important to continue to develop exposure data wherever possible. The goal of this objective is to examine usage patterns for preservative treated wood (specifically poles) and develop exposure data that utilities can employ to both assess their use patterns and answer questions that might arise from regulators or the general public. One aspect of pole use is the potential for chemical migration in rainwater runoff from stored poles.
A. Migration of Copper from Copper Naphthenate Treated Douglas-fir Poles During Storage
Virtually all wood preservatives have some degree of water solubility allowing them to be present in free water within wood cell walls at levels that can affect wood degrading agents. These solubilized preservative components have the potential to migrate from wood into the surrounding environment where they can affect non-target organisms (Morrell et al., 2011). Preservative migration concerns have led regulators in many countries to restrict treated wood use in some applications. The wood preservation industry has worked to improve its practices to limit over-treatment and to clean wood surfaces following treatment, reducing the potential for preservative migration.
While improving treatment practices to reduce the potential for migration makes sense, there is a surprising lack of data on actual levels of preservative that migrate from treated wood in many applications. Such data can be extremely useful for determining risks in a given environment and for assessing the success of modifications to treatment practices.
Treated wood storage is often over-looked as a contamination source, particularly with larger wood members such as utility poles. Electric utilities must carry inventories of replacement poles to rapidly replace structures that fail during storms. These poles are generally stored outdoors without cover and can remain in place for many years. Horizontal storage exposes maximum surface area to potential wetting, which can solubilize small amounts of preservative that may migrate into soil beneath the poles. In previous trials, we examined potential migration of copper, zinc and arsenic from poles treated with ACZA and penta from poles treated with this biocide (Morrell and Chen, 2008; Morrell et al., 2010). In general, preservative components were detected following every precipitation event and concentrations fell within a relatively narrow range, suggesting migration was a function of preservative solubility rather than precipitation-
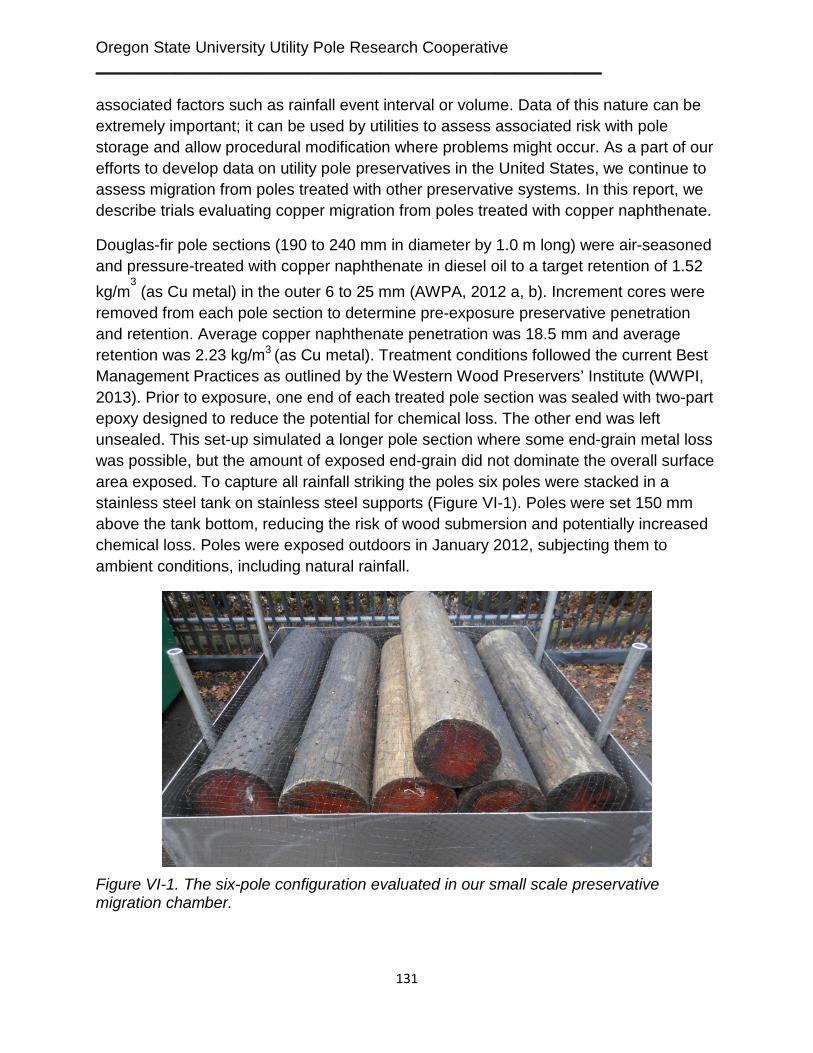
Oregon State University Utility Pole Research Cooperative _________________________________________________________
131
associated factors such as rainfall event interval or volume. Data of this nature can be extremely important; it can be used by utilities to assess associated risk with pole storage and allow procedural modification where problems might occur. As a part of our efforts to develop data on utility pole preservatives in the United States, we continue to assess migration from poles treated with other preservative systems. In this report, we describe trials evaluating copper migration from poles treated with copper naphthenate.
Douglas-fir pole sections (190 to 240 mm in diameter by 1.0 m long) were air-seasoned and pressure-treated with copper naphthenate in diesel oil to a target retention of 1.52 kg/m
3 (as Cu metal) in the outer 6 to 25 mm (AWPA, 2012 a, b). Increment cores were
removed from each pole section to determine pre-exposure preservative penetration and retention. Average copper naphthenate penetration was 18.5 mm and average retention was 2.23 kg/m3 (as Cu metal). Treatment conditions followed the current Best Management Practices as outlined by the Western Wood Preservers’ Institute (WWPI, 2013). Prior to exposure, one end of each treated pole section was sealed with two-part epoxy designed to reduce the potential for chemical loss. The other end was left unsealed. This set-up simulated a longer pole section where some end-grain metal loss was possible, but the amount of exposed end-grain did not dominate the overall surface area exposed. To capture all rainfall striking the poles six poles were stacked in a stainless steel tank on stainless steel supports (Figure VI-1). Poles were set 150 mm above the tank bottom, reducing the risk of wood submersion and potentially increased chemical loss. Poles were exposed outdoors in January 2012, subjecting them to ambient conditions, including natural rainfall.
Figure VI-1. The six-pole configuration evaluated in our small scale preservative migration chamber.

34th Annual Report 2014 ___________________________
The tank was drained whenever there was measurable rainfall. Water was collected and weighed immediately after rainfall event concluded, or daily when storms continued for more than one day. In some cases, rainfall, while measurable, did not result in collectible water samples because conditions were so dry prior to the rainfall event that falling moisture was either sorbed by the wood or evaporated before it could be collected. Water collection continued until November 2012, then ceased for the remainder of the winter. The tank was allowed to empty during each rainfall event. Water collection resumed in September 2013 as the autumn rains began. Collection continued until the study was terminated in October 2013.
Collected water samples were acidified and analyzed for copper content by ion-coupled plasma spectroscopy (ICP) (Anonymous, 1989; Gaviak et al., 1994). The data were arrayed by date of collection, total rainfall, and days between rainfall events to determine correlations between these variables and copper levels in the runoff. Results were used to determine the relative amounts of copper that would migrate from a Class 4, 13.3 m long pole. Observations suggested that the upper exposed surfaces were the areas primarily subjected to wetting. Configuration changes in previous studies indicated that metal levels were primarily a function of surface area exposure (i.e. water that continued to run down pole surfaces did not appear to pick up additional metals) (Morrell et. al., 2010).
Data from poles exposed in the tank were used to estimate copper migration potential from 15 full-size poles arrayed in three hypothetical configurations. The first configuration spread poles out individually to maximize the area exposed to rainfall and the other two configurations stacked poles to progressively reduce surface area exposure (Figure VI-2). The total amount of rainfall striking the poles was determined for each configuration at several rainfall levels (Table VI-1). The average concentrations of copper detected in the tank study were used to estimate runoff for each pole configuration.
These estimates were used to calculate metal concentrations that could develop in soil beneath stored poles assuming no further metal movement into the surrounding soil occurred, and metals were confined depths of either 75 or 150 mm beneath the poles.
Runoff from the poles consistently contained copper levels ranging from 2 to 12 ppm. There were two collections that contained approximately 25 ppm (Figure VI-3). Copper levels were otherwise very consistent regardless of rainfall amount or interval between rainfall events. The two elevated copper samples were collected after prolonged drying periods, suggesting additional copper might migrate to the surface and become more available. However, collections after a second long dry period were not elevated (Figure VI-4,5). These results are similar to those found in poles treated with penta in oil and suggests that poles will continue to release copper at these levels for some time

Oregon State University Utility Pole Research Cooperative _________________________________________________________
133
Figure VI-2. Configurations of 15 Class 4, 13.3 m long poles used to model predicted copper concentrations in soil beneath the poles as a result of rainwater runoff. Poles were configured as a single layer of 15 individual poles (Arrayed), 15 poles in a triangular stack (Triangle) and 15 poles in four courses (Stack) with non-treated stickers in between each course.
Table VI-1. Total amount of rainfall that would fall on 15 Class 4, 13.3 m long utility poles stored in three different configurations in a single year.
Total Annual Rainfall
(m)
Total liters of rainfall per configuration (X 103)
Arrayed (54 m2) Triangle (18 m2) Stack (14.4 m2)
0.375 20.25 6.75 5.40
0.750 40.50 13.50 10.80
1.125 60.75 20.25 16.20
1.500 81.00 27.00 21.60
4.5m
1.5m
1.2m
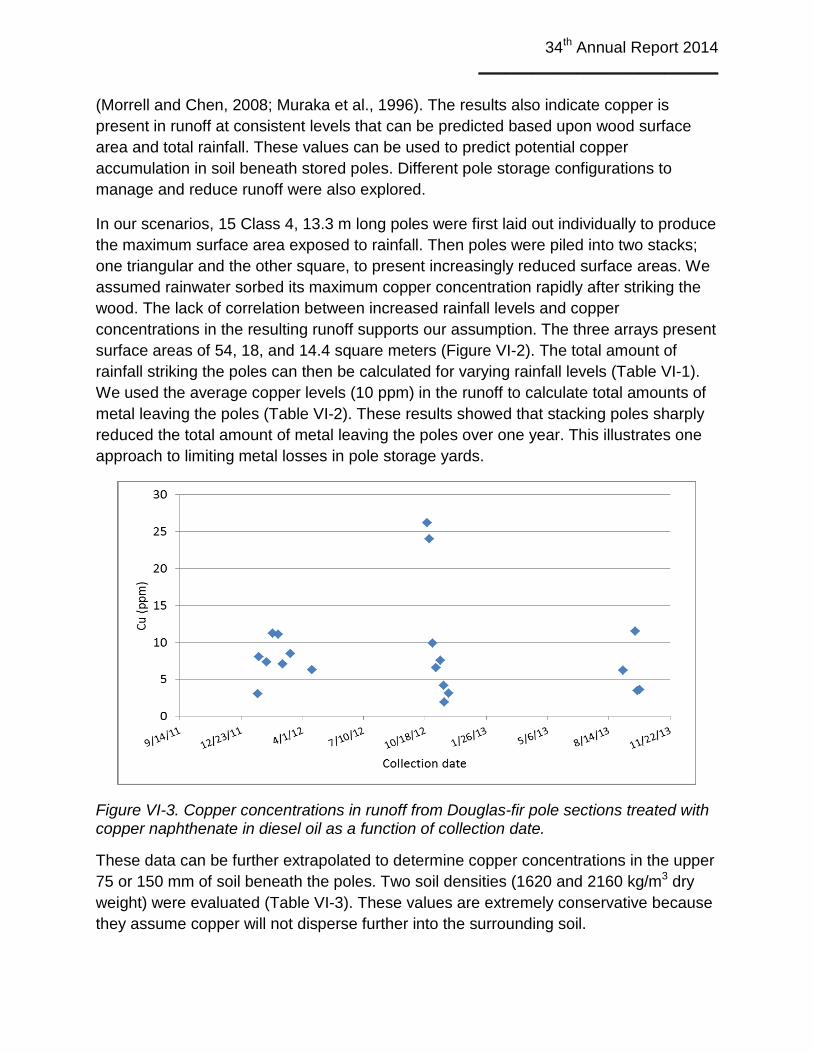
34th Annual Report 2014 ___________________________
(Morrell and Chen, 2008; Muraka et al., 1996). The results also indicate copper is present in runoff at consistent levels that can be predicted based upon wood surface area and total rainfall. These values can be used to predict potential copper accumulation in soil beneath stored poles. Different pole storage configurations to manage and reduce runoff were also explored.
In our scenarios, 15 Class 4, 13.3 m long poles were first laid out individually to produce the maximum surface area exposed to rainfall. Then poles were piled into two stacks; one triangular and the other square, to present increasingly reduced surface areas. We assumed rainwater sorbed its maximum copper concentration rapidly after striking the wood. The lack of correlation between increased rainfall levels and copper concentrations in the resulting runoff supports our assumption. The three arrays present surface areas of 54, 18, and 14.4 square meters (Figure VI-2). The total amount of rainfall striking the poles can then be calculated for varying rainfall levels (Table VI-1). We used the average copper levels (10 ppm) in the runoff to calculate total amounts of metal leaving the poles (Table VI-2). These results showed that stacking poles sharply reduced the total amount of metal leaving the poles over one year. This illustrates one approach to limiting metal losses in pole storage yards.
Figure VI-3. Copper concentrations in runoff from Douglas-fir pole sections treated with copper naphthenate in diesel oil as a function of collection date.
These data can be further extrapolated to determine copper concentrations in the upper 75 or 150 mm of soil beneath the poles. Two soil densities (1620 and 2160 kg/m3 dry weight) were evaluated (Table VI-3). These values are extremely conservative because they assume copper will not disperse further into the surrounding soil.

Oregon State University Utility Pole Research Cooperative _________________________________________________________
135
Figure VI-4. Copper concentrations in runoff from Douglas-fir pole sections treated with copper naphthenate in diesel oil as a function of the amount of rainfall collected per precipitation event.
Figure VI-5. Copper concentrations in runoff from Douglas-fir pole sections treated with copper naphthenate in diesel oil as a function of the time between water collections.
While the total amount of copper leaving poles will vary with pole configuration, concentrations in the soil below poles should remain the same because total inputs are based on exposed area. Thus, while stacked poles have a smaller surface exposed to rainfall, the poles receive similar rainfall per unit area resulting in the same soil concentrations. The difference is in the total copper input as well as the area affected.

34th Annual Report 2014 ___________________________
Predicted copper levels beneath poles in a zone 75 mm deep after one year of storage could range from 23.2 to 123.4 ppm, depending on rainfall level. Extending the leaching zone to 150 mm would reduce these values by one half. Soil metal levels vary widely across the country depending on origin. Soil copper levels in Florida, New York and Virginia range from 2 to 51 ppm (Morrell et al., 2003). Clearly, pole storage would result in elevated levels directly beneath poles. Previous studies of soils around poles that suggest copper would continue to migrate and dissipate to background levels away from the storage area (Morrell et al., 2003; Morrell and Huffman, 2004; Zagury et al., 2003). There is a clear benefit to reducing the overall footprint of stored poles since it decreases the total amount of metal released. As expected, configuration has a major effect on the amount of water striking the poles and illustrates the benefits of stacking instead of laying poles out for storage. Stacking can have potential negative effects on storage if the stacks collect water, which supports the colonization and development of decay fungi in pole interiors. This risk may be offset by ensuring that poles stored for longer times are used first as in-service poles are replaced.
Table VI-2. Total amount of copper that would migrate from 15 Class 4, 13.3 m long poles stored in three different configurations for a single year.
Total Annual Rainfall (m)
Total Copper Released/Configuration (g)1
Arrayed (54 m2) Triangle (18 m2) Stack (14.4 m2)
0.375 203 68 54
0.750 405 135 108
1.125 608 203 164
1.500 810 270 216 1Values reflect an assumption that any runoff leaving the poles will contain an average of least 10 mg of copper per liter.
Table VI-3. Predicted copper concentrations in 75 or 150 mm of soil with densities between 1620 and 2160 kg per cubic meter beneath 15 Class 4, 13.3 m long poles subjected to four different rainfall levels over a one year period.
Annual Rainfall (m) Estimated Copper Concentration (ppm)1
0-75 mm deep zone 0-150 mm deep zone
0.375 23.2-30.8 11.6-15.5
0.750 46.3-61.7 23.2-30.9
1.125 69.5-92.6 34.8-46.8
1.500 92.6-123.4 46.3-61.7 1Values reflect an assumption that any runoff leaving the poles will contain 10 mg of copper per liter and all metal remains in a soil layer either 75 or 150 mm thick. Values are expressed on a mg of copper per kg of soil basis (ppm).

Oregon State University Utility Pole Research Cooperative _________________________________________________________
137
Literature Cited
American Wood Protection Association. 2012. Standard U1-12 Use Category System: User specification for treated wood. In: American Wood Protection Association Annual Book of Standards, Birmingham, Alabama. American Wood Protection Association. 2012. Standard T1-12 Use Category System: Processing and treatment standard. In: American Wood Protection Association Annual Book of Standards, Birmingham, Alabama. Anonymous. 1989. Methods of soil analysis used in the soil testing laboratory at Oregon State University. Publication SM 89:4, Agricultural Experiment Station, Oregon State University, Corvallis, Oregon. Pages 9-10. Gaviak, R.G., D.A. Horneck, and R.O. Miller. 1994. Plant, soil and water reference methods for the Western region. Western States Proficiency testing program soil and plant analytical methods Version 4.00. WREP 125. Pages 120-122 Morrell, J.J., K.M. Brooks, and C.M. Davis (Ed.), 2011. Managing treated wood in aquatic environments. Forest Products Society, Madison, WI. 501 p. Morrell, J.J. and H. Chen. 2008. Migration of pentachlorophenol from treated poles in storage and its mitigation. In: Proceedings, International Conference on Overhead Lines. Fort Collins, Colorado. Pages 445-455. Morrell, J.J. and J. Huffman. 2004. Copper, chromium, and arsenic levels in soils surrounding posts treated with chromate copper arsenate (CCA). Wood and Fiber Science 36:119-128.
Morrell, J.J., D. Keefe, and R.T. Baileys. 2003. Copper, zinc, and arsenic in soil surrounding Douglas-fir poles treated with ammoniacal copper zinc arsenate (ACZA).J. Environmental Quality 32:2095-2099.
Morrell, J.J., C.S. Love, and C. Freitag. 2010. Metal migration from Douglas-fir poles treated with ammoniacal copper zinc arsenate according to Best Management Practices. Document No IRG/WP/10-50272. International Research Group on Wood Protection, Stockholm, Sweden. 14 pages Muraka, I.P., R. Malecki, B. Taylor, B. Hensel, and J. Roewer. 1996. Release, migration and degradation of pentachlorophenol around in-service utility poles. Proceedings American Wood Preservers’ Association 92:180-187. Western Wood Preservers’ Institute (WWPI). 2013. Best Management Practices for the use of treated wood in aquatic environments. Western Wood Preservers Institute, Vancouver, WA.
34th Annual Report 2014 ___________________________
Zagury, G.R., R. Samson, and L. Deschenes. 2003. Occurrence of metals in soil and ground water near chromate copper arsenate treated utility poles. J. Environmental Quality 32:507-514.