oregon passenger rail eis project leadership council hal gard, rail administrator, odot john sibold,...
TRANSCRIPT
Oregon Passenger Rail EIS Project Leadership Council
Hal Gard, Rail Administrator, ODOTJohn Sibold, Cascade Rail Corridor Director, WSDOT
Salem, ORJune 6, 2012
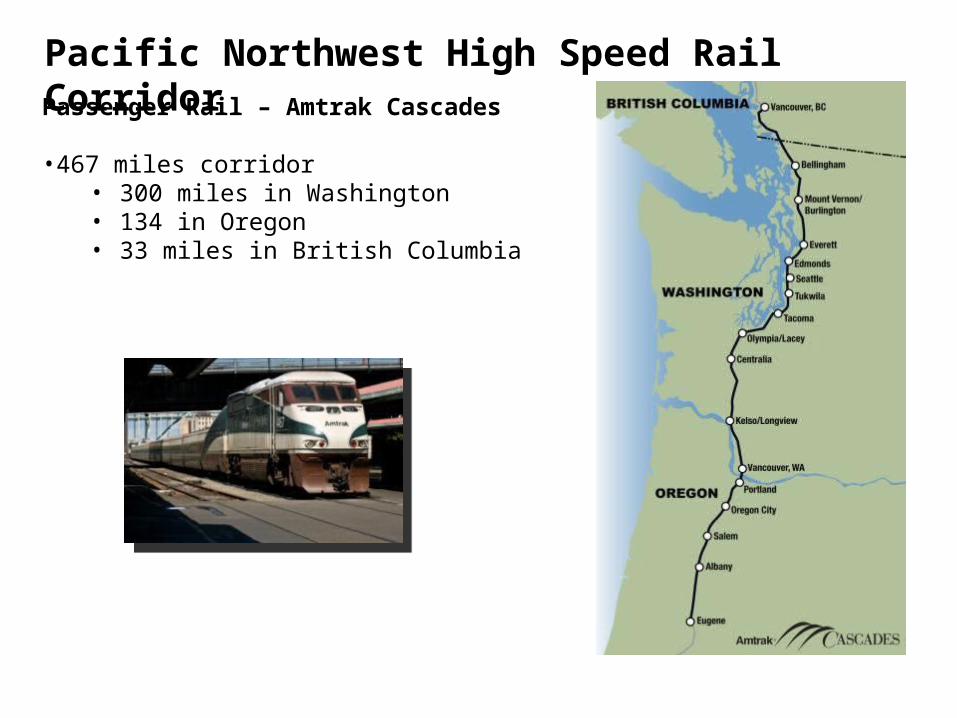
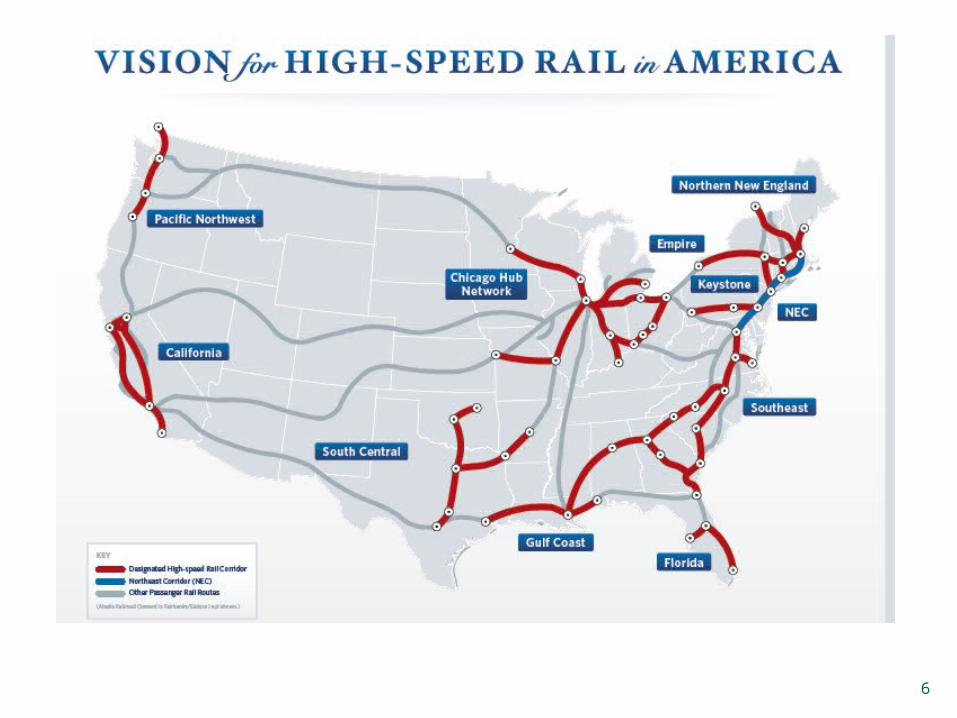
Pacific Northwest High Speed Rail CorridorPassenger Rail – Amtrak Cascades
•467 miles corridor • 300 miles in Washington• 134 in Oregon• 33 miles in British Columbia
Pacific Northwest High Speed Rail Corridor
Amtrak Cascades Passenger Rail
Eleven daily trains totaling 4,015 annually:•4 daily round trips between Seattle & Portland•2 round trips between Seattle & Vancouver, B.C.•2 round trips between Eugene & Portland
Five trainsets:•Washington owns three•Amtrak owns two
Website www.AmtrakCascades.com
Partnership
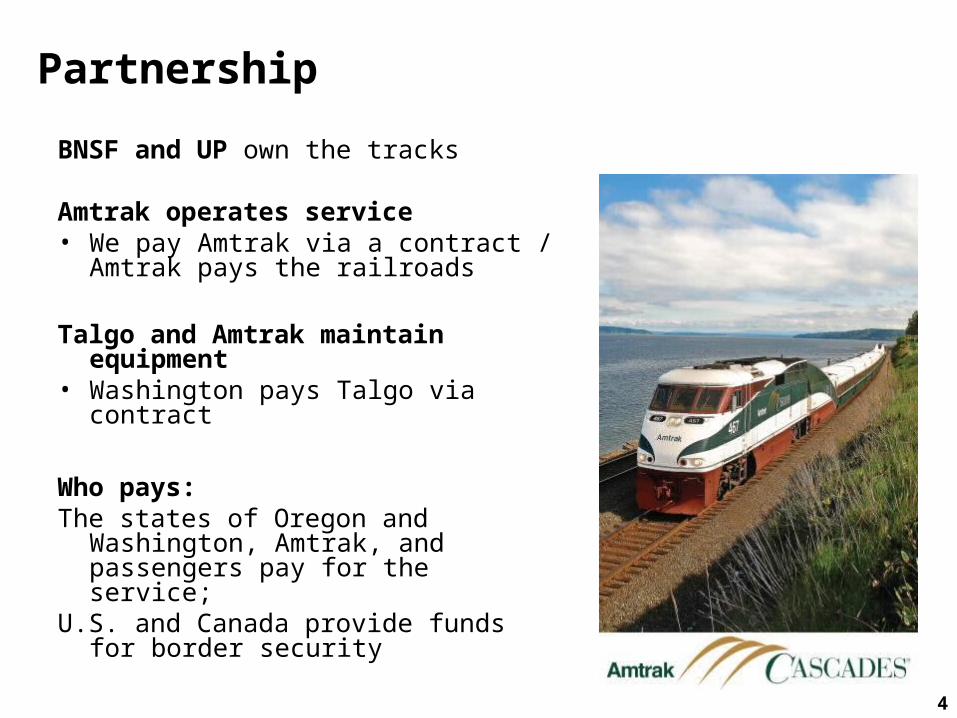
BNSF and UP own the tracks
Amtrak operates service• We pay Amtrak via a contract /
Amtrak pays the railroads
Talgo and Amtrak maintain equipment
• Washington pays Talgo via contract
Who pays: The states of Oregon and Washington,
Amtrak, and passengers pay for the service;
U.S. and Canada provide funds for border security
4
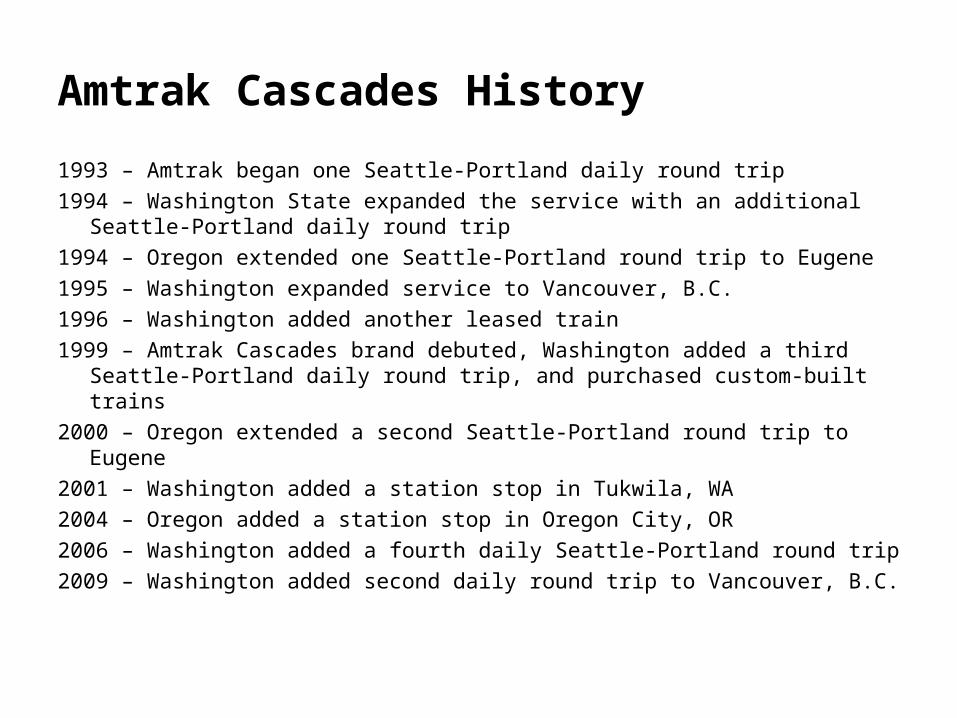
Amtrak Cascades History
1993 – Amtrak began one Seattle-Portland daily round trip
1994 – Washington State expanded the service with an additional Seattle-Portland daily round trip
1994 – Oregon extended one Seattle-Portland round trip to Eugene
1995 – Washington expanded service to Vancouver, B.C.
1996 – Washington added another leased train
1999 – Amtrak Cascades brand debuted, Washington added a third Seattle-Portland daily round trip, and purchased custom-built trains
2000 – Oregon extended a second Seattle-Portland round trip to Eugene
2001 – Washington added a station stop in Tukwila, WA
2004 – Oregon added a station stop in Oregon City, OR
2006 – Washington added a fourth daily Seattle-Portland round trip
2009 – Washington added second daily round trip to Vancouver, B.C.
6
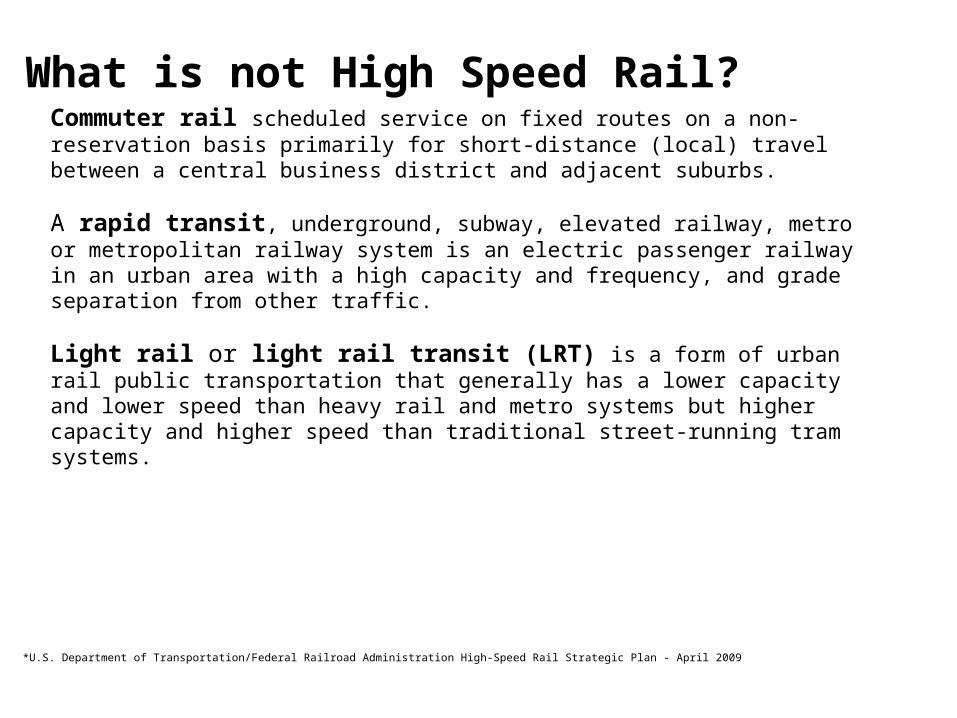
What is not High Speed Rail?
*U.S. Department of Transportation/Federal Railroad Administration High-Speed Rail Strategic Plan - April 2009
Commuter rail scheduled service on fixed routes on a non-reservation basis primarily for short-distance (local) travel between a central business district and adjacent suburbs.
A rapid transit, underground, subway, elevated railway, metro or metropolitan railway system is an electric passenger railway in an urban area with a high capacity and frequency, and grade separation from other traffic.
Light rail or light rail transit (LRT) is a form of urban rail public transportation that generally has a lower capacity and lower speed than heavy rail and metro systems but higher capacity and higher speed than traditional street-running tram systems.
Conventional RailEmerging High
Speed Rail (HSR)HSR – Regional
HSR and Intercity Passenger Rail (IPR)
HSR – Express
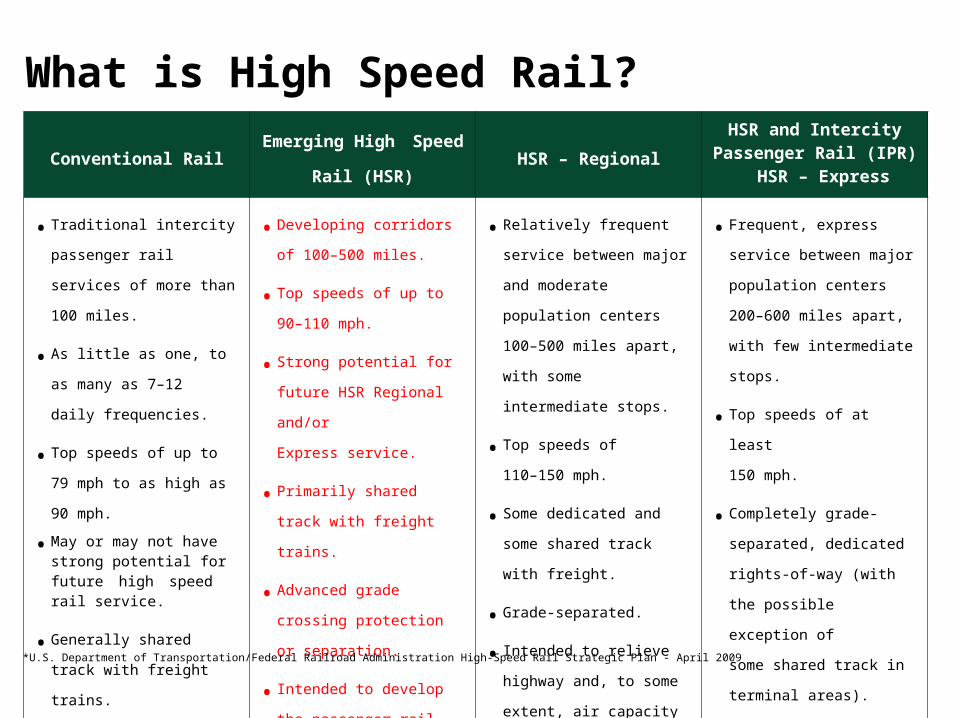
• Traditional intercity
passenger rail services of
more than 100 miles.
• As little as one, to as many
as 7–12 daily frequencies.
• Top speeds of up to 79 mph
to as high as 90 mph.
• May or may not have strong potential for future high speed rail service.
• Generally shared track with
freight trains.
• Intended to provide travel
options and to develop the
passenger rail market for
further development in
the future.
• Developing corridors of 100–
500 miles.
• Top speeds of up to
90–110 mph.
• Strong potential for future
HSR Regional and/or
Express service.
• Primarily shared track with
freight trains.
• Advanced grade crossing
protection or separation.
• Intended to develop the
passenger rail market, and
provide some relief to
other modes.
• Relatively frequent service
between major and
moderate population centers
100–500 miles apart, with
some intermediate stops.
• Top speeds of
110–150 mph.
• Some dedicated and some
shared track with freight.
• Grade-separated.
• Intended to relieve highway
and, to some extent, air
capacity constraints.
• Frequent, express service
between major population
centers 200–600 miles apart,
with few intermediate stops.
• Top speeds of at least
150 mph.
• Completely grade-separated,
dedicated rights-of-way (with
the possible exception of
some shared track in
terminal areas).
• Intended to relieve air
and highway
capacity constraints.
What is High Speed Rail?
*U.S. Department of Transportation/Federal Railroad Administration High-Speed Rail Strategic Plan - April 2009
Federally-funded Investment Outcomes
• Washington was successful in securing nearly $800 million in federal funds due to strategic state investments
• Supports overall program goal of more frequent and reliable Amtrak Cascades service
– Two additional round trips between Seattle and Portland; for a total of six
– Improved on-time performance to 88%
– 10-minute time savings
• 20 projects building additional rail line capacity and upgrading tracks, utilities, signals, passenger stations and advanced warning systems
• ODOT EIS to lead way for future federal investment in HSR corridor - $10 million ($4.2 million ARRA funds/$5.8 million Oregon funds)
9
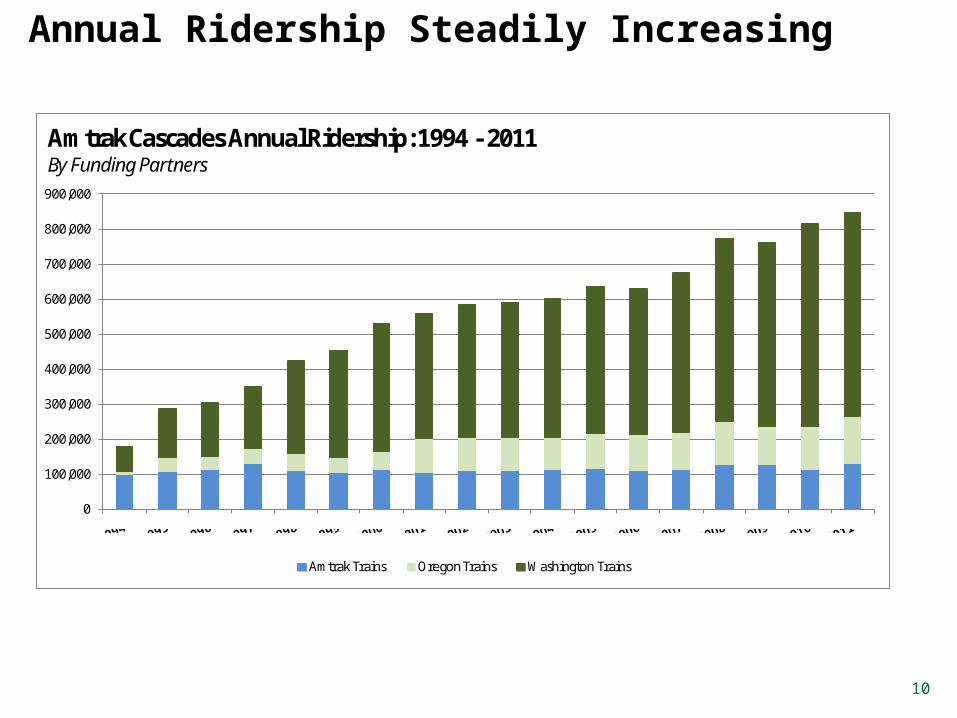
Annual Ridership Steadily Increasing
10
0
100,000
200,000
300,000
400,000
500,000
600,000
700,000
800,000
900,000
Amtrak Cascades Annual Ridership: 1994 - 2011By Funding Partners
Amtrak Trains Oregon Trains Washington Trains
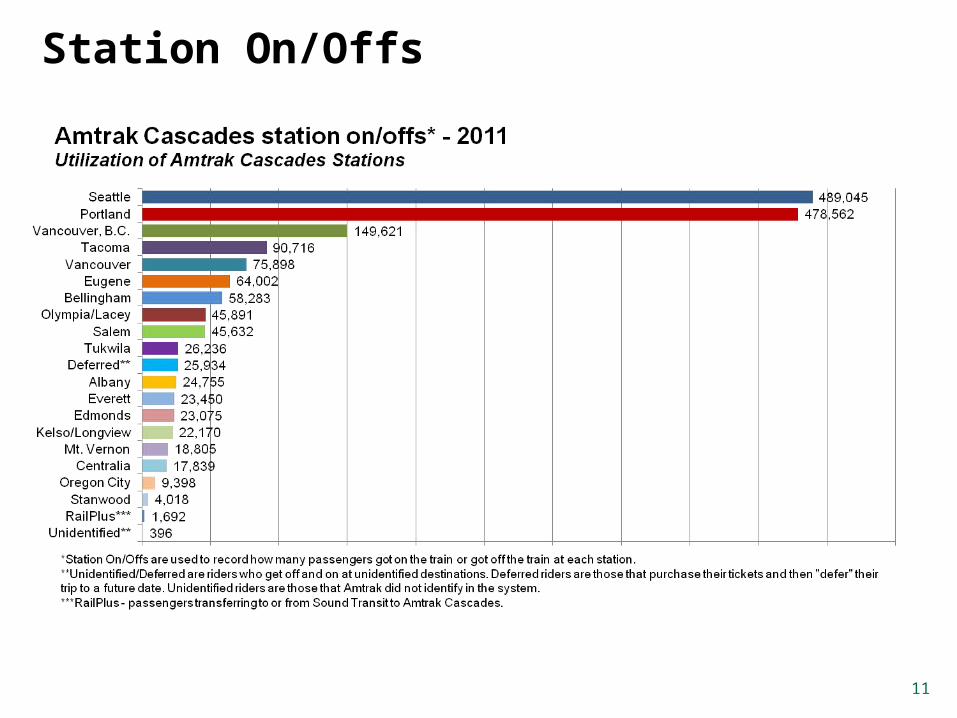
Station On/Offs
11
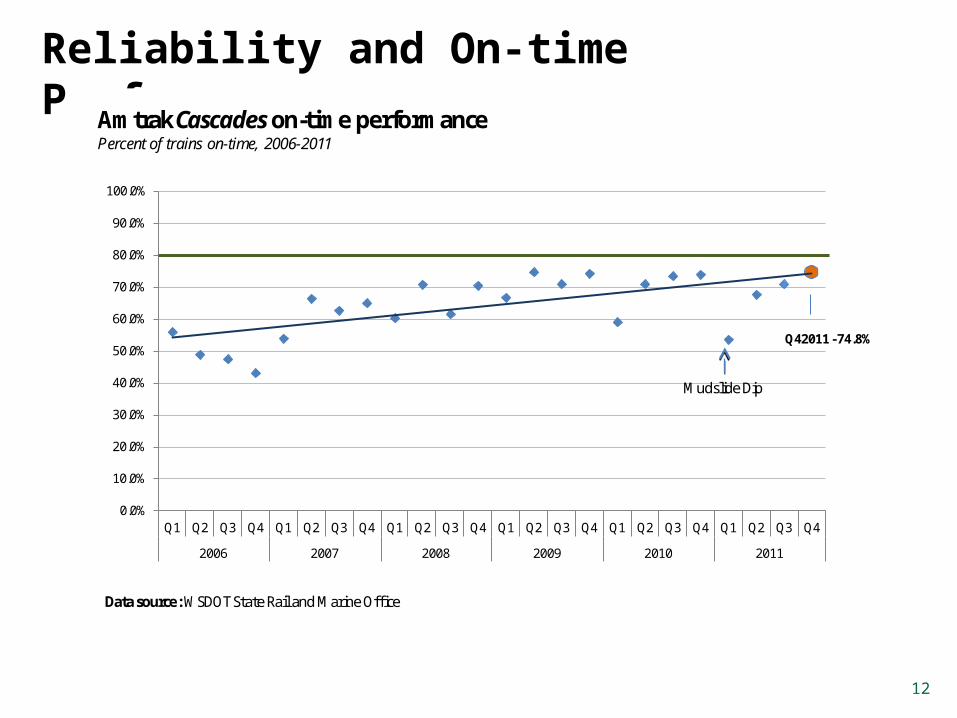
Reliability and On-time Performance
12
Q42011 - 74.8%
0.0%
10.0%
20.0%
30.0%
40.0%
50.0%
60.0%
70.0%
80.0%
90.0%
100.0%
Q1 Q2 Q3 Q4 Q1 Q2 Q3 Q4 Q1 Q2 Q3 Q4 Q1 Q2 Q3 Q4 Q1 Q2 Q3 Q4 Q1 Q2 Q3 Q4
2006 2007 2008 2009 2010 2011
Amtrak Cascades on-time performancePercent of trains on-time, 2006-2011
Data source: WSDOT State Rail and Marine Office
Mudslide Dip
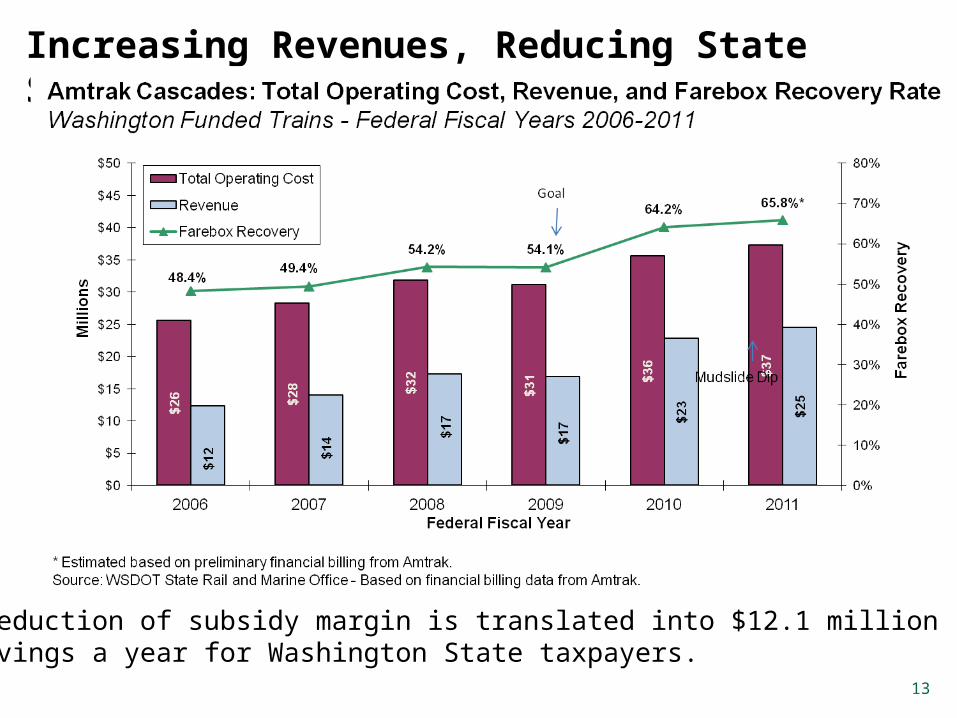
Increasing Revenues, Reducing State Subsidy
13
The reduction of subsidy margin is translated into $12.1 million in savings a year for Washington State taxpayers.
14
$30.3$28.6
$0
$5
$10
$15
$20
$25
$30
$35
$0
$500,000
$1,000,000
$1,500,000
$2,000,000
$2,500,000
$3,000,000
$3,500,000
$4,000,000
$4,500,000
$5,000,000
Jan Feb Mar Apr May Jun Jul Aug Sep Oct Nov Dec 2011 2010
Mill
ions
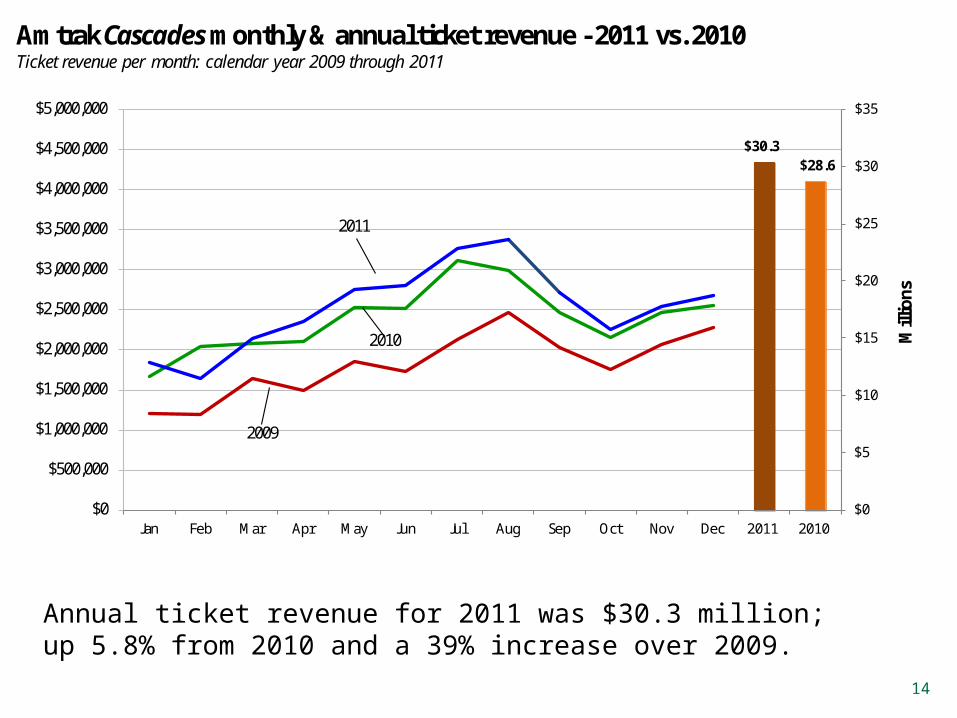
Amtrak Cascades monthly & annual ticket revenue - 2011 vs. 2010Ticket revenue per month: calendar year 2009 through 2011
2009
2010
2011
Annual ticket revenue for 2011 was $30.3 million; up 5.8% from 2010 and a 39% increase over 2009.
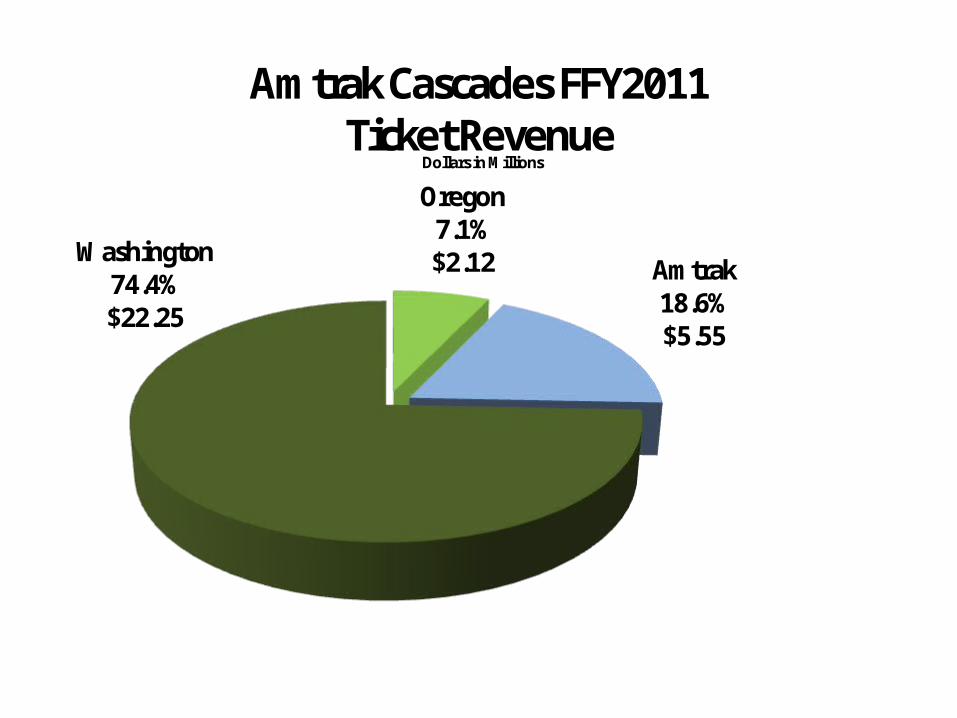
Amtrak Cascades FFY2011 Ticket Revenue
Washington74.4%$22.25
Dollars in Millions
Oregon 7.1% $2.12 Amtrak
18.6%$5.55
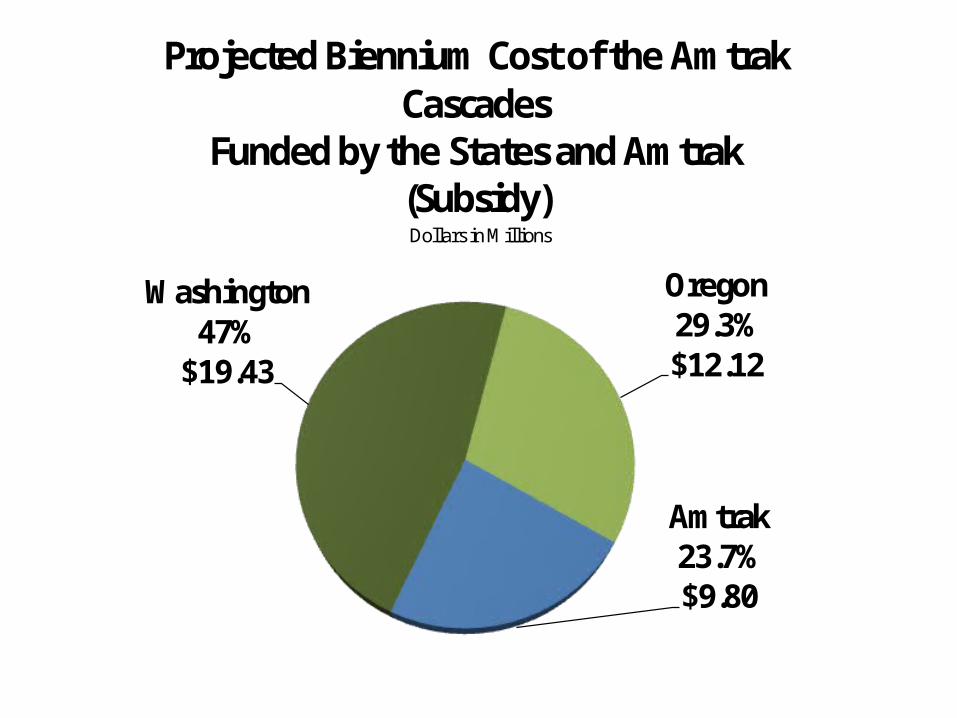
Amtrak 23.7%$9.80
Washington47%
$19.43
Oregon29.3%$12.12
Projected Biennium Cost of the Amtrak Cascades
Funded by the States and Amtrak(Subsidy)Dollars in Millions
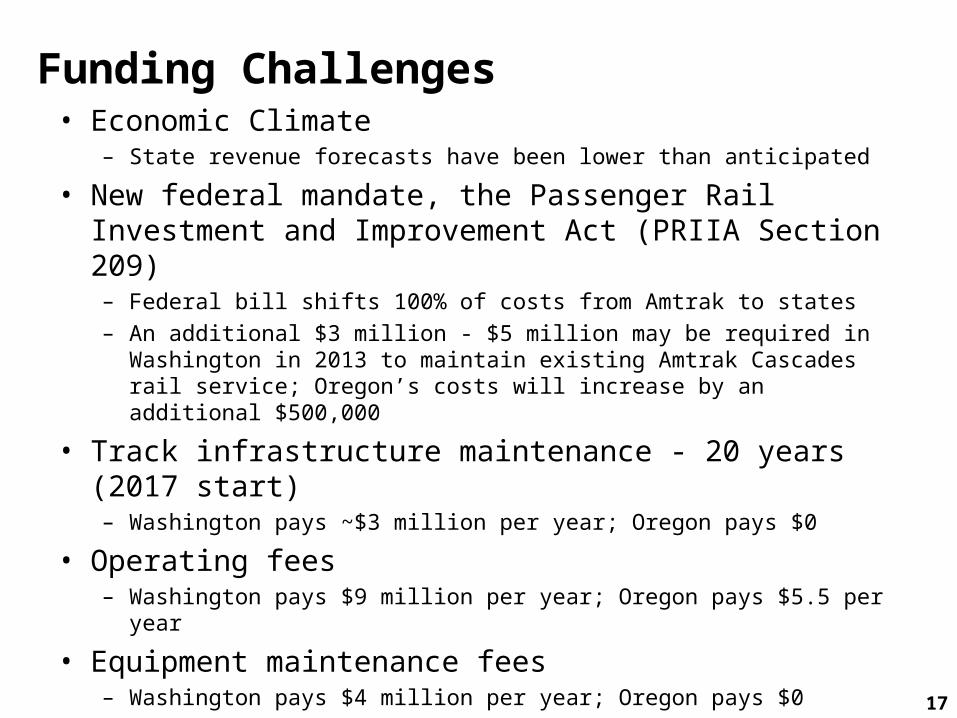
Funding Challenges• Economic Climate
– State revenue forecasts have been lower than anticipated
• New federal mandate, the Passenger Rail Investment and Improvement Act (PRIIA Section 209)– Federal bill shifts 100% of costs from Amtrak to states
– An additional $3 million - $5 million may be required in Washington in 2013 to maintain existing Amtrak Cascades rail service; Oregon’s costs will increase by an additional $500,000
• Track infrastructure maintenance - 20 years (2017 start)– Washington pays ~$3 million per year; Oregon pays $0
• Operating fees – Washington pays $9 million per year; Oregon pays $5.5 per year
• Equipment maintenance fees – Washington pays $4 million per year; Oregon pays $0
17
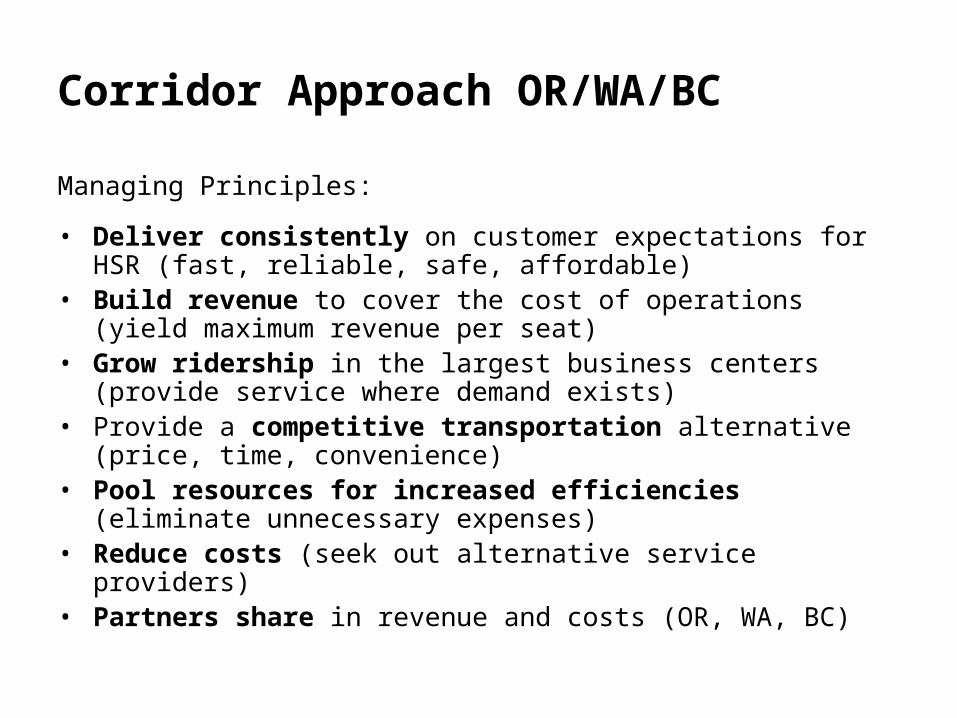
Corridor Approach OR/WA/BC
Managing Principles:
• Deliver consistently on customer expectations for HSR (fast, reliable, safe, affordable)
• Build revenue to cover the cost of operations (yield maximum revenue per seat)
• Grow ridership in the largest business centers (provide service where demand exists)
• Provide a competitive transportation alternative (price, time, convenience)
• Pool resources for increased efficiencies (eliminate unnecessary expenses)
• Reduce costs (seek out alternative service providers)• Partners share in revenue and costs (OR, WA, BC)
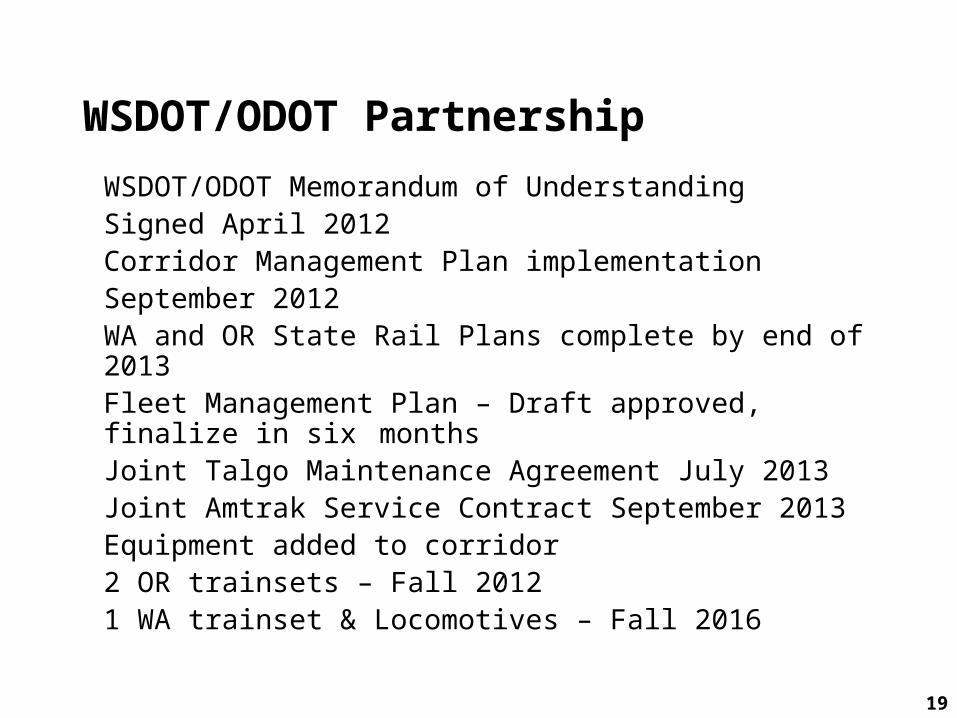
WSDOT/ODOT Partnership
WSDOT/ODOT Memorandum of Understanding Signed April 2012
Corridor Management Plan implementationSeptember 2012
WA and OR State Rail Plans complete by end of 2013Fleet Management Plan – Draft approved, finalize in six monthsJoint Talgo Maintenance Agreement July 2013Joint Amtrak Service Contract September 2013Equipment added to corridor
2 OR trainsets – Fall 20121 WA trainset & Locomotives – Fall 2016
19
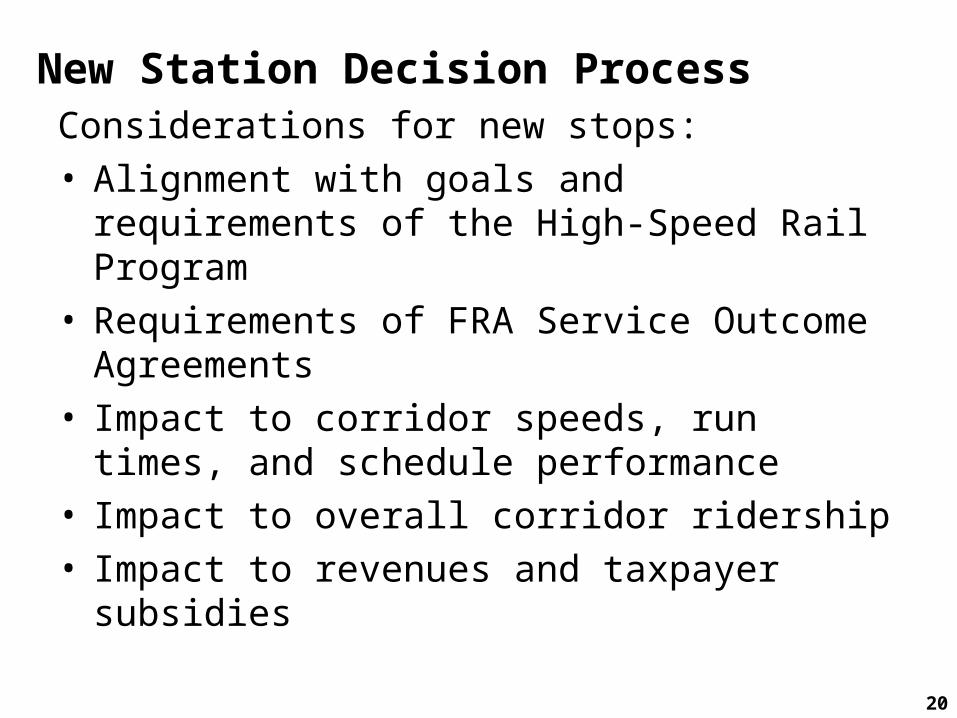
New Station Decision ProcessConsiderations for new stops:• Alignment with goals and requirements of the
High-Speed Rail Program• Requirements of FRA Service Outcome
Agreements• Impact to corridor speeds, run times, and
schedule performance• Impact to overall corridor ridership• Impact to revenues and taxpayer subsidies
20
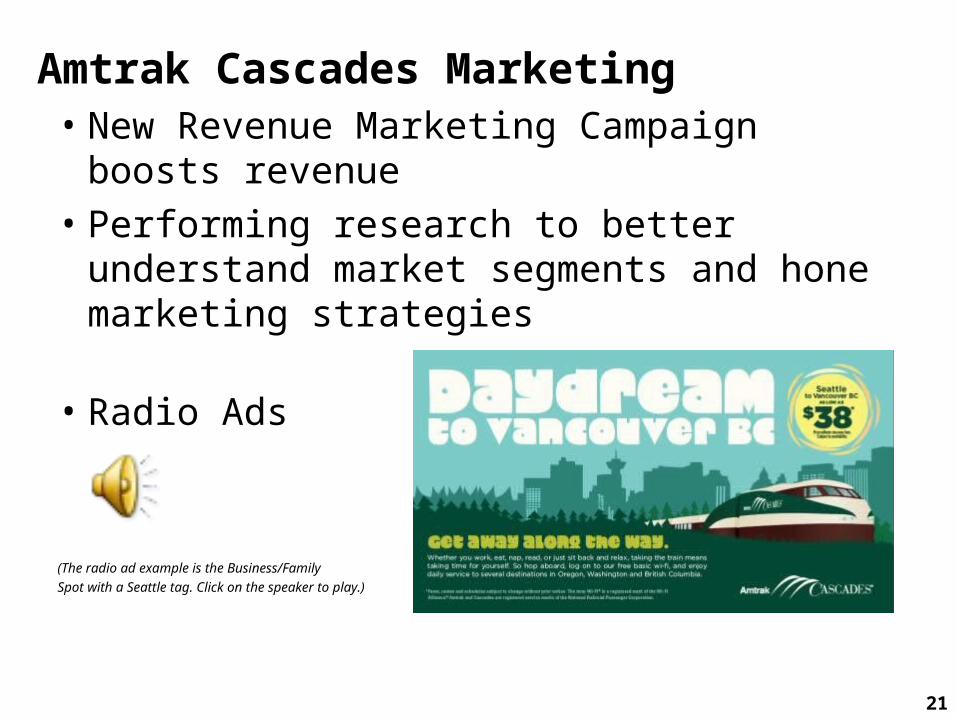
Amtrak Cascades Marketing• New Revenue Marketing Campaign boosts
revenue• Performing research to better understand
market segments and honemarketing strategies
• Radio Ads
(The radio ad example is the Business/Family
Spot with a Seattle tag. Click on the speaker to play.)
21
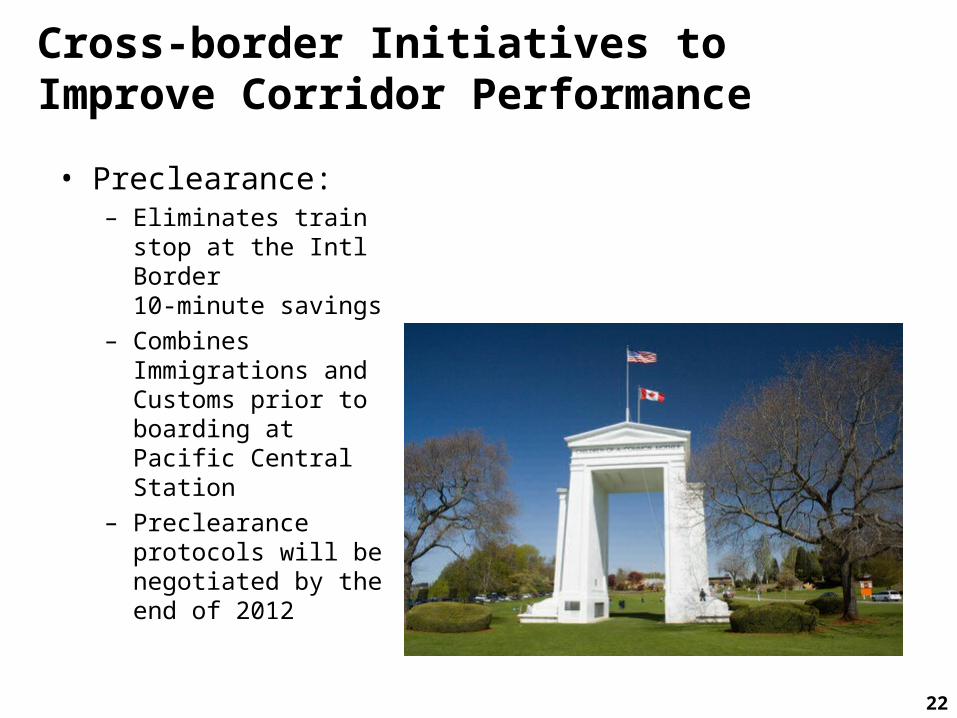
Cross-border Initiatives to Improve Corridor Performance
• Preclearance:– Eliminates train stop
at the Intl Border 10-minute savings
– Combines Immigrations and Customs prior to boarding at Pacific Central Station
– Preclearance protocols will be negotiated by the end of 2012
22