estimating ksat for infiltration assessment – wsdot … infiltration assessment – wsdot...
TRANSCRIPT

TONY ALLEN, State Geotechnical EngineerMay 16, 2017
Estimating Ksat for Infiltration Assessment – WSDOT Approach

Presentation Overview
• Infiltration rate estimation concepts• Advantages and disadvantages of infiltration field testing
methods• Typical WSDOT approach for estimating infiltration rate• Research to improve Ksat estimation using grain size
data• Quantifying the reliability of infiltration design• On-going research to develop methodology to estimate
infiltration rate in embankment side slopes

Infiltration Rate Estimation Concepts
Infiltration Rate Estimation
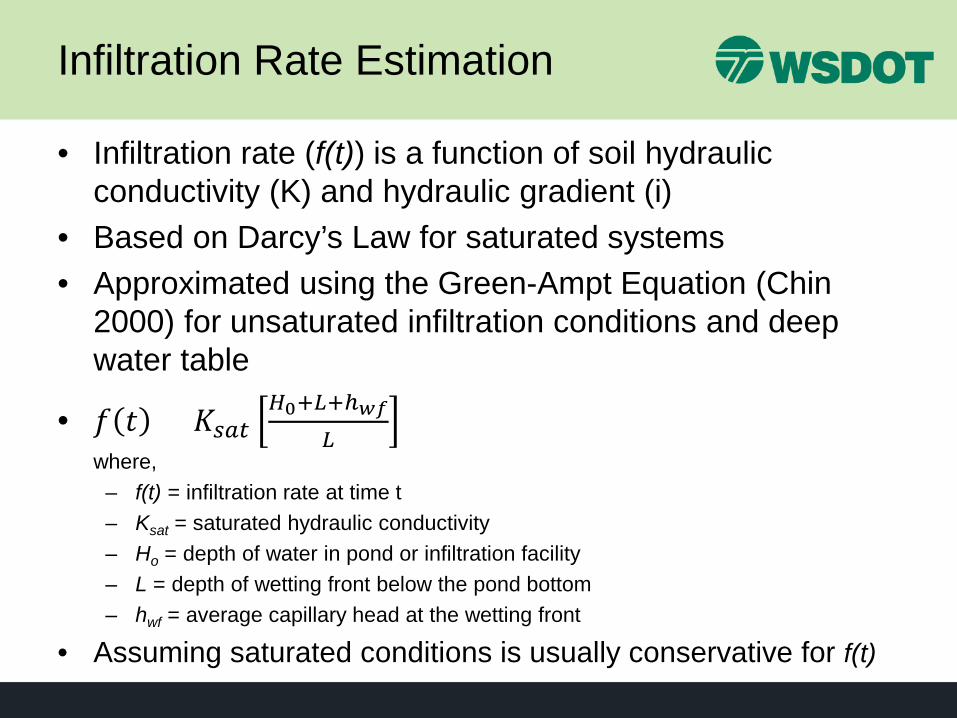
• Infiltration rate (f(t)) is a function of soil hydraulic conductivity (K) and hydraulic gradient (i)
• Based on Darcy’s Law for saturated systems• Approximated using the Green-Ampt Equation (Chin
2000) for unsaturated infiltration conditions and deep water table
• 𝑓𝑓 𝑡𝑡 = 𝐾𝐾𝑠𝑠𝑠𝑠𝑠𝑠𝐻𝐻0+𝐿𝐿+ℎ𝑤𝑤𝑤𝑤
𝐿𝐿where,
– f(t) = infiltration rate at time t– Ksat = saturated hydraulic conductivity– Ho = depth of water in pond or infiltration facility– L = depth of wetting front below the pond bottom– hwf = average capillary head at the wetting front
• Assuming saturated conditions is usually conservative for f(t)

Infiltration Rate Estimation
• For deep water table sites, i = 1.0 is usually conservative, or can use Green-Ampt equation
• For shallow groundwater sites or where low permeability layer is present at shallow depths, i < 1.0 is likely
• For shallow water table conditions where groundwater mounding is possible, Massman (2003) recommended the following to calculate the hydraulic gradient for ponds:– 𝑖𝑖 ≈ 0.73𝐴𝐴𝑝𝑝𝑝𝑝𝑝𝑝𝑝𝑝−0.76 𝐷𝐷𝑤𝑤𝑤𝑤+𝐷𝐷𝑝𝑝𝑝𝑝𝑝𝑝𝑝𝑝
138.62𝐾𝐾𝑠𝑠𝑠𝑠𝑤𝑤0.1
where,• Dwt = depth to water table or first low permeability layer (i.e., aquiclude) (ft)• Dpond = depth of water in pond (ft)• Ksat = saturated hydraulic conductivity (ft/day)
– Targeted for typical conditions in western WA– An approximation to account for the reduction in hydraulic gradient due
to ground water mounding– This is a steady state hydraulic gradient

Infiltration Rate Estimation
• These gradient approximations may not apply to infiltration in highway embankment slopes
• Currently approximated as a very shallow pond or trench using equations in HRM (e.g., for CAVFS)
• Current research may provide an update to this

Infiltration Rate Estimation
• Ksat value used is harmonic mean if soil is layered:
𝐾𝐾𝑒𝑒𝑒𝑒𝑒𝑒𝑒𝑒𝑒𝑒 =𝑑𝑑
∑ 𝑑𝑑𝑒𝑒𝐾𝐾𝑒𝑒where,
• d = total depth of soil column (limit to 20 times BMP depth, but not less than 2.5dpond)
• di = thickness of layer i in the soil column• Ki = Ksat for each soil layer
• For ponds, siltation and biofouling reduction factors usually needed (ranges from 0.2 to 0.9)
• Also consider aspect ratio of pond: CFaspect = 0.02(Lpond/Wpond) + 0.98• WSDOT HRM says siltation and biofouling reduction factors not
applicable to slope treatments (e.g., CAFVS), but compaction factor applied to Ksat does apply (ranges from 0.067 to 0.2)
• fcorr = CFsilt/bioCFaspectKequivi

Infiltration Field Tests

Infiltration Rates from Field TestsDouble-ring Infiltrometer Test• 2 to 3 ft diameter cylinder inserted in ground with a second larger
diameter cylinder inserted around the first cylinder• Water is poured into inner ring, keeping water level constant by
continuously adding water• Quantity of water added during specified time is recorded• Correction factors are often applied to measured infiltration rate to
address the test scale, site variability, and potential for clogging in the full scale infiltration facility
• Test tends to significantly over-estimate the infiltration due to:– Gradient that is too high relative to the full scale infiltration gradient– Only the surficial soils are tested– Localized variability in the soil and moisture conditions– Does not address long-term effects due to bio-fouling and siltation

Infiltration Rates from Field TestsPilot Infiltration Test (PIT)• Test pit is excavated with backhoe• Enough water is added to pit to keep water level approximately 1 to
2 ft deep ft above pit bottom for a minimum of 6 hrs but more typically 17 hrs
• Test tends to over-estimate the infiltration due to:– Gradient that is too high relative to the full scale infiltration gradient, especially
depending on time of year test is conducted (winter versus summer)– Model to estimate infiltration rate assumes one-dimensional flow, whereas the
flow is in three directions; therefore Q and infiltration rate are too high– Only the surficial soils are tested, but significantly deeper than double-ring
infiltrometer– Localized variability in the soil and moisture conditions– Does not address long-term effects due to bio-fouling and siltation
• Test is often not practical due to large volume of water required and long length of test

Infiltration Rates from Field TestsGuelph Permeameter
• Focus of test is to estimate Ksat in-situ• Essentially a reduced scale constant head borehole
permeameter that can be applied to unsaturated conditions
• WSDOT currently limits its use to natural dispersion of runoff into the highway embankment side slopes
• Limited to eastern WA (i.e., drier conditions and relatively deep water table)
• Multiple tests conducted to account for site variability• Generally used for depths of 3 ft or less, but can be used
a few feet deeper if needed

Infiltration Rates from Field TestsBorehole Tests• Borehole tests (e.g., a Slug Test, Seepage Test, or Packer
Permeability Test) can be used to obtain Ksat for deeper strata• In general, these tests obtain Ksat in the horizontal direction, or
possibly a bulk Ksat
• Should be isolated to single soil layer making sure that the hole is screened and sealed properly to accomplish this
• Can be conducted above or below the water table, depending on the type of test (e.g., seepage test – above the water table; slug test –below the water table)
• The hydraulic gradient is usually difficult to determine with certainty for any of these tests
• Strongly affected by near well conditions such as gravel pack, poor well development, skin effects, etc.
• Full scale aquifer pumping tests could also be conducted to get a more accurate determination of the bulk hydraulic conductivity, but very expensive and generally not used for infiltration design

Estimating Infiltration RatesConclusions Regarding Field Tests
• Full scale flood tests or long-term full scale infiltration studies are most accurate field test for estimating infiltration, but often not practical to do, other than for research
• Smaller scale tests have the disadvantage of only addressing the surficial soils, having too high a hydraulic gradient which may be difficult to quantify, and being susceptible to localized soil property variation
• Have relied on estimating Ksat from gradation parameters or laboratory hydraulic conductivity testing
• Further investment to improve Ksat predictions based on grain size characteristics is warranted

Summary of WSDOT Approachfor Estimating Infiltration Rate
• Estimate Ksat for each soil layer using grain size analysis (currently using equation from Massman 2003 which is in WSDOT HRM and also DOE Stormwater manual)
• Estimate hydraulic gradient as summarized earlier in presentation
• Reduce Ksat/infiltration rate to address long-term maintenance and/or degree of compaction
• Alternatively, estimate Ksat/infiltration rate through Pilot Infiltration Test per DOE Manual, though this approach is rarely used by WSDOT
• No additional reduction/safety factors are applied

WSDOT Research Results Regarding Estimation of Ksat Considering Compaction

Current Research: Purpose and Scope• Hydraulic conductivity (Ksat) is key parameter to
estimate infiltration rate• Research focus
– Infiltration of storm water into embankment side slopes, but could also apply to other applications where Ksat needed
– Effect of compaction (or density) on Ksat
• Research scope– Saturated, non-cohesive soils– Testing included soil grain size, density, and large diameter rigid
and flex-wall permeameter tests• Mostly on specimens reconstituted in lab• Specimens in a loose and compacted state

Review of Previous Work
• To estimate Ksat, d10 (in mm) commonly used, as well as porosity, η, or void ratio, e
• Hazen (1892): Ksat = Cd102
where, – C = 0.4 to 1.5, – usually set equal to 1.0
• Slichter (1898): Ksat = 10.2η3.287d102
• Terzaghi (1925): 𝐾𝐾 cm/s = 𝐶𝐶0𝜇𝜇10𝜇𝜇𝑤𝑤
𝜂𝜂−0.133 1−𝜂𝜂
2𝑑𝑑102
where,– C0 = 8 for smooth grains and 4.6 for grains of irregular shape– µ10 = water viscosity at 10o C– µt = water viscosity at the soil temperature “t” (usually 20o C)– µ10/ µt usually taken as 1.30

Review of Previous Work
• Chapuis (2004): 𝐾𝐾 = 2.4622 𝑑𝑑102𝑒𝑒3
1+𝑒𝑒
0.7825
• More recently, equation developed by Massman (2003):– Log10(Ksat) = -1.57+1.90d10+0.015d60-0.013d90-2.08Ffines
– This equation is currently in DOE Stormwater Management Manual and WSDOT Highway Runoff Manual (HRM)
• Most of these equations were developed for loose soils (not compacted)
• Most Ksat equations are purely empirical in nature• Equations which include porosity or void ratio have the
best chance of addressing compaction effects• There are many Ksat equations

Laboratory Test ProgramMaterials Tested• Natural soils used to meet WSDOT borrow specifications for
embankments• Soils reconstituted from natural soils to make gradations needed• Mostly glacial in origin and angular in nature• Nonplastic soils used

• Two levels of compaction used– Uncompacted – placed moist and lightly tamped by hand using 2 in. dia. circular
tamping foot (only for uniform placement)– Compacted – placed moist using same tamping foot, but with 2.25 lbs weight and
12 in. drop– Achieved approx. 95% compaction or more for compacted specimens– Had approx. 80 to 85% compaction for uncompacted specimens
Laboratory Test ProgramSpecimen Preparation

• Rigid wall permeameter – AASHTO T215, 6 in. dia., except 9 in. dia. for coarsest soils, constant head, and used if soil d10 > 0.1 mm
• Flex wall permeameter – ASTM D5084, 6 in. dia., falling head, and used if soil d10 < 0.1 mm
• Testing was conducted such that the common mistakes in laboratory Ksattesting identified by Chapuis (2012) were avoided
Laboratory Test ProgramTest Procedures

Gradation Characteristics of Soils Tested or Included in Database
• WSDOT Testing included 36 uncompacted and 37 compacted tests• Gathered data from Chapuis (2004) as comparison, which included 137 tests,
all not specifically compacted, and mostly rounded soil particles• Outliers were removed based on criteria in in TRB Circular E-C079 (Allen et
al. 2005) - a total of 11 points, mostly at very coarse end

Relationship between MeasuredKsat and Soil d10• All WSDOT and Chapuis data based on saturated hydraulic
conductivity (Ksat) tests• Massman (2003) data are air permeability tests converted to Ksat

• Fairly strong relationship – as Cu increases, Ksat decreases• Not all of the Chapuis data could be shown, as some cases did not
have a d60 value reported
Relationship between MeasuredKsat and Soil Cu

Massman (2003) Equation

Hazen (1892) Equation

Chapuis (2004) Equation

Slichter (1898) Equation

Terzaghi (1925) Equation

Improving Method Accuracy
• Focused on “tweaking” coefficients and exponents• Used SOLVER in Excel, then made final
adjustments by hand• Optimization approach
– Lowest COV with mean as close to 1.0 as possible– Used Ksat method prediction bias (i.e., measured/predicted value)
for statistics– Method accuracy as a function of key variables addressed (i.e., no
hidden dependencies)– Considered differences between data sets, e.g., the WSDOT
uncompacted sample data, the WSDOT compacted sample data, and the data gathered by Chapuis (2004)
– Only considered saturated hydraulic conductivity test data– Did not consider air permeability test results by Massman (2003)

Optimized Methods
• Optimized Slichter Method: 𝐾𝐾𝑠𝑠𝑠𝑠𝑠𝑠 = 21.2η3.5𝑑𝑑101.75
– Original: 𝐾𝐾𝑠𝑠𝑠𝑠𝑠𝑠 = 10.2η3.287𝑑𝑑102
• Optimized Terzaghi Method:
𝐾𝐾 cm/s = 𝐶𝐶0𝜇𝜇10𝜇𝜇𝑠𝑠
𝜂𝜂 − 0.133 1 − 𝜂𝜂
1.7
𝑑𝑑101.75
– Where, C0 = 4.6 for all soils
– Original: 𝐾𝐾 cm/s = 𝐶𝐶0𝜇𝜇10𝜇𝜇𝑤𝑤
𝜂𝜂−0.133 1−𝜂𝜂
2𝑑𝑑102
– Original: C0 = 8 for smooth grains and 4.6 for grains of irregular shape
• Optimized Chapuis Method:
𝐾𝐾𝑠𝑠𝑠𝑠𝑠𝑠 = 2.1 𝑑𝑑102.24 𝑒𝑒2
1 + 𝑒𝑒
0.7825
– Original: 𝐾𝐾 = 2.4622 𝑑𝑑102𝑒𝑒3
1+𝑒𝑒
0.7825
• Optimized Hazen Method: Ksat = 0.65d101.65
– Original: K = 1.0d102
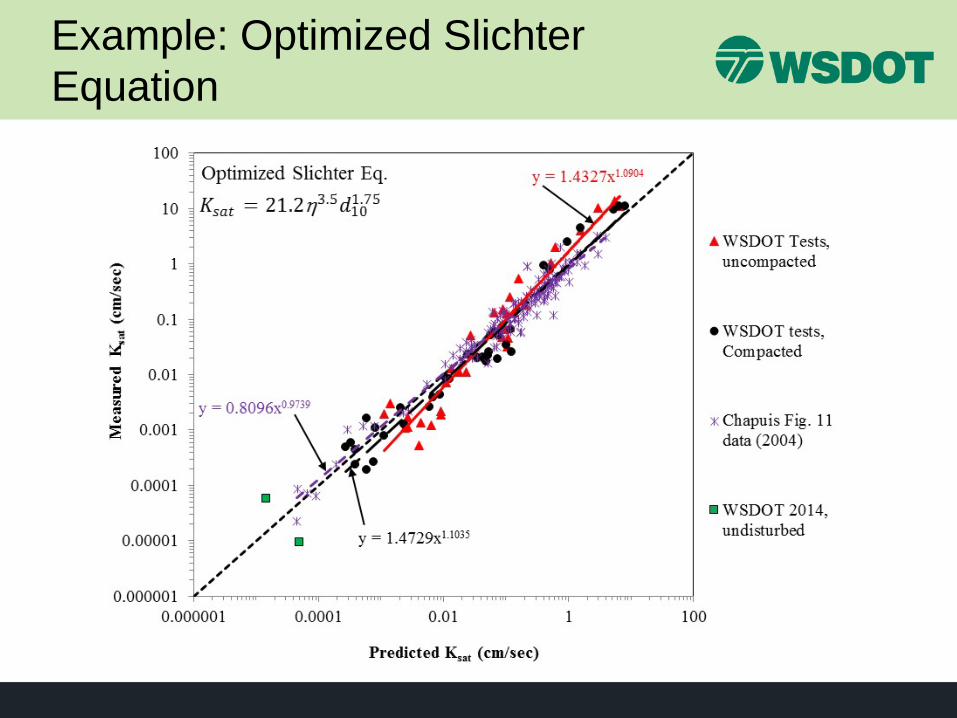
Example: Optimized Slichter Equation

Example: Optimized SlichterEquation

Summary of ObservationsRegarding Improvements
• Focused on methods that could account for compaction/density effects on Ksat
• Improved Slichter and Terzaghi methods provided similar accuracy and were best overall
• Improvements were not as effective for ChapuisMethod (also true of Cozeny-Carmen Method)
• Hazen Method could also be improved, but still does not address compaction effects
• For Slichter and Terzaghi methods, need soil porosity – how to obtain?

Obtaining the Soil Porosity
• Can measure directly (e.g., from undisturbed specimens of natural soil, from soil compaction records, etc.)
• Past η prediction efforts focused on grain size parameters (e.g., Cu), but not relative density or degree of compaction
• Proposed equation: η = P x d10a x Cu
b x (Fcp)where,– P = empirical porosity coefficient (P = 0.4)– a = empirical d10 exponent (a = -0.08)– b = empirical coefficient for Cu (b = -0.1)– Fcp = compaction factor for porosity (set equal to 1.0 if not
compacted)

Compaction Effect on Porosity
Note: Compaction effect on porosity is either “on” or “off”, but may be possible to interpolate to intermediate values. Compacted porosities approximately correspond to densest state possible, and uncompacted values approximately correspond to loosest state, at least for fill materials.

Compaction Effect on Porosity
• Plot to right assumes no d10 dependence
• No correction for compaction
• Plot to right corrects for d10 dependence for uncompacted and compacted data
• No correction for compaction

Estimating Porosity - Results
Since compacted soil porosity not affected by d10, must cancel out d10 effect needed for uncompactedsoils. Therefore,
Fcp = 0.85d100.08
In effect, the porosity equation for compacted soils simplifies to:
η = 0.34𝐶𝐶𝑒𝑒−0.1

Effect of Compaction on Porosity and Ksat• Using predicted η in optimized Slichter or Terzaghi Ksat
equations:• At d10 = 0.001 mm:
– Ksat (compacted) = 0.083 x Ksat (uncompacted)
• At d10 = 1.0 mm:– Ksat (compacted) = 0.57 x Ksat (uncompacted)
• Current WSDOT HRM:– Ksat (compacted) = 0.067 x Ksat (uncompacted) for clayey soils– Ksat (compacted) = (0.1 to 0.2) x Ksat (uncompacted) for sands
and gravels– Will be no need for these factors anyway if use the new Ksat
equations

Method Statistics – Historical Methods
Data SetNo. of Meas.,
n
Hazen Method
Slichter Method
Terzaghi Method
Chapuis Method
Mean COV Mean COV Mean COV Mean COVWSDOT uncompacted tests
36 2.39 392% 3.59 180% 1.73 173% 1.96 148%
WSDOT compacted tests
37 -- -- 2.20 83% 1.35 96% 1.76 157%
All WSDOT tests
74 -- -- 2.89 164% 1.54 149% 1.86 151%
Chapuis (2004) tests
137 1.25 90% 2.50 86% 1.20 87% 1.05 70%
All Test data 210 1.49* 294%* 2.64 125% 1.32 121% 1.33 135%*For the Hazen Equation, all test data does not include compacted WSDOT tests.

Method Statistics – Optimized Methods
*For the Hazen Equation, all test data does not include compacted WSDOT tests.
Data SetNo. of Meas.,
n
Hazen Method
SlichterMethod
Terzaghi Method
ChapuisMethod
Mean COV Mean COV Mean COV Mean COVWSDOT uncompactedtests
36 1.05 129% 1.28 83% 1.20 88% 1.41 113%
WSDOT compacted tests
37 -- -- 1.01 73% 0.90 73% 0.96 131%
All WSDOT tests
74 -- -- 1.14 80% 1.05 84% 1.18 122%
Chapuis (2004) tests
137 1.19 59% 1.02 57% 1.01 54% 1.03 55%
All Test data 211 1.16* 76%* 1.06 67% 1.02 66% 1.08 89%

Method Statistics – PorosityPrediction
Data SetNo. of
Meas., nStatistical Parameter
Proposed porosity Prediction Method
Chapuis (2004) and all WSDOT Tests
158Mean 0.99
COV 13%
All WSDOT tests 74Mean 1.01
COV 9.1%
Chapuis (2004) tests 85Mean 0.97
COV 16%
All uncompacted WSDOT tests
36Mean 1.01
COV 7.9%
All compacted WSDOT tests
38Mean 1.00
COV 10%

Method Statistics – Optimized Methods, but Using Est. Porosity
Optimized Slichter Method Optimized Terzaghi Method
Measured η Estimated η Measured η Estimated η
Data Set Mean COV Mean COV Mean COV Mean COV
WSDOT uncompacted tests 1.28 83% 1.31 88% 1.20 88% 1.23 94%
WSDOT compacted tests 1.01 73% 1.07 93% 0.90 73% 0.96 100%
All WSDOT tests 1.14 80% 1.19 91% 1.05 84% 1.09 97%Chapuis (2004) tests 1.02 57% 0.95 57% 1.01 54% 0.97 56%
All Test data 1.06 67% 1.06 79% 1.02 66% 1.03 80%
Conclusions:• Using measured porosity, both methods are about the same for accuracy• Using estimated porosity, overall both methods are about the same for accuracy, but
for the WSDOT test data, the optimized Slichter Method is slightly better than the optimized Terzaghi Method

Recommended Ksat Prediction Method• Optimized Slichter and Terzaghi equations provide most accurate
predictions with widest range of applicability, and work for rounded and angular soils, using measured or estimated porosity
• Range of applicability for the optimized Slichter Equation is shown below – optimized Terzaghi Method is similar
Range of Applicability

Application to Infiltration Design:Comparison to Current HRM

Comparison to Infiltration Rates from 1998 Thurston County Study
46
“Predicted” infiltration rates not corrected for siltation/biofouling

Comparison to Corrected Infiltration Rates from 1998 Thurston County Study
47
Predicted infiltration rates corrected for siltation/biofouling, and hydraulic gradient, i, calculated using WSDOT HRM equation for ponds

Concluding Remarks from Current Study
• Accuracy of Ksat prediction from grain size data significantly improved– Recommend optimized Slichter Equation– Best to use measured porosity, if available– Otherwise, can use grain size/compaction level based porosity equation– Optimized Slichter Equation is generally more conservative, but is also
more accurate and consistent, especially for finer grained soils, than current specified equation
– Reduction factors in WSDOT HRM for compaction no longer needed as this issue can be handled directly in proposed equation, and in general, those reduction factors are very conservative for sands and gravels
• Reduction factors for use of grain size based Ksat equation due to method uncertainty appear to be unnecessary
• Reduction factors only appear warranted if expect poor maintenance (e.g., siltation, biofouling)
48

Level of Safety for Infiltration Design

Overall Safety Factor Required
• Can be assessed through statistical reliability theory analysis (TRB Circular E-C079 - Allen et al. 2005)
• An adapted load and resistance factor approach– Resistance is infiltration rate– Load is volume of storm water generated
• Can estimate a safety factor needed to achieve maximum probability of exceedance– Need to establish what is the acceptable probability of
exceedance, considering the impact of exceedance– Have statistics needed for method uncertainty in estimating
infiltration rate – can combine with site variability statistics– Need statistics for estimation of storm water volume to be
infiltrated– Can use Monte Carlo method to conduct analysis

Bias Statistical Distributions (CDF) for Original and Optimized Terzaghi Equations
Differences in variability for these equations is greatest when bias > 1

Bias Dependency Issues
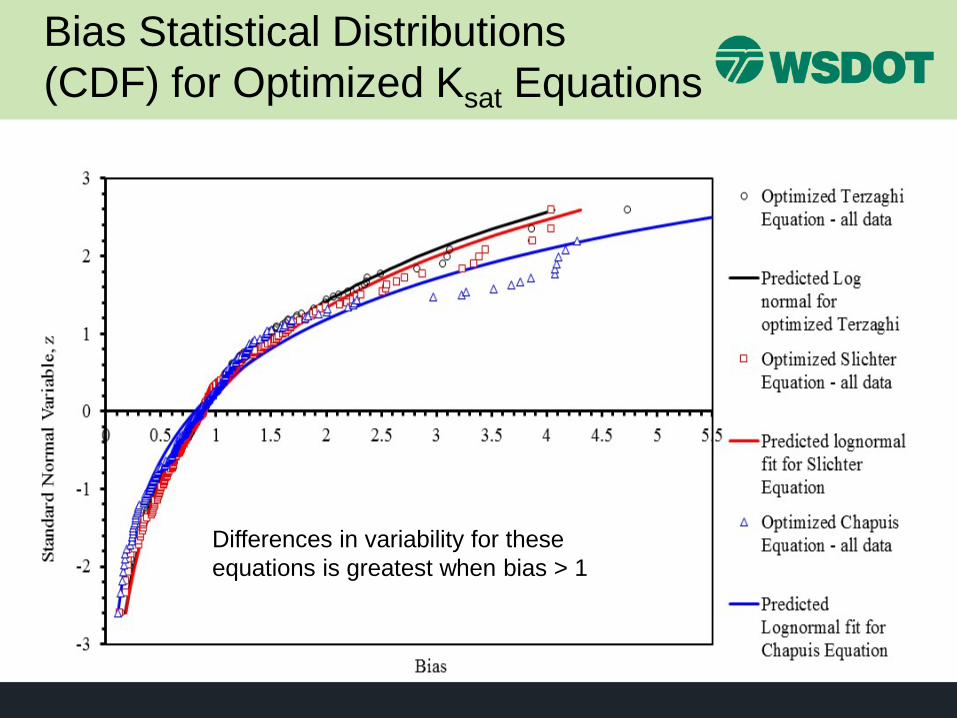
Bias Statistical Distributions (CDF) for Optimized Ksat Equations
Differences in variability for these equations is greatest when bias > 1

Statistical Data Distributions for various Prediction Methods• Lower tail of Ksat prediction statistics most important for infiltration design• Upper tail of storm water volume statistics will be most important for
infiltration design

Current On-Going WSDOT Research on infiltration of Storm Water in Highway Embankments
Future Research Underway –Plan
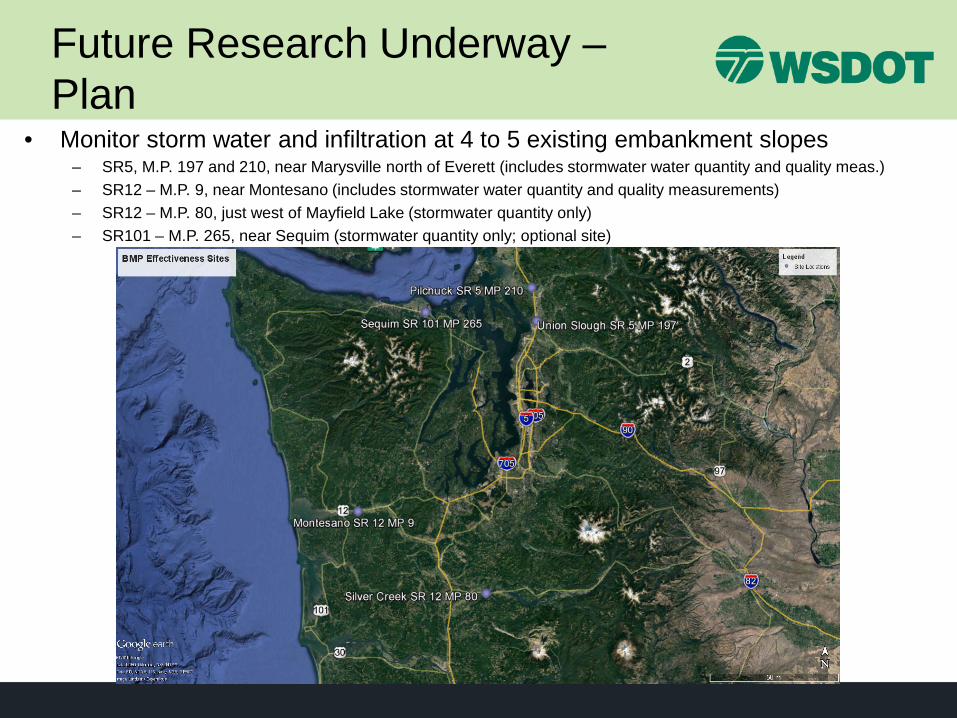
• Monitor storm water and infiltration at 4 to 5 existing embankment slopes– SR5, M.P. 197 and 210, near Marysville north of Everett (includes stormwater water quantity and quality meas.)– SR12 – M.P. 9, near Montesano (includes stormwater water quantity and quality measurements)– SR12 – M.P. 80, just west of Mayfield Lake (stormwater quantity only)– SR101 – M.P. 265, near Sequim (stormwater quantity only; optional site)

Future Research Underway –Plan• Monitor storm water and infiltration at up to 5 existing embankment
slopes (typically 3:1 side slopes, 10 to 15 ft in height)• Subsurface characterization (in general, 3 test holes and
piezometers per site)• Measure Ksat from lab tests, both disturbed and undisturbed soil
samples• Measure Ksat from field permeability tests – mainly borehole tests
(constant head hydraulic conductivity test in single borehole)• Measure stormwater inflow at road edge, 6 ft below road shoulder
edge, and any water outflow or runoff at slope toe• Analytically model slopes using programs such as MODFLOW• Develop design model for assessing infiltration in embankments (for
MGSFlood)• Update Ksat prediction equations using new Ksat and gradation test
results from field study

Example Test Site Setup
Fill
Sands and silts
31
Surface watercollection
Test hole and piezometer (typ.)RainGauge
40 ft length
80 ft length
80 ft length

Example Test Site Setup
40 ft
80 ft
80 ft
Highway
Toe of slope
Surface watercollectionDown slope

Questions?