optimization the design of venturi gas mixer for syngas
TRANSCRIPT

Journal of Mechanical Science and Technology 25 (9) (2011) 2285~2296
www.springerlink.com/content/1738-494x DOI 10.1007/s12206-011-0612-8
Optimization the design of venturi gas mixer for syngas engine using
three-dimensional CFD modeling† Dominicus Danardono1, Ki-Seong Kim1,*, Sun-Youp Lee2 and Jang-Hee Lee2
1Department of Mechanical Design Engineering, Chonnam National University, Jeonnam 550-749, Korea 2Korean Institute of Machinery and Materials, Daejon 305-343, Korea
(Manuscript Received February 10, 2011; Revised April 25, 2011; Accepted April 25, 2011)
----------------------------------------------------------------------------------------------------------------------------------------------------------------------------------------------------------------------------------------------------------------------------------------------
Abstract A venturi mixer prototype is developed for mixing air and synthesis gas or “syngas” as a fuel. Syngas is recognized as a viable energy
source worldwide, particularly for stationary power generation. It has a very low energy density, so a mixer with λ (ratio of actual to stoichiometric air-fuel ratio) in the range of 1.1 to 1.7 is expected. In this study, three-dimensional computational fluid dynamics (CFD) modeling is used to investigate and analyze the influence of the throat diameter, gas chamber thickness and gas exits diameter on mixer characteristics and performance. Attention is focused on the effect of venturi mixer geometry on the air-fuel ratio, pressure loss and mix-ing quality. Based on the numerical results, an optimized design of venturi gas mixer is made. The optimized design has λ in the range of 1.2 to 1.3, and gives very good mixing quality and acceptable pressure loss. The CFD results are validated with experimental data. The CFD results show good agreement with experimental data.
Keywords: Air-fuel ratio; Pressure loss; Mixing quality; Syngas; Venturi mixer; CFD ---------------------------------------------------------------------------------------------------------------------------------------------------------------------------------------------------------------------------------------------------------------------------------------------- 1. Introduction
A gas mixer mixes the air and fuel gas and plays a very im-portant role in the performance of a gas engine. A venturi gas mixer is a device that uses the venturi effect, a particular case of Bernoulli’s principle of a converging-diverging nozzle to convert the pressure energy of a motive fluid (air) to velocity energy at the throat to create a low pressure zone. This low pressure zone draws in and entrains the suction fluid (fuel) into the mixing chamber where it mixes with the motive fluid. The air-fuel ratio (AFR) of the mixture generated must be within the range determined by the operating condition of the gas engine. An out of range air-fuel ratio will lead to an unsta-ble gas engine operation and to the production of exhaust gas emission that will not meet the environmental standard. If there is no additional pressure at the air or fuel gas inlet, then the air-fuel ratio of the mixer will only depend on the mixer design. For this reason, the mixer design is very important; it should be designed to meet the air-fuel ratio requirement for various loads without using feedback control. Furthermore, to improve engine efficiency, the gas mixer design should pro-duce a uniform air-fuel mixture and have small pressure loss.
The venturi mixer design should be compact, with mini-mum pressure loss across the venturi-mixer, good suction pressure mainly in the throat due to the venturi effect from the pressure difference, and homogeneous or good mixing quality [1]. The air-fuel ratio and pressure loss of the venturi mixer are affected by several specifications: the venturi throat area, throat position, gas inlet area, and gas inlet location [2-5]. Whereas, the mixing effect of a venturi mixer is affected by venturi throat diameter, fuel nozzle position, number of fuel holes and impingement angle [3, 6, 7].
The mixing process on the mixer is driven by the strong impingement of two fluid streams, which produces high-energy dissipation [8]. The mixing process depends directly on the momentum-transfer efficiency of the mean flow at different scales. At intermediate scale, mixing is governed by turbulent fluctuations that can be characterized by the turbu-lent kinetic energy (TKE), and at micro scale, mixing can be characterized by the turbulence energy dissipation rate. A higher TKE and turbulence energy dissipation rate lead to better mixing quality [9]. However, better mixing quality is generally accompanied by an increase in pressure drop.
Synthesis gas (syngas) is being recognized as a viable en-ergy source worldwide. It is the direct end product of the bio and fossil fuel gasification process. Though it has low energy density, it can be used as a stand-alone fuel [10-13]. Syngas is a gas mixture that consists primarily of carbon monoxide
† This paper was recommended for publication in revised form by Associate Editor Jun Sang Park
*Corresponding author. Tel.: +82 61 659 3286, Fax.: +82 61 654 2006 E-mail address: [email protected]
© KSME & Springer 2011

2286 D. Danardono et al. / Journal of Mechanical Science and Technology 25 (9) (2011) 2285~2296
(CO), hydrogen (H2) and some carbon dioxide (CO2) or nitro-gen (N2). The low heating value (LHV) of the syngas is 6.079 MJ/kg. Considering its heat content, which is very low, the air-fuel ratio required at the mixer output in term of lambda (λ) ranges from 1.1 to 1.7 [10]. λ is the ratio of actual air-fuel ratio to the stoichiometric air-fuel ratio for a given mixture. Lambda 1.0 means that mixture is at the stoichiometric air-fuel ratio. λ of a rich mixture is less than 1.0, and a lean mix-ture is greater than 1.0.
2. Methodology
The methodology of the research is as follows. At first, we analyze a venturi gas mixer designed by the Korea Institute of Machinery & Materials (KIMM) as a baseline of characteriza-tion and optimization of venturi gas mixer for syngas. Using steady flow test equipment, we analyze the performance of the existing gas mixer prototype under the fully opened throttle valve condition by experiments. Based on the experimental results, a three-dimensional (3D) computational model is made as the baseline model. Computational fluid dynamics (CFD) package software is used to study the performance of the venturi mixer and flow behavior in the mixer. Later, the specifications of the basic model are modified and varied, and the gas mixer reflecting the modifications is analyzed by using CFD software to understand the general characteristic of the gas mixer. Based on the numerical calculation results, a better design is proposed. The optimized design of the mixer, whose λ ranges from 1.2 to 1.3, is expected and will be applied on a stationary reciprocating engine for power generation using syngas as a fuel. The engine is a 4-stroke SI (spark ignition) engine that has maximum power of 60 kW, total displacement of 6 liters, 1800 RPM and volu-metric efficiency of 30%. The engine configuration is vertical and it has a water-cooled cooling system.
A schematic diagram of the experimental set up is presented in Fig. 1. In this experiment, steady flow was maintained with a blower. To obtain various air flow rates, blower suction pressure was controlled by using a valve (V2). The air and syngas supplied were at atmospheric pressure. Two flow me-ters were provided, one on the gas inlet side and the other on the outlet side of the mixer. Another valve (V1) was provided
in front of the air inlet side of the mixer to regulate the inlet air pressure to be the same as the inlet pressure of the syngas. Inlet pressures of the air and syngas were measured at points 1 and 2, respectively, while the outlet pressure of the mixer was measured at point 3. The pressure at inlet and outlet of the mixer was measured by means of the digital multi parameter of air flow, TSI VelociCalc Plus, model 8386-M-GB.
The baseline prototype of the mixer (Fig. 2) has a throat di-ameter of 80 mm (throat area, AT=5026.548 mm2), gas cham-ber thickness of 8 mm (gas chamber cross-section area, Ach=483.8 mm2), gas exit holes diameters of 24x8 mm and 12x12 mm (total gas exit area, Aex=2563.54 mm2), and air inlet diameter of 92 mm (air inlet area, Ai=6647.61 mm2).
The syngas that was used contained the following mixture volumetric composition: 25% H2, 25% CO2 and 50% N2. The stoichiometric combustion reaction of the syngas is as follows:
H2+CO+2N2 + 5(0.2O2+0.8N2) H2O+CO2+6N2 . The stoichiometric air-fuel ratio of the syngas by weight is
1.624.
3. Modified models
To understand the characteristics of the mixer, we made some
Fig. 1. Schematic presentation of experimental system.
Table 1. Variation of the modified models.
Throat area variations
Gas chamber cross section
area variations
Gas exit area variations
DT (mm)
AT (mm2) t (mm) Ach
(mm2) Dex
(mm) Aex
(mm2)
57 2551.8 8 483.8 36x8 1809.6
64 3217.0 16 971.8 24x8 and
12x12 2563.5
72 4071.5 24 1459.8 36x11 3421.2
80 5026.5 42.1 2563.5 36x12 4071.5
84 5541.8 50 3045.8
(a) (b) Fig. 2. (a) KIMM mixer prototype; (b) cross-section view of the mixer prototype.
D. Danardono et al. / Journal of Mechanical Science and Technology 25 (9) (2011) 2285~2296 2287
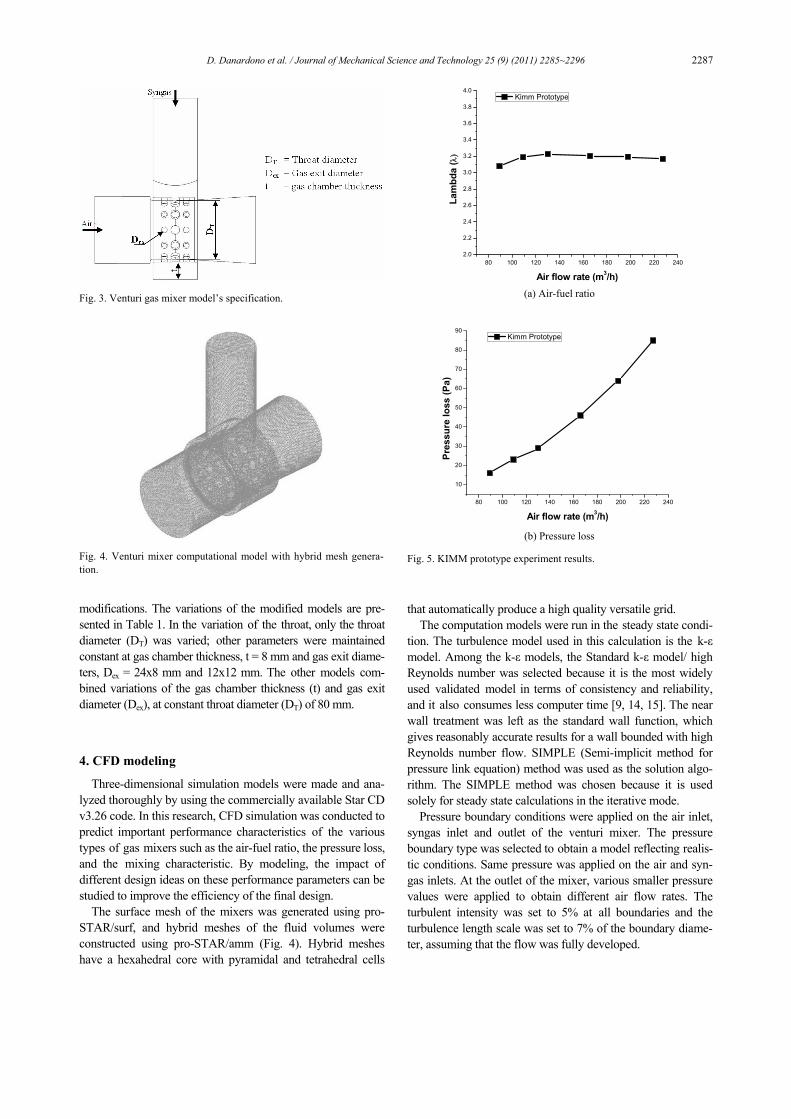
modifications. The variations of the modified models are pre-sented in Table 1. In the variation of the throat, only the throat diameter (DT) was varied; other parameters were maintained constant at gas chamber thickness, t = 8 mm and gas exit diame-ters, Dex = 24x8 mm and 12x12 mm. The other models com-bined variations of the gas chamber thickness (t) and gas exit diameter (Dex), at constant throat diameter (DT) of 80 mm.
4. CFD modeling
Three-dimensional simulation models were made and ana-lyzed thoroughly by using the commercially available Star CD v3.26 code. In this research, CFD simulation was conducted to predict important performance characteristics of the various types of gas mixers such as the air-fuel ratio, the pressure loss, and the mixing characteristic. By modeling, the impact of different design ideas on these performance parameters can be studied to improve the efficiency of the final design.
The surface mesh of the mixers was generated using pro-STAR/surf, and hybrid meshes of the fluid volumes were constructed using pro-STAR/amm (Fig. 4). Hybrid meshes have a hexahedral core with pyramidal and tetrahedral cells
that automatically produce a high quality versatile grid. The computation models were run in the steady state condi-
tion. The turbulence model used in this calculation is the k-ε model. Among the k-ε models, the Standard k-ε model/ high Reynolds number was selected because it is the most widely used validated model in terms of consistency and reliability, and it also consumes less computer time [9, 14, 15]. The near wall treatment was left as the standard wall function, which gives reasonably accurate results for a wall bounded with high Reynolds number flow. SIMPLE (Semi-implicit method for pressure link equation) method was used as the solution algo-rithm. The SIMPLE method was chosen because it is used solely for steady state calculations in the iterative mode.
Pressure boundary conditions were applied on the air inlet, syngas inlet and outlet of the venturi mixer. The pressure boundary type was selected to obtain a model reflecting realis-tic conditions. Same pressure was applied on the air and syn-gas inlets. At the outlet of the mixer, various smaller pressure values were applied to obtain different air flow rates. The turbulent intensity was set to 5% at all boundaries and the turbulence length scale was set to 7% of the boundary diame-ter, assuming that the flow was fully developed.
Fig. 3. Venturi gas mixer model’s specification.
Fig. 4. Venturi mixer computational model with hybrid mesh genera-tion.
80 100 120 140 160 180 200 220 2402.0
2.2
2.4
2.6
2.8
3.0
3.2
3.4
3.6
3.8
4.0
Lam
bda
(λ)
Air flow rate (m3/h)
Kimm Prototype
(a) Air-fuel ratio
80 100 120 140 160 180 200 220 240
10
20
30
40
50
60
70
80
90
Pres
sure
loss
(Pa)
Air flow rate (m3/h)
Kimm Prototype
(b) Pressure loss
Fig. 5. KIMM prototype experiment results.

2288 D. Danardono et al. / Journal of Mechanical Science and Technology 25 (9) (2011) 2285~2296
5. Results
The experiment results of the KIMM prototype venturi mixer are presented in Fig. 5. The results show that the venturi mixer outputs a very lean mixture with air-fuel ratio of greater than 3.15. The throat diameter of the KIMM prototype, which is almost as big as the air inlet and mixer outlet diameters, gives the advantage of low pressure loss.
5.1 Model validation
A series of tests were performed to determine the appropri-ate grid density to assure good predictions of the mixer per-formance. The grid density tests and the turbulence models were run for Reynolds number, Re = 25500. The number of cells used for grid density test is reported in Table 2. The grid dependence test result (Fig. 6) shows that a rough grid, i.e., M1, which has 170,664 cells, is the only mesh giving a differ-ent result. The other meshes show very close results. Based on these tests, meshes consisting of 400,000 to 700,000 grid cells, depending on the mixer configuration, were set.
The model was validated by comparing the model results with the experiment results, as shown in Fig. 7. The computa-tion model shows very close results to the experiment. There-fore, the CFD model is in good agreement with experiment.
5.2 Throat diameter (DT) variation calculation results
Fig. 8 shows the CFD calculation results for the variation of the throat. The results show that a decrease of the throat di-ameter makes the mixture richer and decreases the air-fuel ratio significantly. For smaller throat area, flow of lower air flow rate flows into the mixer. On the other hand, more gas flows into the mixer caused by the decrease of the static pres-sure on the throat area. But a decrease of the throat diameter is
60 80 100 120 140 160 180 200 220 2402.0
2.2
2.4
2.6
2.8
3.0
3.2
3.4
3.6
3.8
4.0
Lam
bda
(λ)
Air flow rate (m3/h)
Kimm Prototype Kimm Model
(a) Air-fuel ratio
60 80 100 120 140 160 180 200 220 2400
10
20
30
40
50
60
70
80
90
Pres
sure
loss
(Pa)
Air flow rate (m3/h)
Kimm Prototype Kimm Model
(b) Pressure loss
Fig. 7. Comparison results of the experiment and computation models.
20 30 40 50 60 70 80 90 100 110 120 130 140 150 160
1.21.41.61.82.02.22.42.62.83.03.23.43.63.84.04.24.44.64.85.0
Lam
bda (λ)
Air flow rate (m3/h)
DT84-t8-Dex8&12 DT80-t8-Dex8&12 DT72-t8-Dex8&12 DT64-t8-Dex8&12 DT57-t8-Dex8&12
(a) Air-fuel ratio
20 30 40 50 60 70 80 90 100 110 120 130 140 150 160
0
50
100
150
200
250
300
350
400
450
Pres
sure
loss
(Pa)
Air flow rate (m3/h)
DT84-t8-Dex8&12 DT80-t8-Dex8&12 DT72-t8-Dex8&12 DT64-t8-Dex8&12 DT57-t8-Dex8&12
(b) Pressure loss
Fig. 8. Throat variations calculation results with t = 8 mm and Dex = 24x8 mm and 12x12 mm.
Table 2. Number of cells used in the simulation for grid dependence test.
M1 M2 M3 M4 M5
170,664 266,990 498,692 564,228 634,666
0 50 100 150 200 250
-30
-25
-20
-15
-10
-5
0
5
Pres
sure
pro
file
(Pa)
measurement points (mm)
M1 M2 M3 M4 M5
Fig. 6. Grid dependence test result.

D. Danardono et al. / Journal of Mechanical Science and Technology 25 (9) (2011) 2285~2296 2289
disadvantageous to the performance of the venturi mixer. The pressure loss of the venturi mixer increases significantly.
Fig. 9 shows the influence of the ratio the throat area (AT) to the air inlet area (Ai) on the mixer performance. At constant air inlet area, the air-fuel ratio increases with the increment of the throat area, followed by the decrease of the pressure loss.
Fig. 9(b) shows that when the throat area is less than 0.6 of the air inlet area, pressure loss will drastically increase.
5.3 Gas chamber thickness (t) variation calculation result
In the following models, the gas chamber cross-section area
0.3 0.4 0.5 0.6 0.7 0.8 0.9
1.0
1.5
2.0
2.5
3.0
3.5
4.0
4.5
5.0
Air flow rate 100m3/hr
Lam
bda (λ)
AT/Ai 0.3 0.4 0.5 0.6 0.7 0.8 0.9
0
20
40
60
80
100
120
140
160
180
200
Air flow rate 100m3/hr
Pres
sure
loss
(Pa)
AT/Ai (a) AFR vs (AT/Ai) (b) Pressure loss vs (AT/Ai) Fig. 9. Relation of the (AT/Ai) against air-fuel ratio and pressure loss.
20 40 60 80 100 120 140 160
0.8
1.0
1.2
1.4
1.6
1.8
2.0
2.2
2.4
2.6
2.8
Lam
bda
(λ)
Air flow rate (m3/h)
DT80-t8-Dex12 DT80-t16-Dex12 DT80-t24-Dex12 DT80-t42.1-Dex12 DT80-t50-Dex12
20 40 60 80 100 120 140 160
0
20
40
60
80
100
120
140
160
180
200
Pres
sure
loss
(Pa)
Air flow rate (m3/h)
DT80-t8-Dex12 DT80-t16-Dex12 DT80-t24-Dex12 DT80-t42.1-Dex12 DT80-t50-Dex12
(a) Air-fuel ratio (b) Pressure loss Fig. 10. Gas chamber thickness variation with DT = 80 mm and Dex = 36x12 mm.
20 30 40 50 60 70 80 90 100 110 120 130 140 150 1601.0
1.2
1.4
1.6
1.8
2.0
2.2
2.4
2.6
2.8
3.0
Lam
bda (λ)
Air flow rate (m3/h)
DT80-t8-Dex11 DT80-t16-Dex11 DT80-t24-Dex11 DT80-t42.1-Dex11 DT80-t50-Dex11
20 30 40 50 60 70 80 90 100 110 120 130 140 150 160
0
10
20
30
40
50
60
70
80
90
100
110
120
130
Pres
sure
loss
(Pa)
Air flow rate (m3/h)
DT80-t8-Dex11 DT80-t16-Dex11 DT80-t24-Dex11 DT80-t42.1-Dex11 DT80-t50-Dex11
(a) Air-fuel ratio (b) Pressure loss Fig. 11. Gas chamber thickness variation with DT = 80 mm and Dex = 36x11 mm.

2290 D. Danardono et al. / Journal of Mechanical Science and Technology 25 (9) (2011) 2285~2296
is varied. In these models, only the gas chamber thickness (cross-section area) was varied, and the other parameters re-mained constant. As presented in Figs. 10-13, enlarging the cross-section area tends to make the mixture richer. However,
when the gas chamber thickness is 42.1 mm, the air-fuel ratio of the mixture reaches the minimum value. When the gas chamber thickness increases further, the mixture becomes slightly leaner for a mixer with a large gas exit diameter and
30 40 50 60 70 80 90 100 110 120 130 140 150 160
1.6
1.8
2.0
2.2
2.4
2.6
2.8
3.0
3.2
3.4
Lam
bda
(λ)
Air flow rate (m3/h)
DT80-t8-Dex8&12 DT80-t16-Dex8&12 DT80-t24-Dex8&12 DT80-t42.1-Dex8&12 DT80-t50-Dex8&12
30 40 50 60 70 80 90 100 110 120 130 140 150 160
0
10
20
30
40
50
60
70
80
90
Pres
sure
loss
(Pa)
Air flow rate (m3/h)
DT80-t8-Dex8&12 DT80-t16-Dex8&12 DT80-t24-Dex8&12 DT80-t42.1-Dex8&12 DT80-t50-Dex8&12
(a) Air-fuel ratio (b) Pressure loss Fig. 12. Gas chamber thickness variation with DT = 80 mm and Dex = 24x8 mm and 12x12 mm.
30 40 50 60 70 80 90 100 110 120 130 140 150 1602.4
2.6
2.8
3.0
3.2
3.4
3.6
3.8
4.0
4.2
Lam
bda
(λ)
Air flow rate (m3/h)
t8-Dex8 t16-Dex8 t24-Dex8 t42.1-Dex8 t50-Dex8
30 40 50 60 70 80 90 100 110 120 130 140 150 160
0
10
20
30
40
50
60
Pres
sure
loss
(Pa)
Air flow rate (m3/h)
DT80-t8-Dex8 DT80-t16-Dex8 DT80-t24-Dex8 DT80-t42.1-Dex8 DT80-t50-Dex8
(a) Air-fuel ratio (b) Pressure loss Fig. 13. Gas chamber thickness variation with DT = 80 mm and Dex = 36x8 mm.
0.1 0.2 0.3 0.4 0.5 0.6
0.81.01.21.41.61.82.02.22.42.62.83.03.23.43.63.84.04.24.4
Air flow rate 100m3/h
DT80-t vary - Dex 8 DT80-t vary - Dex 8&12 DT80-t vary - Dex 11 DT80-t vary - Dex 12
Lam
bda
(λ)
Ach/AT 0.1 0.2 0.3 0.4 0.5 0.6
15
20
25
30
35
40
45
50
55
60
65
70Air flow rate 100m3/h
DT80-t vary - Dex 8 DT80-t vary - Dex 8&12 DT80-t vary - Dex 11 DT80-t vary - Dex 12
Pres
sure
loss
(Pa)
Ach/AT (a) λ vs (Ach/AT) (b) Pressure loss vs (Ach/AT) Fig. 14. Correlation of the Ach/AT to the air-fuel ratio and pressure loss.

D. Danardono et al. / Journal of Mechanical Science and Technology 25 (9) (2011) 2285~2296 2291
does not show significant changes for a mixer with a small gas exit diameter. A gas chamber thickness greater than 42.1 mm also has insignificant effect on the mixer pressure loss.
Fig. 14 describes the Ach/AT relationship to air-fuel ratio
and pressure loss at air flow rate 100 m3/hr. The minimum air-fuel ratio is reached when Ach/AT is about 0.5 of the throat area. Fig. 14 also shows that Ach/AT greater than 0.3 does not affect the air-fuel ratio and pressure loss significantly. How-
30 40 50 60 70 80 90 100 110 120 130 140 150 1602.4
2.6
2.8
3.0
3.2
3.4
3.6
3.8
4.0
4.2
Lam
bda
(λ)
Air flow rate (m3/h)
DT80-t8-Dex8 DT80-t8-Dex8&12 DT80-t8-Dex11 DT80-t8-Dex12
30 40 50 60 70 80 90 100 110 120 130 140 150 160
0
10
20
30
40
50
60
Pres
sure
loss
(Pa)
Air flow rate (m3/h)
DT80-t8-Dex8 DT80-t8-Dex8&12 DT80-t8-Dex11 DT80-t8-Dex12
(a) Air-fuel ratio (b) Pressure loss Fig. 15. Gas exit diameter variation with DT = 80 mm and t = 8 mm.
20 30 40 50 60 70 80 90 100 110 120 130 140 150 160
1.4
1.6
1.8
2.0
2.2
2.4
2.6
2.8
3.0
Lam
bda
(λ)
Air flow rate (m3/h)
DT80-t16-Dex8 DT80-t16-Dex8&12 DT80-t16-Dex11 DT80-t16-Dex12
20 30 40 50 60 70 80 90 100 110 120 130 140 150 160
0
10
20
30
40
50
60
70
80
90
100
Pres
sure
loss
(Pa)
Air flow rate (m3/h)
DT80-t16-Dex8 DT80-t16-Dex8&12 DT80-t16-Dex11 DT80-t16-Dex12
(a) Air-fuel ratio (b) Pressure loss Fig. 16. Gas exit diameter variation with DT = 80 mm and t = 16 mm.
20 30 40 50 60 70 80 90 100 110 120 130 140 150 1600.8
1.0
1.2
1.4
1.6
1.8
2.0
2.2
2.4
2.6
2.8
Lam
bda (λ)
Air flow rate (m3/h)
DT80-t24-Dex8 DT80-t24-Dex8&12 DT80-t24-Dex11 DT80-t24-Dex12
20 30 40 50 60 70 80 90 100 110 120 130 140 150 160
-10
0
10
20
30
40
50
60
70
80
90
100
110
120
130
140
Pres
sure
loss
(Pa)
Air flow rate (m3/h)
DT80-t24-Dex8 DT80-t24-Dex8&12 DT80-t24-Dex11 DT80-t24-Dex12
(a) Air-fuel ratio (b) Pressure loss Fig. 17. Gas exit diameter variation with DT = 80 mm and t = 24 mm.

2292 D. Danardono et al. / Journal of Mechanical Science and Technology 25 (9) (2011) 2285~2296
ever, for the mixers with gas exit diameters 11 mm and 12 mm (Fig. 14(b)), respectively, their pressure loss continues to increase until it reaches the maximum point at Ach/AT = 0.5.
5.4 Gas exit diameter (Dex) variation calculation result
The following modified models incorporate the gas exit variation at constant throat diameter and gas chamber thick-
10 20 30 40 50 60 70 80 90 100 110 120 130 140 150 160
0.8
1.0
1.2
1.4
1.6
1.8
2.0
2.2
2.4
2.6
Lam
bda (λ)
Air flow rate (m3/h)
DT80-t42.1-Dex8 DT80-t42.1-Dex8&12 DT80-t42.1-Dex11 DT80-t42.1-Dex12
10 20 30 40 50 60 70 80 90 100 110 120 130 140 150 160
0
20
40
60
80
100
120
140
160
180
Pres
sure
loss
(Pa)
Air flow rate (m3/h)
DT80-t42.1-Dex8 DT80-t42.1-Dex8&12 DT80-t42.1-Dex11 DT80-t42.1-Dex12
(a) Air-fuel ratio (b) Pressure loss Fig. 18. Gas exit diameter variation with DT = 80 mm and t = 42.1 mm.
10 20 30 40 50 60 70 80 90 100 110 120 130 140 150 1600.8
1.0
1.2
1.4
1.6
1.8
2.0
2.2
2.4
2.6
Lam
bda
(λ)
Air flow rate (m3/h)
DT80-t50-Dex8 DT80-t50-Dex8&12 DT80-t50-Dex11 DT80-t50-Dex12
10 20 30 40 50 60 70 80 90 100 110 120 130 140 150 160
0
20
40
60
80
100
120
140
160
Pres
sure
loss
(Pa)
Air flow rate (m3/h)
DT80-t50-Dex8 DT80-t50-Dex8&12 DT80-t50-Dex11 DT80-t50-Dex12
(a) Air-fuel ratio (b) Pressure loss Fig. 19. Gas exit diameter variation with DT = 80 mm and t = 50 mm.
0.3 0.4 0.5 0.6 0.7 0.8
0.81.01.21.41.61.82.02.22.42.62.83.03.23.43.63.84.04.24.4
Air flow rate 100m3/h
Lam
bda
(λ)
Aex/AT
DT80-t 8 - Dex vary DT80-t 16 - Dex vary DT80-t 24 - Dex vary DT80-t 42.1 - Dex vary DT80-t 50 - Dex vary
0.3 0.4 0.5 0.6 0.7 0.8
10
20
30
40
50
60
70Air flow rate 100m3/h
Pres
sure
loss
(Pa)
Aex/AT
DT80-t 8 - Dex vary DT80-t 16 - Dex vary DT80-t 24 - Dex vary DT80-t 42.1 - Dex vary DT80-t 50 - Dex vary
(a) λ vs (Aex/AT) (b) Pressure loss vs (Aex/AT) Fig. 20. Correlation of Aex/AT to the air-fuel ratio and pressure loss.

D. Danardono et al. / Journal of Mechanical Science and Technology 25 (9) (2011) 2285~2296 2293
ness. Fig. 15 presents the results of the models with gas cham-ber thickness of 8 mm. Increase of the gas exit holes area made the mixture richer and increased the pressure loss. The same trends were also shown by the gas exit variation models with gas chamber thickness of 16, 24, 42.1 and 50 mm, as presented on Figs. 16-19.
Fig. 20 presents the correlation of the ratio of the Aex/AT to
the air-fuel ratio and pressure loss at air flow rate 100 m3/hr. As presented in Fig. 20, with a constant gas chamber cross-section area, the air-fuel ratio of the mixture decreases with the increment of the total gas exit area, but the pressure loss increases. The variations of the gas exit area significantly af-fected the mixer air-fuel ratio and pressure loss.
5.5 Mixing characteristics
The mixing characteristics of the modified models at air flow rate 100 m3/h, are presented qualitatively on Figs. 21-23. As shown in Fig. 21, a smaller throat area yields a better mix-ing quality. The smallest throat diameter, DT = 57 mm, gave the best mixing quality. From Fig. 22, the mixing characteris-tic of the mixer is only affected when the gas chamber thick-ness increases from 8 mm to 16 mm. Further increment in gas chamber thickness hardly affected the mixing quality. On the other hand, Fig. 23 shows that a bigger gas exit diameter gives a better mixing distribution, although the impact is not as sig-nificant as that given by a decrease of the throat area.
6. Discussion
Every modified model had advantages and disadvantages. Based on the modeling results, an optimized design with λ in
20 40 60 80 100 120 140 1600.8
1.0
1.2
1.4
1.6
1.8
2.0
2.2
2.4
2.6
2.8
3.0
3.2
3.4
Lam
bda (λ)
Air flow rate (m3/h)
optimized model KIMM model
(a) Air-fuel ratio
20 40 60 80 100 120 140 160
0
20
40
60
80
100
120
140
Pres
sure
loss
(Pa)
Air flow rate (m3/h)
optimized model KIMM model
(b) Pressure loss
Fig. 24. The calculation results of the optimized design model.
Fig. 21. Mixing characteristic on the mixer outlet cross sectional viewfor DT variation with t = 8 mm and Dex = 24x8 and 12x12 mm, at air flow rate 100 m3/h.
Fig. 22. Mixing characteristic on the mixer outlet cross sectional view for t variation with DT = 80 mm and Dex = 24x8 and 12x12 mm, at air flow rate 100 m3/h.
Fig. 23. Mixing characteristic on the mixer outlet cross sectional view for Dex variation with DT = 80 mm and t = 8 mm, at air flow rate 100m3/h.

2294 D. Danardono et al. / Journal of Mechanical Science and Technology 25 (9) (2011) 2285~2296
the range of 1.2 to 1.3 was made. The optimized design combined the modifications of the venturi throat, gas exit area and gas chamber thickness. As seen in Fig. 9, the ratio of the throat area to the air inlet area should be made greater than 0.6 to avoid high pressure loss. Based on Fig. 14, the area ratio of the gas chamber to the throat had to be kept under 0.3 to significantly affect the air-fuel ratio. Also, the compactness of the venturi mixer should be considered. By looking at the mixing characteristics of the models, increasing the size of the gas exit area was a good way to obtain a richer mixture, better
mixing and less pressure loss. The gas exit area modification was limited by the size of the throat circumference and the gas chamber width. With these considerations, the optimized design model was made. The optimized design model has 78 mm throat diameter (AT = 4778.362 mm2), 16 mm gas chamber thickness (Ach = 971.8 mm2) and 36xdia13 mm gas exit holes (Aex = 4778.362 mm2).
(a) (b) Fig. 27. (a) Optimized design prototype; (b) cross-section view of the mixer prototype.
20 40 60 80 100 120 140 1600.8
1.0
1.2
1.4
1.6
1.8
2.0
2.2
2.4
2.6
2.8
3.0
3.2
3.4 optimized model optmized prototype
Lam
bda (λ)
Air flow rate (m3/h) (a) Air-fuel ratio
20 40 60 80 100 120 140 160
0
20
40
60
80
100
120
140
160 optimized model optmized prototype
Pres
sure
loss
(Pa)
Air flow rate (m3/h) (b) Pressure loss
Fig. 28. Comparison of experiment and computation model results of the optimized design.
(a) KIMM model (b) Optimized design model Fig. 25. Mixing characteristics on the mixer outlet cross sectional viewof the KIMM and optimized model at air flow rate 100 m3/h.
20 40 60 80 100 120 140 160-0.1
0.0
0.1
0.2
0.3
0.4
0.5
0.6
0.7
0.8
0.9
1.0
1.1
1.2
1.3
1.4
k av (m
2 /s2 )
Air flow rate (m3/h)
KIMM model Optimized model
(a) Average turbulence kinetic energy
20 40 60 80 100 120 140 160
-200
20406080
100120140160180200220240260280300320340
ε av (m
2 /s3 )
Air flow rate (m3/h)
KIMM model Optimized model
(b) Average turbulence energy dissipation
Fig. 26. Average turbulence kinetic energy and average turbulence energy dissipation on the cross sectional view of the mixer outlet.

D. Danardono et al. / Journal of Mechanical Science and Technology 25 (9) (2011) 2285~2296 2295
7. Optimized model
The CFD calculation results of the optimized model are presented in Fig. 24. The optimized model had λ = 1.23 at air flow rate 100 m3/hr, which was within the design range. Al-though the amount of syngas flowing into the mixer increased drastically, the pressure loss of the optimized model did not increase significantly. At 100 m3/hr air flow rate, the pressure loss of the optimized design was 46 Pa, which increased the baseline model pressure loss by about 28 Pa. However, the mixing quality of the optimized model was much better than that of the KIMM model. The syngas and the air mixed to the center of the mixer outlet, as presented in Fig. 25. This mixing quality was almost as good as the mixer which had a throat diameter of 57 mm. But if we compare their pressure losses, the optimized mixer had much less pressure drop than the mixer with a throat diameter of 57 mm, which had pressure loss of 180 Pa at 100 m3/h air flow rate.
Fig. 26 shows the average turbulence kinetic energy and the average turbulence energy dissipation on the cross sectional view of the mixer outlet at various air flow rates. At air flow rate of 100m3/h, the turbulence kinetic energy of the optimized model is about 145.71% above that of the KIMM model. At the same air flow rate, the turbulence energy dissipation of the optimized model is about 213.64% above that of the KIMM model. This result confirmed the visualization of the mixing characteristic shown in Fig. 25, in which the optimized model gave better mixing quality than the baseline model.
A prototype of the optimized design (Fig. 27) was also made to validate the computation model results. The experi-ment result of the optimized design is presented in Fig. 28. The experiment and the model computation show very close results, which indicates that the CFD model is valid and reli-able.
8. Conclusions
A computational study was performed to investigate the performance and mixing characteristic of a gas mixer and to develop an optimized mixer design. First, a three-dimensional CFD model of an initial design prototype was made as the baseline model. The baseline model was validated by compar-ing the air fuel ratio as well as the pressure loss characteristic with the corresponding experimental data result. The CFD results show good agreement with the experimental data. By this validated simulation code, numerical calculations were made for different geometries of throat, gas chamber and gas exit. Based on the CFD results of the modified models, an optimized model was made and calculated. An experiment was also conducted on the optimized prototype. The CFD results of the optimized model also matched the experiment data very well.
Based on the experiment and CFD model calculation results, some conclusions can be drawn. In this venturi mixer type, the air-fuel ratio is mainly affected by total areas of the venturi
throat, gas chamber cross-section and gas exit. The venturi throat area especially governs the amount of air flow rate, whereas the gas flow rate is strongly influenced by gas cham-ber cross-section area and gas exit total area. The ratio of the throat area to the air inlet area should be kept greater than 0.6 (AT/Ai > 0.6). If AT/Ai is less than 0.6, the pressure loss of the venturi mixer will increase drastically. The gas chamber cross-section area has significant influence on the air-fuel ratio of the mixer as long as the ratio of the gas chamber area to the throat area, Ach/AT is less than 0.3. The minimum air-fuel ratio of a mixer is achieved when the ratio of the gas chamber area to the throat area, Ach/AT, is about 0.5. Increasing the gas exit area can produce a better mixing quality without significant pressure loss. An optimized design of the venturi mixer was developed based on the calculation results of the modified models. The optimized design has λ about 1.23 and pressure loss about 46 Pa at air flow rate 100 m3/hr and also has very good mixing quality.
Acknowledgment
This work is supported by basic research program (NK156D) of Korea Institute of Machinery and Materials.
Nomenclature------------------------------------------------------------------------
Ach : Gas chamber cross-sectional area (mm2) Aex : Total gas exit area (mm2) Ai : Air inlet area (mm2) AT : Throat area (mm2) DT : Throat diameter (mm) M : Mesh t : Gas chamber thickness (mm) λ : Air-fuel ratio
References
[1] R. S. G. Baert, D. E. Beckman and A. Veen, Efficient EGR technology for future HD diesel engine emission targets, SAE paper 1999-01-0837, International Congress & Exposi-tion (1999).
[2] A. Baylar, M. Unsal and F. Ozkan, Determination of the optimal location of the air hole in venturi aerators, CLEAN-Soil, Air, Water, 35 (3) (2007) 246-249.
[3] A. Baylar, M. C. Aydin, M. Unsal and F. Ozkan, Numerical modeling of venturi flows for determining air injection rates using Fluent v6.2, Mathematical and Computational Appli-cations, 14 (2) (2009) 97-108.
[4] A. Baylar, F. Ozkan and M. Unsal, Effect of air inlet hole diameter of venturi tube on air injection rate, KSCE Journal of Civil Engineering, 14 (4) (2010) 489-492.
[5] F. Ozkan, M. Ozturk and A. Baylar, Experimental investiga-tion of air and liquid injection by venturi tubes, Water and Envronment Journal, 20 (2006) 114-122.
[6] M. Gorjibandpy and M. K. Sangsereki, Computational in-

2296 D. Danardono et al. / Journal of Mechanical Science and Technology 25 (9) (2011) 2285~2296
vestigation of air-gas venturi mixer for powered bi-fuel die-sel engine, World Academy of Science, Engineering and Technology 71, 2010.
[7] P. Luo, Y. Cheng, Y. Jin, W. Yang and J. Ding, Fast liquid mixing by cross-flow impingement in millimeter channels, Chemical Engineering Science, 62 (2007) 6178-6190.
[8] P. Luo, Y. Cheng, Y. Zhao, J. Jin and W. Yang, Millisecond mixing of two liquid streams in a mixer model, Chemical Engineering Science, 62 (2007) 5688-5695.
[9] C. Habchi, T. Lemenand, D. D. Valle and H. Peerhossaini, Turbulent mixing and residence time distribution in novel multifunctional heat echangers-reactors, Chemical engineer-ing and processing: process intensification, 2010.
[10] A. Al-Halbouni, H. Rahms and K. Gorner, An efficient combustion concept for low calorific gases, The Interna-tional Conference on Renewable Energy and Power Quality (ICREPQ´07), Sevilla (2007).
[11] C. D. Rakopoulos, C. N. Michos and E. G. Giakoumis, Availability analysis of a syngas fueled spark ignition engine using a multi-zone combustion model, Energy, 33 (2008) 1378-1398.
[12] F. Delattin, G. D. Lorenzo, S. Rizzo, S. Bram and J. D. Ruyck, Combustion of syngas in a pressurized microturbine-like combustor, Applied Energy, 87 (2010) 1441-1452.
[13] S. Som, A. I. Ramirez, J. Hagerdon, A. Saveliev and S. K. Aggarwal, A numerical and experimental study of counter-flow syngas flames at different pressures, Fuel, 87 (2008) 319-334.
[14] S. Sundararaj and V. Selladurai, An analysis on propor-tional mixing of liquids using venturi jet mixer, International Journal of Applied Engineering Research, 7 (2008) 891-902.
[15] T. Utomo, Z. Jin, M. Sq. Rahman, H. Jeong and H. Chung, Investigation on hydrodynamics and mass transfer character-istics of a gas-liquid ejector using three-dimensional CFD modeling, Journal of Mechanical Science and Technology, 22 (2008) 1821-1829.
Dominicus Danardono received his BS and MS degrees in Mechanical Engineer-ing from the Gadjah Mada University, Indonesia, in 1995 and 2004, respectively. He is currently a PhD student in the De-partment of Mechanical Engineering De-sign at the Chonnam National University, Korea. His research interests include
aerodynamics performance on low Reynolds number, incom-pressible internal flows and venturi mixer.
Ki-Seong Kim received his MS and Ph.D degrees in Mechanical Engineering from KAIST (Korea Advanced Institute of Science and Technology), Korea, in 1989 and 2004, respectively. He is cur-rently a Professor in the Division of Me-chanical & Automotive Engineering at the Chonnam National University, Korea.
His research interests include the combustion and flow in in-ternal combustion engines, optical measurements of flow and combustion phenomena, and nondestructive testing using ultrasonic technology.