optimization of ro desalination systems powered by renewable energies. part i: wind energy
TRANSCRIPT
ELSEMER Desalination 160 (2004) 293-299
Optimization of RO desalination systems powered by renewable energies. Part I: Wind energy
Ignacio de la Nuez Pestana*, Francisco Javier Garcia Latorre, Celso Argudo Espinoza, Antonio G6mez Gotor
School of Industrial Engineering, Vniversiv of Las Palmas de Gran Canaria, Spain Tel. +34 (92) 835-5789; Fax +34 (92) 835-1584; email: [email protected]
Received 30 April 2003; accepted 4 May 2003
Abstract
Operation of an experimental RO plant connected directly to a wind system without energy storage was studied. The data obtained confirm the wide spectrum of operation of the plant with respect to the power available and the operation of the system.
Keywords: Desalination; Renewable energy; Reverse osmosis; Simulation; Wind energy
1. Introduction energy have suffered important fluctuations in
Water needs today have grown due to increased consumption and to the contamination of aquifers. Initially other desalination systems have been used, but at present the extensive use of the RO process predominates. The flexibility in the dimensions of RO plants together with reduced energy consumption and improvement in membranes have made RO the most efficient and economical process. Conventional sources of
the last decades of the 20th century. Thus renewable energy sources are necessary for obtaining water [ 11. Three different methods are: l RO renewable energy plants and alternative
systems (diesel and storage) l Small-scale RO plants that are connected
according to the energy available [2,3] . RO plant - renewable energy without
alternative energy sources [4].
*Corresponding author. Within this framework, the OPRODES project
(JOR3-CT98-0274), has as one of its objectives
Presented at the European Conference on Desalination and the Environment: Fresh Waterfor All, Malta, 4-8 May 2003. European Desalination Society, International Water Association.
001 l-9164/04/$- See front matter 0 2004 Elsevier Science B.V. All rights reserved PII: SO01 l-9164(03)00669-6

294 I. de la Nuez Pestana et al. /Desalination 160 (2004) 293-299
the study of RO membranes subjected to flow and pressure fluctuations in desalination plants powered by renewable energy. An RO plant has been designed to obtain this information.
2. Plant description . The RO plant designed for this project retains
the philosophy of a conventional desalination plant, but it includes a series of important modifi- cations [5,6] for the study of the membranes undergoing a variable regime due to colic and solar energy fluctuations. With this system the operation of the plant in variable regime and with stops and successive starts, depending on the availability of electric power in the system, is proved.
.
2.1. Technical characteristics Fig. 1 shows a conventional scheme of an RO
plant to which a series of modifications have been made: Pre-treatment intakes: In order to study dif- ferent pre-treatments, together or separately, there are three independent inputs for the addition of pre-treatment products. Pressure tube: The pressure tube will take two inputs of product water through both tube side ends. This system has been chosen to check the quality of the product water in the different membranes. The collector ofproduct water will be covered inside the tube so that it collects the product water coming only from the first membrane, or of the first and second ones, and so on. With this system, we will be able to test, in a variable or invariable regime, whether it is necessary to use n-membranes. Cleaning tank: An automated cleaning tank has been installed since due to the automation of the plant, and the possibility to foresee shutdowns of long duration and outbursts, the
HI@ &sane Purr0 Fig. 1. .RO plant scheme.
I. de la Nuez Pestana et al. /Desalination 160 (2004) 293-299 295
cleaning will be carried out automatically, with the possibility of carrying it out manually in some cases.
The high-pressure pump chosen for the project is a positive displacement pump with a stainless steel piston pump in solid ceramic. The maximum flow is 13.62 m3/h with power ranges from 7-85 bar. The relationship between flow and pressure is lineal. A three-phase electric motor carries the haulage. The coupling between the motor-pump is carried out by means of a system of pulleys with a transmission relation- ship 4: 1. The combined (motor-pump) character- istics are given in Table 1. These parameters are the maximum and minimum that can be obtained from the pump-motor with values higher than required by the membranes.
A 6 m-long tube with six membranes is used in the project. The membranes are Koch Fluid Systems and the model TFC 2822-SS premium polyamide spiral wound for seawater desalination and high rejection. Each membrane allows a permeation of 18.9 m3/d with a salt rejection of 99.8%, each with an area of 27.9 m*. Once the
Table 1 Characteristics of combined (pump-motor)
Motor, rpm Pump, rpm Pressure, bar Flow, m3/h Power, kW
Min Max
800 1500 200 375 7 85 5.2 9.8 1.17 26.43
Table 2 Functioning characteristics of the plant
Operating pressure, bar Recovery, % Electric motor, rpm Power consumption, kW
Min Max
30 60 10 50 800 1500 5.5 21.5
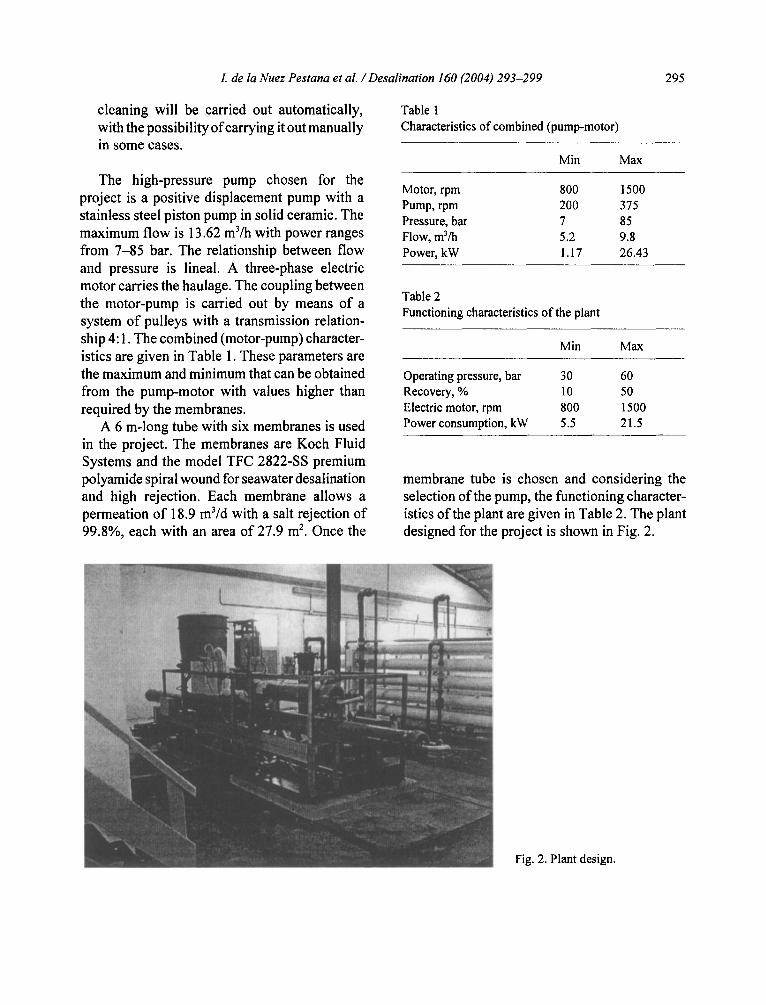
membrane tube is chosen and considering the selection of the pump, the functioning character- istics of the plant are given in Table 2. The plant designed for the project is shown in Fig. 2.
Fig. 2. Plant design.
296 I. de la Nuez Pestana et al. /Desalination 160 (2004) 293-299
Product
Brine Seawater
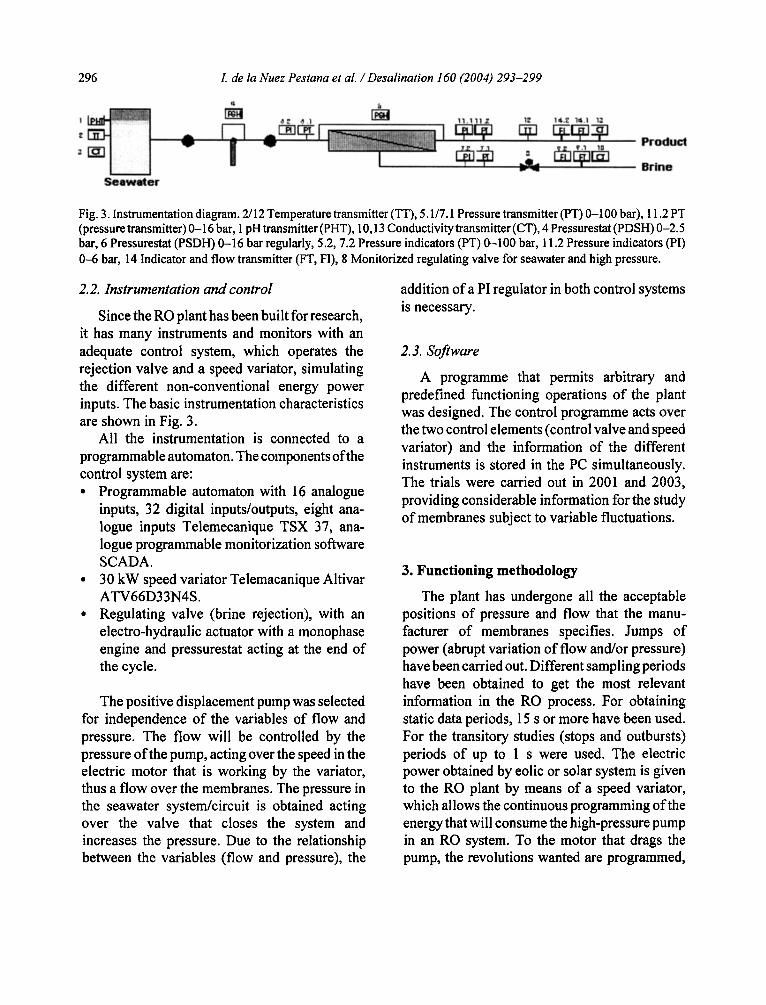
Fig. 3. Instrumentation diagram. 2112 Temperature transmitter (TT), 5.U7.1 Pressure transmitter (PT) O-100 bar), 11.2 PT (pressure transmitter) O-16 bar, 1 pH transmitter (PHT), lo,13 Conductivity transmitter (CT), 4 Pressurestat (PDSH) O-2.5 bar, 6 Pressurestat (PSDH) O-16 bar regularly, 5.2,7.2 Pressure indicators (PT) O-100 bar, 11.2 Pressure indicators (PI) O-6 bar, 14 Indicator and flow transmitter (FT, FI), 8 Monitorized regulating valve for seawater and high pressure.
2.2. Instrumentation and control
Since the RO plant has been built for research, it has many instruments and monitors with an adequate control system, which operates the rejection valve and a speed variator, simulating the different non-conventional energy power inputs. The basic instrumentation characteristics are shown in Fig. 3.
All the instrumentation is connected to a programmable automaton. The components ofthe control system are: l Programmable automaton with 16 analogue
inputs, 32 digital inputs/outputs, eight ana- logue inputs Telemecanique TSX 37, ana- logue programmable monitorization software SCADA.
l 30 kW speed variator Telemacanique Altivar ATV66D33N4S.
l Regulating valve (brine rejection), with an electro-hydraulic actuator with a monophase engine and pressurestat acting at the end of the cycle.
The positive displacement pump was selected for independence of the variables of flow and pressure. The flow will be controlled by the pressure of the pump, acting over the speed in the electric motor that is working by the variator, thus a flow over the membranes. The pressure in the seawater system/circuit is obtained acting over the valve that closes the system and increases the pressure. Due to the relationship between the variables (flow and pressure), the
addition of a PI regulator in both control systems is necessary.
2.3. Software
A programme that permits arbitrary and predefined functioning operations of the plant was designed. The control programme acts over the two control elements (control valve and speed variator) and the information of the different instruments is stored in the PC simultaneously. The trials were carried out in 2001 and 2003, providing considerable information for the study of membranes subject to variable fluctuations.
3. Functioning methodology
The plant has undergone all the acceptable positions of pressure and flow that the manu- facturer of membranes specifies. Jumps of power (abrupt variation of flow and/or pressure) have been carried out. Different sampling periods have been obtained to get the most relevant information in the RO process. For obtaining static data periods, 15 s or more have been used. For the transitory studies (stops and outbursts) periods of up to 1 s were used. The electric power obtained by colic or solar system is given to the RO plant by means of a speed variator, which allows the continuous programming of the energy that will consume the high-pressure pump in an RO system. To the motor that drags the pump, the revolutions wanted are programmed,
I. de la Nuez Pestana et al. 1 Desalination 160 (2004) 293-299 297
obtaining in the pump a variable rather than a lineal flow.
The different objectives are: l Study of the membrane behaviour l Optimum energy study of an RO plant l Study of the recovery subjected to fluctua-
tions l Aging process in plants of RO powered with
renewable energy l Study of the RO plant that undergoes energy
pulses
Some authors have treated some of these points, but always on laboratory facilities or of reduced size [7]. All these objectives are being developed as part of the investigations of the group.
4. Results
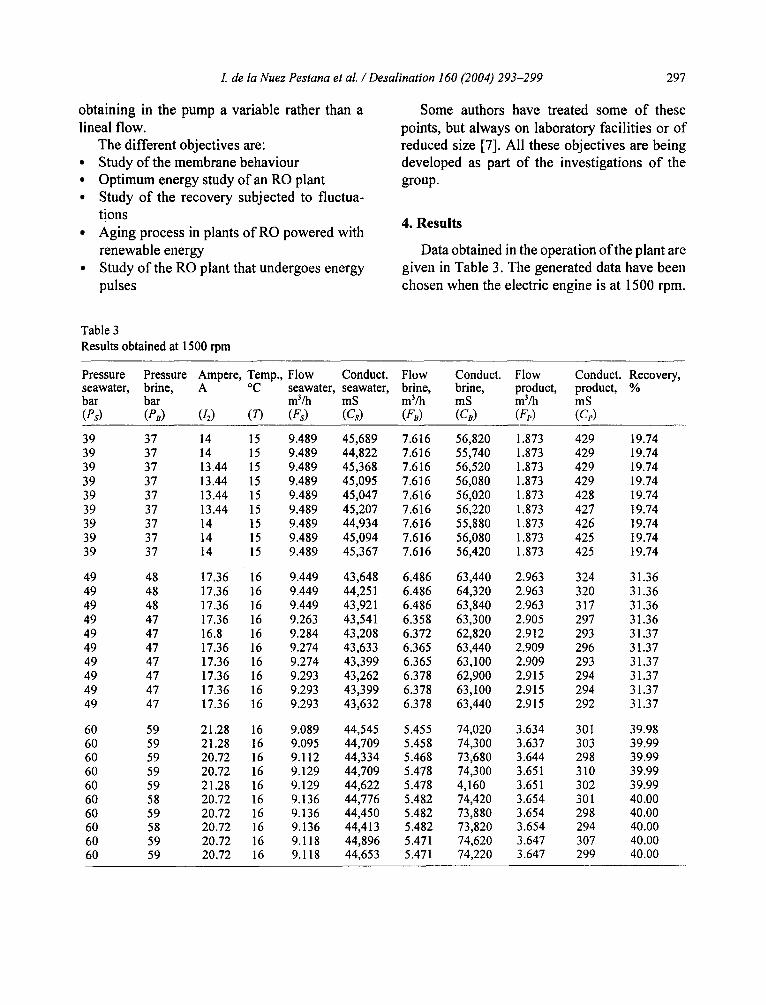
Data obtained in the operation of the plant are given in Table 3. The generated data have been chosen when the electric engine is at 1500 r-pm.
Table 3 Results obtained at 1500 rpm
Pressure Pressure Ampere, Temp., Flow Conduct. Flow seawater, brine, A “C bar bar
seawater, seawater, brine,
(PSI (PB) (4)
Conduct. Flow Conduct. Recovery, brine, product, product, % mS m’/h mS (GA (FP) (Cd
39 39 39 39 39 39 39 39 39
49 49 49 49 49 49 49 49 49 49
60 59 21.28 16 9.089 44,545 5.455 74,020 3.634 301 39.98 60 59 21.28 16 9.095 44,709 5.458 74,300 3.637 303 39.99 60 59 20.72 16 9.112 44,334 5.468 73,680 3.644 298 39.99 60 59 20.72 16 9.129 44,709 5.478 74,300 3.651 310 39.99 60 59 21.28 16 9.129 44,622 5.478 4,160 3.651 302 39.99 60 58 20.72 16 9.136 44,776 5.482 74,420 3.654 301 40.00 60 59 20.72 16 9.136 44,450 5.482 73,880 3.654 298 40.00 60 58 20.72 16 9.136 44,413 5.482 73,820 3.654 294 40.00 60 59 20.72 16 9.118 44,896 5.471 74,620 3.647 307 40.00 60 59 20.72 16 9.118 44,653 5.471 74,220 3.647 299 40.00
37 14 15 9.489 45,689 7.616 56,820 1.873 429 19.74 37 14 15 9.489 44,822 7.616 55,740 1.873 429 19.74 37 13.44 15 9.489 45,368 7.616 56,520 1.873 429 19.74 37 13.44 15 9.489 45,095 7.616 56,080 1.873 429 19.74 37 13.44 15 9.489 45,047 7.616 56,020 1.873 428 19.74 37 13.44 15 9.489 45,207 7.616 56,220 1.873 427 19.74 37 14 15 9.489 44,934 7.616 55,880 1.873 426 19.74 37 14 15 9.489 45,094 7.616 56,080 1.873 425 19.74 37 14 15 9.489 45,367 7.616 56,420 1.873 425 19.74
48 17.36 16 9.449 43,648 6.486 63,440 2.963 324 31.36 48 17.36 16 9.449 44,25 1 6.486 64,320 2.963 320 31.36 48 17.36 16 9.449 43,921 6.486 63,840 2.963 317 31.36 47 17.36 16 9.263 43,541 6.358 63,300 2.905 297 31.36 47 16.8 16 9.284 43,208 6.372 62,820 2.912 293 31.37 47 17.36 16 9.274 43,633 6.365 63,440 2.909 296 31.37 47 17.36 16 9.274 43,399 6.365 63,100 2.909 293 31.37 47 17.36 16 9.293 43,262 6.378 62,900 2.915 294 31.37 47 17.36 16 9.293 43,399 6.378 63,100 2.915 294 31.37 47 17.36 16 9.293 43,632 6.378 63,440 2.915 292 31.37

298 I. de la Nuez Pestana et al. /Desalination 160 (2004) 293-299
The data have been generated during 1 h (every 6 min) for three values of the pressure in the entrance of the tube of 40-50-60 bar, respect- ively. The pressures to the entrance and exit of the tube correspond to the first and second columns of Table 3. Observe that the loss of pressure is smaller as the operation pressure increases. An increment in the consumption of amperes is observed in the function of the pressure, and the seawater flow is approximately the same. The two expressions of the conser- vation have been used to complete Table 3.
The couples of flow values and conductivity are shown for the input of the seawater membrane and for the produce and brine. Usually the conductivity for this type of membrane is less than 500 mS. The recovery is shown in each one of the situations that varies from 19.74% to 40.00%.
The flow, that is a function of the rpm, remains almost constant. However, when you increase the pressure, it increases the product flow and the brine conductivity. An energy study shows that the decrease of the consumption is observed when the recovery increases. It goes from a consumption of 5.4 kW/m3 when the rejection is of 20%, to a consumption of 4.2 kW1 m3 when the rejection is of 40%. In Figs. 4 and 5, the results obtained are shown for a day, operating at 1500 rpm. The fluctuations are shown when the pressures in the membranes vary. Observe that when the pressure is small, the behaviour is irregular because osmosis does not exist. The consumed intensity increases com- pletely in this situation. In Fig. 5, the variations of conductivity are shown in the same situation as the one obtained in Fig. 4.
The specific energy consumption diminishes when the recovery increases. When recovery acts over the flow and pressure, we can conclude the
1600RP.M.
0 20 40 60 80
Pressure
Fig. 4. Conductivity obtained (operating at 1500 rpm).
1 uuuuu 90000 80000 70000 60000
g 50000 40000 30000 20000 10000
0
1 mu
1000
800
600
400
200
0 0 20 40 60 80
Pressure
Fig. 5. Conductivity obtained.
-1 6S.6 bu
s4 3.6.
e 3.
2.6
2.
1.5 6 10 16 20 26 30
Power kW
Fig. 6. Flow/power.
optimum results foreseen in this type of plant. The membrane manufacturers limit the recovery being the objective of the control system, work- ing around 40-43% recovery. An increment of the recovery will imply bigger power, and in turn, the curve flow-pressure can increase. For the opposite, a decrease of the recovery implies a decrease of the curve flow-pressure. To achieve
I. de la Nuez Pestana et al. /Desalination 160 (2004) 293-299 299
this type of control, Fig. 6 proposes the necessity of instrumentalization of the flow product, as a necessary sign to re-feed the system. Leaning on in this variable, you can calculate the installation recovery.
Later, we show the most important values that will allow definition of a control curve for this type of plant. The power that will consume the installation is variable, shown in Fig. 6.
5. Conclusions
The development of an RO plant for variable charges is presented. The plant has been working for more than 7000 h, generating a history for analysing the behaviour of the plant. The mem- branes allow a variable functioning without deteriorating, although additional information is needed for the aging study. The results obtained reveal the optimum control for the reduction of the energy consumption in this type of design that consists of obtaining adequate recovery membranes (40-43%). The control system must take the plant to an adequate recovery for each
available power, this being possible by use of a simple programme.
References
PI
PI
131
141
PI
Fl
[71
A. Hanati, Desalination using renewable energy sources, Desalination, 97 (1944) 339-352. D. Herold and A. Neskakis, A small PV-driven reverse osmosis desalination plant on the island of Gran Canaria, Desalination, 137 (2001) 285-292. M.S. Miranda and D. Infield, A wind-powered seawater reverse-osmosis system without batteries, Desalination, 153 (2002) 9-16. C.K. Liu, J.-W. Park, R. Migita and G. Qin, Experi- ments of a prototype wind-driven reverse osmosis desalination system with feedback control, Desali- nation, 150 (2002) 277-287. G. Al-Enezi and N. Fawzi, Design consideration of RO units: case studies, Desalination, 153 (2002)281- 286. A.J. Dababneh andM.A. Al-Nimr, A reverse osmosis desalination unit, Desalination, 153 (2002) 265-272. M. Thomson, MS. Miranda and D. Infiel, A small- scale seawater reverse-osmosis system with excellent energy efficiency over a wide operating range, Desalination, 153 (2002) 229-236.