a tool for the design of desalination plants powered by...
TRANSCRIPT
1
A tool for the design of desalination plants powered by renewable energies
D. Assimacopoulos
National Technical University of Athens, Chemical Engineering Department, Sector II, 9, Heroon Polytechniou, Zografou Campus, Athens, GR-157 80, Greece
ABSTRACT A unified approach for the evaluation of alternative Renewable Energy powered desalination systems, and their comparison on the basis of the economics of the associated investments is presented. The proposed method works out a preliminary plant design, evaluates the energy flows and calculates the water cost and the expected water-selling price. The energy needs of the desalination processes and the energy production by the renewable energy technologies are estimated using simplified models. The size and type of the back up power units (energy storage, grid connection or diesel generators) are identified. The expected water-selling price is estimated taking into account the water production cost and the investment profitability index. The computer-aided design tool that has been developed proposes technology combinations that guarantee the desalination energy needs and provides the means to compare the alternative options on the basis of economic indicators. Results on alternative RE-desalination combinations are presented in order to select the optimum solution for a specific case study. The effect of critical design parameters on the water-selling price is analysed for a wind powered reverse osmosis plant.
Keywords: Renewable Energy, Desalination, Water Price, Financial analysis, Software application
1 INTRODUCTION Renewable Energy Sources (RES) represent one promising option for the considerable energy needs of desalination processes. Especially in remote and arid regions, where the use of conventional energy (fossil fuels, electricity) is costly or not available, RES powered desalination plants may be an attractive alternative option. In most cases, fresh water scarcity co-exists with abundant RES potential.
Stand-alone RES powered desalination schemes are selected mainly for remote areas where a grid connection is impossible or very expensive and water demand is usually rather low. The main desirable features for these systems are low cost, low maintenance requirements, simple operation and of course very high reliability. On the other hand, grid-connected plants are preferred for medium or large-scale plants. Grid connection provides the plant with the energy needed at periods of low RES energy supply while offering the possibility to sell excess energy to the local grid.
The selection of the optimum combination of RES and desalination technologies in a specific region is based on resource availability and the technical compatibility and maturity of processes. Numerous RES – desalination combinations have been identified and tested in the framework of the ongoing research for innovative desalination processes [1 – 9]. Detailed assessments of available and exploitable water resources and water needs have been carried out in the framework of research programmes [10 – 12] taking into account current and future trends on economic development, environmental and socio-economic factors. Moreover the
2
market potential for RES desalination in specific regions has been identified, based on the combined evaluation of water shortage problems and RES potential with the objective to determine economically competitive options for RES powered desalination [13 – 15].
Although various methods to assess the economic viability of specific desalination plants powered by RES have been presented, there is still the need for a unified approach, which can assess alternative RE-desalination combinations, and compare them on the basis of the economic results of the associated investments. In the present work, a method is proposed for the preliminary plant design and evaluation of water production cost. The profitability index, [16, 17], is used for the estimation of the expected water-selling price on the basis of the overall discounted water cost. A computer-aided design tool, which implements user-defined RE–desalination combinations has been developed. The tool proposes technology combinations that guarantee the desalination energy needs and provides the means to compare alternative options on the basis of economic indicators. The tool provides to the user all the necessary information for the selection of the optimum power matching between the intermitted RES supply and the steady energy demand of desalination processes.
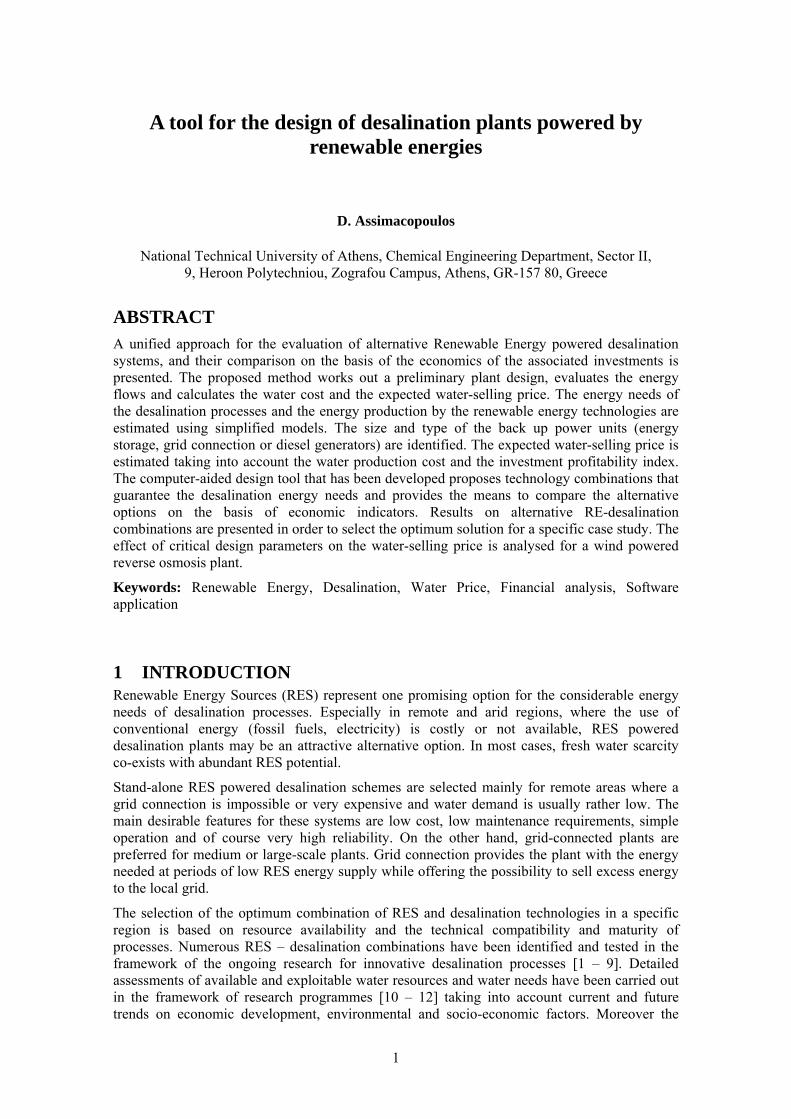
2 THE DESIGN APPROACH There is no straightforward way to select the appropriate RE – desalination technology for a specific case. Rather an iterative approach is most probable to be followed, involving careful assessment of available options in meeting the regional water demand and the economic viability of the selected solution. The decision maker handles information such as feed water quality and quantity, desalinated water specifications, type and size of the available RES potential and commercial maturity of the technology in order to decide on operational characteristics of each candidate solution. Furthermore, candidate options are screened through constraints such as site characteristics and financial requirements and compared in order to select the optimum solution.
The overall design algorithm is presented in Figure 1. The first step of the proposed approach involves the definition of a list of alternative technology arrangements, which can satisfy the targeted water demand. In the next step, a detail design of each candidate option is made to determine the plant capacity, the structure of the power unit, and the operational characteristics. The final step pursues a financial analysis of the investment associated with the selected RES desalination combination. The investment and operational costs are analytically estimated and the expected water-selling price is evaluated on the basis of the overall discounted water cost. The expected water-selling price is used for comparison among alternative RES desalination options as well as different schemes to cover water shortage such as transportation of water, construction of dams or conventional desalination systems.
3
DefineAlternative
RES - Desalinationcombination
EvaluateInvestment
Viability
Energy productionof RES Unit
Desalination PlantCapacity,
Energy Needs
SelectDesalinationTechnology
SelectRES
Technology
SpecifyGrid
Connection
SpecifyEnergy
Storage Unit
Energy needsSatisfied?
NO
YES
SpecifyWaterNeeds
CompareAlternatives oneconomic basis
Figure 1. RES – Desalination design algorithm
2.1 Design of the RES - Desalination Unit The capacity of the desalination plant and the daily and seasonal operation are determined by the water demand. The desalination process is selected taking into account the capacity of the plant, the feed water quality and the product water requirements. The plant capacity, the feed salinity as well as operating characteristics of the plant, determine the energy requirements of each desalination process. Appendix 1 describes the models for the evaluation of the energy needs of desalination processes.
The most challenging problem associated with the implementation of RES powered desalination plants is the optimum matching of the intermitted RES power output with the steady energy demand for the desalination process. Power management and demand side management are the two options available to solve this problem. In the first case, an appropriately controlled hybrid RES unit that is able to provide a steady energy output is used and it is sized at the nominal power demand of the desalination process. In the second case, the desalination process operates only when the energy output of the RES unit is able to cover the energy demand. The cost
4
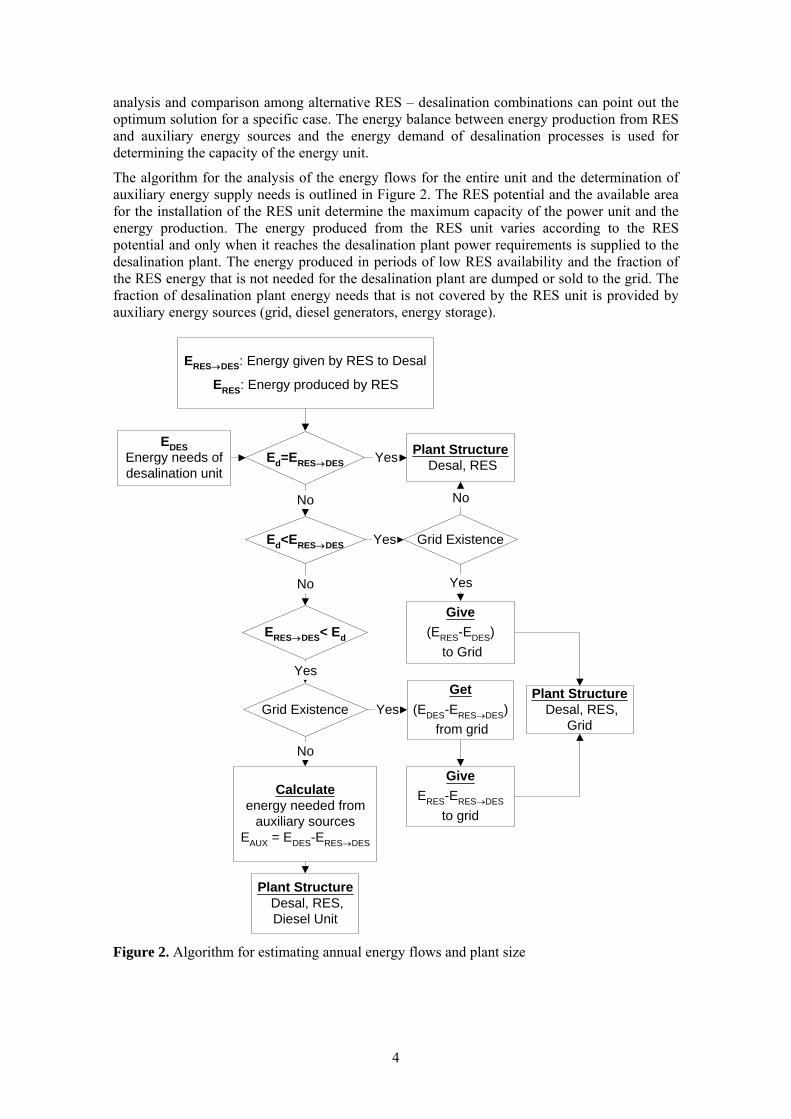
analysis and comparison among alternative RES – desalination combinations can point out the optimum solution for a specific case. The energy balance between energy production from RES and auxiliary energy sources and the energy demand of desalination processes is used for determining the capacity of the energy unit.
The algorithm for the analysis of the energy flows for the entire unit and the determination of auxiliary energy supply needs is outlined in Figure 2. The RES potential and the available area for the installation of the RES unit determine the maximum capacity of the power unit and the energy production. The energy produced from the RES unit varies according to the RES potential and only when it reaches the desalination plant power requirements is supplied to the desalination plant. The energy produced in periods of low RES availability and the fraction of the RES energy that is not needed for the desalination plant are dumped or sold to the grid. The fraction of desalination plant energy needs that is not covered by the RES unit is provided by auxiliary energy sources (grid, diesel generators, energy storage).
EDESEnergy needs ofdesalination unit
ERES→DES: Energy given by RES to Desal
ERES: Energy produced by RES
Ed=ERES→DES Yes
No
Ed<ERES→DES Yes
ERES→DES< Ed
No
Yes
Calculateenergy needed from
auxiliary sourcesEAUX = EDES-ERES→DES
No
No
Grid Existence
Grid Existence
Give(ERES-EDES)
to Grid
Yes
YesGet
(EDES-ERES→DES) from grid
GiveERES-ERES→DES
to grid
Plant Structure Desal, RES
Plant Structure Desal, RES,Diesel Unit
Plant Structure Desal, RES,
Grid
Figure 2. Algorithm for estimating annual energy flows and plant size
5
If the energy supplied by RES meets the energy requirements of the desalination unit, then there will be no energy from the auxiliary energy sources. An auxiliary energy supply system can be used, in this case, to make up for periods of low RES availability. In the case, where the maximum available RES energy is not adequate to cover the energy needs, a grid connection or diesel generator is necessary. The size of the diesel generator and the energy flows to and from the grid are determined in order to cover the power shortage.
The energy production from RES as well as the energy flows from the RES unit to the desalination plant is estimated by simplified models. In the case of wind energy powered desalination plants, the mean annual wind speed and the k-Weibull distribution are the main site-specific inputs necessary for the evaluation of energy production. The main technology related inputs are the height and the power curve of the selected wind turbines. In the case of PV powered desalination plants the solar radiation in the specific region as well as the efficiency of the PV cells are the main necessary inputs for the evaluation of energy flows to and from the grids. Details on the modelling of the Renewable Energy converters are given in Appendix 2.
2.2 Financial Evaluation The financial analysis of the proposed investment involves the estimation of capital and operational costs, the estimation of the overall water discounted cost and the evaluation of the expected water selling price.
The profitability index (PI) is defined as the net present value of the investment per unit of initial capital investment (equation 1) and provides a measure of the minimum profitability margin, which determines the difference of discounted cost and selling price. Positive values of the profitability index indicate that the investment is viable while negative values indicate that the overall discounted costs are higher than the expected water-selling price.
INVCNPVPI = (1)
The net present value (NPV) of the investment, is calculated by:
RCCRCQSPQSP
NPV MOINVEEWW &*** −−+= (2)
The overall discounted water cost is a function of the initial investment and the operational and maintenance costs of the RES powered desalination plant. Both the desalination unit and the RES unit costs are taken into account in the estimation of the water production cost. In the case that the plant is grid connected, the potential revenues from power sales have to be excluded from the analysis because a fraction of the plant costs is covered by those revenues and does not influence the water cost (equation 3).
W
EEMOIW Q
QSPCRCDC ** & −+= (3)
The profitability index is used to calculate the expected water-selling price based on the overall discounted cost of the RES – desalination system. Taking into account equations 1 – 3, the water-selling price can be estimated from equation 4.
WW
IW DCPI
QRCSP += **
(4)
The comparison among alternative RES – Desalination schemes is based on the estimated water-selling price or the overall discounted costs. Moreover, estimated water prices can be compared to the actual water selling prices in order to specify whether the proposed investment
6
is competitive towards conventional methods of water supply. The variation of water-selling price with the profitability index helps the decision maker to identify the selling price that best matches the economic requirements from the investment. The graph of the water-selling price versus the profitability index is a straight line, in accordance to equation 4. The slope of the line depends on the initial investment, the financing parameters of the investment (lifetime, discount rate) and the plant capacity. Higher slopes represent more attractive investments since a small increase of the selling price leads to a substantial increase of the profitability index and consequently to the net present value. Higher PI values lead to high revenues and consequently more profitable investments. On the other hand, lower PI values lead to lower consumer water prices making the proposed investment competitive with alternative options to cover water demand.
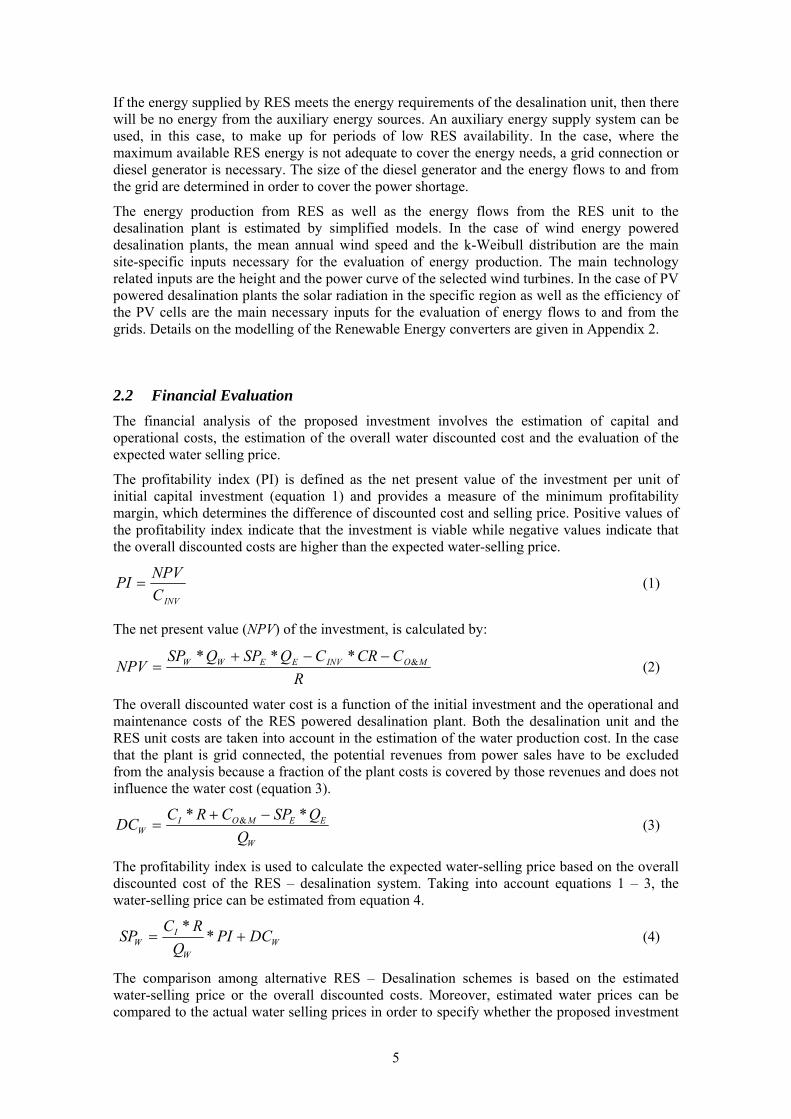
3 SOFTWARE IMPLEMENTATION The tool implements the proposed method in four sequential steps. Each step is presented in a specific form and the user has the option to review the results and repeat the calculations at any step. The tool starts with the form presented in Figure 3. The user defines different RES desalination combinations by selecting the desired desalination process and the renewable energy source that will be used. Moreover, the grid connection and the use of diesel generators or storage units can be determined in order to generate a series of alternative RES desalination plant structures. In the initial form the user defines the costs for all desalination processes and RE technologies as well as the financial parameters of the investment.
Figure 3. RES – Desalination plant configuration
7
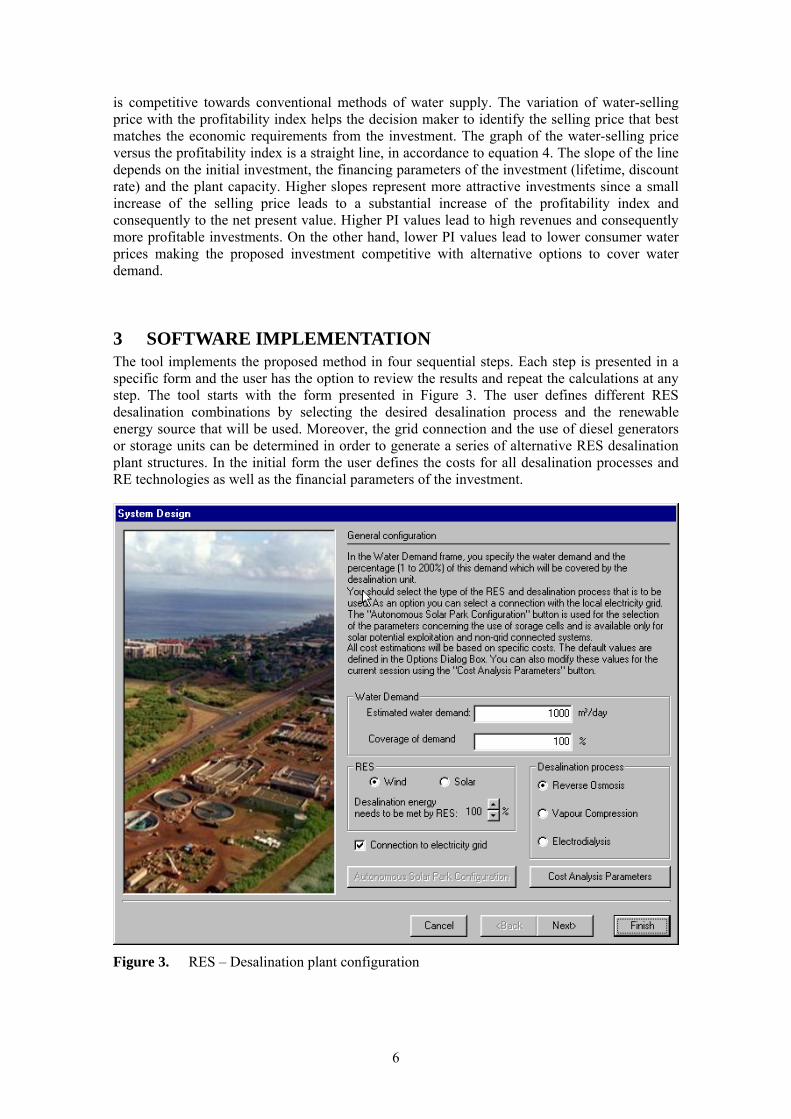
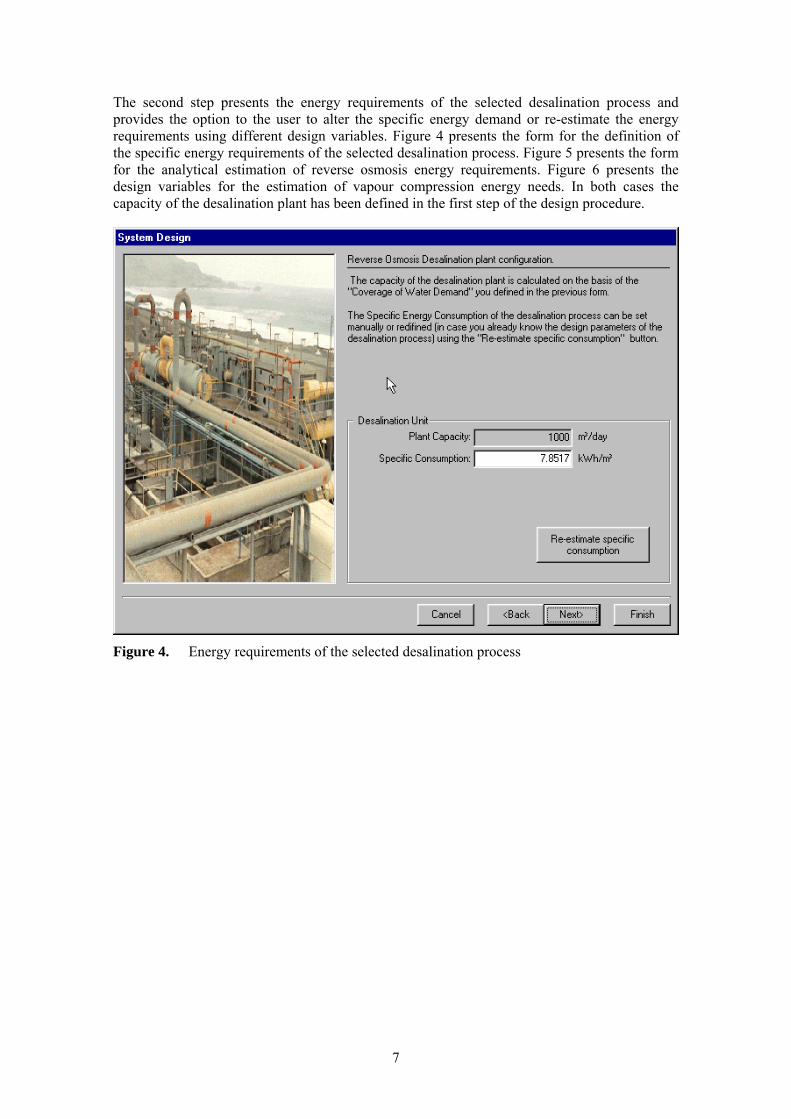
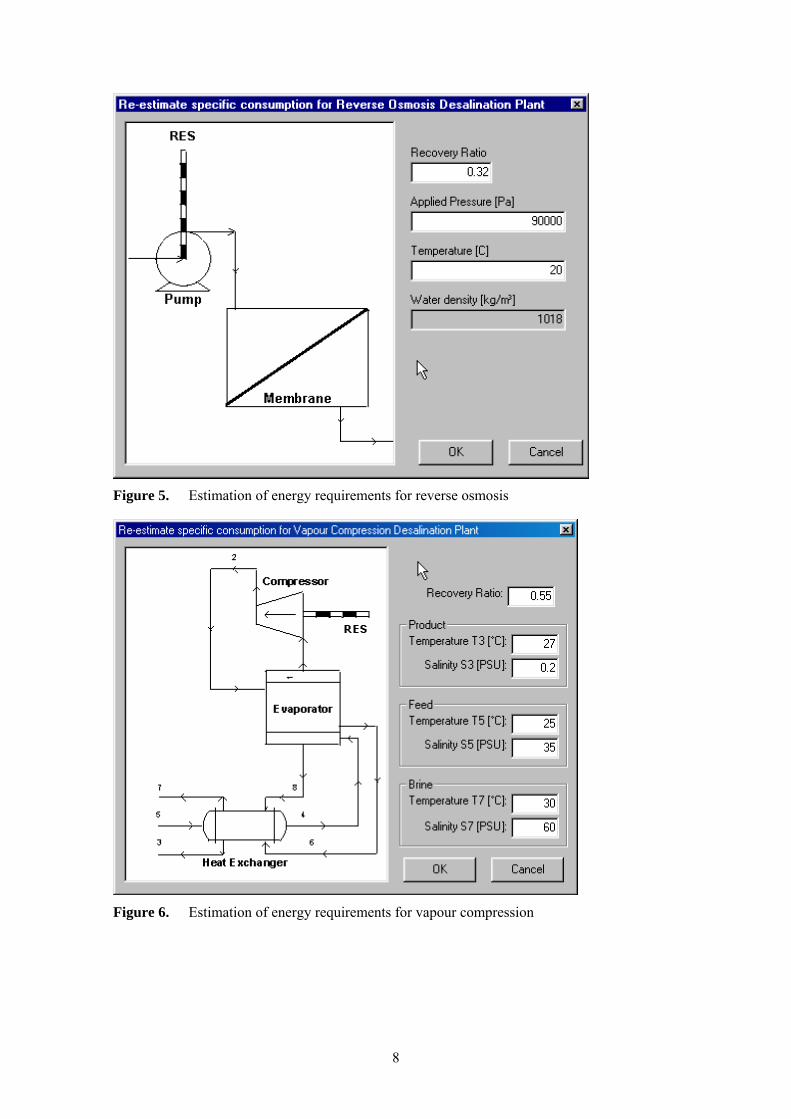
The second step presents the energy requirements of the selected desalination process and provides the option to the user to alter the specific energy demand or re-estimate the energy requirements using different design variables. Figure 4 presents the form for the definition of the specific energy requirements of the selected desalination process. Figure 5 presents the form for the analytical estimation of reverse osmosis energy requirements. Figure 6 presents the design variables for the estimation of vapour compression energy needs. In both cases the capacity of the desalination plant has been defined in the first step of the design procedure.
Figure 4. Energy requirements of the selected desalination process
8
Figure 5. Estimation of energy requirements for reverse osmosis
Figure 6. Estimation of energy requirements for vapour compression
9
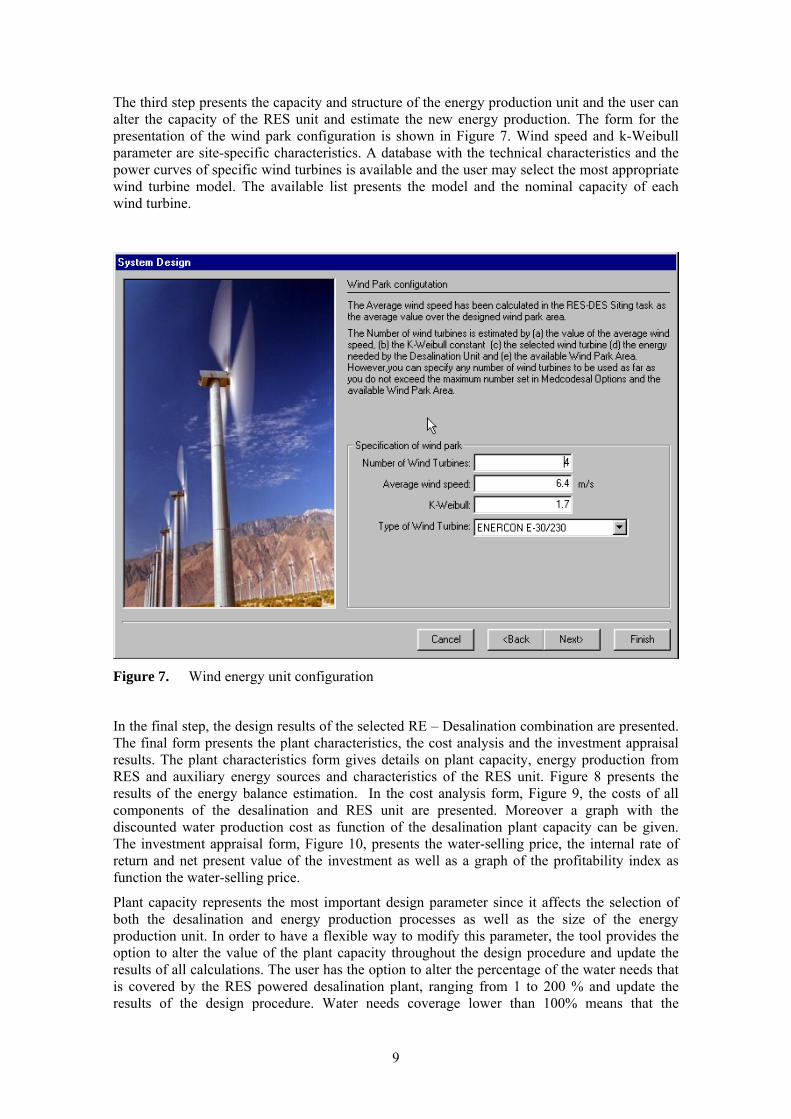
The third step presents the capacity and structure of the energy production unit and the user can alter the capacity of the RES unit and estimate the new energy production. The form for the presentation of the wind park configuration is shown in Figure 7. Wind speed and k-Weibull parameter are site-specific characteristics. A database with the technical characteristics and the power curves of specific wind turbines is available and the user may select the most appropriate wind turbine model. The available list presents the model and the nominal capacity of each wind turbine.
Figure 7. Wind energy unit configuration
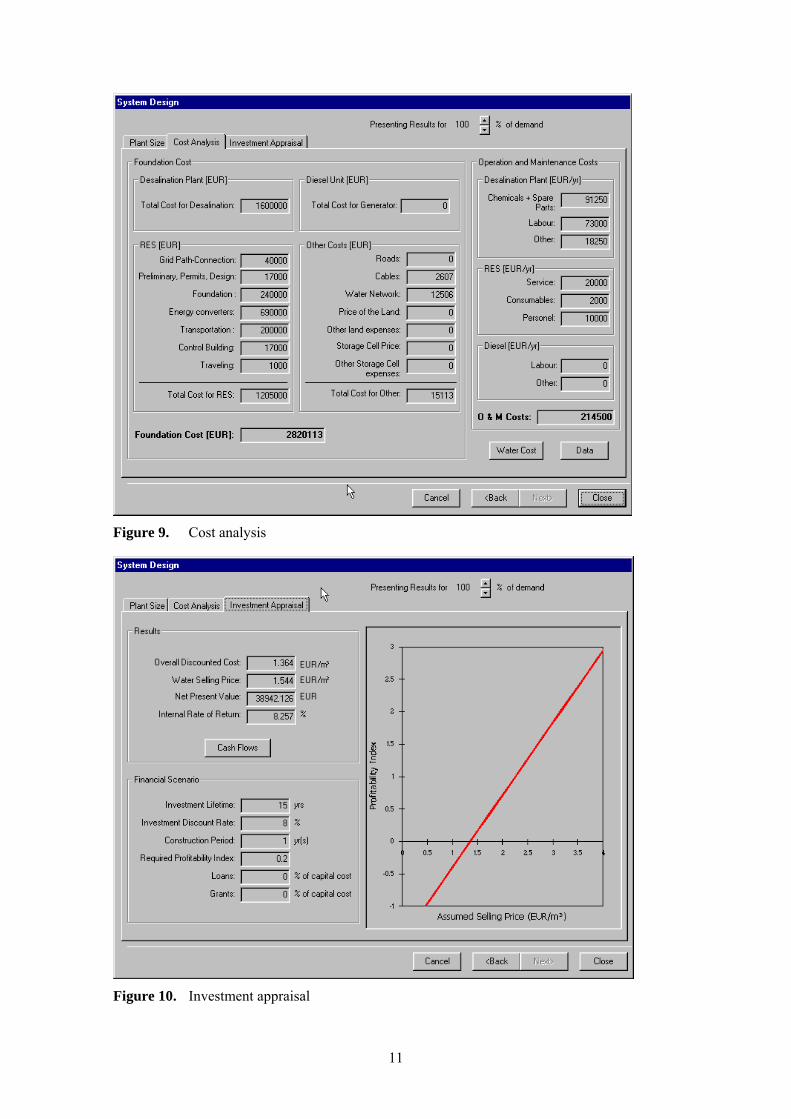
In the final step, the design results of the selected RE – Desalination combination are presented. The final form presents the plant characteristics, the cost analysis and the investment appraisal results. The plant characteristics form gives details on plant capacity, energy production from RES and auxiliary energy sources and characteristics of the RES unit. Figure 8 presents the results of the energy balance estimation. In the cost analysis form, Figure 9, the costs of all components of the desalination and RES unit are presented. Moreover a graph with the discounted water production cost as function of the desalination plant capacity can be given. The investment appraisal form, Figure 10, presents the water-selling price, the internal rate of return and net present value of the investment as well as a graph of the profitability index as function the water-selling price.
Plant capacity represents the most important design parameter since it affects the selection of both the desalination and energy production processes as well as the size of the energy production unit. In order to have a flexible way to modify this parameter, the tool provides the option to alter the value of the plant capacity throughout the design procedure and update the results of all calculations. The user has the option to alter the percentage of the water needs that is covered by the RES powered desalination plant, ranging from 1 to 200 % and update the results of the design procedure. Water needs coverage lower than 100% means that the
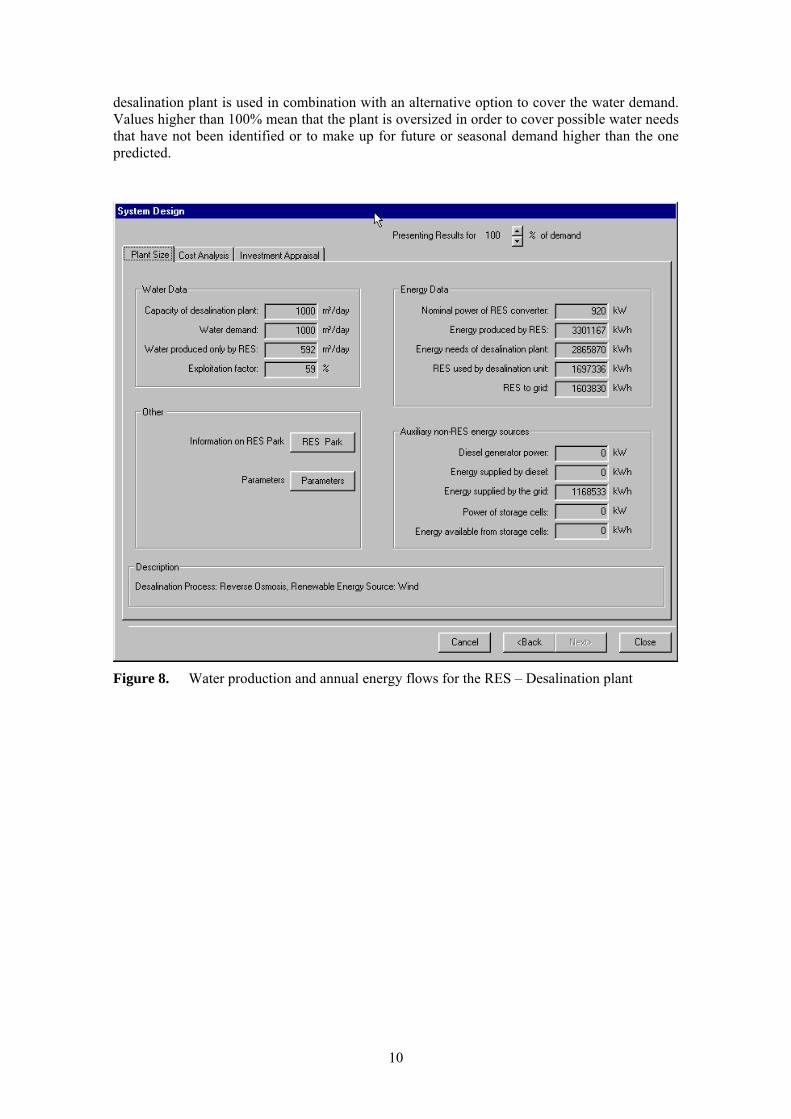
10
desalination plant is used in combination with an alternative option to cover the water demand. Values higher than 100% mean that the plant is oversized in order to cover possible water needs that have not been identified or to make up for future or seasonal demand higher than the one predicted.
Figure 8. Water production and annual energy flows for the RES – Desalination plant
11
Figure 9. Cost analysis
Figure 10. Investment appraisal
12
4 CASE STUDY
4.1 Design of alternative RE-desalination options The software tool has been used to identify and design the most appropriate RES powered desalination plant in the case of a seawater desalination plant. The capacity of the desalination plant is 1000 m3/d. The mean annual wind speed, considered for the case study, is 6.4 m/s and the annual solar radiation on a tilted surface is 1680 kWh/m2. The objective of the case study is to select the RES-desalination technology combination that best matches the conditions of the specific region.
Six alternative combinations of desalination process and renewable energy technologies have been evaluated. The desalination processes that can be used for seawater are reverse osmosis (RO) and vapour compression (VC). Electrodialysis (ED) is not used for seawater desalination and is excluded from further analysis. The RES technologies that have been evaluated are wind turbines (WT) and photovoltaics (PV) either grid connected or stand-alone. The high energy needs of vapour compression and the high PV costs indicate that this combination is not expected to be economically competitive with the rest of the available options and is excluded from further analysis. The operating pressure of the RO plant is 90 bar and the recovery ratio is 0.32. The recovery ratio for the VC plant is 0.55 and the salinity of the feed and product streams is presented in Figure 6. In the cases of grid connected desalination plants the installed capacity of RES units does not exceed the maximum allowable limit that ensures the stability of the grid.
Table 1 presents the energy balance for the selected RES-desalination combinations. The existence of the grid connection provides the option to direct the excess energy to the grid during high wind energy availability and to get the required energy during low wind energy availability. For non-grid connected plants a diesel generator covers the energy demand during low energy production while excess energy produced during high wind energy production is rejected. In the case of PV powered plants, the capacity of the power unit has been selected to meet the energy requirements of the desalination process. This option implies that the desalination plant operates only when adequate solar energy is available.
Table 1. Energy balance for the 1000 m3/d RES-Desalination Units
RES –Desalination Combination
Desalination energy needs
(MWh/y)
RES energy production (MWh/y)
Nominal installed power (kW)
RES energy used by
desalination (MWh/y)
Grid energy used by
desalination (MWh/y)
RES energy to
Grid (MWh/y)
RO-WT-G 2866 3301 920 1697 1169 1604
RO-WT-NG 2866 3301 920 1697 0 0
VC-WT-G 5641 5777 1610 3235 2406 2542
VC-WT-NG 5641 5777 1610 3235 0 0
RO-PV-G 2866 2809 1968 2809 57 0
RO-PV-NG 2866 2809 1968 2809 0 0
The overall discounted water cost for each of the selected RES desalination combinations is estimated according to the investment and operational costs of Table 2, [1]. A lifetime of 15 years and a discount rate of 8% are assumed. Table 3 presents the estimated overall discounted
13
cost and the expected water selling price for each of the selected RES-desalination combinations and a desalination unit capacity of 1000 m3/d. The overall discounted water cost is lower in the case of the grid connected wind powered RO plant due to the revenues from power sales to the grid. The PV powered RO plant is the scheme with the higher discounted costs due to the high PV costs and there is no substantial difference between the grid and non-grid connected option. This is due to the selected PV unit capacity, which exactly matches the energy requirements of the reverse osmosis plant, and consequently the energy flow from the PV unit to the grid does not substantially affect the plant economics.
The water-selling price has been estimated assuming a profitability index of 0.2, which is considered adequate for an investment with very low operating and maintenance costs. One of the criteria to select the most applicable combination for the region under consideration is to compare the expected water-selling price to the price that consumers already pay. In most Aegean Islands, which face severe water shortage problems, the only available alternative to cover water demand is water transportation by ships. The cost of this option ranges from 2.9 – 3.5 EURO/m3 but is subsidised resulting to water prices in the range of 1.5 to 1.7 EURO/m3. Comparing the RE-desalination water cost with the non-subsidised cost of water transportation, most of the RE-desalination alternatives are competitive on economic terms. Only the wind energy powered reverse osmosis plant is economically competitive when the comparison is based on the subsidised water price.
Table 2. Investment and operational costs of RES – Desalination plants
Desalination Process Initial investment (EURO/m3)
Consumables (EURO/m3)
Labour (EURO/m3)
Maintenance (EURO/m3)
Reverse Osmosis 1600 0.25 0.2 0.05 Vapour compression 2500 0.15 0.2 0.08
Electrodialysis (brackish water) 328 0.13 0.2 0.01
Renewable energy
technologies Equipment
(EURO/kW) Installation (EURO/kW)
Maintenance (EURO/kW)
Wind Turbines 750 500 32 Photovoltaics 4000 153 10
Table 3. Water production cost and selling price
RES Desalination Combination
Estimated Discounted Water Cost (EURO/m3)
Expected water selling price
(EURO/m3)
Subsidized water prices (EURO/m3)
RO-WT-G 1.50 1.68
1.5 – 1.7 RO-WT-NG 1.69 1.87 VC-WT-G 2.13 2.42 VC-WT-NG 2.44 2.74 RO-PV-G 3.15 3.78 RO-PV-NG 3.14 3.76
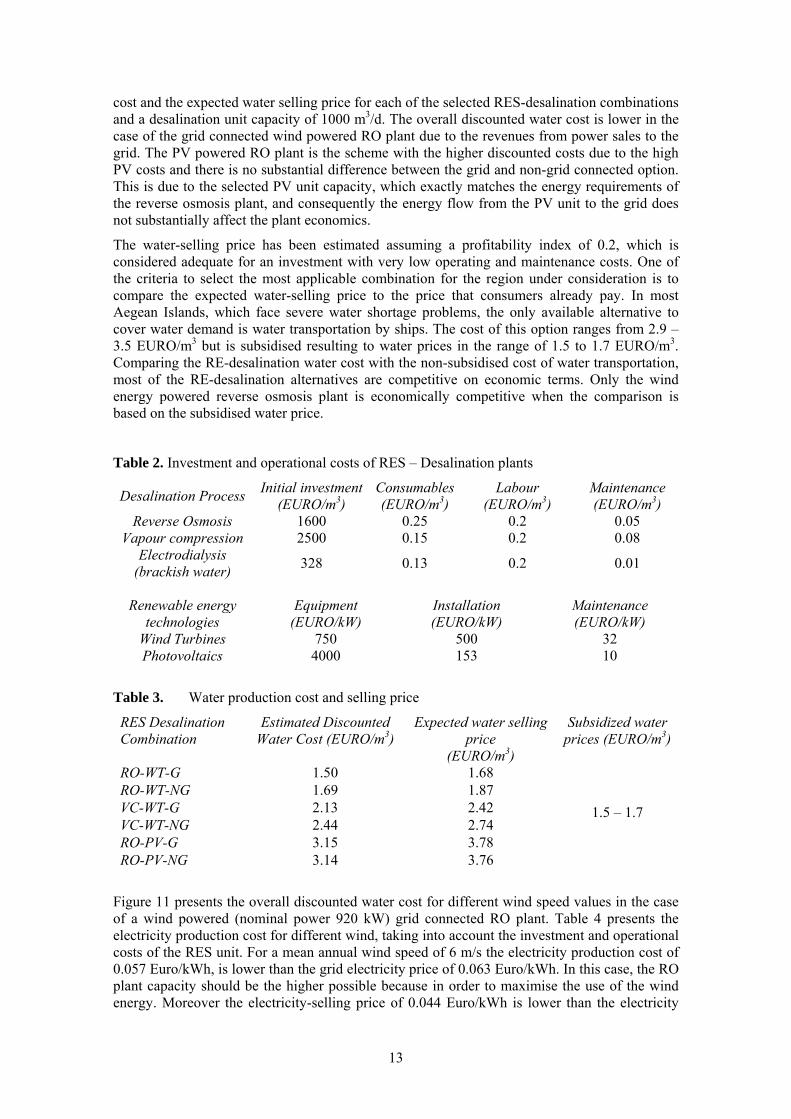
Figure 11 presents the overall discounted water cost for different wind speed values in the case of a wind powered (nominal power 920 kW) grid connected RO plant. Table 4 presents the electricity production cost for different wind, taking into account the investment and operational costs of the RES unit. For a mean annual wind speed of 6 m/s the electricity production cost of 0.057 Euro/kWh, is lower than the grid electricity price of 0.063 Euro/kWh. In this case, the RO plant capacity should be the higher possible because in order to maximise the use of the wind energy. Moreover the electricity-selling price of 0.044 Euro/kWh is lower than the electricity
14
production cost of 0.057 Euro/kWh indicating that it is more profitable to use the wind electricity for desalination than to sell it directly to the grid. For a wind speed of 8.5 m/s the electricity production cost is lower than the power-selling price (and the grid electricity price). In this case the RO plant capacity should be as low as possible in order to maximize the power sales to the grid.
Table 4. Electricity production cost for the grid connected wind RO plant
Wind speed (m/s)
Electricity production cost (EUR/kWh)
6.0 0.057 7.0 0.046 8.0 0.044 8.5 0.040
0 400 800 1200 1600 2000
Desalination Plant Capacity (m3/day)
1
2
3
Ove
rall
Wat
er C
ost (
EUR
O/m
3 )
Wind Speed (m/s)6.07.08.08.5
Figure 11. Effect of the wind speed on the overall discounted water cost for the grid connected
wind powered RO plant
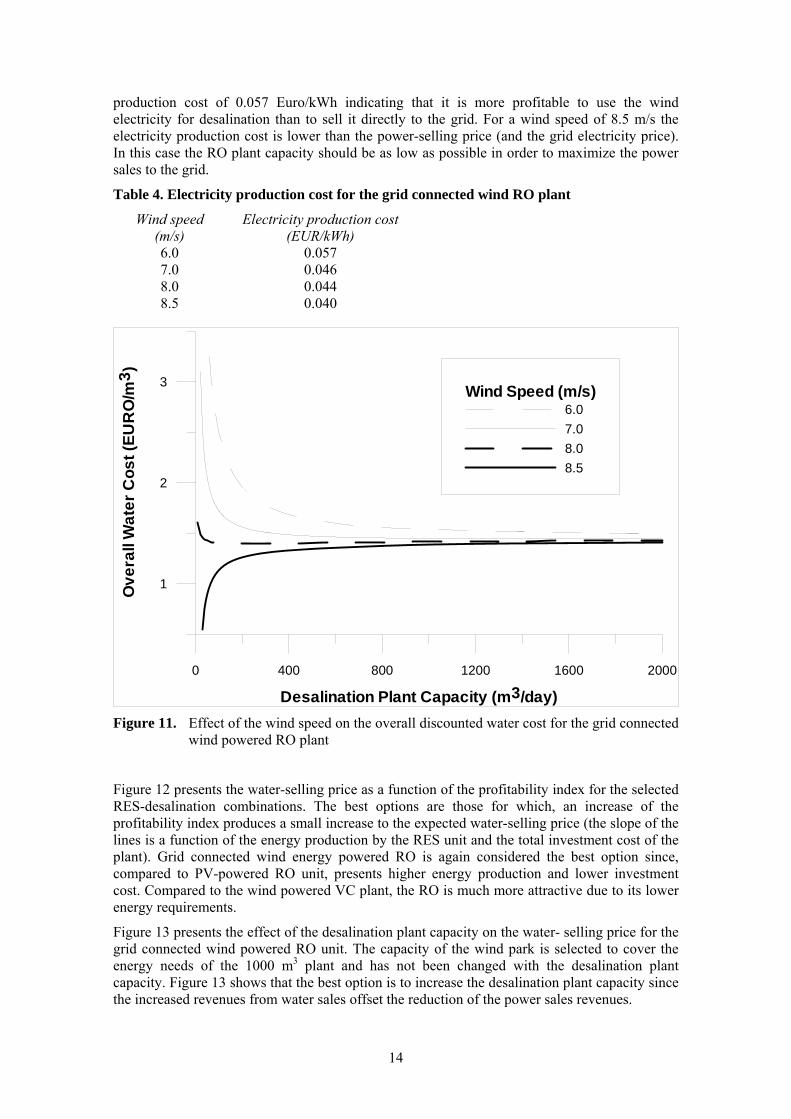
Figure 12 presents the water-selling price as a function of the profitability index for the selected RES-desalination combinations. The best options are those for which, an increase of the profitability index produces a small increase to the expected water-selling price (the slope of the lines is a function of the energy production by the RES unit and the total investment cost of the plant). Grid connected wind energy powered RO is again considered the best option since, compared to PV-powered RO unit, presents higher energy production and lower investment cost. Compared to the wind powered VC plant, the RO is much more attractive due to its lower energy requirements.
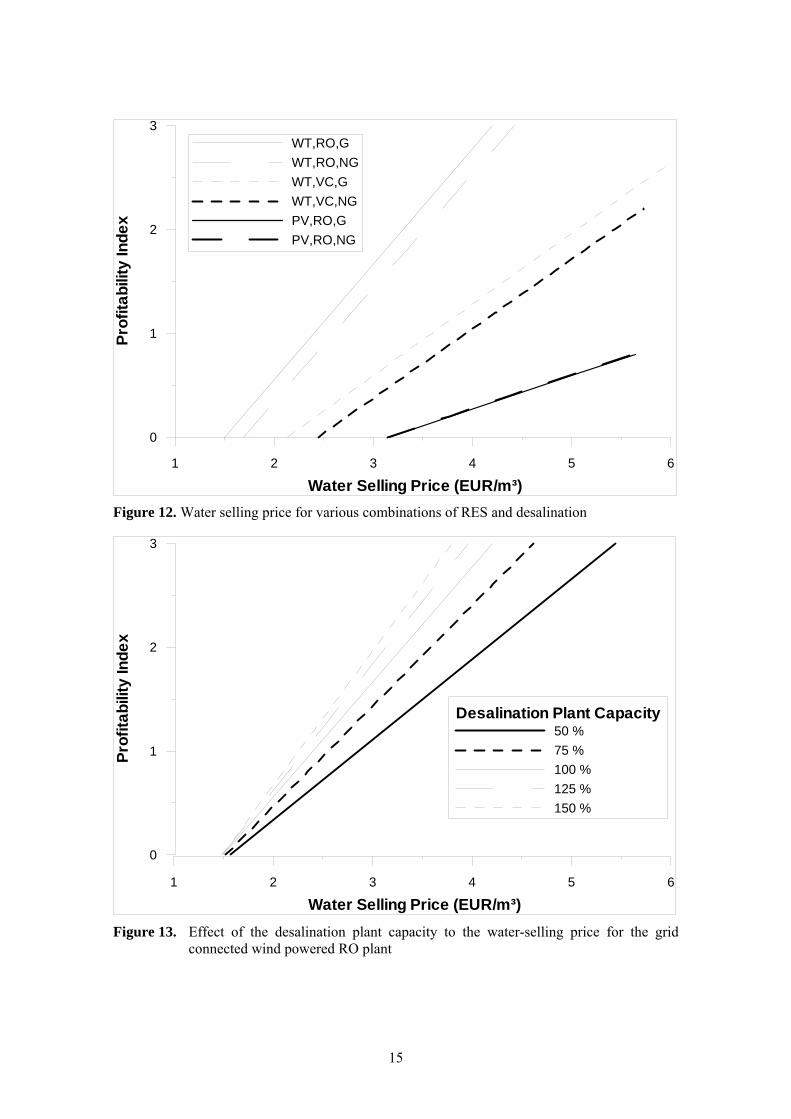
Figure 13 presents the effect of the desalination plant capacity on the water- selling price for the grid connected wind powered RO unit. The capacity of the wind park is selected to cover the energy needs of the 1000 m3 plant and has not been changed with the desalination plant capacity. Figure 13 shows that the best option is to increase the desalination plant capacity since the increased revenues from water sales offset the reduction of the power sales revenues.
15
1 2 3 4 5 6
Water Selling Price (EUR/m³)
0
1
2
3Pr
ofita
bilit
y In
dex
WT,RO,GWT,RO,NGWT,VC,GWT,VC,NGPV,RO,GPV,RO,NG
Figure 12. Water selling price for various combinations of RES and desalination
1 2 3 4 5 6
Water Selling Price (EUR/m³)
0
1
2
3
Prof
itabi
lity
Inde
x
Desalination Plant Capacity50 %75 %100 %125 %150 %
Figure 13. Effect of the desalination plant capacity to the water-selling price for the grid
connected wind powered RO plant
16
4.2 Water selling price analysis The water production cost for most of the RES – Desalination schemes is higher than current water prices, (Table 3). The RES – Desalination scheme with the lower water production cost is the grid-connected, wind – RO desalination plant. The expected water selling prices, estimated in order to provide a minimum profitability for the investor (Figure 12), are well above current water prices (Table 3).
In order for RES powered desalination plants to be competitive with current water sources in economic terms the water price should be reduced without affecting the profitability of investments. The options available to reduce the expected water prices from RES powered desalination plants are:
• Direct or indirect price subsidies,
• Economies of scale for the desalination technology
• Economies of scale for the renewable energy technology
The tool has been used to analyse the prospects of these options. The expected water-selling price for a grid-connected wind powered RO plant has been analysed in relation to the electricity selling price, the desalination unit capacity and the wind energy unit capacity.
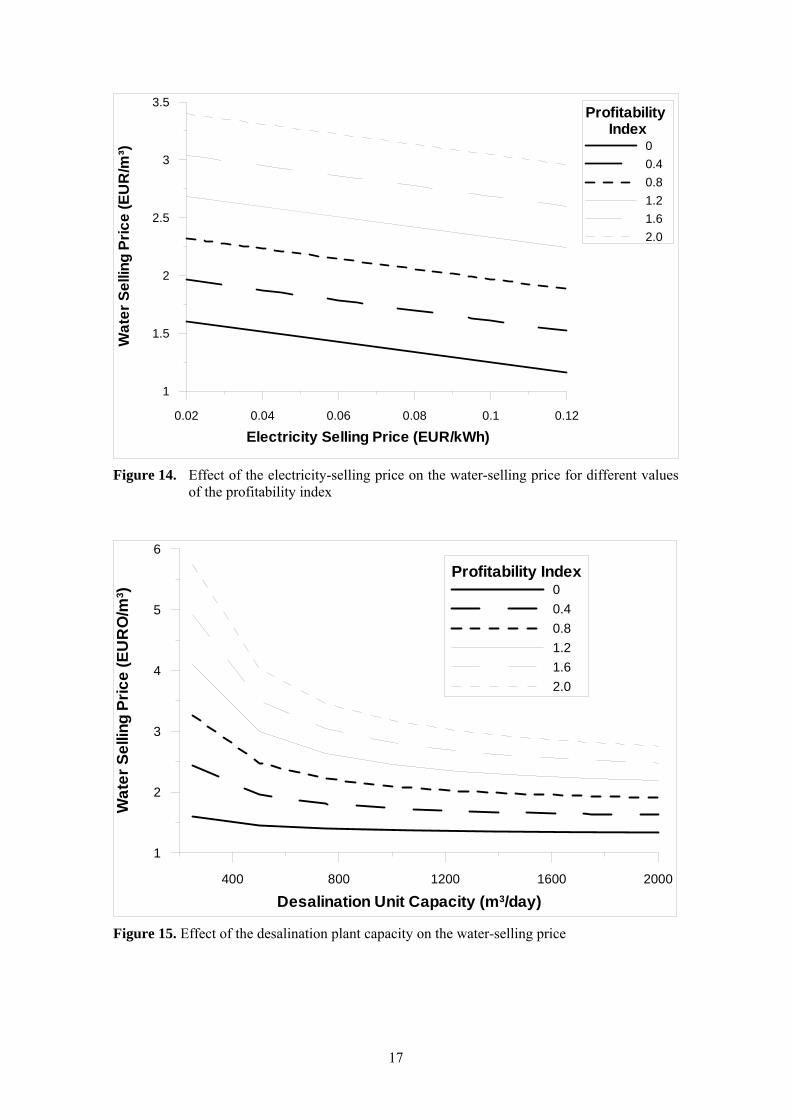
Indirect water price subsidies can be achieved through the electricity-selling price in grid-connected plants. Figure 14 presents the dependence of the water-selling price on the electricity-selling price for different values of the profitability index. The capacity of the RO desalination plant is 1000 m3/d and the capacity of the wind energy unit is 920 kW. The increase of the electricity-selling price leads to lower water-selling prices for all profitability index values. Higher profitability index values indicate that both electricity prices and water prices have to be increased. Negative values of the water selling price that are expected for high electricity prices indicate that the examined investment would reach the specified profitability level just by selling the excess electricity to the grid at the selected price. RES electricity tariff premium can be used to indirectly subsidise the water-selling price for grid-connected plants.
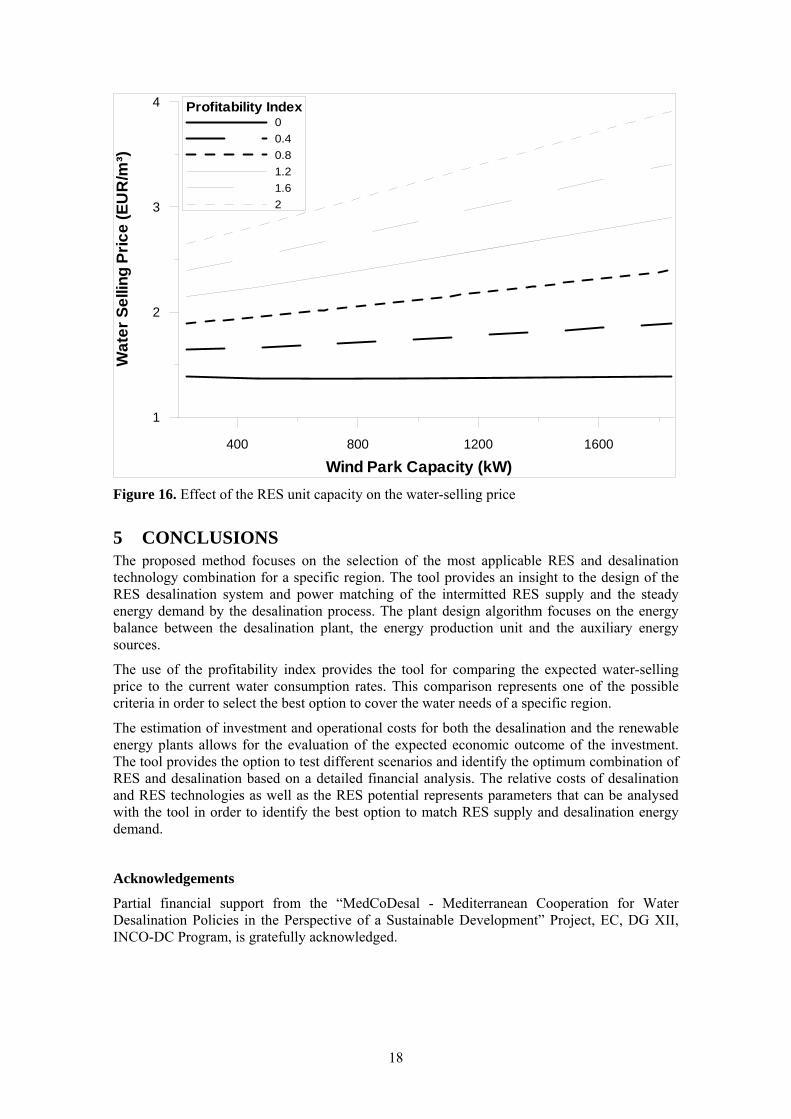
Economies of scale for the desalination plant can be evaluated assuming that the desalination plant capacity increases while the wind park capacity is fixed. Figure 15 presents the effect of the desalination plant capacity on the water-selling price for different profitability index values. The assumed capacity of the wind park is 920 kW. If the profitability index value is set to zero the water-selling price is equal to the discounted water cost. The water-selling price follows the same pattern with the water production cost for all profitability index values. As the profitability index increases the difference of the water-selling price with the water cost increases.
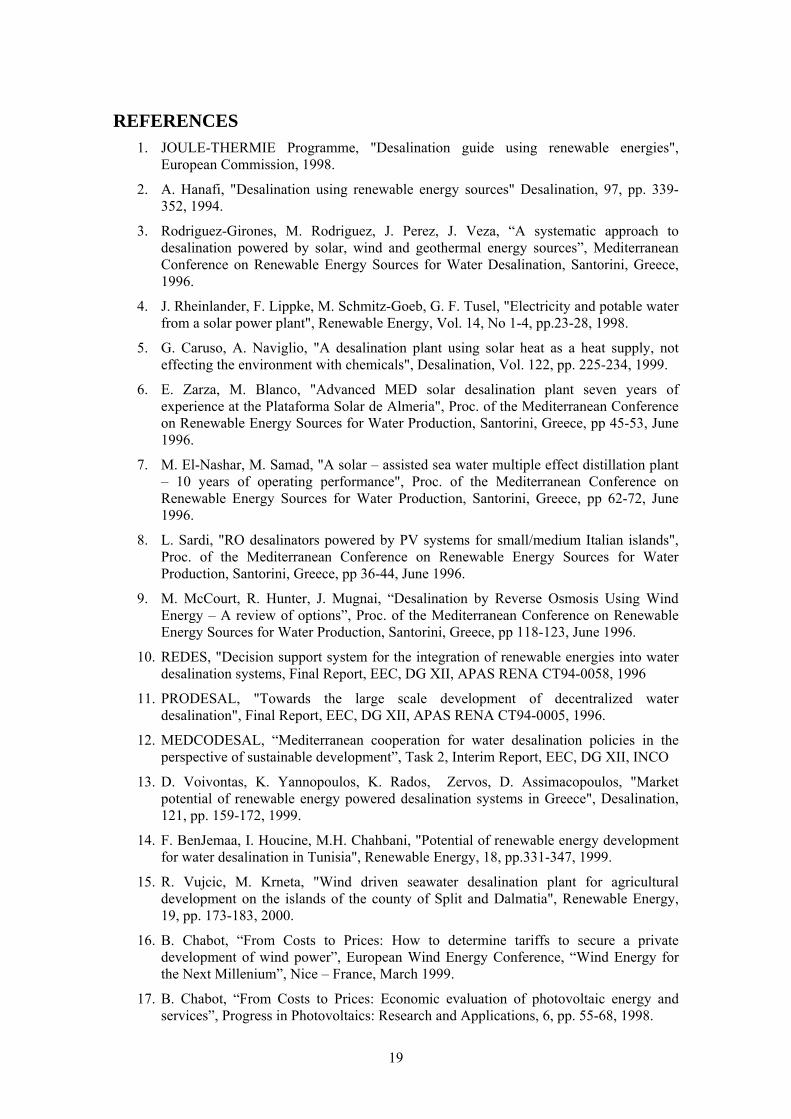
The effect of the RE capacity on the overall water cost and consequently on the water price can be analysed assuming that the desalination unit capacity is fixed and the RES unit capacity is increased. Figure 16 presents the effect of the RES plant capacity on the water-selling price. The RO desalination plant capacity is set to 1000 m3/d and the wind speed at the installation site is 6.4 m/s. In the selected case as the wind park capacity increases the plant investment and operational costs increase faster than the increase of electricity selling revenues. Consequently, the water production cost as well as the water-selling price increases with the RES plant capacity. The decisive parameter in this analysis is the electricity production cost, which depends on site-conditions as well as RE technology costs. Different site conditions (higher wind speed) would decrease the electricity production cost and may alter the shape of the line in the graph leading to water price reduction with the increase of wind plant capacity.
17
0.02 0.04 0.06 0.08 0.1 0.12
Electricity Selling Price (EUR/kWh)
1
1.5
2
2.5
3
3.5
Wat
er S
ellin
g Pr
ice
(EU
R/m
³)Profitability
Index00.40.81.21.62.0
Figure 14. Effect of the electricity-selling price on the water-selling price for different values
of the profitability index
400 800 1200 1600 2000
Desalination Unit Capacity (m3/day)
1
2
3
4
5
6
Wat
er S
ellin
g Pr
ice
(EU
RO
/m3 )
Profitability Index00.40.81.21.62.0
Figure 15. Effect of the desalination plant capacity on the water-selling price
18
400 800 1200 1600
Wind Park Capacity (kW)
1
2
3
4W
ater
Sel
ling
Pric
e (E
UR
/m³)
Profitability Index00.40.81.21.62
Figure 16. Effect of the RES unit capacity on the water-selling price
5 CONCLUSIONS The proposed method focuses on the selection of the most applicable RES and desalination technology combination for a specific region. The tool provides an insight to the design of the RES desalination system and power matching of the intermitted RES supply and the steady energy demand by the desalination process. The plant design algorithm focuses on the energy balance between the desalination plant, the energy production unit and the auxiliary energy sources.
The use of the profitability index provides the tool for comparing the expected water-selling price to the current water consumption rates. This comparison represents one of the possible criteria in order to select the best option to cover the water needs of a specific region.
The estimation of investment and operational costs for both the desalination and the renewable energy plants allows for the evaluation of the expected economic outcome of the investment. The tool provides the option to test different scenarios and identify the optimum combination of RES and desalination based on a detailed financial analysis. The relative costs of desalination and RES technologies as well as the RES potential represents parameters that can be analysed with the tool in order to identify the best option to match RES supply and desalination energy demand.
Acknowledgements
Partial financial support from the “MedCoDesal - Mediterranean Cooperation for Water Desalination Policies in the Perspective of a Sustainable Development” Project, EC, DG XII, INCO-DC Program, is gratefully acknowledged.
19
REFERENCES 1. JOULE-THERMIE Programme, "Desalination guide using renewable energies",
European Commission, 1998.
2. A. Hanafi, "Desalination using renewable energy sources" Desalination, 97, pp. 339-352, 1994.
3. Rodriguez-Girones, M. Rodriguez, J. Perez, J. Veza, “A systematic approach to desalination powered by solar, wind and geothermal energy sources”, Mediterranean Conference on Renewable Energy Sources for Water Desalination, Santorini, Greece, 1996.
4. J. Rheinlander, F. Lippke, M. Schmitz-Goeb, G. F. Tusel, "Electricity and potable water from a solar power plant", Renewable Energy, Vol. 14, No 1-4, pp.23-28, 1998.
5. G. Caruso, A. Naviglio, "A desalination plant using solar heat as a heat supply, not effecting the environment with chemicals", Desalination, Vol. 122, pp. 225-234, 1999.
6. E. Zarza, M. Blanco, "Advanced MED solar desalination plant seven years of experience at the Plataforma Solar de Almeria", Proc. of the Mediterranean Conference on Renewable Energy Sources for Water Production, Santorini, Greece, pp 45-53, June 1996.
7. M. El-Nashar, M. Samad, "A solar – assisted sea water multiple effect distillation plant – 10 years of operating performance", Proc. of the Mediterranean Conference on Renewable Energy Sources for Water Production, Santorini, Greece, pp 62-72, June 1996.
8. L. Sardi, "RO desalinators powered by PV systems for small/medium Italian islands", Proc. of the Mediterranean Conference on Renewable Energy Sources for Water Production, Santorini, Greece, pp 36-44, June 1996.
9. M. McCourt, R. Hunter, J. Mugnai, “Desalination by Reverse Osmosis Using Wind Energy – A review of options”, Proc. of the Mediterranean Conference on Renewable Energy Sources for Water Production, Santorini, Greece, pp 118-123, June 1996.
10. REDES, "Decision support system for the integration of renewable energies into water desalination systems, Final Report, EEC, DG XII, APAS RENA CT94-0058, 1996
11. PRODESAL, "Towards the large scale development of decentralized water desalination", Final Report, EEC, DG XII, APAS RENA CT94-0005, 1996.
12. MEDCODESAL, “Mediterranean cooperation for water desalination policies in the perspective of sustainable development”, Task 2, Interim Report, EEC, DG XII, INCO
13. D. Voivontas, K. Yannopoulos, K. Rados, Zervos, D. Assimacopoulos, "Market potential of renewable energy powered desalination systems in Greece", Desalination, 121, pp. 159-172, 1999.
14. F. BenJemaa, I. Houcine, M.H. Chahbani, "Potential of renewable energy development for water desalination in Tunisia", Renewable Energy, 18, pp.331-347, 1999.
15. R. Vujcic, M. Krneta, "Wind driven seawater desalination plant for agricultural development on the islands of the county of Split and Dalmatia", Renewable Energy, 19, pp. 173-183, 2000.
16. B. Chabot, “From Costs to Prices: How to determine tariffs to secure a private development of wind power”, European Wind Energy Conference, “Wind Energy for the Next Millenium”, Nice – France, March 1999.
17. B. Chabot, “From Costs to Prices: Economic evaluation of photovoltaic energy and services”, Progress in Photovoltaics: Research and Applications, 6, pp. 55-68, 1998.
20
List of Symbols NPV = Net present value of the investment
INVC = Initial investment cost
WSP = Water selling price
WQ = Desalination plant capacity
ESP = Electricity selling price
EQ = Excess power sold to the grid CR = Capital recovery factor
MOC & = Annual operation and maintenance cost
WDC =Discounted water cost
FQ = Feed flow rate
BQ = Brine flow rate
PWQ = Product water flow rate (plant capacity)
FC = Salt concentration in the feed stream
BC = Salt concentration in the brine stream
PWC = Salt concentration in the product stream R = Plant recovery ratio
1β = Membrane coefficient
mA = Membrane area
AdP = Applied pressure differential
OdP = Osmotic pressure differential b = Proportionality factor a = Polarisation factor
WP = Power requirements of the reverse osmosis unit
Wρ = Sea water density as a function of salinity
ih = Enthalpy of streams i
iPc = Specific heat capacity of streams i as a function of salinity
iT = Temperature of streams i
refT = Reference temperature [K].
)(Up = Probability of occurrence of wind speed U U = Wind speed, k = Shape coefficient of the k-Weibull distribution, C = Scale coefficient Γ = Γ -function and U = Mean annual wind speed
HU = Wind speed at height H
refU = Wind speed at reference height refH (in most cases 10 m)
r = Index depending on the roughness of the terrain (for flat regions, 0.17) WTE = Annual energy production of the wind turbine
CutOutU = Maximum operating wind speed
21
( )UP = Power output at wind speed U
DESWTE → = Wind energy absorbed by the desalination plant WTN = Number of wind turbines
PdesU = Wind speed which corresponds to power equal to WTW NP / at the power curve of the wind-turbine
outP = Output electric power
inP = Input solar power. E = Annual energy production S = Solar radiation A = Area covered by PV-cells
SE
SE = Energy production from storage cells DA = Days of continuous stand alone operation
Sη = Storage cell efficiency
22
Appendix 1. Modelling of Desalination Processes
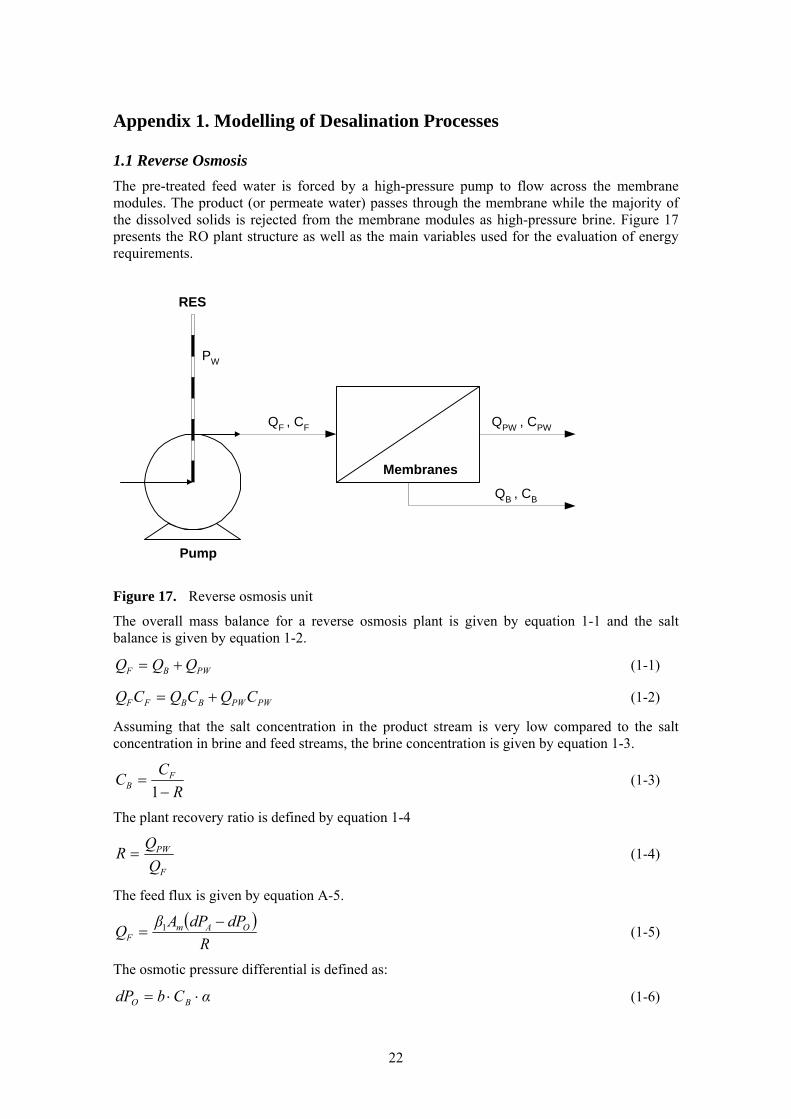
1.1 Reverse Osmosis The pre-treated feed water is forced by a high-pressure pump to flow across the membrane modules. The product (or permeate water) passes through the membrane while the majority of the dissolved solids is rejected from the membrane modules as high-pressure brine. Figure 17 presents the RO plant structure as well as the main variables used for the evaluation of energy requirements.
RES
Pump
Membranes
QF , CF QPW , CPW
QB , CB
PW
Figure 17. Reverse osmosis unit
The overall mass balance for a reverse osmosis plant is given by equation 1-1 and the salt balance is given by equation 1-2.
PWBF QQQ += (1-1)
PWPWBBFF CQCQCQ += (1-2)
Assuming that the salt concentration in the product stream is very low compared to the salt concentration in brine and feed streams, the brine concentration is given by equation 1-3.
RCC F
B −=
1 (1-3)
The plant recovery ratio is defined by equation 1-4
F
PW
QQR = (1-4)
The feed flux is given by equation A-5.
( )R
dPdPAQ OAmF
−= 1β (1-5)
The osmotic pressure differential is defined as:
α⋅⋅= BO CbdP (1-6)
23
The polarisation factor is defined as:
B
BFB
CCC +
=α (1-7)
The feed-brine salt concentration, FBC , is calculated by equation 8.
FBF
BBFFFB C
RQQCQCQ
C−
=++
=2
2 (1-8)
For a specified recovery ratio, the feed flow rate is calculated using equation 1-5 and the product flux is calculated by equation 1-4. The power needed to produce capacity equal to the product flow rate is calculated using equation 1-8.
W
APW R
dPQP
ρ⋅⋅
= (1-9)
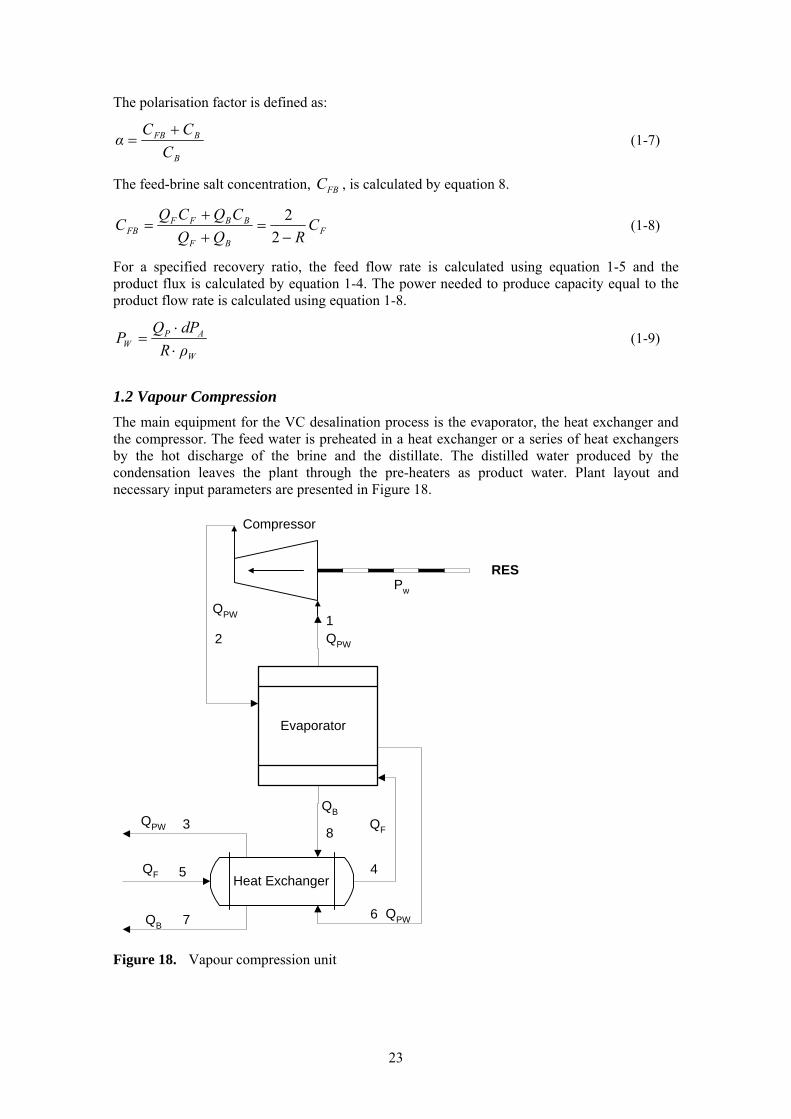
1.2 Vapour Compression The main equipment for the VC desalination process is the evaporator, the heat exchanger and the compressor. The feed water is preheated in a heat exchanger or a series of heat exchangers by the hot discharge of the brine and the distillate. The distilled water produced by the condensation leaves the plant through the pre-heaters as product water. Plant layout and necessary input parameters are presented in Figure 18.
Evaporator
12
8
4
7
5
3
6
Compressor
Heat Exchanger
RES
QPW
Pw
QPW
QPW
QPW
QF
QF
QB
QB
Figure 18. Vapour compression unit
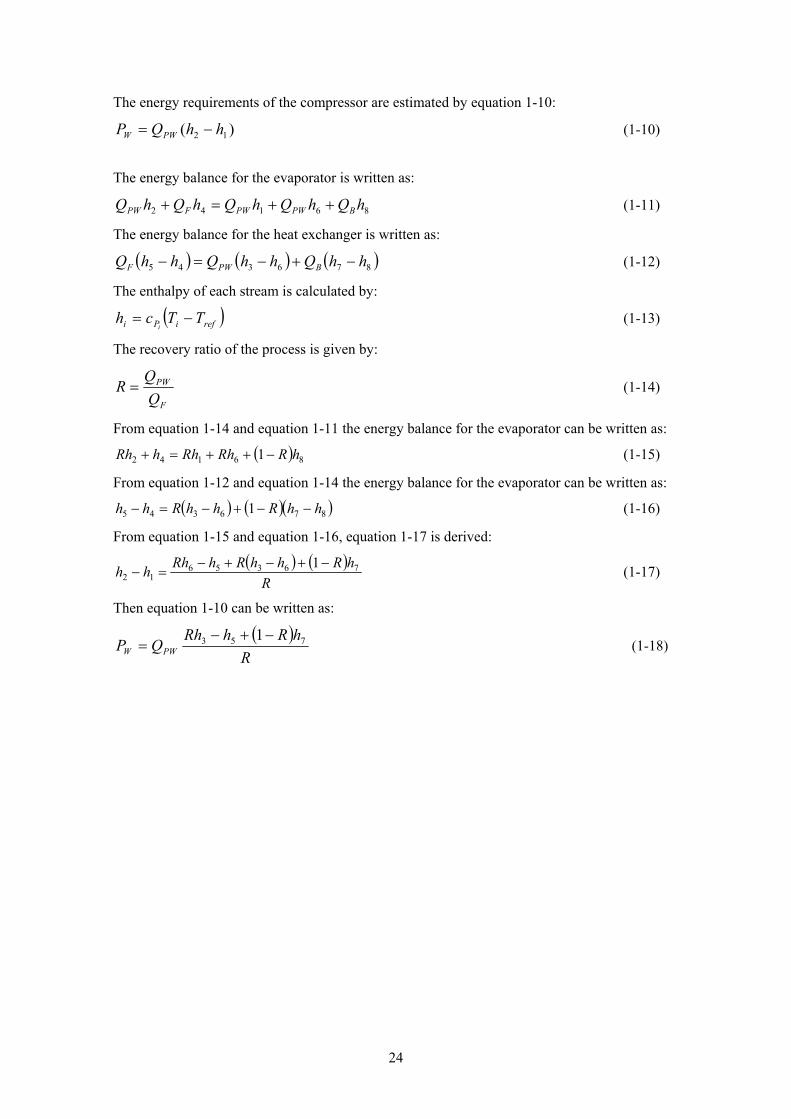
24
The energy requirements of the compressor are estimated by equation 1-10:
)( 12 hhQP PWW −= (1-10)
The energy balance for the evaporator is written as:
86142 hQhQhQhQhQ BPWPWFPW ++=+ (1-11)
The energy balance for the heat exchanger is written as:
( ) ( ) ( )876345 hhQhhQhhQ BPWF −+−=− (1-12)
The enthalpy of each stream is calculated by:
( )refiPi TTchi
−= (1-13)
The recovery ratio of the process is given by:
F
PW
R = (1-14)
From equation 1-14 and equation 1-11 the energy balance for the evaporator can be written as:
( ) 86142 1 hRRhRhhRh −++=+ (1-15)
From equation 1-12 and equation 1-14 the energy balance for the evaporator can be written as:
( ) ( )( )876345 1 hhRhhRhh −−+−=− (1-16)
From equation 1-15 and equation 1-16, equation 1-17 is derived:
( ) ( )R
hRhhRhRhhh 7635612
1−+−+−=− (1-17)
Then equation 1-10 can be written as:
( )R
hRhRhQP PWW
753 1−+−= (1-18)
25
Appendix 2. Modelling of RES Converters
2.1 Wind Energy The produced energy from a wind turbine depends on the power curve of the wind-turbine and the instant wind velocity. The time variability of wind speed is usually modelled by the K-Weibull distribution. The probability of occurrence of a specific wind speed is estimated using equation 2-1.
⎟⎟⎠
⎞⎜⎜⎝
⎛⎟⎠⎞
⎜⎝⎛−⎟
⎠⎞
⎜⎝⎛=
− kk
CU
CU
CkUp exp)(
1
(2-1)
The scale parameter C of the Weibull distribution can be estimated using equation 2-2.
⎟⎠⎞
⎜⎝⎛ +
=
k
UC11Γ
(2-2)
Consequently, the only necessary inputs for modelling the wind speed in a specific region are the mean annual wind speed and the shape parameter.
The instantaneous power output of a wind turbine is a function of the wind speed at the rotor height and is given by the power curve ( )UP . Usually the mean annual wind speed is measured at height 10 m. The wind speed at rotor height can be estimated from the wind speed at 10 m using equation 21. The annual energy production of the wind turbine is estimated using equation 2-3.
r
refrefH H
HUU ⎟⎟⎠
⎞⎜⎜⎝
⎛= (2-3)
∫ ⋅⋅=Ucutout
WT dUUPUpE0
)()(8760 (2-4)
The annual energy requirements of the desalination process, DESE , are estimated by:
WDES PE ⋅= 8760 . (2-5)
where, WP , is the power needed by the desalination process. Assuming that the wind turbines can provide the desalination plant with power up to WP , the maximum annual wind energy that the desalination plant can absorb is estimated by:
( ) ( ) ( )⎥⎥⎦
⎤
⎢⎢⎣
⎡+⋅⋅= ∫ ∫→
Pdes cutout
Pdes
U U
UPdesWTDESWT dUUpPdUUpUPNE
0 0
8760 (2-6)
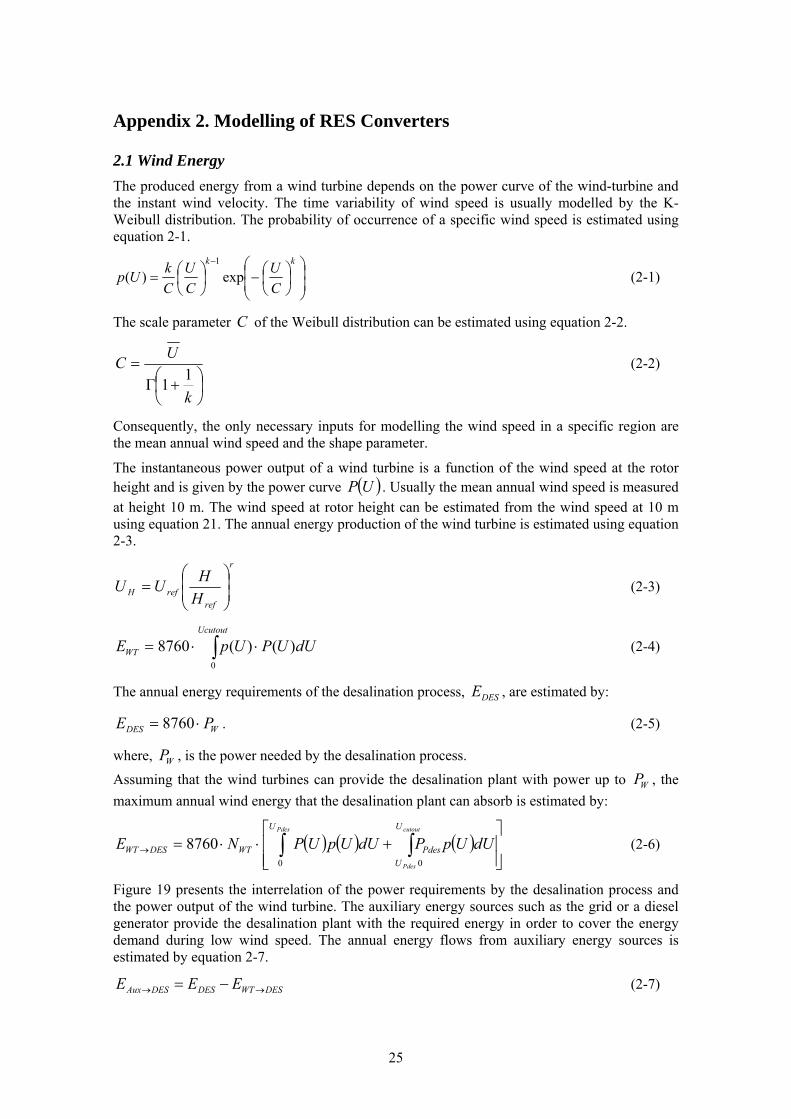
Figure 19 presents the interrelation of the power requirements by the desalination process and the power output of the wind turbine. The auxiliary energy sources such as the grid or a diesel generator provide the desalination plant with the required energy in order to cover the energy demand during low wind speed. The annual energy flows from auxiliary energy sources is estimated by equation 2-7.
DESWTDESDESAux EEE →→ −= (2-7)
26
The excess power that is not used by the desalination unit is sold to the grid in the case of grid-connected plants or dumped in the case of stand-alone plants. The wind energy sold to the grid is given by equation 2-8.
DESWTWTGridWT EEE →→ −= (2-8)
0.0
100.0
200.0
300.0
400.0
500.0
600.0
2 4 6 8 10 12 14 16
U (m/s)
PWT
PWT→DESPAux→DES
(PWT→Grid)
PW
Figure 19. Power curve and power absorbed by the desalination unit for one Enercon E-
40/500 kW wind turbine
2.2 PV energy The energy produced by solar cells depends on the solar radiation of the specified region, the area of the PV-cells and their efficiency. The efficiency of PV is defined as:
in
out
PP
=η (2-9)
The annual produced energy is equal to:
ASE ⋅⋅= η (2-10)
In the case of stand alone PV powered desalination plant energy storage cells are used to cover the plant energy requirements for periods of low solar radiation. The maximum capacity of the storage cells is estimated on the basis of the maximum period that the plant should operate without any input from the PV cells. The energy production of the storage cells is calculated by equation 2-11. Energy losses from charging and discharging the batteries are estimated using equation 2-12.
DA365EE DES
S ⋅= (2-11)
27
SS
Slost EE ⋅
−=
ηη )1(
(2-12)
Therefore, storage cell use increases the total energy demand of the unit and the new energy demand is estimated using Equation 2-13:
lostDESTOTAl EEE += (2-13)