open the pdf - king county metro transit
TRANSCRIPT
Transportation
F - 76

ECONOMIC GROWTH AND BUILT ENVIRONMENT
DEPARTMENT OF TRANSPORTATION
O V E R V I E W The Department of Transportation (DOT) includes the following DOT divisions: DOT Director’s Office; Roads Services Division; Airport Division; Transit Division; Marine Division; and Fleet Administration Division. The 2013 / 2014 Executive Proposed Budget reflects a continuing need to address the transportation priorities of King County efficiently and economically within funding constraints. Many DOT divisions continue to experience significant financial pressures resulting from structural deficits and the declining economy. This has required prudent financial management on the part of all DOT divisions in order to preserve services to the community.
The Department of Transportation strongly advances the King County Strategic Plan Economic Growth and Built Environment (EGBE) Goal, and thus the Department’s appropriation units are included in the EGBE section of the Executive Proposed Budget Book.
Fleet is reported out under the How We Deliver section of the budget book.
MARINE DIVISION 29,853,923 2%
DOT DIRECTOR 'S OFFICE 11,547,893 1%
FLEET WASTEWATER EQUIP REPLACEMENT
5,160,099 <1%
TRANSIT 1,352,091,808 70%
OTHER 16,406 <1%
AIRPORT 30,437,415 2%
AIRPORT CONSTRUCTION
TRANSFER 5,500,000 <1%
ROADS 140,934,497 7%
ROADS CONSTRUCTION TRANSFER 48,000,000
2%
FLEET MGT EQUIPMENT 25,897,661 1%
TRANSIT REVENUE VEHICLE REPLACEMENT
262,629,618 14%
FLEET MOTOR POOL 28,046,443 1%
Department of Transportation Appropriations$1.9 Billion
Mission:
Transportation
To improve the quality of life for the citizens of King County by providing
mobility in a way that protects the environment, helps to manage
growth, and reduces traffic congestion.
F - 77

ECONOMIC GROWTH AND BUILT ENVIRONMENT
Department of Transportation Director’s Office
The purpose of the King County Department of Transportation (DOT) Director’s Office is to support the delivery of transportation services by the department’s Transit, Road Services, Airport, Fleet Administration, and Marine divisions. The DOT Director’s Office advances the missions and goals of the department’s divisions by providing leadership and coordination as well as direct centralized services to the divisions. Specifically, the DOT Director’s Office provides: (1) overall department leadership resulting in shared goals and collaboration on transportation service delivery, grant applications, and transportation policy; (2) human resources, reform, and process improvement; (3) coordination for countywide initiatives including strategic planning, performance management
and performance measurement, energy saving and global warming mitigation, equity and social justice, and customer service; (4) essential services to divisions including emergency preparedness planning and implementation, community relations, internal and external communications, public information and outreach, grant management services, and legislative coordination across local, state, and federal governments; and (5) leadership for regionally significant projects.
The Director’s Office budget resides in the Public Transportation operating fund (along with Transit operations). Division operations are funded primarily through allocations and direct service charges to the DOT divisions and other King County departments, with the bulk of the DOT Director’s Office revenues derived from allocations from the Transit Division. During the 2013 / 2014 biennium, the two largest divisions, Transit and Road Services, are implementing budget decisions and resource allocations in terms of their adopted strategic plans and implementation plans. The Road Services Division is undergoing significant reductions in service and staffing levels throughout the biennium, and Metro Transit will begin making service reductions at the end of the biennium unless a new revenue source is obtained. The Director’s Office will play a critical role in supporting Transit and Roads as they work with their customers, stakeholders, and decision makers to fully inform all of the consequences and expected outcomes of these changes. The Director’s Office will lead in development of funding options, forging regional partnerships, and providing support for all efforts to generate new revenues. These efforts will mitigate the impact that financial shortfalls have on the advancement of the strategies within the Economic Growth and Built Environment goal. 2013 / 2014 Key Issues The Director’s Office will continue to provide leadership, advocacy, and support for the department, its customers, and the community. DOT will focus on safety and security, mobility, environmental health, equity and social justice, workforce development, and customer service with an emphasis on managing costs and maximizing revenues. Executive Priorities Considered in 2013 / 2014 Business Planning and Budget Development The Executive’s 2013 / 2014 priorities to advance the King County Strategic Plan and inform the 2013 / 2014 Proposed Budget spotlighted consideration of Equity and Social Justice; attainment of a 3 percent efficiency target while maintaining value and service levels; energy investment; and KCSP alignment of agency goals, objectives, and services.
Mission:
Transportation
To improve the quality of life for the citizens of King County by providing
mobility in a way that protects the environment, helps to manage growth,
and reduces traffic congestion.
F - 78

ECONOMIC GROWTH AND BUILT ENVIRONMENT
• Equity and Social Justice: The Director’s Office provides leadership and coordination among the divisions
for the Department of Transportation’s work on countywide initiatives. These include equity and social justice (ESJ) issues. The core of the department’s business operations is dependent on the quality of customer relationships and the responsiveness of services to customer needs. The department’s ESJ activities relative to business operations focus on three primary objectives:
o Promoting opportunities to integrate ESJ into decision making (resources, services, and policies). o Elevating employee awareness of the department’s ESJ activities to demonstrate the practical value of
ESJ in the workplace, both among employees and with customers. o Continuing an active community engagement model that engages community stakeholders as partners
to improve access to services. In 2013 / 2014, the department (DOT) will continue to work with the King County Procurement Office to implement changes that will improve the diversity of its contracted and procurement services. They will also work with Human Resources to ensure that ESJ is reflected in the recruitment, selection and retention of a diverse and qualified workforce. The Communications group will continue to use a community engagement model to help better inform the department on how the county’s diverse communities may be impacted by proposed service decisions. This model has been an effective tool as seen in our outreach in South Park concerning the replacement bridge, and in southeast Seattle concerning transit improvements. The Director’s Office will focus efforts on working across departments to coordinate access and availability to services with other county agencies utilizing the mutual benefits of the ESJ Inter branch team (IBT) to better leverage partnerships with other King County departments, local governments, and nonprofit organizations or agencies.
• 3 Percent Efficiencies: The Director’s Office will continue its vigilant cost management practices, which focuses on reducing expenditures and finding efficiencies that can be passed on to the divisions. Building on the space and administration efficiencies from 2012, the Director’s Office proposes to meet the 3 percent efficiency goal through a combination of administrative efficiencies and budget reductions in non-labor accounts. For 2013, no labor based efficiencies are proposed given the high demands anticipated from the contraction of the Roads Services Division along with leadership transitions in the Roads and Marine Divisions.
• Energy Investment: The Director’s Office co-leads the county’s Energy Task Force and staffs the Energy
Strategy Team and the implementation of the 2010 King County Energy Plan. The energy plan provides a detailed roadmap for implementing the King County Strategic Plan, building on the county’s past efforts to improve energy efficiency and expanding the use and production of renewable and greenhouse-gas-neutral energy. Energy continues to be a major cost to the county and Department of Transportation, and reducing this expense will contribute to the county’s ability to maintain critical services. The Director’s Office provides leadership and focuses on leveraging utility and grant-backed resources to help the department achieve the following objectives:
o Reduce energy use through continuous improvements in facility and equipment efficiency, procurement, construction practices, and resource conservation.
o Increase transit use and provide transportation choices that reduce overall energy use and emissions in the county, while improving the efficiency of King County’s fleet.
o Work with the state and local jurisdictions to guide the regional adoption of innovative technology for buildings and vehicles, with a focus on developing electric vehicle policies.
o Increase the production and use of renewable energy.
F - 79

2013/2014 Biennial Budget for
DOT Director's Office 4640/A46400
Code/ Item# Description Expenditures FTEs * TLTs
FY13
Adopted Budget
2012 / 2013 Adopted Budget 11,810,072 30.90 2.00AD_012
Adjustments to Adopted Budget
2013 Adjustments to 2012 / 2013 Adopted Budget (5,863,873) 0.00 0.00PF_013
Direct Service Changes
Alignment of Staffing with Service Needs (18,200) 0.00 0.00DS_001
Administrative Service Changes
Non-Labor Budgeted Expenditure Efficiencies (98,574) 0.00 0.00AC_300
Erroneous Revenue Revision (-31,877 Revenue) 0 0.00 0.00AC_301
Central Rate Changes
General Fund Overhead Adjustment 24,876 0.00 0.00CR_005
KCIT Operations and Maintenance Charge (2,220) 0.00 0.00CR_007
KCIT Infrastructure Charge (34,815) 0.00 0.00CR_008
Geographic Information Systems Charge 894 0.00 0.00CR_009
KCIT Operations and Maintenance Charge (9,234) 0.00 0.00CR_010
Motor Pool Rate Adjustment 10,644 0.00 0.00CR_013
Prosecuting Attorney Office Civil Division Charge 567 0.00 0.00CR_020
Debt Service Adjustment 24,324 0.00 0.00CR_021
Long Term Leases (17,963) 0.00 0.00CR_022
Financial Services Charge (10,212) 0.00 0.00CR_025
Property Services-Lease Administration Fee (50) 0.00 0.00CR_036
Facilities Management Strategic Initiative Fee 37 0.00 0.00CR_037
Major Maintenance Repair Fund (1,314) 0.00 0.00CR_038
Countywide Strategic Technology Projects (214) 0.00 0.00CR_046
Business Resource Center 1,744 0.00 0.00CR_048
KCIT Reorganization Transfer (50,452) 0.00 0.00CR_050
KCIT Workstation Services 137,712 0.00 0.00CR_052
KCIT Business Analysis 3,372 0.00 0.00CR_056
KCIT Countywide Services 8,268 0.00 0.00CR_057
KCIT Tech Service Rebate (8,880) 0.00 0.00CR_058
Technical Adjustments
Inclusion of Omitted Finance TLT to be Loaned-Out to
Marine Division
(305) 0.00 0.00TA_001
Update of Miscellaneous Administrative Accounts
Based on Historical Actuals
500 0.00 0.00TA_003
Loan-Out Labor to Transit In-Motion Program (20,000) 0.00 0.00TA_005
Grant Funding Revenue Revision - ($93,000) Revenue 0 0.00 0.00TA_006
DOT Director's Office Allocation Model Revenue
Revisions - ($44,397) Revenue
0 0.00 0.00TA_050
Long Term Lease Rebate (154,149) 0.00 0.00TA_099
5,732,554 30.90 2.00FY13 Subtotal
DOT Director's OfficeEconomic Growth and Built EnvironmentKing County Strategic Plan:
F - 80

2013/2014 Biennial Budget for
DOT Director's Office 4640/A46400
Code/ Item# Description Expenditures FTEs * TLTs
FY14
Adjustments to Adopted Budget
2013 Adopted Budget 6,007,850 0.00 0.00PF_012
Adjustments to Adopted Budget 17,728 0.00 (1.00)PF_014
Direct Service Changes
Alignment of Staffing with Service Needs (18,200) 0.00 0.00DS_001
2014 Mid-Year Staff Reduction (56,140) (.42) 0.00DS_002
Administrative Service Changes
Non-Labor Budgeted Expenditure Efficiencies (98,574) 0.00 0.00AC_300
Erroneous Revenue Revision (70,094 Revenue) 0 0.00 0.00AC_301
Central Rate Changes
2014 Central Rate Adjustments 116,419 0.00 0.00CR_099
Technical Adjustments
Inclusion of Omitted Finance TLT to be Loaned-Out to
Marine Division
(95) 0.00 0.00TA_001
Update of Miscellaneous Administrative Accounts
Based on Historical Actuals
500 0.00 0.00TA_003
Grant Funding Revenue Revision - ($132,500) Revenue 0 0.00 0.00TA_006
DOT Director's Office Allocation Model Revenue
Revisions - ($76,392) Revenue
0 0.00 0.00TA_050
Long Term Lease Rebate (154,149) 0.00 0.00TA_099
5,815,339 30.48 1.00FY14 Subtotal
11,547,893 1.00
* FTEs for the 2013 Budget and 2013/2014 Biennial Budget do not include temporary positions or overtime. The 2013/2014
Biennial Budget reflects the maximum number of FTEs during the biennium.
** The 2013/2014 Biennial Budget reflects the total expenditures for the biennium.
2013/2014 Biennial Budget 30.90
DOT Director's OfficeEconomic Growth and Built EnvironmentKing County Strategic Plan:
F - 81

ECONOMIC GROWTH AND BUILT ENVIRONMENT
Department of Transportation Director’s Office
P R O G R A M H I G H L I G H T S The total 2013 / 2014 Proposed budget for the Director’s Office is $11,547,893 with funding for 30.90 FTEs and 1.00 TLTs. This proposed 2013 / 2014 budget represents a 2 percent decrease from the 2012 / 2013 Adopted Budget. Adjustments to Adopted Budget Adjustments to the 2012 / 2013 Adopted Biennial Budget in 2013 and 2014 Pro Forma include removing the 2012 portion of the budget to create a baseline for the 2013 / 2014 budget as well as miscellaneous salary adjustments. Salary adjustments include increases for 3.09 percent COLA for 2013 and 2.00 percent for 2014 and a 1.00 percent increase in the Flex Benefit rate for 2013 from the 2012 rate and a 4.00 percent increase from 2013 for the 2014 rate. Direct Service Changes Alignment of Staffing with Service Needs 2013 – ($18,200) 2014 – ($18,200) This change item replaces the budget authority for one full time position with authority for two half-time positions to meet the staffing needs of the Communications/Community Relations section as they provide services to other DOT divisions and county agencies. In the 2012 / 2013 Adopted Budget, the Director's Office proposed reducing one position in the Communications/Community Relations unit as an efficiency and increasing a part time position to a full time position. However, it has since been determined that this staffing arrangement would not provide the needed skill sets and competencies to meet county needs with regard to community engagement and equity and social justice. The main budget impact of this change is an increase in benefit costs, which the agency has offset by taking a reduction in consulting services budget. The item is therefore neutral to the Director’s Office allocation model and the division costs; however, the system indicates a negative value for this item because the additional benefit costs for the part-time position are contained in the Adjustments to be Adopted Budget change item. 2014 Mid-Year Staff Reduction/Efficiency 2014 – ($56,140) / (0.42) FTE This proposal eliminates a transportation planner in August of 2014. The Director’s Office proposes to reorganize and redistribute the work in the Office of Regional Transportation Planning to minimize the impact of this reduction; however, this proposal will result in a reduction in the capacity of ORTP. This reduction will help the Director’s Office contain its cost growth, which is especially important given the fiscal condition of the Road Service’s and Transit Divisions. This change will annualize to the reduction of one FTE.
F - 82

ECONOMIC GROWTH AND BUILT ENVIRONMENT
Administrative Service Changes Non-Labor Budgeted Expenditure Efficiencies 2013 – ($98,574) 2014 – ($98,574) This proposal incorporates $98,574 in non-labor, on-going efficiencies into the budget beginning in 2013. This change builds on the staffing and space consolidation efficiencies undertaken in 2012. The largest proportion of savings comes from considerable reductions in consulting budget in the Director’s Office and Office of Regional Transportation Planning. Additional savings is achieved through reductions from various administrative accounts. The proposed reductions were based on a review of actual expenditures as well as consideration of the anticipated 2013 / 2014 work program. Erroneous Revenue Revision 2013 – ($31,877) Revenue 2014 – $70,094 Revenue This adjustment was made in error during the budget process. The revenue revision change item below brings the total revenue to the required level. Central Rate Changes Central Rate Changes 2013 – $77,084 2014 – $116,419 This series of adjustments captures the net effect of countywide charges from the 2012 / 2013 Adopted Budget to reflect the most current 2013 and 2014 central rate charges. Unlike previous years, it does not include COLA and flex benefits, which are included in the Pro Forma decision package. Details about each rate can be found in the How We Deliver Introduction, beginning on page H-5, and the agency-specific changes are detailed in the central rate section of the agency crosswalk. Technical Adjustments Inclusion of Omitted Finance TLT to be Loaned-Out to Marine Division 2013 – ($305) 2014 – ($95) This adjustment restores a finance TLT to be loaned-out to the Marine Division that was inadvertently deleted in the transition to the new budget system. The TLT position was restored through April 2014. Update of Miscellaneous Administrative Accounts Based on Historical Actuals 2013 – $500 2014 – $500 This technical adjustment is comprised of changes to various non-labor administrative accounts within the Communications/Community Relations unit of the Director’s Office. The net change reflects a small increase based on actual expenditure levels in 2012.
F - 83

ECONOMIC GROWTH AND BUILT ENVIRONMENT
Loan-Out Labor to Transit In-Motion Program 2013 – ($20,000) This change item increases loan out labor in 2013 in the Office of Regional Transportation Planning. In prior budgets, a project program manager TLT was approved with the understanding it would be fully funded from grants and other sources and that it would not result in additional overheard charges to DOT divisions. For 2013, 80 percent of the revenue supporting this position is from federal grants. The remaining 20 percent, or $20,000, is to be charged out to Transit for work on the Transit In-Motion program. Grant Funding Revenue Revision 2013 – ($93,000) Revenue 2014 – ($132,500) Revenue This adjustment revises the amount of anticipated grant revenues to $94,000 for 2013 and to $54,500 for 2014. This change reflects the ending of the federal energy grant in 2013. These grant funds support both a project program manager TLT as well as other chargeable hours. Grants administration staff time previously chargeable to the grant will be redirected to other grant administration activities and covered through the cost allocation model. DOT Director’s Office Allocation Model Revenue Revisions 2013 – ($44,379) Revenue 2014 – ($76,392) Revenue This adjustment makes several revisions to revenue accounts consistent with the 2013 / 2014 allocation plan. Long-Term Lease Rebate 2013 – ($154,149) 2014 – ($154,149) King County has received a rebate from the owner of the King Street Center and has benefitted from the refinancing of the remaining debt. The 2013 / 2014 budget passes this windfall on to the King Street tenants in the form of a $7.5 million rent rebate and a $450,000 capital project to reconfigure space associated with the Road Services proposed consolidation to a single floor in King Street Center. Since this Road Services cost cutting space measure is a relatively recent proposal a 20 percent contingency is included in the $450,000 project amount budgeted in the Long Term Lease fund. In the proposed budget the rebate has been included as a separate decision package entry to offset the central rate budgeting of 2013 and 2014 lease costs.
F - 84

ECONOMIC GROWTH AND BUILT ENVIRONMENT
KING COUNTY INTERNATIONAL AIRPORT
O V E R V I E W King County International Airport (KCIA) has been serving King County and its citizens since 1928. KCIA is classified by the Federal Aviation Administration as a Class IV, Primary, Commercial Service, Non-Hub Reliever Airport. DOT Airport Division accommodates flights at KCIA by keeping the runways and taxiways accessible and in good condition. The Federal Aviation Administration (FAA) provides specific and comprehensive regulatory direction and manages the flow of air and ground traffic. The Airport Division furthers the County’s Economic Growth and Built Environment goal, specifically strategy D of objective 1: “maintain infrastructure that facilitates the efficient movement of freight and goods to promote trade across the region.” KCIA supports the economic vitality of the county by supporting over 12,000 jobs in the local economy and creating $800 million in
labor income in King County1. KCIA clients range from private pilots to corporate aircraft operations, government organizations, retailers, and wholesalers. It is home to over 150 tenant businesses such as the Boeing Company, United Parcel Service (UPS), DHL Deutsche Post, Galvin, and Clay Lacy. 2013 / 2014 Key Issues Over the next two years, the Airport Division will begin implementing recommendations made in its line of business plan and complete a strategic plan. The recommendations and policy direction from these two planning efforts will help make judicious capital investments in systems and structures that keep the airport financially viable for the long term. One of the Airport Division’s immediate liabilities identified in the line of business plan is environmental mitigation. In 2013, the Airport Division will complete an investigation of several, recently discovered, contaminated sites and conduct clean-ups. The division will seek reimbursement from potentially responsible parties. The 2013 / 2014 Proposed Capital Budget includes $4.5 million for planning and clean-up at various sites around KCIA including the fuel farm.
1 Beyers, William B., and Michael Bebb. “King County International Airport Economic Impact Study 2008.” March 2009.
Mission:
King County International Airport
Provide safe and continuous aviation services that support scheduled
commercial, charter, and air cargo airlines as well as general aviation
and corporate operators as part of the national air transportation system, while fulfilling the needs of county and state businesses and residents for quality airport transportation
services and facilities.
F - 85

ECONOMIC GROWTH AND BUILT ENVIRONMENT
Executive Priorities Considered in 2013 / 2014 Business Planning and Budget Development The Executive’s 2013 / 2014 priorities to advance the King County Strategic Plan and inform the 2013 / 2014 Proposed Budget spotlighted consideration of Equity and Social Justice; attainment of a 3 percent efficiency target while maintaining value and service levels; energy investment; and KCSP alignment of agency goals, objectives, and services. • Equity and Social Justice: The Airport Roundtable, an advisory board to the Airport’s management, the
County Executive, and the County Council, provides an opportunity to address many elements of the County’s equity and social justice (ESJ) initiative. Eight of the sixteen Roundtable positions are reserved for representatives of communities affected by airport operations, giving these communities an excellent forum to voice their opinions and influence decisions on issues important to them. The Airport also operates the Residential Aircraft Noise Remedy Improvement Program (RANRIP) which reduces noise levels in homes adjacent to the airport to acceptable federal standards at no cost to the home’s occupant or owner. The program supplies language interpretive services for interested residents to mitigate any language barriers. Additionally, Opportunity Skyway is an airport-based education program at King County International Airport that combines academic and vocational learning with career exploration in aviation-related industries. The program supports KCIA’s efforts to foster good relations with nearby communities. It also supports the region’s Aerospace Alliance objective promote aviation education. The program is an airport based education program that uses aviation to promote academic and vocational learning while encouraging career exploration in aviation related industries.
• 3 Percent Efficiency: The Airport Division is making investments in operations that yield long-term savings
and return for the airport. In 2013, the Airport Division will continue redevelopment of vacant or underutilized leases to augment revenue, make some parcels more development ready through demolition and/or cleanup of existing sites, complete a strategic plan to better determine long-term development opportunities, and continue to look for opportunities to reduce costs in its operating and capital budgets. It is working with its regional partners to streamline stormwater management and firefighting services and costs.
• Energy Investment: The division continues to implement a facilities assessment and energy evaluation study completed in spring 2010. The projects include replacing the traditional lighting fixtures on Taxiway Alpha with LED fixtures. LED fixtures have a longer operational life and have reduced power consumption. Additionally, the Airport Division plans to improve and replace the HVAC system at several buildings on site including the terminal building, the maintenance ship and the FAA control tower.
F - 86

2013/2014 Biennial Budget for
Airport 4290/A71000
Code/ Item# Description Expenditures FTEs * TLTs
FY13
Adopted Budget
2012 / 2013 Adopted Budget 29,709,006 46.00 0.00AD_012
Adjustments to Adopted Budget
2013 Adjustments to 2012 Adopted Budget (15,390,360) 0.00 0.00PF_013
Central Rate Changes
General Fund Overhead Adjustment 41,268 0.00 0.00CR_005
KCIT Operations and Maintenance Charge (19,387) 0.00 0.00CR_007
KCIT Infrastructure Charge (54,146) 0.00 0.00CR_008
Geographic Information Systems Charge 91,233 0.00 0.00CR_009
KCIT Operations and Maintenance Charge (13,176) 0.00 0.00CR_010
KCIT Telecommunications Services 49,524 0.00 0.00CR_011
KCIT Telecommunications Overhead (2,736) 0.00 0.00CR_012
Facilities Management Space Charge (619) 0.00 0.00CR_014
Insurance Charges (33,524) 0.00 0.00CR_015
Prosecuting Attorney Office Civil Division Charge 46,956 0.00 0.00CR_020
Debt Service Adjustment 102,252 0.00 0.00CR_021
Financial Services Charge (47,027) 0.00 0.00CR_025
Long Term General Obligation Debt Insurance (1,488) 0.00 0.00CR_033
Property Services-Lease Administration Fee (68,816) 0.00 0.00CR_036
Facilities Management Strategic Initiative Fee (3) 0.00 0.00CR_037
Countywide Strategic Technology Projects 3,288 0.00 0.00CR_046
Business Resource Center 11,068 0.00 0.00CR_048
KCIT Application Services 54,096 0.00 0.00CR_051
KCIT Workstation Services 281,148 0.00 0.00CR_052
KCIT Business Analysis 3,696 0.00 0.00CR_056
KCIT Countywide Services 11,916 0.00 0.00CR_057
KCIT Tech Service Rebate (29,484) 0.00 0.00CR_058
Technical Adjustments
Technical Adjustments (71,542) 0.00 0.00TA_100
Utilities Adjustments 257,706 0.00 0.00TA_102
14,930,850 46.00 0.00FY13 Subtotal
FY14
Adjustments to Adopted Budget
2013 Adopted Budget 14,991,587 0.00 0.00PF_012
Adjustments to Adopted Budget (536,831) 0.00 0.00PF_014
Central Rate Changes
2014 Central Rate Adjustments 517,895 0.00 0.00CR_099
Technical Adjustments
Technical Adjustments 120,208 0.00 0.00TA_100
Utilities Adjustments 413,706 0.00 0.00TA_102
AirportEconomic Growth and Built EnvironmentKing County Strategic Plan:
F - 87

2013/2014 Biennial Budget for
Airport 4290/A71000
Code/ Item# Description Expenditures FTEs * TLTs
15,506,565 46.00 0.00FY14 Subtotal
30,437,415 0.00
* FTEs for the 2013 Budget and 2013/2014 Biennial Budget do not include temporary positions or overtime. The 2013/2014
Biennial Budget reflects the maximum number of FTEs during the biennium.
** The 2013/2014 Biennial Budget reflects the total expenditures for the biennium.
2013/2014 Biennial Budget 46.00
AirportEconomic Growth and Built EnvironmentKing County Strategic Plan:
F - 88

ECONOMIC GROWTH AND BUILT ENVIRONMENT
King County International Airport
P R O G R A M H I G H L I G H T S DOT Airport Division is funded through a variety of fees and lease agreements with KCIA tenants. The 2013 / 2014 Proposed Budget for the Airport Division is $30.44 million and 46.00 FTEs, plus an additional $5.5 million transferring from the operating fund to its capital program over the biennium. Adjustments to the Adopted Budget (Pro Forma) Adjustments to the 2012 / 2013 Adopted Biennial Budget in 2013 and 2014 Pro Forma include removing the 2012 portion of the budget to create a baseline for the 2013 / 2014 budget. Salary adjustments include increases for 3.09 percent COLA for 2013 and 2.00 percent for 2014 and a 1.00 percent increase in the Flex Benefit rate for 2013 from the 2012 rate and a 4.00 percent increase from 2013 for the 2014 rate. Central Rate Changes Central Rate Adjustments 2013 – $426,040 Expenditure 2014 - $517,895 Expenditure This series of adjustments captures the net effect of countywide charges from the 2013 Adopted Budget to reflect the most current 2013 and 2014 central rate charges. Unlike previous years, it does not include COLA and flex benefits, which are included in the Pro Forma decision package. Details about each rate can be found in the How We Deliver Introduction, beginning on page H-5, and the agency-specific changes are detailed in the central rate section of the agency crosswalk. Technical Adjustments Technical Adjustments 2013 – ($71,542) Expenditure / ($370,438) Revenue 2014 - $120,208 Expenditure / ($466,820) Revenue This biennial adjustment makes technical adjustments to the operating budget to align with actual expenditures including a reduction to temporary and overtime budget and a $20,000 one-time consulting cost for a customer service survey. Utilities Adjustments 2013 - $257,706 2014 - $413,706 This biennial adjustment reflects changes to utility accounts such as electricity, sewer, and natural gas. The majority of the increase is due to rate increases projected by the cities of Seattle and Tukwila over the next two years.
F - 89

2011 Actual 1 2012 Adopted2012
Estimated 22013
Proposed2014
Proposed 32015
Projected 42016
Projected 4
Beginning Fund Balance 7,020,335 8,850,872 8,850,872 8,009,803 7,200,659 7,233,810 6,009,901RevenuesLeases 14,617,510 12,876,791 13,001,690 13,522,442 13,376,300 13,133,957 13,133,957Other Fees and Operating Revenues 4,227,126 4,721,485 4,206,725 3,701,299 3,753,263 4,257,581 4,267,630Interest Earnings 95,766 37,352 51,200 24,694 22,490 20,425 20,477
Total Revenues 18,844,636 17,598,276 17,208,415 17,248,435 17,152,053 17,391,537 17,401,587Total Biennial Revenues
ExpendituresOperating Expenditures (8,995,112) (9,931,502) (9,931,502) (9,916,179) (10,378,894) (10,562,691) (10,902,262)ARFF KCSO Contract (2,991,418) (3,083,580) (3,083,580) (3,132,000) (3,132,000) (3,225,960) (3,322,739)Surface Water Utility Payment (987,850) (1,086,000) (1,086,000) (1,161,000) (1,274,000) (1,505,521) (1,580,797)2001 Bond and ABT Debt (628,768) (616,337) (616,337) (721,671) (721,671) (721,671) (721,671)
Total Expenditures (13,603,147) (14,717,419) (14,717,419) (14,930,850) (15,506,565) (16,015,842) (16,527,469)Total Biennial Expenditures
Estimated Underexpenditures 5 0 367,935 373,271 387,664 400,396 413,187Other Fund Transactions Transfer to Capital Fund (A71600) (3,500,000) (3,700,000) (3,700,000) (3,500,000) (2,000,000) (3,000,000) (2,000,000)
Total Other Fund Transactions (3,500,000) (3,700,000) (3,700,000) (3,500,000) (2,000,000) (3,000,000) (2,000,000)Total Biennial Other Fund Transactions
Ending Fund Balance 8,761,824 8,031,729 8,009,803 7,200,659 7,233,810 6,009,901 5,297,205ReservesGAAP Adjustment (9,658)
Rainy Day Reserve @ 60 days of expenditures (3,071,808) (2,917,761) (3,169,307) (3,087,912)
Total Reserves (3,071,808) (2,917,761) (3,169,307) (3,087,912)
Reserve Shortfall
Ending Undesignated Fund Balance 8,752,166 8,031,729 8,009,803 4,128,851 4,316,049 2,840,594 2,209,294
Financial Plan Notes:1 2011 Actuals are based on ARMS.
3 2014 revenues and expenditures include PSB inflation assumptions, except utilities and fuel separately calculated.4 2015 and 2016 revenues and expenditures include PSB rates except utilities and fuel separately calculated.
Airport Operating / 4290
6 The reduction in operating expenditures in 2013 is partially due to project management costs beginning to be allocated or "loaned‐out" to Airport capital projects.
2013/2014 Biennial Proposed Financial Plan
34,400,488 34,793,124
(30,437,415) (32,543,312)
(5,500,000) (5,000,000)
5 Estimated underexpenditures are based on 2.5% of total expenditures. Actual underexpenditures will vary. This value is not included in the budget system.
2 2012 Estimated is based on updated revenue and expenditure data as of (06/28/12). Significant changes from 2012 Adopted include lower fuel and landing fees.
F - 90

2013/2014 Biennial Budget for
Airport Construction Transfer 4290/A71600
Code/ Item# Description Expenditures FTEs * TLTs
FY13
Adopted Budget
2012 / 2013 Adopted Budget 7,700,000 0.00 0.00AD_012
Adjustments to Adopted Budget
2013 Adjustments to 2012 Adopted Budget (4,000,000) 0.00 0.00PF_013
Technical Adjustments
Reduce Transfer to CIP (200,000) 0.00 0.00TA_001
3,500,000 0.00 0.00FY13 Subtotal
FY14
Adjustments to Adopted Budget
2013 Adopted Budget 3,700,000 0.00 0.00PF_012
Technical Adjustments
Reduce Transfer to CIP (1,700,000) 0.00 0.00TA_001
2,000,000 0.00 0.00FY14 Subtotal
5,500,000 0.00
* FTEs for the 2013 Budget and 2013/2014 Biennial Budget do not include temporary positions or overtime. The 2013/2014
Biennial Budget reflects the maximum number of FTEs during the biennium.
** The 2013/2014 Biennial Budget reflects the total expenditures for the biennium.
2013/2014 Biennial Budget 0.00
Airport Construction TransferEconomic Growth and Built EnvironmentKing County Strategic Plan:
F - 91

ECONOMIC GROWTH AND BUILT ENVIRONMENT
Airport Construction Transfer
P R O G R A M H I G H L I G H T S As described earlier, the Airport Division will transfer $5.5 million from its operating fund to its capital program in the 2013 / 2014 biennium. Adjustments to the Adopted Budget (Pro Forma) Adjustments to the 2012-2013 Adopted Biennial Budget in 2013 and 2014 Pro Forma include removing the 2012 portion of the budget to create a baseline for the 2013 / 2014 budget. Technical Adjustments Reduce Transfer to CIP 2013 – ($200,000) 3014 – ($1,700,000) This adjustment reduces the 2012 / 2013 transfer to the Airport capital program from $7.7 million to $5.5 million to meet available revenues and programmatic needs in the capital fund.
F - 92

2011 Actual 2012
Estimated2013
Proposed 2014
Proposed 2015
Projected 2016
ProjectedBeginning Fund Balance 13,628,167 15,191,714 13,291,684 3,083,396 1,676,701 392,130 Revenues: Transfer from Operating Fund 4290 3,500,000 3,700,000 3,500,000 2,000,000 3,000,000 2,000,000 FAA Revenue 1 15,501,471 22,610,000 8,135,402 7,734,600 11,005,480 0 Boeing Settlements Revenue 2 245,753 40,133 60,000 30,000 0 0 Interest Earnings 75,730 48,961 42,862 10,094 23,303 9,928 Other Revenue 94,533 Dept of Ecology Revenue 3 56,623
TOTAL REVENUES 19,474,110 26,399,094 11,738,264 9,774,694 14,028,782 2,009,928 Expenditures: Budget: Current Year (10,375,358) (11,381,354) (9,437,154) (6,367,154) (767,154) Budget: Carryover from Prior Year (33,247,921) (15,324,155) (5,046,338) (3,604,091) (3,871,435) Budget: Total (43,623,279) (26,705,509) (14,483,492) (9,971,245) (4,638,589) Budget: Unexpended at Year End 15,324,155 4,758,957 3,302,103 (5,342,108) 3,659,645TOTAL EXPENDITURES (Cash Flow) (17,841,060) (28,299,124) (21,946,552) (11,181,389) (15,313,353) (978,944)
OTHER FUND TRANSACTIONS
Equity Adjustment (8,502)
TOTAL OTHER FUND TRANSACTIONS (8,502)ENDING BALANCE BEFORE RESERVES/ DESIGNATIONS 15,191,714 13,291,684 3,083,396 1,676,701 392,130 1,423,114 RESERVES AND DESIGNATIONS 5
Budget Unexpended at Year End (15,324,155) (4,758,957) (3,302,103) 5,342,108 (3,659,645) Revenue Accrual Estimate 406,770 386,730 550,274 0 217,350 Cumulative Estimated Underexpenditure 1,744,931 1,972,558 2,161,301 2,288,644 2,303,987CIP Revenue Verification Adjustment Estimate
2013/2014 Biennial Proposed Financial PlanAirport Construction / 000003380
CIP Revenue Verification Adjustment Estimate
ENDING FUND BALANCE AFTER RESERVES AND DESIGNATIONS 15,191,714 119,230 683,727 1,086,173 8,022,882 284,807
Assumptions1. Current FAA reimbursement is 90% with 10% KCIA local match on certain key improvements to runways, taxiways, and related facilities, as well as the residential noise grant program.2. This represents the Boeing Company's reimbursement for certain environmental mitigation work.3. This represents the state DOE grant funds for the Duwamish Slip 4 site.
5. Reserves are currently being held in the Airport Operating Fund 3380.
4. Starting in 2013, project management costs will now be allocated or "loaned in" to capital projects. Previously all in‐house labor costs were charged to the operating fund.
F - 93

ECONOMIC GROWTH AND BUILT ENVIRONMENT
Airport Division Capital Improvement Program
The purpose of the Airport Division’s Capital Improvement Program (CIP) is to maintain, upgrade and redevelop a first-class general aviation transportation facility that provides safe and continuous general aviation services. The 2013 / 2014 Proposed CIP Budget is $20.87 million. The 2013-2018 six-year capital plan enhances the Economic Growth and Built Environment goal in the KCSP by increasing mobility for people and freight. The 2013 / 2014 Proposed CIP Budget will make the airport more development-ready by funding the demolition of buildings no longer of much value as well as fully developing and leasing underdeveloped areas of the airport. The Airport Division will address other aging buildings and infrastructure needs in its upcoming strategic plan. Projects of note within the 2013 / 2014 biennium include: Residential Noise Remedy Improvements - $16,000,000. This is an ongoing project. The purpose of the program to reduce the interior noise levels in homes surrounding the airport that have at least one habitable room with a noise level greater than 45 decibels. Airport Development - $6,535,221. This is an ongoing project to plan for and develop the King County International Airport in order to meet aviation demand. Many airport-owned buildings are scheduled to be demolished in the next two years and much of the infrastructure that serves tenants and aircraft will be rehabilitated and/or reconstructed. The environmental clean-up of sites and demolishing of old facilities to redevelop underutilized space is proposed in the 2013 / 2014 Proposed CIP Budget, as well as several long-term planning processes.
Airport Development Sub-Projects 2013 / 2014 Proposal
Update Airport Layout Plan $75,000 Airport Strategic Plan $300,000 7300 Building Demolition $380,000 Street Vacation - 15th $24,000 Hangar 5 Demolition $1,036,000 Environmental Cleanup Fuel Farm $2,300,000 Environmental Planning (phase 2) $95,000 Environmental Cleanup Galvin/Bookstore $1,800,000 Environmental Cleanup of Core Tract $300,000 Environmental Assess. Landside Gas Station Sites $40,000
KCIA staff loaned-in to these projects $185,221
TOTAL $6,535,221
F - 94

ECONOMIC GROWTH AND BUILT ENVIRONMENT
MARINE DIVISION
O V E R V I E W The King County Department of Transportation Marine Division currently operates the King County Water Taxi through an inter-local agreement, or contract, between the Ferry District and King County. The Marine Division is responsible for the operations, moorage, and maintenance of the vessels that provide ferry services. The Marine Division provides passenger-only ferry service between downtown Seattle, Vashon Island, and West Seattle. The division currently operates two leased vessels to serve its two routes. The Vashon Island/downtown Seattle route provides year-round passenger-only ferry services during commute periods on weekdays. The West Seattle/downtown Seattle route provides similar weekday commuter ferry service during the winter months, and daily passenger-only ferry service for 11 to 16 hours a day between April and October. By providing this service, the Marine Division advances several strategies of the King County Strategic Plan’s (KCSP)
Economic Growth and Built Environment goal. The division’s ferry service to and from downtown Seattle aligns with Strategy 2.b, “Focus transportation resources to support density and growth.” In addition, the division provides a connector shuttle in West Seattle and connects with Metro bus service on Vashon Island, advancing Strategy 2.c, “Coordinate and develop services for an integrated and seamless regional transportation system.” 2013 / 2014 Key Issues The key issues facing the Marine Division over the next biennium include finding a sustainable funding source, constructing and putting into service two new vessels, and planning for the impacts of the Colman Dock Preservation project undertaken by Washington State Ferries (WSF). Sustainable Funding Source The revenue forecast from the property tax levy, passenger fares, and other sources continues to be insufficient to sustain current levels of ferry operations into the future. The broad issue of a sustainable funding source, or sources, must be addressed in the not-too-distant future. Current projections indicate sufficient reserve in the Ferry District fund to support the planned Marine Division 2013 / 2014 Proposed Budget. To address this issue, the Marine Division’s 2013 / 2014 Proposed Budget includes funding for consultant help to support development of a strategic plan, which would identify options for sustainable funding. This work would advance Objective 2 of the Financial Stewardship goal within the KCSP, “Plan for the long-term sustainability of county services.” New Vessel Implementation The 2013 / 2014 Proposed Budget assumes the use of existing federal grants and matching Ferry District funds to support the new vessel construction program as a fiscally responsible approach with demonstrable life cycle cost benefit of constructing, operating, and maintaining new vessels as compared to leasing used and aging vessels. This is especially important to move forward with procurement expeditiously in light of the approaching expiration dates of existing awarded federal grants.
Mission:
Marine Division To provide safe, reliable,
efficient, environmentally sound, customer-friendly, and fiscally
responsible passenger-only ferry services to the public and
establish waterborne transportation as a viable
alternative mode of transportation in support of regional mobility
and a high quality of life in King County, under contract with the
King County Ferry District
F - 95

ECONOMIC GROWTH AND BUILT ENVIRONMENT
Current plans are to build two new vessels, with delivery projected for early to mid-2014. These vessels will be larger, with added passenger capacity, and will have different fuel consumption rates and will require additional crewing due to the size increase. New vessels notoriously go through an initial break-in period when systems are refined and “bugs” worked out, and it is not uncommon for some added maintenance cost associate with this break-in period. Plus, with new vessels there will be a need to establish an inventory of appropriate spare parts. These expected increased expenses will be difficult to project, but estimates have been incorporated into the 2013 / 2014 Proposed Budget. Going forward there is an expected decline in maintenance costs associated with operating new vessels, but this will likely not be realized initially. Colman Dock Preservation Project In January 2012, WSF announced, as part of the environmental assessment scoping process, its intentions to undertake a project to preserve the Colman Dock intermodal ferry terminal. The project proposal included the elimination of the existing passenger-only ferry terminal, and the current home to the King County Water Taxi and Seattle terminus for other ferry operators, at Pier 50 as soon as mid-2015. This project is on a very aggressive timeline, so the need to move rapidly is essential to success. Planning, design, preliminary engineering and permitting efforts need to be undertaken promptly. An existing capital project is being used to perform the initial siting study, which will lead into a new capital project aimed at design, permitting and construction of a new facility (or facilities if an interim facility is necessary). Executive Priorities Considered in 2013 / 2014 Business Planning and Budget Development The Executive’s 2013 / 2014 priorities to advance the King County Strategic Plan and inform the 2013 / 2014 Proposed Budget spotlighted consideration of Equity and Social Justice; attainment of a 3 percent efficiency target while maintaining value and service levels; energy investment; and KCSP alignment of agency goals, objectives, and services. • Equity and Social Justice: In the short term, the Marine Division intends to include more access friendly
design requirements into the new vessels. In a similar fashion, new terminal facilities will integrate features designed to accommodate those with physical limitations. Further, in the planning and siting studies being explored for permanent or long-term terminal locations, the Marine Division will research and make efforts to include relevant data input from analysis of the social, economic, and cultural dynamics of the populations of Vashon Island, West Seattle, and Downtown Seattle. The Marine Division also intends to continue ongoing efforts to find ways to provide more equitable access to the Water Taxi, including items such as identification of other languages and formats in which to provide schedule and service information.
• 3 Percent Efficiency: The Marine Division identified several areas in which it will achieve efficiencies in its
2013 / 2014 budget including: successful negotiation with WSDOT over leasing Pier 48 for vessel maintenance; successful negotiation of a reduced rate for leasing the two vessels currently in operation; renegotiation of insurance rates for the division to be calculated on an annual basis versus an hourly basis, thus reducing costs; and identification of efficiencies in fare collection processes based on expenditure history analysis.
• Energy Investment: The division is building a moorage and maintenance barge. When installed, the division
will begin to monitor the energy usage. This facility will provide shoreside power in order that vessels may shut down their diesel generators when moored during layup periods. Energy consumption will be a major consideration during the planning and design of the two new passenger vessels. Fuel efficiency and emissions reduction will be important design parameters built into the design.
F - 96

2013/2014 Biennial Budget for
Marine Division 1590/A46200
Code/ Item# Description Expenditures FTEs * TLTs
FY13
Adopted Budget
2012 / 2013 Adopted Budget 30,762,395 21.20 .60AD_012
Adjustments to Adopted Budget
2013 Adjustments to 2012 Adopted Budget (24,836,327) (.96) (.02)PF_013
Direct Service Changes
West Seattle A.M. Peak Service Add 13,742 0.00 0.00DS_001
Administrative Service Changes
Strategic Plan Support 75,000 0.00 0.00AC_001
Vessel Capacity Insurance 28,524 0.00 0.00AC_002
Fare Collection Efficiency (21,420) 0.00 0.00AC_301
Terminal Maintenance Efficiency (55,000) 0.00 0.00AC_302
Central Rate Changes
General Fund Overhead Adjustment 20,454 0.00 0.00CR_005
KCIT Operations and Maintenance Charge (312) 0.00 0.00CR_007
KCIT Infrastructure Charge (22,062) 0.00 0.00CR_008
KCIT Operations and Maintenance Charge (6,831) 0.00 0.00CR_010
KCIT Telecommunications Services 696 0.00 0.00CR_011
KCIT Telecommunications Overhead (36) 0.00 0.00CR_012
Motor Pool Rate Adjustment (947) 0.00 0.00CR_013
Insurance Charges (8,118) 0.00 0.00CR_015
Prosecuting Attorney Office Civil Division Charge 5,456 0.00 0.00CR_020
Debt Service Adjustment 31,800 0.00 0.00CR_021
Long Term Leases 17,755 0.00 0.00CR_022
Financial Services Charge 272,131 0.00 0.00CR_025
Property Services-Lease Administration Fee 888 0.00 0.00CR_036
Facilities Management Strategic Initiative Fee (33) 0.00 0.00CR_037
Major Maintenance Repair Fund 2,814 0.00 0.00CR_038
Countywide Strategic Technology Projects (2,464) 0.00 0.00CR_046
Business Resource Center 13,250 0.00 0.00CR_048
KCIT Workstation Services 40,956 0.00 0.00CR_052
KCIT Business Analysis 756 0.00 0.00CR_056
KCIT Countywide Services 5,928 0.00 0.00CR_057
KCIT Tech Service Rebate (2,616) 0.00 0.00CR_058
Technical Adjustments
Vessel Fuel Increase 38,805 0.00 0.00TA_002
Group Labor and Benefits Adjustment 180,404 0.00 0.00TA_003
Shuttle and Bus Increase 27,454 0.00 0.00TA_004
Management and Support Corrections 5,791 0.00 0.00TA_005
Vessel Maintenance Corrections (51,860) 0.00 0.00TA_006
Prior Year Budgeting Corrections (248,000) 0.00 0.00TA_007
Shoreside Corrections (27,693) 0.00 0.00TA_008
Marine DivisionEconomic Growth and Built EnvironmentKing County Strategic Plan:
F - 97

2013/2014 Biennial Budget for
Marine Division 1590/A46200
Code/ Item# Description Expenditures FTEs * TLTs
Marine Capital Program Correction 11,367,410 0.00 0.00TA_009
Revenue Adjustments - $11,405,371 0 0.00 0.00TA_050
Long-Term Lease Rebate (7,285) 0.00 0.00TA_099
17,621,406 20.24 .58FY13 Subtotal
FY14
Adjustments to Adopted Budget
2012 Adopted Budget 30,762,395 0.00 0.00PF_012
2013 And 2014 Adjustments to 2012 Adopted Budget (24,719,066) 0.00 0.00PF_014
Direct Service Changes
West Seattle A.M. Peak Service Add 14,058 0.00 0.00DS_001
New Vessel Implementation Costs 207,308 1.92 0.00DS_002
Administrative Service Changes
Vessel Capacity Insurance 28,524 0.00 0.00AC_002
Fare Collection Efficiency (19,991) 0.00 0.00AC_301
Terminal Maintenance Efficiency (48,500) 0.00 0.00AC_302
Central Rate Changes
2014 Central Rate Adjustments 290,577 0.00 0.00CR_099
Technical Adjustments
Vessel Fuel Increase 28,408 0.00 0.00TA_002
Group Labor and Benefits Adjustment 172,215 0.00 0.00TA_003
Shuttle and Bus Increase 56,260 0.00 0.00TA_004
Management and Support Corrections 26,499 0.00 0.00TA_005
Vessel Maintenance Corrections 43,984 0.00 0.00TA_006
Prior Year Budgeting Corrections (249,909) 0.00 0.00TA_007
Shoreside Corrections (21,596) 0.00 0.00TA_008
Marine Capital Program Correction 5,668,636 0.00 0.00TA_009
Revenue Adjustments - $ 6,016,482 0 0.00 0.00TA_050
Long-Term Lease Rebate (7,285) 0.00 0.00TA_099
12,232,517 22.16 .58FY14 Subtotal
29,853,923 .58
* FTEs for the 2013 Budget and 2013/2014 Biennial Budget do not include temporary positions or overtime. The 2013/2014
Biennial Budget reflects the maximum number of FTEs during the biennium.
** The 2013/2014 Biennial Budget reflects the total expenditures for the biennium.
2013/2014 Biennial Budget 22.16
Marine DivisionEconomic Growth and Built EnvironmentKing County Strategic Plan:
F - 98

ECONOMIC GROWTH AND BUILT ENVIRONMENT
Marine Division
P R O G R A M H I G H L I G H T S The 2013 / 2014 Executive Proposed Budget for the Marine Division is $29,853,923 and 22.16 FTEs and 0.58 TLTs. Adjustments to the Adopted Budget (Pro Forma) Adjustments to the 2012 / 2013 Adopted Biennial Budget in 2013 and 2014 Pro Forma include removing the 2013 portion of the budget to create a baseline for the 2013 / 2014 budget. Salary adjustments include increases for 3.09 percent COLA for 2013 and 2.00 percent for 2014 and a 1.00 percent increase in the Flex Benefit rate for 2013 from the 2012 rate and a 4.00 percent increase from 2013 for the 2014 rate. Direct Service Changes West Seattle A.M. Peak Service Add 2013 - $13,742 2014 - $14,058 This request provides for the costs associated with increasing service on the West Seattle route by adding an earlier morning weekday departure during the peak season only. To add this additional early sailing, the last morning sailing during the 5 month winter (non-peak) period will be eliminated, as it has not shown ridership growth. Due to a mid-day break, this service change can be made without any increased expenses during this period. During the peak season the additional early sailing would extend the service by one half hour, five days a week. This proposal includes the costs to extend the Shuttle to meet the new service and the additional fuel for one complete run to West Seattle. The associated labor costs are included in the base budget and would not represent an additional increase. New Vessel Implementation Costs 2014 - $207,308 / 1.92 FTE This request provides for the expected added costs associated with putting new vessels into service in 2014. The Division is expecting to hire two fulltime year round and two fulltime intermittent crewmembers to operate the new vessels and meet regulatory requirements. Other associated costs include an increase in insurance and costs associated with hiring, testing, and training new staff. Administrative Changes Strategic Plan Support 2013 - $75,000 This request adds funding to hire a consultant to aid in the development of a strategic plan for the Marine Division that addresses issues such as long-term sustainable funding, timing and location of expansion routes, levels of service, as well as identifying opportunities for regional efficiencies and synergies.
F - 99

ECONOMIC GROWTH AND BUILT ENVIRONMENT
Vessel Capacity Insurance 2013 - $28,524 2014 - $28,524 This expenditure provides for increased insurance costs associated with the increase in passenger capacity of the existing leased vessels. It is estimated at ten percent of the existing annual insurance rates. Fare Collection Efficiency 2013 - ($21,420) 2014 - ($19,991) This reduction is primarily due to the review of expenditure history in 2010 and 2011 and realizing the benefit of experience to better estimate the cost of servicing and maintaining the existing fare equipment including the ticket vending machines, the portable fare transaction processors, and the cash vaults in inventory. Terminal Maintenance Efficiency 2013 - ($55,000) 2014 - ($48,500) This reduction is due in part to the successfully negotiated dock use agreement with Washington State Ferries for the use of Pier 50 and Vashon Island Terminals. The agreement sets an expectation that the landlord will be responsible for maintaining the facilities as a capital investment of the owner. King County is responsible for the everyday dock maintenance costs, but costs previously budgeted for annual and restorative maintenance are being removed. This budget reduction also includes a decline in the cost of daily maintenance based on a full review of the expenditure history in 2010 and 2011. Central Rate Changes Central Rate Adjustments 2013 - $369,465 2014 - $290,577 This series of adjustments captures the net effect of countywide charges from the 2012 Adopted Budget to reflect the most current 2013 and 2014 central rate charges. Unlike previous years, it does not include COLA and flex benefits, which are included in the Pro Forma decision package. Details about each rate can be found in the How We Deliver Introduction, beginning on page H-5, and the agency-specific changes are detailed in the central rate section of the agency crosswalk. Technical Adjustments Vessel Fuel Increase 2013 - $38,805 2014 - $28,408 This request is tied to projected fuel rate increases, and identified fuel consumption increases associated with increased passenger counts. Group and Labor Benefits Adjustment 2013 - $180,404 2014 - $172,215 This request corrects inaccurate labor and benefit information loaded during Pro Forma and makes incremental adjustments to these accounts based on projected amounts for each account by cost center. Accounts include temporary help, overtime, premium pay, unemployment, military leave, and loan in labor costs.
F - 100

ECONOMIC GROWTH AND BUILT ENVIRONMENT
Shuttle and Bus Increase 2013 - $27,454 2014 - $56,260 This proposed increase is due to the contracted rate increase with the vendor that provides shuttle services, including fuel cost increases, and the small rate increase from the incremental amount paid for Metro Transit Route 118. Management and Support Corrections 2013 - $5,791 2014 - $26,499 This request is comprised of incremental adjustments to all non-labor accounts in the Management & Support cost center. It includes adjustments to supply, service and intragovernmental accounts for the services provided by other divisions and the DOT Director’s Office overhead. This reflects a truing up of accounts based on the division’s estimated costs for these functions. Vessel Maintenance Corrections 2013 - ($51,860) 2014 - $43,984 This change item is comprised of incremental adjustments to all non-labor accounts in the Vessel Maintenance cost center. It includes adjustments to supply, service and capital expense accounts. This is a truing up of accounts based on the division’s estimated costs for this function. Prior Year Budgeting Corrections 2013 - ($248,000) 2014 - ($249,909) This request is comprised of two separate correcting adjustments to select service accounts and one intragovernmental account. Shoreside Corrections 2013 - ($27,693) 2014 - ($21,596) This change item is comprised of incremental adjustments to all non-labor accounts in the Shoreside & Customer Services cost center. It includes adjustments to supply, service and intragovernmental expense accounts. This represents a truing up of accounts based on the division’s estimated costs for this function. Marine Capital Program Correction 2013 - $11,367,410 2014 - $5,668,636 This request provides budget authority for the Marine Division’s capital program. The majority of this budget is for the acquisition of two high speed passenger only ferries and to plan for the effects of the Colman Dock preservation project undertaken by Washington State Ferries. The Marine Division’s capital program is described in greater detail in the capital section. Revenue Adjustments 2013 - $11,405,371 Revenue 2014 - $6,016,482 Revenue This represents a technical correction to the operating budget to adjust the revenue to match the total expenditures for the 2013 / 2014 budget. This is because the King County Ferry District reimburses the Marine Division for all expenditures through an interlocal agreement. This package also includes the revenue portion of the Marine Capital Program Correction package above.
F - 101

ECONOMIC GROWTH AND BUILT ENVIRONMENT
Long-Term Lease Rebate 2013 – ($7,285) 2014 – ($7,285) King County has received a rebate from the owner of the King Street Center and has benefitted from the refinancing of the remaining debt. The 2013 / 2014 Proposed Budget passes this windfall on to the King Street tenants in the form of a $7.5 million rent rebate and a $450,000 capital project to reconfigure space associated with the Road Services proposed consolidation to a single floor in King Street Center. Since this Road Services cost cutting space measure is a relatively recent proposal a 20 percent contingency is included in the $450,000 project amount budgeted in the Long Term Lease fund. In the proposed budget the rebate has been included as a separate decision package entry to offset the central rate budgeting of 2013 and 2014 lease costs.
F - 102

2011 Actual 1 2012 Adopted2012
Estimated 2 2013 Proposed2014
Proposed 32015
Projected 42016
Projected 4
Beginning Fund Balance ‐ ‐ ‐ ‐ ‐ ‐ (0) RevenuesLevy Proceeds from Ferry District 4,548,441 5,911,710 5,911,710 6,253,996 6,563,881 6,892,075 7,236,679 Levy Proceeds from Ferry District ‐ Capital Projects 2 2,235,166 18,634,650 19,975,380 11,367,410 5,668,636 4,000,000 ‐
‐ ‐ ‐ ‐ ‐ ‐ ‐
Total Revenues 6,783,607 24,546,360 25,887,090 17,621,406 12,232,517 10,892,075 7,236,679 Total Biennial Revenues
ExpendituresManagement & Support (1,249,750) (1,591,673) (1,591,673) (1,880,532) (1,743,601) (1,830,781) (1,922,320) Shoreside Operations (841,900) (1,186,231) (1,186,231) (1,052,580) (1,098,496) (1,153,421) (1,211,092) Vessel Operations & Maintenance (2,456,697) (3,133,806) (3,133,806) (3,320,883) (3,721,785) (3,907,874) (4,103,268)
Total Expenditures (4,548,347) (5,911,710) (5,911,710) (6,253,996) (6,563,881) (6,892,075) (7,236,679)Total Biennial Expenditures
Estimated Underexpenditures 5 ‐ ‐ ‐ ‐ ‐ ‐ Other Fund TransactionsCapital Expenditures 2 (2,235,378) (18,634,650) (19,975,380) (11,367,410) (5,668,636) (4,000,000) ‐ Accounting reconciliation adjustment 118 ‐ ‐ ‐ ‐ ‐ ‐
Total Other Fund Transactions (2,235,260) (18,634,650) (19,975,380) (11,367,410) (5,668,636) (4,000,000) ‐ Total Biennial Other Fund Transactions
Ending Fund Balance ‐ ‐ ‐ ‐ ‐ (0) (0) Reserves 6
Ending Undesignated Fund Balance ‐ ‐ ‐ ‐ ‐ (0) (0)
Financial Plan Notes:1 2011 Actuals are based on 14th month accounting system totals.
3 2014 revenues and expenditures follow the King County Financial Planning Assumptions for 2013 Proforma4 2015 ‐ 2016 revenues and expenditures include the following inflation assumptions: 5% inflation for operating and capital expenditureare estimated based on anticipated project expenditures.
Marine Operating / 1591
6 The Marine Division is 100% reimbursed by the King County Ferry District (KCFD) and holds no reserves. Reserves would be planned for in the KCFD financial
2013/2014 Biennial Proposed Financial Plan
29,853,923 18,128,754
(12,817,877) (14,128,754)
(17,036,046)
5 Estimated operating underexpenditures are not planned or budgeted.
(4,000,000)
2 2012 Estimated is based on adopted budget for 2012. The Levy Proceeds from Ferry District ‐ Capital Projects and the Capital Expenditures both include the omnibus ordinance 17349 amount of $1,340,730 of capital budget carryover for unexpended prior year capital project budget. The capital project to purchase new vessels has been delayed and it is expected that a significant amount of that project's budget will be carried over to 2013.
F - 103

ECONOMIC GROWTH AND BUILT ENVIRONMENT
Marine Capital Improvement Program
The King County Marine Division (KCMD) Capital Program provides for the planning and acquisition of necessary infrastructure to deliver safe, reliable and efficient passenger-only ferry service in King County. It accomplishes this by preserving existing passenger terminals, leasing vessels, providing vessel moorage and maintenance facilities, and planning, designing and building new ferry vessels and new passenger-only ferry terminal facilities. This infrastructure gives the King County Ferry District (KCFD) the physical capability to deliver passenger-only ferry services to its customers. In conjunction with KCFD funding, significant grant funds have been secured for the Ferry District to support the construction and acquisition of the capital improvements program. The KCMD is operating under an interlocal agreement (ILA) with the KCFD. The Capital Program will be funded directly by transfers from the Ferry District. The Ferry District’s revenues that support the transfer will come from state and federal grant resources, as well as from property tax and fare revenues. The 2013 / 2014 capital budget request of $17 million is based on the expected timing of project expenditures within a capital program that totals $29 million. This represents a net increase of $3.8 million over the 2012 budgeted amount. The noteworthy changes include the addition of a new project called the Seattle Ferry Terminal and changes to the Vessel Acquisition project and Seacrest Terminal Improvements project. The following information is provided to support the changes in the request: Seattle Ferry Terminal: 2013 / 2014 Proposed Budget $2,130,000 Both the Vashon / downtown Seattle route and the West Seattle / downtown Seattle route of the King County Water Taxi terminate at Pier 50 - the downtown Seattle passenger-only ferry terminal and water taxi hub. Pier 50 is owned by Washington State Ferries (WSF) and the King County Ferry District is the primary and priority tenant. WSF has announced a planned preservation project at Colman Dock, which would eliminate the passenger-only ferry (POF) terminal at the adjacent Pier 50 site as soon as mid-2015. As a result, this project will include all aspects of implementing a new permanent POF facility on the downtown Seattle waterfront, and an interim terminal location if required to relocate due to WSF construction plans and phasing. As a result of considerable uncertainty over the continued existence of the current POF facilities at Pier 50, this project has been launched to responsibly implement a permanent and interim, if needed, location for the downtown Seattle POF hub. This project will use a combination of local Ferry District and federal grant funding. Additionally, the nature of this project and impact to the core business district has the potential to create a regional emphasis and collaboration with other key stakeholders.
F - 104

ECONOMIC GROWTH AND BUILT ENVIRONMENT
Vessel Acquisition: 2013 / 2014 Proposed Budget $12,583,598 This project will fund the planning, vessel performance specification development, design and construction of two passenger-only ferries to service existing King County Water Taxi passenger-only ferry routes. This project was initially appropriated in the 2009 budget. However, the Ferry District temporarily suspended this project in 2010 and transferred the funding to the Ferry District fund. The project was reinstated during the 2011 Capital Project Budget process. A work plan outlining the formation of an expert review panel (ERP), along with the first phase of developing ERP input materials, were completed in 2010. This input included the solicitation of passenger feedback regarding their desired vessel properties. The purpose of this panel was to evaluate design options for the King County Ferry District and identify specific operating and design requirements for the vessels. The ERP was convened in 2011, several long and in-depth meetings were held, consensus was reached on design issues, and the ERP final report was completed. This report provided pertinent vessel construction insights and recommendations for Ferry District consideration. The ERP report was used as a springboard for the development and approval of basic vessel characteristics. These vessel general characteristics, in turn, provide the basis for detailed vessel performance specifications. The increase to the total budget is based on the added costs of hiring a vessel consultant, inflation over a three year period and the supplemental addition of grant funding that requires 20% local matching funds.
F - 105

ECONOMIC GROWTH AND BUILT ENVIRONMENT
ROAD SERVICES DIVISION
O V E R V I E W
The King County Road Services Division (RSD) maintains, preserves, and operates roads, bridges and related infrastructure in unincorporated King County. The county’s many bridges are an integral part of the road system, as are other components such as sidewalks and pathways, bike lanes, guardrails, drainage and water quality facilities, traffic control equipment, and traffic cameras.
The unincorporated-area road system owned and managed by RSD includes the following inventory (numbers are approximate):2 • 1,479 miles of paved roads and 51 miles of unpaved roads
• 181 bridges, including several that are jointly owned with cities
• 39,000 traffic control signs and 102 traffic signals
• 110 miles of protective guardrail
• 68 traffic cameras (viewable on the division’s website)
The road system in unincorporated King County is critically important to people who live and travel in the county, but it is aged and deteriorating. Substantial investments are needed to restore roads and bridges, maintain them in good condition, and meet new transportation demands. The Road Services Division’s available funding falls far short of this need, despite the division’s efforts in recent years to gain further efficiencies, streamline its organizational structure, adjust business practices, and account for labor union concessions. The Strategic Plan for Road Services (SPRS) identified a worst case scenario annual budget of $102 million, but the current unexpected economic situation, coupled with the road levy reaching its statutory cap, has resulted in a projected RSD budget of $91 million in 2014 – far below previous predictions and resulting in dramatic reductions in staffing and services. In 2010, the County Council adopted the SPRS, which responds to the dilemma of significantly constrained resources by setting clear priorities to guide the division as it manages the road system. The plan gives top priority to basic goals: complying with regulatory requirements, meeting core safety needs, and preserving and maintaining the existing road network. These are followed by the goals of enhancing mobility and increasing roadway capacity to support urban growth. RSD has used these priorities to build its 2013 / 2014 budget, resulting in funding of regulatory and safety work first and then a dramatically reduced portion of preservation and maintenance needs. The division is currently unable to fund mobility and capacity work. Budget Environment The revenue challenges King County faces result in serious impacts on service levels. The County Road Fund is supported mostly by the local property tax, through a separate Roads levy limited to $2.25 per thousand dollars of
2 Data as of 2011
Mission:
Road Services Division
Maintain, preserve, and improve the unincorporated King County road and bridge system for the safe and efficient movement of
people, goods, and services, and quickly respond to storms, floods, and other emergencies.
F - 106

ECONOMIC GROWTH AND BUILT ENVIRONMENT
assessed value. Under the state Growth Management Act, the annexation of urban unincorporated areas into cities is leaving a dramatically reduced base of property tax revenues for County roads in the unincorporated areas. Yet the county has not seen a proportional drop in its responsibility for repairing, maintaining, and replacing roads, bridges, and culverts, and is still responsible for nearly 1,500 miles of roadway. As a result of the recession and annexations, the assessed value of property in unincorporated King County has dropped by 44 percent over the last four years. By 2013, the average homeowner in most areas of unincorporated King County will pay roughly $90 less per year for road services than they did in 2011. The assessed value decline and projections for recovery have a profound impact on the division’s revenue stream since two-thirds of its budget comes from property taxes. Over the past four years, a combination of annexations, lower property valuations, and declines in gas tax revenues has led to a 25 percent decline in the Road Fund, from $122 million to $93 million. As a result, by the end of the biennium, the Road Services Division will have eliminated about 200 positions, or about one-third of its entire workforce, since 2010. The loss of road funding is taking a major toll on county roads.
• In recent years, pothole repairs have been cut by nearly half. By 2013, pothole filling and patching could be reduced by nearly 65 percent from historical levels.
• The County’s road overlay program is shrinking; in 2012, just 11 miles of deteriorated roadway will be
repaved. Similarly, during the next biennium, the County will only be able to perform overlay on 11 to 12 miles of roadway each year.
• This past winter season, about 20 percent less snow and ice removal was performed due to a lack of
staffing. With additional position reductions in March and July of 2013 and January of 2014, plowing and sanding capacity will be reduced even more during the 2014 winter season.
The reduced ability to care for infrastructure assets will lead to further deterioration of county roadways. Eventually the lack of preservation and maintenance will force speed reductions, bridge and lane closures, and the need to turn some rural roads to gravel. Roads in the county’s rural area are some of the oldest in the system, and are the most vulnerable to falling trees and debris, floods, and snow storms, as roads run alongside rivers and streams, through heavily wooded areas and at higher elevations. Road Services Approach to Managing within Current Funding Constraints
Product-Oriented Process Management Road Services is working with the Executive Office and County Council staff to implement a new business management approach to meet these challenges. Described as product-oriented process management, this approach involves analyzing the division’s business to identify the products produced, the processes to produce them, the staff skill sets required by the processes, and the quality attributes of the product delivered. The products are defined in a way that makes sense to the customers of the road network and reflects the customer experience. These products also align with the asset management approach that RSD has been utilizing to understand the maintenance required to optimally maintain the road infrastructure. By defining the business processes and skill sets required to produce products, the division will be able to implement the Lean management approach to identify and implement process efficiencies. Figure one provides a snapshot of this new approach to analyzing and improving the division’s business.
F - 107

ECONOMIC GROWTH AND BUILT ENVIRONMENT
Figure 1. Product-Oriented Process Management
Asset management program development
RSD is developing an asset management program that will have impacts across most functions of the division in 2013-14 and beyond. Asset management as implemented by RSD will be a strategic and systematic process of operating, maintaining, upgrading, and expanding physical assets (including the traveled roadway, bridges, drainage facilities, traffic control devices, and roadside features) as effectively as possible, given available resources, throughout their lifecycle.
Fiscal Stewardship Road Services is committed to responsible financial management of the Road Fund. RSD is continuing to implement the financial policies developed in the 2012 / 2013 budget development process. These policies, developed in partnership with council and executive staff, strengthen Roads’ ability to meet fund balance requirements, establish reserves that allow Roads to better respond to unforeseen events, reduce reliance on interfund loans, and provide more transparency in financial planning. Roads is actively monitoring actual expenditures to be able to quickly identify and respond to any revenue shortfalls that might arise during the biennium, either due to lower property or gas tax forecasts or reduced reimbursable contract work.
Partnerships and Communication Road Services Division has been partnering with council and executive staff as they address these fiscal challenges. Council and executive staff representatives have been active participants in developing the product-oriented process management approach. Roads staff have updated council members periodically throughout the budget development process to keep them apprised of the financial situation and get feedback on the proposed management approach. Road Services Division management is actively engaging labor partners by instituting a Labor Management Committee. The division uses this forum as a means of providing regular and ongoing communications to employees and unions about the significant change Road Services is experiencing and will
F - 108

ECONOMIC GROWTH AND BUILT ENVIRONMENT
continue to experience over the next few years. The division is continuing to use employee meetings and an employee communication website to explain and discuss budget challenges, organizational changes, and implementation of the SPRS. Road Services will undertake a significant customer communication effort as it implements the service reductions that result from the current funding situation. This communication effort will be guided by the SPRS Communication Plan, and will include printed materials explaining service levels (translated if needed to reach audiences with limited English proficiency) and a website with explanations, photos, maps, and graphics illustrating the division’s ongoing funding issues, service levels, accomplishments, and other pertinent issues. Reductions in Staff and Associated Service Levels The 2013 / 2014 Road Services Division Budget was based upon the policy direction in SPRS. The resource allocation is guided by the SPRS Five-Tier Service Level Framework, which helps to implement the SPRS by establishing a hierarchical approach to serving roadways that, combined with a risk management approach, will focus the timing and level of investment on the most vital components of the road network. The work of the division was assigned to the SPRS categories and budget decisions were made based upon these goals. The division then considered staffing skills and levels needed to accomplish the priority work. The proposed budget includes significant reductions in order to balance the Road Fund. These reductions fall across the operating budget and Capital Improvement Program. While these proposals were developed to have the least possible negative impact on road infrastructure and staffing levels, significant reductions were unavoidable. Consistent with SPRS priorities and the tiered road system, resources were allocated in the following rank order: regulatory compliance, core safety, maintenance and preservation, and operation of the system. While the proposed budget reflects the best judgment of the leadership team to reduce risk, preserve core professional competencies, and most importantly, address the basic needs of roads network customers in light of declining resources, it does reflect a major reduction in services. These decisions will impact all parts of unincorporated King County. The workforce reductions over the biennium include the elimination of approximately 35 engineering and 24 maintenance positions resulting from cuts to the RSD CIP projects and programs and approximately 25 maintenance position reduction associated with reductions to unincorporated area service levels. While these cuts are necessary to balance the budget given continuing reductions in property and gas taxes and annexation activity, and while some positions have been restored to perform drainage activities funded by the proposed Surface Water Management fee increase, these cuts will have a significant negative impact on the service level provided to the unincorporated area and the road conditions experienced by drivers. Activities reduced include items such as shoulder restoration; ditch and catch basin cleaning; slope/shoulder mowing; pothole patching; drainage, roadway, and bridge preservation; and overlay. These reductions could result in more incidents of standing water on roadway, roadway washout or flooding, pot-holed/rough roadway surfaces and roadway edges, down or missing signs, reduced sight distances, and rutted unsafe shoulders. These conditions could lead to increased numbers of Citizen Action Requests, and an increased risk of injuries, accidents, claims and lawsuits in the rural area. In addition, the maintenance and engineering position cuts will decrease RSD’s ability to respond to storm events. The Road Services Division has tried to make reductions commensurate across all levels and functions in the division. The result of these proposed reductions, however, has a greater proportional impact on front-line functions. In part, this is due to the dramatic rate of reductions; it will take time to adjust the organizational structure to reflect the new size of the division. Additionally, it is essential to maintain resources in several key administrative functions for at least the first half of the biennium. Human resources staff are critical to support layoff and job placement functions during downsizing. Customer service and communications staff are needed to communicate and respond to customers who are seeing changes in service levels and road conditions. New information management systems require project management and information technology resources for successful implementation. Finance and payroll staff are still adjusting to new Oracle systems and associated
F - 109

ECONOMIC GROWTH AND BUILT ENVIRONMENT
processes. As business conditions change, however, there will be opportunities to reassess business processes and staffing levels in all of these areas. Additional Tools to Mitigate Reductions The Executive Proposed Budget includes several proposals external to the Road Services Division that help to mitigate RSD reductions. These include a reduction in the transfer from the Road Fund to the General Fund, increased revenue-backed water quality work, and temporary funding for debt service for the South Park Bridge replacement project. The Road Fund currently transfers $4 million annually to the General Fund. This transfer supports the King County Sheriff Office’s (KCSO) Selective Traffic Enforcement Program (STEP) Unit along with general patrolling provided by KCSO in the unincorporated area. The 2013 / 2014 Proposed Budget eliminates the STEP unit and reduces the Roads transfer to the General Fund by $1.5 million each year. RSD will use this funding to enhance road safety infrastructure. The Water and Land Resources Division (WLRD) proposed Surface Water Management (SWM) Fee includes an expanded Capital Improvement Program. WLRD and RSD staff worked together to identify those surface water projects that are most beneficial to water quality to include in the CIP proposal. This proposal includes approximately $3 million of funding for water quality projects in the right-of-way as well as $1 million in operational maintenance that will benefit water quality. Working closely with WLRD, RSD’s maintenance activities and projects would realize immediate environmental benefits while helping attain the long-term stormwater management goals. The 2013 / 2014 biennial budget includes funding for debt service for the South Park Bridge replacement project. This will free up approximately $2 million each year for other RSD priorities. This funding is from excess fund balance from the Limited General Obligation Bond fund and covers only two years of the debt service for this project. Additional revenue tools that could further mitigate reductions are the implementation of a Transportation Benefit District (TBD) and potential new tools that could be developed by the state. New revenue tools, if enacted, could provide more sustainable revenues for Road Services on an ongoing basis. Without these tools, Road Services Division will need to identify additional reductions in the 2015 / 2016 budget development cycle and road conditions will continue to deteriorate. Executive Priorities Considered in 2013 / 2014 Business Planning and Budget Development The Executive’s 2013 / 2014 priorities to advance the King County Strategic Plan and inform the 2013 / 2014 Proposed Budget spotlighted consideration of Equity and Social Justice; attainment of a 3 percent efficiency target while maintaining value and service levels; energy investment; and KCSP alignment of agency goals, objectives, and services. • Equity and Social Justice: The RSD will be making efforts to mitigate the impacts that service reductions
have on historically disadvantaged communities. The division will prioritize emergency storm response (such as snow and ice removal) along transit routes, since public transit may be the only source of transportation available to lower-income residents during countywide snow and storm events. RSD will promote equal access to, and availability of, information and services for all county residents by designing division communications and public engagement processes that are culturally relevant for diverse communities, including communities whose residents have limited English proficiency. Roads Services has also secured Community Development Block Grant funding for two new sidewalk projects, one along 17th Avenue SW in White Center and the other along Renton Avenue South in the Skyway neighborhood. Both neighborhoods
F - 110

ECONOMIC GROWTH AND BUILT ENVIRONMENT
meet U.S. Department of Housing and Urban Development census tract criteria for low income and have racially/ethnically diverse populations. The division plans to continue to pursue grant funding to help serve such communities. One particularly high-profile example of capital projects serving disadvantaged communities is the South Park Bridge replacement, which is under construction in 2011- 2013. This $160 million bridge construction project is the largest capital investment in the division’s history. The bridge serves residents from one of the region’s most disadvantaged and ethnically diverse neighborhoods. South Park meets the definition of an economically distressed area as defined by the Federal Public Works and Economic Development Act of 1965. Approximately 13 percent of its residents are below the poverty level. Construction of the new South Park Bridge has been made possible through a successful partnership between King County and the South Park community. Two keys to this partnership were the application of the county’s translation policy to communications with the community (including translation of written materials and signs, use of language interpreters at public meetings, and a dedicated construction hotline staffed with interpreters) and the view of the community as a partner.
• 3 Percent Efficiency: Despite the large number of direct services reductions in the proposed budget, there are some efficiencies as well. Implicit in direct-service reductions will be process improvements as the division needs to do less with significantly less resources. There is a proposal to charge for parking at the Vashon Island park-and-ride, which will result in a new revenue source with minimal increased operational costs. Overall, however, with the magnitude of the reductions and the loss of economies of scale, the Road Services Division will not be able to provide service as efficiently as before.
• Energy Investment: The division has been exploring ways to use its fleet more efficiently to reduce fuel usage and minimize environmental impact. The current lack of resources, however, minimizes the division’s ability to invest in strategies that advance the goals in the Energy Plan in this budget.
F - 111

2013/2014 Biennial Budget for
Roads 1030/A73000
Code/ Item# Description Expenditures FTEs * TLTs
FY13
Adopted Budget
2012 / 2013 Adopted Budget 155,027,751 484.75 3.45AD_012
Adjustments to Adopted Budget
2013 Adjustments to 2012 / 2013 Adopted Budget (71,887,883) (3.00) (1.95)PF_013
Direct Service Changes
2012 Mid-Year Staffing Reductions (643,164) (6.70) 0.00DS_001
2013 Engineering Services City Reimbursable
Adjustments
(32,731) 0.00 0.00DS_002
2013 Engineering Services CIP Workload Reductions 0 (7.00) 0.00DS_003
2013 Annexation Reductions (534,841) (3.00) 0.00DS_004
2013 Road Maintenance Unincorporated Area Service
Level Reductions
(775,261) (4.17) 0.00DS_006
2013 Traffic Unincorporated Area Service Level
Reductions
(223,311) (1.70) 0.00DS_007
2013 Road Maintenance City Contract Adjustments (162,431) 0.00 0.00DS_008
2013 Traffic Maintenance City Contract Adjustments (239,917) 0.00 0.00DS_009
Surface Water Management (SWM) Fee Adjustment 763,965 0.00 0.00DS_010
2013 Roads Maintenance CIP Workload Reduction
(Loan-Out)
0 (20.00) 0.00DS_011
2013 Water and Land Resources Workload Reduction
(Loan-Out)
0 (2.50) 0.00DS_012
2013 Reimbursable Adjustments to Other
Miscellaneous Clients (Loan-Out)
0 (2.50) 0.00DS_013
2013 / 2014 High Risk Rural Road Program Grant
Funded Adjustments
163,167 0.00 0.00DS_014
Adopt-A-Road Program Elimination (61,947) (.50) 0.00DS_016
Additional 2013 Engineering Services Staffing
Reductions
(67,734) (3.00) 0.00DS_017
Surface Water Management Engineering Services
Adjustment - Loan-Out to RSD CIP
(148,256) 2.00 0.00DS_019
Additional 2013 Road Maintenance Unincorporated
Area Service Level Reductions
(781,264) (6.50) 0.00DS_020
Additional 2013 Maintenance Reduction -
Environmental Unit Water Quality Monitoring Position
(108,696) (1.00) 0.00DS_022
Environmental Unit Suppot to Solid Waste South
County Transfer Station
(347,989) 0.00 0.00DS_023
Additional 2013 Traffic Reduction - Sign and Signal
Preventive Maintenance Position
(76,054) (.35) 0.00DS_024
Additional 2013 Traffic Reduction - Markings Engineer
Position
(56,383) (.50) 0.00DS_025
Surface Water Management Engineering Services
Adjustments - Loan-Out to WLRD CIP
(133,256) 2.00 0.00DS_026
RoadsEconomic Growth and Built EnvironmentKing County Strategic Plan:
F - 112

2013/2014 Biennial Budget for
Roads 1030/A73000
Code/ Item# Description Expenditures FTEs * TLTs
Elimination of STEP Unit/Reduction in Transfer to King
County Sheriff's Office
(1,500,000) 0.00 0.00DS_027
Surface Water Management Maintenance Work
Adjustment - Loan-Out to RSD CIP
(179,993) 4.00 0.00DS_030
Surface Water Management Maintenance Work
Adjustments - Loan-Out to WLRD CIP
(49,855) 1.00 0.00DS_031
Traffic Support of City Signal Upgrades and Pedestrian
Crossing Safety Improvements
222,280 0.00 2.00DS_032
Community Services Area Allocation Adjustment 69,712 0.00 0.00DS_110
Administrative Service Changes
2013 Supervisory and Administrative Position
Reductions
(1,777,155) (16.50) 0.00AC_001
2013 Zero Base Budget Review of Consultant Budget
Accounts
(490,310) 0.00 0.00AC_002
2013 Zero Base Budget Review of Capital Outlay
Budget Accounts
(149,224) 0.00 0.00AC_003
Additional 2013 / 2014 Administrative Position
Reductions
(257,401) (2.50) (.17)AC_004
Vashon Ferry Paid Parking Implementation 18,840 0.00 0.00AC_304
Central Rate Changes
General Fund Overhead Adjustment (180,171) 0.00 0.00CR_005
KCIT Operations and Maintenance Charge (350,881) 0.00 0.00CR_007
KCIT Infrastructure Charge (671,310) 0.00 0.00CR_008
Geographic Information Systems Charge (127,205) 0.00 0.00CR_009
KCIT Operations and Maintenance Charge (143,922) 0.00 0.00CR_010
KCIT Telecommunications Services 2,964 0.00 0.00CR_011
KCIT Telecommunications Overhead (4,272) 0.00 0.00CR_012
Motor Pool Rate Adjustment (9,465) 0.00 0.00CR_013
Facilities Management Space Charge (3,370) 0.00 0.00CR_014
Insurance Charges (346,199) 0.00 0.00CR_015
Prosecuting Attorney Office Civil Division Charge (30,336) 0.00 0.00CR_020
Debt Service Adjustment 398,436 0.00 0.00CR_021
Long Term Leases (412,858) 0.00 0.00CR_022
Financial Services Charge (117,033) 0.00 0.00CR_025
Equipment Repair and Replacement 652,537 0.00 0.00CR_028
Wastewater Vehicles (23,649) 0.00 0.00CR_029
Property Services-Lease Administration Fee (2,204) 0.00 0.00CR_036
Facilities Management Strategic Initiative Fee (2,821) 0.00 0.00CR_037
Major Maintenance Repair Fund (33,023) 0.00 0.00CR_038
Countywide Strategic Technology Projects (106,389) 0.00 0.00CR_046
Business Resource Center 10,862 0.00 0.00CR_048
KCIT Reorganization Transfer (1,447,209) 0.00 0.00CR_050
KCIT Application Services 884,940 0.00 0.00CR_051
KCIT Workstation Services 1,248,900 0.00 0.00CR_052
RoadsEconomic Growth and Built EnvironmentKing County Strategic Plan:
F - 113

2013/2014 Biennial Budget for
Roads 1030/A73000
Code/ Item# Description Expenditures FTEs * TLTs
KCIT Business Analysis 23,784 0.00 0.00CR_056
KCIT Countywide Services 128,772 0.00 0.00CR_057
KCIT Tech Service Rebate (75,360) 0.00 0.00CR_058
Technical Adjustments
Labor Distribution Adjustment (1,977,385) 0.00 0.00TA_001
Department of Transportation Director's Office
Allocation Adjustment
69,705 0.00 0.00TA_002
Legacy Account Budget Elimination (24,892) 0.00 0.00TA_003
Permit Integration Cost Allocation Adjustment 59,496 0.00 0.00TA_004
Implementation of Reorganization - Elimination of
Various Budget Elements
(5,306,398) 0.00 0.00TA_010
Implementation of Reorganization - Reestablishment of
Non-Labor Accounts
5,043,920 0.00 0.00TA_011
Vacation Payout for Mid-Year 2013 Reductions 163,800 0.00 0.00TA_013
2013 Unemployment Cost Adjustment 528,854 0.00 0.00TA_014
Vacation Payout Costs for 2014 Reductions 200,000 0.00 0.00TA_015
Revenue Establishment in Reorganized Cost Centers -
$96,444,540 Revenues
0 0.00 0.00TA_050
Long Term Lease Rebate (654,608) 0.00 0.00TA_099
72,946,669 412.33 3.33FY13 Subtotal
FY14
Adjustments to Adopted Budget
2013 Adopted Budget 78,854,544 0.00 0.00PF_012
Adjustments to Adopted Budget 7,312,134 0.00 (.50)PF_014
Direct Service Changes
2012 Mid-Year Staffing Reductions (644,559) 0.00 0.00DS_001
2013Engineering Services City Reimbursable
Adjustments
(32,731) 0.00 0.00DS_002
2013 Annexation Reductions (593,953) (.70) 0.00DS_004
2014 Potential Annexation Reductions (556,860) (4.68) 0.00DS_005
2013 Road Maintenance Unincorporated Area Service
Level Reductions
(852,899) (.83) 0.00DS_006
Traffic Unincorporated Area Service Level Reductions (223,311) 0.00 0.00DS_007
2013 Road Maintenance City Contract Adjustments (162,311) 0.00 0.00DS_008
2013 Traffic Maintenance City Contract Adjustments (239,917) 0.00 0.00DS_009
Surface Water Management Fee Adjustment 545,013 0.00 0.00DS_010
2013 Road Maintenance CIP Workload Reduction
(Loan-Out)
0 (4.00) 0.00DS_011
2013 Water and Land Resources Workload Reduction
(Loan-Out)
0 (.50) 0.00DS_012
2013 Reimbursable Adjustments to Other
Miscellaneous Clients (Loan-Out)
0 (.50) 0.00DS_013
RoadsEconomic Growth and Built EnvironmentKing County Strategic Plan:
F - 114

2013/2014 Biennial Budget for
Roads 1030/A73000
Code/ Item# Description Expenditures FTEs * TLTs
2013 / 2014 High Risk Rural Road Program Grant
Funded Adjustments
(869,417) 0.00 0.00DS_014
Adopt-A-Road Program Elimination (61,947) 0.00 0.00DS_016
Additional 2013 Engineering Services Reductions (410,458) (1.00) 0.00DS_017
Additional 2014 Engineering Services Reductions 1,017,235 (22.00) 0.00DS_018
Surface Water Management Engineering Services
Adjustments - LoanOut to RSD CIP
(148,256) 0.00 0.00DS_019
Additional 2013 Road Maintenance Unicorporated Area
Service Level Reductions
(1,593,442) (6.50) 0.00DS_020
Additional 2014 Road Maintenance Unicorporated Area
Service Level Reductions
(1,164,477) (7.00) 0.00DS_021
Additional 2013 Maintenance Reduction -
Environmental Unit Water Quality Monitoring Position
(108,696) 0.00 0.00DS_022
Environmental Unit Suppot to Solid Waste South
County Transfer Station
(518,011) 0.00 0.00DS_023
Additional 2013 Traffic Reduction - Sign and Signal
Preventive Maintenance Position
(109,288) (.35) 0.00DS_024
Additional 2013 Traffic Reduction - Markings Engineer
Position
(116,276) (.50) 0.00DS_025
Surface Water Management Engineering Services
Adjustments - Loan-Out to WLRD CIP
(133,256) 0.00 0.00DS_026
Elimination of STEP Unit/Reduction in Transfer to King
County Sheriff's Office
(1,500,000) 0.00 0.00DS_027
Surface Water Management Maintenance Work
Adjustments - Loan-Out to RSD CIP
(350,783) 4.00 0.00DS_030
Surface Water Management Maintenance Work
Adjustments - Loan-Out to WLRD CIP
(120,882) 2.00 0.00DS_031
Traffic Support of City Signal Upgrades and Pedestrian
Crosing Safety Improvements
222,280 0.00 0.00DS_032
2014 Budget Contra for Additional Maintenance or
Other RSD Reductions
(1,000,000) 0.00 0.00DS_040
2014 Budget Contra for Anticipated Reductions to Fleet
Costs
(1,000,000) 0.00 0.00DS_041
Community Services Area Allocation Increase 73,184 0.00 0.00DS_110
Administrative Service Changes
2013 Supervisory and Administrative Position
Reductions
(1,770,422) 0.00 0.00AC_001
2013 Zero Base Budget Review of Consultant Budget
Accounts
(490,310) 0.00 0.00AC_002
2013 Zero Base Budget Review of Capital Outlay
Budget Accounts
(149,224) 0.00 0.00AC_003
Additional 2013 / 2014 AdministrativePosition
Reductions
(537,783) (2.00) (.83)AC_004
Vashon Ferry Paid Parking Implementation 18,840 0.00 0.00AC_304
RoadsEconomic Growth and Built EnvironmentKing County Strategic Plan:
F - 115

2013/2014 Biennial Budget for
Roads 1030/A73000
Code/ Item# Description Expenditures FTEs * TLTs
Central Rate Changes
2014 Central Rate Adjustments 554,784 0.00 0.00CR_099
Technical Adjustments
Labor Distribution Adjustment (1,977,385) 0.00 0.00TA_001
Department of Transportation Director's Office
Allocation Adjustment
72,702 0.00 0.00TA_002
Legacy Account Budget Elimination (24,892) 0.00 0.00TA_003
Permit Integration Cost Allocation Adjustment 62,054 0.00 0.00TA_004
Implementation of Reorganization - Elimination of
Various Budget Elements
(7,972,507) 0.00 0.00TA_010
Implementation of Reorganization - Reestablishment of
Non-Labor Budget
5,043,920 0.00 0.00TA_011
2014 Unemployment Cost Adjustment 300,000 0.00 0.00TA_016
Revenue Establishment in Reorganized Cost Centers -
$92,596,425 Revenues
0 0.00 0.00TA_050
Long Term Lease Rebate (654,608) 0.00 0.00TA_099
67,987,829 367.77 2.00FY14 Subtotal
140,934,498 2.00
* FTEs for the 2013 Budget and 2013/2014 Biennial Budget do not include temporary positions or overtime. The 2013/2014
Biennial Budget reflects the maximum number of FTEs during the biennium.
** The 2013/2014 Biennial Budget reflects the total expenditures for the biennium.
2013/2014 Biennial Budget 412.33
RoadsEconomic Growth and Built EnvironmentKing County Strategic Plan:
F - 116

ECONOMIC GROWTH AND BUILT ENVIRONMENT
Road Services Operating Budget
P R O G R A M H I G H L I G H T S The total 2013 / 2014 Proposed budget for the Road Services Division is $140,934,498 with funding for 412.33 FTEs and 2.00 TLTs. This proposed 2013 / 2014 Proposed Budget represents a 9 percent decrease from the 2012 / 2013 Adopted Budget and includes the reduction of approximately 20 percent of the Roads workforce over the biennium. In addition, this budget incorporates the reorganization of the division that was developed with council staff during the 2012 / 2013 budget adoption process. Adjustments to Adopted Budget Adjustments to the 2012 / 2013 Adopted Biennial Budget in 2013 and 2014 Pro Forma include removing the 2012 portion of the budget to create a baseline for the 2013 / 2014 budget as well as miscellaneous salary adjustments. Salary adjustments include increases for 3.09 percent COLA for 2013 and 2.00 percent for 2014 and a 1.00 percent increase in the Flex Benefit rate for 2013 from the 2012 rate and a 4.00 percent increase from 2013 for the 2014 rate. Direct Service Changes 2012 Mid-Year Staffing Reductions 2013 – ($643,164) / (6.70) FTE 2014 – ($644,559) This decision package implements in the budget the FTE reductions identified in the April 2012 re-baseline analysis. The reduction reflects salary and benefits only; the loan-out labor impacts and overhead cost recovery impacts are included in the Labor Distribution decision package. These reductions include an administrative specialist, two engineers, a carpenter, a sign painter, and a sign technician. 2013 Engineering Services City Reimbursable Adjustments 2013 – ($32,731) 2014 – ($32,731) This budget item is the annual change to the Engineering Services (ES) city program for 2013 reflecting workload assumptions from the respective cities. The 2013 program is based on city input, historic city actual expenditures, annexations and changes in city inventory. The ES program fluctuates from year-to-year due to work program needs and the financial situation of each city as well as the Section’s ability to staff the work. Engineering Services city work in 2013 includes bridge inspections, materials lab sampling, signal design support, and inspection support. 2013 Engineering Services CIP Workload Reductions 2013 – $0 / (7.00) FTE This decision package makes reductions in the number of engineering positions supporting the CIP in order to align and size direct service engineering capacity consistent with SPRS priorities, the tiered road system, and reductions in revenue resulting in reduced CIP work. This proposal makes reductions consistent with staffing only those projects that can be categorized as core safety, regulatory compliance, grant-backed, carry-over or currently in construction, and reduced preservation based on available funds. As a result, major reductions in the bridge, roadway, drainage and pavement preservation programs have been made either in this biennial budget or in the 2012 / 2013 Biennial Budget. This proposal identifies the elimination of seven engineering positions at various levels in the Engineering Services section that directly support the RSD CIP.
F - 117

ECONOMIC GROWTH AND BUILT ENVIRONMENT
2013 Annexation Reductions 2013 – ($534,841) / (3.00) FTE 2014 – ($593,953) / (0.70) FTE This proposal identifies the direct service cost reductions for Road Maintenance and Traffic operations associated with the annualized annexation of the Eastgate Annexation Area to Bellevue, and the 2013 annexation of the “islands” to Bothell. The North Highline Potential Annexation Area (PAA) will receive road and traffic maintenance services on a contract basis in 2013 after annexation to Burien. Staffing reductions include a crew chief, a utility worker, a truck driver, and a sign marking specialist. These reductions will be effective March 1, 2013 to mitigate possible impacts to storm response. 2014 Potential Annexation Reductions 2014 – ($566,800) / (4.68) FTE This proposal identifies the direct service cost reductions for Road Maintenance and Traffic operations associated with the Klahanie and West Hill PAAs. Staffing reductions include a crew chief, a utility worker, a truck driver, and a sign marking specialist. These reductions will be effective on April 1, 2014, and the annualized impact is the reduction of five positions. 2013 Road Maintenance Unincorporated Area Service Level Reductions 2013 – ($775,261) / (4.17) FTE 2014 – ($852,899) / (0.83) FTE This change item reduces 2013 direct service levels for maintenance consistent with priorities set forth in SPRS and per the tiered road system. Activities reduced include items such as shoulder restoration, ditch cleaning, catch basin cleaning, slope/shoulder mowing, and pothole patching. Overall, the impact of this change will be a significant reduction in the quality and level of service to unincorporated King County citizens, particularly on lower priority tier roads. Reductions are taken in supplies and services costs as well as maintenance positions including a crew chief, a utility worker, a truck driver, and two equipment operators. These reductions will be effective March 1, 2013 to mitigate possible impacts to storm response. 2013 Traffic Unincorporated Area Service Level Reductions 2013 – ($223,311) / (1.70) FTE 2014 – ($223,311) This decision package reduces a position associated with reflective pavement marker installation on lower tier roads in unincorporated King County and also eliminates an engineering position associated with the neighborhood and school traffic safety programs on lower tiered roads. These reductions are consistent with the priorities set forth in SPRS and per the tiered road system. 2013 Road Maintenance City Contract Adjustments 2013 – ($162,431) 2014 – ($162,311) This decision package makes adjustments to the anticipated city contract workload assumptions in the budget. For 2013, reductions are being taken in Burien, Woodinville, Shoreline, Newcastle, Lake Forest Park, Covington, Maple Valley and Sammamish. These reductions are partially offset by an increase in Kenmore and in non-contract cities. Two non-contract cities have requested support for large projects: pond maintenance in Kent and levee repair in Auburn.
F - 118
ECONOMIC GROWTH AND BUILT ENVIRONMENT
2013 Traffic Maintenance City Contract Adjustments 2013 – ($239,917) 2014 – ($239,917) This change item makes adjustments to the anticipated city contract workload assumptions in the budget. Changes to the city program are made as a result of city input, historic city actual expenditures, annexations and changes in city inventory. In 2013, the program has increased slightly from prior years. There are increases in Basic Maintenance in the cities of Burien, Snoqualmie, Covington, Federal Way, Kent, Mercer Island, and Sammamish. Basic Maintenance budgets are decreasing in Auburn, Woodinville, Redmond and Bothell. Discretionary work budgets were increased for Auburn, Burien and Federal Way. Discretionary budgets were decreased for Woodinville, Snoqualmie, Lake Forest Park, and North Bend. Surface Water Management (SWM) Fee Adjustment 2013 – $763,965 2014 – $545,013 This change item makes adjustments to the Surface Water Management Utility fee budget consistent with the Water and Land Resources Division (WLRD) proposed 27 percent increase as well as with reductions in road miles from anticipated annexations. 2013 Road Maintenance CIP Workload Reductions (Loan-Out) 2013 – $0 / (20.00) FTE 2014 – $0 / (4.00) FTE This decision package makes reductions in the number of maintenance positions supporting the CIP in order to align and size direct service capacity consistent with SPRS priorities, the tiered road system, and reduced CIP work resulting from declining revenues. The maintenance staff play a major role in the pavement and drainage preservation programs as well as the pedestrian mobility improvements, and the reductions to those activities directly impact the maintenance workforce. This proposal makes reductions consistent with staffing only those projects that can be categorized as core safety, regulatory compliance, grant-backed, and carry-over or currently in construction. As a result, major reductions in the bridge, roadway, drainage and pavement preservation programs have been made either in this biennial budget or in the 2012 / 2013 Biennial Budget. These cuts include two crew chiefs, ten utility workers, six truck drivers, three equipment operators, and three carpenters. These reductions will be effective March 1, 2013 to mitigate possible impacts to storm response. 2013 Water and Land Resources Workload Reduction (Loan-Out) 2013 – $0 / (2.50) FTE 2014 – $0 / (0.50) FTE This change item decreases loan-out labor to the Water and Land Resource Division (WLRD) for surface water management tasks, capital projects, and WLRD’s city work in 2013. The quantity of work performed each year by the Roads Maintenance and Traffic Operations section for WLRD depends upon the level of loan-in labor support requested. Staff reductions include a truck driver, a utility worker, and an equipment operator. These reductions will be effective March 1, 2013 to mitigate possible impacts to storm response. 2013 Reimbursable Adjustments to Other Miscellaneous Clients 2013 – $0 / (2.50) FTE 2014 – $0 / (0.50) FTE This proposal decreases loan-out labor to other King County agencies other than Water and Land Resources. In 2013, the level of service requested by other county agencies has declined. This proposal will align the Section’s staffing with available funding from other agencies. Eliminated positions include a utility worker, a truck driver, and a carpenter. These reductions will be effective March 1, 2013 to mitigate possible impacts to storm response.
F - 119

ECONOMIC GROWTH AND BUILT ENVIRONMENT
2013 / 2014 High Risk Rural Road Program Grant Funded Adjustments 2013 – $163,167 2014 – ($869,417) This decision package makes adjustments to the Road Services Division budget consistent with anticipated work for the grant-funded High Risk Rural Road Program. 2013 is the third and final year of the Washington State Department of Transportation County Safety Program grant providing operating grant money from the Federal Highway Administration Highway Safety Improvement Program - High Risk Rural Roads Program. These grants are designed to assist counties to improve safety in the two top collision situations: run-off-the-road collisions and intersection related crashes. These types of collisions are designated priority one and two in the state Strategic Highway Safety Plan “Target Zero.” The grant funded work includes improvements such as centerline and/or edge rumble strips or profiled thermoplastic; guideposts at locations with roadside hazards; reflectors on existing guardrail; warning signs such as chevrons and object markers; mowing, clearing and related sight distance improvements; and removal of hazards in the clear zone. In addition, improvements at intersections with a high number of collisions will be constructed as part of this grant. The Road Services Division will finish the design and complete the construction for some of the intersection improvements in 2012. The remaining intersection projects will be constructed in 2013 as will construction of the run-off-road projects. Reductions in 2014 consist of reduced budgets for services and supplies. Because fractional FTEs work on this project, position reductions taken in other decision packages incorporate the reduced workload in 2014. 2013 True Temp and Overtime Traffic Maintenance Adjustments 2013 – $0 2014 – $0 This change item is a net zero request. This adjustment moves budget from a materials account to fund overtime needs and an ongoing requirement for 4 short term temporary seasonal employees to perform pavement marking tasks during the summer months. The temporary employees will work on county and some city reimbursable pavement marking projects only. If work is not available because of weather, the employees will be sent home. The overtime funding supports standby pay associated with weekend and holiday needs on critical safety related sign and signal maintenance work. Adopt-A-Road Program Elimination 2013 – ($61,947) / (0.50) FTE 2014 – ($61,947) This decision package reduces a position from 1.0 to 0.5 FTE and eliminates this position’s work on the Adopt-A-Road program. With this position reduction, the division will no longer be able to provide coordination for the program, which has provided for 350 cleanups per year involving 6,500 volunteer hours from 2,600 volunteers. While this is an efficient and beneficial program, it is not as high of a priority as other Road Services activities. Additional 2013 Engineering Services Reductions 2013 – ($67,734) / (3.00) FTE 2014 – ($410,458) / (1.00) FTE As a result of further declines in property and gas tax revenue, this decision package implements the elimination of additional engineering services positions in 2013 to balance the biennial budget. Significant revenue shortfalls in the biennium required reductions to the 2013 / 2014 years of the CIP program. The remaining funded CIP projects and program work encompass core safety, regulatory compliance, grant-backed, carry-over funding or construction in progress. Consistent with those reductions, this proposal for the 2013 budget eliminates six positions in the Engineering Services section that provided programmatic and project support to the CIP. Eliminated positions include engineers providing support to roadway and preservation (1 FTE), construction inspection (2 FTE), road services (1 FTE), drainage and facilities design (1 FTE) and construction contract management (1 FTE). However, in 2014 two engineering positions are reinstated in the budget consistent with staffing needs. The 2013 reductions will take place on July 1, 2013.
F - 120

ECONOMIC GROWTH AND BUILT ENVIRONMENT
Additional 2014 Engineering Services Reductions 2014 – $1,017,235 / (22.00) FTE As a result of further declines in property and gas tax revenue, this decision package implements the reduction of additional engineering services staff in 2014 to balance the biennial budget. Significant revenue shortfalls in the biennium required reductions to the 2014 CIP program. Consistent with those reductions, this proposal eliminates twenty-two positions in the Engineering Services Section that provided programmatic and project support to the CIP. The remaining funded CIP projects and program work encompass core safety, regulatory compliance, grant-backed, carry-over funding or construction in progress. Reductions include one managing engineer, one administrative specialist and engineering positions at various levels supporting roadway and preservation (5 FTEs), bridge and structural design (7 FTEs), surveys (2 FTEs), the materials lab (2 FTEs), drainage and design (3 FTEs) and utility inspection work (1 FTE). These reductions will be effective on January 1, 2014. Surface Water Management Engineering Services Adjustments – Loan-Out to RSD CIP 2013 – ($148,256) / 2.00 FTE 2014 – ($148,256) This proposal involves the addition of two engineering positions to support surface water quality work in the road right-of-way, which will be funded through a transfer to RSD of a portion of the WLRD SWM fee increase. Consistent with the proposed 2013 / 2014 increase in the WLRD SWM fee, in 2013 RSD will transfer nearly $5 million in SWM fees to the WLRD as required to mitigate the road system’s general stormwater impacts. In 2013 and 2014, a portion of this fee revenue will support work in the RSD budget that will positively impact surface water management and surface water quality. As a whole, this body of work will protect water quality as follows:
• Removing accumulated sediments in ditches prevents large quantities of sediment from being transported to watercourses, streams, and/or off-road ponds and drainage systems.
• Bank stabilization and slope repair work minimizes sediment inputs to receiving water bodies. • Drainage improvements, culvert replacements and pipe installations prevent continued erosion of stream
beds and banks and prevent road failure and subsequent delivery of large quantities of road fill and asphaltic materials to receiving waters.
• Routine maintenance of gravel roads helps prevent fine sediments from entering receiving waters. These activities include grading and adding new gravel material to road surfaces and shoulder areas.
In both 2013 and 2014, part of the SWM fees will reimburse the RSD CIP to support design engineering for culverts and other drainage facility preservation in the road right-of-way. This work will require restoration of two engineering positions, which will be loaned out to the RSD CIP in support of this work. Additional engineering and maintenance positions supported by the SWM fee increase are describe below in change items DS_026 Surface Water Management Engineering Services Adjustments – Loan-Out to WLRD CIP, DS_030 Surface Water Management Maintenance Work Adjustments – Loan-Out to RSD CIP, and DS_031 Surface Water Management Maintenance Work Adjustments – Loan-Out to WLRD CIP Additional 2013 Road Maintenance Unincorporated Area Service Level Reductions 2013 – ($781,264) / (6.50) FTE 2014 – ($1,593,442) / (6.50) FTE As a result of further declines in property and gas tax revenue, this change item implements the reduction of additional maintenance staff in 2013 to balance the biennial budget. As with the maintenance service cuts noted above, this change item reduces direct service levels for maintenance consistent with priorities set forth in SPRS and per the tiered road system. Activities reduced include items such as shoulder restoration, ditch cleaning, catch basin cleaning, slope/shoulder mowing, and pothole patching. Overall, the impact of this change will be a significant reduction in the quality and level of service to unincorporated King County citizens, particularly on
F - 121

ECONOMIC GROWTH AND BUILT ENVIRONMENT
lower priority tier roads. Core safety and regulatory compliance will also be negatively impacted as this change reduces tasks associated with core safety and regulatory compliance by 7 percent. Reductions are taken in supplies and services costs as well as in maintenance positions including a crew chief, four utility workers, four truck drivers, three equipment operators, and a painter. These reductions will be effective July 1, 2013. Additional 2014 Road Maintenance Unincorporated Area Service Level Reductions 2014 – ($1,164,477) / (7.00) FTE As a result of further declines in property and gas tax revenue, this change item implements the reduction of additional maintenance staff in 2014 to balance the biennial budget. As with the maintenance service cuts noted above, this change item reduces direct service levels for maintenance consistent with priorities set forth in SPRS and per the tiered road system. Activities reduced include items such as shoulder restoration, ditch cleaning, catch basin cleaning, slope/shoulder mowing, and pothole patching. Overall, the impact of this change will be a significant reduction in the quality and level of service to unincorporated King County citizens, particularly on lower priority tier roads. Core safety and regulatory compliance will also be negatively impacted. Reductions are taken in supplies and services costs as well as in maintenance positions including a crew chief, three utility workers, two truck drivers, and one equipment operator. These reductions will be effective on January 1, 2014. Additional 2013 Maintenance Reduction - Environmental Unit Water Quality Monitoring Position 2013 – ($108,696) / (1.00) FTE 2014 – ($108,696) As a result of further declines in property and gas tax revenue, this proposal eliminates one engineer associated with the baseline water quality monitoring program associated with the Endangered Species Act. The Baseline Water Quality Monitoring program has been used to document current water quality conditions within the right-of-way and document changes over time. The elimination of this work will reduce the historic water quality information within the right-of-way. This will limit the RSDs ability to anticipate water quality issues and will result in less certainty when developing the most cost-effective solution to address a future issue or violation. While having this information assists RSD in arriving at the most cost-effective decisions, it is not a regulatory requirement and is therefore a lower priority than other RSD activities. Environmental Unit Support to Solid Waste South County Transfer Station 2013 – ($347,989) 2014 – ($518,011) This change item increases the loan out budget to King County Solid Waste consistent with requested support for Environmental Impact Statement work associated with the Solid Waste South County Transfer Station project. This new work mitigates two anticipated cuts to the Environmental Unit. If this work does not materialize, RSD will need to eliminate two positions. Additional 2013 Traffic Reduction – Sign and Signal Preventive Maintenance Position 2013 – ($76,054) / (0.35) FTE 2014 – ($109,288) / (0.35) FTE As a result of further declines in property and gas tax revenue, this decision package makes a reduction to sign and signal preventive maintenance to balance the biennial budget. Traffic signs provide warning, guidance and information about roadway conditions for the travelling public, and sign maintenance is directly related to traffic safety. This reduction will reduce the sign maintenance program by about five percent and will result in longer cycle time for sign repair and maintenance. This reduction will be effective on July 1, 2013.
F - 122

ECONOMIC GROWTH AND BUILT ENVIRONMENT
Additional 2013 Traffic Reduction – Markings Engineer Position 2013 – ($56,383) / (0.50) FTE 2014 – ($116,276) / (0.50) FTE As a result of further declines in property and gas tax revenue, this decision package makes an additional reduction in Traffic to support efforts to balance the budget in the biennium and to align staffing with reductions taken in the RSD CIP to balance the budget. The eliminated engineer position is one of two whose primary responsibilities are to provide pavement markings engineering. Pavement markings are a vital safety feature for proper traffic guidance and safe operations, particularly where high speeds, horizontal curvature, and narrow roadside recovery areas exist. Pavement markings engineers plan and design new or replacement markings and mark the location of those markings in the field. This reduction is necessitated because of a reduction of the CIP overlay and an overall reduction in the unincorporated area service levels, particularly on lower tiered roads. This reduction will take place on July 1, 2013. Surface Water Management Engineering Services Adjustments – Loan-Out to WLRD CIP 2013 – ($133,256) / 2.00 FTE 2014 – ($133,256) This change item increases RSD loan out services to WLRD to support surface water quality work to be funded through the proposed SWM fee increase, discussed in more depth in previous narrative. For the 2013 / 2014 biennium, WLRD is proposing a 27 percent increase in the SWM fee. As part of the work funded by this fee increase, WLRD has requested additional loan in of two engineer positions to provide design support to drainage projects outside the road right-of-way and funded directly by the WLRD CIP. This additional loan out to WLRD necessitates the restoration of two engineering positions within RSD. Elimination of STEP Unit/Reductions in Transfer to King County Sheriff’s Office 2013 – ($1,500,000) 2014 – ($1,500,000) This change item reduces the transfer to the King County Sheriff’s Office by $1.5 million in each year of the biennium. The current $4 million transfer supports the Selective Traffic Enforcement Program (STEP) Unit along with general patrolling provided by KCSO in the unincorporated area. With annexations in the last 10 years, the RSD service area has changed significantly and the services provided by the STEP Unit are less needed and a lower priority for RSD. Surface Water Management Maintenance Work Adjustments – Loan-Out to RSD CIP 2013 – ($179,993) / 4.00 FTE 2014 – ($350,783) / 4.00 FTE This proposal involves the addition of several maintenance positions to support surface water quality work in the road right-of-way, work that will be funded through a transfer to RSD of a portion of the WLRD SWM fee increase. As noted above, in 2013 and 2014, a portion of this fee revenue will be used to reimburse the RSD CIP to support projects and activities that will positively impact surface water management and surface water quality. In 2013, this work includes specific capital projects involving ditch cleaning and bank stabilization, sediment removal, slope repairs and drainage improvements, pipe installation, culvert replacement, and gravel road work. In 2014, this work involves similar projects to the 2013 work, but also includes stormwater retrofits, drainage improvements related to tidal impacts, and debris and sediment removal. In the 2013 / 2014 biennium, this work will be programmed in the RSD CIP and will be performed by RSD maintenance staff, who will be loaned out to the RSD CIP. This work will require the restoration of four maintenance positions in 2013 and an additional four positions in 2014. The positions include a crew chief, three utility workers, two truck drivers and two equipment operators.
F - 123

ECONOMIC GROWTH AND BUILT ENVIRONMENT
Surface Water Management Maintenance Work Adjustments – Loan-Out to WLRD CIP 2013 – ($49,855) / 1.00 FTE 2014 – ($120,882) / 2.00 FTE This change item involves an increase in the RSD loan out services to WLRD to support surface water quality work outside of the right-of-way to be funded through the proposed SWM fee increase. For the 2013 / 2014 biennium, WLRD is requesting a 27 percent increase in the SWM fee. As part of the work funded by this fee increase, WLRD has requested additional loan in of one position in 2013 and three positions in 2014. In 2013, RSD loan out work to WLRD will support seven minor Neighborhood Drainage Assistance Program (NDAP) projects and three remediation projects. In 2014, RSD will perform additional NDAP and habitat restoration work for the WLRD. This work will require the restoration of a utility worker position in 2013 and an additional truck driver position and an addition equipment operator position in 2014. Performing this work as well as the work identified in the three other SWM fee related proposals will restore critical habitat and protect water quality and is an important priority for both RSD and WLRD. Traffic Support of City Signal Upgrades and Pedestrian Crossing Safety Improvements 2013 – $222,280 / 2.00 TLT 2014 – $222,280 This proposal adds budget authority for two new signal technician TLTs in support of the Washington State Department of Transportation (WSDOT) Highways & Local Programs grants for City Safety Program. WSDOT has awarded these grants, which are funded through the federal Highway Safety Improvement Program, to four RSD contract cities: Burien, Federal Way, Shoreline, and SeaTac. These four cities have indicated an interest in having the county complete this work on a contractual basis. The request for additional staff is necessitated by a significant ongoing workload for signal technicians in contract cities. 2014 Budget Contra for Additional Maintenance or Other RSD Reductions 2014 – ($1,000,000) This change item places a $1 million contra in the budget for additional reductions. By 2014, RSD will have made significant reductions in most areas of its budget. However, in the absence of a new funding source, additional reductions will be necessary to balance. Further reductions could be proposed to maintenance; however, there are other areas of the organization that could be evaluated further to identify efficiencies or cuts with minimal impacts. This contra provides the division director with the opportunity to identify additional cost cutting measures in the mid-biennial review. 2014 Budget Contra for Anticipated Reductions to Fleet Costs 2014 – ($1,000,000) This item places a $1 million contra in the budget associated with anticipated fleet savings. In the decision packages implemented in the budget, there is an associated potential fleet savings of nearly $2 million. However, this estimate must be validated by the Fleet Administration Division and will not be achieved until vehicle reductions are actually made. This contra requires that RSD work to obtain savings in fleet costs, but it does not count on all the currently estimated savings. This value will be further examined during the mid-biennial review. Community Services Area Allocation Adjustment 2013 – $69,712 2014 – $73,184 This proposed change reflects the RSD share of the allocation model to fund the implementation of the Community Services Area (CSA) program. The CSA program, adopted by the Council in 2011, replaces the former Unincorporated Area Councils (UAC) approach to fostering community involvement in the unincorporated areas. The CSA program will be funded per the former UAC allocation model of which RSD is responsible for 21 percent.
F - 124

ECONOMIC GROWTH AND BUILT ENVIRONMENT
Administrative Service Changes 2013 Supervisory and Administrative Position Reductions 2013 – ($1,777,155) / (16.50) FTE 2014 – ($1,770,422) This change item implements significant reductions to administrative and supervisory positions throughout the Road Services Division. In general, these reductions represent result in reduced support for the organization necessitated by current fiscal conditions. Reductions include the following:
• Administration - two positions processing maps and records and public disclosures, one position responsible for development of the non-motorized plan and coordination with the non-motorized community, and one position associated with construction contract support.
• Budget and Finance – one engineer working on the Road Network Inventory System (RNIS) and stormwater data collection, one engineer providing 3 dimensional mapping support, one project program manager supporting telecommunications, and two fiscal specialist positions supporting payroll and accounts payable.
• Engineering – one administrative specialist position and one managing engineer. • Maintenance – two supervisor positions, one project program manager, and two administrative specialists.
2013 Zero Base Budget Review of Consultant Budget Accounts 2013 – ($490,310) 2014 – ($490,310) This change item adjusts consulting accounts consistent with anticipated workload during the biennium. Consulting services and Other Contract/Professional Services accounts were reviewed for budget savings. Of the $740,310 budget in these accounts, $250,000 will be retained for required ongoing contractual service needs. 2013 Zero Base Budget Review of Capital Outlay Budget Accounts 2013 – ($149,224) 2014 – ($149,224) This decision package adjusts capital outlay budget accounts consistent with anticipated workload during the biennium. A capital outlay spending plan is prepared each year itemizing capital outlay needs within an historic allowance of $245,448. With the need to identify budget savings, the plan was reviewed. Capital outlay spending will be reduced in both years of the biennium. Vashon Ferry Paid Parking Implementation 2013 – $18,840 2014 – $18,840 This proposal would generate revenue by charging ferry riders to park in the Road Services division parking lot adjacent to the ferry dock on the north end of Vashon Island. It is estimated that this would generate annual revenue of $263,738. This revenue assumption is included in the Revenue Adjustment change item. This revenue will be minimally offset by one-time costs of approximately $18,000 to purchase and install an auto cashier parking lot payment system and ongoing costs for a phone line to support credit card payments for the auto cashier payment system. Additional 2013 / 2014 Administrative Position Reductions 2013 – ($257,401) / (2.50) FTE / (0.17) TLT 2014 – ($537,738) / (2.00) FTE / (0.83) TLT This change item takes additional administrative reductions to balance the 2013 / 2014 Biennial Budget. Reductions include the following: a payroll specialist supporting the Road Maintenance section (in 2014), an administration specialist in the division Director’s Office (2013), a business and finance officer position (2013), and three positions associated with the Roads Enterprise GIS project (2013 and 2014). These reductions may result in some overtime for other staff and will delay the full implementation of the division’s work order system
F - 125

ECONOMIC GROWTH AND BUILT ENVIRONMENT
Central Rate Changes Central Rate Changes 2013 – ($736,482) 2014 – $554,784 This series of adjustments captures the net effect of countywide charges from the 2012 / 2013 Adopted Budget to reflect the most current 2013 and 2014 central rate charges. Unlike previous years, it does not include COLA and flex benefits, which are included in the Pro Forma decision package. Details about each rate can be found in the How We Deliver Introduction, beginning on page H-5, and the agency-specific changes are detailed in the central rate section of the agency crosswalk. Technical Adjustments Labor Distribution Adjustment 2013 – ($1,977,385) 2014 – ($1,977,385) This proposal addresses incremental changes associated with loan-out labor, benefits, and overhead cost recovery that are not directly addressed by other stand alone decision packages contained in the budget proposal. This value includes the reduction in loan out and overhead recovery for select 2013 decision packages containing reductions in loan out labor. Additional reductions to overhead recovery are captured in specific decision packages. In sum, this decision package reflects a reduction in loan out labor and overhead recovery associated with select 2013 reductions. Department of Transportation Director’s Office Allocation Adjustment 2013 – $69,705 2014 – $72,705 This technical adjustment revises the budget for the overhead charge paid to the Department of Transportation Director’s Office consistent with the most recent allocation model. Legacy Account Budget Elimination 2013 – ($24,892) 2014 – ($24,892) This change item eliminates budget in a legacy central rate account. This budget has not been used for several years. Permit Integration Cost Allocation Adjustment 2013 – $59,496 2014 – $62,054 This change item adjusts the budget cost for RSD support for the Permit Integration project. Implementation of Reorganization – Elimination of Various Budget Elements 2013 – ($5,306,398) Expenditures / (101,263,209) Revenue 2014 – ($7,972,507) Expenditures / (102,041,002) Revenue As part of the 2012/2013 budget development process, council staff worked with Road Services to reorganize the division, with the direction that the reorganization would be formally incorporated into the 2013/2014 Biennial Budget. Staff budgets were moved consistent with the reorganization during the Pro Forma phase of the budget development. In addition to labor changes, the reorganization required the movement of non-labor, non-central rate budgets among cost centers. To simplify this process, non-labor, non-central rate budgets from the 2013 allocation of the 2012 / 2013 Adopted Budget are zeroed out in 2013 and 2014 in this change item. This change item also removes some COLA and benefits inflationary costs given that these items were to be reinstated centrally later in the budget process. Finally, this change item also zeroes out the revenue budgets.
F - 126
ECONOMIC GROWTH AND BUILT ENVIRONMENT
Implementation of Reorganization – Reestablishment of Non-Labor Budget 2013 – $5,043,920 2014 – $5,043,920 This change item reinstates the 2013 adopted budget, placing non-labor, non-central rate expenditures in the proper cost centers per the organizational chart developed by council staff and Road Services leadership. Revenues were reinstated in the revenue change item described below. Central rate changes were implemented as part of the budget development process. Vacation Payout for Mid-Year 2013 Reductions 2013 – $163,800 This change item sets aside resources to cover vacation payout costs for layoffs scheduled for March 1, 2013 and mid-year 2013. Costs for layoffs effective January 1, 2013 layoffs will be incurred in 2012. 2013 Unemployment Cost Adjustment 2013 – $528,854 This decision package adjusts the budgeted amount for unemployment costs consistent with anticipated layoffs in 2013. Vacation Payout Costs for 2014 Reductions 2013 – $200,000 This change item sets aside resources to cover vacation payout costs for layoffs January 1, 2014. These costs will be incurred in 2013. 2014 Unemployment Cost Adjustment 2014 – $300,000 This decision package adjusts the budgeted amount for unemployment costs consistent with anticipated layoffs in 2014. Revenue Establishment in Reorganized Cost Centers 2013 – $96,444,540 Revenue 2014 – $92,596,425 Revenue This change item establishes the anticipated revenue budgets in cost centers consistent with the reorganization and consistent with updated revenue projections. This change incorporates the latest property and gas tax forecasts as well as anticipated revenues from reimbursable work and other revenues. Long Term Lease Rebate 2013 – ($654,608) 2014 – ($654,608) King County has received a rebate from the owner of the King Street Center and has benefitted from the refinancing of the remaining debt. The 2013 / 2014 budget passes this windfall on to the King Street tenants in the form of a $7.5 million rent rebate and a $450,000 capital project to reconfigure space associated with the Road Services proposed consolidation to a single floor in King Street Center. Since this Road Services cost cutting space measure is a relatively recent proposal a 20 percent contingency is included in the $450,000 project amount budgeted in the Long Term Lease fund. In the proposed budget the rebate has been included as a separate decision package entry to offset the central rate budgeting of 2013 and 2014 lease costs.
F - 127

2011 Actual 1 2012 Adopted2012
Estimated 22013
Proposed2014
Proposed 32015
Projected 42016
Projected 4
Beginning Fund Balance (10,724,308) 2,062,222 (3,884,914) 392,498 (380,164) 1,908,310 (3,078,883) RevenuesProperty Taxes 81,150,042 74,209,709 72,580,578 64,554,527 62,659,341 62,941,165 65,072,027 Gas Taxes 13,762,446 13,299,504 13,191,249 12,907,932 12,744,590 12,788,485 12,788,134 Reimbursable Fees for Service 16,115,377 14,886,159 16,269,311 14,081,209 14,654,811 14,732,383 15,045,128 Grants 1,818,107 2,364,009 1,963,045 1,374,417 ‐ ‐ ‐ Emergency Grant Contingency ‐ ‐ 1,000,000 1,000,000 1,000,000 1,000,000 1,000,000 Other Revenues 1,614,158 1,185,443 1,481,180 2,526,454 1,537,684 1,557,652 1,578,168
Total Revenues 114,460,130 105,944,824 106,485,364 96,444,540 92,596,425 93,019,685 95,483,458 Total Biennial Revenues
ExpendituresWages, Benefits and Retirement ‐ ‐ ‐ (39,886,579) (37,668,919) (41,134,663) (42,903,453) Supplies and Operating Capital Outlay ‐ ‐ ‐ (4,555,712) (3,906,145) (4,074,109) (4,249,295) Services and Other Charges ‐ ‐ ‐ (13,240,556) (11,709,819) (12,213,341) (12,738,515) Intergovernmental Services and Contributions ‐ ‐ ‐ (24,908,363) (26,211,620) (27,338,720) (28,514,285) Overhead Recovery ‐ ‐ ‐ 11,716,918 10,011,494 9,454,953 9,861,516 Other ‐ ‐ ‐ (2,072,375) (502,821) (524,443) (546,994) Budget Contra ‐ ‐ ‐ ‐ 2,000,000 2,086,000 2,175,698
Total Expenditures (82,008,726) (76,540,822) (80,020,476) (72,946,669) (67,987,829) (73,744,322) (76,915,328) Total Biennial Expenditures
Estimated Underexpenditures 5 765,408 800,205 729,467 679,878 737,443 769,153 Other Fund TransactionsTransfer to Capital (25,612,010) (29,004,680) (22,987,680) (25,000,000) (23,000,000) (25,000,000) (26,000,000)
‐ ‐ ‐ ‐ ‐ ‐ ‐
Total Other Fund Transactions (25,612,010) (29,004,680) (22,987,680) (25,000,000) (23,000,000) (25,000,000) (26,000,000) Total Biennial Other Fund Transactions
Ending Fund Balance (3,884,914) 3,226,952 392,498 (380,164) 1,908,310 (3,078,883) (9,741,600)
Reserves
Rainy Day Reserve ‐ Consistent with RSD Financial Policies6 ‐ (7,000,000) (7,000,000) (7,000,000) (7,000,000) (7,000,000) (7,000,000)
Cumulative Expected Property Sale Revenue to Build Reserves 1,000,000 1,000,000 2,500,000 4,000,000 5,500,000 7,000,000
Reserve Shortfall 7 ‐ ‐ 6,000,000 4,500,000 3,000,000 1,500,000 ‐
Ending Undesignated Fund Balance 392,498 (380,164) 1,908,310 (3,078,883) (9,741,600)
Financial Plan Notes:1 2011 Actuals are based on the 2010 CAFR or 14th Month ARMS/IBIS.2 2012 Estimated is based on updated revenue and expenditure data as of March 2012. 3 2014 revenues and expenditures include the inflation assumptions for salary, benefits, and intragovernmental charges as implemented in the budget system.
Road Services Division / 1030
7 This fund intends to build fund balance to recommended levels over the next three years as outlined in the Road Services Division financial policies. Over the next several years, the Road Services Division will also transition to comply more closely with the county‐wide financial policies.
2013/2014 Biennial Proposed Financial Plan
189,040,965 188,503,143
(140,934,497) (150,659,649)
(48,000,000) (51,000,000)
5 Estimated underexpenditures are established at 1 percent of budgeted expenditures. This value is not incorporated in the proposed appropriation.
6 The Rainy Day Reserve of $7 million corresponds with recently approved Road Services Division financial policies. This amount also corresponds with a reserve of approximately 30 days of operating expense. This reserve can also function to partially cover cash flow needs resulting from the semi‐annual influx of property taxes. The Road Service Division will transition over the next few years to fully implement county‐wide financial policies.
4 2015 and 2016 expenditures assume an inflationary factor of 4.3 percent of ongoing costs. Property tax revenues are based on OEFA estimates; gas taxes are based on State of Washington projections. Inflation assumptions for other revenues are generally set at 4.3 percent.
F - 128

2013/2014 Biennial Budget for
Roads Construction Transfer 1030/A73400
Code/ Item# Description Expenditures FTEs * TLTs
FY13
Adopted Budget
2012 / 2013 Adopted Budget 59,396,833 0.00 0.00AD_012
Adjustments to Adopted Budget
2013 Adjustments to 2012 / 2013 Adopted Budget (29,004,680) 0.00 0.00PF_013
Technical Adjustments
Reduction to Transfer to CIP (5,392,153) 0.00 0.00TA_010
25,000,000 0.00 0.00FY13 Subtotal
FY14
Adjustments to Adopted Budget
2013 Adopted Budget 30,392,153 0.00 0.00PF_012
Adjustments to Adopted Budget 0 0.00 0.00PF_014
Technical Adjustments
Reduction to Transfer to CIP (7,392,153) 0.00 0.00TA_010
23,000,000 0.00 0.00FY14 Subtotal
48,000,000 0.00
* FTEs for the 2013 Budget and 2013/2014 Biennial Budget do not include temporary positions or overtime. The 2013/2014
Biennial Budget reflects the maximum number of FTEs during the biennium.
** The 2013/2014 Biennial Budget reflects the total expenditures for the biennium.
2013/2014 Biennial Budget 0.00
Roads Construction TransferEconomic Growth and Built EnvironmentKing County Strategic Plan:
F - 129

ECONOMIC GROWTH AND BUILT ENVIRONMENT
Roads Construction Transfer
P R O G R A M H I G H L I G H T S The total 2013 / 2014 Proposed Budget for the Roads Construction Transfer is $48,000,000. This is a reduction of approximately 24 percent from the 2012 / 2013 Adopted Budget. Adjustments to Adopted Budget Adjustments to the 2012 / 2013 Adopted Biennial Budget in 2013 and 2014 Pro Forma include removing the 2012 portion of the budget to create a baseline for the 2013 / 2014 budget as well as miscellaneous salary adjustments. Salary adjustments include increases for 3.09 percent COLA for 2013 and 2.00 percent for 2014 and a 1.00 percent increase in the Flex Benefit rate for 2013 from the 2012 rate and a 4.00 percent increase from 2013 for the 2014 rate. Technical Adjustments Reduction to Transfer to CIP 2013 – ($5,392,153) 2014 – ($7,392,153) This change item reduces the Roads Construction Transfer consistent with the proposed capital program and resulting financial plan CIP contribution amount.
F - 130

ECONOMIC GROWTH AND BUILT ENVIRONMENT
Road Services Division Capital Budget
As noted previously, RSD maintains, preserves, and operates roads, bridges and related infrastructure in unincorporated King County. The county’s many bridges are an integral part of the road system, as are other components such as sidewalks and pathways, bike lanes, guardrails, drainage and water quality facilities, traffic control equipment, and traffic cameras. The overarching goal of the capital program is to make sound capital investment decisions on existing roadways to provide safe, efficient and environmentally sound transportation facilities for the movement of people, goods and services. The Road Services Division can no longer afford to make capacity improvements and is making very limited mobility investments backed by grants in urban neighborhoods that meet the equity and social justice criteria. Given the current funding constraints, the CIP is developed to fund the highest needs on Tiers 1 and 2 roads and is able to provide very limited support to the lower tiered roadway needs. The CIP now strives to provide safe roads and bridges, to be consistent with federal, state, and county land use policies and plans, and to meet identified transportation needs within the current financial constraints. Also as noted above, in recent years the division has developed a significant structural funding gap. Revenue growth from the unincorporated area property tax levy and gas tax has not keep pace with rising operating costs. In addition, annexations result in a loss of revenue but not a commensurate reduction in costs. The funding for the 2013 / 2014 biennium is over $30 million less than projected in 2012 for the same period. RSD’s available funding falls short of existing needs, despite efforts in recent years to gain further efficiencies, streamline its organizational structure, and adjust business practices. The severity of the funding gap is compounded by the obligation of rural taxpayers to pay debt service on projects that have or will be annexed by cities in the next few years. In 2010, the division completed the SPRS, which sets clear priorities to guide the division as it manages the road system. King County Council Motion 13393 required RSD to develop an implementation plan to deliver its programs and services within the policy framework of SPRS and within currently forecast revenue. SPRS implementation work, facilitated by meetings of an interbranch workgroup, has included the development of a tiered/risk management-based approach to resource allocation and development of new financial policies, which have in turn informed the development of the 2013 / 2014 Proposed Capital Improvement Plan. SPRS Priorities The County has reached the critical point where a decade of voter initiatives and legislative actions combined with ongoing declines in property values and gas tax revenues due to the Great Recession have reduced the funding available to the CIP. Over the next few years, this situation will worsen as revenues are projected to continue to decline or not keep pace with inflation as annexations are completed. The County will retain responsibility for preserving and maintaining bridges, roads, and drainage systems in the rural and flood prone areas of the county. Many of these remaining assets have or will reach the end of their useful life in the next six years and will require significant investment to restore their condition to serviceable levels. To assist in the allocation of scarce resources, the SPRS established priorities, which are indicated below in rank order.
• Meet regulatory requirements and standards • Meet core safety needs, which equates to addressing high accident locations in the CIP • Preserve the existing roadway facilities network • Enhance mobility by facilitating more efficient use of the existing road system • Address roadway capacity needs
F - 131

ECONOMIC GROWTH AND BUILT ENVIRONMENT
As part of SPRS implementation, RSD has developed a tiered service level/risk management-based allocation method that incorporates the SPRS priorities. In 2012, the County began the transition to a tiered system of prioritizing its roadways based upon their function and importance to the local and regional roadway network. The hierarchical tiered system, combined with a risk management approach, will focus resources on providing the most functionally effective road network possible given limited resources. This will be accomplished by first meeting regulatory requirements and core safety needs throughout the road network and then by allocating remaining resources to maintaining and preserving the most vital infrastructure on a cost/benefits basis. Using a system of five tiers, RSD has assigned each road segment to a service level tier using criteria such as traffic volume, projected length of detours or whether the road is considered sole-access, a lifeline route or important in maintaining mobility and regional transportation. Risk Management Considerations As detailed above, RSD has established a hierarchy of roadways, which, combined with a risk management approach, will focus resource allocation on the preservation and maintenance of the most vital components of the existing roadway network. Within this framework, RSD will expand the use of risk management, claims analysis, and tort liability for planning, engineering, and implementation. CIP Implications This proposed six-year plan reflects the tiered/risk management-based resource allocation method by focusing on roadways within the higher tiers of the system and prioritizing the work programmed upon those roadways using risk analysis and the priorities within the approved SPRS. The majority of the projects in the CIP relate to the preservation of assets located on higher tier road segments. With regard to regulatory compliance, the CIP provides ongoing funding for projects that bring the road system into compliance with the Americans with Disabilities Act (ADA) as well as projects to meet permit requirements. Core safety is narrowly defined in the CIP as projects listed on the high accident location/high accident rate segment report, and safety needs prioritization is supported by information collected as part of the Annual Bridge Report and the Transportation Needs Report. Enhancing mobility is primarily accomplished with pedestrian pathway projects that leverage federal grant or other partnership funding. There are no capacity projects contained within the proposed six-year plan. The tiered service level will also have an impact on the engineering solutions to projects on the lower tiers. RSD will review design criteria on every project to ensure that it is appropriate for the need and the roadway. RSD may adjust the design standards or choose engineering alternatives with minimal added risk that offer the opportunity to significantly reduce the cost of the project.
F - 132
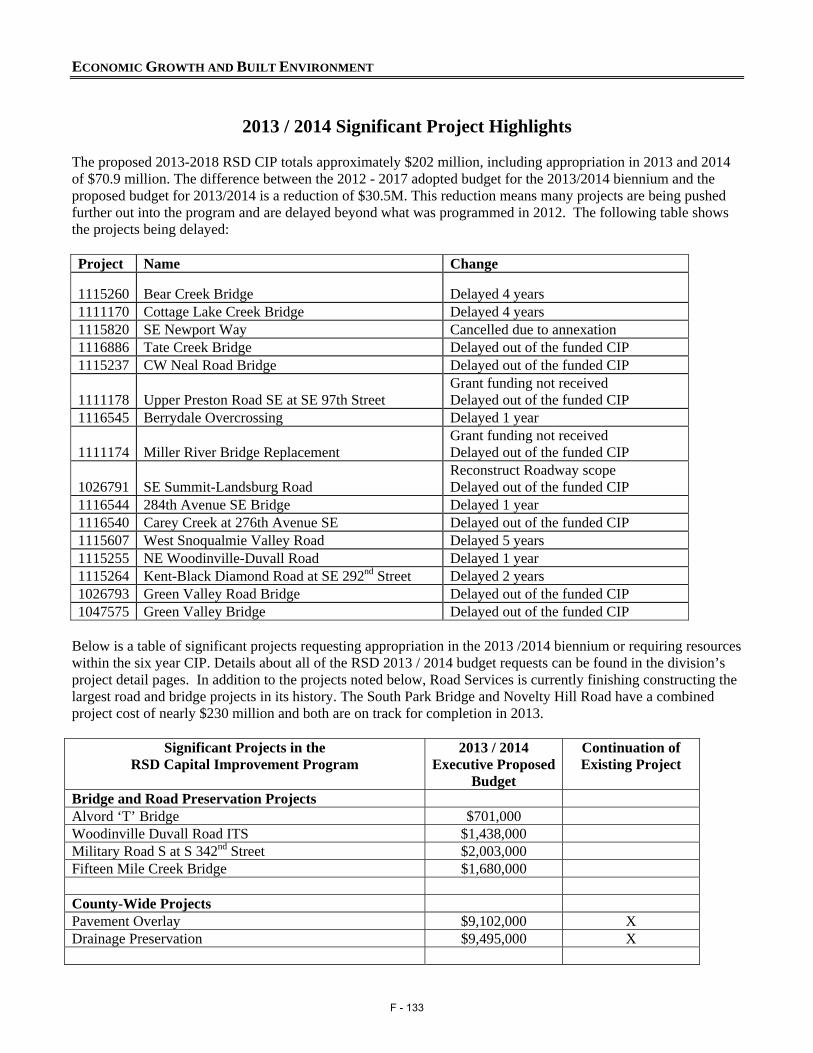
ECONOMIC GROWTH AND BUILT ENVIRONMENT
2013 / 2014 Significant Project Highlights
The proposed 2013-2018 RSD CIP totals approximately $202 million, including appropriation in 2013 and 2014 of $70.9 million. The difference between the 2012 - 2017 adopted budget for the 2013/2014 biennium and the proposed budget for 2013/2014 is a reduction of $30.5M. This reduction means many projects are being pushed further out into the program and are delayed beyond what was programmed in 2012. The following table shows the projects being delayed: Project Name Change
1115260 Bear Creek Bridge Delayed 4 years1111170 Cottage Lake Creek Bridge Delayed 4 years1115820 SE Newport Way Cancelled due to annexation 1116886 Tate Creek Bridge Delayed out of the funded CIP 1115237 CW Neal Road Bridge Delayed out of the funded CIP
1111178 Upper Preston Road SE at SE 97th StreetGrant funding not received Delayed out of the funded CIP
1116545 Berrydale Overcrossing Delayed 1 year
1111174 Miller River Bridge ReplacementGrant funding not received Delayed out of the funded CIP
1026791 SE Summit-Landsburg Road Reconstruct Roadway scope Delayed out of the funded CIP
1116544 284th Avenue SE Bridge Delayed 1 year1116540 Carey Creek at 276th Avenue SE Delayed out of the funded CIP 1115607 West Snoqualmie Valley Road Delayed 5 years 1115255 NE Woodinville-Duvall Road Delayed 1 year1115264 Kent-Black Diamond Road at SE 292nd Street Delayed 2 years1026793 Green Valley Road Bridge Delayed out of the funded CIP 1047575 Green Valley Bridge Delayed out of the funded CIP
Below is a table of significant projects requesting appropriation in the 2013 /2014 biennium or requiring resources within the six year CIP. Details about all of the RSD 2013 / 2014 budget requests can be found in the division’s project detail pages. In addition to the projects noted below, Road Services is currently finishing constructing the largest road and bridge projects in its history. The South Park Bridge and Novelty Hill Road have a combined project cost of nearly $230 million and both are on track for completion in 2013.
Significant Projects in the RSD Capital Improvement Program
2013 / 2014 Executive Proposed
Budget
Continuation of Existing Project
Bridge and Road Preservation Projects Alvord ‘T’ Bridge $701,000 Woodinville Duvall Road ITS $1,438,000 Military Road S at S 342nd Street $2,003,000 Fifteen Mile Creek Bridge $1,680,000 County-Wide Projects Pavement Overlay $9,102,000 X Drainage Preservation $9,495,000 X
F - 133

ECONOMIC GROWTH AND BUILT ENVIRONMENT
Road and Bridge Preservation Projects As discussed in more detail elsewhere in this text and consistent with the SPRS priorities and implementation plan, the majority of the capital projects are regulatory, core safety and preservation projects on high priority / high tier road segments. Alvord ‘T’ Bridge: $701,000 in biennium, $1,292,000 total project cost In 2008, the county applied for grant funding for the replacement of the aged bridge. However, the grant application was denied and the county was directed by WSDOT to examine the feasibility of closing the bridge due to the high cost of replacement weighed against the low traffic volumes and two nearby alternate river crossings (SR 167 and Central Avenue South). This bridge has been posted as “load limited” since the early 1990s. It continues to deteriorate and is approaching the end of its useful life. This CIP project scope involves closure and then removal of this Tier 5 bridge in 2013. Woodinville Duvall Road ITS: $1,438,000 in biennium, $1,438,000 total project cost RSD was successful in getting a grant to design and install intelligent traffic systems including signal interconnect and remote operation and monitoring capability for 11 signals with cameras, variable messaging signs, and road weather information systems. This project will also reduce vehicle collisions and improve safety at an identified high accident location. Military Rd S @ 342nd St: $2,003,000 in biennium, $3,333,500 total project cost This project will design and construct a northbound left turn lane at the intersection and a two way left turn lane between S. 340th St. and S. 342nd St. The High Accident Location (HAL) Report, that compiles accident data and identifies and prioritizes accident location sites throughout the county identified this location as having a history of rear-end collisions in the northbound direction. Fifteen Mile Creek Bridge #1384B: $1,680,000 in biennium, $2,268,000 total project cost This project will replace an existing deficient bridge with a new bridge and reconstruct approaches. This bridge was damaged in the winter 2010 storm and has received funding from the state bridge replacement program. County-Wide Projects Pavement Overlay: $9,102,000 in biennium, $44,409,000 in the six-year plan The County Wide Overlay Program seeks to extend the roadway service life by application of new surface treatments. The SPRS policies resulted in overlay changes in the 2013 / 2014 biennium. By adopting SPRS to the Overlay program, Roads Services will focus on resurfacing Tier 1 and Tier 2 roads and resurface Tiers 3, 4 and 5 roads if additional funds are available. In 2012 Road Services secured $2,080,000 in Federal Highway Administration grant funds offered through a pilot federal preservation program that will help sustain the Tier 1 and 2 roads in current condition through the 2013/2014 biennium. Drainage Preservation: $9,495,000 in biennium, $28,483,000 in the six-year plan The County Wide Drainage Preservation Program seeks to extend the roadway service life and prevent immediate damage by replacing existing substandard or damaged surface water drainage facilities. Projects involving streams also enhance salmon migration and habitat. The Drainage Program complies with SPRS roadway core safety policies by reducing risk to the travelling public related to flooding and scour. In 2013 and 2014 Roads Services secured $3.2 million from the Surface Water Management (SWM) fee to fund unmet drainage needs within county right-of-way.
F - 134

2011 Actual2012
Estimate2013
Proposed2014
Proposed2015
Projected2016
Projected2017
Projected2018
ProjectedBeginning Fund Balance (263,677) (4,460,191) (15,338,392) (8,610,247) (7,623,799) (8,279,904) (8,813,904) (8,751,904)Revenues CIP Contribution 25,612,010 22,987,680 25,000,000 23,000,000 25,000,000 26,000,000 27,000,000 28,000,000 MPS Revenues 1,192,117 700,000 700,000 700,000 700,000 700,000 700,000 700,000 Investment Interest Earnings 5,544 ‐ ‐ ‐ ‐ ‐ ‐ ‐ Bond Proceeds 10,491,123 30,000,000 ‐ ‐ ‐ ‐ ‐ ‐ Grant revenues 37,017,510 28,234,224 12,282,900 6,678,000 6,874,000 2,795,000 2,627,000 766,000 Other One‐time or Contingent Revenues 1,824,570 2,432,895 6,304,895 4,077,895 2,111,895 1,925,000 2,609,000 2,292,000 Total Revenues 76,142,874 84,354,799 44,287,795 34,455,895 34,685,895 31,420,000 32,936,000 31,758,000 Expenditures Planning 150,676 103,000 ‐ ‐ ‐ ‐ ‐ ‐ Preliminary Design ‐ 760,000 449,000 107,000 309,000 202,000 123,000 127,000 Final Design 14,855,217 5,949,000 1,805,000 1,410,000 1,711,000 2,162,000 1,182,000 915,000 Implementation 56,671,708 80,766,995 27,079,920 23,992,138 23,911,497 19,289,117 25,330,425 23,643,126 Close Out ‐ 270,000 370,650 204,447 240,000 476,000 227,000 667,000 Acquisition 898,813 222,000 ‐ 110,000 ‐ 525,000 198,000 ‐ Total Expenditures 72,576,414 88,070,995 29,704,570 25,823,585 26,171,497 22,654,117 27,060,425 25,352,126 Debt Service 7,762,974 7,162,005 7,855,080 7,645,862 9,170,503 9,299,883 5,813,575 5,790,874 Ending Fund Balance (4,460,191) (15,338,392) (8,610,247) (7,623,799) (8,279,904) (8,813,904) (8,751,904) (8,136,904) Designations and Reserves CIP Revenue Verification Adjustments 5,594,241 15,673,449 9,055,204 8,075,204 8,782,204 9,366,205 9,354,204 8,639,206 Programmed Fund Balance Usage (22,707) Unrealized Investment Gains and Losses Equity Adjustments (759,093) Total Reserves & Designations 4,812,442 15,673,449 9,055,204 8,075,204 8,782,204 9,366,205 9,354,204 8,639,206
Ending Undesignated Fund Balance 352,251 335,057 444,957 451,405 502,300 552,301 602,300 502,302
Notes:
2013/2014 Biennial Proposed Financial PlanRenton Maintenance and Road Construction Funds / 3850 and 3860
p y p p y y gof the 2001 and 2002 LTGO bonds.
2. There is an additional debt service payment for the sale of the South Park Bridge bonds in 2012. Payments of $ 2,025,000 per year begin in 2013.
3. Payment for the 2002 LTGO bonds end in 2016.
F - 135

ECONOMIC GROWTH AND BUILT ENVIRONMENT
TRANSIT DIVISION O V E R V I E W Metro Transit operates a fleet of about 1,300 vehicles – including standard and articulated coaches, electric trolleys, and hybrid diesel-electric buses – and serves an annual bus ridership of over 110 million people within a 2,100 square mile area. Metro Transit serves riders who are disabled with accessible fixed route service (all Metro Transit buses have wheelchair lifts or ramps and all routes and trips are accessible) as well as with paratransit van service and a taxi script program. Metro Transit has twice been honored as the best-run large public transportation system in North America and in 2009 was named a bus safety award winner by the American Public Transportation Association.
For over 30 years, Metro Transit has been committed to providing environmentally sustainable and energy-wise transportation. Metro Transit operates the largest publicly owned vanpool program in the country with more than 1,000 vans making more than 3.5 million trips per year. More than 9,000 people use these vans Monday through Friday, eliminating at least 8,000 vehicles from area roads on those days. The state-wide Ridematch system helps commuters form and sustain new carpools and vanpools throughout the states of Washington, Oregon and Idaho by matching names in a computer database. To help meet future needs and ease severe downtown traffic congestion, Metro Transit operates a 1.3-mile tunnel underneath downtown Seattle supporting joint operation of bus and light rail service. Metro Transit is the operator for Sound Transit of LINK light rail. LINK currently operates from SeaTac airport to downtown Seattle and will extend to the University of Washington in 2016. In addition, Metro Transit provides close to 300,000 hours of bus service as part of Sound Transit’s Regional Express Bus Service. Services provided for Sound Transit are 100 percent revenue backed. Metro Transit operations are funded by the Public Transportation Fund, which is comprised of three sub-funds: operating, capital, and fleet replacement. There are several revenue sources for the Public Transportation Fund, but the main revenue source is sales tax. 2013 / 2014 Key Issues The Transit Division’s 2013 / 2014 Proposed Budget carries forward the initiatives and proposals contained within the 2012 / 2013 Adopted Budget, with updates for significant cost drivers and other minor adjustments. Compared to the 2012 / 2013 adopted budget, ridership assumptions and farebox recovery numbers have grown. There are a number of favorable assumption changes; cost assumptions have decreased for diesel fuel, flex benefits, and the Access program. The division has continued to identify efficiencies and is seeing financial savings. There is new, one-time funding from the State. Balancing these favorable adjustments, forecasts for sales tax, property tax, and fare revenue have decreased and the Cost of Living Adjustment (COLA) rate has increased. In aggregate, these changes do not have a significant impact on the financial plan. To reach a sustainable system with current revenue sources, Metro will need to cut 17 percent or 600,000 annual hours of bus service from what was operated in 2011. The need to make these reductions has been postponed until 2014 and 2015 by the adoption of the two-year, $20 Congestion Reduction Charge authorized in 2011 by the
Mission: .
Transit Division
Provide the best possible public transit services to get
people on the bus and improve regional mobility and quality
of life in King County.
F - 136

ECONOMIC GROWTH AND BUILT ENVIRONMENT
Washington State Legislature. Actions taken by the King County Council in August 2011 will result in approximately $26 million in annual revenue over a twenty-four month period starting in June 2012 and extending through May 2014. This funding, combined with existing reserves, is sufficient to maintain current bus service levels until the fall of 2014. At the point that the Congestion Reduction Charge ends in 2014, reserve levels will have been depleted to the point where service reductions will be required unless a new, sustainable funding source is in place. Significant changes in the 2013 / 2014 Proposed Budget include:
• Support for new revenue-backed service, including the First Hill Streetcar (addition of 33.5 FTEs by 2014) and University Link (addition of 12 FTEs by 2014);
• Completion of Rapid Ride in the fall of 2013 will all lines operating in 2014 (addition of 38 FTEs and 42,000 hours of service);
• Partnership with Sound Transit on a Transit Oriented Development project for the existing Metro Northgate Transit Center and Park and Ride properties;
• New grant-backed projects including improvements on Third Avenue and ORCA kiosks in downtown Seattle; and
• Limited new and/or repurposed staffing to address near-term initiatives to support the Strategic Plan in areas such as risk mitigation, energy monitoring, and training.
While there is no fare increase proposal included with the Proposed Budget, Metro Transit is planning on a fare increase proposal for 2014. Revenues from this proposal are not assumed in this budget, but are assumed to be in place by 2015. Fare alternatives are being developed and analyzed that will examine zone fares and low income options. This proposal will be finalized in early 2013 and submitted for Council consideration. Executive Priorities Considered in 2013 / 2014 Business Planning and Budget Development The Executive’s 2013 / 2014 priorities to advance the King County Strategic Plan (KCSP) and inform the 2013 / 2014 Proposed Budget spotlighted consideration of Equity and Social Justice; attainment of a 3 percent efficiency target while maintaining value and service levels; energy investment; and KCSP alignment of agency goals, objectives, and services. • Equity and Social Justice: Consistent with the Regional Transit Task Force recommendations, Metro’s
Strategic Plan for Public Transportation 2012-2021 and Service Guidelines ensure social equity in Metro’s transit system. The strategic plan directs Metro to provide equitable opportunities for people from all areas of King County to access the public transportation system. Under this direction, Metro seeks to facilitate access to jobs, education, and other destinations for all customers, particularly those who have been historically disadvantaged (low income people, students, youth, seniors, people of color, people with disabilities, and others with limited transportation options). In addition, Metro prioritizes social equity when considering how to allocate, maintain, and reduce service from its system, as described in its service guidelines. Metro prioritizes service to concentrations of minority and low-income populations in its All-Day and Peak Network, which establishes service levels for transit corridors throughout King County. Metro also ensures that social equity is a primary consideration in any reduction proposal, making sure that historically disadvantaged populations are not disproportionately impacted. Metro recognizes, through these efforts, that social equity is a primary concern and value for King County’s public transportation system.
• 3 Percent Efficiencies: Metro continues to take steps to improve operational efficiency. The operating
budget request includes more than $4 million in annual, ongoing efficiency savings and reduction of 19 positions. These savings include: automating the paperwork required of mechanics reducing the amount of
F - 137

ECONOMIC GROWTH AND BUILT ENVIRONMENT
redundant data entry, reorganization of Commute Trip Reduction activities, streamlining work processes and supervision/management, implementing time standards for maintenance work, and renegotiating the contracts with paratransit providers and Lean improvements to FLSA and worker’s compensation. In addition, job skill training will also ensure that the workforce is appropriately trained to most efficiently complete their work without incurring job injuries. These changes are in addition to the efficiencies being gained through the implementation in the 2010 / 2011 biennium of the recommendations of the 2009 Performance Audit and the increased productivity that will result through the implementation of the new service guidelines. While these efforts do not have specific budget changes associated with them, they will help contain the costs to provide service. Overall, the cost per rider for transit service is projected to grow at less than three percent year over year for the next six years; this is three percent less than the historical costs of population growth and inflation.
• Energy Investment: Metro continues to improve the energy efficiency and minimize the environmental
impact of it vehicles. By 2016, Metro will have a bus fleet that is 100 percent hybrid or electric. In May 2012, Metro issued a Request for Proposals to replace the electric trolley fleet with a final contract anticipated in early 2013. Metro also plans to replace the existing 30’ diesel buses with hybrid vehicles by 2014. Additional funding is needed in the out years to provide the incremental purchase costs to replace additional fleets in the future with hybrid vehicles. Metro will continue to pursue grant funds to help fund this important element of the King County energy plan. Grant funding will also be pursued for additional electric vehicles in the vanpool and non-revenue vehicle fleets. Metro’s Fleet Engineering group will continue to pursue cost-effective alternatives to reduce the use of diesel fuel, including the grant funded project to evaluate a fast charging electric bus. Metro plans to finalize the contract for this project by the end of 2013. Testing is planned in 2013 and 2014 with development of final recommendations in 2014. Metro has taken a number of steps to position the organization to meet the goals identified in King County’s Energy Plan and to reduce its environmental footprint and improve sustainability. Metro is in the process of developing an agency-wide Sustainability Program, overseen by a new Sustainability Program Coordinator to coordinate sustainability initiatives as part of planning, capital projects, operations, and maintenance through a new Sustainability Plan.
Metro has a number of environmentally sustainable projects in addition to those previously described. Metro’s capital project planning considers operation and energy efficiencies through required life-cycle cost assessment. Metro is also conducting energy audits at its facilities. Grant applications will continue to be submitted to replace existing facilities lighting with lower usage alternatives. Metro is also replacing the HVAC system at North Base, the last of HVAC system replacement projects at four transit bases. Metro will also install both permanent and temporary sub-metering in order to accurately measure energy consumption and provide data for analysis. The green building program continues to support the use of environmentally sustainable operations and maintenance practices consistent with the county’s Green Operations and Maintenance Guidelines.
F - 138

2013/2014 Biennial Budget for
Transit 4640/A46410
Code/ Item# Description Expenditures FTEs * TLTs
FY13
Adopted Budget
2012 / 2013 Adopted Budget 1,315,477,621 3,941.95 27.25AD_012
Adjustments to Adopted Budget
2013 Adjustments to 2012 / 2013 Adopted Budget (648,975,272) (13.66) (8.25)PF_013
Direct Service Changes
2013 Bus Service Adjustments (6,900,290) 40.89 0.00DS_001
ACCESS Service Level Adjustments (2,868,750) 0.00 0.00DS_003
Vanpool and Vanshare Service Expansion 50,407 0.00 0.00DS_004
Link Service Adjustments 996,996 9.00 0.00DS_005
South Lake Union Streetcar Service Adjustment 323,237 1.50 0.00DS_006
First Hill Trolley Support and Operation Adjustments 1,098,680 2.00 6.00DS_007
Rapid Ride Shelter Cleaning and Guard Services 111,779 1.25 0.00DS_008
Revenue Backed Operating Changes (269,263) 0.00 0.00DS_009
Tunnel Personnel to Implement Platooning 202,457 2.00 0.00DS_021
Loaders for Tunnel Operation 356,253 3.00 0.00DS_022
Energy/Sustainability Coordinator 130,473 1.00 0.00DS_041
Radio System Technical Support 33,500 0.00 0.00DS_042
Technical Infrastructure System Support Position 113,379 1.00 0.00DS_043
Lease Park-and-Ride Lot Program 31,618 0.00 0.00DS_061
ACCESS Staff Adjustments 10,480 .25 0.00DS_071
ACCESS Hours of Service Change (727,141) 0.00 0.00DS_072
Rideshare Online Support 99,741 0.00 1.00DS_073
Community Access Transportation (CAT) Service
Expansion
432,414 0.00 0.00DS_074
Expanding Outlets for ORCA Cards with Vending
Machines
158,000 0.00 0.00DS_081
Lost and Found Program Changes (87,107) (.75) 0.00DS_082
Adverse Weather Campaign 100,000 0.00 0.00DS_083
Phase Out of Westlake Customer Operation 253,356 3.00 0.00DS_085
Community Services Area Allocation 19,471 0.00 0.00DS_110
Administrative Service Changes
Administrative Staff Assistant Position Reduction (92,438) (1.00) 0.00AC_011
PeopleSoft and Position Management Activities Staff 102,042 1.00 0.00AC_012
Automated Passenger Counter Staff Reduction (75,413) (.90) 0.00AC_013
Risk Management/Safety Initiative Implementation 112,855 1.00 0.00AC_014
Leave Administration Human Resource Associate TLT 88,905 0.00 1.00AC_016
Fiscal Specialist III 88,905 1.00 0.00AC_017
Information Systems Vendor Maintenance 290,000 0.00 0.00AC_018
Payroll Technician 71,064 1.00 0.00AC_021
Vehicle Maintenance Staffing Adjustment 29,961 0.00 0.00AC_031
Litigation Costs 520,000 0.00 0.00AC_032
TransitEconomic Growth and Built EnvironmentKing County Strategic Plan:
F - 139

2013/2014 Biennial Budget for
Transit 4640/A46410
Code/ Item# Description Expenditures FTEs * TLTs
Environmental Compliance Support 85,000 0.00 0.00AC_041
Eliminate PPM IV Position in Research and
Management Information
(117,552) (1.00) 0.00AC_061
ORCA Autoload Collections 70,028 1.00 0.00AC_081
Central Rate Changes
General Fund Overhead Adjustment 326,012 0.00 0.00CR_005
KCIT Operations and Maintenance Charge (526,598) 0.00 0.00CR_007
KCIT Infrastructure Charge (4,367,821) 0.00 0.00CR_008
Geographic Information Systems Charge (3,239) 0.00 0.00CR_009
KCIT Operations and Maintenance Charge (1,152,230) 0.00 0.00CR_010
KCIT Telecommunications Services 28,884 0.00 0.00CR_011
KCIT Telecommunications Overhead (14,028) 0.00 0.00CR_012
Motor Pool Rate Adjustment (3,833) 0.00 0.00CR_013
Insurance Charges (242,617) 0.00 0.00CR_015
Prosecuting Attorney Office Civil Division Charge (681,192) 0.00 0.00CR_020
Debt Service Adjustment 2,497,464 0.00 0.00CR_021
Long Term Leases 556,632 0.00 0.00CR_022
Financial Services Charge (956,837) 0.00 0.00CR_025
Long Term General Obligation Debt Insurance (19,776) 0.00 0.00CR_033
Property Services-Lease Administration Fee 24,576 0.00 0.00CR_036
Facilities Management Strategic Initiative Fee (525) 0.00 0.00CR_037
Major Maintenance Repair Fund 8,661 0.00 0.00CR_038
Countywide Strategic Technology Projects (770,951) 0.00 0.00CR_046
Business Resource Center 175,453 0.00 0.00CR_048
KCIT Reorganization Transfer (7,133,265) 0.00 0.00CR_050
KCIT Application Services 6,700,680 0.00 0.00CR_051
KCIT Workstation Services 4,378,632 0.00 0.00CR_052
KCIT Business Analysis 251,004 0.00 0.00CR_056
KCIT Countywide Services 1,030,968 0.00 0.00CR_057
KCIT Tech Service Rebate (512,784) 0.00 0.00CR_058
Technical Adjustments
Technical Adjustments for Various Operating Costs 1,128,702 0.00 0.00TA_002
COLA and Pension Adjustments for Those Not Funded 846,924 0.00 0.00TA_003
Utilities Adjustment 404,378 0.00 0.00TA_007
Staffing Changes from Capital to Operating 2,078,646 1.00 0.00TA_009
Changes to Capitalization Policy 595,364 0.00 0.00TA_011
Technical Correction to Budget System Data 10,740 0.00 0.00TA_015
Revenue Adjustments - $51,900,814 Revenue 0 0.00 0.00TA_050
Final Revenue Adjustments - $912,334 Revenue 0 0.00 0.00TA_051
Transfer of Debt Service Cost 31,248 0.00 0.00TA_097
Long Term Lease Rebate (1,166,151) 0.00 0.00TA_099
Transfer Project Program Manager from KCIT 130,473 1.00 0.00TA_100
664,998,989 3,996.53 27.00FY13 Subtotal
TransitEconomic Growth and Built EnvironmentKing County Strategic Plan:
F - 140

2013/2014 Biennial Budget for
Transit 4640/A46410
Code/ Item# Description Expenditures FTEs * TLTs
FY14
Adjustments to Adopted Budget
Adjustments to Adopted Budget 683,921,503 0.00 0.00PF_014
Direct Service Changes
2013 Bus Service Adjustments (6,348,173) 12.03 0.00DS_001
2014 Proposed Bus Service (5,555,176) (53.12) 0.00DS_002
ACCESS Service Level Adjustments (569,840) 0.00 0.00DS_003
Vanpool and Vanshare Service Expansion 411,365 3.00 0.00DS_004
Link Service Adjustments 1,174,594 0.00 0.00DS_005
South lake Union Streetcar Service Adjustment 391,849 .50 0.00DS_006
First Hill Trolley Support and Operation Adjustments 3,138,300 31.17 (6.00)DS_007
Rapid Ride Shelter Cleaning and Guard Services 167,351 .75 0.00DS_008
Revenue Backed Operating Changes (305,932) 0.00 0.00DS_009
Tunnel Personnel to Implement Platooning 202,457 0.00 0.00DS_021
Loaders for Tunnel Operation 358,811 0.00 0.00DS_022
Energy/Sustainability Coordinator 130,473 0.00 0.00DS_041
Radio System Technical Support 33,500 0.00 0.00DS_042
Technical Infrastructure System Support Position 113,379 0.00 0.00DS_043
Lease Lot Park-and-Ride Program 36,902 0.00 0.00DS_061
ACCESS Staff Adjustments 10,480 0.00 0.00DS_071
ACCESS Hours of Service Change (1,407,751) 0.00 0.00DS_072
Rideshare On-Line Support 99,741 .25 0.00DS_073
Community Access Transportation (CAT) Service
Expansion
895,504 0.00 0.00DS_074
Expanding Outlets for ORCA Cards with Vending
Machines
216,400 0.00 0.00DS_081
Lost and Found Program Changes (109,365) (.25) 0.00DS_082
Adverse Weather Campaign 130,000 0.00 0.00DS_083
Phase Out of Westlake Customer Operation 0 (3.00) 0.00DS_085
Community Services Area Allocation 20,000 0.00 0.00DS_110
Administrative Service Changes
Administrative Staff Assistant Position Reduction (92,438) 0.00 0.00AC_011
PeopleSoft and Position Management Activities Staff 104,103 0.00 0.00AC_012
Automated Passenger Counter Staff Reduction (75,413) 0.00 0.00AC_013
Risk Management/Safety Initiative Implementation 117,552 0.00 0.00AC_014
Safety Training Coordinator (23,966) 1.00 (1.00)AC_015
Leave Administration Human Resource Associate TLT 0 0.00 (1.00)AC_016
Fiscal Specialist III 90,651 0.00 0.00AC_017
Information Systems Vendor Maintenance 416,900 0.00 0.00AC_018
Payroll Technician 66,971 0.00 0.00AC_021
Vehicle Maintenance Staffing Adjustment 29,961 0.00 0.00AC_031
Litigation Costs 640,000 0.00 0.00AC_032
TransitEconomic Growth and Built EnvironmentKing County Strategic Plan:
F - 141

2013/2014 Biennial Budget for
Transit 4640/A46410
Code/ Item# Description Expenditures FTEs * TLTs
Environmental Compliance Support 85,000 0.00 0.00AC_041
Eliminate PPM IV Position in Research and
Management Information
(117,552) 0.00 0.00AC_061
ORCA Autoload Collections 70,028 0.00 0.00AC_081
Central Rate Changes
2014 Central Rate Adjustments 3,958,395 0.00 0.00CR_099
Technical Adjustments
Technical Adjustments for Various Operating Costs 2,462,000 0.00 0.00TA_002
COLA and Pension Adjustments for Those Not Funded 1,198,193 0.00 0.00TA_003
Utilities Adjustment 404,378 0.00 0.00TA_007
Staffing Changes from Capital to Operating 1,474,866 (1.00) 0.00TA_009
Changes to Capitalization Policy 600,618 0.00 0.00TA_011
Technical Correction to Budget System Data 10,553 0.00 0.00TA_015
Revenue Adjustments - $12,956,499 Revenue 0 0.00 0.00TA_050
Final Revenue Adjustments - ($1,928,486) Revenue 0 0.00 0.00TA_051
Transfer of Debt Service Cost 31,248 0.00 0.00TA_097
Long Term Lease Rebate (1,166,150) 0.00 0.00TA_099
Transfer Project Program Manager from KCIT 130,473 0.00 0.00TA_100
687,572,743 3,987.86 19.00FY14 Subtotal
1,352,571,732 19.00
* FTEs for the 2013 Budget and 2013/2014 Biennial Budget do not include temporary positions or overtime. The 2013/2014
Biennial Budget reflects the maximum number of FTEs during the biennium.
** The 2013/2014 Biennial Budget reflects the total expenditures for the biennium.
2013/2014 Biennial Budget 3,996.53
TransitEconomic Growth and Built EnvironmentKing County Strategic Plan:
F - 142

ECONOMIC GROWTH AND BUILT ENVIRONMENT
Transit Operating Budget
P R O G R A M H I G H L I G H T S The total 2013 / 2014 Proposed budget for the Transit Division is $1,352,571,732 with funding for 3,996.53 FTEs and 19.00 TLTs. This proposed 2013 / 2014 budget represents a 6 percent decrease from the 2012 / 2013 Adopted Budget. Adjustments to Adopted Budget Adjustments to the 2012 / 2013 Adopted Biennial Budget in 2013 and 2014 Pro Forma include removing the 2012 portion of the budget to create a baseline for the 2013 / 2014 budget as well as miscellaneous salary adjustments. Salary adjustments include increases for 3.09 percent COLA for 2013 and 2.00 percent for 2014 and a 1.00 percent increase in the Flex Benefit rate for 2013 from the 2012 rate and a 4.00 percent increase from 2013 for the 2014 rate. Direct Service Changes 2013 Bus Service Adjustments 2013 – ($6,900,290) / 40.89 FTEs 2014 – ($6,348,173) / 12.03 FTEs This proposal updates bus service levels from the 3,888,932 hours contained in the 2013 Adopted Budget to 3,903,348, with a 2014 carryforward of 3,932,101. This package includes a net increase in budgeted service hours in 2013 of 14,416 (including an increase in King County bus service of 40,036 hours, a reduction in Dial-a-Ride Transit (DART) service of 23,989 hours, and a reduction in Sound Transit bus service of 1,630 hours). The increase in King County service is mostly due to increases in Transit Now Partnerships (11,621 hours) and the extension of current mitigation services (10,974 hours). The 2013 proposed service level is projected to increase operators by 22.29 FTEs, mechanics by 10.60 FTEs, utility service workers by 3.00 FTE, sheet metal workers by 2.00 FTE, painters by 1.00 FTE and equipment service workers by 2.00 FTEs. The 2014 carryforward of service is projected to result in a few additional staffing changes including increases to operators (15.53 FTEs) and decreases in mechanics (3.50 FTE). The 2013 increase in service is projected to increase ridership by 257,000 and fares by $296,000 over the 2013 adopted budget. In 2014 before any other service changes, the annualized service level is projected to increase ridership by 691,000 and fares by $798,000. The impact of changing service levels on ridership and fares is included in TA_050 Revenue Adjustments. The impacts of changes in Transit Now Partnership service and mitigation service are calculated separately for the effected revenue accounts. 2014 Proposed Bus Service 2014 – ($5,555,176) / (53.12) FTE This proposal reduces bus service levels for 2014 from a carryforward total of 3,932,101 budget hours to 3,856,696 budget hours. With the ending of the Congestion Reduction Charge and without a new revenue source, this reduction in service is the first step toward reaching a sustainable level of service. In this package, budgeted service hours in 2014 are projected to decrease by 75,406, including a decrease in King County bus service of 79,783 hours, an increase in DART service of 4,342 hours and an increase in Sound Transit bus service of 314 hours. The decrease in King County service is due to a proposed reduction at the fall service change of 150,000 annual hours. Additional reductions of 450,000 hours would have to be taken in 2015 to reach a sustainable service level. In addition, in 2014 Transit Now Partnerships increase by 14,000 annual hours and mitigation service declines by 57,000 annual hours. The proposed reduction in service is projected to reduce operators by
F - 143
ECONOMIC GROWTH AND BUILT ENVIRONMENT
46.12 FTEs, mechanics by 5.00 FTEs, utility service workers by 1.00 FTE, and sheet metal workers by 1.00 FTE. The proposed reduction in 2014 service, including reduced mitigation service, is projected to reduce 2014 ridership by 1,200,000 and fares by $1,386,000. The annualized impact will be roughly four times as much, 4,800,000 riders and $5.5 million in fares. The ultimate reduction of 600,000 hours to obtain a sustainable system will have roughly four times this impact. ACCESS Service Level Adjustments 2013 – ($2,868,750) 2014 – ($569,840) This change item updates ACCESS services for projected changes in ridership and unit costs. Current projections for ACCESS ridership in 2013 show a decline from 1,258,610 to 1,207,860 riders. The decrease of 50,750 riders is projected to reduce contractor service hours by 36,951, resulting in an expenditure reduction of roughly $2,274,000. In addition to fewer hours of service, the average cost of ACCESS fuel is decreasing, resulting in additional savings. In 2014, ridership is projected to increase to 1,222,152, increasing contractor service hours by 7,877 when compared to the current projection for 2013. Compared to the current 2013 projection, the 2014 cost of contracted service increases by roughly $2,128,000. A reduction in the cost of fuel per gallon reduces projected expense by around $235,000. The net impact is an increase of about $2,094,000. Because starting point for the proposed budget is set at the 2013 adopted level, the net change is a reduction of $569,840. Reductions in ridership will have a corresponding negative impact on fares collected, billing to Medicaid, and reimbursement from Sound Transit in the amount of $1.012 million in 2013 and $1.045 million in 2014. Vanpool and Vanshare Service Expansion 2013 – $50,407 2014 – $411,365 / 3.0 FTE This proposal supports cost growth for existing commuter van service and funds an increase in service of 60 vanpool groups and 12 vanshare groups in 2013 and the same amount in 2014. Based on current cost assumptions, the change will allow the vanpool program to expand to 1,340 vans in operation and 171 vanshare vehicles in 2014. The estimate for growth may be conservative in that it is less than what occurred in 2011 (an increase of 154 vanpool groups) and what is projected for 2012 (an increase of 120 to 130 vanpool groups), although it is greater than the historic annual growth. Ridership is expected to increase eight percent in 2013 and five percent in 2014 to just below 4 million annual passenger trips. The growth assumed for 2014 does not include any increases in service as a result of decreasing transit services. Compared to 2012, vanpool and vanshare revenues will increase around five percent due to increased ridership. In 2014, vanpool fares are currently projected to increase by around eight percent in order to meet vanpool funding requirements. By ordinance, vanpool fares are required to pay 100 percent of all direct operating and capital costs as well as 25 percent of all indirect expense. Link Service Adjustments 2013 – $996,996 / 9.0 FTE 2014 – $1,174,594 This change item funds Metro Transit Rail Section’s (Rail) operations. Rail operates Central Link and Airport Link, with all activities performed under contract with Sound Transit being fully reimbursed. Sound Transit is also constructing the University Link (U-Link) light rail extension, which is expected to be complete in 2016. U-Link will connect the University of Washington and Capitol Hill to downtown Seattle. In addition, Sound Transit is extending light rail south from Sea-Tac Airport to South 200th Street. The South 200th Street Link extension is also expected to be complete in 2016. Consistent with these operations, this change item makes increases to various operational costs for existing operations and funds additional staff to support new Link service. Staff changes in 2013 include the addition of two facility electricians, two facility mechanics, four Rail Supervisory Control and Data Acquisition (SCADA) system specialists; the conversion of two TLT ground specialist positions to permanent positions, and the delay in hiring of an electro-mechanic. In 2014, staffing adds include and electro-
F - 144

ECONOMIC GROWTH AND BUILT ENVIRONMENT
mechanic, a facility electrician, and a facility mechanic. Some of the 2014 staffing additions occur mid-year; when annualized this decision package results in the addition of 12 positions. South Lake Union Streetcar Service Adjustment 2013 – $323,237 / 1.5 FTE 2014 – $391,849 / 0.5 FTE This proposal makes adjustments to support Transit’s operation of the South Lake Union Streetcar (SLUSC) Operation, including changes to peak service, nighttime service, and administrative support. Currently, a third streetcar is being operated during peak time service. This request proposes that this service is continued in 2013 / 2014, which will require one full time streetcar operator, increased labor for maintenance, and additional spare parts. In addition, the streetcar facility operates 20 hours per day on Monday through Saturday, with slightly reduced service hours on Sunday. After almost 5 years in service, there is a crucial need to have day and night supervision to efficiently and effectively run the streetcar operation. In 2013, an operations and maintenance supervisor is proposed to be on special duty as a chief to provide supervision in the evening hours. In 2014, a transit chief position is proposed to be added to provide night time supervision for both SLUSC and First Hill Streetcar (FHSC). Finally, as administrative responsibilities have increased for SLUSC, this change converts an 0.5 FTE administrative specialist position to one full FTE in 2013. The City of Seattle is 100 percent responsible for special requests and for additional service not covered under the intergovernmental agreement. First Hill Trolley Support and Operation Adjustments 2013 – $1,098,680 / 2.00 FTE / 6.00 TLT 2014 – $3,138,300 / 31.17 FTE / (6.00) TLT This item provides budget for Transit activities associated with the First Hill Streetcar in 2013 / 2014. The City of Seattle is constructing the First Hill Streetcar project, which is scheduled to start operating in early 2013 to serve Capitol Hill, First Hill and the International District with connections to Sound Transit and Metro Transit bus systems. It is anticipated that the streetcar will be operated by King County under a fully reimbursable contract. Transit anticipates hiring one rail chief/rail activation manager and four full time streetcar maintainers on October 1, 2013. The remaining 28.5 FTEs to be hired between January 1, 2014 and March 1, 2014 include a rail chief, 4 streetcar operations and maintenance supervisors, a streetcar operations and maintenance supervisor/train controller, 22 streetcar operators, and an administrative specialist. Some of the 2014 positions are mid-year additions; when annualized this decision package results in the addition of 33.5 FTEs. In addition, this request includes six term limited temporary positions in 2013 to support the construction of the streetcar route. This change also moves appropriation authority from 2012 to 2013, due to construction delays. Rapid Ride Shelter Cleaning and Guard Services 2013 – $111,779 / 1.25 FTE 2014 – $167,351 / 0.75 FTE This proposal supports expanding shelter cleaning efforts at Rapid Ride shelters as the service expands in 2012 and 2013. The adjustment includes an increase in cleaning materials and adds 2 FTE utility laborers. One position will start in January 2013 and the second will start in October 2013. Revenue Backed Operating Changes 2013 – ($269,263) 2014 – ($305,932) This adjustment requests changes to budgeted accounts that are revenue backed by grant awards. Most Transit grants are reimbursable and expense and revenue need to be adjusted as grant awards are satisfied and/or obtained. Because grant projects are zero-based and time-limited, this proposal adjusts expense budgets to reflect the anticipated expenditure level. Grant revenue adjustments are shown in TA_050 Revenue Adjustments.
F - 145
ECONOMIC GROWTH AND BUILT ENVIRONMENT
Tunnel Personnel to Implement Platooning 2013 – $202,457 / 2.00 FTE 2014 – $202,457 This proposal is part of a two year pilot program, adding two service quality supervisors to support the platooning of coaches through the Downtown Seattle Transit Tunnel and provide oversight of rear door “loader” positions. The Ride Free Area will be eliminated in Sept 2012 at which time riders will be required to board and make fare payments through the front door. It is expected that this will increase the length of time that the coach is stopped at the curb (dwell time), which will increase the cost of bus operation, reduce the number of coaches that can pass through the tunnel per hour, and increase trip time for riders. Platooning involves controlling the entrance of buses into the tunnel so that coaches that stop at the far end of each station enter first, so that routes serving the second bays at a station do not get stuck behind buses serving the first stops. Platooning is one of the ways that Transit is attempting to mitigate such dwell time impacts. Two FTEs are proposed: one FTE will be responsible for platooning buses at Convention Place Station while the other will located at the International District Station. These positions will also be responsible for the portable fare transaction processors (PFTPs) that the rear door “loaders” will use. Loaders for Tunnel Operation 2013 – $356,253 / 3.00 FTE 2014 – $358,811 This proposal is part of a two year pilot program, adding rear door “loader” positions to reduce the dwell time of coaches in the Downtown Seattle Transit Tunnel (see DS_021 Tunnel Personnel to Implement Platooning for more information). Ten rear door “loaders” will have PFTPs, allowing riders to pay their fare while entering at the rear door. This work will require the equivalent of three bus operator FTEs plus overtime. Loaders will be employed in the tunnel during the weekday afternoon peak service when dwell time would be most impacted. Some reduction in fare evasion may occur as a result of this pilot. Energy/Sustainability Coordinator 2013 – $130,473 / 1.00 FTE 2014 – $130,473 This change item adds an energy/sustainability coordinator to the Transit Division. In order to advance Metro and King County strategic plan goals of environmental sustainability, it is critical that Metro has in place a strong program and framework to coordinate and carry out the objectives and strategies as put forth in the KCSP, the Energy Plan, and the Metro Stategic Plan. The request includes additional budget for this position but no additional FTE authority is needed because Transit will repurpose a position currently loaned-out to the capital program in an area where work has declined due to changing definitions of capital projects and capital thresholds. Radio System Technical Support 2013 – $33,500 2014 – $33,500 This proposal adds funding for the annual technical support of the new 700 MHz radio system that is used to communicate with the buses. The current contract with Motorola is focused on providing software support with limited hardware maintenance support. This contract expands the support for hardware maintenance. Power and Facilities will be performing most of the maintenance work and this support, in conjunction with existing contracts, will provide the technical knowledge to keep the system in good repair.
F - 146

ECONOMIC GROWTH AND BUILT ENVIRONMENT
Technical Infrastructure System Support Position 2013 – $113,379 / 1.00 FTE 2014 – $113,379 This item reassigns a radio technician that currently supports the capital program to the operating program. Projects such as Rapid Ride Corridor and Station installations and new parking garages and transit centers have brought both an increase in numbers as well as complexity for electronic devices. The reassignment of this position to operating will support the ongoing work associated with these devices, providing for proper maintenance of the additional infrastructure, enhancing equipment and system reliability, and enabling more rapid repair when required. Leased Park-and-Ride Lot Program 2013 – $31,618 2014 – $36,902 This adjustment aligns the budget with current commitments for the Leased Park-and-Ride Lot program plus a modest expansion. The current budget for this program is less than commitments and additional anticipated program costs include small expansion of the Leased Park-and-Ride Lot program to accommodate growing Park-and-Ride demand and to respond to changes in transit service. This change will allow for the opening of two new leased lots per year near permanent park-and-ride lots that are at full capacity. ACCESS Staff Adjustments 2013 – $10,480 / 0.25 FTE 2014 – $10,480 This proposal revises positions in the ACCESS program to better match workload. Specifically, a transportation planner position is increased from 0.75 FTE to1.0 FTE in response to increasing workload on scheduling, dispatch, and reporting software and a customer service coordinator position is eliminated and replaced with an administrative specialist consistent with the tasks typically performed by this position. ACCESS Hours of Service Change 2013 – ($727,141) 2014 – ($1,407,751) This item implements a change to ACCESS hours to provide service that is more consistent with regular fixed route service hours. The 2009 Performance Audit of Transit conducted by the King County Auditor’s Office identified ACCESS services hours in excess of the Americans with Disabilities Act requirements as a potential area for cost savings. This package implements a policy decision to reduce the hourly boundaries to more closely align with fixed route service before 9:00 a.m. and after 6:00 p.m. This change will result in a reduction of approximately 4 percent in the number of service hours, number of rides, and operating costs. However, it is estimated that only approximately 113 customers, or less than 1 percent of ACCESS riders, will be impacted by this change. These riders will face the same public transportation limitations that fixed route bus riders face. Rideshare On-Line Support 2013 – $99,741 / 1.00 TLT 2014 – $99,741 This proposal provides funding for a TLT to support RideshareOnline.com and for related promotional activities and materials. The Washington State Department of Transportation (WSDOT) manages and owns RideshareOnline.com and partners with King County Metro to administer the system for the users in Washington, Oregon, and Idaho. King County Metro also provides administrative and project management support to WDSOT for system enhancements, vendor relations, and partner contracting. A TLT was hired in 2012 to provide administrative support and backfill duties for staff managing RideshareOnline.com as the service expanded from
F - 147

ECONOMIC GROWTH AND BUILT ENVIRONMENT
including Washington and Idaho to include Oregon. The TLT provides technical customer service to partner agencies, helps manage access to the system, participates in maintaining user accounts, supports employer training review reports and updates database records. Annual partner payments cover the cost of this proposal as well as contribute to other system administrative costs. Revenue related to this request is included in revenue adjustment change item. Community Access Transportation (CAT) Service Expansion 2013 – $432,414 2014 – $895,504 This proposal supports expansion of the Community Access Transportation (CAT) program as well as increased maintenance and operating costs of existing service. The 2009 Performance Audit of Transit conducted by the King County Auditor’s Office recognized that the CAT program was a lower cost alternative to Access Service and recommended program expansion. The community shuttles run by the CAT program are a partnership between the County and community organizations, nonprofits and city governments. At the end of 2012, 116 CAT vehicles will be in operation. This proposal supports the addition of 10 vehicles in 2013 and another 14 vehicles in 2014. The CAT program will expand to serve new areas in East and South King County that have high Access ridership, such as Bellevue, Redmond, Auburn and other suburban areas. Priority will be given to projects designed to include low-income, cultural minorities and limited English speaking communities. Funding for CAT program expansion has been provided by Washington State. Expanding Outlets for ORCA Cards with Vending Machines 2013 – $158,000 2014 – $216,400 This package funds the operating and maintenance fees associated with purchasing and installing eleven ORCA card vending machines. The units are being purchased through a grant funded capital project. Three of the eleven units will be installed by the end of 2012 with the remaining eight units installed by the end of 2013. Locations for the units include transit, community and senior centers. Metro will contract with Sound Transit to manage and service the vending units. Operating costs include regular maintenance, repairs, armored car services and bank card fees. Lost and Found Program Changes 2013 – ($87,107) / (0.75) FTE 2014 – ($109,365) / (0.25) FTE This proposal shifts the storage and return function associated with the Transit Lost and Found Program from internal resources to an external provider. Lost and found items are currently collected and transported to the King Street Center where they are stored and either returned to their owner or transferred to surplus. This package reduces the funds associated with operating the in-house service and eliminates a customer information specialist. Starting in second quarter 2013, lost and found services will be handled by a single outside provider. King County Surplus has been notified of the potential change. Adverse Weather Campaign 2013 – $100,000 2014 – $130,000 This proposal provides dedicated funding for an annual adverse weather media campaign. Funding is provided for the purchase of air time, to update the adverse weather video, to update the annual snow guide, and for inserts in local utility bills and small overlay stickers for local newspapers. A primary goal of the media campaign is to inform the public of the “transit alerts” system that provides current information on the operation of bus routes during weather events, allowing the public to make informed transportation decisions. Since the media campaign was implemented, more than 54,000 subscriptions have been established for the “transit alerts” system and the number of weather related service complaints has decreased significantly. The use of different media will help to reach a variety of audiences.
F - 148
ECONOMIC GROWTH AND BUILT ENVIRONMENT
Phase Out of Westlake Customer Operation 2013 – $253,356 / 3.00 FTE 2014 – $0 / (3.00) FTE When the 2012 / 2013 budget was adopted, it included closure of the Westlake Customer Stop in early 2013. The timing for this proposal was identified prior to the decision to eliminate the Ride Free Area. Elimination of the Ride Free Area has resulted in a need to provide more opportunities for customers to purchase fare media. This proposal continues operation of the Westlake Customer Stop when sales are highest (the last and first four days of the month). During the remainder of the month, staff will perform ORCA outreach events throughout the County at community centers, senior centers, service agencies, schools, institutions and other venues where there is both a high volume of foot traffic and easy access to transit. Customers in these communities will have increased access to information about ORCA and transit services and will receive personal assistance as they buy ORCA fare media. Community Services Area Allocation Adjustment 2013 – $19,471 2014 – $20,000 This proposed change reflects the Transit share of the allocation model to fund the implementation of the Community Services Area (CSA) program. The CSA program, adopted by the Council in 2011, replaces the former Unincorporated Area Councils (UAC) approach to fostering community involvement in the unincorporated areas. The CSA program will be funded per the former UAC allocation model of which Transit is responsible for 3.2 percent. Administrative Service Changes Administrative Staff Assistant Position Reduction 2013 – ($92,438) / (1.00) FTE 2014 – ($92,438) This request is to eliminate an administrative staff assistant currently in Transit Human Resources. This position previously was responsible for providing administrative and general office support to the Labor Relations and Disability staff in Transit Human Resources. The volume of this work has diminished or changed over time. The personnel in this position is currently performing an “otherwise assigned” duty assignment that will end 12/31/2012. Administrative support will be provided by the current administrative specialist. PeopleSoft and Position Management Activities Staff 2013 – $102,042 / 1.00 FTE 2014 – $104,103 This change item creates a new project/program manager position to administer position management and special duty modules within PeopleSoft as well as to create customized PeopleSoft queries to meet reporting needs for Human Resources, Finance and Payroll staff; to provide Transit guidance and coordination for payroll staff; and to develop, design and implement training materials and presentations. The newly implemented PeopleSoft system includes a number of data management activities that were not previously required. These activities include managing position data and special duty assignments to ensure that personnel activity is processed both timely and correctly. Managing position data is a new body of work for Transit that was not previously required. Other areas of county government purchase this service from central human resources staff, but based on its volume, Transit has been asked to manage this workload internal to Transit. Managing special duty assignments has been a Transit responsibility; however, the requirements for entering and maintaining this data in the system have increased. Because individual’s pay is based on accurate and timely position and special duty data processing, this has become a priority work item for the Transit HR group. The Business Resource Center and Human Resources Division were involved in the decision to transfer the position data management activities to Transit.
F - 149

ECONOMIC GROWTH AND BUILT ENVIRONMENT
Automated Passenger Counter Staff Reduction 2013 – ($75,413) / (0.90) FTE 2014 – ($75,413) This proposal eliminates a partial 0.9 FTE position currently performing manual data retrieval for the legacy Automated Passenger Counter (APC) system. This position currently visits Metro bases during overnight hours to retrieve APC data from individual coaches and then loads that data into the APC system. With the implementation of the new On Board Systems on Metro coaches, passenger counting will be downloaded wirelessly into the new system and the need for this manual process will end. Risk Management/Safety Initiative Implementation 2013 – $112,855 / 1.00 FTE 2014 – $117,552 This change item contains a new position and funding to support implementation of a risk management and safety initiative. Metro Transit pays in excess of $13 million annually for Risk Management and insurance. In order to reduce insurance costs, Metro Transit needs to reduce its exposure to losses in all categories but particularly for those events that are either of a high cost or a high frequency. To achieve this goal, a culture of safety needs to be developed and maintained throughout the organization. Consistent with these goals, Metro Transit is requesting the addition of a loss control/risk coordinator. The loss control/risk coordinator will audit existing policies/procedures, identify and develop methods to report metrics that demonstrate how groups are managing hazards in their workplace/area of responsibility, propose new/revised policies/procedures, and audit and review training programs. The impact of the position and associated activities will be measured and reported. Safety Training Coordinator 2014 – ($23,966) / 1.00 FTE / (1.00) TLT This proposal involves changing a term limited temporary position associated with spill response training into a permanent position. During 2012 and 2013, Transit has been using a TLT to develop and provide mandated spill response training. In 2014, Metro Transit is requesting that this temporary position be made permanent in order to address increasing federal and state mandated training. In addition to addressing mandated training, this position would also be responsible to ensure that appropriate training is provided to employees on policies and procedures to ensure that work processes are completed in a safe manner. This position will also develop procedures for the accurate recording and tracking of employee training, will participate in regularly scheduled safety meetings providing briefings and updates on changing requirements, will participate in the annual safety audit, and will analyze performance measures to identify areas where training could positively impact performance. In combination with the loss control/risk coordinator, this position will help reinforce a culture of safety at Metro Transit that is intended to keep employees and customers safe as well as reduce risk and insurance costs. Leave Administration/Human Resource Associate TLT 2013 – $88,905 / 1.00 TLT 2014 – $0 / (1.00) TLT This request is designed to reduce costs by providing an additional resource to administer leave programs such as Family Medical Leave (FML), unemployment insurance claims, termination tracking, attendance management and FML 12 week letters and other activities identified in the recently completed worker’s compensation lean process review. These activities could reduce worker’s compensation and other costs if administered consistently and reliably. A one-year, term limited temporary is being requested for 2013.
F - 150

ECONOMIC GROWTH AND BUILT ENVIRONMENT
Fiscal Specialist III 2013 – $88,905 / 1.00 FTE 2014 – $90,651 This proposal requests the addition of a fiscal specialist to perform accounting/finance activities newly assigned to Transit. Metro Transit has historically had a small number of staff associated with general accounting/fiscal accounting activities. With the implementation of the Oracle E-Business Suite (EBS) financial system, a number of activities previously performed by central agencies are now the responsibility of Transit. Activities that have shifted to Metro Transit include processing of miscellaneous receipts and bank deposit preparation, reconciliation of Transit’s bank accounts (7 accounts), creating project hierarchies and awards, monitoring accounts payable and procurement activity to ensure that payments are being processed, preparing recurring payment requests, processing miscellaneous transactions to correct project/grant coding errors and make adjustments, preparing and tracking miscellaneous transactions associated with interfund payments, processing of fixed asset capitalizations along with reporting and account reconciliations between the project/grants and general ledger modules. Failure to appropriately perform these accounting related tasks could result in audit findings. Information Systems Vendor Maintenance 2013 – $290,000 2014 – $416,900 This proposal funds the increased vendor costs for various newly implemented software projects. Vendor maintenance helps to ensure continuous operation of essential software services used internally by Transit staff and externally by Transit customers. Payroll Technician 2013 – $71,064 / 1.00 FTE 2014 – $66,971 This change item adds a fiscal specialist to handle the increased workload resulting from the implementation of the new PeopleSoft and EBS systems and to provide backup for the existing positions. The processing of unscheduled overtime was recently reassigned from the Finance and Business Operations Division to Transit. This additional work comprises approximately 4 hours per day of data entry to support seven operating bases. Due to their current workload and changes in payroll processing deadlines to support the ABT transition, the existing two Transit timekeepers are unable to absorb this additional work. In addition to the issue of unscheduled overtime, the two Transit timekeepers must work mandatory overtime in order to complete their payroll processing due to the volume of work required to support approximately 3,000 Transit operations employees. Currently, the timekeepers complete their work within minutes of the processing deadlines, with no room for error. A third timekeeper will also resolve the problem of backfill for the current timekeepers during vacations, planned absences, holiday workweeks, or emergency snow operations. Any delay in processing the operations payroll could potentially delay payroll for the entire County. Vehicle Maintenance Staffing Adjustment 2013 – $29,961 2014 – $29,961 This item adjusts vehicle maintenance staffing consistent with identified needs. The 2012 / 2013 Adopted budget included a number of efficiencies in Vehicle Maintenance (VM), including the elimination one superintendent position as a result of combining the management of Bellevue and East Bases. Unfortunately, this change has not been successful as the volume of work and the issues with staff and other activities are not diminished as the bases are combined and the current VM superintendent is experiencing a workload that is not sustainable over time. At the same time, work process changes at Component Supply have resulted in the need for one less machinist. The work processes that have made this possible include standardization of parts, focus on job safety
F - 151
ECONOMIC GROWTH AND BUILT ENVIRONMENT
and job hazard analysis, purchase and installation of new equipment that reduces the time required to machine parts and less work associated with activities such as transmission rebuilds with newer vehicles. Therefore, this item proposes the transfer of a vehicle maintenance superintendent from non-revenue vehicles to Bellevue Base, the addition of a chief at non-revenue vehicles to help manage day-to-day operation, and the reduction of a machinist. This results in no net increase in FTEs. Litigation Costs 2013 – $520,000 2014 – $640,000 This change item provides funding for litigation costs associated with certain bus purchases. King County has removed from service its low-floor, medium-sized diesel-motor buses. Transit maintains that these buses are defective and nonconforming with the purchase contract in numerous respects that make them unsafe and unfit for their intended use. As a result, the county formally revoked acceptance of the buses and has filed a lawsuit against the vendor for declaratory relief and damages, including the purchase price paid for the buses. At the recommendation of the Prosecuting Attorney’s Office (PAO), external legal counsel has been engaged to manage this litigation effort. This package provides funding for the costs as estimated by the external legal counsel as well as annual costs for storing the vehicles. PAO and Risk are both aware of the litigation efforts. Environmental Compliance Support 2013 – $85,000 2014 – $85,000 Benchmark criteria for various toxins, contaminations and other conditions continue to be lowered by the various regulatory agencies tasked with measuring compliance (e.g., Department of Ecology (DOE)). These lower threshold standards coupled with Transit’s aging infrastructure result in the need for heightened water quality discharge monitoring compliance efforts. This package provides funding to provide a higher level of monitoring and testing; it does not necessarily fund the costs of remediation activities which would be addressed separately. Eliminate PPM IV Position in Research and Management Information 2013 – ($117,552) / (1.00) FTE 2014 – ($117,552) This proposal involves the reduction of one project program manager IV position, which became vacant due to a retirement in 2010. This position’s workload has been redistributed among other personnel, although the capacity of the group to conduct and analyze survey research has diminished with this reduction. ORCA Autoload Collections 2013 – $70,028 / 1.00 FTE 2014 – $70,028 This change item provides dedicated funding and a Customer Service Representative for working with transit customers on unsuccessful ORCA autoload transactions and collecting unpaid amounts. Per an interlocal agreement, Metro manages the ORCA autoload function, and the partner transit agencies reimburse Metro for 35 percent of the cost of the work. This proposal adds a customer service representative to answer incoming customer telephone calls and emails about the failed transactions, research and verify amounts in the bank card processor system, request repayments, maintain a confidential list of promised payments, monitor payments received and follow up with customers on promises still outstanding, block products on the ORCA card itself when repayments have not been received, and respond to customer queries for information on and interpretation of regional Orca autoload policy and procedures. To test the effectiveness of this position, Metro employed a TLT over the last year with duties as described above. On average, the TLT was able to collect about 60 percent of the unpaid amounts.
F - 152

ECONOMIC GROWTH AND BUILT ENVIRONMENT
Central Rate Changes Central Rate Changes 2013 – ($406,731) 2014 – $3,958,395 This series of adjustments captures the net effect of countywide charges from the 2012 / 2013 Adopted Budget to reflect the most current 2013 and 2014 central rate charges. Unlike previous years, it does not include COLA and flex benefits, which are included in the Pro Forma decision package. Details about each rate can be found in the How We Deliver Introduction, beginning on page H-5, and the agency-specific changes are detailed in the central rate section of the agency crosswalk. Technical Adjustments Technical Adjustment for Various Operating Costs 2013 – $1,128,702 2014 – $2,462,000 This decision package includes technical adjustments to the Transit budget that are not net-zero. The following changes are included: inflationary increases for contracted guard services and the King County Sheriff Office and annualization of fare enforcement officers for Rapid Ride; restoration of appropriation for excess compensation that was inadvertently removed during in the Proforma stage; funding for cleaning/maintenance of bus shelters in Bellevue; adjustment to the appropriation for ORCA support to match the contract obligation with regional partners to meet ORCA business needs; addition of budget in 2014 for the Transit incentive program due to delays in program timing; and funding for classification adjustments. COLA and Pension Adjustments for Those Not Funded 2013 – $846,924 2014 – $1,198,193 This change item adjusts the budget for COLA and pension costs not funded elsewhere in the budget. Utility Costs Adjustments 2013 – $404,378 2014 – $404,378 This proposal consists of adjustments to support utility rate increases at Metro Transit facilities. Utility rate increases include the City of Seattle (4.5 percent), Puget Sound Energy (5 percent), Surface Water Management fees (1 percent), and permit fees to the City of Seattle. Staffing Changes from Capital to Operating 2013 – $2,078,646 / 1.00 FTE 2014 – $1,474,866 / (1.00) FTE This proposal is a technical adjustment that updates the allocation of wages and benefits to the Transit capital program. In all the Transit sections with capital staff, the amount of wages and benefits assigned to the capital program are recalculated based on the current assignment of staff and their specific wages and benefits. Within the Design and Construction section, the allocation of staff between capital, operating and support is revised. In the Vehicle Maintenance section, a position supporting the purchase of non-revenue vehicles and ACCESS vans is moved from operating to capital.
F - 153

ECONOMIC GROWTH AND BUILT ENVIRONMENT
the Vehicle Maintenance section, a position supporting the purchase of non-revenue vehicles and ACCESS vans is moved from operating to capital. Changes to Capitalization Policy 2013 – $595,364 2014 – $600,618 This item makes adjustments to the budget consistent with new capitalization policy, impacting both the Base Improvement Program and the Transit Asset Management Program (TAMP). The capitalization threshold is increasing from $50,000 to $100,000. This changes the funding of projects within this range from capital to operating. The Transit capital program is also modified with the changed definition. Base improvements projects in this range include feasibility studies, planning studies, modifications to building systems, and safety regulations. TAMP projects in this range are primarily paving and roofing. This proposal also shifts funding for City of Seattle bus stop maintenance commitments from the capital program to operating. Technical Correction to Budget System Data 2013 – $10,740 2014 – $10,553 This item makes a minor change to correct an error in position budgeting in the system. Revenue Adjustments 2013 – $51,900,814 Revenue 2014 – $12,956,499 Revenue This change item makes adjustment to various revenue accounts, including a $20 million increase per year in estimated sales tax. Final Revenue Adjustments 2013 – $912,334 Revenue 2014 – ($1,928,486) Revenue This change item makes final adjustment to various accounts consistent with anticipated revenues. Transfer of Debt Service Cost 2013 – $31,248 2014 – $31,248 This item moves the ABT debt service charge from the Transit Revenue Vehicle Replacement Fund to the Transit operating fund. Long Term Lease Rebate 2013 – ($1,166,151) 2014 – ($1,166,151) King County has received a rebate from the owner of the King Street Center and has benefitted from the refinancing of the remaining debt. The 2013 / 2014 budget passes this windfall on to the King Street tenants in the form of a $7.5 million rent rebate and a $450,000 capital project to reconfigure space associated with the Road Services proposed consolidation to a single floor in King Street Center. Since this Road Services cost cutting space measure is a relatively recent proposal a 20 percent contingency is included in the $450,000 project amount budgeted in the Long Term Lease fund. In the proposed budget the rebate has been included as a separate decision package entry to offset the central rate budgeting of 2013 and 2014 lease costs.
F - 154
ECONOMIC GROWTH AND BUILT ENVIRONMENT
Transfer Project Program Manager from KCIT 2013 – $130,473 / 1.00 FTE 2014 – $130,473 This proposal reflects the transfer of a Project Program Manager III FTE from KCIT to Transit’s Finance and Budget group. This position formerly was responsible for the budget and financial reporting for Transit’s technology projects as well as the operating costs associated with system maintenance and operation. As part of the KCIT consolidation, this position was moved to KCIT. It has since been determined that the work performed by this position is primarily related to Metro Transit and, with the concurrence of KCIT, the position is being moved back to Metro Transit. The position will be housed in the Transit Finance and Budget group and will have broadened responsibilities that will include capital program review and project analysis, capital program reporting and budget development, and reporting/analysis for capital grants and other revenue.
F - 155

2011 Actual1 2012 Adopted2012
Estimate22013
Proposed2014 Proposed
2015 Projection3
2016 Projection3
Beginning Fund Balance 487,086,333 452,173,198 446,813,130 420,523,638 439,585,937 256,642,246 257,519,581Revenues Fares (Bus, ACC, VP, SLU) 132,276,074 149,654,862 138,529,728 145,999,933 149,484,639 153,542,413 156,764,199 Other Operations (Bus, ACC, VP, SLU) 13,907,383 11,066,325 15,941,465 16,663,282 17,962,814 19,781,930 20,383,445 Sales Tax 397,576,059 411,906,300 402,897,642 420,644,678 437,540,182 460,960,235 486,822,765 Property Tax 22,629,077 24,275,638 23,585,148 22,934,910 23,654,550 24,109,931 24,537,615 Congestion Relief Charge 0 13,174,530 13,174,530 26,349,058 13,174,530 0 0 Interest Income 2,870,481 1,369,368 2,191,245 1,564,025 1,751,082 1,951,251 4,207,091 Grants 189,265,348 129,209,653 132,511,414 117,447,982 94,525,174 84,471,649 85,610,932 Sound Transit Payments 70,755,621 71,061,401 73,502,707 79,956,894 83,490,760 86,145,344 88,780,848 Support of Other KC Divisions 3,070,706 2,962,717 2,962,717 2,008,363 2,026,690 2,076,547 2,126,176 Miscellaneous 24,875,045 20,354,514 18,569,571 18,307,111 9,516,099 15,970,509 11,227,071
Total Revenues 857,225,794 835,035,308 823,866,167 851,876,235 833,126,520 849,009,808 880,460,142Total Biennial Revenues 1,685,002,755 1,729,469,950
Expenditures Transit (593,233,583) (643,737,793) (643,737,855) (664,998,992) (687,572,748) (669,839,259) (668,428,737) Transit Administration (13,885,169) (5,802,222) (5,802,222) (5,732,554) (5,815,339) (6,016,532) (6,173,607) Capital (270,975,707) (225,126,957) (224,354,142) (159,008,820) (338,491,855) (160,086,120) (252,923,953) Debt Service (17,004,838) (17,001,343) (17,001,343) (16,992,021) (17,010,724) (16,999,398) (16,996,887)
Total Expenditures (895,099,297) (891,668,315) (890,895,562) (846,732,386) (1,048,890,666) (852,941,309) (944,523,184)Total Biennial Expenditures (1,895,623,052) (1,797,464,492)
Estimated Underexpenditures4
Operating Program 0 6,495,400 6,495,401 6,738,563 6,965,618 6,758,558 6,746,023 Capital Program 0 (2,594,580) 31,840,827 4,424,436 23,476,131 (4,606,542) (25,587,818)
Total Estimated Underexpenditures 0 3,900,820 38,336,228 11,162,999 30,441,749 2,152,016 (18,841,795)Other Fund Transactions
Debt Proceeds 0 0 0 0 0 0 0Misc Balance Adjustments (2,399,701) 2,403,675 2,403,675 2,755,451 2,378,705 2,656,820 1,852,238
Total Other Fund Transactions (2,399,701) 2,403,675 2,403,675 2,755,451 2,378,705 2,656,820 1,852,238Total Biennial Other Fund Transactions 5,134,156 4,509,059Ending Fund Balance 446,813,130 401,844,686 420,523,638 439,585,937 256,642,246 257,519,581 176,466,983Reserves5
Mandated & Rate Stabilization ReservesOperating Ending Target Requirement (24,950,086) (26,693,425) (26,693,428) (27,564,310) (56,994,822) (55,549,791) (55,446,768)Capital Ending Target Requirement (274,311,246) (86,004,537) (104,201,892) (104,673,450) (170,879,053) (130,505,768) (177,687,015)RFRF Ending Target Requirement (173,419,247) (153,604,211) (168,432,635) (132,856,859) (101,149,919) (58,917,903) (55,361,078)Bond Ending Reserve Requirement (16,803,303) (17,072,247) (17,072,247) (17,375,113) (17,653,971) (17,958,570) (18,271,418)Revenue Stabilization Reserve (26,403,928) (118,457,450) (104,114,115) (157,125,587)
Total Reserves (515,887,810) (401,831,870) (420,514,316) (439,595,319) (346,677,765) (262,932,032) (306,766,279)
Reserve Shortfall 90,043,350 5,412,016 130,289,060Ending Undesignated Fund Balance (69,074,680) 12,817 9,323 (9,382) 7,831 (434) (10,236)
1 2011 Actuals are based or IBIS 14th month.2 2012 Estimated is based on updated revenue and expenditure data as of June 2012. 3 2015 through 2016 revenues and expenditures are based on future assumptions concerning service levels and the supporting CIP needs.
2013/2014 Biennial Proposed Financial PlanPublic Transportation Enterprise Fund / 4640
4 Estimated underexpenditures are based on 1 percent of expenditures for the operating or the Transit financial model fo the capital. Actual underexpenditures will vary. This value is not included in the budget system.5 The Operating Target Fund Balance for 2010 through 2013 is set at 15 days, half the adopted policy of 30 days. Other target fund balances are based on the adopted fund management policies.
F - 156

2011 Actual1 2012 Adopted2012
Estimate22013
Proposed2014 Proposed
2015 Projection3
2016 Projection3
Beginning Fund Balance 48,713,470 83,726,939 51,354,014 130,807,542 184,689,897 (33,048,527) 50,137,775Revenues Bus Fares 124,648,783 136,766,664 129,370,391 135,079,638 137,363,948 141,080,749 142,366,099ACCESS Fares 874,034 4,071,219 900,677 848,857 846,060 1,023,656 1,202,488Vanpool Fares 6,710,691 7,686,031 7,686,031 9,490,990 10,690,941 10,834,707 12,546,098South Lake Union Fares 42,566 1,130,948 572,628 580,448 583,689 603,301 649,514Other Operations (Bus, ACC, VP, SLU) 13,907,383 11,066,325 15,941,465 16,663,282 17,962,814 19,781,930 20,383,445Sales Tax 298,182,044 339,191,198 331,682,482 346,476,967 360,553,223 380,078,139 401,632,492Property Tax 22,629,077 24,275,638 23,585,148 22,934,910 23,654,550 24,109,931 24,537,615Congestion Relief Charge 0 13,174,530 13,174,530 26,349,058 13,174,530 0 0Payments from Sound Transit 66,260,991 66,568,896 68,897,889 74,799,132 78,327,107 80,989,316 83,622,796Support of Other KC Divisions 3,070,706 2,962,717 2,962,717 2,008,363 2,026,690 2,076,547 2,126,176Operating Grants 8,072,344 58,885,903 57,654,795 58,684,681 14,666,034 33,878,325 58,024,887Interest 314,349 187,844 187,844 195,083 444,838 303,303 187,566Miscellaneous 4,325,232 9,254,351 10,726,478 11,221,441 3,271,619 885,781 906,951
Total Revenues 549,038,200 675,222,265 663,343,076 705,332,851 663,566,043 695,645,684 748,186,127Total Biennial Revenues 1,368,898,893 1,443,831,811
Expenditures Transit (593,233,583) (643,737,793) (643,737,855) (664,998,992) (687,572,748) (669,839,259) (668,428,737)Transit Administration (13,885,169) (5,802,222) (5,802,222) (5,732,554) (5,815,339) (6,016,532) (6,173,607)
Total Expenditures (607,118,752) (649,540,015) (649,540,077) (670,731,546) (693,388,087) (675,855,791) (674,602,344)Total Biennial Expenditures (1,364,119,633) (1,350,458,135)
Estimated Underexpenditures4 0 6,495,400 6,495,401 6,738,563 6,965,618 6,758,558 6,746,023Operating Fund Transactions Misc Balance Adjustment (6,182,904) 0 0 0 0 0 0Transfer (to) from Capital Program 48,972,000 41,160,996 41,393,337 (19,824,488) (90,765,830) 175,492,992 (151,328,455)Transfer (to) from Revenue Fleet Replacement 17,932,000 (11,914,710) 17,761,792 32,366,974 (104,116,168) (118,855,141) (53,981,419)
Total Other Fund Transactions 60,721,096 29,246,286 59,155,129 12,542,486 (194,881,998) 56,637,851 (205,309,874)Total Biennial Other Fund Transactions (182,339,512) (148,672,023)
Ending Fund Balance 51,354,014 145,150,875 130,807,542 184,689,897 (33,048,527) 50,137,775 (74,842,292)Reserves
Mandated & Rate Stabilization Reserves Operating Policy Minimum Balance5 (24,950,086) (26,693,425) (26,693,428) (27,564,310) (56,994,822) (55,549,791) (55,446,768) Revenue Stabilization Reserve6 (26,403,928) (118,457,450) (104,114,115) (157,125,587) ‐ ‐ ‐
Total Reserves (51,354,014) (145,150,875) (130,807,542) (184,689,897) (56,994,822) (55,549,791) (55,446,768)
Reserve Shortfall 90,043,350 5,412,016 130,289,060 Ending Undesignated Fund Balance 0 0 0 0 0 0 0
1 2011 Actuals are based or IBIS 14th month.2 2012 Estimated is based on updated revenue and expenditure data as of June 2012. 3 2015 through 2016 revenues and expenditures are based on future assumptions concerning service levels and the supporting CIP needs.
6 The Revenue Stabilization Reserve is created based on the criteria included in the adopted fund management policies.
5 The Operating Target Fund Balance for 2010 through 2013 is set at 15 days, half the Transit financial policy of 30 days.
2013/2014 Biennial Proposed Financial PlanPublic Transportation Enterprise Fund / 4640
Operating Sub‐fund Financial Plan
4 Estimated underexpenditures are based on 1 percent of operating budget. Actual underexpenditures will vary. This value is not included in the budget system.
F - 157

2011 Actual1 2012 Adopted2012
Estimate22013 Proposed 2014 Proposed
2015 Projection3
2016 Projection3
Beginning Fund Balance 159,486,736 157,631,583 139,809,181 104,201,892 104,673,450 170,879,053 130,505,768Revenues Sales Tax 32,882,932 0 0 28,320,398 0 0 31,101,703Interest Income 813,885 486,300 547,792 546,928 664,233 1,060,208 2,876,426Sound Transit Payments 4,494,630 4,492,505 4,604,818 5,157,762 5,163,652 5,156,028 5,158,052Capital Grants 180,722,472 69,853,219 74,386,087 58,292,769 79,388,608 50,122,793 27,126,289Miscellaneous 20,549,813 11,100,163 7,843,093 7,085,670 6,244,480 15,084,728 10,320,120
Total Revenues 239,463,732 85,932,186 87,381,790 99,403,526 91,460,974 71,423,757 76,582,589Total Biennial Revenues 190,864,500 148,006,346
Expenditures Capital Program Expenditures (270,975,707) (225,126,957) (224,354,142) (159,008,820) (338,491,855) (160,086,120) (252,923,953)
Total Expenditures (270,975,707) (225,126,957) (224,354,142) (159,008,820) (338,491,855) (160,086,120) (252,923,953)Total Biennial Expenditures (497,500,675) (413,010,073)
Estimated Underexpenditures4 0 (2,594,580) 31,840,827 4,424,436 23,476,131 (4,606,542) (25,587,818)Other Fund TransactionsMiscellaneous Fund Balance Adj. 2,568,250 1,219,409 1,219,409 1,565,288 1,182,521 1,454,487 643,626RFRF Funds for Fleet Replacement 57,332,170 109,197,892 109,197,892 33,356,640 196,906,002 226,028,126 96,232,782Lease and Prepaid Lease Offset 906,000 906,000 906,000 906,000 906,000 906,000 906,000Transfer (to) from Operating Sub‐fund (48,972,000) (41,160,996) (41,393,337) 19,824,488 90,765,830 (175,492,992) 151,328,455Transfers (to) from Bond Sub‐fund 0 0 (405,729) 0 0 0 (435)
Total Other Fund Transactions 11,834,420 70,162,305 69,524,235 55,652,416 289,760,353 52,895,621 249,110,428Total Biennial Other Fund Transactions 345,412,769 302,006,049
Ending Fund Balance 139,809,181 86,004,537 104,201,892 104,673,450 170,879,053 130,505,768 177,687,015Reserves5
Mandated & Rate Stabilization ReservesCapital Policy Reserve (273,811,246) (83,504,537) (101,701,892) (102,173,450) (168,379,053) (128,005,768) (175,187,015)Capital Policy Minimum Balance (500,000) (2,500,000) (2,500,000) (2,500,000) (2,500,000) (2,500,000) (2,500,000)
Total Reserves (274,311,246) 86,004,537 (104,201,892) (104,673,450) (170,879,053) (130,505,768) (177,687,015)
Reserve ShortfallEnding Undesignated Fund Balance (134,502,065) 0 0 0 0 0 0
1 2011 Actuals are based or IBIS 14th month.2 2012 Estimated is based on updated revenue and expenditure data as of June 2012. 3 2015 through 2016 revenues and expenditures are based on future assumptions concerning service levels and the supporting CIP needs.
2013/2014 Biennial Proposed Financial PlanPublic Transportation Enterprise Fund / 4640
Capital Sub‐fund Financial Plan
5 Target fund balances are based on the the adopted Transit fund management policies.
4 Estimated underexpenditures are based on the Transit financial model. Actual underexpenditures will vary. This value is not included in the budget system.
F - 158

2011 Actual1 2012 Adopted 2012 Estimate2 2013 Proposed2014
Proposed2015
Projection32016
Projection3
Beginning Fund Balance 263,106,205 194,007,878 239,252,361 168,432,635 132,856,859 101,149,918 58,917,903Revenues Sales Tax 49,617,492 56,184,291 54,684,349 29,325,824 60,440,882 64,353,229 37,551,439Interest 1,742,247 695,224 1,455,609 822,014 642,011 587,740 1,143,099
Total Revenues 51,359,739 56,879,515 56,139,958 30,147,838 61,082,893 64,940,969 38,694,538Total Biennial Revenues 91,230,731 103,635,507
Other Fund Transactions Fleet Replacement Transfer to CIP (Appropriated) (57,332,170) (109,197,892) (109,197,892) (33,356,640) (196,906,002) (226,028,126) (96,232,782) Transfer to Operating Sub‐fund (Appropriated) (17,932,000) 11,914,710 (17,761,792) (32,366,974) Transfer from Operating Sub‐fund 104,116,168 118,855,141 53,981,419 Balance Sheet Adjustments 50,587
Total Other Fund Transactions (75,213,583) (97,283,182) (126,959,684) (65,723,614) (92,789,834) (107,172,985) (42,251,363)Total Biennial Other Fund Transactions (158,513,448) (149,424,348)
Ending Fund Balance 239,252,361 153,604,211 168,432,635 132,856,859 101,149,918 58,917,903 55,361,078Reserves4
Mandated & Rate Stabilization Reserves RFRF Year‐end Balance Calculation (173,419,247) (153,604,211) (168,432,635) (132,856,859) (101,149,919) (58,917,903) (55,361,078)
Total Reserves (173,419,247) (153,604,211) (168,432,635) (132,856,859) (101,149,919) (58,917,903) (55,361,078)
Reserve Shortfall ‐ ‐ ‐ ‐ ‐ ‐ ‐ Ending Undesignated Fund Balance 65,833,114 0 0 0 0 0 0
1 2011 Actuals are based or IBIS 14th month.2 2012 Estimated is based on updated revenue and expenditure data as of June 2012. 3 2015 through 2016 revenues and expenditures are based on future assumptions concerning service levels and the supporting CIP needs.
2013/2014 Biennial Proposed Financial PlanPublic Transportation Enterprise Fund / 4640
RFRF Sub‐fund Financial Plan
4 Target fund balances are based on the adopted Transit fund management policies.
F - 159

2011 Actual12012
Adopted2012
Estimate22013
Proposed2014
Proposed2015
Projection32016
Projection3
Beginning Fund Balance 15,779,923 16,806,798 16,397,574 17,081,569 17,365,732 17,661,802 17,958,135RevenuesSales Tax 16,893,591 16,530,811 16,530,811 16,521,489 16,546,078 16,528,866 16,537,132Federal Debt Service Subsidies 470,532 470,532 470,532 470,532 470,532 470,532 459,755
Total Revenues 17,364,123 17,001,343 17,001,343 16,992,021 17,016,610 16,999,398 16,996,887Total Biennial Revenues 34,008,631 33,996,285
Expenditures Bond Debt Service Payments (17,004,838) (17,001,343) (17,001,343) (16,992,021) (17,010,724) (16,999,398) (16,996,887)
Total Expenditures (17,004,838) (17,001,343) (17,001,343) (16,992,021) (17,010,724) (16,999,398) (16,996,887)Total Biennial Expenditures (34,002,745) (33,996,285)
Other Fund TransactionsTransfers from Capital Sub‐fund 0 0 405,729 0 0 0 435Balance Sheet Adjustments (14,126) 0 0 0 0 0 0Sinking Fund Transfers 272,492 278,266 278,266 284,163 290,184 296,333 302,613
Total Other Fund Transactions 258,366 278,266 683,995 284,163 290,184 296,333 303,048Total Biennial Other Fund Transactions 574,347 599,381
Ending Fund Balance 16,397,574 17,085,064 17,081,569 17,365,732 17,661,802 17,958,135 18,261,183Reserves4
Mandated & Rate Stabilization ReservesAnnual Net Debt Service Reserve (One Year) (16,530,811) (16,521,489) (16,521,489) (16,540,192) (16,528,866) (16,537,132) (16,547,367) Sinking Bond Reserve (272,492) (550,758) (550,758) (834,921) (1,125,105) (1,421,438) (1,724,051)
Total Reserves (16,803,303) 17,072,247 (17,072,247) (17,375,113) (17,653,971) (17,958,570) (18,271,418)
Reserve ShortfallEnding Undesignated Fund Balance (405,729) 12,817 9,322 (9,381) 7,831 (435) (10,236)
1 2011 Actuals are based ob IBIS 14th month.2 2012 Estimated is based on updated revenue and expenditure data as of June 2012. 3 2015 through 2016 revenues and expenditures are based on future assumptions concerning service levels and the supporting CIP needs.
2013/2014 Biennial Proposed Financial PlanPublic Transportation Enterprise Fund / 4640
Bond Sub‐fund Financial Plan
4 The appropriation authority anticipates that the Sinking Bond Reserve is held by others; however, at this point in time, these reserves are still held by the Public Transportation Fund.
F - 160

2013/2014 Biennial Budget for
Transit Revenue Vehicle Replacement 4647/A75600
Code/ Item# Description Expenditures FTEs * TLTs
FY13
Adopted Budget
2012 / 2013 Adopted Budget 204,279,532 0.00 0.00AD_012
Adjustments to Adopted Budget
2013 Adjustments to 2012 / 2013 Adopted Budget (139,197,892) 0.00 0.00PF_013
Central Rate Changes
Debt Service Adjustment 31,248 0.00 0.00CR_021
Technical Adjustments
Preliminary Revenue Adjustment - $1,317,872 Revenue 0 0.00 0.00TA_050
Transfers to Capital and Operating 641,976 0.00 0.00TA_096
Transfer of Debt Payment (31,248) 0.00 0.00TA_097
65,723,616 0.00 0.00FY13 Subtotal
FY14
Adjustments to Adopted Budget
Adjustments to Adopted Budget 65,081,640 0.00 0.00PF_014
Central Rate Changes
Debt Service Adjustment 31,248 0.00 0.00CR_021
Technical Adjustments
Preliminary Revenue Adjustment - $32,859,010 Revenue 0 0.00 0.00TA_050
Final Revenue Adjustment - ($606,083) Revenue 0 0.00 0.00TA_051
Transfers to Capital and Operating 131,824,362 0.00 0.00TA_096
Transfer of Debt Payment (31,248) 0.00 0.00TA_097
196,906,002 0.00 0.00FY14 Subtotal
262,629,618 0.00
* FTEs for the 2013 Budget and 2013/2014 Biennial Budget do not include temporary positions or overtime. The 2013/2014
Biennial Budget reflects the maximum number of FTEs during the biennium.
** The 2013/2014 Biennial Budget reflects the total expenditures for the biennium.
2013/2014 Biennial Budget 0.00
Transit Revenue Vehicle ReplacementEconomic Growth and Built EnvironmentKing County Strategic Plan:
F - 161

ECONOMIC GROWTH AND BUILT ENVIRONMENT
Transit Revenue Vehicle Replacement
P R O G R A M H I G H L I G H T S The total 2013 / 2014 Proposed Budget for Transit Revenue Vehicle Replacement is $262,629,618. Adjustments to Adopted Budget Adjustments to the 2012 / 2013 Adopted Biennial Budget in 2013 and 2014 Pro Forma include removing the 2012 portion of the budget to create a baseline for the 2013 / 2014 budget. Central Rate Changes Central Rate Changes 2013 – $31,248 2014 – $31,248 This series of adjustments captures the net effect of countywide charges from the 2012 / 2013 Adopted Budget to reflect the most current 2013 and 2014 central rate charges. Unlike previous years, it does not include COLA and flex benefits, which are included in the Pro Forma decision package. Details about each rate can be found in the How We Deliver Introduction, beginning on page H-5, and the agency-specific changes are detailed in the central rate section of the agency crosswalk. Technical Adjustments Preliminary Revenue Adjustment 2013 – $1,317,872 Revenue 2014 – $32,859,010 Revenue This change item made a preliminary adjustment to revenues during the Agency Request phase of the budget development. Final Revenue Adjustment 2014 – ($606,083) Revenue This decision package makes final adjustments to the revenues to match anticipated values. Transfers to Capital and Operating 2013 – $641,976 2014 – $131,824,362 This proposal supports Transit’s replacement of fleet over the biennium as detailed in the capital program and transfers funds to the operating program per the Transit financial policies. The increment results in a transfer to CIP of $33,356,640 in 2013 and $196,906,002 in 2014. The increment also results in a transfer to operating in 2013 of $32,366,974. Transfer of Debt Payment 2013 – ($31,248) 2014 – ($31,248) This proposal transfers the ABT debt payment from the Transit Revenue Vehicle Replacement Fund to the Transit operating fund.
F - 162

2013/2014 Biennial Budget for
Transit Debt Service 4640/A84300
Code/ Item# Description Expenditures FTEs * TLTs
FY13
Adopted Budget
2012 / 2013 Adopted Budget 0 0.00 0.00AD_012
Adjustments to Adopted Budget
2013 Adjustments to 2012 / 2013 Adopted Budget 0 0.00 0.00PF_013
Central Rate Changes
Debt Service Adjustment 16,707,864 0.00 0.00CR_021
Technical Adjustments
Final Revenue Adjustment - $16,992,024 0 0.00 0.00TA_051
Sinking Fund Expenditures 284,160 0.00 0.00TA_097
16,992,024 0.00 0.00FY13 Subtotal
FY14
Adjustments to Adopted Budget
2013 Adopted Budget 0 0.00 0.00PF_012
Adjustments to the Adopted Budget 0 0.00 0.00PF_014
Central Rate Changes
Debt Service Adjustment 16,720,536 0.00 0.00CR_021
Technical Adjustments
Final Revenue Adjustment - $17,016,610 Revenue 0 0.00 0.00TA_051
Sinking Fund Expenditures 290,188 0.00 0.00TA_097
17,010,724 0.00 0.00FY14 Subtotal
34,002,748 0.00
* FTEs for the 2013 Budget and 2013/2014 Biennial Budget do not include temporary positions or overtime. The 2013/2014
Biennial Budget reflects the maximum number of FTEs during the biennium.
** The 2013/2014 Biennial Budget reflects the total expenditures for the biennium.
2013/2014 Biennial Budget 0.00
Transit Debt ServiceDebt ServiceKing County Strategic Plan:
F - 163

ECONOMIC GROWTH AND BUILT ENVIRONMENT
Transit Debt Service
P R O G R A M H I G H L I G H T S The total 2013 / 2014 Proposed Budget for Transit Debt Service is $34,002,748. Adjustments to Adopted Budget Adjustments to the 2012 / 2013 Adopted Biennial Budget in 2013 and 2014 Pro Forma include removing the 2012 portion of the budget to create a baseline for the 2013 / 2014 budget. Central Rate Changes Central Rate Changes 2013 – $16,707,864 2014 – $16,720,536 This series of adjustments captures the net effect of countywide charges from the 2012 / 2013 Adopted Budget to reflect the most current 2013 and 2014 central rate charges. Unlike previous years, it does not include COLA and flex benefits, which are included in the Pro Forma decision package. Details about each rate can be found in the How We Deliver Introduction, beginning on page H-5, and the agency-specific changes are detailed in the central rate section of the agency crosswalk. Technical Adjustments Final Revenue Adjustment 2013 – $16,992,024 Revenue 2014 – $17,016,610 Revenue This decision package makes final adjustments to the revenues to match anticipated values. Sinking Fund Expenditures 2013 – $284,160 2014 – $290,188 This change item includes sinking fund debt service costs.
F - 164

ECONOMIC GROWTH AND BUILT ENVIRONMENT
Transit Capital Improvement Program
I N T R O D U C T I O N T O P R O G R A M , P R O G R A M G O A L S A N D K E Y 2 0 1 3 - 2 0 1 8 I S S U E S
The purpose of the Public Transportation Fund Capital Program is to provide for the ongoing replacement of aging infrastructure and to support service delivery and expansion. A goal is to achieve the optimal set of capital assets in conjunction with service that best meet the Strategic Goals as presented in the Adopted King County Metro Transit Strategic Plan for Public Transportation 2011-2021. The strategic plan includes 8 goals that are aligned with the goals in King County’s Strategic Plan3. In addition to the eight goals there are 32 strategies outlined in the plan that support objectives for each of the goals. The 2013 / 2014 Public Transportation Capital Improvement Program (CIP) appropriations are projected to total $98 million. This is in addition to $740 million of unspent appropriation, which includes 2012 supplemental appropriations. The CIP focuses on maintaining existing infrastructure and systems, partnering with other regional transportation agencies and providing the physical capacity needed to meet projected service. The priorities for the CIP come from the strategic plan and in many cases represent near term actions that are necessary to achieve the strategies, objectives, and goals of the program. Metro’s 2012 / 2014 Business Plan discusses the near term actions that are associated with each of the strategies in the strategic plan. As an example, appropriation requests to replace diesel and trolley buses and replace bus lifts at Ryerson Base are to maintain assets in a state of good repair, strategy 6.2.2 Provide and maintain capital assets to support effective service delivery. Another example is the grant funded effort to improve passenger facilities and speed and reliability along 3rd Avenue in Seattle. This proposal relates to Strategy 3.4.1: Serve centers and other areas of concentrated activity consistent with Transportation 2040; Strategy 5.1.3: Improve transit speed and reliability and Strategy 3.1.1: Provide alternatives to driving alone through investments and partnerships with regional organizations and local jurisdictions. Due to reduced revenue growth and the resulting inability to maintain current levels of bus service, the emphasis of the capital program continues to be replacement of existing infrastructure. In August 2011, the King County Council passed a Congestion Relief Charge (CRC), which will increase the Vehicle License Fee by $20 over a two year period and raise approximately $50 million – enough revenue to stave off service reductions until late 2014. Over the six year period, however, King County Metro expects to reduce bus service in order to reach a sustainable level of service. The lower service levels combined with more efficient scheduling is reducing the need for replacement buses. The reductions in replacement buses were made in prior budgets and will continue in the 2013 / 2014 biennium. Most other new efforts, particularly Rapid Ride projects, have external funding.
P R O J E C T P R I O R I T I Z A T I O N M E T H O D O L O G Y
The capital improvement program funds projects based on the following priorities in support of the adopted strategic plan: 1) maintaining infrastructure and replacing aging fleets; 2) supporting the implementation of the service delivery system adopted in the strategic plan for 2011-2021; 3) increasing efficiency or productivity that offsets the cost of investment and 4) forming partnerships with other jurisdictions and businesses throughout the region. The Transit Division annually reviews the CIP to ensure that funding is consistent with the established priorities and that both regional priorities and the requirements of each group in Transit are balanced within funding constraints. 3 For a complete comparison of the King County Strategic Plan versus the King County Metro Strategic Plan, see Metro’s 2012/2013 Business Plan.
F - 165

ECONOMIC GROWTH AND BUILT ENVIRONMENT
Consistent with these priorities, the largest portion of the 2012-18 program is associated with maintaining infrastructure. Roughly 80 percent of the total CIP is related to the maintenance and replacement of existing assets, including fleet, facilities and on board equipment. Support for the Strategic Plan and RapidRide service related to passenger facilities, speed and reliability, and RapidRide buses is 15 percent of the program. Expenditures on projects with partners are 3 percent, primarily related to Transit Oriented Development efforts and RapidRide grant partnerships. Financial Planning and Policy Overview The Fund Management Policies adopted in the fall of 2011, direct the allocation of sales tax between the operating and capital portions of the Public Transportation Fund. Sales tax is the largest source of funding for the capital program and the 2013 / 2014 Proposed Budget reflects a forecast that is worse than the one that supported the adopted budget. Federal grant receipts have remained steady, especially for the RapidRide program. The new federal Surface Transportation Act (MAP- 21) lasts thru 2014, providing some near term federal funding certainty. In recent years, in an effort to capture grant funding as soon as possible, a larger proportion of capital grant awards each year have been taken as preventative maintenance and used to fund ongoing operations and to support fleet replacement. This practice allows Metro to capture grant funds that otherwise would have remained with the Federal Government until the time that fleet replacements occur. During 2014 and 2015 the majority of federal grants are assigned to the capital program to support the purchase of trolley buses. These purchases are timed in a manner that will enable the grants to be expended during the same period in which they are awarded. The 2013/2014 financial plan assumes that under-expenditures will occur in the near term, but those amounts will be spent within the following two to three years. Major Projects/Programs in the Biennium The budget authority proposed for the 2013 / 2014 biennium totals $98 million, including the disappropriation of funds for some projects. Major work during the coming biennium includes fleet procurement and capital work supporting RapidRide implementation. Appropriation proposals to procure 35-foot, 40-foot, and 60-foot hybrid buses total $57 million. Vanpool and Paratransit budget proposals for 2013 / 2014 are $8 million to purchase 496 vanpool vehicles and 91 Access vans. In addition, the program includes funding to improve access at the Northgate Transit Center in connection with the future expansion of Link Light Rail to Northgate. The existing $16 million appropriation for the Route 48 electrification is being disappropriated until planned external funding is secured. By the end of 2014, budget authority associated with future commitments (amount unspent) will total $116 million. $89 million of this is for articulated and trolley buses that will be delivered in 2015. Additional detail on select major work is provided below. Fleet Procurement In 2013 and 2014, Transit will replace sixty 40-ft buses with low floor hybrid vehicles. Thirty three new vehicles will be procured for the final portions of the RapidRide E&F Lines. Trolley replacements will begin with fifty 40-foot trolleys and fifty-five 60-foot trolleys planned for delivery in 2014. New appropriation is proposed in 2013 / 2014 to procure sixty 35-foot hybrid buses, instead of 30-foot diesel vehicles. This is a change from earlier plans and represents a decision to move to larger vehicles. This purchase will also mean that the bus fleet is 100 percent hybrid or electric.
F - 166

ECONOMIC GROWTH AND BUILT ENVIRONMENT
As noted above, Transit is proposing funds to replace sixty 40-foot buses during the 2013 / 2014 biennium. This increase of 45 vehicles during the 2013 / 2014 timeframe accelerates the replacement of some vehicles that are showing less reliability and an increased cost to maintain; this does not change the total number of vehicles purchased between 2013 and 2018. The budget request thru 2018 is $15 million higher than the same time period in the 2012 / 2013 Adopted Budget. This is due to a higher estimated cost per vehicle, which reflects recent prices paid by other transit agencies rather than existing contract prices. The previous vendor under contract is exiting the bus manufacturing business. Rapid Ride Implementation RapidRide Corridors E and F will be implemented during the 2013 / 2014 biennium. Four capital projects will install passenger facilities, real time information signs, signal priority equipment and arrange for roadway improvements to support this new service. Terminal work on the D Line and pathway improvements through downtown Seattle for the C and D line will continue during the biennium. One new grant funded project will improve bike access and parking along five of the RapidRide lines. Another new grant backed project will fund work with the City of Seattle to improve bus stops and speed and reliability along 3rd Avenue in downtown Seattle. Technology Systems Both the On Board Systems Project and Radio Automated Vehicle Location Replacement Project will be completed in 2013. Transit will continue to replace its existing data model by modifying how data is structured and how some of that data will be used for new customer information systems. Work will continue on enhancements to the ORCA system and expansion of use to other transit modes, including work funded through a new grant to develop alternative methods of distributing ORCA cards. Work will be completed on an upgrade and enhancement to the system used to manage operations and scheduling. Facility Asset Maintenance Major facility asset maintenance efforts include replacement of Downtown Seattle Transit Tunnel elevators, replacement of the North Base HVAC for the operations and vehicle maintenance areas, replacement of the Atlantic Base maintenance and fuel wash building roof, replacement of the East Base operations and maintenance building roof, replacement of lifts at Ryerson Base and replacement of yard lighting at South Base. Base modification efforts focus on adding lifts specifically for hybrid vehicles at five bases, adding Diesel Emission Fluid fueling systems at transit bases and base electrical modifications to assist with bus interior cleaning. Comparison to 2012 / 2013 Adopted Budget The proposed biennial budget has a 2011-2017 cash flow of $1,611 million. This is a $175 million increase over the $1,436 million 2012 / 2013 budget amount for the same time period. Changes are a combination of 2012 supplemental ordinances ($14 million), new projects ($30 million), changes in the cost of existing projects ($87 million) and out year placeholders to support ‘state of good repair’ funding for technology and communications systems and vehicle wash buildings ($44 million). The six year program includes seven new projects, which are listed below. The first five listed are backed by federal, state and/or local jurisdiction revenue.
• The Transit Signal Priority (TSP) Infrastructure Replacement project will replace aging bus detection equipment.
• The RapidRide Bike Facilities and 3rd Ave Improvement projects will enhance bus stop and streetscape elements along RapidRide corridors.
• The Rt. 101 Transit Corridor Improvement Project will improve transit speed and reliability along 4.5 miles of Route 101, near the Renton Transit Center.
F - 167

ECONOMIC GROWTH AND BUILT ENVIRONMENT
• The ORCA Self Serve Kiosk project will develop and install kiosks for vending and revaluing ORCA
cards in downtown Seattle. • The only new, non revenue backed project is for a new Transit Police Facility which has been identified
as a need for several years and is included in this budget as well as the Central/Atlantic facility master plan that will be completed in 2013.
• The Ryerson Base Lift replacement project is not new. It was formerly part of the TAMP appropriation and has been assigned a unique appropriation for more visibility due to its cost.
Revenue vehicle expense has increased. As previously mentioned, 40-foot bus costs have increased because the vendor under contract is exiting the business and costs have been modified to reflect current market prices. The plan to procure 30-foot diesel buses has shifted to 35-foot hybrid buses, causing an $18 million cost increase. Earlier replacement of sixty-one 60-foot buses has resulted in a $47 million cost increase for that project during the 2011-17 time period. Costs for the vanpool program have increased due to higher growth assumptions. Paratransit will purchase 11 more vehicles over the 7 year timeframe, but more vehicles will be lower cost gas vans so costs are similar to the last budget. Two trolley projects had substantial cost reductions. The trolley extension to the Henderson Light Rail station was cancelled because of limited layover space, limited potential ridership gains, and higher priority trolley work. The Route 48 Electrification project, which is dependent on funding from grants and the City of Seattle, was moved out several years while funding opportunities are pursued. The Atlantic Central Operations Building, Real Time Information Signs for RapidRide Corridors, and buses for the SR 520 corridor all have total cost estimates that are significantly lower than last year. Existing, non vehicle projects with cost increases include trolley modifications for work on Denny Way to improve travel time and work on Mercer to support City of Seattle street improvements and Northgate TOD, which reflects current plans for replacing the Transit Center and coordination with Sound Transit needs. The Signage Replacement project added expense to replace all medium and large signs in the system. The Operating Facility Improvements project includes new efforts to add jib cranes at two more bases, update security at the Van Distribution Center, add facilities at bases for a fuel additive, install electric and gas sub meters and add automatic shutoff systems at lubrication product supply pumps. In 2016 and beyond, placeholders have been added for replacement of existing equipment, systems and buildings. In the 2016 and 2017 timeframe, these include the Radio System, fare collection system, customer information systems, Wireless Access Points and routers on the bus, and vehicle wash buildings, particularly for non revenue vehicles and East Base.
F - 168