king county metro transit 2015 rider/non-rider survey ... · king county metro transit 2015...
TRANSCRIPT
King County
Metro Transit
2015 Rider/Non-Rider Survey
Final Report
June 2016
Research Conducted for:
King County
Department of Transportation
Metro Transit Division
By:
Northwest Research Group, LLC

2015 Rider / Non-Rider Survey 2 | P a g e
Prepared by:
King County Department of Transportation Metro Transit Division - Strategy and Performance King Street Center, KSC-TR-0415 201 S Jackson St Seattle, WA 98104
206-553-3000 TTY Relay: 711
Research conducted by:
Northwest Research Group, LLC
Rebecca Elmore-Yalch, Principal / Managing Director
Nathan Wiggin, Project Director
Alternative Formats Available
206-477-5796 TTY Relay: 711

2015 Rider / Non-Rider Survey 3 | P a g e
TABLE OF CONTENTS Contents
Table of Contents ............................................................................................................................................................................................................ 3
Contents ............................................................................................................................................................................................................. 3
List of Figures ..................................................................................................................................................................................................... 7
List of Tables ....................................................................................................................................................................................................11
Executive Summary ......................................................................................................................................................................................................13
Project Overview .............................................................................................................................................................................................13
Objectives ........................................................................................................................................................................................................13
Methodology ...................................................................................................................................................................................................13
Key Findings .....................................................................................................................................................................................................15
Study Background and Objectives ................................................................................................................................................................................28
Methodology ................................................................................................................................................................................................................29
Sampling ..........................................................................................................................................................................................................29
Response Rates ................................................................................................................................................................................................33
Survey Instrument ...........................................................................................................................................................................................34
Analysis and Reporting ....................................................................................................................................................................................35
Findings—Market Share ...............................................................................................................................................................................................37
Summary ..........................................................................................................................................................................................................37
Market Share (Households with Riders) ..........................................................................................................................................................39
Findings: Rider and Non-Rider Demographics ..............................................................................................................................................................42
Summary ..........................................................................................................................................................................................................42
2015 Rider / Non-Rider Survey 4 | P a g e
Demographic Characteristics: Riders and Non-Riders .....................................................................................................................................47
Changing Demographics: Riders and Non-Riders ............................................................................................................................................51
Low-Income Riders ..........................................................................................................................................................................................55
Findings: Riders’ General Travel Behavior ....................................................................................................................................................................57
Summary ..........................................................................................................................................................................................................57
Frequency of Riding .........................................................................................................................................................................................62
Length of Time Riding Metro ...........................................................................................................................................................................71
Reliance on Metro for Transportation .............................................................................................................................................................76
Travel Times .....................................................................................................................................................................................................80
Transferring .....................................................................................................................................................................................................84
Bus Stop Access ...............................................................................................................................................................................................89
Park-and-Ride Lot Use .....................................................................................................................................................................................90
Personal Travel ................................................................................................................................................................................................91
Findings: Fare Payment.................................................................................................................................................................................................92
Summary ..........................................................................................................................................................................................................92
Primary Fare Payment Method .......................................................................................................................................................................94
ORCA Cards ......................................................................................................................................................................................................98
Employer / School Subsidies ..........................................................................................................................................................................101
Findings: Sources of Information about Metro ..........................................................................................................................................................102
Summary ........................................................................................................................................................................................................102
Primary Information Sources .........................................................................................................................................................................103
Smartphones ..................................................................................................................................................................................................105
Information at Stops ......................................................................................................................................................................................109

2015 Rider / Non-Rider Survey 5 | P a g e
Findings: Overall Satisfaction with Metro ..................................................................................................................................................................112
Summary ........................................................................................................................................................................................................112
Overall Satisfaction ........................................................................................................................................................................................113
Findings: Service Quality .............................................................................................................................................................................................118
Summary ........................................................................................................................................................................................................118
Overview of Service Quality Analysis .............................................................................................................................................................124
Performance on Overall Service Dimensions ................................................................................................................................................126
Level of Service ..............................................................................................................................................................................................130
Transferring ...................................................................................................................................................................................................133
Personal Safety ..............................................................................................................................................................................................136
Comfort and Cleanliness at Stops ..................................................................................................................................................................139
Comfort and Cleanliness Onboard .................................................................................................................................................................142
Park-and-Ride Lots .........................................................................................................................................................................................145
Information Sources ......................................................................................................................................................................................148
Metro Operators ............................................................................................................................................................................................151
Fare Payment .................................................................................................................................................................................................154
Findings: Non-Riders ...................................................................................................................................................................................................157
Summary ........................................................................................................................................................................................................157
Transit Use .....................................................................................................................................................................................................158
Potential Ridership ........................................................................................................................................................................................162
Findings: Riders’ and Non-Riders’ Commute Travel ...................................................................................................................................................167
Summary ........................................................................................................................................................................................................167
Commute Status ............................................................................................................................................................................................169

2015 Rider / Non-Rider Survey 6 | P a g e
Commute Mode .............................................................................................................................................................................................172
Work Location ................................................................................................................................................................................................176
Potential Use of Metro to Commute to Work or School ...............................................................................................................................180
Findings: Goodwill.......................................................................................................................................................................................................182
Summary ........................................................................................................................................................................................................183
Meeting Expectations ....................................................................................................................................................................................187
Brand Perception ...........................................................................................................................................................................................190
Brand Relationship .........................................................................................................................................................................................195
Perceived Value of Services Received ...........................................................................................................................................................198
Goodwill Index ...............................................................................................................................................................................................199
Findings: Other Topics ................................................................................................................................................................................................206
Personal Safety ..............................................................................................................................................................................................206
Summary ........................................................................................................................................................................................................206
Awareness and Impact of 2015 Service Changes ..........................................................................................................................................212
Appendix .....................................................................................................................................................................................................................216
Questionnaire ................................................................................................................................................................................................216
Zip Code List ...................................................................................................................................................................................................216
2015 Rider / Non-Rider Survey 7 | P a g e
List of Figures
Figure 1: Market Share: Countywide ............................................................................................................................................................................39
Figure 2: Market Share: Seattle / North King County ...................................................................................................................................................40
Figure 3: Market Share: South King County ..................................................................................................................................................................41
Figure 4: Market Share: East King County ....................................................................................................................................................................41
Figure 5: Distribution of Low-Income Riders ................................................................................................................................................................55
Figure 6: Percentage of Riders who are Regular and Infrequent Riders ......................................................................................................................62
Figure 7: All Riders: Trends in Riding Frequency (Average Number of One-Time Rides in Past 30 Days) ....................................................................63
Figure 8: Regular Riders’ Frequency of Riding by Area of Residence ...........................................................................................................................64
Figure 9: Trends in Primary Trip Purpose .....................................................................................................................................................................65
Figure 10: Number of One-Way Rides by Primary Trip Purpose ..................................................................................................................................66
Figure 11: Primary Trip Purpose for Those Who Primarily Use Metro for Commute Trips ..........................................................................................67
Figure 12: Primary Trip Purpose for Those Who Primarily Use Metro for Non-Commute Trips ..................................................................................68
Figure 13: Regular Riders’ Primary Use of Metro for Commute Trips by Frequency of Riding ....................................................................................69
Figure 14: Trends in Length of Time Riding Metro (New and Experienced Riders) ......................................................................................................71
Figure 15: Percentage of New Riders by Frequency of Riding ......................................................................................................................................72
Figure 16: Experienced Riders: Length of Time Riding (2015) by Frequency of Riding ................................................................................................73
Figure 17: Trip Purpose by Length of Time Riding ........................................................................................................................................................74
Figure 18: Reliance on Metro .......................................................................................................................................................................................76
Figure 19: Reliance on Metro by Frequency of Riding..................................................................................................................................................77
Figure 20: Percentage of Riders with Driver’s License by Reliance on Metro ..............................................................................................................79
Figure 21: Percentage of Riders with Access to Vehicle by Reliance on Metro ...........................................................................................................79
Figure 22: Peak and Off-Peak Travel .............................................................................................................................................................................80
Figure 23: Detailed Times Ride .....................................................................................................................................................................................81
Figure 24: Extent to Which Riders Use Metro When It Is Dark ....................................................................................................................................82
Figure 25: Extent to Which Riders Use Metro When It Is Dark by Frequency of Riding...............................................................................................83
Figure 26: Transfer Rates for Primary Trip....................................................................................................................................................................84
Figure 27: Number of Transfers ....................................................................................................................................................................................85

2015 Rider / Non-Rider Survey 8 | P a g e
Figure 28: Wait Time When Transferring .....................................................................................................................................................................87
Figure 29: Wait Time When Riding by Area of Residence ............................................................................................................................................88
Figure 30: How Riders Access Bus Stop They Use Most Often .....................................................................................................................................89
Figure 31: Trends in Park-and-Ride Lot Use..................................................................................................................................................................90
Figure 32: Personal Travel Mode(s) ..............................................................................................................................................................................91
Figure 33: Trends in Fare Payment ...............................................................................................................................................................................94
Figure 34: Use of ORCA Cards and Cash to Pay Fares (2015) by Frequency of Riding .................................................................................................95
Figure 35: Reasons for Paying with Cash ......................................................................................................................................................................97
Figure 36: Type of ORCA Card .......................................................................................................................................................................................98
Figure 37: Products on ORCA Card ...............................................................................................................................................................................99
Figure 38: Products on ORCA Card by Frequency of Riding .......................................................................................................................................100
Figure 39: Employer / School Subsidies ......................................................................................................................................................................101
Figure 40: Sources of Information about Metro .........................................................................................................................................................103
Figure 41: Smartphone Ownership .............................................................................................................................................................................105
Figure 42: Smartphone Ownership by Age .................................................................................................................................................................106
Figure 43: Smartphone Ownership by Income ...........................................................................................................................................................107
Figure 44: Frequency of Using Smartphones to Get Information about Metro .........................................................................................................108
Figure 45: Use of Posted and Real-Time Information at Stops ...................................................................................................................................109
Figure 46: Satisfaction with Printed / Posted Information at Stops ...........................................................................................................................110
Figure 47: Satisfaction with Real-Time Information at Stops .....................................................................................................................................110
Figure 48: Interest in Different Types of Real-Time Travel Information ....................................................................................................................111
Figure 49: Preferred Means of Getting Real-Time Travel Information.......................................................................................................................111
Figure 50: Trends in Overall Satisfaction ....................................................................................................................................................................113
Figure 51: Trends in Overall Satisfaction by Area of Residence .................................................................................................................................115
Figure 52: Trends in Overall Satisfaction by Income ..................................................................................................................................................117
Figure 53: Overall Service Dimensions: Ratings for Quality of Service 2015 ..............................................................................................................126
Figure 54: Differences in % Very Satisfied with Overall Dimensions of Service (2015) Regular and Infrequent Riders ............................................127
Figure 55: Overall Dimensions of Service Changes in Satisfaction Ratings 2014–2015* ...........................................................................................128

2015 Rider / Non-Rider Survey 9 | P a g e
Figure 56: Key Drivers Overall Dimensions .................................................................................................................................................................129
Figure 57: Level of Service: Ratings for Quality of Service 2015.................................................................................................................................130
Figure 58: Level of Service: Changes in Ratings 2014–2015 .......................................................................................................................................131
Figure 59: Key Drivers Level of Service .......................................................................................................................................................................132
Figure 60: Transferring: Ratings for Quality of Service 2014 ......................................................................................................................................133
Figure 61: Transferring: Changes in Satisfaction Ratings 2014–2015* ......................................................................................................................134
Figure 62: Key Drivers: Transferring ...........................................................................................................................................................................135
Figure 63: Personal Safety: Ratings for Quality of Service 2015 .................................................................................................................................136
Figure 64: Personal Safety: Changes in Ratings 2014–2015 .......................................................................................................................................137
Figure 65: Key Drivers: Personal Safety ......................................................................................................................................................................138
Figure 66: Comfort and Cleanliness at Stops: Ratings for Quality of Service 2015 ....................................................................................................139
Figure 67: Comfort and Cleanliness at Stops: Changes in Ratings 2014–2015...........................................................................................................140
Figure 68: Key Drivers: Comfort / Cleanliness at Stops ..............................................................................................................................................141
Figure 69: Comfort and Cleanliness Onboard: Ratings for Quality of Service 2015 ...................................................................................................142
Figure 70: Comfort and Cleanliness On-Board: Changes in Ratings 2014–2015 ........................................................................................................143
Figure 71: Key Drivers: Comfort and Cleanliness Onboard ........................................................................................................................................144
Figure 72: Park-and-Ride Lots: Ratings for Quality of Service 2015 ...........................................................................................................................145
Figure 73: Park-and-Ride Lots: Changes in Ratings 2014–2015..................................................................................................................................146
Figure 74: Key Drivers: Park-and-Ride Lots .................................................................................................................................................................147
Figure 75: Information Sources: Ratings for Quality of Service 2015 .........................................................................................................................148
Figure 76: Information Sources: Changes in Ratings 2014–2015* .............................................................................................................................149
Figure 77: Key Drivers: Sources of Information* ........................................................................................................................................................150
Figure 78: Metro Operators: Ratings for Quality of Service 2015 ..............................................................................................................................151
Figure 79: Metro Operators: Changes in Ratings 2014–2015* ..................................................................................................................................152
Figure 80: Key Drivers: Metro Operators....................................................................................................................................................................153
Figure 81: Fare Payment: Ratings for Quality of Service 2015 ...................................................................................................................................154
Figure 82: Fare Payment: Changes in Ratings 2014–2015* ........................................................................................................................................155
Figure 83: Key Drivers: Fare Payment .........................................................................................................................................................................156

2015 Rider / Non-Rider Survey 10 | P a g e
Figure 84: Non-Riders’ Use of Metro in the Past Year ................................................................................................................................................158
Figure 85: Percentage of Non-Riders Who Have Never Used or Used Metro 5 or More Years Ago ..........................................................................159
Figure 86: Primary Purpose for Using Metro ..............................................................................................................................................................160
Figure 87: Non-Riders’ Use of Other Transit Systems ................................................................................................................................................161
Figure 88: Appeal of Using Metro ...............................................................................................................................................................................162
Figure 89: Appeal of Using Metro by Past Use ...........................................................................................................................................................163
Figure 90: Likelihood of Riding Metro ........................................................................................................................................................................164
Figure 91: Likelihood of Using Metro by Past Use ......................................................................................................................................................165
Figure 92: All Potential Riders: Most Important Improvements to Encourage Ridership ..........................................................................................166
Figure 93: Highest Potential Riders: Most Important Improvements to Encourage Ridership ..................................................................................166
Figure 94: Commuter Status .......................................................................................................................................................................................169
Figure 95: Riders’ Commuter Status ...........................................................................................................................................................................170
Figure 96: Non-Riders’ Commuter Status ...................................................................................................................................................................170
Figure 97: Trends in Work at Home Status .................................................................................................................................................................171
Figure 98: Trends in Number of Days Commuting .....................................................................................................................................................171
Figure 99: Primary Commute Mode Riders and Non-Riders ......................................................................................................................................172
Figure 100: Primary Commute Mode Regular Riders .................................................................................................................................................172
Figure 101: Use of Metro for Commuting by Primary Commute Mode (2015) .........................................................................................................173
Figure 102: Commute Mode (2015) by Frequency of Riding .....................................................................................................................................174
Figure 103: Work Location ..........................................................................................................................................................................................176
Figure 104: Work Location Metro Bus Commuters ....................................................................................................................................................177
Figure 105: Work Location Drive-Alone Commuters ..................................................................................................................................................178
Figure 106: Overall Appeal of Using Metro to Commute to Work or School .............................................................................................................180
Figure 107: Likelihood of Using Metro to Commute to Work or School ....................................................................................................................181
Figure 108: Extent to Which Metro Meets Riders’ and Non-Riders’ Expectations for Service ..................................................................................188
Figure 109: Perceptions of Metro ...............................................................................................................................................................................190
Figure 110: Extent to Which Riders and Non-Riders Hear Positive Things about Metro from Friends / Colleagues .................................................193
Figure 111: Extent to Which Riders and Non-Riders Hear Positive Things about Metro in Media ............................................................................193

2015 Rider / Non-Rider Survey 11 | P a g e
Figure 112: Brand Relationship ...................................................................................................................................................................................195
Figure 113: Brand Relationship (I Like to Say I Ride Metro) .......................................................................................................................................197
Figure 114: Value of Services Received from Metro ..................................................................................................................................................198
Figure 115: Impact of Individual Brand Perception Elements on Goodwill ................................................................................................................199
Figure 116: Impact of Individual Brand Relationship Elements on Goodwill .............................................................................................................200
Figure 117: Impact of Three Primary Components of Goodwill on Goodwill ............................................................................................................201
Figure 118: Overall Brand Perception, Brand Relationships, Value, and Goodwill Indices ........................................................................................202
Figure 119: Differences in Brand Perception, Brand Relationship, Value, and Goodwill Indices—Riders and Non-Riders .......................................203
Figure 120: Differences in Brand Perception, Brand Relationship, Value, and Goodwill Indices—Regular and Infrequent Riders...........................203
Figure 121: Differences in Brand Perception, Brand Relationship, Value, and Goodwill Indices New and Experienced Riders ................................204
Figure 122: Differences in Brand Perception, Brand Relationship, Value, and Goodwill Indices Non-Riders ............................................................205
Figure 123: Extent to Which Riders Avoid Riding Due to Concerns about Safety ......................................................................................................207
Figure 124: Extent to Which Riders Avoid Riding Due to Concerns about Safety by Rider Status .............................................................................208
Figure 125: Factors Influencing the Extent to Which Riders Avoid Riding Metro Due to Concerns about Safety .....................................................209
Figure 126: Agreement that Metro Provides a Safe and Secure Environment ..........................................................................................................211
Figure 127: Agreement that Metro is Proactive about Safety Improvements ...........................................................................................................211
Figure 128: Awareness of June / September 2015 Service Changes ..........................................................................................................................213
Figure 129: Percentage of Riders Impacted by Service Change(s) .............................................................................................................................214
Figure 130: Satisfaction with Service Changes ...........................................................................................................................................................214
List of Tables
Table 1: Demographic Characteristics of Riders and Non-Riders .................................................................................................................................48
Table 2: Changing Demographics: Age of Riders and Non-Riders ................................................................................................................................51
Table 3: Changing Demographics: Employment Status of Riders and Non-Riders .......................................................................................................52
Table 4: Changing Demographics: Riders’ and Non-Riders’ Household Income ..........................................................................................................53
Table 5: Changing Demographics: Riders’ and Non-Riders’ Access to Vehicle .............................................................................................................54
Table 6: Demographics: Low-Income Riders ................................................................................................................................................................56

2015 Rider / Non-Rider Survey 12 | P a g e
Table 7: Demographics: Primary Trip Purpose .............................................................................................................................................................70
Table 8: Demographics: New and Experienced Riders .................................................................................................................................................75
Table 9: Demographics: Reliance on Metro .................................................................................................................................................................78
Table 10: Percentage Transferring by Area of Residence .............................................................................................................................................86
Table 11: How Riders Access Bus Stop by Area of Residence .......................................................................................................................................89
Table 12: Distance Riders Walk from Home to Stop by Area of Residence ..................................................................................................................89
Table 13: Demographics: Fare Payment Media ............................................................................................................................................................96
Table 14: Sources of Information by Rider Status ......................................................................................................................................................104
Table 15: Sources of Information by Age ....................................................................................................................................................................104
Table 16: Sources of Information by Income ..............................................................................................................................................................104
Table 17: Trends in Overall Satisfaction by Frequency of Riding................................................................................................................................114
Table 18: System(s) Used ............................................................................................................................................................................................161
Table 19: Demographics: Commute Mode .................................................................................................................................................................175
Table 20: Mode Share by Work Location ....................................................................................................................................................................179
Table 21: Differences in Extent to Which Metro Meets Riders and Non-Riders’ Expectations by Rider Status (2015) .............................................189
Table 22: Provides Excellent Customer Service by Rider Status (2015) ....................................................................................................................192
Table 23: Has High Standards for Service by Rider Status (2015) ..............................................................................................................................192
Table 24: Is Innovative by Rider Status (2015) ..........................................................................................................................................................192
Table 25: Hear Positive Things from Friends and Colleagues by Rider Status (2015) ...............................................................................................194
Table 26: Hear Positive Things in the Media by Rider Status (2015) .........................................................................................................................194
Table 27: Agency I Like and Respect by Rider Status (2015) .....................................................................................................................................196
Table 28: Agency I Trust by Rider Status (2015) ........................................................................................................................................................196
Table 29:Extent to Which Metro Values its Customers by Rider Status (2015) .........................................................................................................196
Table 30: Brand Relationship (I Like to Say I Ride Metro) by Rider Status (2015) ......................................................................................................197
Table 31: Perceived Value of Services Received by Rider Status (2015) ....................................................................................................................198
Table 32: Reasons for Dissatisfaction with Service Changes ......................................................................................................................................215
2015 Rider / Non-Rider Survey 13 | P a g e
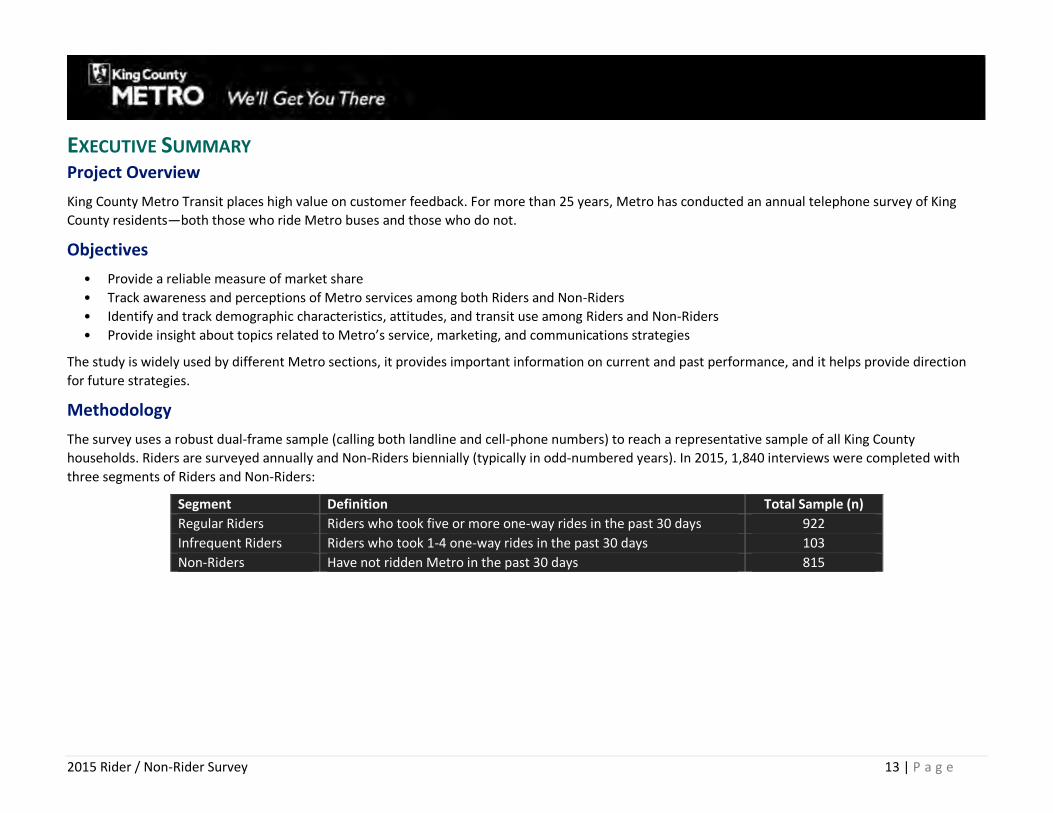
EXECUTIVE SUMMARY Project Overview
King County Metro Transit places high value on customer feedback. For more than 25 years, Metro has conducted an annual telephone survey of King
County residents—both those who ride Metro buses and those who do not.
Objectives
• Provide a reliable measure of market share
• Track awareness and perceptions of Metro services among both Riders and Non-Riders
• Identify and track demographic characteristics, attitudes, and transit use among Riders and Non-Riders
• Provide insight about topics related to Metro’s service, marketing, and communications strategies
The study is widely used by different Metro sections, it provides important information on current and past performance, and it helps provide direction
for future strategies.
Methodology
The survey uses a robust dual-frame sample (calling both landline and cell-phone numbers) to reach a representative sample of all King County
households. Riders are surveyed annually and Non-Riders biennially (typically in odd-numbered years). In 2015, 1,840 interviews were completed with
three segments of Riders and Non-Riders:
Segment Definition Total Sample (n)
Regular Riders Riders who took five or more one-way rides in the past 30 days 922
Infrequent Riders Riders who took 1-4 one-way rides in the past 30 days 103
Non-Riders Have not ridden Metro in the past 30 days 815

2015 Rider / Non-Rider Survey 14 | P a g e
The sample was stratified using the boundaries of Metro’s former planning areas. A
minimum number of interviews with Regular Riders was set for each geographic area
(400 in Seattle / North King County and 250 each in South and East King County).
Actual interview totals for each area are shown at right (“n” refers to total completed
interviews; “RR n” refers to Regular Rider interviews). Data are weighted to reflect
area populations, and additional weighting reflects landline and cellphone incidence
and a supplemental sample of low-income respondents.
2015 Rider / Non-Rider Survey 15 | P a g e
Key Findings
MARKET SHARE
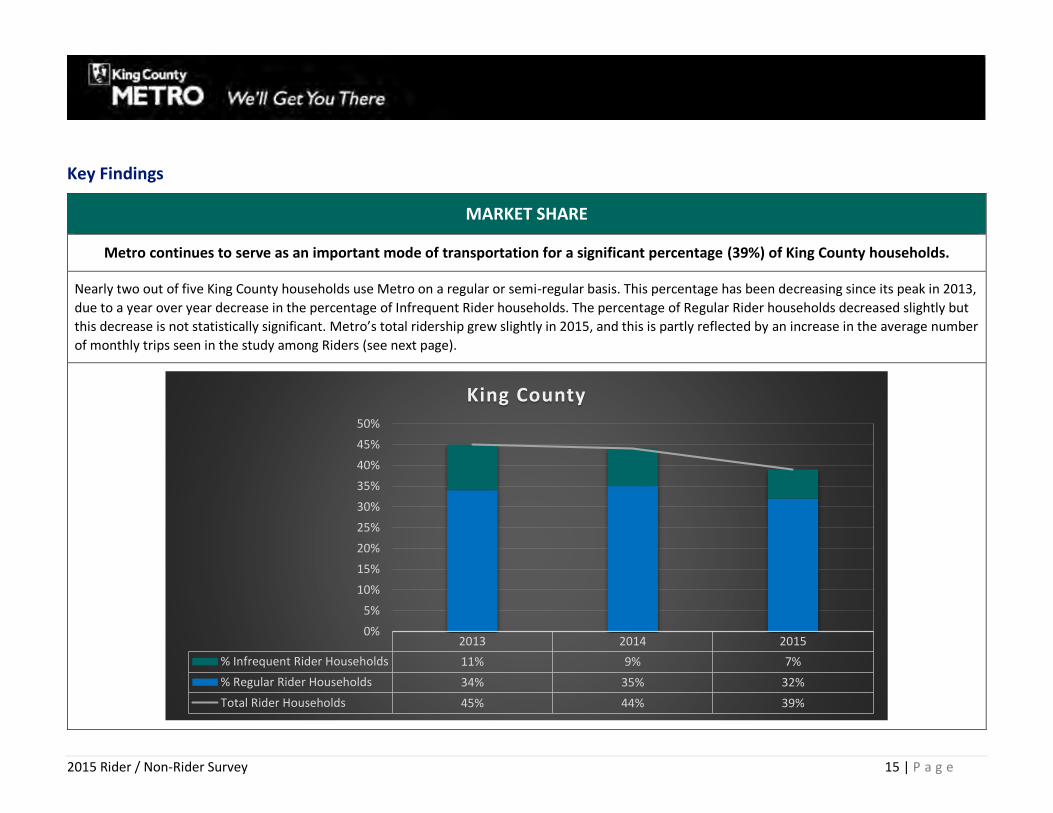
Metro continues to serve as an important mode of transportation for a significant percentage (39%) of King County households.
Nearly two out of five King County households use Metro on a regular or semi-regular basis. This percentage has been decreasing since its peak in 2013,
due to a year over year decrease in the percentage of Infrequent Rider households. The percentage of Regular Rider households decreased slightly but
this decrease is not statistically significant. Metro’s total ridership grew slightly in 2015, and this is partly reflected by an increase in the average number
of monthly trips seen in the study among Riders (see next page).
2013 2014 2015
% Infrequent Rider Households 11% 9% 7%
% Regular Rider Households 34% 35% 32%
Total Rider Households 45% 44% 39%
0%
5%
10%
15%
20%
25%
30%
35%
40%
45%
50%
King County
2015 Rider / Non-Rider Survey 16 | P a g e
TRANSIT USE
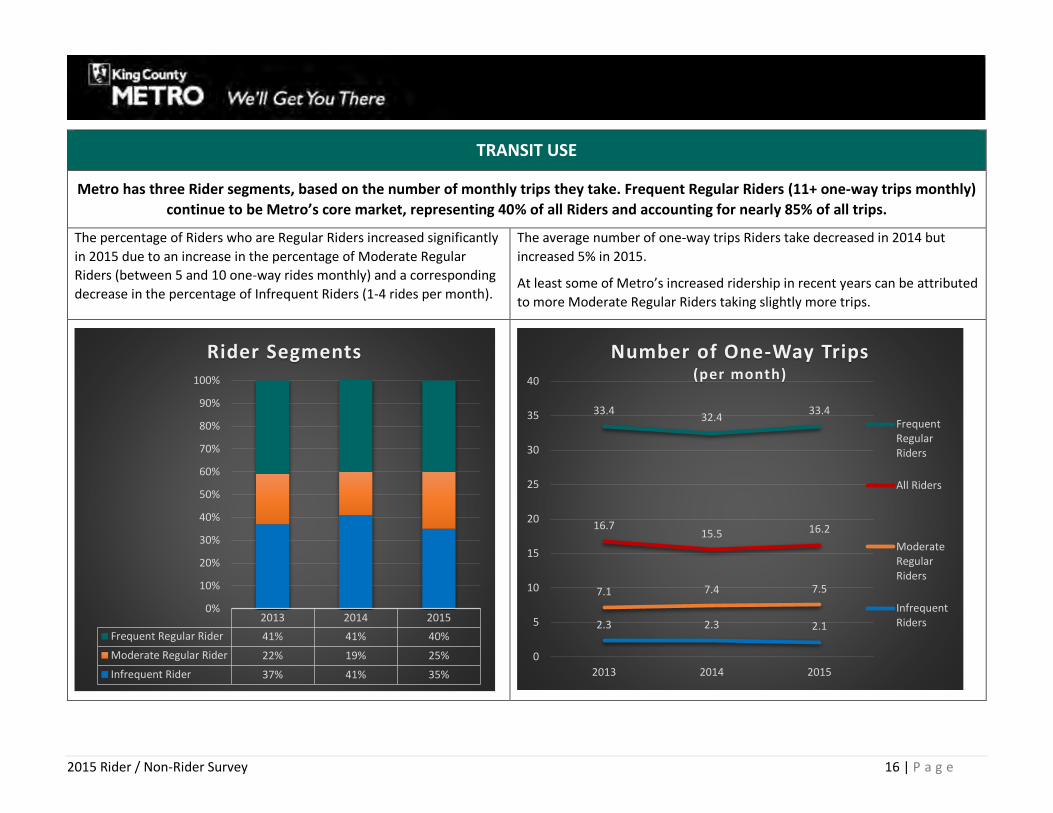
Metro has three Rider segments, based on the number of monthly trips they take. Frequent Regular Riders (11+ one-way trips monthly)
continue to be Metro’s core market, representing 40% of all Riders and accounting for nearly 85% of all trips.
The percentage of Riders who are Regular Riders increased significantly
in 2015 due to an increase in the percentage of Moderate Regular
Riders (between 5 and 10 one-way rides monthly) and a corresponding
decrease in the percentage of Infrequent Riders (1-4 rides per month).
The average number of one-way trips Riders take decreased in 2014 but
increased 5% in 2015.
At least some of Metro’s increased ridership in recent years can be attributed
to more Moderate Regular Riders taking slightly more trips.
2013 2014 2015
Frequent Regular Rider 41% 41% 40%
Moderate Regular Rider 22% 19% 25%
Infrequent Rider 37% 41% 35%
0%
10%
20%
30%
40%
50%
60%
70%
80%
90%
100%
Rider Segments
33.432.4
33.4
16.715.5 16.2
7.1 7.4 7.5
2.3 2.3 2.1
0
5
10
15
20
25
30
35
40
2013 2014 2015
Number of One-Way Trips (per month)
FrequentRegularRiders
All Riders
ModerateRegularRiders
InfrequentRiders

2015 Rider / Non-Rider Survey 17 | P a g e
Most Riders use Metro primarily to commute to work or school, and these Riders account for the majority of Metro trips. But a growing
percentage of Riders primarily use Metro for non-commute trips.
Commuting continues to be the primary trip for which Riders use
Metro. However, a significant and growing percentage use Metro for
non-commute trips—primarily recreation and shopping.
Riders who primarily use Metro for commute trips take three times as many
monthly trips as those using Metro for non-commute trips.
Therefore, while only 53% of all Riders primarily use Metro for commute
trips, they account for 77% of all monthly trips.
2013 2014 2015
Commute 60% 56% 53%
Non-Commute 40% 44% 47%
0%
10%
20%
30%
40%
50%
60%
70%
80%
90%
100%Primary Trip Purpose
22.8 22.923.7
7.67.0
7.6
0.0
5.0
10.0
15.0
20.0
25.0
2013 2014 2015
Number of One-Way Trips (per month)
Riders whoPrimarily UseMetro forCommuteTrips
Riders whoPrimarily UseMetro forNon-CommuteTrips

2015 Rider / Non-Rider Survey 18 | P a g e
Most Metro Riders are “Choice” Riders—that is, they have other transportation options. While the large majority of Riders have access
to a vehicle, some may be choosing to give up their personal vehicles as new transportation options become available.
The majority of Riders rely on Metro for some or very little of their
transportation needs.
However, a relatively consistent percentage (approximately one-third)
relies on Metro for all or most of their transportation.
Only one out of 10 Riders rely on Metro for all or most of their transportation
needs and do not have access to a vehicle.
While the majority of those relying on Metro for all or most of their
transportation needs have access to a vehicle, this percentage has decreased
significantly over the years.
2013 2014 2015
All 7% 9% 8%
Most 29% 22% 26%
Some / Little 64% 69% 66%
0%
10%
20%
30%
40%
50%
60%
70%
80%
90%
100%
Reliance on Metro for Transportation
75%
40%
83%
70%
46%
80%
64%
40%
71%
0%
10%
20%
30%
40%
50%
60%
70%
80%
90%
Combined All / Most All Most
% with Vehicle(s) by Extent Rely on Metro for Transportation
2013 2014 2015

2015 Rider / Non-Rider Survey 19 | P a g e
FARE PAYMENT
Riders continue to move towards paying their fares with ORCA. Riders’ fare payment methods and the products they choose to load on
their ORCA card are strongly related to the frequency with which they ride.
Riders’ use of ORCA to pay their fare has continued to increase slowly.
Use of cash or tickets has decreased since 2013.
Regular Riders are more likely than Infrequent Riders to pay with
ORCA—78% compared to 51%, respectively. Eighty-five percent (85%)
of all Frequent Regular Riders pay with ORCA.
Riders who pay with ORCA are somewhat more likely to have a pass than an
E-Purse on their card. The percentage with a pass on their ORCA Card
increased in 2015 due to a significant increase in the percentage with a
monthly pass.
Regular Riders are more likely than Infrequent Riders to have a pass on their
ORCA Card—61% compared to 25%, respectively.
0% 20% 40% 60% 80% 100%
Cash / Tickets
ORCA
Cash / Tickets ORCA
2015 27% 69%
2014 30% 68%
2013 32% 66%
Fare Payment Method
0% 20% 40% 60% 80% 100%
E-Purse
Pass
E-Purse Pass
2015 49% 53%
2014 52% 49%
2013 41% 51%
Products on ORCA
2015 Rider / Non-Rider Survey 20 | P a g e
INFORMATION SOURCES
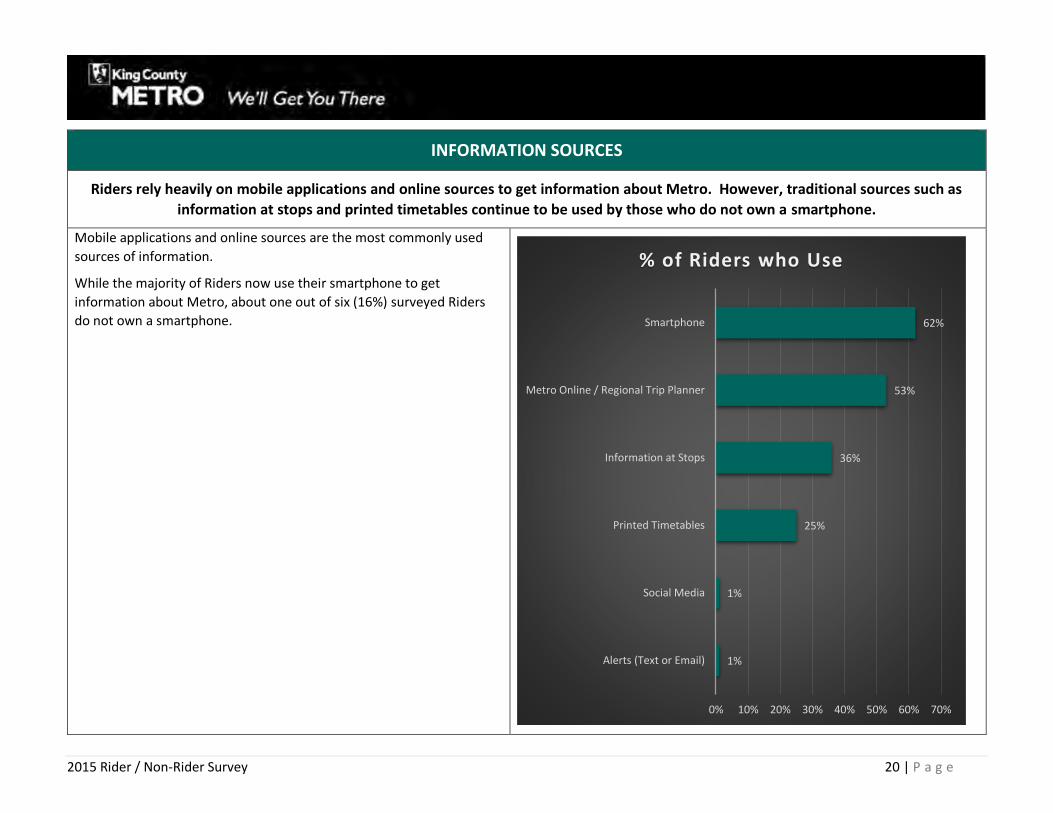
Riders rely heavily on mobile applications and online sources to get information about Metro. However, traditional sources such as
information at stops and printed timetables continue to be used by those who do not own a smartphone.
Mobile applications and online sources are the most commonly used
sources of information.
While the majority of Riders now use their smartphone to get
information about Metro, about one out of six (16%) surveyed Riders
do not own a smartphone.
1%
1%
25%
36%
53%
62%
0% 10% 20% 30% 40% 50% 60% 70%
Alerts (Text or Email)
Social Media
Printed Timetables
Information at Stops
Metro Online / Regional Trip Planner
Smartphone
% of Riders who Use

2015 Rider / Non-Rider Survey 21 | P a g e
OVERALL SATISFACTION WITH METRO
The vast majority of Riders continue to be satisfied with Metro. Moreover, a greater percentage are “very” as opposed to “somewhat”
satisfied.
After increasing significantly in 2014 and reversing the downward trend
first noted in 2011, overall satisfaction with Metro was relatively stable.
The percentage of satisfied Regular Riders increased but was offset by a
decrease in total satisfaction among Infrequent Riders.
Total Satisfied
2013 2014 2015
Regular Riders 88% 88% 90%
Infrequent Riders 80% 91% 85%
A greater percentage of Riders are “very” as opposed to “somewhat”
satisfied with Metro and that difference is increasing. The percentage
“very” satisfied remains below the peak (50%) in 2011.
2013 2014 2015
Very Satisfied 42% 46% 47%
Somewhat Satisfied 43% 43% 41%
Dissatisfied 14% 10% 11%
Total Satisfied 85% 90% 88%
0%
20%
40%
60%
80%
100%
Overall Satisfaction with Metro

2015 Rider / Non-Rider Survey 22 | P a g e
SATISFACTION WITH INDIVIDUAL ELEMENTS OF SERVICE
Riders are most satisfied with fare payment and coach operators, and least satisfied with comfort and cleanliness on-board and at
stops.
Consistent with the trend in overall satisfaction, the percentage of
Riders “very” satisfied with each of the nine primary Service
Dimensions was relatively stable. (The Service Dimensions are
composites of the 42 specific service elements measured in this study.)
However, there were some significant increases for:
Metro operators,
Park-and-ride lots,
Level of service, and
Transferring.
35%
38%
30%
41%
40%
50%
60%
63%
81%
32%
35%
35%
46%
48%
48%
58%
73%
77%
0% 20% 40% 60% 80% 100%
Comfort / Cleanliness at Stops
Comfort / Cleanliness Onboard
Transferring
Level of Service (LOS)
Park-and-Ride Lots
Personal Safety
Information
Operators
Fare Payment
% Very Satisfied with Overall Service Dimensions
2015 2014

2015 Rider / Non-Rider Survey 23 | P a g e
Eighteen of the 42 service elements achieved satisfaction ratings above
50% “very” satisfied. With the exception of personal safety at park-and-
ride lots, all were also above 50% in 2014 as well. (Note that operator
courtesy and availability of information via smartphones were rated for
the first time in 2015.)
In general, ratings were similar to 2014. The percentage of “very”
satisfied ratings increased significantly for:
Personal safety at park-and-ride lots,
How effectively operators handle problems on the buses when
they occur,
Distance from home to stops, and
Operators’ safe operation of their vehicles.
The percentage of “very” satisfied ratings decreased significantly for:
The availability of information about Metro online,
Ease of adding value to an E-Purse,
Daytime safety while waiting for bus,
Daytime safety onboard, and
Overall satisfaction with ORCA.
51%
59%
46%
62%
68%
71%
63%
52%
70%
66%
55%
76%
81%
74%
87%
51%
53%
55%
59%
60%
60%
61%
62%
63%
63%
66%
68%
69%
72%
76%
80%
82%
83%
0% 20% 40% 60% 80% 100%
SAFETY: Transit tunnel
SAFETY: Onboard daytime
P&R LOTS: Personal safety
FARE: Value of service
INFO: Smartphone
FARE: Adding value to E-Purse
INFO: Online
INFO: Ability to obtain
LOS: Distance to stop
SAFETY: Daytime at stops
OPERATORS: Smooth start/stop
OPERATORS: Helpfulness
OPERATORS: Handles problems
FARE: Loading pass
OPERATORS: Courtesy
FARE: Ease of paying
OPERATORS: Drives safely
FARE: ORCA Cards
Highest Rated Service Elements(50%+ Very Satisfied)
2015 2014

2015 Rider / Non-Rider Survey 24 | P a g e
A second tier of service elements received ratings below 50% “very”
satisfied but still above the lowest rated service elements (between 40
and 49% “very” satisfied). With the exception of three, all of these
services were within this tier in 2014 as well.
The element regarding notifications of information about service
changes was not measured in 2014 but received a rating of 41% “very”
satisfied.
The percentage of Riders “very” satisfied increased significantly for:
Frequency of service,
Availability of parking at park-and-ride lots, and
Number of transfers.
45%
35%
41%
40%
45%
41%
40%
34%
47%
36%
41%
41%
41%
41%
43%
43%
43%
44%
45%
45%
47%
0% 10% 20% 30% 40% 50%
INFO: Service changes
INFO: At stops
TRANSFER: Number of
LOS: Travel time
P&R LOTS: Vehicle security
ONBOARD: Loading / unloading(ease due to crowding at stops)
LOS: On-time performance
LOS: Availability of service
P&R LOTS: Parking availability
ONBOARD: Cleanliness
LOS: Frequency of service
Lower Rated Service Elements(40-49% Very Satisfied)
2015 2014

2015 Rider / Non-Rider Survey 25 | P a g e
Fewer than two out of five Riders were “very” satisfied with 13 (of the
42) service elements. Four of these items were new in 2015:
Protection from the weather when waiting, and scheduling of
connections when transferring received some of the lowest
ratings. Scheduling of connections received a somewhat lower
rating than wait times when transferring.
Two information items also fell into this tier: website postings
of delays or problems, and the ability to provide feedback (e.g.,
complaints or commendations).
The remaining items were in this tier in 2014 as well.
While still relatively low, the percentage of “very” satisfied
riders increased for safety while waiting after dark.
Satisfaction decreased significantly for availability of seating on
vehicles (and overcrowding is the element with the least
satisfaction), and also decreased for the cleanliness of stops
and shelters.
21%
29%
40%
26%
35%
28%
36%
41%
37%
20%
26%
27%
27%
30%
30%
32%
34%
35%
35%
35%
36%
39%
0% 10% 20% 30% 40% 50%
ONBOARD: Overcrowding
STOPS: Protection(from weather)
STOPS: Seating(availability of)
TRANSFER: Scheduling(of connections)
ONBOARD: Seating(availability of)
TRANSFER: Wait time
STOPS: Shelters(availability of)
SAFETY: Waiting after dark
ONBOARD: Loading / unloading(ease due to crowding onboard)
STOPS: Cleanliness(stops and shelters)
INFO: Feedback(ability to provide)
SAFETY: Onboard after dark
INFO: Website postings(of delays / problems)
Lowest Rated Service Elements(<40% Very Satisfied)
2015 2014

2015 Rider / Non-Rider Survey 26 | P a g e
KEY DRIVERS ANALYSIS
“Level of Service” elements, notably travel time, availability of service, and on-time performance, are the most important target areas
for continued improvements. Personal safety, particularly after dark, and comfort of the vehicles, notably at it relates to crowding, are
also important targets for improvements.
The Key Drivers Analysis identifies the extent to which the overall service dimensions and the individual service elements influence Riders’ overall
satisfaction with—and expectations of—Metro. Satisfaction ratings are used to identify priorities for improvements and services to maintain.
Level of Service is by far the single largest driver of Riders’ overall satisfaction with and perceptions of Metro. Satisfaction is below 50% and therefore
the Level of Service should be a priority for improvement. Personal safety is the second key driver. Satisfaction with safety after dark is significantly
lower than daytime safety and should be a continued priority. While Comfort and Cleanliness On-Board is somewhat less important, it has one of the
lowest percentages of “very” satisfied ratings and should also be considered a primary target for improvement.
Level of Service
Personal SafetyComfort / Cleanliness
Park-and-Ride Operators
Fare PaymentTransferring
Information
Comfort / Cleanliness at Stops
-0.02
0.03
0.08
0.13
0.18
0.23
0.28
0.33
0.25 0.5 0.75
Bel
ow
Ave
rage
Im
po
rtan
ce
Ab
ove
A
vera
ge
<50%% Very Satisfied >= 50%

2015 Rider / Non-Rider Survey 27 | P a g e
All elements within the Level of Service dimension are key drivers.
Travel time is by far the most important driver (nearly twice as important as any
other element) and receives the lowest rating.
Improvements in frequency of service
may contribute to the somewhat lower importance of this element of service than seen in previous years.
All elements of service within the Personal Safety dimension are key drivers.
Safety after dark should be a primary focus. However, daytime safety should be carefully monitored as satisfaction
decreased in 2015.
All elements of service within the Comfort
and Cleanliness Onboard dimension are key
drivers.
Inside cleanliness is the most significant
driver.
Other target areas for improvement include:
Vehicle security and parking availability
at park-and-ride lots,
Number of transfers,
Ability to provide feedback, and
Protection from the weather.
The table to the right is ordered by the importance of the Dimensions followed by the importance of the Elements within the dimension. Elements in bold are significant drivers. Some Elements are not included due to small base sizes. The dimension scores are based on all elements, including new ones this year.
Importance Rank % Very Satisfied Strategy
Level of Service 1 46% Improve Travel Time 1 41% Improve Availability of Service 2 44% Improve On-Time Performance 3 43% Improve Distance to Stop 4 63% Monitor Frequency of Service 5 47% Strategically Target
Personal Safety 2 48% Improve Onboard During the Day 1 53% Maintain Onboard After Dark 2 36% Improve Waiting at Stops After Dark 3 34% Improve Waiting at Stops During the Day 4 63% Monitor Downtown Transit Tunnel 5 51% Monitor
Comfort and Cleanliness Onboard 3 35% Improve Inside Cleanliness 1 45% Improve Ease of Loading/Unloading (due to crowding at stops) 2 43% Improve Overcrowding 3 20% Improve Ease of Loading/Unloading (due to crowding onboard) 4 35% Strategically Target Availability of Seating 5 30% Strategically Target
Park-and-Ride Lots 4 48% Improve Personal Safety 1 55% Maintain Vehicle Security 2 43% Improve Parking Availability 3 45% Improve
Metro Operators 5 72% Monitor Handles Problems Effectively 1 69% Maintain Courtesy 2 76% Maintain Operates Vehicles Safely 3 82% Maintain Starts / Stops Vehicles Smoothly 4 66% Monitor Helpfulness with Information 5 68% Monitor
Fare Payment 6 72% Monitor Value of Service 1 59% Maintain ORCA Cards 2 83% Monitor Ease of Paying Fares (when boarding) 3 80% Monitor
Transferring 7 33% Strategically Target Number of Transfers 1 41% Improve Scheduling of Connections 2 27% Strategically Target Wait Time when Transferring 3 30% Strategically Target
Information Sources 8 49% Strategically Target Ability to Provide Feedback 1 35% Improve
Availability of Information Online 2 61% Maintain Notification of Service Changes 3 41% Strategically Target Availability of Information at Stops 4 41% Strategically Target Availability of Information via Smartphones 5 60% Monitor
Comfort and Cleanliness at Stops 9 30% Strategically Target Protection from the Weather 1 26% Improve Availability of Shelters 2 32% Improve Cleanliness of Stops / Shelters 3 35% Strategically Target Availability of Seating 4 27% Strategically Target

2015 Rider / Non-Rider Survey 28 | P a g e
STUDY BACKGROUND AND OBJECTIVES King County’s Department of Transportation—Transit Division (King County Metro) places high value on customer feedback and for more than 25 years
has conducted an annual survey with King County residents who
are Metro Riders and Non-Riders. The primary objectives of this
ongoing study are to:
Provide a reliable measure of market share—that is, the percentage of King County households with one or more riders
Track customer awareness and perceptions of Metro services and programs
Identify and track demographic, attitudinal, and transit use characteristics among Riders, Non-Riders, and Commuters
Provide insights on current and relevant topics that are a current focus of Metro’s service, marketing, and communications strategies
Riders are surveyed every year; Non-Riders are generally
included every other (odd-numbered) year. This year’s survey (2015) includes both Riders and Non-Riders.
2015 Rider / Non-Rider Survey 29 | P a g e
METHODOLOGY
Sampling
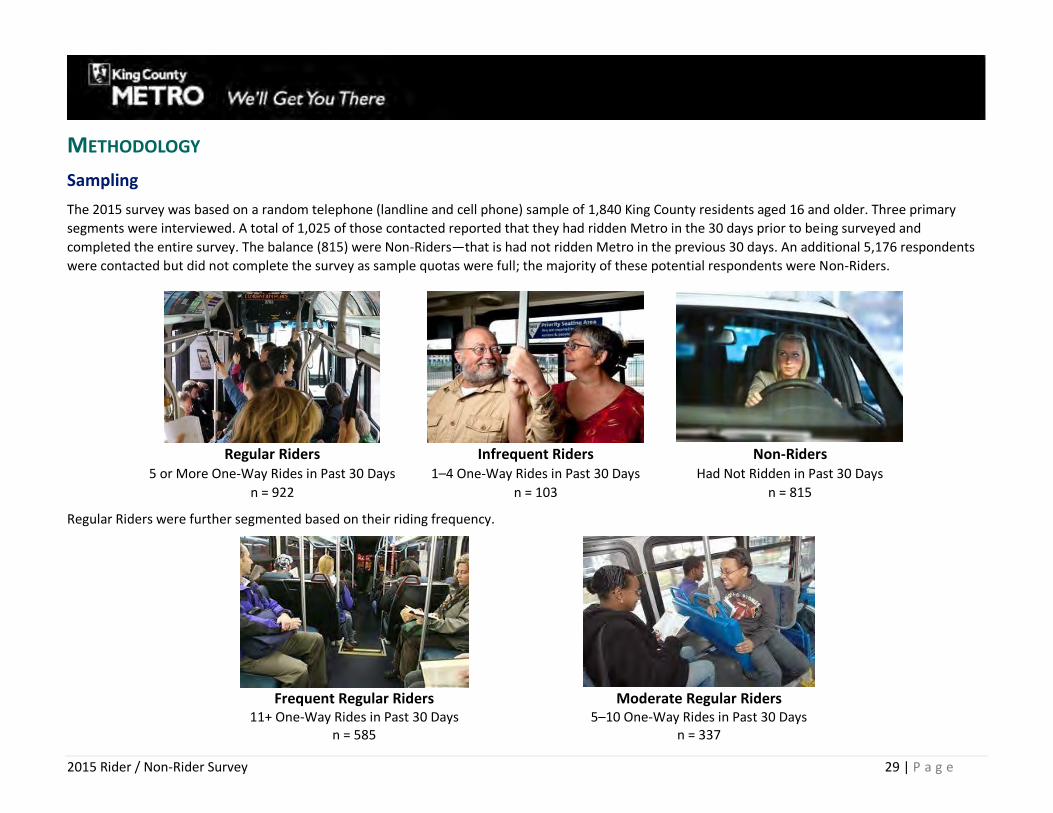
The 2015 survey was based on a random telephone (landline and cell phone) sample of 1,840 King County residents aged 16 and older. Three primary
segments were interviewed. A total of 1,025 of those contacted reported that they had ridden Metro in the 30 days prior to being surveyed and
completed the entire survey. The balance (815) were Non-Riders—that is had not ridden Metro in the previous 30 days. An additional 5,176 respondents
were contacted but did not complete the survey as sample quotas were full; the majority of these potential respondents were Non-Riders.
Regular Riders
5 or More One-Way Rides in Past 30 Days
n = 922
Infrequent Riders
1–4 One-Way Rides in Past 30 Days
n = 103
Non-Riders Had Not Ridden in Past 30 Days
n = 815
Regular Riders were further segmented based on their riding frequency.
Frequent Regular Riders
11+ One-Way Rides in Past 30 Days n = 585
Moderate Regular Riders
5–10 One-Way Rides in Past 30 Days n = 337

2015 Rider / Non-Rider Survey 30 | P a g e
To address the growing prevalence of cell phone only households and
those who primarily use cell phones in King County, a dual-frame (RDD
landline and RDD cell phone) sample methodology was used. Nearly
half (46%) of all King County households are cell-phone-only
households.1
In 2015, more than half of all respondents were reached through the
cell phone sample.
Because cell phones are considered personal devices, the individual
reached on the cell phone was surveyed. For the landline sample, if the
household was identified as a Regular Rider household, an attempt was
made to interview the Regular Rider. If the household was identified as
an Infrequent Rider household, an attempt was made to interview the
Infrequent Rider.
YEAR 2011 2012 2013 2014 2015
CELL PHONE
SAMPLE
# 759 536 976 457 1,021
% 30% 44% 40% 38% 55%
LANDLINE
SAMPLE
# 1,762 682 1,438 744 819
% 79% 56% 60% 62% 45%
TOTAL # 2,521 1,218 2,414 1,201 1,840
1 Source: Wireless Substitution: State-level Estimates from the National Health Interview Survey, 2012, Number 70, December 18, 2013.

2015 Rider / Non-Rider Survey 31 | P a g e
To provide the ability to do reliable analysis across the region served by Metro, the sample was stratified using the boundaries of Metro’s former planning
areas. A minimum number of interviews with Regular Riders was set for each geographic area. This minimum number was set to be roughly proportionate
to the number of households in each area.
COUNTYWIDE
SEATTLE/
NORTH
SOUTH
KING
EAST
KING
REGULAR RIDERS MINIMUM N 900 400 250 250
REGULAR RIDERS ACHIEVED 922 406 252 264
INFREQUENT RIDERS 103 666 17 20
NON-RIDERS 815 238 340 237
TOTAL 1,840 710 609 521
Finally, to ensure representation of King County’s diverse population,
supplemental sampling, again using both landline and cell phone sample,
was undertaken to ensure representation of low-income households and
Hispanic and Asian riders roughly in proportion to their incidence in the
general population.
TARGET DEMO
% IN
POPULATION
NUMBER
ACHIEVED % OF SAMPLE
LOW-INCOME
HOUSEHOLDS
(<$35,000)
24% 268 24%
HISPANICS 7% 71 6%
ASIAN 13% 137 11%
Data were weighted based on this complex sampling plan. Full documentation of the weighting procedures is provided to Metro separately.

2015 Rider / Non-Rider Survey 32 | P a g e
Using a 95 percent confidence level, the margin of error of the entire
sample is no greater than plus or minus 2.3% percentage points. This
means that if the study were duplicated in the same time frame with
1,800 different respondents, sampled in the same fashion, 95 times out
of 100, the same result would occur, within the stated range. The
adjacent table provides the margin of error for key subgroups in the
study.
N
MARGIN OF ERROR
95% CONFIDENCE
LEVEL
TOTAL CONTACTS 7,016 ±1.2%
TOTAL COMPLETES 1,840 ±2.3%
SEATTLE / NORTH
KING COUNTY 710 ±3.7%
SOUTH KING
COUNTY 609 ±4.0%
EAST KING COUNTY 521 ±4.3%
REGULAR RIDERS 922 ±3.2%
INFREQUENT RIDERS 103 ±9.7%
NON-RIDERS 815 ±3.4%
2015 Rider / Non-Rider Survey 33 | P a g e
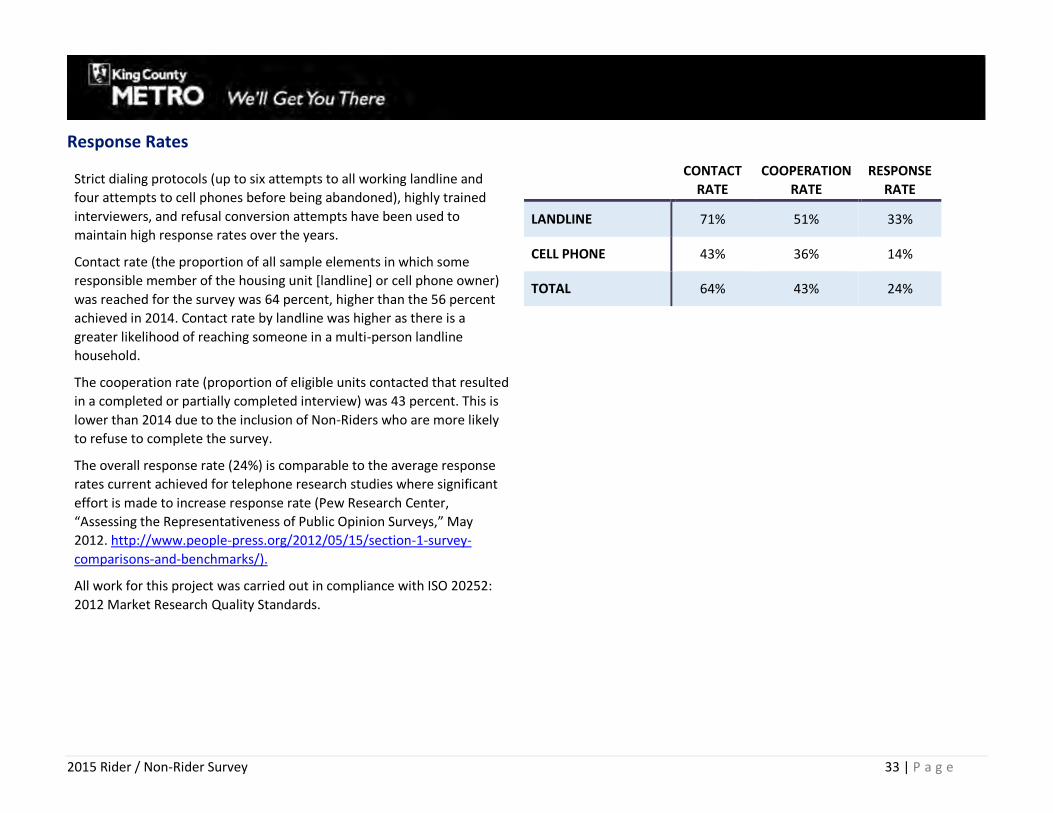
Response Rates
Strict dialing protocols (up to six attempts to all working landline and
four attempts to cell phones before being abandoned), highly trained
interviewers, and refusal conversion attempts have been used to
maintain high response rates over the years.
Contact rate (the proportion of all sample elements in which some
responsible member of the housing unit [landline] or cell phone owner)
was reached for the survey was 64 percent, higher than the 56 percent
achieved in 2014. Contact rate by landline was higher as there is a
greater likelihood of reaching someone in a multi-person landline
household.
The cooperation rate (proportion of eligible units contacted that resulted
in a completed or partially completed interview) was 43 percent. This is
lower than 2014 due to the inclusion of Non-Riders who are more likely
to refuse to complete the survey.
The overall response rate (24%) is comparable to the average response
rates current achieved for telephone research studies where significant
effort is made to increase response rate (Pew Research Center,
“Assessing the Representativeness of Public Opinion Surveys,” May
2012. http://www.people-press.org/2012/05/15/section-1-survey-
comparisons-and-benchmarks/).
All work for this project was carried out in compliance with ISO 20252:
2012 Market Research Quality Standards.
CONTACT
RATE
COOPERATION
RATE
RESPONSE
RATE
LANDLINE 71% 51% 33%
CELL PHONE 43% 36% 14%
TOTAL 64% 43% 24%

2015 Rider / Non-Rider Survey 34 | P a g e
Survey Instrument
The questionnaire included many
of the same questions as in
previous years as well as new
questions to address special
topics. The topics covered in the
survey for each major respondent
segment are shown in the
adjacent table.
The interviews averaged 17
minutes. The survey was
significantly longer for Regular
and Infrequent Riders (23
minutes, respectively) than for
Non-Riders (10 minutes).
All People Contacted
• Household Ridership • Individual Ridership
All Respondents (Those Who Completed Survey)
• Commute Status & Behavior • Perceptions of Metro • Demographics
Current Riders
• Frequency • Trip Purpose(s) • Satisfaction with Service
• Transit Dependence • Transferring • Length of Time Riding
• Personal Travel • Fare Payment • Travel Behavior
• Information Sources • Overall Satisfaction • Personal Safety
• Management of Service Change
Non-Riders
• Use of Other Systems • Use of Metro • Potential Ridership
The survey instrument was pretested over several days. Initial pretests were focused on questionnaire wording and respondent understanding.
Subsequent pretesting was used to test study assumptions including survey length and incidence. Data collection began on October 21, 2015 and
continued through December 9, 2015. No interviewing was done on Thanksgiving Day or the day before or after.
Bernett Information Group was used for telephone data collection; they also did the data collection for the 2013 and 2014 surveys. A minimum of 10
percent of all interviews were monitored; NWRG project staff monitored (either live or through recordings) a minimum of 5 percent of the interviews.
Interviews were conducted in English and Spanish. The survey was translated into Spanish and administered by multilingual interviewers. One hundred
twenty (120) respondents self-identified as Hispanic; a total of 17 interviews (14%) chose to complete the survey in Spanish.

2015 Rider / Non-Rider Survey 35 | P a g e
Analysis and Reporting
This report summarizes the major findings of the research for each survey topic overall and by key subgroups such as Rider status based on frequency of riding.
Tables and charts provide supporting data. In the charts and tables, unless otherwise noted, column percentages are used. Percentages are rounded to the
nearest whole number. Columns generally sum to 100 percent except in cases of rounding. In some instances, columns sum to more than 100 percent due to
multiple responses given to a single question; these cases are noted.
All satisfaction and attitudinal questions use a five-point scale. The Top Box scoring method only accounts for the percentage of respondents selecting the
highest rating. Top Two Box analysis combines the percentage of respondents selecting the top two score. In some instances, the sum of the top two scores is
greater or less than the individual scores. This is due to rounding as percentages are rounded to the nearest whole number.
On many questions in the survey, respondents may have answered “don’t know.” In addition, respondents have the option to refuse to answer any question. In
general, “don’t know” and “refusals” are counted as missing values and are not included in the reported percentages except as noted.
For every major topic, the specific question number or code and the actual text asked of the respondent is provided. The full questionnaire is included in the
Appendix. The base for the question—that is, the characteristics and number of respondents asked the question—is also provided. The base for a question may
vary depending on answers to previous questions or inclusion in specific analytical groups—for example, Regular Riders versus Infrequent Riders. Unless
otherwise noted, the results in this report are based on the final weighted sample data.

2015 Rider / Non-Rider Survey 36 | P a g e
The report also identifies differences that are statistically significant. If a particular difference is large enough to be unlikely to have occurred due to chance or
sampling error, the difference is statistically significant. Unless noted otherwise, statistical significance was tested at the 95 percent confidence levels.
Unweighted cell sizes are used to determine statistically significant differences between respondent groups. Significant differences are pointed out in the report
text and identified in tables and charts as follows.
When comparing changes over time, comparisons are made to the prior
year. In the table below, the notation ▲in 2013 indicates that the
percentage of Riders whose primary trip is a commute trip increased
significantly from 2012. Similarly, the notation ▼ in 2014 indicates that the
percentage of Riders whose primary trip is a commute trip decreased
significantly from 2013.
When comparing the differences in responses between different
respondent groups, significant differences are noted by showing whether
responses are significantly higher (▲) or lower (▼) than the columns
identified by letter. In the table below the notation (a▲, c▲) under (b)
Regular Rider indicates that the percentage of Regular Riders’ whose
primary trip is a commute trip is significantly higher than (a) all Riders and
(c) Infrequent Riders.
Significant increase (▲) or (▼) from previous year
Significant difference (▲) or (▼) between respondent groups
A statistically significant difference may not always be practically significant. The differences of practical significance depend on the judgment of
the organization’s management.

2015 Rider / Non-Rider Survey 37 | P a g e
FINDINGS—MARKET SHARE
Summary
This annual survey provides a reliable measure of market share—defined as the percentage of King County households with one or more Regular Riders
(individuals taking at least five one-way rides monthly). This is done by asking all households contacted: (1) the number of individuals in their household 16 years
of age and older, (2) the number of household members taking at least one one-way ride on a Metro bus in the previous 30 days, and (3) the number taking five
or more one-way rides in the previous 30 days.
Topic What We Found What It Means
Household
Market
Share – King
County
The proportion of households in King
County that have a Rider fell from its peak
of 45% in 2013 to 39% in 2015.
Despite this decrease, the percentage of
Regular Rider households is about the
same as in 2012 and remains significantly
higher than in 2010 and 2011 when only
one out of four King County households
were Regular Rider households.
Household Type
Rider Non-Rider
2015 39%▼ 61%▲
2014 44% 56%
2013 45%▲ 55%▼
2012 40%▲ 60%▼
2011 35%▼ 65%▲
2010 38% 62%
Regular Rider Infrequent Rider
2015 32%▼ 7%▼
2014 35% 9%▼
2013 34% 11%▲
2012 33%▲ 7%▼
2011 26% 9%▼
2010 25% 13%
Regular Rider Household: 1 or More Regular (5+ One-Way Trips)
Riders in Household; Household Could Also Include Infrequent Riders
Infrequent Rider Household: 1 or More Infrequent (1-4 One-Way
Trips) Riders in Household; No Regular Riders
Significant increase (▲) or (▼) from previous year
While it appears that the decrease in market
share occurred primarily between 2014 and
2015, it is possible that it began late in 2014
after the September 2014 service changes.
The timing of the 2014 survey (immediately
following this service change) may not have
picked up some changes in behaviors as
Riders were still adjusting to these changes.
Ridership figures from Metro showed
significant growth between 2010 and 2014,
although the rate of growth began slowing in
2014. Total ridership for 2015 was up 0.8
percent over 2014; growth outside the City
of Seattle was flat.
Increasing ridership, in the face of
decreasing in market share (measured as the
percentage of households with Riders) is
typically due to increases in the number of
trips taken by riders.

2015 Rider / Non-Rider Survey 38 | P a g e
Topic What We Found What It Means
Household
Market
Share –
Seattle*
The City of Seattle saw statistically
significant growth in Regular Rider
households.
The percentage of Rider households in
Seattle is at its highest level since 2010
and above the last peak in 2012 when 64
percent of all Seattle households were
Rider households.
Household Type
Rider Non-Rider
2015 65% 35%
2014 62% 38%
2013 61%▲ 39%
2012 64%▲ 36%▼
2011 55% 45%
2010 58% 42%
Regular
Rider
Infrequent
Rider
2015 54%▲ 11%
2014 49% 13%
2013 47%▼ 15%▲
2012 53%▲ 11%▼
2011 41% 14%
2010 42% 16%
* Three zip codes in Seattle also include small areas outside of
Seattle (portions of Shoreline, Richmond Beach, Kenmore); sample
sizes in these areas are small
Significant increase (▲) or (▼) from previous year
Seattle continues to represent King County’s
core market. It is the most densely populated
geographic area, and extensive, relatively
high-frequency service has translated into
very high market share. The City of Seattle
accounts for just 37 percent of all King County
households but 62 percent of Rider
households.
Addition of new services in 2015 translated
into Infrequent Riders taking additional trips,
thus moving to Regular Rider status, and Non-
Riders starting to ride and is clearly evident in
the 2 percent ridership growth reported by
Metro in this area.

2015 Rider / Non-Rider Survey 39 | P a g e
Market Share (Households with Riders)
Metro has traditionally examined three components of market share: (1) the percent of households with one or more Regular Riders (could also include
Infrequent Riders); (2) the percent of Infrequent Rider households (no Regular Riders); and (3) Non-Rider households. Market share is computed based on all
households contacted who provided data on the extent to which the respondent on the phone or others in the household use Metro.
After being relatively stable for the past
three years, market share (% of Regular
Rider households) decreased in 2015 but
remains significantly higher than 2010-
2011.
o The percentage of Infrequent Rider
households has decreased steadily
since 2013.
When combined, the 3 percentage point
decrease in Regular Rider households and
2 percentage point decrease in
Infrequent Rider households, results in a
significant increase in the percentage of
Non-Rider households. The percentage of
Non-Rider households remains below the
peak in 2011.
Figure 1: Market Share: Countywide
Questions: S4A—Including yourself, how many people in your household, age 16 or over, have taken between one (1) and four (4) one-way rides on a Metro bus in the last 30 days? S4B—Including yourself, how many people in your household, age 16 or over, have taken at least five (5) one-way rides in the last 30 days?
Base: All contacted households
▲ / ▼indicates a statistically significant change from previous year

2015 Rider / Non-Rider Survey 40 | P a g e
Differences by Geographic Area
While no longer defined for planning purposes, Metro has traditionally stratified the county by three major geographic areas.
Seattle / North King County continues to
represent Metro’s core market.
It is the most densely populated.
Nearly two out of three households are
Regular Rider households
The percentage of Regular Rider
households has increased significantly
since 2013, surpassing the previous record
of 53 percent in 2012.
At the same time, the percentage of
Infrequent Rider households decreased
and the percentage of Non-Rider
households decreased, suggesting
increased commitment to being a Rider
versus a Non-Rider.
Figure 2: Market Share: Seattle / North King County

2015 Rider / Non-Rider Survey 41 | P a g e
Geographically larger, South King County
represents nearly the same number of
households as Seattle / North King County
(35% of all households).
One out of five households in this area
ride Metro.
o The percentage of Rider households
increased significantly in 2013 but
began to drop 2014 and decreased
again in 2015. The sharply higher rates
in 2013 and 2014 may have been
anomalies, and market share is again
at its longer-term rate.
o The percentage of Regular Rider
households is at its lowest level since
2011 but remains higher than 2010.
Figure 3: Market Share: South King County
East King County is also geographically large
but represents the smallest number of
households (27% of all households).
The share of Regular Rider households
increased steadily in this area between
2010 and 2014 and then dropped
significantly in 2015, but remains
significantly higher than in 2010.
The share of Infrequent Rider households
peaked in 2013.
Figure 4: Market Share: East King County

2015 Rider / Non-Rider Survey 42 | P a g e
FINDINGS: RIDER AND NON-RIDER DEMOGRAPHICS
Summary
Topic What We Found What It Means
All Current
Riders
Riders surveyed in 2015 generally mirror
the demographic characteristics of King
County’s population.
King County
Population*
Current
Metro
Riders
Male 50% 51%
Female 50% 49%
16–17 3% 4%
18–34 31% 30%
35–54 36% 32%
55+ 29% 34%
Mean 43.5 44.7
Employed 65% 67%
Not Employed 35% 33%
<$35,000 24% 23%
$35K-<$55K 17% 15%
$55K–<$75K 13% 13%
$75K–<$100K 12% 17%
$100K + 34% 31%
Median $73,035 $73,732
Caucasian** 62% 70%
Non-White** 23% 19%
Hispanic 9% 6%
Mixed Race 5% 6%
% with License N/A 81%
% with Vehicle
in Household 91% 85%
* Source: 2014 American Community Survey three-year
estimates
** Does not include Hispanic
Not only does a significant percentage of
King County households use Metro, the
demographic analysis clearly
demonstrates that Metro serves a broad
cross-section of the County.
Metro is a major component of a complex
regional transportation system that
provides services to the general
population, not just those who have no
other options for getting around.

2015 Rider / Non-Rider Survey 43 | P a g e
Topic What We Found What It Means
Regular and
Infrequent
Riders
Nearly two out of three (65%) Riders are
Regular Riders—that is, they take five or
more one-way rides monthly.
With the exception of employment status,
race / ethnicity, and age, there are few
significant differences between Regular
and Infrequent Riders.
The average age of Regular Riders
has consistently been between 42
and 44 over the years.
Infrequent Riders are aging—in
2009, 28 percent of Infrequent
Riders were 55 and older; this
percentage has increased to 43
percent in 2015.
Regular Riders are significantly less likely
than Infrequent Riders to have a driver’s
license and/or access to a vehicle.
The percentage of Regular Riders
with no vehicle access more than
doubled since 2009—from 9
percent in 2009 to 19 percent in
2015.
Regular
Riders
Infrequent
Riders
% of Riders 65% 35%
Male 53% 45%
Female 47% 55%
16–17 4% 4%
18–34 32% 27%
35–54 36% 27%
55+ 29%▼ 43%▲
Mean 43.1 47.7
Employed 68% 64%
Student 12%▲ 5%▼
Retired 13%▼ 22%▲
Not Employed 8% 8%
<$35,000 25% 20%
$35K-<$55K 15% 16%
$55K–<$75K 13% 14%
$75K–<$100K 16% 20%
$100K + 31% 30%
Median $72,391 $76,200
Caucasian** 65%▼ 80%▲
Non-White** 20% 15%
Hispanic 7% 2%
Mixed Race 8% 2%
% with License 77%▼ 91%▲
% with Vehicle
in Household 81%▼ 91%▲
▲ / ▼indicates a statistically significant difference
between respondent group
** Does not include Hispanic
Regular and Infrequent Riders are two
distinct segments demographically and, as
shown in the next section, have very
different travel behaviors.
Metro’s Regular Riders are clearly younger
and are likely to have different values and
attitudes toward riding as well as different
needs and expectations for service. While
the majority continue to have access to a
vehicle, this percentage has decreased
significantly, suggesting a conscious effort
to do without a car or use alternatives to
their own vehicle (car sharing, Car2Go,
rentals, etc.).
As people age, they may choose to use
Metro less often. This could be a
conscious choice to use other modes or
they may be taking fewer trips by any
mode.

2015 Rider / Non-Rider Survey 44 | P a g e
Regular
Riders
More than three out of five Regular Riders
surveyed were Frequent Regular Riders—
that is, they take 11 or more one-way
rides monthly.
South King County has the highest
percentage of Frequent Regular
Riders—seven out of ten (70%)
Riders are Frequent Regular
Riders.
With the exception of age and
employment status, there are few
demographic differences between
Frequent and Moderate Regular Riders.
Frequent Regular Riders are:
More likely to be employed.
Younger than Moderate Regular
Riders, with a relatively high
percentage between the ages of
35 and 54. The average age of
Frequent Regular Riders is 42.
Moderate Regular Riders are
Less likely to be employed; one
out of five are retired.
Older than Frequent Regular
Riders (average age 44) but
younger than Infrequent Riders
(average age 48) and Non-Riders
(average age 53).
Frequent
Regular
Riders
Moderate
Regular
Riders
% of Regular
Riders 62% 38%
16–17 4% 4%
18–34 32% 32%
35–54 38%▲ 31%▼
55+ 26%▼ 33%▲
Mean 42.2▼ 44.4▲
Employed 75%▲ 58%▼
Student 11% 13%
Retired 8% 19%
Not Employed 6%▼ 10%▲ ▲ / ▼indicates a statistically significant difference
between respondent groups
The difference in age between Frequent
and Moderate Regular Riders as well as
between Infrequent and Non-Riders
suggests that as Riders age, they use
Metro less often. As noted above this
could be a result of using different modes
of transportation or a decline in actual trip
taking by any mode.
The differences in age between the three
rider segments (Frequent Regular,
Moderate Regular, and Infrequent Riders)
and corresponding employment status
suggest opportunities for generational
segmentation and marketing
communications.

2015 Rider / Non-Rider Survey 45 | P a g e
Topic What We Found What It Means
Low-Income
Riders
Nearly one out of four (23%) Riders have a
household income that is below
$35,000—that is, are Low-Income Riders.
Low-Income Riders are:
More likely to be female than male.
Somewhat older due to a higher
percentage 55 years of age and older
and a lower percentage of those
between the ages of 35 and 54.
Less likely to be employed. Significant
percentages are students or retired.
Significantly less likely to have a
driver’s license and/or access to a
vehicle.
<$35K >$35k
% of Riders 23% 77%
Male 42%▼ 53%▲
Female 58%▲ 47%▼
16–17 4% 3%
18–34 31% 30%
35–54 25%▼ 36%▲
55+ 39%▲ 31%▼
Mean Age 45.4 44.5
Employed 37%▼ 78%▲
Student 17%▲ 7%▼
Retired 27%▲ 11%▼
Not Employed 19%▲ 4%▼
Median $18,182 $90,376
Caucasian** 65%▼ 72%▲
Non-White** 20% 18%
Hispanic 8% 5%
Mixed Race 7% 5%
% with License 56%▼ 90%▲
% with Vehicle
in Household
55%▼ 92%▲
▲ / ▼indicates a statistically significant difference
between respondent groups
** Does not include Hispanic
King County Metro provides an important
mobility service for those who have
limited options for travel. This is a diverse
segment, notably in terms of their age and
employment status and is likely to have
varying travel needs.

2015 Rider / Non-Rider Survey 46 | P a g e
Topic What We Found What It Means
Non-Riders
Non-Riders are older than Riders.
Nearly half of all Non-Riders are
55 years of age and older.
Only one out of five Non-Riders
are under the age of 35.
In keeping with their age, a significant
percentage (32%) of Non-Riders are
retired.
While their median incomes are similar, a
greater percentage of Riders have
household incomes below $35,000 while a
higher percentage of Non-Riders have
household incomes between $35,000 and
$55,000.
Nearly all Non-Riders have a driver’s
license and/or access to a vehicle.
Non-Riders
Metro
Riders
Male 48% 51%
Female 52% 49%
16–34 20% 34%▲
35–54 32% 32%
55+ 48%▲ 34%▼
Mean Age 52.9 44.7
Employed 55% 67%
Not Employed 45%▲ 33%
<$35,000 18%▼ 23%▲
$35K-<$55K 21%▲ 15%▼
$55K–<$75K 14% 13%
$75K–<$100K 13%▼ 17%▲
$100K + 34% 31%
Median $73,281 $73,732
Caucasian** 70% 70%
Non-White** 17% 19%
Hispanic 7% 6%
Mixed Race 8% 6%
% with License 95%▲ 81%▼
% with Vehicle
in Household 96%▲ 85%▼
▲ / ▼indicates a statistically significant difference
between respondent groups
** Does not include Hispanic
Access to one or more vehicles is the
characteristic that most clearly
distinguishes Non-Riders from Riders.
Employment status is also a major
distinguishing characteristic. This would
suggest that as individuals age and/or
retire they are less likely to consider
Metro as a transportation option. While
frequency of riding would most likely be
lower, Metro should focus on retaining
those who currently ride to continue
riding even as their lifestyles change.

2015 Rider / Non-Rider Survey 47 | P a g e
Demographic Characteristics: Riders and Non-Riders
There are significant differences in the demographic characteristics of the different Rider and Non-Rider segments.
Gender
Regular Riders are more likely than Infrequent Riders and Non-Riders to be men.
Moreover, Regular Riders are more likely than the general population in King County to be men.
Age
Riders are significantly younger than Non-Riders.
Moreover, Regular Riders are significantly younger than Infrequent Riders.
Non-Riders are by far the oldest segment; nearly half are 55 years of age and older.
The age distribution of Regular Riders is almost the same as the age distribution of the general population in King County while the percentage of Non-
Riders and, to a lesser extent, Infrequent Riders who are older (55+) is significantly higher than the general population.
Employment Status
Three out of five respondents are employed (full-time, part-time, or self-employed).
Riders are significantly more likely than Non-Riders to be employed or students.
o In addition, Regular Riders are more likely than Infrequent Riders to be employed or students.
Reflecting their older age, nearly one out of three Non-Riders are retired.
The percentage of Riders who are employed is nearly the same as the percentage of the general population in King County.
Income
There are no significant differences in median income across the different Rider and Non-Rider segments.
Regular Riders are more likely than Non-Riders to have household incomes below $35,000.
Household Composition
There are no significant differences in household composition between Riders and Non-Riders. Moreover, the household composition of both Riders and Non-
Riders is similar to the general population.
While a small segment, Infrequent Riders are more likely than Regular Riders and Non-Riders to live alone.

2015 Rider / Non-Rider Survey 48 | P a g e
Race / Ethnicity
There are few significant differences between Riders’ and Non-Riders’ race / ethnicity.
Riders, notably Regular Riders, are more likely than Non-Riders to be black. Blacks are somewhat under-represented in the total sample.
Regular Riders are more diverse than Infrequent Riders.
Regular Riders are less likely than Infrequent Riders to be white, and more likely to be black, Hispanic, or of mixed race.
Vehicle Access
While the majority of Riders have a driver’s license and/or access to a vehicle, Riders are significantly less likely than Non-Riders to have a license or vehicle
access.
Nearly one out of four Regular Riders do not have a driver’s license and one out of five do not have access to a vehicle.
Table 1: Demographic Characteristics of Riders and Non-Riders
All Respondents (n = 1,840; nw = 1,840)
(a)
All Riders (n = 1,025; nw = 1,025)
(b)
Regular Riders (n = 922; nrw = 669)
(c)
Infrequent Riders (n = 103; nrw = 356)
(d)
Non-Riders (n = 815; nw =1,207)
(e)
General Population
GENDER
MALE 49% (c▲)
51% 53% (a▲, e▲)
45% 48% (c▼)
50%
FEMALE 51% (c▼)
49% 47% (a▼, e▼)
55% 52% (c▲)
50%
AGE
16–17 2%
(b▼, c▼) 4%
(a▲, e▲) 4%
(a▲, e▲) 4%
1%
(b▼, c▼, d▼) 3%
18–34 23% (b▼, c▼, e▼)
30% (a▲, e▲)
32% (a▲, e▲)
27% 19% (a▼, b▼, c▼)
31%
35–54 32% 32% 36% 27% 32% 36%
55+ 43% (b▲, c▲, e▼)
34% (a▲, c▲, e▼)
29% (a▼ , b▼▲, d▼, e▼)
43% (c▲)
48% (a▲, b▲, c▲)
29%
MEAN 50.0 44.7 43.1 47.7 52.9 43.5

2015 Rider / Non-Rider Survey 49 | P a g e
All Respondents (n = 1,840; nw = 1,840)
(a)
All Riders (n = 1,025; nw = 1,025)
(b)
Regular Riders (n = 922; nrw = 669)
(c)
Infrequent Riders (n = 103; nrw = 356)
(d)
Non-Riders (n = 815; nw =1,207)
(e)
General Population
EMPLOYED 59% (b▼, c▼)
67% (a▲, e▲)
68% (a▲, e▲)
64% 55% (b▼, c▼)
65%
STUDENT 5% (b▼, c▼, e▲)
10% (a▲, e▲)
12% (a▲, d▲, e▲)
5% (c ▼)
3% (a▼, b▼, c▼)
N/A RETIRED 26% (b▲, c▲, a▼)
16% (a▼, c▲, e▼)
13% (a▼, b▼, d▼, e▼)
22% (c▲)
32% (a▲, b▲, c▲)
OTHER 10% (c▲)
8% (a▼)
8% (a▼, e▼)
8% 11% (b▲, c▲)
INCOME
<$35K 20% (c▼)
23% (e▲)
25% (a▲, e▲)
20% 18% (b▼, c▼)
24%
$35K –$55K 19% (b▲, c▲)
15% (a▼, e▼)
15% (a▼, e▼)
16% 21% (b▲, c▲)
17%
$55K –$75K 14% 13% 13% 14% 14% 13%
$75K –$100K 15% 17% (e▲)
16% 20% 13% (b▼)
12%
$100K+ 33% 31% 31% 30% 34% 34%
MEDIAN $73,442 $73,732 $72,391 $76,200 $73,281 $73,035
HOUSEHOLD COMPOSITION
% SINGLE FAMILY 27% (c▲, d▼)
30% (c▲, d▼)
21% (c▲, d▼)
46% (b▲, b▲, c▲, b▲,)
26% (c▲, d▼)
31%
MEAN # IN HOUSEHOLD 2.50 2.47 2.65 2.12 2.51 2.44
RACE / ETHNICITY
CAUCASIAN ALONE 70% (c▼, d▼)
70% (c▲, d▼)
65% (a▼, b▼, d▼)
80% (a▲, ▲b, c▲, e▲)
70% (d▼)
62%
ASIAN ALONE 14% 14% 14% 13% 14% 16%
BLACK ALONE 3% (c▼)
5% (e▲)
6% (a▲, e▲)
2% 2% (b▼, c▼)
7%
HISPANIC 6% 6% 7% (d▲)
2% (c▼)
7% 9%
MIXED RACE / OTHER 7% 6% 8%▲ 2%▲ 8% 5%
VEHICLE ACCESS
% W/ LICENSE 90% (b▲, c▲, e▼)
81% (a▼, c▲, d▼, e▼)
77% (a▼, b▼, d▼, e▼)
91% (b▲, c▲)
95% (a▲, b▲, c▲)
91%

2015 Rider / Non-Rider Survey 50 | P a g e
% W/ VEHICLES 92% (b▲, c▲, e▼)
85% (a▼, c▲, e▼)
81% (a▼, b▼, d▼, e▼)
91% (c▲)
96% (a▲, b▲, c▲)
N/A
MEAN # VEHICLES 1.96 1.61 1.52 1.78 2.14 N/A Employed includes those working full- or part-time (including students who work full- or part-time) or self-employed or work at home. Student includes full-time students (not working).
Columns may to more or less than 100% due to rounding
▲ / ▼indicates a statistically significant difference(s) between respondent groups

2015 Rider / Non-Rider Survey 51 | P a g e
Changing Demographics: Riders and Non-Riders
Age
Reflecting the general characteristics of the population, those surveyed are increasingly older. However, this varies significantly between Riders and Non-Riders.
The age distribution of Regular Riders has varied little over the years. Regular Riders are primarily between the ages of 18 and 54; average age is
between 43 years of age.
Non-Riders and, to a lesser extent, Infrequent Riders have been older than Regular Riders. This difference has been increasing.
o The majority of Infrequent Riders are 35 years of age and older, but there is a significant increase in the percentage of Infrequent Riders who are
55 years of age and older.
o Nearly half of all Non-Riders are 55 years of age and older—up from one-third in 2009 and 2011. The increase of older respondents in this year’s
sample likely contributed to the declining ridership incidence outside of Seattle.
Table 2: Changing Demographics: Age of Riders and Non-Riders
2009 2011 2013 2015
All Riders & Non-Riders
16–34 28% 28% 27% 25%
35–54 40% 40% 36%▼ 32%▼
55+ 32% 32% 36%▲ 43%▲
MEAN 47.6 47.4 48.4 50.0
Regular Riders
16–34 31% 37% 37% 36%
35–54 41% 39% 37% 36%
55+ 27% 24% 26% 29%
MEAN 44.4 42.7 42.4 43.1
Infrequent Riders
16–34 35% 35% 32% 31%
35–54 37% 32% 35% 27%▼
55+ 28% 32% 33% 43%▲
MEAN 44.6 46.3 46.9 47.7
Non-Riders
16–34 26% 25% 23% 20%▼
35–54 41% 41% 36%▼ 32%▼
55+ 34% 34% 40%▲ 48%▲
MEAN 48.9 48.7 50.9▲ 52.9▲ Columns may sum to more or less than 100% due to rounding ▲ / ▼indicates a statistically significant change from previous year

2015 Rider / Non-Rider Survey 52 | P a g e
Employment Status
The changes in employment status are generally consistent with the overall trends in employment and the aging population.
The percentage of all Riders and Non-Riders who were employed increased significantly between 2009 and 2011, but decreased significantly in 2015,
due primarily to a significant decrease among Non-Riders.
o Regular Riders are significantly more likely than Non-Riders to be employed. The percentage of employed Regular Riders has not varied
significantly over the years.
The percentage of all Riders and Non-Riders who are retired has been increasing since 2011.
o This increase is due primarily to the significant increase in retired Non-Riders since 2011. The percentage of retired Infrequent Riders has also
been increasing but is not statistically significant due to smaller sample sizes.
Table 3: Changing Demographics: Employment Status of Riders and Non-Riders
2009 2011 2013 2015
All Riders & Non-Riders
Employed 63% 66%▲ 65% 59%▼
Student 6% 5% 6% 5%
Retired 16% 16% 19%▲ 26%▲
Not Working 15% 13%▼ 10%▼ 10%
Regular Riders
Employed 69% 72% 73% 68%
Student 9% 8% 10% 12%
Retired 11% 8% 8% 13%
Not Working 11% 11% 9% 8%
Infrequent Riders
Employed 64% 63% 60% 64%
Student 9% 9% 8% 5%
Retired 14% 17% 21% 22%
Not Working 13% 11% 11% 8%
Non-Riders
Employed 62% 65%▲ 64% 55%▼
Student 4% 3% 4% 3%
Retired 17% 18% 22%▲ 31%▲
Not Working 16% 13%▼ 10%▼ 11%
Employed includes those working full- or part-time (including students who work full- or part-time) or self-employed or work at home. Student includes full-time students (not-working). Columns may to more or less than 100% due to rounding ▲ / ▼indicates a statistically significant change from previous year

2015 Rider / Non-Rider Survey 53 | P a g e
Household Income
Household incomes decreased between 2009 and 2011 and began to increase in 2013. The increase between 2013 and 2015 is significant and reflects the rapidly
growing economy in King County.
Table 4: Changing Demographics: Riders’ and Non-Riders’ Household Income
2009 2011 2013 2015
All Riders & Non-Riders
<$35,000 19% 23%▲ 23% 20%▼
$35,000—<$55,000 19% 18% 16% 19%
$55,000—<$75,000 15% 15% 17% 14%▼
$75,000—<$100,000 19% 17%▼ 15% 15%
$100,000+ 29% 27% 29% 33%▲
Median $73,792 $68,127 $69,277 $73,422
Regular Riders
<$35,000 25% 30%▲ 27% 25%
$35,000—<$55,000 18% 20% 17% 15%
$55,000—<$75,000 15% 14% 18%▲ 13%▼
$75,000—<$100,000 16% 13% 13% 16%▲
$100,000+ 27% 22%▼ 25% 31%▲
Median $66,404 $56,786 $62,642 $72,391
Infrequent Riders
<$35,000 20% 24% 26% 20%
$35,000—<$55,000 16% 12% 15% 16%
$55,000—<$75,000 16% 15% 17% 14%
$75,000—<$100,000 19% 17% 14% 20%
$100,000+ 28% 32% 29% 30%
Median $73,649 $74,091 $68,400 $76,200
Non-Riders
<$35,000 17% 21% 21% 18%
$35,000—<$55,000 19% 18% 16% 21%
$55,000—<$75,000 15% 15% 17% 14%
$75,000—<$100,000 20% 17% 16% 13%
$100,000+ 30% 28% 30% 34%
Median $75,793 $70,000 $72,400 $73,281 Columns may to more or less than 100% due to rounding ▲ / ▼indicates a statistically significant change from previous year

2015 Rider / Non-Rider Survey 54 | P a g e
Vehicle Access
While still relatively small (<10%), the percentage of Riders and Non-Riders without access to a vehicle has increased steadily over the years.
Nearly one out of five Regular Riders currently do not have access to a vehicle—more than double the figure in 2009. In addition, the percentage of
Regular Riders with a driver’s license has decreased significantly.
Table 5: Changing Demographics: Riders’ and Non-Riders’ Access to Vehicle
2009 2011 2013 2015
All Riders & Non-Riders % with License 93% 93% 92% 90%
% with No Vehicle 2% 4% 6%▲ 8%▲
Regular Riders % with License 83% 83% 82% 77%▼
% with No Vehicle 9% 13% 14% 19%▲
Infrequent Riders % with License 90% 89% 93% 91%
% with No Vehicle 2% 6% 7% 9%
Non-Riders % with License 95% 96% 96% 95%
% with No Vehicle <1% 2%▲ 3%▲ 4%▲
▲ / ▼indicates a statistically significant change from previous year
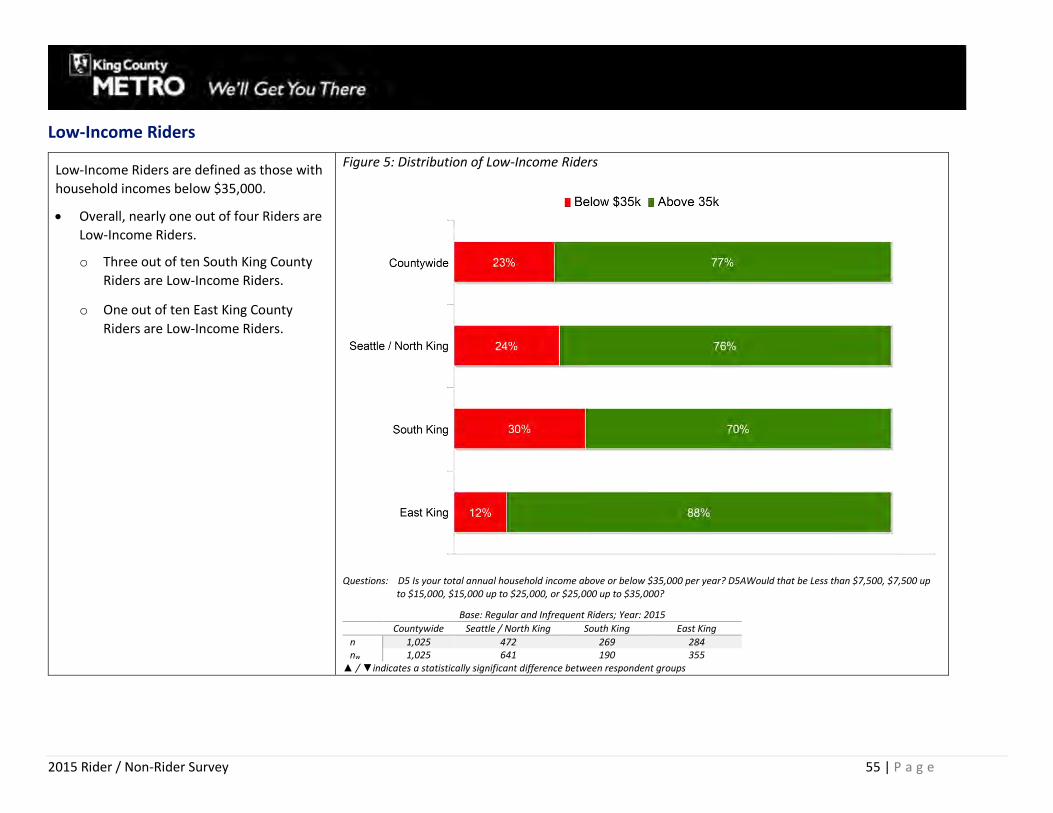
2015 Rider / Non-Rider Survey 55 | P a g e
Low-Income Riders
Low-Income Riders are defined as those with
household incomes below $35,000.
Overall, nearly one out of four Riders are
Low-Income Riders.
o Three out of ten South King County
Riders are Low-Income Riders.
o One out of ten East King County
Riders are Low-Income Riders.
Figure 5: Distribution of Low-Income Riders
Questions: D5 Is your total annual household income above or below $35,000 per year? D5AWould that be Less than $7,500, $7,500 up
to $15,000, $15,000 up to $25,000, or $25,000 up to $35,000?
Base: Regular and Infrequent Riders; Year: 2015
Countywide Seattle / North King South King East King
n 1,025 472 269 284 nw 1,025 641 190 355
▲ / ▼indicates a statistically significant difference between respondent groups

2015 Rider / Non-Rider Survey 56 | P a g e
Low-Income Riders
Low-Income Riders are:
More likely to be female than male.
Somewhat older due to a higher percentage 55 years of age and
older and a lower percentage of those between the ages of 35 and
54.
Less likely to be employed. A significant percentage are students or
retired.
More likely to live in a single-personal household.
More likely to be non-Caucasian.
Significantly less likely to have a driver’s license and/or access to a
vehicle.
Table 6: Demographics: Low-Income Riders
<=$35K
(n=210; nw=721) >$35K
(n=203; nw=744)
GENDER MALE 42%▼ 53%▲
FEMALE 58%▲ 47%▼ AGE
16–17 4% 2% 18–34 31% 30%
35–54 25%▼ 36%▲ 55+ 39%▲ 31%▼
MEAN AGE 45.4 44.4 EMPLOYMENT STATUS
EMPLOYED 37%▼ 78%▲ STUDENT 17%▲ 7%▼
RETIRED 27%▲ 11%▼ UNEMPLOYED 8%▲ 2%▼
OTHER 10%▲ 2%▼ MEDIAN HH INCOME $18,182 $90,376
HH COMPOSITION % SINGLE-PERSON 48%▲ 25%▼
MEAN HH SIZE 2.27 2.47 RACE/ETHNICITY
CAUCASIAN ALONE 65%▼ 72%▲
ASIAN ALONE 10% 14%
BLACK ALONE 10%▲ 3%▼
HISPANIC 8% 5%
MIXED RACE / OTHER 7% 5%
VEHICLE ACCESS % W/ LICENSE 56%▼ 90%▲
% W/ VEHICLES 55%▼ 92%▲ MEAN # VEHICLES (ALL) 0.80▼ 1.79▲
Base: Regular and Infrequent Riders; Year: 2015
▲ / ▼Indicates a statistically significant difference between respondent groups
Columns may to more or less than 100% due to rounding

2015 Rider / Non-Rider Survey 57 | P a g e
FINDINGS: RIDERS’ GENERAL TRAVEL BEHAVIOR
Summary
Topic What We Found What It Means
Frequency
of Travel
On average, Riders take about 16 one-
way trips per month.
Two out of five Riders (40%) are Frequent
Regular Riders—taking 11 or more trips
per month and averaging 33 trips per
month—roughly one trip daily.
2015 saw a significant increase in the
percentage of Moderate Regular Riders
(currently 25% of all Riders) and a
decrease in the percentage of Infrequent
Riders (currently 35% of all Riders).
2013 2014 2015
All Riders 16.7 15.5 16.2
All Regular Riders 26.1 24.5 23.7
Frequent Regular Riders 33.4 32.4 33.4
Moderate Regular Riders 7.1 7.4 7.5
Infrequent Riders 2.3 2.3 2.1
Significant increase (▲) or (▼) from previous year
The continued decrease in the average
number of trips taken by Regular Riders may
be due to a number of factors—a decrease in
overall travel or the use of other modes such
as light rail as well as the growing segment of
Moderate Regular Riders.
Frequent Regular Riders continue to be
Metro’s core market and represent 40
percent of all riders. This segment accounts
for nearly 85 percent of all Metro trips.
Primary Trip
Purpose
While over time the majority of Riders
have primarily used Metro to commute
to work or school, a significant
percentage use Metro for non-commute
travel. Commuting as Riders’ primary use
of Metro peaked in 2013 and has
decreased each year since then,
returning to 2010 levels.
Those using Metro for commute trips
take more than three times as many trips
per month as those using Metro for non-
commute trips—23.7 compared to 7.6,
respectively.
2013 2014 2015
All Riders
Commute 60%▲ 56%▼ 53%
Non-Commute 40%▼ 44%▲ 47%
All Regular Riders
% Commute 76% 72%▼ 66%▼
Frequent Regular Riders
% Commute 87% 83%▼ 80%
Moderate Regular Riders
% Commute 53% 45%▼ 44%
Significant increase (▲) or (▼) from previous year
Riders using Metro for commute trips are
clearly Metro’s core market. Those who
primarily use Metro for commute trips
account for nearly 77 percent of all trips.
At the same time, those using Metro for non-
commute trips represent an important source
of incremental ridership. The continuing
increase in those primarily using Metro for
non-commute trips in Seattle / North King
County may reflect changes in service that
better meet the needs of this market.

2015 Rider / Non-Rider Survey 58 | P a g e
Topic What We Found What It Means
Length of
Time Riding
While the majority of Riders are
Experienced Riders (riding Metro more
than one year), 13 percent are New
Riders (that is, started riding in the past
year).
The percentage of New Frequent Regular
Riders has been stable over the past
several years.
Reflecting the significant increase in the
percentage of Moderate Regular Riders,
there was a significant increase in New
Riders in this segment in 2015.
2013 2014 2015
% New Riders
12% 15% 13%
Frequent Regular Riders
17% 17% 16%
Moderate Regular Riders
14% 10% 15%▲
Infrequent Riders
6% 13%▲ 9%
Significant increase (▲) or (▼) from previous year
Metro has been consistently successful in
attracting New Riders and efforts should
continue. At the same time, the small but
significant decrease in market share and flat
ridership growth suggests that Metro may be
losing Experienced Riders. This could be
natural attrition as Riders age and lifestyles
change. Focus should be on retaining these
Riders through these changes.
New Rider
Demos
New Riders are significantly younger than
Experienced Riders—more than half are
millennials (under the age of 35). In
addition, they are more likely to be
males.
The majority of New Riders are
employed; however, a significant number
are students.
New Riders are somewhat less likely to
have a driver’s license and/or access to a
vehicle.
New
Riders
Experienced
Riders
Male
Female
60%▲
40%▼
49%▼
51%▲
16–34 55%▲ 31%▼
35–54 30% 33%
55+ 17%▼ 36%▲
Mean 35.8▼ 46.0▲
Employed 61%▼ 68%▲
Student 21%▲ 8%▼
Not Employed 18%▼ 24%▲
% with License
% with Vehicle
75%
80%
82%
85% ▲ / ▼indicates a statistically significant difference
between respondent groups
Retaining these new younger Riders, notably
as they transition from being students to
employees, is key to long-term growth.
Millennials have significantly different
lifestyles, values, and motivations as well as
different ways of communicating. Use of
social media, mobile devices, and other
technologies will be important to reach these
Riders.

2015 Rider / Non-Rider Survey 59 | P a g e
Topic What We Found What It Means
Reliance on
Metro
Over the years, approximately one out of
three Riders have reported that they rely
on Metro for all or most of their
transportation needs. Less than 10
percent rely on Metro for all of their
transportation.
Those who rely on Metro for all or most
of their transportation needs are
frequent Riders—averaging nearly one
trip per day. The number of trips taken by
Metro’s most reliant Riders has
decreased, due to lower trip-taking
among Riders who rely on Metro for all of
their transportation needs.
2013 2014 2015
All Riders
% of Metro
Reliant
Riders
36% 31%▼ 34%
# of One-Way Trips
2013 2014 2015
All Transit
Reliant
Riders
29.2 28.6 27.2
All 35.4 32.2 29.6
Most 27.7 27.1 26.5
Significant increase (▲) or (▼) from previous year
A significant segment of Metro Riders relies
on Metro for transportation. Additional
analysis of the demographics of these Riders
suggests that they are not a single segment
but are differentiated by several factors such
as income.
Metro
Reliant
Riders
Demo-
graphics
Riders who rely on Metro for all or most
of their travel are clearly differentiated
by their income.
A significant percentage do not have a
driver’s license and/or access to a
vehicle.
Metro Reliant*
Riders
<$35K 42%
Median $55,471
% without Driver’s
License 38%
% without Access to
Vehicle 36%
* Rely on Metro for all or most of their travel
The majority of Metro’s Transit-Reliant Riders
are choice riders—that is, they use Metro for
a significant amount of their travel but have
access to a vehicle or other transportation
options.
New transit research is looking into further
understanding these “choice riders”—that is,
Riders who have chosen to give up vehicles
and rely primarily on public transportation.

2015 Rider / Non-Rider Survey 60 | P a g e
Topic What We Found What It Means
Transfer
Rates
The percentage of Riders reporting that
they transfer increased significantly in
2015. However, transfer rates remain
significantly lower than rates between
2011 and 2013.
South King County Riders are the
most likely to transfer. Moreover,
the increase in Riders reporting
they have to transfer was highest
in this area.
2013 2014 2015
% of Riders Who Transfer
(Primary Trip)
52% 38%▼ 45%▲
Seattle / North King County
45% 33%▼ 42%▲
South King County
68% 49%▼ 62%▲
East King County
45% 38% 39%
Significant increase (▲) or (▼) from previous year
Access to service and travel times are
important determinants of mode choice. In
those instances where transfers are required,
scheduling connections to minimize wait
times and reduce overall travel time will
reduce the impact of transferring.
Access to
Service
More than three out of four Riders walk
to the bus stop they use most often. As
would be expected, Seattle / North King
County Riders are the most likely to walk.
% Walk
All Riders 77%
Seattle / N. King County 90%
South King 63%
East King 45%
% Drive*
All Riders 20%
Seattle / N. King County 7%
South King 32%
East King 51% % Drive includes drive and park, get dropped off, ride
with someone else
Access to service near home is an important
determinant of ridership, notably among
Choice Riders and less Frequent Riders. Riders
may be willing to trade-off access to service
near their homes with having to transfer if
scheduling of transfers does not significantly
increase overall travel times.

2015 Rider / Non-Rider Survey 61 | P a g e
Topic What We Found What It Means
Park-and-
Ride Lot
Use
Overall park-and-ride lot use has remained relatively stable for the past several years.
Use of park-and-ride lots continues
to be highest in East King County.
After decreasing steadily between
2010 and 2014, park-and-ride lot
use among East King County Riders
increased and returned to the peak
last seen in 2010.
2013 2014 2015
% of Riders Using Park-and-Ride Lots in Past
Year
35% 33% 35%
Seattle / North King County
19% 15%▼ 19%▲
South King County
43% 46% 47%▼
East King County
66% 62% 77%▲
Significant increase (▲) or (▼) from previous year
Metro’s park-and-ride lot system continues to provide an important means for
accessing service.

2015 Rider / Non-Rider Survey 62 | P a g e
Frequency of Riding
Nearly two out of three Riders are Regular
Riders—a significant increase from 2014.
Moreover, there was a significant increase in
the percentage of Moderate Regular Riders.
While there was some decrease in share of
Rider households, notably Infrequent Rider
households, these shifts suggest that while
some Infrequent Riders may have stopped
riding (or have not ridden recently), others
have increased the frequency with which
they ride, moving them to the Moderate
Regular Rider segment.
Regular
Riders
2014 2015
Countywide
Frequent 69% 62%▼
Moderate 31% 38%▲
Figure 6: Percentage of Riders who are Regular and Infrequent Riders
Questions: S5A/S6A Thinking about the last 30 days, how many one-way rides have you taken on a Metro bus? Note years prior to 2015 included rides on South Lake Union Streetcar.
Base: Regular and Infrequent Riders
2010 2011 2012 2013 2014 2015
n 1,140 1,455 1,218 1,395 1,102 1,025 nw 1,140 1,455 1,218 1,395 1,161 1,025
▲ / ▼indicates a statistically significant change from previous year

2015 Rider / Non-Rider Survey 63 | P a g e
After increasing between 2010 and 2011, the
average number of trips taken by all Riders
has remained relatively stable at about 16.
The slight) increase in 2015 is due to
a greater percentage of Regular
versus Infrequent Riders in 2015
compared to 2014 (Figure 6).
Over the years, the average number of one-
way trips taken by Regular Riders has ranged
between 23 and 26 per month.
Riding frequency among Regular
Riders increased between 2010 and
2011 but has been decreasing since
2013.
The average for Infrequent Riders
over the years has been just over
two.
Figure 7: All Riders: Trends in Riding Frequency (Average Number of One-Way Rides in Past 30 Days)
Questions: S5A/S6A Thinking about the last 30 days, how many one-way rides have you taken on a Metro bus?
Note years prior to 2015 included rides on South Lake Union Streetcar.
Note: Years prior to 2015 included rides on South Lake Union Streetcar; to minimize the effect of outliers (from combining bus and streetcar rides) on the mean, the number of one-way rides is capped at 90.
Base: Regular and Infrequent Riders
2010 2011 2012 2013 2014 2015
n 1,140 1,455 1,218 1,395 1,102 1,025 nw 1,140 1,455 1,218 1,395 1,161 1,025
▲ / ▼indicates a statistically significant change from previous year

2015 Rider / Non-Rider Survey 64 | P a g e
Regular Riders’ Frequency of Riding by Area of Residence
The decrease in the number of trips taken by Regular Riders is primarily due to the significant decrease in the number of trips taken by Regular Riders
living in Seattle / North King County. Seattle / North King County Riders have considerable access to other transportation modes (e.g., light rail, car
sharing, Car2Go). Many may also live in close proximity to urban villages with access to services and shopping within walking distance. This decrease
may also reflect the fact that rides on the South Lake Union Streetcar were not included in the 2015 study.
This decrease has been offset to some degree by the year over year increase in the average number of trips taken by Regular Riders living in South King
County.
Figure 8: Regular Riders’ Frequency of Riding by Area of Residence
Questions: S5A/S6A Thinking about the last 30 days, how many one-way rides have you taken on a Metro bus? Note: Years prior to 2015 included rides on South Lake Union Streetcar; to minimize the effect of outliers (from combining bus and streetcar rides) on the mean, the number of one-way rides is capped at 90.
Base: Regular Riders
Seattle / N. King County South King County East King County 2013 2014 2015 2013 2014 2015 2013 2014 2015
n 402 417 406 403 222 252 402 222 264 nrw 481 396 451 258 186 115 149 143 103
▲ / ▼indicates a statistically significant change from previous year

2015 Rider / Non-Rider Survey 65 | P a g e
Primary Trip Purpose
While over time the majority of Riders have
primarily used Metro to commute to work or
school, a significant percentage use Metro for
non-commute travel.
Commuting as Riders’ primary use of
Metro peaked in 2013 and has
decreased each year since then,
returning to 2010 levels.
Figure 9: Trends in Primary Trip Purpose
Question: M5A When you ride Metro, what is the primary purpose of the trip you take most often?
Base: Regular and Infrequent Riders
2010 2011 2012 2013 2014 2015
n 1,140 1,455 1,218 1,395 1,102 1,025 nw 1,140 1,455 1,218 1,395 1,161 1,025
▲ / ▼indicates a statistically significant change (90% confidence level) from previous year

2015 Rider / Non-Rider Survey 66 | P a g e
Riders who primarily use Metro for commute
trips take more than three times as many
one-way trips per month than do those
primarily using Metro for non-commute trips.
Therefore, while only 53 percent of all Riders
primarily use Metro for commute trips, they
account for nearly 77 percent of all monthly
trips.
Figure 10: Number of One-Way Rides by Primary Trip Purpose
Questions: S5A/S6A Thinking about the last 30 days, how many one-way rides have you taken on a Metro bus? Years prior to 2015 included rides on South Lake Union Streetcar; to minimize the effect of outliers (from combining bus and streetcar rides) on the mean, the number of one-way rides is capped at 90.
Base: Regular and Infrequent Riders
2010 2011 2012 2013 2014 2015 n 1,140 1,455 1,218 1,395 1,102 1,025 nw 1,140 1,455 1,218 1,395 1,161 1,025
▲ / ▼indicates a statistically significant change (90% confidence level) from previous year

2015 Rider / Non-Rider Survey 67 | P a g e
More than four out of five Metro Riders who
primarily use Metro for commute trips are
commuting to work. The remainder of
commuters are going to school.
Figure 11: Primary Trip Purpose for Those Who Primarily Use Metro for Commute Trips
n nrw
Base: Regular and Infrequent Riders Who Primarily Use Metro for Commute Trips’ Year: 2015 651 541

2015 Rider / Non-Rider Survey 68 | P a g e
Riders who primarily use Metro for non-
commute trips use Metro for a variety of
purposes. The most common are recreation
and shopping.
Figure 12: Primary Trip Purpose for Those Who Primarily Use Metro for Non-Commute Trips
n nrw
Base: Regular and Infrequent Riders Who Primarily Use Metro for Non-Commute Trips; Year: 2015 372 483

2015 Rider / Non-Rider Survey 69 | P a g e
Regular Riders’ Primary Use of Metro for Commute Trips by Frequency of Riding
Frequent Regular Riders are nearly twice as
likely as Moderate Regular Riders to primarily
use Metro to commute to work or school.
While the primary use of Metro to
commute to work or school has
decreased for both Frequent and
Moderate Regular Riders, the
decrease is greater among Moderate
Regular Riders.
Figure 13: Regular Riders’ Primary Use of Metro for Commute Trips by Frequency of Riding
Base: Regular Riders
Frequent Regular Riders Moderate Regular Riders
2013 2014 2015 2013 2014 2015
n 776 591 585 420 266 337
nw 573 496 413 304 225 257 ▲ / ▼indicates a statistically significant difference between respondent groups

2015 Rider / Non-Rider Survey 70 | P a g e
Demographic Characteristics There are significant differences between those who primarily use Metro
to commute to work or school and those using Metro for non-commute
trips.
Commute Trips
Those primarily using Metro for commute trips are:
More likely to be men.
Generally, between the ages of 18 and 54; nearly half are between
35 and 54.
More affluent.
More diverse.
Non-Commute
Those primarily using Metro for non-commute trips are:
More likely to be women.
Older; nearly half are 55 years of age and older.
Less affluent; more than one out of four have household incomes
below $35,000.
More likely to live in a single-person household.
Somewhat less likely to have access to a vehicle.
Table 7: Demographics: Primary Trip Purpose
COMMUTE
(n=651; nw=541) NON-COMMUTE
(n=372; nw=483)
GENDER MALE 55%▲ 45%▼ FEMALE 45%▼ 55%▲
AGE 16 –17 4% 3% 18 –34 36%▼ 24%▼ 35 –54 40%▲ 24%▼ 55+ 20%▼ 49%▲ MEAN 39.7▼ 50.2▲
EMPLOYMENT STATUS EMPLOYED 82%▲ 50%▼ STUDENT 13%▲ 5%▼ RETIRED 1%▼ 32%▲ OTHER 4%▼ 12%▲
INCOME <$35K 19%▼ 27%▲ $35K–<$55K 16% 14% $55K–<$75K 13% 14% $75K–<$100K 18% 16% $100K+ 33% 28% MEDIAN $71,916▲ $61,460▼
HH COMPOSITION % SINGLE-PERSON 23%▼ 39%▲ AVERAGE HH SIZE 2.72 2.19
RACE/ETHNICITY CAUCASIAN ALONE 63%▼ 78%▲ ASIAN ALONE 15% 12% BLACK ALONE 7%▲ 2%▼ HISPANIC 8%▲ 3%▼ MIXED RACE / OTHER 7%▲ 5%▼
VEHICLE ACCESS % W/ LICENSE 82% 81% % W/ VEHICLES 89%▲ 80%▼ MEAN # VEHICLES 1.68 1.54
Base: Regular and Infrequent Riders; Year: 2015 ▲ / ▼indicates a statistically significant difference between respondent groups Columns may sum to more or less than 100% due to rounding

2015 Rider / Non-Rider Survey 71 | P a g e
Length of Time Riding Metro
The majority of Metro Riders have been
riding more than one year.
Since 2011, between 12 and 15
percent of Riders are new to the
system (started riding in the past
year).
Figure 14: Trends in Length of Time Riding Metro (New and Experienced Riders)
Questions M1 How long have you been riding Metro? M1A Did you start riding Metro after September of 2013?
New Riders are defined as riders who started riding after September of the year preceding the survey
Base: Regular and Infrequent Riders
2010 2011 2012 2013 2014 2015 n 1,140 1,455 1,218 1,395 1,102 1,025 nw 1,140 1,455 1,218 1,395 1,161 1,025
▲ / ▼indicates a statistically significant change from previous year

2015 Rider / Non-Rider Survey 72 | P a g e
Percentage of New Riders by Frequency of Riding
Nearly twice as many Regular Riders are New
Riders compared to Infrequent Riders—16
percent compared to 9 percent, respectively.
The percentage of Frequent Regular
Riders who are New Riders has
remained relatively consistent over
the years.
Consistent with the significant
increase in the percentage of
Moderate Regular Riders in 2015,
there was a significant increase in the
percentage of Moderate Regular
Riders who started riding in the past
year.
Similarly, there was a decrease in the
percentage of Infrequent Riders and
a corresponding decrease in the
percentage of Infrequent Riders who
started riding in the past year.
Figure 15: Percentage of New Riders by Frequency of Riding
Base: Regular and Infrequent Riders
Frequent Regular Riders Moderate Regular Riders Infrequent Riders
2013 2014 2015 2013 2014 2015 2013 2014 2015
n 776 591 585 420 266 337 188 241 103
nw 366 498 254 294 218 158 324 442 219
▲ / ▼indicates a statistically significant difference between respondent groups

2015 Rider / Non-Rider Survey 73 | P a g e
Infrequent Riders and, to a somewhat lesser
extent, Moderate Regular Riders are more
likely than Frequent Regular Riders to be
long-term Riders (five or more years).
Nearly one out of five Frequent Regular
Riders have been riding between three and
five years.
Figure 16: Experienced Riders: Length of Time Riding (2015) by Frequency of Riding
BASE: EXPERIENCED RIDERS 2015
All Regular Riders Frequent Regular Riders Moderate Regular Riders Infrequent Riders
n 779 488 291 94
nw 564 348 271 135

2015 Rider / Non-Rider Survey 74 | P a g e
Trip Purpose: New and Experienced Riders
New Riders are significantly more likely than
Experienced Riders to primarily use Metro for
commute trips.
The increase in the percentage of
Riders using Metro for non-commute
trips has occurred among
Experienced Riders—increasing from
42 percent in 2013 to 49 percent in
2015.
Figure 17: Trip Purpose by Length of Time Riding
n nw
New Riders 2015 150 135
Experienced Riders 2015 873 889

2015 Rider / Non-Rider Survey 75 | P a g e
Demographic Characteristics: New and Experienced Riders
There are significant differences in the demographic characteristics of
New and Experienced Riders.
New Riders
New Riders are:
More likely to be men.
Significantly younger than Experienced Riders. More than half
are less than 35 years of age and thus part of the millennial
generation.
Generally employed. However, a significant number are
students.
More likely than Experienced Riders to be Asian.
Experienced Riders
Experienced Riders are:
On average 10 years older than New Riders.
Are somewhat more likely to be employed. However, a
significant percentage are retired.
Somewhat more affluent due to a higher percentage making
between $75,000 and $100,000.
Predominantly Caucasian.
Table 8: Demographics: New and Experienced Riders
NEW RIDERS
(n=150; nw=135) EXPERIENCED RIDERS
(n=873; nw=889)
GENDER MALE 60%▲ 49%▼ FEMALE 40%▼ 51%▲
AGE 16 –34 55%▲ 31%▼ 35 –54 30% 33% 55+ 17%▼ 36%▲ MEAN 35.8▼ 46.0▲
EMPLOYMENT STATUS EMPLOYED 61% 68% STUDENT 21%▲ 8%▼ RETIRED 5%▼ 17%▲ OTHER 13%▲ 7%▼
INCOME <$35K 30% 22% $35K–<$55K 17% 15% $55K–<$75K 16% 13% $75K–<$100K 8%▼ 19%▲ $100K+ 29% 31% MEDIAN $63,239 $68,036
HH COMPOSITION % SINGLE-PERSON 21% 31% AVERAGE HH SIZE 2.83 2.41
RACE/ETHNICITY CAUCASIAN ALONE 54%▼ 73%▲ ASIAN ALONE 28%▲ 11%▼ BLACK ALONE 5% 5% HISPANIC 7% 5% MIXED RACE / OTHER 7% 6%
VEHICLE ACCESS % W/ LICENSE 75% 82% % W/ VEHICLES 80% 85% MEAN # VEHICLES 1.65 1.61
Base: Regular and Infrequent Riders; Year: 2015 ▲ / ▼indicates a statistically significant difference between respondent groups Columns may sum to more or less than 100% due to rounding

2015 Rider / Non-Rider Survey 76 | P a g e
Reliance on Metro for Transportation
The majority of Riders rely on Metro for some
or very little of their transportation needs.
However, a relatively consistent percentage
(approximately one-third) relies on Metro for
all or most of their transportation.
The percentage of Riders relying on
Metro for all or most of their
transportation needs decreased
significantly in 2014. It increased
somewhat in 2015 but remains below
2013 levels.
The percentage of Riders relying on
Metro for all of their transportation
needs has remained relatively stable
over the years.
2013 2014 2015
All 7% 9% 8%
Most 29% 22% 26%
Figure 18: Reliance on Metro
Question: M4 Now, thinking about all of your travel around King County, to what extent do you use Metro to get around?
Base: Regular and Infrequent Riders
2010 2011 2012 2013 2014 2015 n 1,140 1,455 1,218 1,395 1,102 1,025 nw 1,140 1,455 1,218 1,395 1,161 1,025
▲ / ▼indicates a statistically significant change from previous year

2015 Rider / Non-Rider Survey 77 | P a g e
Reliance on Metro by Frequency of Riding
The extent to which Riders rely on
Metro also varies significantly by the
frequency with which they ride.
More than half of Frequent
Regular Riders rely on Metro
for all or most of their
transportation needs.
o Frequent Regular Riders
are significantly less likely
to have a driver’s license
and/or access to a vehicle.
Figure 19: Reliance on Metro by Frequency of Riding
BASE: REGULAR AND INFREQUENT RIDERS
Frequent Regular Riders Moderate Regular Riders Infrequent Riders
2013 2014 2015 2013 2014 2015 2013 2014 2015
N 776 591 585 420 266 337 188 241 103
NW 366 498 254 294 218 158 324 442 219
▲ / ▼indicates a statistically significant difference between respondent groups
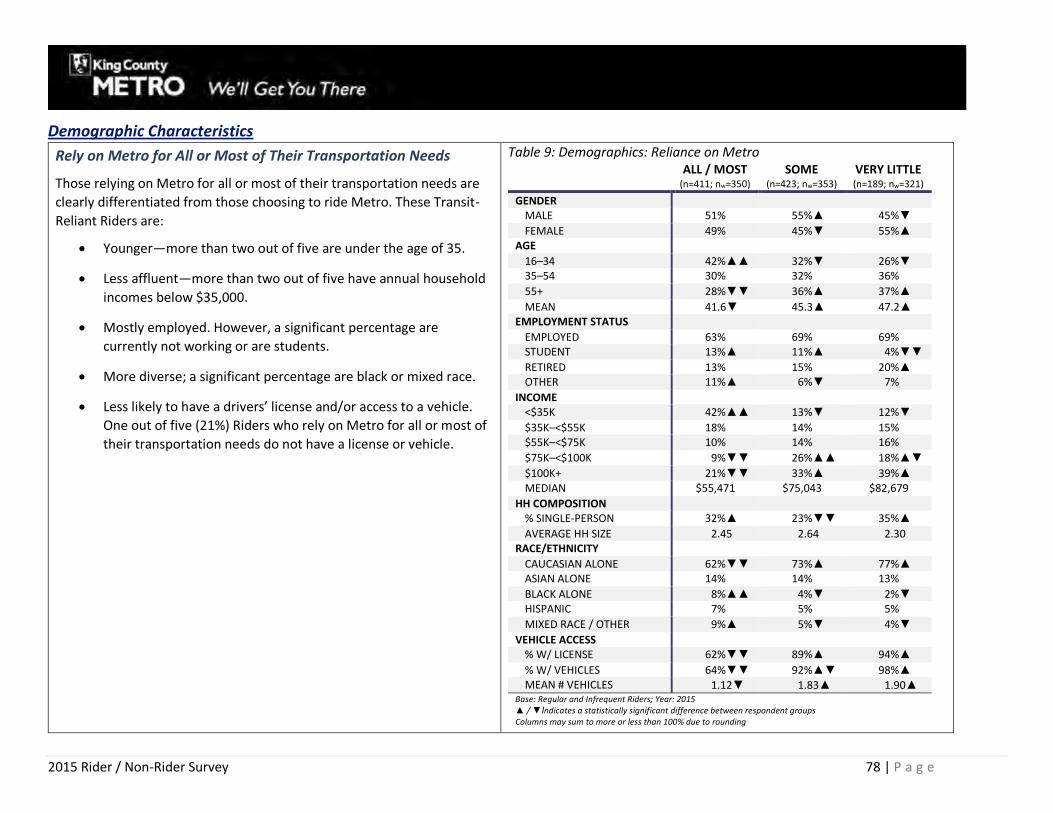
2015 Rider / Non-Rider Survey 78 | P a g e
Demographic Characteristics
Rely on Metro for All or Most of Their Transportation Needs
Those relying on Metro for all or most of their transportation needs are
clearly differentiated from those choosing to ride Metro. These Transit-
Reliant Riders are:
Younger—more than two out of five are under the age of 35.
Less affluent—more than two out of five have annual household
incomes below $35,000.
Mostly employed. However, a significant percentage are
currently not working or are students.
More diverse; a significant percentage are black or mixed race.
Less likely to have a drivers’ license and/or access to a vehicle.
One out of five (21%) Riders who rely on Metro for all or most of
their transportation needs do not have a license or vehicle.
Table 9: Demographics: Reliance on Metro
ALL / MOST
(n=411; nw=350) SOME
(n=423; nw=353) VERY LITTLE (n=189; nw=321)
GENDER MALE 51% 55%▲ 45%▼
FEMALE 49% 45%▼ 55%▲ AGE
16–34 42%▲▲ 32%▼ 26%▼ 35–54 30% 32% 36%
55+ 28%▼▼ 36%▲ 37%▲
MEAN 41.6▼ 45.3▲ 47.2▲ EMPLOYMENT STATUS
EMPLOYED 63% 69% 69% STUDENT 13%▲ 11%▲ 4%▼▼
RETIRED 13% 15% 20%▲ OTHER 11%▲ 6%▼ 7%
INCOME <$35K 42%▲▲ 13%▼ 12%▼
$35K–<$55K 18% 14% 15% $55K–<$75K 10% 14% 16%
$75K–<$100K 9%▼▼ 26%▲▲ 18%▲▼
$100K+ 21%▼▼ 33%▲ 39%▲ MEDIAN $55,471 $75,043 $82,679
HH COMPOSITION % SINGLE-PERSON 32%▲ 23%▼▼ 35%▲
AVERAGE HH SIZE 2.45 2.64 2.30 RACE/ETHNICITY
CAUCASIAN ALONE 62%▼▼ 73%▲ 77%▲ ASIAN ALONE 14% 14% 13%
BLACK ALONE 8%▲▲ 4%▼ 2%▼ HISPANIC 7% 5% 5%
MIXED RACE / OTHER 9%▲ 5%▼ 4%▼
VEHICLE ACCESS % W/ LICENSE 62%▼▼ 89%▲ 94%▲
% W/ VEHICLES 64%▼▼ 92%▲▼ 98%▲ MEAN # VEHICLES 1.12▼ 1.83▲ 1.90▲
Base: Regular and Infrequent Riders; Year: 2015 ▲ / ▼Indicates a statistically significant difference between respondent groups Columns may sum to more or less than 100% due to rounding

2015 Rider / Non-Rider Survey 79 | P a g e
Driver’s License and Vehicle Access by Reliance on Metro
Two out of five (41%) Riders who rely on
Metro for all of their transportation needs
have a driver’s license and/or access to a
vehicle.
Seven out of ten Riders who rely on Metro
for most of their transportation needs have a
driver’s license and/or access to a vehicle.
Figure 20: Percentage of Riders with Driver’s License by Reliance on Metro
Figure 21: Percentage of Riders with Access to Vehicle by Reliance on Metro
n nw
Base: Regular and Infrequent Riders Year: 2015 1,025 1,025

2015 Rider / Non-Rider Survey 80 | P a g e
Travel Times
Peak and Off-Peak Travel
The majority of Riders use Metro during both
peak and off-peak hours.
This is noteworthy for Regular Riders.
Frequent
Regular
Riders
Moderate
Regular
Riders
% Ride both peak
and off-peak hours
80% 72%
While the majority of Infrequent
Riders also ride during both peak and
off-peak hours, they are more likely
than Regular Riders to limit the times
they ride to off-peak hours.
Figure 22: Peak and Off-Peak Travel
Question: M6 During which of the following time periods do you currently ride the bus?
Base: Regular and Infrequent Riders 2015
All Riders Regular Riders Infrequent Riders n 1,025 922 103 nw 1,025 669 356
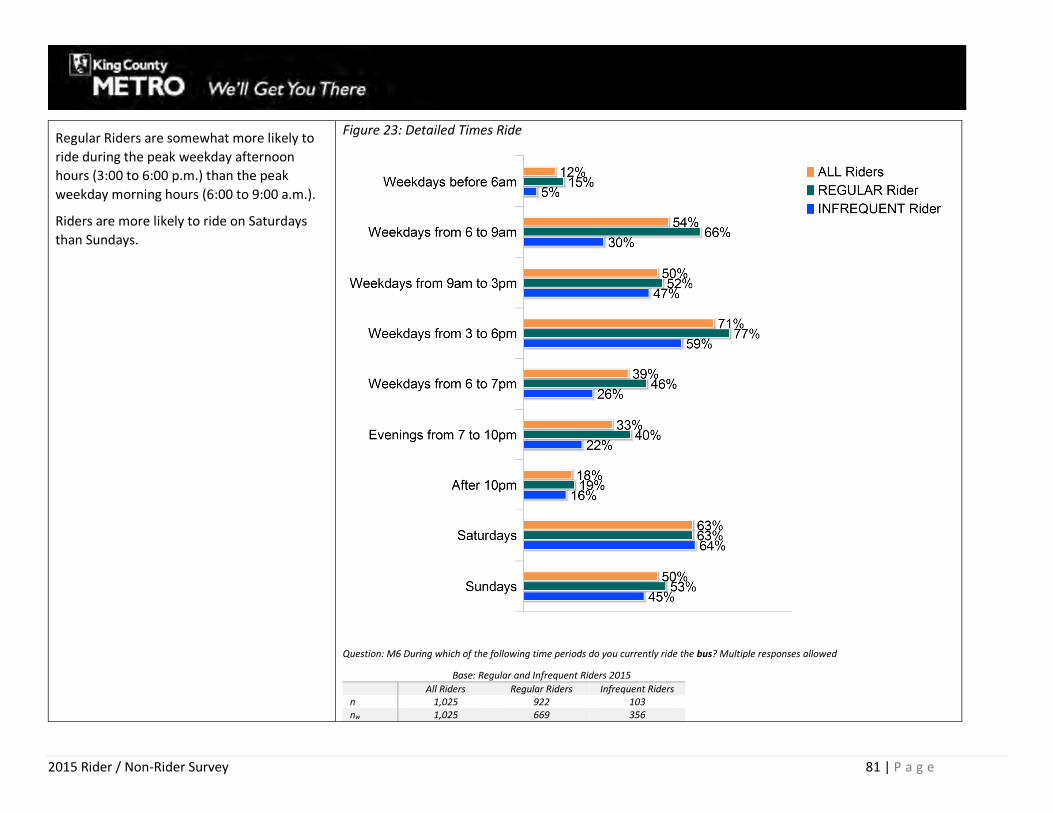
2015 Rider / Non-Rider Survey 81 | P a g e
Regular Riders are somewhat more likely to
ride during the peak weekday afternoon
hours (3:00 to 6:00 p.m.) than the peak
weekday morning hours (6:00 to 9:00 a.m.).
Riders are more likely to ride on Saturdays
than Sundays.
Figure 23: Detailed Times Ride
Question: M6 During which of the following time periods do you currently ride the bus? Multiple responses allowed
Base: Regular and Infrequent Riders 2015
All Riders Regular Riders Infrequent Riders n 1,025 922 103 nw 1,025 669 356

2015 Rider / Non-Rider Survey 82 | P a g e
After Dark
In 2014, there was a significant increase in
the percentage of Riders reporting they
frequently rode Metro when it was dark. This
percentage decreased in 2015 but remains
higher than that reported in 2012 and 2013.
The percentage of Riders reporting
that they never ride when it is dark
has been decreasing since 2013.
Figure 24: Extent to Which Riders Use Metro When It Is Dark
Question: PS1A In the past year, how often have you ridden the bus or streetcar when it is dark?
Columns may sum to more or less than 100% due to rounding
Base: Regular and Infrequent Riders
2010 2011 2012 2013 2014 2015 n 1,140 1,455 1,218 1,395 1,102 1,025 nw 1,140 1,455 1,218 1,395 1,161 1,025
▲ / ▼indicates a statistically significant change from previous year
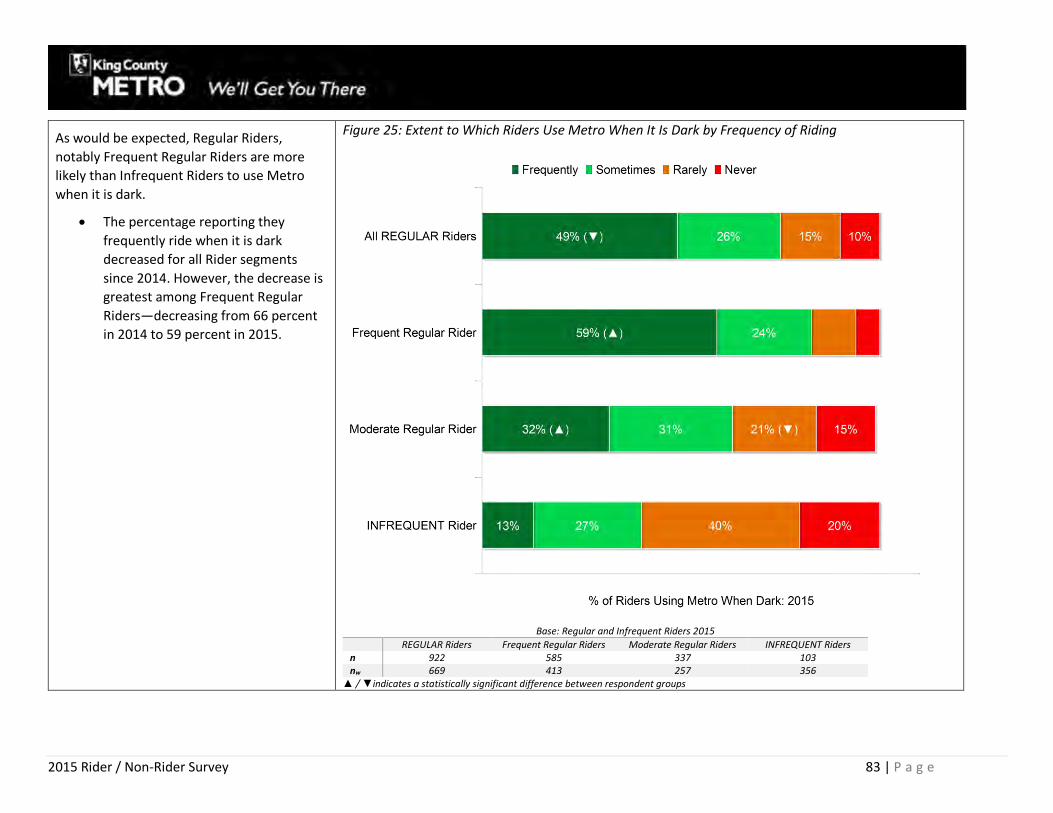
2015 Rider / Non-Rider Survey 83 | P a g e
As would be expected, Regular Riders,
notably Frequent Regular Riders are more
likely than Infrequent Riders to use Metro
when it is dark.
The percentage reporting they
frequently ride when it is dark
decreased for all Rider segments
since 2014. However, the decrease is
greatest among Frequent Regular
Riders—decreasing from 66 percent
in 2014 to 59 percent in 2015.
Figure 25: Extent to Which Riders Use Metro When It Is Dark by Frequency of Riding
Base: Regular and Infrequent Riders 2015
REGULAR Riders Frequent Regular Riders Moderate Regular Riders INFREQUENT Riders n 922 585 337 103 nw 669 413 257 356
▲ / ▼indicates a statistically significant difference between respondent groups

2015 Rider / Non-Rider Survey 84 | P a g e
Transferring
Overall Transfer Rates
After decreasing significantly in 2014, the
percentage of Riders whose primary trip
requires a transfer increased.
The total transfer rate still remains below
2011 through 2013.
Figure 26: Transfer Rates for Primary Trip
Question: TRIP_5A How many transfers do you usually make on the trip you take most often?
Base: Regular and Infrequent Riders
2010 2011 2012 2013 2014 2015 n 1,140 1,455 1,218 1,395 1,102 1,025 nw 1,140 1,455 1,218 1,395 1,161 1,025
▲ / ▼indicates a statistically significant change from previous year

2015 Rider / Non-Rider Survey 85 | P a g e
The majority of those who transfer make a
single transfer.
This has not varied significantly over the
years.
Figure 27: Number of Transfers
Question: TRIP_5A How many transfers do you usually make on the trip you take most often?
Base: Regular and Infrequent Riders Who Transfer
2013 2014 2015
n 714 440 460 nw 725 440 461
▲ / ▼indicates a statistically significant change from previous year
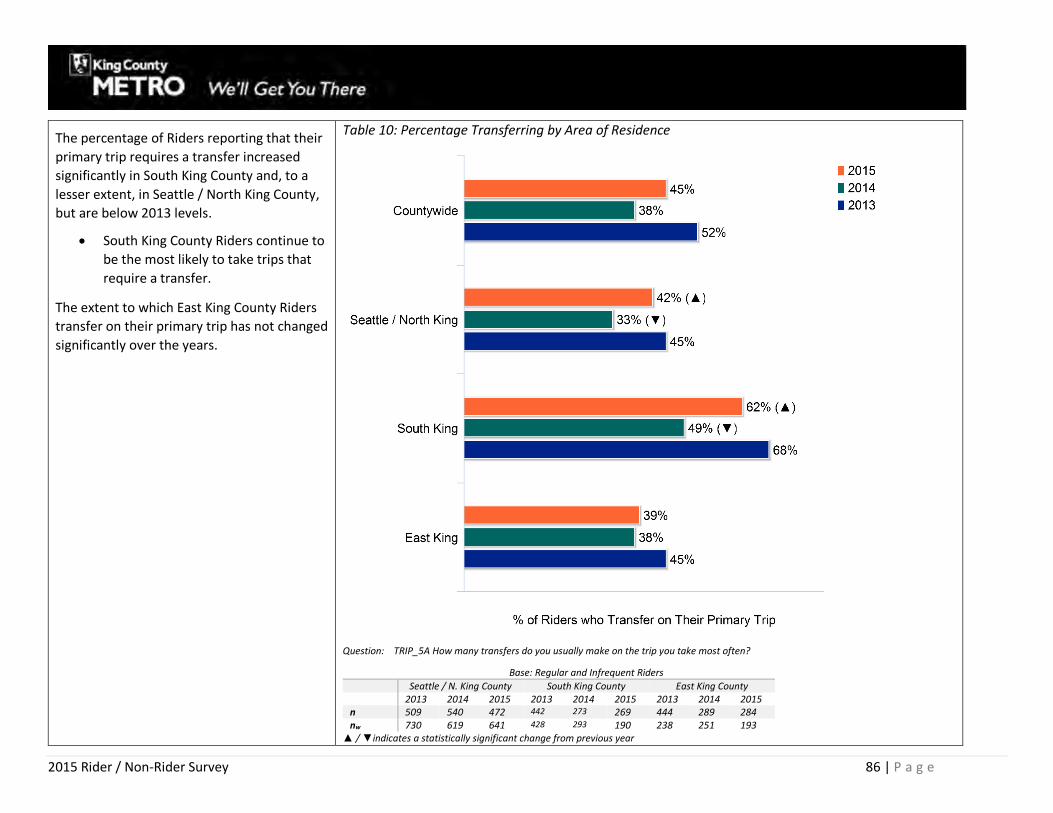
2015 Rider / Non-Rider Survey 86 | P a g e
The percentage of Riders reporting that their
primary trip requires a transfer increased
significantly in South King County and, to a
lesser extent, in Seattle / North King County,
but are below 2013 levels.
South King County Riders continue to
be the most likely to take trips that
require a transfer.
The extent to which East King County Riders
transfer on their primary trip has not changed
significantly over the years.
Table 10: Percentage Transferring by Area of Residence
Question: TRIP_5A How many transfers do you usually make on the trip you take most often?
Base: Regular and Infrequent Riders
Seattle / N. King County South King County East King County 2013 2014 2015 2013 2014 2015 2013 2014 2015 n 509 540 472 442 273 269 444 289 284 nw 730 619 641 428 293 190 238 251 193
▲ / ▼indicates a statistically significant change from previous year
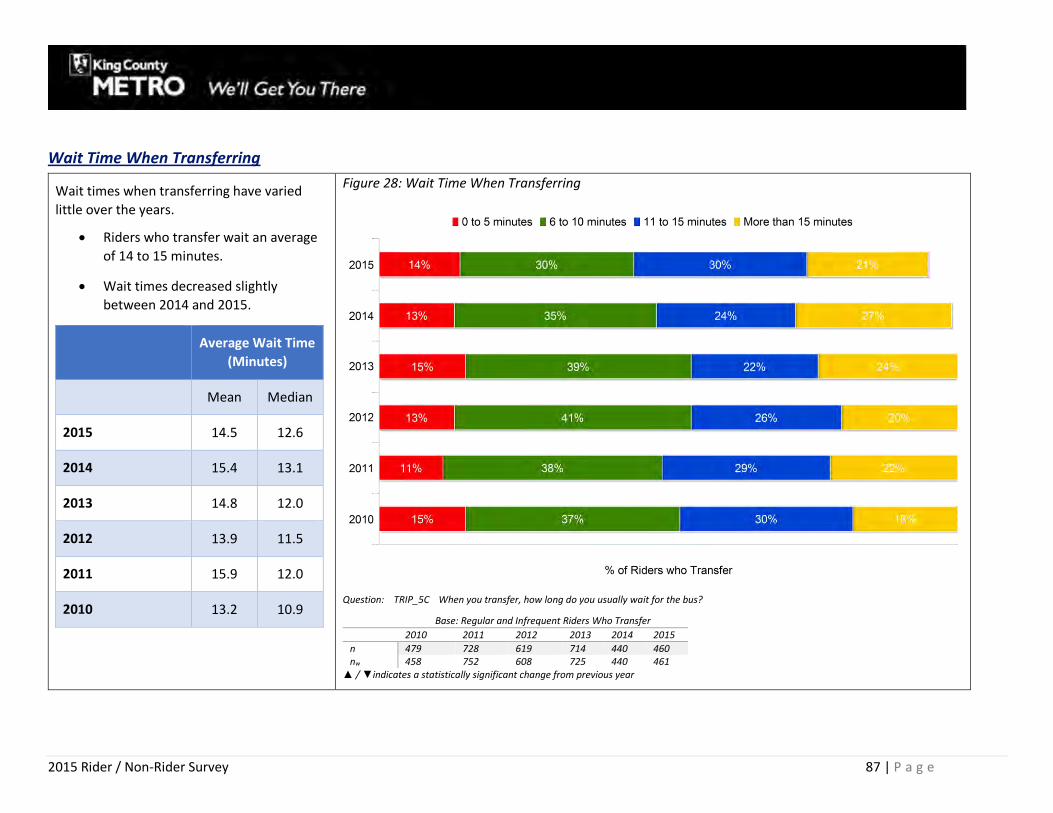
2015 Rider / Non-Rider Survey 87 | P a g e
Wait Time When Transferring
Wait times when transferring have varied
little over the years.
Riders who transfer wait an average
of 14 to 15 minutes.
Wait times decreased slightly
between 2014 and 2015.
Average Wait Time
(Minutes)
Mean Median
2015 14.5 12.6
2014 15.4 13.1
2013 14.8 12.0
2012 13.9 11.5
2011 15.9 12.0
2010 13.2 10.9
Figure 28: Wait Time When Transferring
Question: TRIP_5C When you transfer, how long do you usually wait for the bus?
Base: Regular and Infrequent Riders Who Transfer
2010 2011 2012 2013 2014 2015
n 479 728 619 714 440 460 nw 458 752 608 725 440 461
▲ / ▼indicates a statistically significant change from previous year
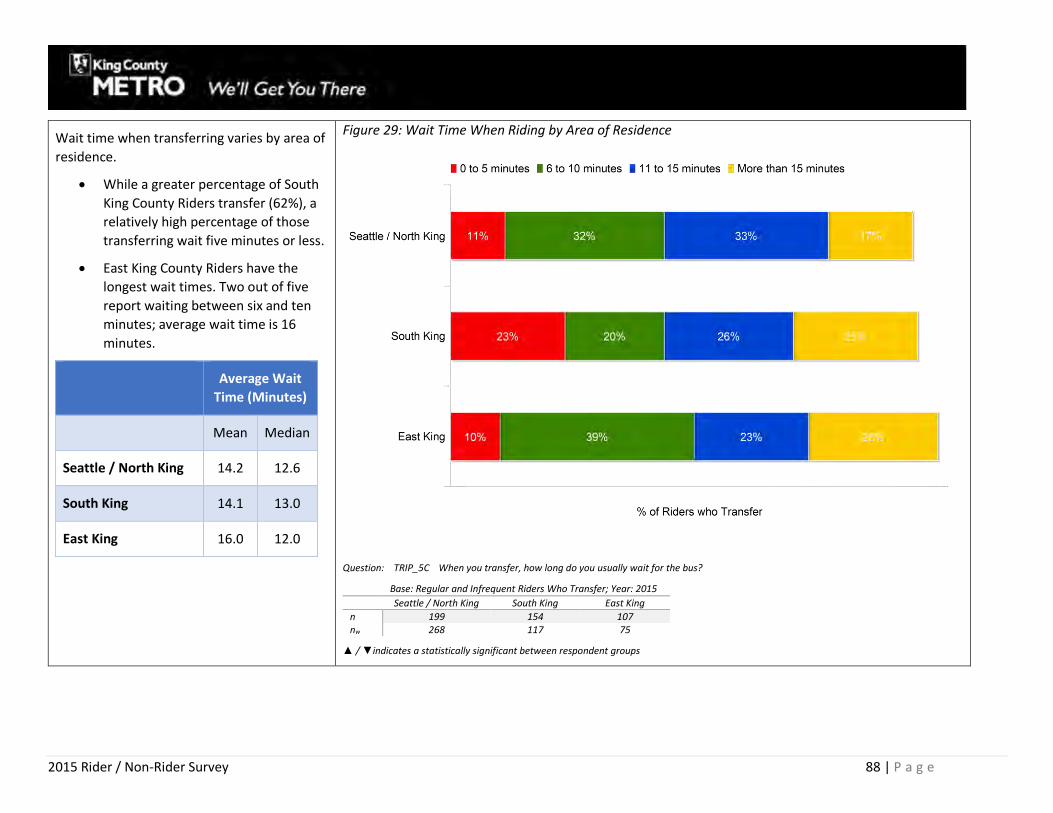
2015 Rider / Non-Rider Survey 88 | P a g e
Wait time when transferring varies by area of
residence.
While a greater percentage of South
King County Riders transfer (62%), a
relatively high percentage of those
transferring wait five minutes or less.
East King County Riders have the
longest wait times. Two out of five
report waiting between six and ten
minutes; average wait time is 16
minutes.
Average Wait
Time (Minutes)
Mean Median
Seattle / North King 14.2 12.6
South King 14.1 13.0
East King 16.0 12.0
Figure 29: Wait Time When Riding by Area of Residence
Question: TRIP_5C When you transfer, how long do you usually wait for the bus?
Base: Regular and Infrequent Riders Who Transfer; Year: 2015
Seattle / North King South King East King
n 199 154 107 nw 268 117 75
▲ / ▼indicates a statistically significant between respondent groups

2015 Rider / Non-Rider Survey 89 | P a g e
Bus Stop Access
More than three out of four Riders walk to the bus stop they use most
often.
Riders living in Seattle / North King County are significantly more likely to walk
to their bus stop.
More than two out of five Riders who walk to their stop walk one
block or less.
Figure 30: How Riders Access Bus Stop They Use Most Often
Table 11: How Riders Access Bus Stop by Area of Residence
Table 12: Distance Riders Walk from Home to Stop by Area of Residence
Question: DS1A How do you usually get from home to the bus stop you use most often?
n nw
Base: Regular and Infrequent Riders 2015 1,025 1,204
Question: DS1B Approximately how far is it from your home to the Metro bus stop you use most often? Base: Riders who Walk to Stop 2015
Seattle / North King South King East King n 351 103 73 nw 482 76 56

2015 Rider / Non-Rider Survey 90 | P a g e
Park-and-Ride Lot Use
Overall Use
Riders’ reported overall use of park-and-ride
has remained relatively stable over the years.
While use of park-and-ride lots continues to
be highest among East King County Riders,
usage decreased between 2010 and 2014.
Use increased in 2015 and returned to the
peak last seen in 2010.
Figure 31: Trends in Park-and-Ride Lot Use
Question: PR1 In the past year, have you used a park-and-ride lot?
Base: Regular and Infrequent Riders
2010 2011 2012 2013 2014 2015 n 1,140 1,455 1,218 1,395 1,102 1,025 nw 1,140 1,455 1,218 1,395 1,161 1,025
▲ / ▼indicates a statistically significant change from previous year or as noted
77%
72%69%
66%62%
77%
52% 52%49%
43%46% 47%
36% 37%33%
35%33%
35%
19%22%
18% 19%15%
19%
2010 2011 2012 2013 2014 2015
East King
South King
Countywide
Seattle / North King

2015 Rider / Non-Rider Survey 91 | P a g e
Personal Travel
The majority of Riders drive alone or with
others for their personal travel.
However, that percentage decreased
between 2014 and 2015.
One out of four Riders use Metro for their
person travel—a significant increase from
2014.
Figure 32: Personal Travel Mode(s)
Question: PT1: How do you usually use to get around for most of your personal travel? Sums to more than 100%; multiple responses allowed.
Response categories with less than 5% of respondents are not shown
Base: Regular and Infrequent Riders
2014 2015 n 1,102 1,025 nw 1,161 1,025
▲ / ▼indicates a statistically significant change from previous year or as noted
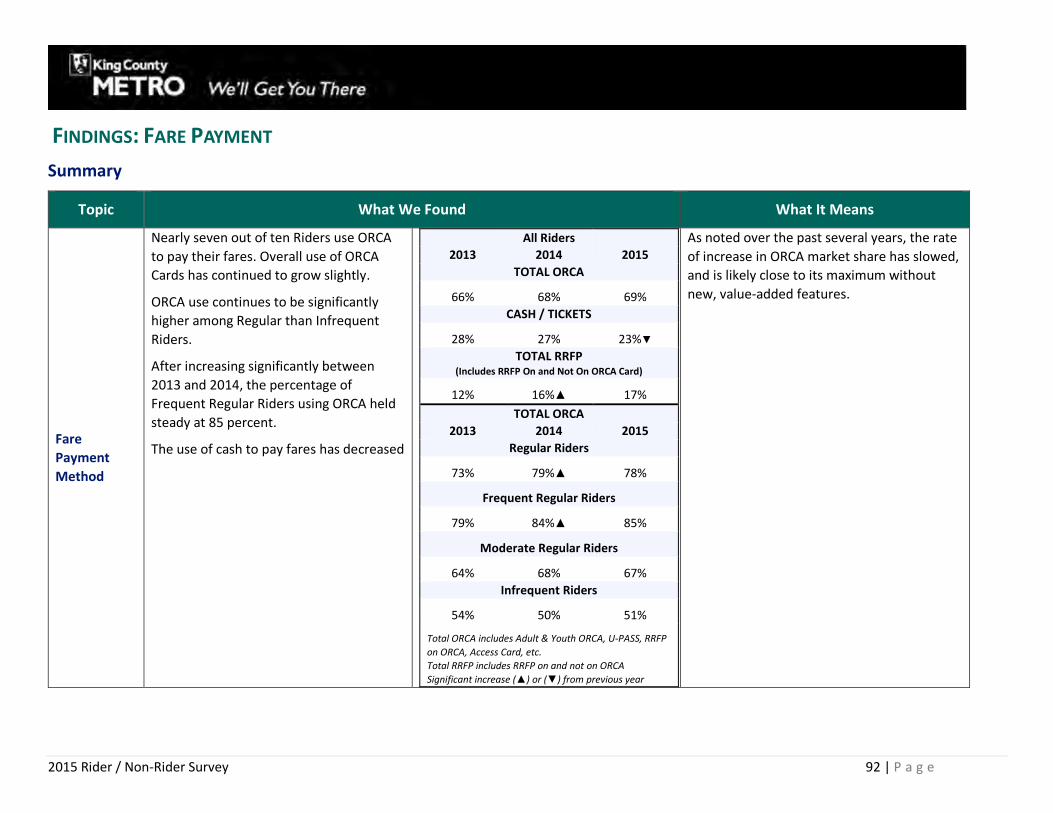
2015 Rider / Non-Rider Survey 92 | P a g e
FINDINGS: FARE PAYMENT
Summary
Topic What We Found What It Means
Fare
Payment
Method
Nearly seven out of ten Riders use ORCA
to pay their fares. Overall use of ORCA
Cards has continued to grow slightly.
ORCA use continues to be significantly
higher among Regular than Infrequent
Riders.
After increasing significantly between
2013 and 2014, the percentage of
Frequent Regular Riders using ORCA held
steady at 85 percent.
The use of cash to pay fares has decreased
All Riders
2013 2014 2015
TOTAL ORCA
66% 68% 69%
CASH / TICKETS
28% 27% 23%▼
TOTAL RRFP (Includes RRFP On and Not On ORCA Card)
12% 16%▲ 17%
TOTAL ORCA
2013 2014 2015
Regular Riders
73% 79%▲ 78%
Frequent Regular Riders
79% 84%▲ 85%
Moderate Regular Riders
64% 68% 67%
Infrequent Riders
54% 50% 51%
Total ORCA includes Adult & Youth ORCA, U-PASS, RRFP
on ORCA, Access Card, etc.
Total RRFP includes RRFP on and not on ORCA
Significant increase (▲) or (▼) from previous year
As noted over the past several years, the rate
of increase in ORCA market share has slowed,
and is likely close to its maximum without
new, value-added features.

2015 Rider / Non-Rider Survey 93 | P a g e
Topic What We Found What It Means
Products on
ORCA Card
Riders who pay with ORCA are somewhat
more likely to have a pass than an E-Purse
on their card. The extent to which Riders
have a pass on their ORCA Card increased
between 2014 and 2015 due to a
significant increase in the percentage with
a pass other than U-PASS.
Regular Riders, notably Frequent Regular
Riders, are more likely to have a pass on
their ORCA Card—61% of Regular Riders
compared to 25% of Infrequent Riders.
2013 2014 2015
TOTAL
E-PURSE
41% 52%▲ 49%
TOTAL
PASS
51% 49% 53%
U-PASS 13% 13% 11%
OTHER
PASS 38% 36% 42%▲
Significant increase (▲) or (▼) from previous year
Regular Riders clearly understand the point
where it makes more sense to have a pass
versus an E-Purse on their ORCA Card.
Making it easier to load value on an E-Purse
may encourage more Moderate Regular and
Infrequent Riders to use ORCA and E-Purse
rather than paying with cash.
Subsidies
The extent to which Riders state their
employer or school subsidizes passes
and/or E-Purses decreased significantly
between 2014 and 2015 and continues
the ongoing decrease from 2010, when
nearly three out of four (73%) riders
received a subsidy. Riders commuting to
work on Metro are nearly twice as likely
as those riders using another mode to
report that they receive a subsidy.
RECEIVE SUBSIDY
2012 2013 2014
All Riders (Commuters)
54% 52% 44%▼
Metro Bus Commuters
66% 68% 66% Significant increase (▲) or (▼) from previous year
Instead of offering subsidies, employers may
be encouraging employees to elect to place
tax-free dollars into their flexible spending
accounts (FSAs) or transportation spending
accounts (TSA) to pay for the transportation
benefits. Customers who pay for part of their
pass through a FSA or TSA may simply not be
aware that their employer is also providing a
subsidy.
At the same time, receiving a subsidy is
clearly an incentive for commuters to use
Metro rather than some other mode.

2015 Rider / Non-Rider Survey 94 | P a g e
Primary Fare Payment Method
ORCA is the primary method of fare
payment and has increased slowly since
2013.
Riders are three times as likely to
pay with ORCA as cash.
Use of cash or tickets has been
decreasing since 2013 and saw a
significant decline in 2015.
One out of six (17%) Riders have a
Regional Reduced Fare Permit, for seniors
and riders with disabilities. Approximately
one out of four Riders using an RRFP
continue to report using an RRFP that is
not on an ORCA Card.
Figure 33: Trends in Fare Payment
Questions: F0 How do you usually pay your bus fare? Adult / Youth ORCA includes ORCA Cards (Adult & Youth Fares), U-PASS, Access Pass, School District Card Total ORCA includes Adult / Youth ORCA and RRFP ORCA; the sum of Adult / Youth ORCA and RRFP ORCA may not sum to Total ORCA due to rounding
Base: Regular and Infrequent Riders
2010 2011 2012 2013 2014 2015 n 1,140 1,455 1,218 1,395 1,102 1,025
nw 1,140 1,455 1,218 1,395 1,161 1,025 ▲ / ▼ indicates a statistically significant change from previous year

2015 Rider / Non-Rider Survey 95 | P a g e
Frequency of riding is highly related to
ORCA Card use.
While more than four out of five
Regular Riders use ORCA, nearly
half of Infrequent Riders use cash.
More than four out of five
Frequent Regular Riders and two
out of three Moderate Regular
Riders pay with ORCA.
Figure 34: Use of ORCA Cards and Cash to Pay Fares (2015) by Frequency of Riding
Questions: F0 How do you usually pay your bus fare?
Total ORCA Includes ORCA Cards (Adult & Youth Fares), RRFP loaded on ORCA, U-PASS, Access Pass, School District Card
Total Cash includes Cash, Tickets, RRFP not on an ORCA Card
Columns sum to less than 100% other methods other responses that could not be classified into these categories are not included
Base: Regular and Infrequent Riders 2015
REGULAR Riders Frequent Regular Riders Moderate Regular Riders INFREQUENT Riders n 922 585 337 103 nw 669 413 257 356
▲ / ▼ indicates a statistically significant change from previous year

2015 Rider / Non-Rider Survey 96 | P a g e
Demographics of Cash and ORCA Users
Income continues to be a distinguishing factor between paying cash and
using ORCA. ORCA use increases as incomes rise above $75,000.
% Cash % ORCA
<$35,000 33% 65%
$35,000-<$55,000 28% 68%
$55,000-<$75,000 34% 63%
$75,000-<$100,000 26% 72%
$100,000 Plus 20% 75%
ORCA Includes ORCA Cards (Adult & Youth Fares), RRFP loaded on ORCA, U-
PASS, Access Pass, School District Card
Cash includes Cash, Tickets, RRFP not on an ORCA Card
A significant percentage of those paying cash are retired, due in part to
the inclusion of RRFP Fares not on an ORCA Card that are considered
cash fares.
Table 13: Demographics: Fare Payment Media
CASH
(n=203; nw=281) ORCA
(n=785; nw=705)
GENDER MALE 56% 51% FEMALE 44% 49%
AGE 16–17 7%▲ 2%▼ 18–34 29% 31% 35–54 29% 31% 55 PLUS 35% 33% MEAN 45.1 44.6
EMPLOYMENT STATUS EMPLOYED 60% 69% STUDENT 9% 10% RETIRED 22%▲ 14%▼ NOT WORKING 9% 7%
INCOME <$35K 28% 22% $35K–$55K 16% 15% $55K–$75K 17% 12% $75K–$100K 16% 18% $100K PLUS 22%▼ 33%▲ MEDIAN $63,000 $77,928
HH COMPOSITION % SINGLE-PERSON 35% 28% AVERAGE HH SIZE 2.50 2.47
RACE/ETHNICITY CAUCASIAN ALONE 77%▲ 68%▼ ASIAN ALONE 9%▼ 16%▲ BLACK ALONE 3% 6% HISPANIC 7% 5% MIXED RACE / OTHER 6% 5%
VEHICLE ACCESS % W/ LICENSE 79% 82% % W/ VEHICLES 88% 83% MEAN # VEHICLES 1.83 1.52
Base: Regular and Infrequent Riders; Year: 2015 ▲ / ▼ indicates a statistically significant difference between respondent group * Columns sum to more than 100%; multiple responses allowed

2015 Rider / Non-Rider Survey 97 | P a g e
Reasons for Paying with Cash
Not riding often enough continues as the
primary reason for using cash. However, the
percentage citing this as a reason decreased
significantly.
Ease or convenience is the second most
frequently mentioned reason for using cash.
Simply not getting around to getting an ORCA
Card increased as a reason for continuing to
use cash.
Figure 35: Reasons for Paying with Cash
Questions: F4A You indicated that you use cash / tickets to pay your fare. Why do you prefer to use cash / tickets as opposed to an ORCA Card?
Base: Regular and Infrequent Riders Who Pay with Cash
2014 2015 n 237 152
nw 297 228 ▲ / ▼ indicates a statistically significant change from previous year

2015 Rider / Non-Rider Survey 98 | P a g e
ORCA Cards
Type of ORCA Card
While the majority of Riders have ORCA
Cards for adult fares, a significant percentage
have RRFPs on an ORCA Card.
About 2 percent of respondents said they had
the new ORCA LIFT Cards.
Figure 36: Type of ORCA Card
Questions: F F1A Is your ORCA card a(n)…?
n nw
Regular and Infrequent Riders Who Use ORCA 2015 785 434

2015 Rider / Non-Rider Survey 99 | P a g e
Products on ORCA Cards
Riders are almost equally likely to have a pass
or an E-Purse on their ORCA Card.
The percentage of Riders with a pass
on their ORCA Card increased slightly
in 2015 due to an increase in the
percentages with a monthly pass. The
percentage of Riders with a U-PASS
has remained relatively stable over
the past several years.
After increasing in 2014, the
percentage with both a pass and an
E-Purse decreased significantly,
returning to 2013 levels.
Figure 37: Products on ORCA Card
Questions: F1D Do you have a pass or an E-Purse on your ORCA Card? Total E-Purse includes those with E-Purse only and both a pass and E-Purse *Total Pass includes those with a pass (monthly or U-PASS) only and both a pass and E-Purse
Base: Regular and Infrequent Riders who pay fare
with Adult or Youth ORCA Card or U-PASS
2013 2014 2015 n 730 596 664
nw 455 580 511 ▲ / ▼ indicates a statistically significant change from previous year

2015 Rider / Non-Rider Survey 100 | P a g e
Regular Riders, notably Frequent Regular
Riders, are more likely to have a pass on their
ORCA Cards.
Moderate Riders are almost equally likely to
have a pass or an E-Purse on their card.
Infrequent Riders are more likely to have an
E-Purse rather than a pass on their card.
Figure 38: Products on ORCA Card by Frequency of Riding
Questions: F1D Do you have a pass or an E-Purse on your ORCA Card? Total E-Purse includes those with E-Purse only and both a pass and E-Purse *Total Pass includes those with a pass (monthly or U-PASS) only and both a pass and E-Purse
Base: Regular and Infrequent Riders who pay fare with an Adult or Youth ORCA Card or U-PASS; Year: 2015
REGULAR Riders Frequent Regular Riders Moderate Regular Riders INFREQUENT Riders n 506 386 120 158
nw 422 324 98 89 ▲ / ▼ indicates a statistically significant differences between respondent groups

2015 Rider / Non-Rider Survey 101 | P a g e
Employer / School Subsidies
The extent to which Riders report that their
employers or school provide a full or partial
subsidy has decreased every year since 2010.
It is now at the point where more Riders say
they do not receive a subsidy than do.
Two out of three Metro bus commuters
receive a full or partial subsidy for the cost of
their pass or E-Purse. This has been relatively
stable for the past several years. However,
the current percentage of Metro Bus
Commuters receiving a subsidy is significantly
lower than the peak in 2010.
% of Metro Bus Commuters
Receiving Full / Partial
Subsidy
2015 66%
2014 68%
2013 66%
2012 70%
2011 66%
2010 77%
Figure 39: Employer / School Subsidies
Questions: F3A Does your employer or school pay for part or all of your ORCA pass or E-purse?
Commuters who have a pass or E-Purse on ORCA Card or U-PASS
2010 2011 2012 2013 2014 2015 n 531 544 573 551 686 927
nw 473 238 564 344 665 854 ▲ / ▼ indicates a statistically significant change from previous year

2015 Rider / Non-Rider Survey 102 | P a g e
FINDINGS: SOURCES OF INFORMATION ABOUT METRO
Summary
Topic What We Found What It Means
Information
Sources
Mobile and online sources are the most
commonly used sources of information
about Metro.
% OF RIDERS WHO USE
SMARTPHONE 62%
METRO ONLINE / REGIONAL
TRIP PLANNER 53%
INFORMATION AT STOPS 36%
PRINTED TIMETABLES 25%
SOCIAL MEDIA 1%
ALERTS (TEXT AND/OR EMAIL) 1%
Metro should continue to grow its online
and mobile capabilities to provide Riders
with information.
However, while information at stops and
printed timetables are used less often by
all Riders, they continue to be primary
sources of information for Riders without
Smartphones and to reach these riders
Metro must continue to provide
information through these more
traditional media.
Smartphones
More than four out of five Riders own a
smartphone, up significantly from 2012,
the first year this question was asked.
Smartphone ownership among
Riders is higher than the national
average of 64%*.
Riders are increasingly using smartphones
to get information.
* Source: http://www.pewinternet.org/2015/04/01/chapter-one-a-
portrait-of-smartphone-ownership/
2012 2015
SMARTPHONE OWNERSHIP
60% 84%▲
USE TO GET INFORMATION ABOUT
METRO
ALL RIDERS
44% 62%▲
REGULAR RIDERS
49% 68%▲
INFREQUENT RIDERS
35% 51%▲ Significant increase (▲) or (▼) from baseline year (2012)
While smartphone ownership is high and
represents an important source of
information about Metro, not all Riders
have smartphones. Notably, lower income
(less than $35,000) and older Riders (55
plus) continue to be less likely to own a
smartphone. These Riders need
alternative sources of information and
may be more likely to use traditional
sources of information.

2015 Rider / Non-Rider Survey 103 | P a g e
Primary Information Sources
Smartphones are the most frequently used
source of information about Metro for all
Riders.
A significant percentage of Riders also use
information at tops and printed timetables.
This is noteworthy for Riders without
Smartphones.
Have
Smartphone
Yes No
Smartphone 74% 0%
Metro Online /
Regional Trip Planner
54%▲ 46%▼
Information at Stops 33%▼ 48%▲
Printed Timetables 20%▼ 52%▲
Figure 40: Sources of Information about Metro
Questions: IN1 Which of the following do you use to get information about Metro? Multiple responses allowed. n nw
Base: Regular and Infrequent Riders; Year 2015 1.025 1,025

2015 Rider / Non-Rider Survey 104 | P a g e
Regular Riders are more likely than Infrequent Riders to use Smartphones
as their primary source of information about Metro. Interestingly, there
were no other significant differences between Regular and Infrequent
Riders in regards to information sources.
Use of Smartphones as a primary information source is clearly related to
age. Older Riders are significantly more likely to use the more traditional
information sources, Metro Online and printed timetables.
Table 14: Sources of Information by Rider Status
Table 15: Sources of Information by Age
Finally, use of Smartphones and Metro online as primary sources of information about Metro is clearly related to income.
Table 16: Sources of Information by Income

2015 Rider / Non-Rider Survey 105 | P a g e
Smartphones
Ownership
More than four out of five Riders own a
smartphone, a significant increase from 2014
and the highest ownership rate to date.
There are no differences in Smartphone
ownership between Regular and Infrequent
Riders.
Figure 41: Smartphone Ownership
Questions: IN4A Do you own a Smartphone?
Base: Regular and Infrequent Riders
2012 2013 2014 2015 n 1,218 1,395 1,102 1,025
nw 1,218 1,395 1,161 1,025 ▲ / ▼ indicates a statistically significant change from previous year Base: Regular and Infrequent Riders

2015 Rider / Non-Rider Survey 106 | P a g e
Smartphone ownership continues to be
related to age and is significantly lower
among older Riders.
Smartphone ownership has increased in all
age groups.
Figure 42: Smartphone Ownership by Age

2015 Rider / Non-Rider Survey 107 | P a g e
Smartphone ownership is also related to
income.
Notably, Riders with household
incomes less than $35,000 are
significantly less likely to own a
Smartphone.
Smartphone ownership has increased among
all but one income segments.
Figure 43: Smartphone Ownership by Income
Questions: IN4A Do you own a Smartphone?
Base: Regular and Infrequent Riders
2013 2015 n 1,395 1,025
nw 1,395 1,025
▲ / ▼ indicates a statistically significant change from previous year

2015 Rider / Non-Rider Survey 108 | P a g e
Use as Source of Information about Metro
Three out of five Riders currently frequently
or sometimes use Smartphones to get
information about Metro, up significantly
from the first year measured (2012).
Frequency of using Smartphones has
increased in all segments.
Use of Smartphones decreased
between 2013 and 2014 among
Regular Riders but then rebounded in
2015. The decrease in 2014 may be
due to the higher percentage of older
Infrequent and Moderate Riders
surveyed in 2014. Older people are
slower to adopt new technologies
and Moderate and Infrequent Riders
were less likely to use Smartphones.
Therefore, the drop in use of
Smartphones for information may
have dropped accordingly. The
increase in 2015 is likely due to
adoption of Smartphones for
information about Metro among
Riders as well as a general increase in
the use of Smartphones across all
Rider segments.
Infrequent Riders’ use of
Smartphones has increased each
year.
Figure 44: Frequency of Using Smartphones to Get Information about Metro
Questions: IN4A How often do you use a Smartphone to get information about Metro? % shown are those who said frequently or sometimes use
Base: Regular and Infrequent Riders
2012 2013 2014 2015 n 1,218 1,395 1,102 1,025
nw 1,218 1,395 1,161 1,025
▲ / ▼ indicates a statistically significant change from previous year Base: Regular and Infrequent Riders

2015 Rider / Non-Rider Survey 109 | P a g e
Information at Stops
Use of and Satisfaction with Posted and Real-Time Information at Stops
As noted (Figure 40), more than one out of
three Riders use information at the bus stops.
Among those using information at stops,
reported use of real-time information at
stops is somewhat higher than posted /
printed information. Because few stops have
real-time information, there might have been
a misunderstanding of the term.
Figure 45: Use of Posted and Real-Time Information at Stops
Questions: IN1 Which of the following do you use to get information about Metro? Multiple responses allowed. Sum of real-time information at stops and posted / printed information at stops sums to less than total information at stops as some respondents did not specify a location
n nw
Base: Regular and Infrequent Riders; Year 2015 1,025 1,025

2015 Rider / Non-Rider Survey 110 | P a g e
Riders who were less than very satisfied with
information at stops (58% of all Riders) were
asked follow-up questions about printed and
real-time information at stops.
Riders are less satisfied with the availability
of real-time information at stops than with
the availability of printed / posted
information at stops.
Figure 46: Satisfaction with Printed / Posted Information at Stops
Figure 47: Satisfaction with Real-Time Information at Stops
Questions: IN3 Are you satisfied or dissatisfied with availability of printed information at stops / real-time information at stops? n nw
Base: Regular and Infrequent Rider Who Were Less than Very Satisfied with Information at Stops
67 64

2015 Rider / Non-Rider Survey 111 | P a g e
Interest in Real-Time Travel Information
When asked what real time information they
would like and how they would like to receive
it, Riders indicate they are most interested in
real-time arrival times and comparative travel
times between routes and/or modes.
Those interested in real-time travel
information prefer to get information at
stops and on their Smartphones.
Figure 48: Interest in Different Types of Real-Time Travel Information
Figure 49: Preferred Means of Getting Real-Time Travel Information
Questions: IN5 Would you be interested in.. .? Multiple responses allowed.
IN5_2 Would you prefer to get real-time information at stops, on your smartphone, or both n nw
Base: Regular and Infrequent Riders Who Currently use Real-time Travel Information or Have a Smartphone 826 879

2015 Rider / Non-Rider Survey 112 | P a g e
FINDINGS: OVERALL SATISFACTION WITH METRO
Summary
Topic What We Found What It Means
Overall
Satisfaction
After increasing significantly in 2014,
Riders’ overall satisfaction with Metro
decreased slightly. However, this decrease
is not statistically significant.
The percentage very satisfied
increased slightly but remains
below the peak in 2011 when 50
percent of all Riders were very
satisfied with riding Metro.
Regular Riders’ overall satisfaction is
significantly higher than Infrequent Riders.
The percentage of “Very” Satisfied
Regular Riders has increased
steadily since 2013.
The slight decrease in overall satisfaction
noted in 2015 is due to a decrease in
satisfaction among Infrequent Riders.
2013 2014 2015
ALL RIDERS
TOTAL SATISFIED
85% 90%▲ 88%
VERY SATISFIED
42% 46%▲ 47%
DISSATISFIED
14% 10%▼ 11%
REGULAR RIDERS
TOTAL SATISFIED
88% 88% 90%
VERY SATISFIED
44% 47% 49%
DISSATISFIED
12% 11% 10%
INFREQUENT RIDERS
TOTAL SATISFIED
80% 91%▲ 85%
VERY SATISFIED
42% 49%▲ 43%
DISSATISFIED
20% 8%▼ 15%▲
Metro is effective in meeting the general
needs of its Regular Riders. Metro should
continue to focus on service
improvements to further enhance Regular
Riders’ customer experience, with a goal
of building the percentage of “very”
satisfied Riders.
While a relatively small segment, Metro
should investigate further the decreased
satisfaction among Infrequent Riders.

2015 Rider / Non-Rider Survey 113 | P a g e
Overall Satisfaction
After increasing significantly in 2014 and
reversing the downward trend first noted in
2011, overall satisfaction with Metro
decreased slightly. However, this decrease is
not statistically significant.
More Riders are “very” as opposed to
“somewhat” satisfied. Moreover, the
percentage of “very satisfied” Riders
has increased since 2013 but remains
below 2010 and 2011 levels.
Figure 50: Trends in Overall Satisfaction
Questions: GW1A Overall, would you say you are satisfied or dissatisfied with Metro? Would that be very or somewhat [satisfied / dissatisfied]?
Base: Regular and Infrequent Riders
2010 2011 2012 2013 2014 2015
n 1,140 1,455 1,218 1,395 1,102 1,025 nw 1,140 1,455 1,218 1,395 1,161 1,025
▲ / ▼ indicates a statistically significant change from previous year
94%91%
88%85%
90%88%
49% 50%46%
42%46% 47%
45%41% 42% 43% 44%
41%
6%8%
10%14%
10% 11%
2010 2011 2012 2013 2014 2015
Total Satisfied
Very Satisfied
Somewhat Satisfied
Dissatisfied

2015 Rider / Non-Rider Survey 114 | P a g e
Overall Satisfaction by Frequency of Riding
Nine out of ten Regular Riders are satisfied
with Metro.
The percentage “very” satisfied has
been increasing steadily since 2013.
However, it remains below the peak
in 2011 (54%).
The changes in overall satisfaction over the
past several years are due almost entirely to
changes among Infrequent Riders.
The increase in overall satisfaction
among Infrequent Riders between
2013 and 2014 was due to an
increase in the percentages of both
“very” and “somewhat” satisfied.
The decrease in overall satisfaction
between 2014 and 2015 is due to a
decrease in the percentage
“somewhat” satisfied and a
significant increase in the percentage
“dissatisfied.”
The percentage “very” satisfied
continued to increase although not
significantly.
Table 17: Trends in Overall Satisfaction by Frequency of Riding
Question: GW1A Overall, would you say you are satisfied or dissatisfied with Metro? Would that be very or somewhat [satisfied /
dissatisfied]?
Base: Regular Riders Base: Infrequent Riders
2013 2014 2015 2013 2014 2015 n 1207 861 922 188 241 103
nw 567 719 412 324 442 219 ▲ / ▼ indicates a statistically significant change from previous year or year marked

2015 Rider / Non-Rider Survey 115 | P a g e
Overall Satisfaction by Area of Residence
The percentage of Satisfied Riders in Seattle /
North King County has increased since 2013.
However, it remains below the peak in 2010
(94%) and 2011 (92%).
Figure 51: Trends in Overall Satisfaction by Area of Residence
While the percentage of Satisfied Riders in
East King County dropped slightly in 2015, the
percentage of “very satisfied” Riders has
been increasing steadily since 2013 and is
now at the highest recorded levels.
East King County has the highest percentage
of “very satisfied” Riders.

2015 Rider / Non-Rider Survey 116 | P a g e
After increasing between 2013 and 2014,
satisfaction decreased among South King
County Riders in 2015. This decrease is due to
a significant increase in the percentage of
“dissatisfied” Riders.
Questions: GW1A Overall, would you say you are satisfied or dissatisfied with Metro? Would that be very or somewhat [satisfied /
dissatisfied]?
Base: Seattle / North King Base: South King Base: East King
2013 2014 2015 2013 2014 2015 2013 2014 2015 n 509 540 472 442 273 269 444 289 284
nw 730 619 641 428 293 190 238 251 193
▲ / ▼ indicates a statistically significant change from previous year

2015 Rider / Non-Rider Survey 117 | P a g e
Overall Satisfaction by Income
While there are no differences in overall
satisfaction between Low- and Higher-
income Riders, Low-Income Riders are more
likely than Higher-Income Riders to be “very
satisfied” with riding Metro.
Moreover, the percentage of “very
satisfied” Low-Income Riders increased
significantly in 2015.
The percentage of “very satisfied” Higher-
Income Riders has also been increasing.
Figure 52: Trends in Overall Satisfaction by Income
Question: GW1A Overall, would you say you are satisfied or dissatisfied with Metro? Would that be very or somewhat [satisfied / dissatisfied]?
Base: Low Income Riders Base: Higher Income Riders
2013 2014 2015 2013 2014 2015 n 386 323 209 809 690 721
nw 326 345 203 888 729 744 ▲ / ▼ indicates a statistically significant change from previous year or year marked
91% 91% 90%
52%47%
59%
39%44% 31%
8% 8% 9%
2013 2014 2015
% o
f Lo
w In
com
e R
ider
s
Total SatisfiedVery SatisfiedSomewhat SatisfiedDissatisfied
83%88% 88%
45% 45%
43%38%
43%
45%
16%11% 11%
2013 2014 2015
% o
f H
igh
er In
com
e R
ider
s
Total Satisfied
Very Satisfied
Somewhat Satisfied
Dissatisfied
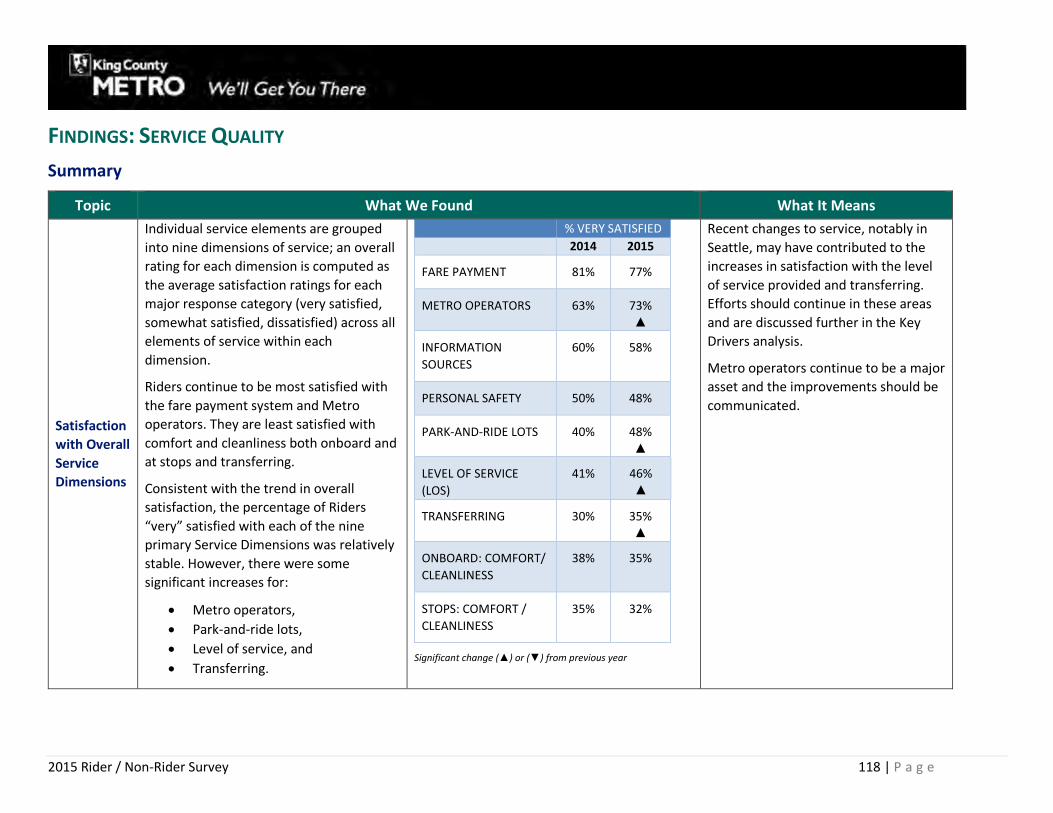
2015 Rider / Non-Rider Survey 118 | P a g e
FINDINGS: SERVICE QUALITY
Summary
Topic What We Found What It Means
Satisfaction
with Overall
Service
Dimensions
Individual service elements are grouped
into nine dimensions of service; an overall
rating for each dimension is computed as
the average satisfaction ratings for each
major response category (very satisfied,
somewhat satisfied, dissatisfied) across all
elements of service within each
dimension.
Riders continue to be most satisfied with
the fare payment system and Metro
operators. They are least satisfied with
comfort and cleanliness both onboard and
at stops and transferring.
Consistent with the trend in overall
satisfaction, the percentage of Riders
“very” satisfied with each of the nine
primary Service Dimensions was relatively
stable. However, there were some
significant increases for:
Metro operators,
Park-and-ride lots,
Level of service, and
Transferring.
% VERY SATISFIED
2014 2015
FARE PAYMENT 81% 77%
METRO OPERATORS 63% 73%
▲
INFORMATION
SOURCES
60% 58%
PERSONAL SAFETY 50% 48%
PARK-AND-RIDE LOTS 40% 48%
▲
LEVEL OF SERVICE
(LOS)
41% 46%
▲
TRANSFERRING 30% 35%
▲
ONBOARD: COMFORT/
CLEANLINESS
38% 35%
STOPS: COMFORT /
CLEANLINESS
35% 32%
Significant change (▲) or (▼) from previous year
Recent changes to service, notably in
Seattle, may have contributed to the
increases in satisfaction with the level
of service provided and transferring.
Efforts should continue in these areas
and are discussed further in the Key
Drivers analysis.
Metro operators continue to be a major
asset and the improvements should be
communicated.

2015 Rider / Non-Rider Survey 119 | P a g e
Topic What We Found What It Means
Highest
Rated
Elements of
Service (50%+ Very
Satisfied)
Eighteen of the 42 service elements rated
achieved satisfaction ratings above 50%
very satisfied. With the exception of
personal safety at park-and-ride lots, all
were above 50% in 2014 as well. Ratings
for this element of service increased
significantly from 2014.
As noted above, satisfaction with the Level
of Service Dimension increased. This is due
in part to a significant increase in
satisfaction with the distance from home
to stop.
Satisfaction with Metro operators also
increased significantly due to increases in
satisfaction with safe vehicle operation,
effectiveness of handling problems, and
the addition of a new element, courtesy,
which is highly rated. Despite the increase
in satisfaction with how well drivers
handle problems on the bus, Rider
satisfaction with safety onboard during
the daytime decreased.
While Riders continue to be very satisfied
with availability of information,
satisfaction with availability of information
online decreased (after a significant
increase between 2013 and 2014).
% VERY SATISFIED 2014 2015
FARE: ORCA Cards 87% 83%▼
DRIVERS: Operate
Vehicles Safely
74% 82%▲
FARE: Ease of Paying
When Boarding
81% 80%
DRIVERS: Courtesy N/A 76%
FARE: Ease of Loading
Pass on ORCA
76% 72%
DRIVERS: Handle
Problems Effectively
55% 69%▲
DRIVERS: Helpfulness 66% 68%
DRIVERS: Stop / Stop
Smoothly
N/A 66%
LEVEL OF SERVICE:
Distance from Home to
Stop
52% 63%▲
SAFETY: Daytime at
Stops
70% 63%
INFO: Overall Ability to
Obtain
63% 62%
INFO: Availability Online 71% 61%▼
INFO: Availability Via
Smartphone
N/A 60%
FARE: Ease of Adding
Value to E-Purse
68% 60%▼
FARE: Value of Service
for Fare Paid 62% 59%
P&R LOTS: Personal
Safety 46% 55%▲
SAFETY: Onboard
Daytime 59% 53%▼
SAFETY: Transit Tunnel 51% 51%
▲ / ▼ indicates significant (95%) change from previous year
▲ / ▼ indicates significant (90%) change from previous year
While ORCA Card use continues to
slowly increase, satisfaction with ORCA
overall and specifically with the ease of
adding value to an E-Purse is down. A
greater understanding of what makes
up the ease of adding value (e.g., easy
access to locations to add value or ease
of the actual process) could provide
additional insights into how to improve
satisfaction with ORCA.
Metro should continue to focus on
providing quality and accurate
information. Online sources should be a
priority.

2015 Rider / Non-Rider Survey 120 | P a g e
Topic What We Found What It Means
Below-
Average
Ratings (40–49%
Very
Satisfied)
Most elements of service in this category
of below-average satisfaction were in this
same category of service in 2013 and
2014.
Satisfaction with frequency of service
increased significantly, moving from the
lowest group of ratings (<40%) to near the
highest group of ratings (50%+).
Satisfaction with number of transfers also
increased, prompting its move from the
lowest group of ratings to this tier or
satisfaction.
% VERY SATISFIED
2014 2015 LEVEL OF SERVICE: Frequency of service
36% 47%
▲
ONBOARD: Inside cleanliness
47% 45%
P&R LOTS: Parking availability
34% 45%
▲
LEVEL OF SERVICE: Availability of service
40% 44%
LEVEL OF SERVICE: On-time
performance
41% 43%
ONBOARD: Ease of loading / unloaded crowding at stops
45% 43%
P&R LOTS: Vehicle security 40% 43%
LEVEL OF SERVICE: Travel time
41% 41%
TRANSFER: Number of 35% 41%
▲
INFO: Availability of information at stops
45% 41%
INFO: Notification of service changes
N/A 41%
Metro should continue to focus on
increased frequency of service with the
goal to move this into the top
satisfaction tier.
The increase in satisfaction with
number of transfers is somewhat
surprising as the percentage of Riders
whose primary trip requires a transfer
increased. The increase in satisfaction
could be due to other factors such as
better access to service and more
frequent service.
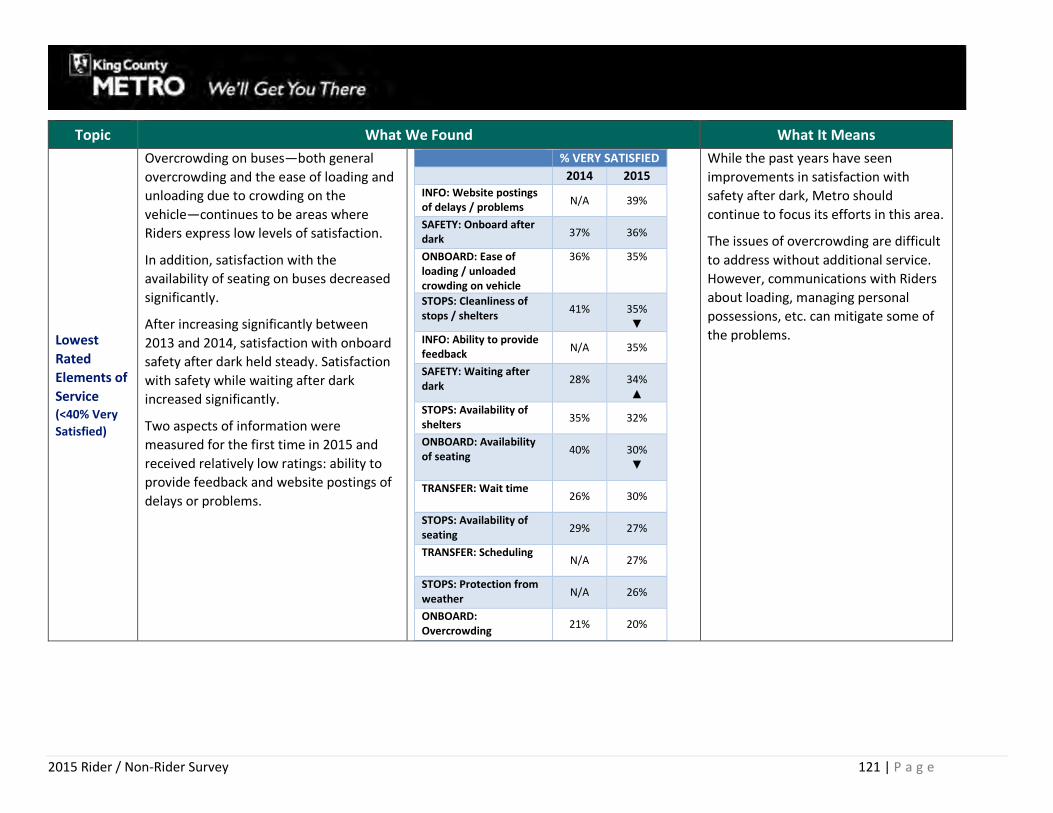
2015 Rider / Non-Rider Survey 121 | P a g e
Topic What We Found What It Means
Lowest
Rated
Elements of
Service (<40% Very
Satisfied)
Overcrowding on buses—both general
overcrowding and the ease of loading and
unloading due to crowding on the
vehicle—continues to be areas where
Riders express low levels of satisfaction.
In addition, satisfaction with the
availability of seating on buses decreased
significantly.
After increasing significantly between
2013 and 2014, satisfaction with onboard
safety after dark held steady. Satisfaction
with safety while waiting after dark
increased significantly.
Two aspects of information were
measured for the first time in 2015 and
received relatively low ratings: ability to
provide feedback and website postings of
delays or problems.
% VERY SATISFIED
2014 2015 INFO: Website postings of delays / problems
N/A 39%
SAFETY: Onboard after dark
37% 36%
ONBOARD: Ease of loading / unloaded crowding on vehicle
36% 35%
STOPS: Cleanliness of stops / shelters
41% 35%
▼
INFO: Ability to provide feedback
N/A 35%
SAFETY: Waiting after dark
28% 34%
▲
STOPS: Availability of shelters
35% 32%
ONBOARD: Availability of seating
40% 30%
▼
TRANSFER: Wait time 26% 30%
STOPS: Availability of seating
29% 27%
TRANSFER: Scheduling N/A 27%
STOPS: Protection from weather
N/A 26%
ONBOARD: Overcrowding
21% 20%
While the past years have seen
improvements in satisfaction with
safety after dark, Metro should
continue to focus its efforts in this area.
The issues of overcrowding are difficult
to address without additional service.
However, communications with Riders
about loading, managing personal
possessions, etc. can mitigate some of
the problems.

2015 Rider / Non-Rider Survey 122 | P a g e
Key Drivers
Analysis
This survey asked riders about their
satisfaction with 42 service elements.
Statistical analysis was used to group
these service elements into nine Overall
Service Dimensions, and to identify the
importance of these Dimensions and the
individual service elements in determining
Rider satisfaction with and expectations of
Metro. This summary table is ordered
based on the importance of the Overall
Service Dimension followed by the
importance of the elements of service.
Level of Service (LOS) continues to be the
most important determinants of Riders’
satisfaction with and expectations of
Metro.
With the exception of Distance from
Home to Stop, all elements of service
within the LOS dimension receive
below-average satisfaction ratings.
Personal Safety is the second most
important service dimension.
Safety after Dark remains an area of
concern.
Comfort and Cleanliness Onboard is the
third most important service dimension
and is more important than comfort and
cleanliness at stops.
All elements of service within the
Comfort and Cleanliness Onboard
High Importance / Below-Average Satisfaction: Improve
Importance Rank % Very Satisfied Level of Service (LOS)
Travel time 1 41%
Availability 2 44%
On-time 3 43%
Personal Safety
Onboard: Dark 2 36%
Waiting: Dark 3 34%
Comfort and Cleanliness Onboard
Cleanliness 1 45%
Loading at stops 2 43%
Crowding 3 20%
Park-and-Ride Lots
Vehicle security 2 43%
Transferring
Number of transfers 1 41%
Information
Provide feedback 1 35%
Comfort and Cleanliness at Stops
Weather protection 1 26%
Shelters 2 32%
Lower Importance / Below-Average Satisfaction: Strategically Target
Level of Service
Frequency of service 5 47%
Comfort and Cleanliness Onboard
Loading onboard 4 35%
Availability of seating 5 30% Park-and-Ride Lots
Parking Availability 3 45%
Transferring
Scheduling 2 27%
Wait Time 3 30%
Information
About service changes 3 41%
At stops 4 41%
Comfort and Cleanliness at Stops
Cleanliness 3 35%
Availability of seating 4 27%
While satisfaction with level of service
increased, the overall importance of
this dimension relative to all other
service dimensions cannot be under-
estimated.
The focus should be on travel
time and availability of service
to major destinations.
While satisfaction with waiting after
dark improved, Metro should continue
to focus on ensuring Rider safety after
dark. In addition, daytime safety should
not be ignored as satisfaction
decreased.
Crowding onboard and while loading at
stops continues to be a major issue.
While crowding is a long-term issue
that is not easily solved, improved
cleanliness onboard may be an easier
fix.
The importance placed on providing
feedback indicates the extent to which
Riders are engaged. It is important to
note that this is a new element of
service measured this year. The low
ratings may suggest they do not know
how to provide feedback and/or they
feel that their feedback is not heard.
2015 Rider / Non-Rider Survey 123 | P a g e
Dimension are key drivers and all
receive below-average ratings.

2015 Rider / Non-Rider Survey 124 | P a g e
Overview of Service Quality Analysis
Factor analysis was originally used to identify nine primary dimensions of service that contain elements of service that correlate with these overall dimensions.
The dimensions represent the broad categories on which Riders evaluate quality of service. The nine dimensions and the elements of service included in each
dimension for 2015 are illustrated below.
Dimension Elements of Service Included
Level of Service
Frequency of Service
On-Time Performance
Availability of Service (where you need to travel)
Travel Time
Distance from Home to Stop
Transferring Number of Transfers
Wait Time when Transferring
Scheduling of Connections
Comfort and Cleanliness Onboard
Inside Cleanliness
Availability of Seating
Overcrowding
Ease of Loading / Unloading due to crowding at stops
(moved from comfort/cleanliness at stops dimension)
Ease of Loading / Unloading due to crowding on-board
Comfort and Cleanliness at Stops Cleanliness of Shelters and Stops
Availability of Seating (at shelters and stops)
Availability of Shelters Stops
Protection from Weather (new)
Personal Safety
Daytime Safety Onboard
Daytime Safety at Stops
Onboard Safety after Dark
Safety at Stops after Dark
Safety in Downtown Transit Tunnel
Metro Drivers
Helpfulness (with route and stop information)
Courtesy
Effectively Handle Problems (on vehicles)
Operate Vehicles Safely
Start / Stop Vehicles Smoothly
Fare Payment
Ease of Paying Fares when Boarding
Overall Satisfaction with ORCA Card
Ease of Loading a Pass on ORCA Card
Ease of Adding Value to E-Purse
Value of Service for Fare Paid
Information Sources
Overall Ability to Get Information
Availability of Information Online
Availability of Information at Stops
Ability to get information via Smartphone
Notification of service changes
Website posting of delays / problems
Ability to provide feedback (new)
Park-and-Ride Lots Personal Safety at Park-and-Ride Lots
Security of Vehicles at Park-and-Ride Lots
Availability of Parking

2015 Rider / Non-Rider Survey 125 | P a g e
For the report, analysis of service quality consists of three stages:
1. A summary of the results for 2015, overall and for key subgroups (rider status and where appropriate area of residence)
2. A review of changes in ratings between 2014 and 2015
3. Key Drivers Analysis to identify priorities for improvements
Key Drivers Analysis is used to derive the importance of the individual elements of service. Derived importance measures are calculated through statistically
testing the influence of the individual elements of service on overall satisfaction with and expectations of Metro. Derived importance can help provide further
understanding of the underlying factors driving overall customer satisfaction and perceptions that a respondent may not explicitly state.
For this analysis, individual service elements were modeled as predictors that influence overall satisfaction with and expectations of Metro. A weighted index of
overall satisfaction with and rider expectations of Metro was developed to serve as the dependent variable. A multiple regression model was used to estimate
the derived importance coefficients, with larger coefficients having a greater influence on overall satisfaction.
The analysis is done initially to determine which of the overall dimensions of service contribute to customers’ overall satisfaction with and expectations of
Metro. Subsequent analysis then looks at the extent to which the individual elements of service within each overall dimension contribute to customers’ overall
satisfaction with and expectations of Metro. Thus, an individual element of service may be a key driver when the overall dimension is not or vice versa.
Overall dimensions and the individual elements of service are then placed into one of four quadrants and corresponding strategies:
High Importance / Below-Average Satisfaction** High Importance / Above-Average Satisfaction*
Improve existing levels of service Maintain existing levels of service
Low Importance / Below-Average Satisfaction Low Importance / Above-Average Satisfaction
Strategically target Monitor
* Above-average satisfaction percentage of “very satisfied” riders >=50%
** Below-average satisfied: percentage of “very satisfied” riders <50%

2015 Rider / Non-Rider Survey 126 | P a g e
Performance on Overall Service Dimensions
Ratings 2015
Overall satisfaction with each of the service
dimensions was computed as the average
satisfaction ratings for each major response
category (very satisfied, somewhat satisfied,
dissatisfied) across all elements of service
within each dimension.
The majority of Riders are “very” or
“somewhat satisfied” with all major service
dimensions.
Riders are most satisfied (50% or more “very
satisfied”) with:
Metro Operators
Fare Payment
Riders are least satisfied (less than 40% very
satisfied) with:
Transferring
Comfort and Cleanliness Onboard
and at Stops
Riders continue to be more satisfied with
comfort and cleanliness onboard than at
stops.
Figure 53: Overall Service Dimensions: Ratings for Quality of Service 2015
n nw
Level of Service, Personal Safety, Fare Payment 1,025 1,025
Transferring (Rides Who Transfer) 460 461
Comfort / Cleanliness Stops / Onboard 353 534
Operators, Information Sources 493 491
-25%
-23%
-23%
-16%
-14%
-12%
-12%
-6%
-5%
40%
42%
41%
36%
36%
35%
37%
21%
20%
30%
33%
35%
46%
48%
49%
48%
72%
72%
Comfort / Cleanliness at Stops
Transferring
Comfort / Cleanliness On-Board
Level of Service
Park-and-Ride Lots
Sources of Information
Personal Safety
Fare Payment
Operators
Dissatisfied Somewhat Satisfied Very Satisfied
92%
93%
85%
84%
84%
82%
76%
75%
70%

2015 Rider / Non-Rider Survey 127 | P a g e
Differences by Frequency of Riding (2015)
Consistent with their lower overall satisfaction ratings, Infrequent Riders are less satisfied with several of the overall service dimensions, notably fare payment,
sources of information, and personal safety.
Figure 54: Differences in % Very Satisfied with Overall Dimensions of Service (2015) Regular and Infrequent Riders
Base: Regular and Infrequent Riders 2015
Fare Payment Operators Sources of
Information
Personal Safety Level of Service Transferring Comfort / Cleanliness
on Board
Comfort / Cleanliness
at Stops
Regular
Riders
Infreq.
Riders
Regular
Riders
Infreq.
Riders
Regular
Riders
Infreq.
Riders
Regular
Riders
Infreq.
Riders
Regular
Riders
Infreq.
Riders
Regular
Riders
Infreq.
Riders
Regular
Riders
Infreq.
Riders
Regular
Riders
Infreq.
Riders
n 609 61 428 48 273 29 800 81 828 92 398 52 475 53 475 53
nw 443 204 311 165 197 98 590 287 602 316 272 174 354 184 354 184
75% 73%
53% 51%46% 45%
34% 33% 31%
65%
71%
43% 44% 46%42%
31%
37%32%
Fare Payment Operators Sources ofInformation
Personal Safety Level of Service Park-and-RideLots
Transferring Comfort /Cleanlinesss On-
Board
Comfort /Cleanliness at
Stops
% V
ery
Sati
sfie
d
Regular Riders Infrequent Riders

2015 Rider / Non-Rider Survey 128 | P a g e
Changes in Ratings 2014–2015
Consistent with the stability of overall satisfaction, there were relatively small changes in the percentage of Riders “very” satisfied with the primary dimensions
of service quality.
Satisfaction with Metro Operators, Park-and-Ride Lots, Level of Service, and Transferring increased significantly.
Figure 55: Overall Dimensions of Service Changes in Satisfaction Ratings 2014–2015*
* 2015 averages only contain those individual elements of service common to both 2014 and 2015. Therefore, 2015 averages presented here (Figure 55) may vary from the 2015 only (Figure 53)
which includes all individual elements of service including those new in 2015. Base: Regular and Infrequent Riders
Fare Payment Operators Sources of
Information
Personal Safety Level of Service Transferring Comfort / Cleanliness
on Board
Comfort / Cleanliness
at Stops
2014 2015 2014 2015 2014 2015 2014 2015 2014 2015 2014 2015 2014 2015 2014 2015
n 1,102 1,025 577 493 577 493 1,102 1,025 1,102 1,025 440 460 525 535 525 535
nw 1,161 1,025 587 491 587 491 1,161 1,025 1,161 1,025 440 461 571 534 571 534
81%
65%60%
50%
40% 41%
30%
38%35%
77%73%
58%
48% 48% 46%
35% 35%32%
Fare Payment* Operators* Sources ofInformation*
Personal Safety Park-and-RideLots
Level of Service Transferring* Comfort /Cleanlinesss On-
Board
Comfort /Cleanliness at
Stops*
% V
ery
Sati
sfie
d
2014 2015*

2015 Rider / Non-Rider Survey 129 | P a g e
Key Drivers
Three areas are clearly identified as target areas for improvement.
Level of service is by far the single largest driver of Riders’ overall satisfaction with and perceptions of Metro. Satisfaction is somewhat below the
target—46% compared to the cut point of greater than or equal to 50%.
Personal safety is the second key driver and satisfaction is somewhat below the target, 48% compared to the cut point of greater than or equal to 50%.
Comfort and cleanliness onboard is the third most important driver; this dimension has one of the lowest satisfaction rating (35%).
Figure 56: Key Drivers Overall Dimensions
Red text indicates item is a key driver of overall satisfaction with and perceptions of Metro; size of bubble indicates impact on overall satisfaction and perceptions of Metro
Level of Service
Personal SafetyComfort / Cleanliness Onboard
Park-and-Ride Lots
Operators
Fare PaymentTransferring
Information
Comfort / Cleanliness at Stops
-0.02
0.03
0.08
0.13
0.18
0.23
0.28
0.33
0.25 0.5 0.75
Bel
ow
Ave
rage
Im
po
rtan
ce
Ab
ove
A
vera
ge
<50%% Very Satisfied >= 50%

2015 Rider / Non-Rider Survey 130 | P a g e
Level of Service
Ratings 2015
More than four out of five (82%) Riders are currently
satisfied with the Level of Service provided by
Metro.
Nearly half are very satisfied.
Overall satisfaction for the individual elements of
service in this dimension are relatively consistent.
Riders are most satisfied with distance from
home to stop.
However, with the exception of distance
from home to stop, less than half of all
Riders are “very” satisfied with the elements
of service contained within this dimension.
While there are no differences in the overall
percentage of “very” satisfied Regular and
Infrequent Riders, Regular Riders are more likely
than Infrequent Riders to be “very” satisfied with
availability of service. On the other hand, Infrequent
Riders are more likely to be “very” satisfied with
frequency of service.
% Very Satisfied
Regular
Riders
Infrequent Riders
Overall Average 46% 46%
Distance to stop 62% 64%
Frequency of service 43%▼ 54%▲
Travel time 44% 37%
On-time performance 41% 48%
Availability of service 49%▲ 35%▼
Figure 57: Level of Service: Ratings for Quality of Service 2015
Questions: Are you satisfied or dissatisfied with [ELEMENT OF SERVICE]? Would that be very or somewhat [satisfied /
dissatisfied]?
Base: Regular and Infrequent Riders
n nw 2015 1,025 1,025
82%
89%
82%
80%
80%
81%

2015 Rider / Non-Rider Survey 131 | P a g e
Changes in Ratings 2014–2015
Riders’ satisfaction with Level of Service increased in 2015. This is noteworthy as the percentage of “Very Satisfied” Riders decreased between
2013 and 2014—from 50% to 41%, respectively. The increase in 2015 is significant for:
Distance from home to stop
Frequency of service
Figure 58: Level of Service: Changes in Ratings 2014–2015
Base: Regular & Infrequent Riders
2014 2015 n 1,102 1,025
nw 1,161 1,025

2015 Rider / Non-Rider Survey 132 | P a g e
Key Drivers Analysis
All five of the individual elements of service within the Level of Service dimension are key drivers of Riders’ overall customer satisfaction with and
perceptions of Metro.
Travel time is the most significant driver of customer satisfaction and perceptions of Metro and receives the lowest percentage of “very”
satisfied ratings (41%).
Figure 59: Key Drivers Level of Service
Red text indicates item is a key driver of overall satisfaction with and perceptions of Metro; size of bubble indicates impact on overall satisfaction and perceptions of Metro
On-Time Performance
Frequency of Service
Availability of Service Where Needed
Travel Time
Distance from Home to Stop
0
0.2
0.4
0.25 0.5 0.75
Bel
ow
Ave
rage
Im
po
rtan
ce
Ab
ove
A
vera
ge
<50%% Very Satisfied >= 50%

2015 Rider / Non-Rider Survey 133 | P a g e
Transferring
Ratings 2015
Three out of four (75%) Riders are satisfied
with transferring.
However, Riders are more likely to be
“somewhat” satisfied rather than
“very” satisfied.
A greater percentage of Riders are very
satisfied with the number of transfers
compared to wait time when transferring and
scheduling of connections.
There are no significant differences in
satisfaction with transferring between
Regular and Infrequent Riders.
There are differences by area of residence.
Notably, while South King County Riders are
somewhat less satisfied with number of
transfers, they are significantly more satisfied
with wait times when transferring
% Very Satisfied
Seattle/
North
South
King
East
King
Overall average 33% 33% 32%
Number of
transfers
42% 37% 41%
Scheduling of
connections
29% 23% 26%
Wait time 27% 39%
▲▲
29%
Figure 60: Transferring: Ratings for Quality of Service 2014
Questions: Are you satisfied or dissatisfied with [ELEMENT OF SERVICE]? Would that be very or somewhat [satisfied / dissatisfied]?
Base: Regular and Infrequent Riders Who Transfer
n nw 2015 460 461
75%
80%
72%
72%
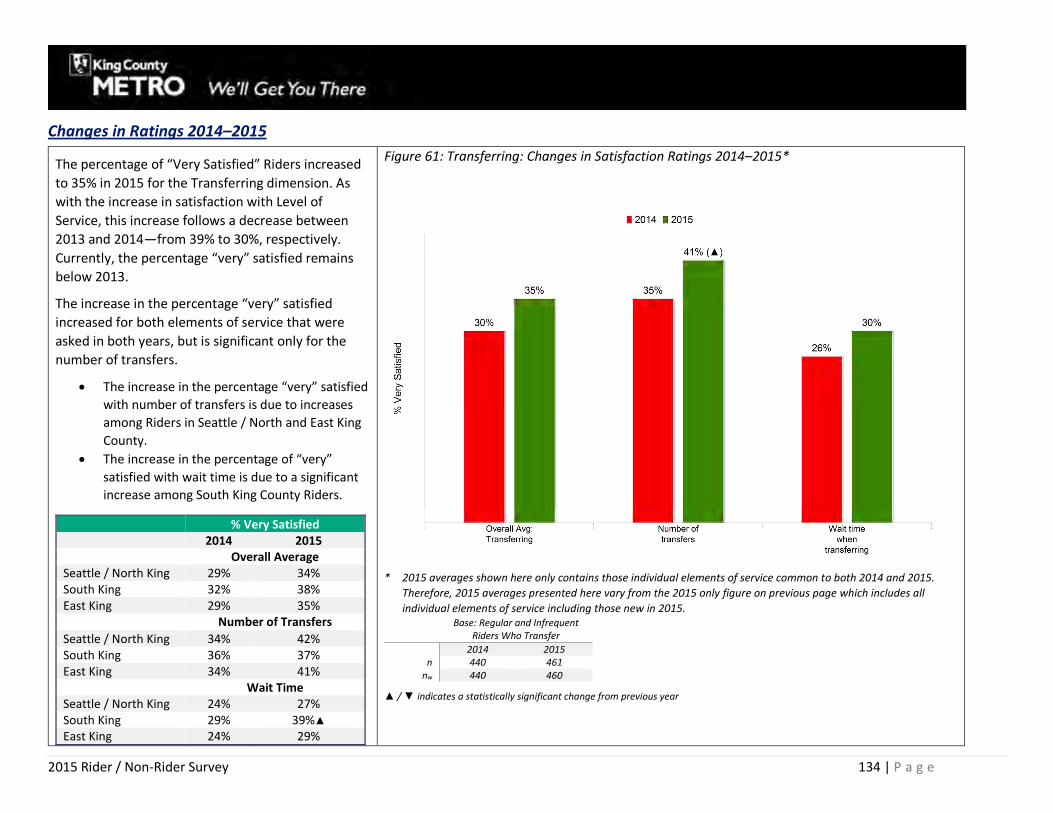
2015 Rider / Non-Rider Survey 134 | P a g e
Changes in Ratings 2014–2015
The percentage of “Very Satisfied” Riders increased
to 35% in 2015 for the Transferring dimension. As
with the increase in satisfaction with Level of
Service, this increase follows a decrease between
2013 and 2014—from 39% to 30%, respectively.
Currently, the percentage “very” satisfied remains
below 2013.
The increase in the percentage “very” satisfied
increased for both elements of service that were
asked in both years, but is significant only for the
number of transfers.
The increase in the percentage “very” satisfied
with number of transfers is due to increases
among Riders in Seattle / North and East King
County.
The increase in the percentage of “very”
satisfied with wait time is due to a significant
increase among South King County Riders.
% Very Satisfied 2014 2015 Overall Average Seattle / North King 29% 34% South King 32% 38% East King 29% 35% Number of Transfers
Seattle / North King 34% 42% South King 36% 37% East King 34% 41% Wait Time Seattle / North King 24% 27% South King 29% 39%▲ East King 24% 29%
Figure 61: Transferring: Changes in Satisfaction Ratings 2014–2015*
* 2015 averages shown here only contains those individual elements of service common to both 2014 and 2015.
Therefore, 2015 averages presented here vary from the 2015 only figure on previous page which includes all
individual elements of service including those new in 2015. Base: Regular and Infrequent
Riders Who Transfer
2014 2015 n 440 461
nw 440 460
▲ / ▼ indicates a statistically significant change from previous year

2015 Rider / Non-Rider Survey 135 | P a g e
Key Drivers Analysis
For those whose usual trip requires a transfer, all three elements of service are significant contributors to their overall satisfaction with and
expectations of Metro.
Number of transfers is more important than wait time and, despite, the increase in the percentage “very” satisfied noted on the previous page,
should be the primary focus for improvement.
In addition, scheduling of connections (i.e., the way service connections are scheduled when making transfers) is more important than wait
time.
Figure 62: Key Drivers: Transferring
Red text indicates item is a key driver of overall satisfaction with and perceptions of Metro; size of bubble indicates impact on overall satisfaction and perceptions of Metro
Number of Transfers
Wait Time
Scheduling of Connections0 0.5
Be
low
Ave
rage
Im
po
rtan
ce
Ab
ove
A
vera
ge
<50%% Very Satisfied >=50%

2015 Rider / Non-Rider Survey 136 | P a g e
Personal Safety
Ratings 2015
Eighty-five percent (85%) of all Riders are
satisfied with Personal Safety.
Nearly half are very satisfied.
Riders are significantly more satisfied with
Daytime Safety than with Safety after Dark.
Riders are also more likely to be very
satisfied with daytime safety while
waiting at stops than while on board.
Infrequent Riders are less likely than Regular
Riders to be “very” satisfied with safety due
to greater concerns with daytime safety.
% Very Satisfied
Regular Riders
Infrequent Riders
Overall Average 51%▲ 44%▼
Waiting during day 69%▲ 52%▼
Onboard during day 57%▲ 46%▼
In transit tunnel 54% 46%
Onboard after dark 38% 32%
Waiting after dark 33% 38%
Riders living in South King County are less
likely than those in other areas to be “very”
satisfied with personal safety.
South King County Overall Average 41%▼ Waiting during day 52%▼ In transit tunnel 49% Onboard during day 44%▼ Waiting after dark 30% Onboard after dark 27%▼
Figure 63: Personal Safety: Ratings for Quality of Service 2015
Questions: Are you satisfied or dissatisfied with [ELEMENT OF SERVICE]? Would that be very or somewhat [satisfied / dissatisfied]?
Small percentages (<5%) do not show on graph
Base: Regular and Infrequent Riders
n nw 2015 1,025 1,025
85%
95%
89%
86%
79%
76%

2015 Rider / Non-Rider Survey 137 | P a g e
Changes in Ratings 2014–2015
Overall satisfaction with personal safety increased significantly between 2013 and 2014—from 44% “very” satisfied to 50%, respectively—and remained
relatively stable in 2015. However, 2015 did see a decrease in the percent “very” satisfied with daytime safety. This was offset by an increase in
satisfaction with safety while waiting after dark.
This decrease in perceived safety during the daytime occurred primarily among Infrequent Riders—satisfaction with waiting during the daytime
decreased from 67% to 52% and satisfaction with onboard safety during the day decreased from 59% to 46%.
Figure 64: Personal Safety: Changes in Ratings 2014–2015
Base: Regular & Infrequent Riders
2014 2015 n 1,102 1,025
nw 1,161 1,025

2015 Rider / Non-Rider Survey 138 | P a g e
Key Drivers Analysis
All aspects of safety are key drivers of Riders’ overall satisfaction with and perceptions of Metro.
Daytime safety while riding is the most important factor and Metro performs well on this aspect of safety.
Safety after dark, onboard and while waiting, are key drivers and satisfaction is low. Both should be a continued focus for improvements.
Figure 65: Key Drivers: Personal Safety
Red text indicates item is a key driver of overall satisfaction with and perceptions of Metro; size of bubble indicates impact on overall satisfaction and perceptions of Metro
Daytime Safety Onboard
Daytime Safetyat Stops
After Dark Safety Onboard
After Dark Safety Waiting
Safety in DT Transit
-0.1
0.1
0.3
0.5
0.7
0.25 0.5 0.75
Bel
ow
Ave
rage
Im
po
rtan
ce
Ab
ove
A
vera
ge
<50% % Very Satisfied >= 50%

2015 Rider / Non-Rider Survey 139 | P a g e
Comfort and Cleanliness at Stops
Ratings 2015
Seven out of ten (70%) Riders are satisfied
with the Comfort and Cleanliness at Stops.
They are most satisfied with:
Cleanliness of Shelters and Stops
They are least satisfied with:
Availability of Seating at Shelters and
Stops
Protection from the weather
There are no significant differences in ratings
between Regular and Infrequent Riders
% Very Satisfied
Regular Riders
Infrequent Riders
Overall Average 30% 31%
Cleanliness of
shelters / stops 34% 39%
Availability of
shelters 32% 33%
Protection from
weather 26% 26%
Availability of
seating 29% 24%
Figure 66: Comfort and Cleanliness at Stops: Ratings for Quality of Service 2015
Questions: Are you satisfied or dissatisfied with [ELEMENT OF SERVICE]? Would that be very or somewhat [satisfied / dissatisfied]?
Base: Random Subset of Regular and Infrequent Riders
n nw 2015 535 534
70%
78%
72%
64%
66%

2015 Rider / Non-Rider Survey 140 | P a g e
Changes in Ratings 2014–2015
Satisfaction with comfort and cleanliness at
stops decreased slightly in 2015 due in part
to a significant decrease in the percentage of
Riders who were very satisfied with
cleanliness at shelters and stops.
This decrease is greatest among
Riders living in East King County—
from 45% in 2014 to 25% in 2015.
Figure 67: Comfort and Cleanliness at Stops: Changes in Ratings 2014–2015
* 2015 averages shown here only contains those individual elements of service common to both 2014 and 2015. Therefore,
2015 averages presented here vary from the 2015 only figure on previous page which includes all individual elements of
service including those new in 2015.
Base: Random Subset of Regular &
Infrequent Riders
2014 2015
n 518 535
nw 536 534
▲ / ▼ indicates a statistically change from previous year

2015 Rider / Non-Rider Survey 141 | P a g e
Key Drivers Analysis
While not a key driver overall, two aspects of comfort at stops are key drivers and receive a low percentage (<40%) of “very” satisfied ratings.
Protection from the weather is somewhat more important than availability of shelters.
Figure 68: Key Drivers: Comfort / Cleanliness at Stops
Red text indicates item is a key driver of overall satisfaction with and perceptions of Metro; size of bubble indicates impact on overall satisfaction and perceptions of Metro
Cleanliness of Stops
Availability of Seating at Shelters & Stops
Availability of Shelters
Protection from Weather
0 0.5
Bel
ow
Ave
rage
Im
po
rtan
ce
Ab
ove
Ave
rage
<50%% Very Satisfied >=50%

2015 Rider / Non-Rider Survey 142 | P a g e
Comfort and Cleanliness Onboard
Ratings 2015
Three out of four Riders are satisfied with the Comfort
and Cleanliness Onboard dimension. However, no
elements of service achieve a “very” satisfied rating
above 50 percent.
Riders are least satisfied with overcrowding on the
buses.
In general, Regular Riders are less likely than
Infrequent Riders to be “very” satisfied with comfort
and cleanliness while riding. The difference is greatest
for ease of loading and loading due to crowding on the
buses followed by inside cleanliness.
% Very Satisfied
Regular Riders
Infrequent Riders
Overall Average 33% 37%
Ease of loading /
unloading due to
crowding at stops
44% 42%
Inside cleanliness 42% 49%
Availability of
seating 29% 33%
Ease of loading /
unloading due to
crowding on buses
33% 40%
Overcrowding 19% 21%
The percentage of “Very Satisfied” Riders is lowest in
South King County (29%) due to significantly lower
ratings for general overcrowding (12%) and availability
of seating (23%).
Figure 69: Comfort and Cleanliness Onboard: Ratings for Quality of Service 2015
Questions: Are you satisfied or dissatisfied with [ELEMENT OF SERVICE]? Would that be very or somewhat [satisfied /
dissatisfied]?
Base: Random Subset of Regular and Infrequent Riders
n nw 2015 535 534
76% 87% 84%
77% 74% 54%

2015 Rider / Non-Rider Survey 143 | P a g e
Changes in Ratings 2014–2015
The percentage of Riders “very” satisfied with comfort and cleanliness while on-board has been decreasing year over year—from 44% in 2013 to 38% in
2014 and again to 35% in 2015.
The decrease between 2014 and 2015 is due mainly to decreased satisfaction with the availability of seating.
Figure 70: Comfort and Cleanliness On-Board: Changes in Ratings 2014–2015
Base: Random Subset of Regular & Infrequent Riders
2014 2015 n 518 535
nw 536 534

2015 Rider / Non-Rider Survey 144 | P a g e
Key Drivers Analysis
All five elements of comfort and cleanliness onboard are key drivers.
Crowding on the bus, notably the ease of loading and unloading due to crowding on the bus, are the most significant issues.
Figure 71: Key Drivers: Comfort and Cleanliness Onboard
Red text indicates item is a key driver of overall satisfaction with and perceptions of Metro; size of bubble indicates impact on overall satisfaction and perceptions of Metro
Inside Cleanliness
Availability of Seats
Overcrowding
Ease of Loading / Unloading
Ease of Loading / Unloading 0 0.5
Bel
ow
Ave
rage
Im
po
rtan
ce
Ab
ove
A
vera
ge
<50% % Very Satisfied >= 50%

2015 Rider / Non-Rider Survey 145 | P a g e
Park-and-Ride Lots
Ratings 2015
Park-and-ride lot users are generally satisfied
with safety and security at the lots.
They are less satisfied with vehicle
security than with their own personal
safety.
Park-and-ride lot users are significantly less
satisfied with the availability of parking.
Park-and-ride lot users in East and, to a lesser
extent, South King County are more satisfied
than those living in Seattle / North King
County.
Safety and security is a greater
problem in Seattle / North and South
King County than in East King County.
Parking availability is a significant
problem for users in Seattle / North
King County
% Very Satisfied
Seattle/
North
South
King
East
King
Overall
Average 39% ▼▼
46% ▲▼
53% ▲▲
Personal
Safety 47% ▼
51% ▼
62% ▲▲
Vehicle
Security 37% ▼
38% ▼
49% ▲
Parking
Availability 32% ▼▼
48% ▲
47% ▲
Figure 72: Park-and-Ride Lots: Ratings for Quality of Service 2015
Questions: Are you satisfied or dissatisfied with [ELEMENT OF SERVICE]? Would that be very or somewhat [satisfied / dissatisfied]?
Small percentages (<=5%) do not show on graph
Base: Park-and-Ride Lot Users
n nw 2015 538 480
84%
92%
86%
72%

2015 Rider / Non-Rider Survey 146 | P a g e
Changes in Ratings 2014–2015
Park-and-ride lot users’ satisfaction increased
significantly from 2014.
Overall satisfaction with park-and-ride lots
increased in all areas.
The increase was greatest among
users in East King County, due to a
significant increase in the percent
“very” satisfied with parking
availability—31% in 2014 to 47% in
2015.
Overall satisfaction among users in
South King County increased due to a
significant increase in the percent
“very” satisfied with personal
safety—40% in 2014 to 51% in 2015.
The increase in overall satisfaction
among users in Seattle / North King
County is due to increases in all three
elements of service; however, none
were statistically significant.
Overall Average
% Very Satisfied
2014 2015
Seattle / North King 33% 39%
South King 39% 46%
East King 44% 53%
Figure 73: Park-and-Ride Lots: Changes in Ratings 2014–2015
Base: Park-and-Ride Lot Users
2014 2015 n 448 538
nw 518 480
▲ / ▼ indicates a statistically significant change from previous year

2015 Rider / Non-Rider Survey 147 | P a g e
Key Drivers Analysis
All three elements of service related to park-and-ride lots are key drivers.
The most important element is personal safety, and users are generally satisfied.
Vehicle security is the second most important element of service and users are less satisfied.
Figure 74: Key Drivers: Park-and-Ride Lots
Red text indicates item is a key driver of overall satisfaction with and perceptions of Metro; size of bubble indicates impact on overall satisfaction and perceptions of Metro
Parking Availability
Personal Safety
Vehicle Security
0
0.33
0.66
0 0.5
Bel
ow
Ave
rage
Im
po
rtan
ce
Ab
ove
A
vera
ge
<50% % Very Satisfied >= 50%

2015 Rider / Non-Rider Survey 148 | P a g e
Information Sources
Ratings 2015
Riders are highly satisfied with their ability to
get information about Metro.
Infrequent Riders are less satisfied than
Regular Riders with sources of
information about Metro, notably their
ability to get information via their
Smartphones.
Riders are least satisfied with their ability to
provide feedback.
Infrequent Riders are significantly less
satisfied with this element of service.
% Very Satisfied
Regular
Riders
Infrequent
Riders
Overall Average 53%▲ 43%▼
Overall ability to
get information 61% 62%
Availability of
info. online 66% 54%
Information via
Smartphones 66%▲ 48%▼
Information at
stops 42% 41%
Notification of
service changes 43% 36%
problems 45% 25%
Ability to
provide
feedback
41%▲ 20%▼
Figure 75: Information Sources: Ratings for Quality of Service 2015
Questions: Are you satisfied or dissatisfied with [ELEMENT OF SERVICE]? Would that be very or somewhat [satisfied / dissatisfied]?
Small percentages (<=5%) do not show on graph
Base: Random Subset of Regular and Infrequent Riders
n nw 2015 490 491
84%
92%
94%
95%
80%
79%
86%
70%

2015 Rider / Non-Rider Survey 149 | P a g e
Changes in Ratings 2014–2015
The percentage of Riders’ who are very
satisfied with Sources of Information has
remained high over the years.
The percentage very satisfied with the
availability of information online decreased in
2015, returning to about 2013 levels (60%).
This decrease is a result of a
significant decrease among
Infrequent Riders—from 75% to 54%
very satisfied.
Figure 76: Information Sources: Changes in Ratings 2014–2015*
* 2015 averages shown here only contains those individual elements of service common to both 2014 and 2015. Therefore, 2015 averages
presented here vary from the 2015 only figure on previous page which includes all individual elements of service including those new in
2015. Base: Random Subset of Regular and
Infrequent Riders base varies based on use of information source
2014 2015 n 569 490
nw 579 491
▲ / ▼ indicates a statistically significant change from previous year

2015 Rider / Non-Rider Survey 150 | P a g e
Key Drivers Analysis
Two elements related to sources of information were not included in the Key Drivers Analysis due to low sample sizes for website postings of delays
and problems and the high correlation between overall ability to get information and the individual elements (high multi-colinearity).
All other elements of service related to sources of information about Metro are key drivers. Despite high use of Smartphones to get information, the
availability of information online is more important than availability of information via Smartphones.
Riders place the most importance on their ability to provide feedback and they are least satisfied with this element of service.
Figure 77: Key Drivers: Sources of Information*
Red text indicates item is a key driver of overall satisfaction with and perceptions of Metro; size of bubble indicates impact on overall satisfaction and perceptions of Metro
Information at Stops
Ability to Provide
Notification of Service
Availability of Information Online
Availability of Information on Smartphones
0
0.2 0.7
Bel
ow
Ave
rage
Im
po
rtan
ce
Ab
ove
A
vera
ge
<50% % Very Satisfied >= 50%

2015 Rider / Non-Rider Survey 151 | P a g e
Metro Operators
Ratings 2015
Metro’s operators are a significant asset.
More than nine out of ten Riders are
satisfied with Metro’s Operators.
More than seven out of ten are very
satisfied.
Figure 78: Metro Operators: Ratings for Quality of Service 2015
Questions: Are you satisfied or dissatisfied with [ELEMENT OF SERVICE]? Would that be very or somewhat [satisfied / dissatisfied]?
Small percentages (<=5%) do not show on graph
Base: Random Subset of Regular and Infrequent Riders
n nw 2015 490 491
92%
96%
93%
89%
93%
91%

2015 Rider / Non-Rider Survey 152 | P a g e
Changes in Ratings 2013—2014
The percentage of Riders “very” satisfied
with Metro operators increased in 2015 due
to a significant increase in ratings of how
well operators handle problems on their
vehicles.
This is noteworthy as the percentage “very”
satisfied with this element of service
decrease significantly between 2013 and
2014—from 64% to 55%, respectively. The
current level of satisfaction is higher than
that seen in all prior years.
Figure 79: Metro Operators: Changes in Ratings 2014–2015*
* 2015 averages shown here only contains those individual elements of service common to both 2014 and 2015. Therefore,
2015 averages presented here vary from the 2015 only figure on previous page which includes all individual elements of
service including those new in 2015. Random Subset of Regular and
Infrequent Riders
2014 2015 n 577 490
nw 587 491
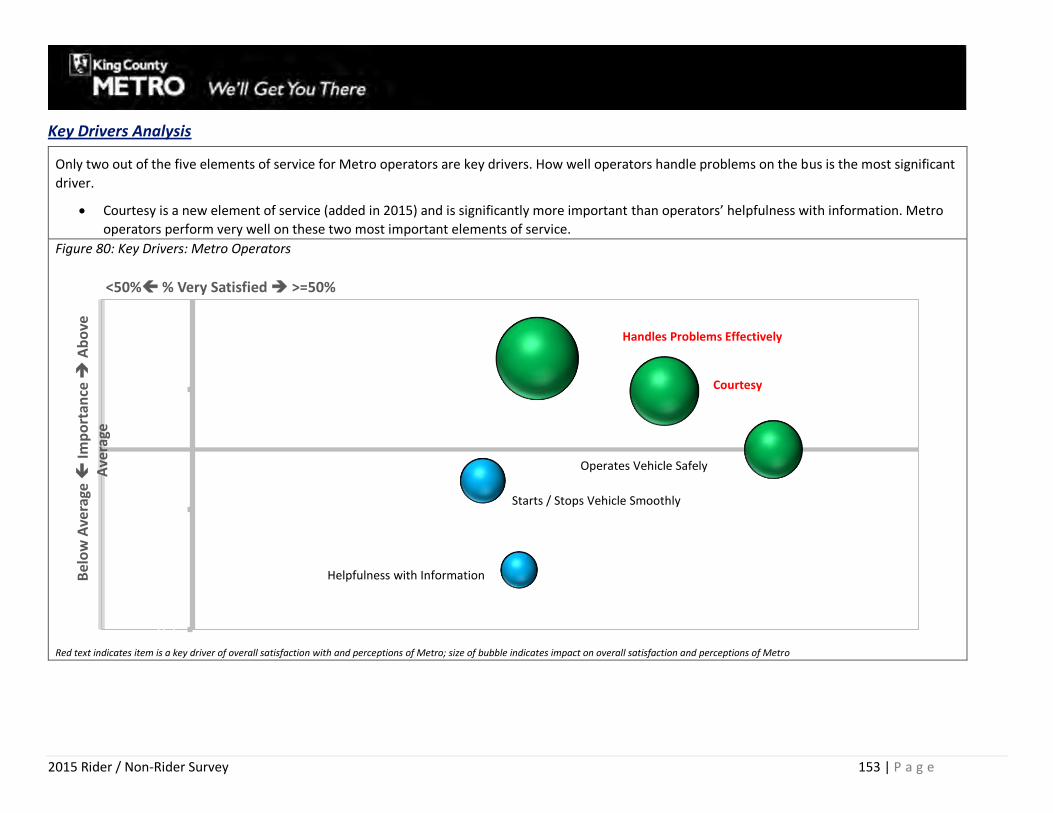
2015 Rider / Non-Rider Survey 153 | P a g e
Key Drivers Analysis
Only two out of the five elements of service for Metro operators are key drivers. How well operators handle problems on the bus is the most significant
driver.
Courtesy is a new element of service (added in 2015) and is significantly more important than operators’ helpfulness with information. Metro
operators perform very well on these two most important elements of service.
Figure 80: Key Drivers: Metro Operators
Red text indicates item is a key driver of overall satisfaction with and perceptions of Metro; size of bubble indicates impact on overall satisfaction and perceptions of Metro
Helpfulness with Information
Operates Vehicle Safely
Handles Problems Effectively
Courtesy
Starts / Stops Vehicle Smoothly
-0.1
0.1
0.3
0.45
Bel
ow
Ave
rage
Im
po
rtan
ce
Ab
ove
A
vera
ge
<50%% Very Satisfied >=50%

2015 Rider / Non-Rider Survey 154 | P a g e
Fare Payment
Ratings 2015
Riders are highly satisfied with all elements of
service within the Fare Payment dimension.
Riders are more likely to say they are
very satisfied with the Ease of
Loading a Pass on an ORCA Card than
the Ease of Adding Value to an E-
Purse.
Infrequent Riders are somewhat less satisfied
with fare payment due to a significantly
lower percentage of those “very” satisfied
with ease of paying fares when boarding.
% Very Satisfied
Regular Riders
Infrequent Riders
Overall Average 75% 65%
Satisfaction with
ORCA / U-PASS 85% 77%
Ease of paying fares
when boarding 84%▲ 73%▼
Ease of loading pass
on ORCA 72% 69%
Value of service for
fare paid 62% 53%
Ease of adding value
to E-Purse 63% 56%
Figure 81: Fare Payment: Ratings for Quality of Service 2015
Questions: Are you satisfied or dissatisfied with [ELEMENT OF SERVICE]? Would that be very or somewhat [satisfied / dissatisfied]?
Small percentages (<=5%) do not show on graph Base: Regular and Infrequent Riders
(varies based on ORCA use)
n nw 2015 1,025 1,025
93%
98%
96%
95%
89%
85%
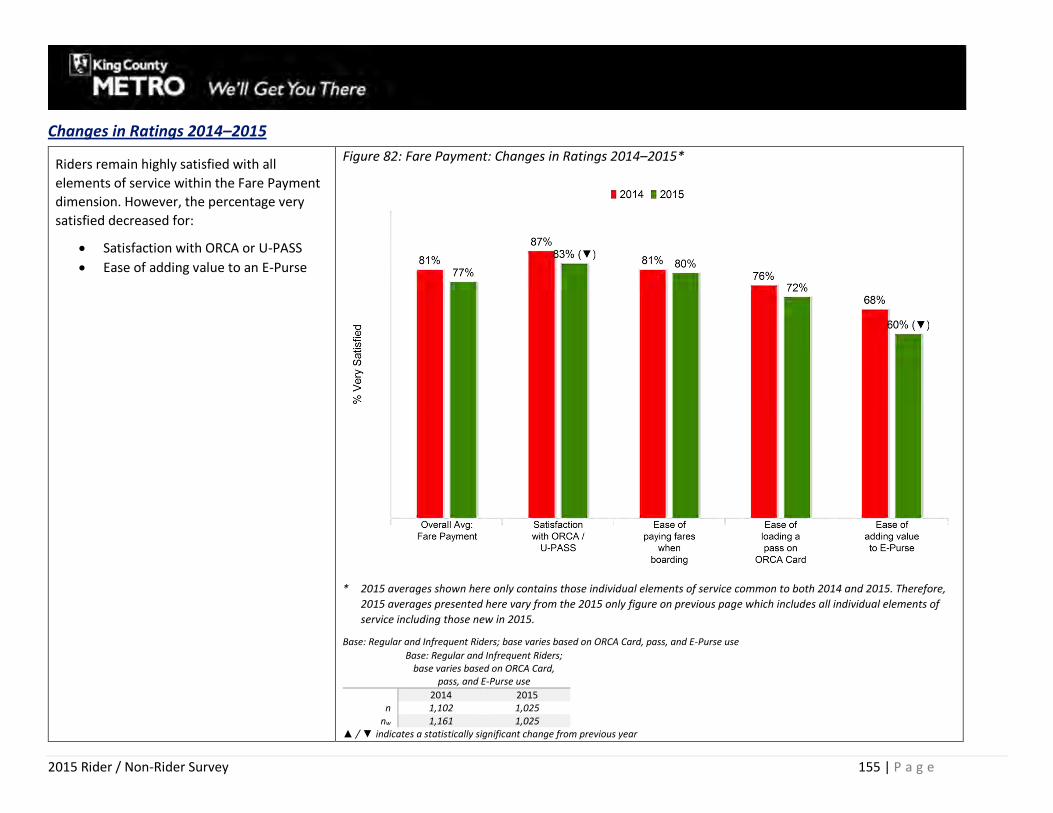
2015 Rider / Non-Rider Survey 155 | P a g e
Changes in Ratings 2014–2015
Riders remain highly satisfied with all
elements of service within the Fare Payment
dimension. However, the percentage very
satisfied decreased for:
Satisfaction with ORCA or U-PASS
Ease of adding value to an E-Purse
Figure 82: Fare Payment: Changes in Ratings 2014–2015*
* 2015 averages shown here only contains those individual elements of service common to both 2014 and 2015. Therefore,
2015 averages presented here vary from the 2015 only figure on previous page which includes all individual elements of
service including those new in 2015.
Base: Regular and Infrequent Riders; base varies based on ORCA Card, pass, and E-Purse use
Base: Regular and Infrequent Riders; base varies based on ORCA Card,
pass, and E-Purse use
2014 2015 n 1,102 1,025
nw 1,161 1,025 ▲ / ▼ indicates a statistically significant change from previous year

2015 Rider / Non-Rider Survey 156 | P a g e
Key Drivers Analysis
Only three elements of fare payment were included in the Key Drivers Analysis. Ease of adding value to an E-Purse or loading a pass are not included as
these questions were only asked of a subset of Riders (those who pay with ORCA and who have a pass or E-Purse loaded on their ORCA Card).
The value of service received for the fare paid is by far the single largest driver of Riders’ overall satisfaction with and perception of Metro and
Riders are generally very satisfied with this element of service.
Figure 83: Key Drivers: Fare Payment
Red text indicates item is a key driver of overall satisfaction with and perceptions of Metro; size of bubble indicates impact on overall satisfaction and perceptions of Metro
Ease of Paying Fares when Boarding
Overall Satisfaction with ORCA Card
Value of Service for Fare Paid
0
0.2
0.4
0.6
0.45
Bel
ow
Ave
rage
Im
po
rtan
ce
Ab
ove
A
vera
ge
<50%% Very Satisfied >=50%

2015 Rider / Non-Rider Survey 157 | P a g e
FINDINGS: NON-RIDERS
Summary
Topic What We Found What It Means
Transit Use
One out of three Non-Riders (those who
did not ride in the previous month) have
used Metro in the past year; 21% within
the past six months. Primary use is for
non-commute trips—for example,
recreation or to get to downtown Seattle.
At the same time a significant percentage
of Non-Riders have never ridden (11%) or
have not ridden Metro within the past five
years (32%).
2011 2013 2015
Used Metro in Past Year
32% 37%▲ 32%▼
Never Ridden Metro
16% 11%▼ 11%
Have not Ridden Within Past 5 Years
(includes Never Ridden)
43% 38% 43%
Significant increase (▲) or (▼) from previous year
There is clearly a segment of Non-Riders
who are open to using public
transportation. Understanding and
addressing their needs for service could
increase ridership.
Potential
Use of Metro
Non-Riders’ attitudes toward riding are
decidedly mixed. Just under half suggest
that riding is at least somewhat appealing
while just over half say that it is not
appealing. However, the strength of these
attitudes is stronger among those who say
it is not appealing.
One out of six Non-Riders said that they
would be very likely to ride if convenient
service was available.
More frequent service was the most
important improvement provided by all
Non-Riders with at least some stated
potential to use Metro.
% of Non-
Riders
Total Appealing 48%
Very Appealing 18%
Somewhat Appealing 30%
Total Not Appealing 52%
Not Very Appealing 20%
Not at All Appealing 32%
Potential Riders 32%
Very Likely to Ride 17%
Somewhat Likely to Ride 15%
No Potential 59%
Limited Likelihood 9%
Very Unlikely to Ride 59%
While there is some potential to increase
ridership among current Non-Riders
notably those with recent experience
riding, long-term ridership growth is most
likely to come from retention of existing
Riders and attracting New Riders as
people move into the region.
Reaching out directly to Non-Riders who
have had recent experience with riding
with additional information about
available service could encourage
additional use of Metro.

2015 Rider / Non-Rider Survey 158 | P a g e
Transit Use
Metro
Nearly one out of three Non-Riders have had
relatively recent experience with Metro
(ridden within the past year). One out of five
have ridden within the past six months.
The percentage with recent
experience increased significantly
between 2011 and 2013 but then
dropped in 2015.
Recent use of Metro is highest among Non-
Riders living in Seattle / North and, to a lesser
extent, East King County.
% of Non-Riders
Riding Metro within
Past Year
Seattle / North King 46%
South King 22%
East King 38%
Figure 84: Non-Riders’ Use of Metro in the Past Year
Questions: NON2 When was the last time you rode a Metro bus?
Base: Non-Riders
2011 2013 2015 n 1,066 1,019 815
nw 1,828 1,522 1,207
▲ / ▼ indicates a statistically significant change from previous year

2015 Rider / Non-Rider Survey 159 | P a g e
Just over two out of five Non-Riders have
never ridden Metro or rode five or more
years ago.
While the percentage of long-ago riders
increased between 2013 and 2015 (27%
compared to 32%, respectively), the
percentage who have never ridden dropped
between 2011 and 2013 and remained
unchanged in 2015.
More than half of South King County Non-
Riders have never ridden Metro or have not
ridden within the past five years.
% of Non-Riders
Who Have
Never Ridden
Ridden, but
not in Past
5 Years
Seattle /
North King
5% 26%
South King 15% 40%
East King 11% 24%
Figure 85: Percentage of Non-Riders Who Have Never Used or Used Metro 5 or More Years Ago
Questions: NON2 When was the last time you rode a Metro bus?
Base: Non-Riders
2011 2013 2015 n 1,066 1,019 815
nw 1,828 1,522 1,207 ▲ / ▼ indicates a statistically significant change from previous year

2015 Rider / Non-Rider Survey 160 | P a g e
The majority of Non-Riders who have ridden
Metro are using the bus for non-commute
trips. However, nearly three out of ten used
Metro to commute to work or school.
Figure 86: Primary Purpose for Using Metro
Questions: NON2A When you rode Metro, what was the primary purpose of the trip you took most often??
n nw
Base: Non-Riders Who Had Ridden Metro within 0 to 4 Years 449 660

2015 Rider / Non-Rider Survey 161 | P a g e
Other Transit Systems
One out of six Non-Riders have experience with
other public transportation in the region.
Use of other transit systems in the region is
highest among Non-Riders living in Seattle /
North King County. Frequency of riding is
relatively low.
% of Non-Riders
Riding Other
Transit Systems
(2015)
# of One-
Way Trips in
Past 30 Days
(2015)
Countywide 17% 5.5
Seattle / N. King 27% 4.3
South King 18% 6.9
East King 11% 4.0
Figure 87: Non-Riders’ Use of Other Transit Systems
Questions: NON1A Do you use any of the other public transportation services in the area? Base: Non-Riders
2013 2015 n 1,019 815
nw 1,522 1,207
Non-Riders are most likely to ride Link Light Rail.
This is noteworthy among those living in Seattle
/ North King and South King County where
service is available.
Table 18: System(s) Used
Questions: NON1B Which (public transportation service) do you use? Multiple responses allowed.
Base: Non-Riders Who Ride Other Transit
Countywide Seattle / North King South King East King* (small base) n 133 53 56 24
nw 202 64 98 40

2015 Rider / Non-Rider Survey 162 | P a g e
Potential Ridership
Appeal of Using Metro
Non-Riders’ views regarding the appeal of
using Metro are decidedly mixed. However,
while an equal percentage of Non-Riders say
that riding Metro is appealing versus not
appealing, nearly twice as many say it is not at
all appealing compared to very appealing.
Figure 88: Appeal of Using Metro
Questions: NON6A Overall, how appealing to you personally is the idea of using Metro?
n nw
Base: Non-Riders 2015 815 1,207

2015 Rider / Non-Rider Survey 163 | P a g e
Non-Riders who have had recent experience (within the last year) with Metro are significantly more likely than those who have not ridden recently or
who have never ridden to say the idea of using Metro is appealing.
Figure 89: Appeal of Using Metro by Past Use
Questions: NON6A Overall, how appealing to you personally is the idea of using Metro?
n nw
Base: Non-Riders 2015 815 1,207

2015 Rider / Non-Rider Survey 164 | P a g e
Likelihood of Riding
While nearly half (48%) of all Non-Riders said
the idea of riding Metro is at least somewhat
appealing, only one out of three (32%) stated
they would be likely to ride.
Figure 90: Likelihood of Riding Metro
Questions: NON6B If convenient transit service was available to places you typically travel, how likely would you be to ride Metro? 11-point scale; 9 – 10 coded as “very likely” 7 – 8 coded as “somewhat likely” 4 – 6 coded as “limited likelihood” 0 – 3 or riding Metro is not at all appealing coded as “very unlikely”
n nw
Base: Non-Riders 2015 815 1,207

2015 Rider / Non-Rider Survey 165 | P a g e
Non-Riders who have had recent experience (within the last year) with Metro are significantly more likely than those who have not ridden recently or
who have never ridden to suggest they would be very or somewhat likely to ride.
Figure 91: Likelihood of Using Metro by Past Use
Questions: NON6A Overall, how appealing to you personally is the idea of using Metro?
n nw
Base: Non-Riders 2015 815 1,207

2015 Rider / Non-Rider Survey 166 | P a g e
Most Important Improvement to Encourage Ridership
More frequent service was the most important improvement provided by
all Non-Riders with at least some stated potential to use Metro.
Among Non-Riders with the highest potential, frequency coupled with
direct service were mentioned most frequently.
Figure 92: All Potential Riders: Most Important Improvements to Encourage Ridership
Figure 93: Highest Potential Riders: Most Important Improvements to Encourage Ridership
Question: NON6C What is the single most important thing that Metro could do to increase your likelihood of using the bus for at least some of your travel?
n nw
Base: Non-Riders with some potential (6+ on 11-point scale) 333 480 Base: Non-Riders with high potential (9-10 on 11-point scale) 142 203

2015 Rider / Non-Rider Survey 167 | P a g e
FINDINGS: RIDERS’ AND NON-RIDERS’ COMMUTE TRAVEL
Summary
Topic What We Found What It Means
Commute
Status
The current year (2015) saw a significant
decrease in the percentage of Riders and
Non-Riders who commute to work or
school outside the home, three or more
days per week.
This decrease is due almost entirely to a
decrease in commuters among Non-
Riders.
Riders & Non-Riders
2011 2013 2015
Commuters
61% 63% 53%▼
Non-Commuter
39% 37% 47%▲ Significant increase (▲) or (▼) from previous year
The decrease in the percentage of Non-
Riders who are commuters may in part
reflect the increase in the percentage of
Non-Riders who are older and retired.
% Commuters
2011 2013 2015
Riders
70% 71% 68%
Non-Riders
58% 59% 46%▼ Significant increase (▲) or (▼) from previous year
Commute
Mode
The percentage of King County
commuters using Metro has increased
significantly over the past five years.
(Those using Metro for 50% or more of
their commute trips are considered Metro
Bus Commuters).
More than three out of four Regular
Riders who are commuters use Metro to
get to work—up 11 points from 2011.
Riders & Non-Riders Commute Mode
2011 2013 2015
Metro Bus
16% 23%▲ 27%▲
Single Occupant Vehicle
63% 60%▼ 52%▼
Regular Riders Commute Mode
2011 2013 2015
Metro Bus
66% 75%▲ 77%
Single Occupant Vehicle
11% 12% 10% Significant increase (▲) or (▼) from previous year
The increase in use of Metro for
commuting is consistent with recent
analysis of Census data that found a
significant increase in commuters using
Metro (“Seattle Sees Biggest Jump in Bus
Riders of Any U.S. City,” Seattle Times,
April 22, 2016.)
Increased access to transit and other
alternative modes coupled with increasing
congestion may be driving the decrease in
single-occupant vehicle commuting.

2015 Rider / Non-Rider Survey 168 | P a g e
Topic What We Found What It Means
Work
Location
More than one out of five commuters
work in the downtown Seattle core—up
significantly over the past five years.
Nearly two out of five commuters work in
downtown Seattle and the areas
immediately surrounding downtown
Seattle.
More than three out of five Metro bus
commuters work within this concentrated
area. However, most work within the
core.
% of Commuters Working in Downtown
Seattle Core
2011 2013 2015
All Commuters
10% 17%▲ 23%▲
Metro Bus Commuters
27% 37%▲ 46%▲
% of Commuters Working in Surrounding
Downtown Areas
2011 2013 2015
All Commuters
16% 16% 16%
Metro Bus Commuters
31% 20%▼ 18%
% of Commuters Working in DT Seattle Core
& Surrounding Areas
2011 2013 2015
All Commuters
26% 33%▲ 39%▲
Metro Bus Commuters
58% 57% 64%▲
Metro’s commuter segment is increasingly
those who work in the heart of downtown
Seattle. The addition of new services and
realignment of existing services to better
serve the areas surrounding the core may
encourage greater use of Metro to
commute to these areas.
Commute
Mode by
Major Work
Location
More than half of commuters working in
the heart of downtown Seattle use Metro
to get to work—up significantly in the past
five years.
The percentage of Metro bus commuters
working at or near the University of
Washington has also increased
significantly.
Mode Share—Metro Bus
2011 2013 2015
Downtown Seattle
43% 52%▲ 54%
Surrounding Downtown
32% 29% 30%
University of WA
42% 45%▲ 53%▲
Downtown Bellevue
8% 16% 24%
Availability of service to downtown Seattle
and the University as well as high costs
and/or availability of parking in these
areas are most likely key factors in
commuters’ decision to use Metro.

2015 Rider / Non-Rider Survey 169 | P a g e
Commute Status
Respondents are classified as Commuters versus Non-Commuters based on the number of days per week they commute to work or school outside the home.
Commuters are defined as those employed full or part-time or students who commute to a fixed worksite or school at least three days per week by any mode.
Just over half (53%) of all Riders and Non-
Riders are commuters—that is, work or go to
school outside their home three or more days
per week.
This figure is significantly lower than in
previous years.
Figure 94: Commuter Status
Questions: CS1 Are you currently employed / self-employed, a student, a homemaker, retired, currently not employed or something else?
CS2B/3B How many days a week do you travel to work, that is, you work outside your home / attend school? Base: All Respondents
2011 2013 2015 n 2,521 2,414 1,840
nw 2,521 2,414 1,840 ▲ / ▼ indicates a statistically significant change from previous year

2015 Rider / Non-Rider Survey 170 | P a g e
Riders are significantly more likely than Non-Riders to be commuters.
The percentage of Riders who are commuters has not varied
significantly over the years.
The decrease in the percentage of all commuters is due almost entirely to
a decrease in commuters among Non-Riders.
Currently, less than half of all Non-Riders are commuters.
Figure 95: Riders’ Commuter Status
Figure 96: Non-Riders’ Commuter Status
Questions: CS1 Are you currently employed / self-employed, a student, a homemaker, retired, currently not employed or something else? CS2B/3B How many days a week do you travel to work, that is, you work outside your home / attend school?
Base: Regular and Infrequent Riders
2011 2013 2015 n 1,455 1,395 1,025
nw 1,455 1,395 1,025 ▲ / ▼ indicates a statistically significant change from previous year
Base: Non-Riders
2011 2013 2015 n 1,066 1,019 815
nw 1,066 1,019 815 ▲ / ▼ indicates a statistically significant change from previous year

2015 Rider / Non-Rider Survey 171 | P a g e
Telecommuting
We see a significant increase in the percentage of Riders and Non-Riders
who are employed but do not work outside the home three or more days
per week. This decrease is evident for both Riders and Non-Riders but is
greater for Non-Riders.
Similarly, there has been a significant decrease in the number of days
employed Non-Riders commute to a worksite outside their home.
Figure 97: Trends in Work at Home Status
Figure 98: Trends in Number of Days Commuting
CS2B/3B How many days a week do you travel to work, that is, you work outside your home / attend school?
Riders and Non-Riders who are Employed
Riders and Non-Riders Riders Non-Riders 2011 2013 2015 2011 2013 2015 2011 2013 2015
n 1,567 1,492 1,090 936 897 677 631 595 413 nw 1,575 1,561 1,076 445 601 420 1,130 960 655
▲ / ▼ indicates a statistically significant change from previous year

2015 Rider / Non-Rider Survey 172 | P a g e
Commute Mode
Overall
The percentage of surveyedcommuters using Metro has increased steadily
over the past five years.
More than three out of four Regular Riders use Metro to commute to
work or school, up significantly from 2011.
The percentage of Regular Riders using Metro to commute to
work or school has increased by 11 percentage points.
Figure 99: Primary Commute Mode Riders and Non-Riders
Figure 100: Primary Commute Mode Regular Riders
Question: C4B How do you typically get to work or school? Does not sum to 100%; other modes not included.
Base: All Commuters (Riders & Non-Riders)
2011 2013 2015 n 1,567 1,492 1,090
nw 1,575 1,561 1,076 ▲ / ▼ indicates a statistically significant change from previous year
Question: C4B How do you typically get to work or school? Does not sum to 100%; other modes not included.
Base: Commuters who are Regular Riders
2011 2013 2015 n 850 617 639
nw 691 514 472 ▲ / ▼ indicates a statistically significant change from previous year

2015 Rider / Non-Rider Survey 173 | P a g e
Commuters do not use the same mode every
day. A variable was computed based on the
number of days an individual respondent
works and the number of days they use
Metro to get to work. Those who primary
mode is Metro bus use Metro to get to work
a minimum of half of the days they work.
Nearly one out of four commuters
use Metro for all of their commute
trips.
More than four out of five (83%)
Metro bus commuters commute to
work or school by bus every day they
work. The balance use Metro at least
half of the days they work but use
other modes as well.
Figure 101: Use of Metro for Commuting by Primary Commute Mode (2015)
Base: Commuters 2015
All Commuters SOV Metro Bus Carpool / Vanpool Other n 1,009 325 534 56 94
nw 896 471 244 77 105 Those using other transit are not included as base size was too small (n <25).

2015 Rider / Non-Rider Survey 174 | P a g e
Commute Mode by Frequency of Riding
As would be expected, commute mode varies
between Riders and Non-Riders but also
between Regular and Infrequent Riders.
More than three out of four Regular
Riders use Metro to commute to
work.
Figure 102: Commute Mode (2015) by Frequency of Riding
Base: Commuters 2015
All Riders Regular Riders Infrequent Riders Non-Riders n 712 655 57 308
nw 425 299 126 485

2015 Rider / Non-Rider Survey 175 | P a g e
Demographic Characteristics of Riders Driving Alone versus Metro Bus (Primary Commute Mode)
There are surprisingly few demographic differences between commuters
who drive alone to work and those using Metro.
The primary distinguishing characteristics is access to a vehicle
combined with income. Notably those without or limited access
to a vehicle (one vehicle in the household) using Metro to
commute to work are more likely to be low income (<$35,000)
or high income ($100,000 plus).
Table 19: Demographics: Commute Mode
SOV
(n=307; nw=440) METRO
(n=532; nw=242)
GENDER MALE 52% 53% FEMALE 48% 47%
AGE 16 –34 32% 42% 35 –54 45% 40% 55+ 23% 18% MEAN 42.6 38.8
EMPLOYMENT STATUS EMPLOYED 97%▲ 85%▼ STUDENT 3%▼ 15%▲
INCOME <$35K 7%▼ 22%▲ $35K–<$55K 16% 18% $55K–<$75K 15%▲ 12%▼ $75K–<$100K 17% 17% $100K+ 45%▲ 32%▼ MEDIAN $93,056 $74,200
HH COMPOSITION % SINGLE-PERSON 20% 18% AVERAGE HH SIZE 2.71 2.79
RACE/ETHNICITY CAUCASIAN ALONE 66% 61% ASIAN ALONE 19% 15% BLACK ALONE 2%▼ 9%▲ HISPANIC 6% 8% MIXED RACE / OTHER 6% 7%
VEHICLE ACCESS % W/ LICENSE 100%▲ 79%▼ % W/ VEHICLES 100%▲ 86%▼ MEAN # VEHICLES 2.32 1.66
Base: Commuters; Year: 2015 ▲ / ▼indicates a statistically significant difference between respondent groups Columns may sum to more or less than 100% due to rounding

2015 Rider / Non-Rider Survey 176 | P a g e
Work Location
Downtown Seattle is the destination for the
largest percentage (23%) of surveyed
commuters, up significantly from 2011.
Coupled with the area immediately
surrounding downtown, nearly two out of
five (39%) commuters currently work in or
immediately around the downtown core
(South Lake Union, Pioneer Square, Belltown,
International District, Capitol Hill, First Hill,
Denny Regrade, and SODO).
Figure 103: Work Location
Question: C1 In what geographic area do you work / attend school?
Base: All Commuters
2011 2013 2015 n 1,616 1,484 1,027
nw 1.533 1,517 931 ▲ / ▼ indicates a statistically significant change from previous year

2015 Rider / Non-Rider Survey 177 | P a g e
Metro Bus Commuters’ commute destination
is increasingly concentrated in downtown
Seattle.
Nearly half of all Metro Bus
Commuters currently work in the
Downtown Seattle core. This number
has increased by 20 percentage
points since 2011.
Combined with the destinations immediately
surrounding downtown Seattle, nearly two
out of three (64%) Metro Bus Commuters
work within these major destination zones.
Figure 104: Work Location Metro Bus Commuters
Question: C1 In what geographic area do you work / attend school?
Base: Metro Bus Commuters
2011 2013 2015 n 633 679 524
nw 487 553 388 ▲ / ▼ indicates a statistically significant change from previous year

2015 Rider / Non-Rider Survey 178 | P a g e
More than one out of four (28%) drive-alone
commuters work in downtown Seattle or the
area immediately surrounding the downtown
core. This is up significantly from 2011 when
just 17 percent of drive-alone commuters
work in these two areas.
This is significantly less than the 64 percent of Metro Bus Commuters who work within this concentrated area.
Figure 105: Work Location Drive-Alone Commuters
Question: C1 In what geographic area do you work / attend school?
Base: Drive-Alone Commuters
2011 2013 2015 n 637 590 307
nw 971 903 440 ▲ / ▼ indicates a statistically significant change from previous year

2015 Rider / Non-Rider Survey 179 | P a g e
Downtown Seattle and the University have
the highest percentage of surveyed
commuters using Metro.
Among commuters working in
downtown Seattle the share using
Metro increased significantly
between 2011 and 2013. The
percentage increased again in 2015
but that increase was not significant.
Among commuters working in the
University area, the share using
Metro has increased each year and is
significantly higher than in 2011.
% Commute by Metro
Bus
2011 2013 2015
DT Seattle Core 43% 52% ▲
54%
Surrounding DT 32% 29% 30%
University of WA 40% 45% ▲
53% ▲
DT Bellevue 8% 16% 24%
Table 20: Mode Share by Work Location
Downtown Surrounding University Other North Downtown Other East South
Seattle Core Downtown King Bellevue King King
Base size 308 165 79 66 67 137 130
Metro Bus 54% 30% 53% 23% 24% 9% 8%
SOV 28% 45% 27% 48% 63% 63% 73%
Carpool / 5% 5% 9% 14% 9% 12% 11%
Vanpool
Other Transit 4% 0% 0% 0% 0% 4% 0%
Other 9% 20% 12% 15% 4% 12% 8%
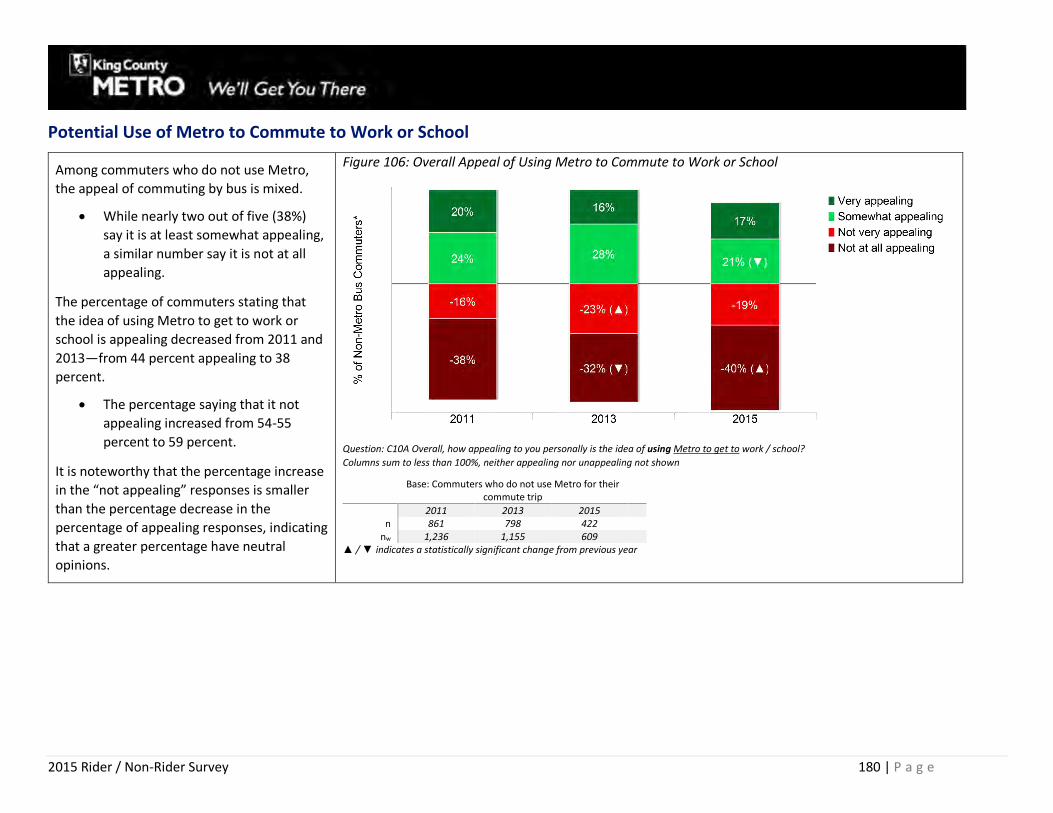
2015 Rider / Non-Rider Survey 180 | P a g e
Potential Use of Metro to Commute to Work or School
Among commuters who do not use Metro,
the appeal of commuting by bus is mixed.
While nearly two out of five (38%)
say it is at least somewhat appealing,
a similar number say it is not at all
appealing.
The percentage of commuters stating that
the idea of using Metro to get to work or
school is appealing decreased from 2011 and
2013—from 44 percent appealing to 38
percent.
The percentage saying that it not
appealing increased from 54-55
percent to 59 percent.
It is noteworthy that the percentage increase
in the “not appealing” responses is smaller
than the percentage decrease in the
percentage of appealing responses, indicating
that a greater percentage have neutral
opinions.
Figure 106: Overall Appeal of Using Metro to Commute to Work or School
Question: C10A Overall, how appealing to you personally is the idea of using Metro to get to work / school?
Columns sum to less than 100%, neither appealing nor unappealing not shown
Base: Commuters who do not use Metro for their commute trip
2011 2013 2015 n 861 798 422
nw 1,236 1,155 609 ▲ / ▼ indicates a statistically significant change from previous year

2015 Rider / Non-Rider Survey 181 | P a g e
One out of six (17%) commuters who do not
use Metro suggest they are at least
somewhat likely to consider riding.
Figure 107: Likelihood of Using Metro to Commute to Work or School
Question: C10A _1 If convenient transit service was available to where you would [work/go to school], how likely would you be to ride Metro?
Base: Commuters who do not use Metro for their commute trip: 2015
n 422 nw 609

2015 Rider / Non-Rider Survey 182 | P a g e
FINDINGS: GOODWILL Goodwill is a measure of how well Metro delivers to and emotionally engages its Riders and the communities it serves. A high reservoir of goodwill ensures
higher support for Metro plans and policies. High goodwill also ensures that Metro has support to draw on during tough times (e.g., service cuts, extreme
weather, etc.). Overall goodwill is measured by the extent to which Riders and Non-Riders have expectations of Metro and believe that Metro provides high
quality service. Goodwill is comprised of three primary components:
Brand Perception: Brand Perception is the portion of goodwill attributable to the Riders’ and Non-Riders’ subjective and intangible perceptions of Metro (above
and beyond its objectively perceived value). This evaluation is shaped by direct
experience, external influences, and Metro’s communications strategies. For
Riders and Non-Riders, the main drivers of Brand Perception are:
Awareness, which is heavily influenced by the media and word-of-
mouth, and
Perceptions of the quality of service provided such as the extent to
which the agency has high standards for the quality of service provided,
provides excellent customer service, and is innovative.
In addition, Riders’ direct experiences, as reflected by their satisfaction with
service, are included in this component.
Brand Relationship: Brand Relationship is the extent to which Riders and Non-
Riders are emotionally attached to Metro and goes beyond the objective and
subjective assessments of Metro that are part of Brand Perception. For Riders
and Non-Riders this is measured by the extent to which they agree that they:
Like and respect Metro,
Trust Metro, and
Believe that Metro values it customers.
Among Riders, the extent to which they like to say they ride Metro is also included.
Value: Value is the objective assessment of the utility of the services Metro provides based on perceptions of what is forgone for what is received. For the
purposes of this research, value is measured by the extent to which Riders and Non-Riders agree that Metro provides good value for the quality of service
provided and that Metro values its customers.
Goodwill
Brand Perception
Relationship with Brand
Value Received

2015 Rider / Non-Rider Survey 183 | P a g e
Summary
Topic What We Found What It Means
Meeting
Expectations
The majority of Riders and Non-Riders
expect high quality services from Metro
and are generally positive or confident in
Metro’s ability to deliver to these
expectations.
Regular Riders are the most likely to have
high expectations for quality and be
confident in Metro’s ability to deliver.
Infrequent Riders are more likely to
suggest that they are generally positive
rather than fully confident.
While the majority of Non-Riders have
high expectations of Metro, one out in six
(16%) have low expectations and low
confidence.
Expect High Quality and are. . .
Confident* Positive** Total
2013 18% 45% 63%
2015 18% 43% 61%
2015
All Riders 20% 48% 68%
Regular
Riders 24% 45% 69%
Infreq.
Riders 12% 53% 65%
Non-
Riders
16% 41% 57%
* I have high expectations of Metro and I am
confident that they will continue to provide the best
service possible
** I generally expect high quality service from Metro and
I am generally confident that they will provide high
quality service
The extent to which Riders and Non-Riders
have high expectations of Metro and believe
that Metro provides high quality service is a
measure that goes beyond satisfaction and
factors in the theory of disconfirmation which
examines the extent to which the outcome—
delivered service—meets or contradicts
expectations.
Riders experiencing disconfirmation—that is,
service does not meet their expectations—
may be willing to expend additional effort in
order to have service that meets their needs
and expectations. However, that additional
effort could result in lower satisfaction.
Alternatively, they may lower their
expectations which then decreases goodwill
and support for riding.
Non-Riders will consider riding if they believe
their expectations can be met; and they will
support Metro if they feel the quality of
service provided adds value to the
community.

2015 Rider / Non-Rider Survey 184 | P a g e
Topic What We Found What It Means
Brand
Perception
The majority of Riders and Non-Riders
agree that Metro provides excellent
customer service and has high standards
for service. However, strength of that
agreement decreased in 2015 due to a
decrease in the percentage who
somewhat agree.
Riders and Non-Riders are less likely to
agree that Metro is innovative. Moreover,
the percentage saying that Metro is NOT
innovative has increased—from 25% to
32%, respectively.
% Agree
2013 2015
Has High Standards
for Service
80% 74% ▼
Provides Excellent
Customer Service
78% 72% ▼
Is Innovative 65% 56% ▼
Metro should investigate what factors
underlie the erosion in Riders’ and Non-
Riders’ perceptions of its focus on quality
levels of service and customer service.
In addition, Metro should communicate new
innovations that have been introduced, such
as real-time information at stops, new electric
trolley buses coming into service, TripPool,
etc. In addition, Metro should focus on
additional innovations notably in the areas of
fare payment.
External
Influences
and Brand
Perception
While the majority of Riders and Non-
Riders hear positive things about Metro
from their friends and colleagues and, to a
somewhat lesser extent, in the media, a
significant percentage hear negative
comments. This is noteworthy among
Infrequent Riders.
On a positive note, the extent to which
Riders and Non-Riders disagree that they
hear positive things about Metro has
decreased significantly.
% Agree
Hear Good Things. . . 2013 2015
From Friends and
Colleagues
61% 60%
In the Media 56% 58%
% Disagree
From Friends and
Colleagues
30% 25% ▼
In the Media
37% 31% ▼
Metro should continue to work on improved
media relations to publicize positive news
about the system. Social media channels can
also be extremely effective in countering
negative comments.

2015 Rider / Non-Rider Survey 185 | P a g e
Topic What We Found What It Means
Brand
Relationship
The majority of Riders and Non-Riders
have a strong Brand Relationship with
Metro.
The strength of these associations
weakened somewhat due to a decrease in
the percentage of Riders, notably
Infrequent Riders, who somewhat agree
with these statements.
% Agree
2013 2015
Like and Respect 82% 78%
Trust 82% 78%
Values its Customers 85% 81%
Like to Say I Ride
Metro (Riders Only)
80% 74%
As with Brand Perception, Metro should
investigate what could be contributing to the
somewhat weaker ratings among those who
have less of a relationship with Metro, for
example Infrequent Riders.
Value
As with the other aspects of goodwill, the
majority of Riders and Non-Riders
continue to agree that Metro provides
good value for the level of services it
provides. However, the strength of that
agreement is weakening, notably among
Infrequent Riders and Non-Riders.
Value of Services
2013 2015
Total Agree 85% 80% ▼
Strong Agree 40% 43%
Somewhat Agree 45% 37% ▼
Disagree 11% 13% ▲
Recent fare increases combined with service
cuts in both 2014 and 2015 may have
contributed to the slight erosion in perceived
value of services provided.

2015 Rider / Non-Rider Survey 186 | P a g e
Goodwill
Regression analysis was used to
determine the extent to which the
individual elements of Brand Perception
and Brand Relationship affect the extent
to which Riders and Non-Riders have high
expectations of Metro and believe that
Metro provides high quality service. The
coefficients from this analysis were used
to compute weighted indices reflecting
overall Brand Perception and Brand
Relationship.
A similar analysis was then used to
determine the extent to which the two
overall indices (Brand Perception and
Brand Relationship) and ratings for the
value of service received contributes to
the extent to which Riders and Non-Riders
have high expectations of Metro and
believe that Metro provides high quality
service. The results from this analysis was
used to develop an overall Goodwill Index.
Metro has a moderately high level of
goodwill. Improving perceptions of the
brand (i.e., what they hear about and feel
about Metro) would have the greatest
impact on overall goodwill. Riders, notably
Regular Riders, have a higher Goodwill
Index than do Non-Riders.
Overall
Brand Perception
Brand Relationship
Value
3.68 4.00 4.05 Goodwill 3.83
Riders
Perception Relationship Value 3.86 4.18 4.24
Goodwill 3.94
Non-Riders
Perception Relationship Value 3.56 3.89 3.95
Goodwill 3.75
Regular Riders
Perception Relationship Value 3.89 4.27 4.24
Goodwill 3.96
Infrequent Riders
Perception Relationship Value 3.80 4.03 4.24
Goodwill 3.90
Metro can improve its Goodwill Index
through positive messaging to key targets.
Notably, Non-Riders’ Brand Relationship can
be most improved by increasing the extent
to which they like and respect Metro.
Infrequent Riders’ Brand Relationship can be
improved by increasing the extent to which
they say they like to ride.
Non-Riders’ Brand Perception can be most
improved by increasing the extent to which
they are aware of and believe that Metro
provides excellent customer service.
Infrequent Riders need to be convinced that
Metro has high standards for the quality of
service it provides.

2015 Rider / Non-Rider Survey 187 | P a g e
Meeting Expectations
A transit agency is only as good as its Riders’ and Non-Riders’ assessment and expectation of the agency. Therefore, in 2013 a question was added to measure
the extent to which Metro meets Riders’ and Non-Riders’ expectations for service. This question builds on the theory of disconfirmation which examines the
extent to which the outcome—delivered service—meets or contradicts expectations.
Riders experiencing disconfirmation—that is, service does not meet their expectations—may be willing to expend additional effort—for example take an
earlier bus or change routes to take a less crowded bus—in order to have service that meets their needs and expectations. However, this is likely to lead
to lower overall satisfaction. Alternatively, Riders may lower their expectations, which then decreases goodwill towards the agency and they may stop
riding and/or ride less often.
Non-Riders will consider riding if they believe their expectations can be met; and they will support Metro if they feel the quality of service provided adds
value to the community.

2015 Rider / Non-Rider Survey 188 | P a g e
The majorities of Riders and Non-Riders have
high expectations for the quality of service
Metro provides and are generally positive to
highly confident that Metro can meet these
expectations.
There have been no changes in this key
measure over the past several years.
Figure 108: Extent to Which Metro Meets Riders’ and Non-Riders’ Expectations for Service

2015 Rider / Non-Rider Survey 189 | P a g e
Regular Riders are significantly more
confident in Metro’s ability to meet their
expectations for quality service than are
Infrequent and Non-Riders.
In addition, Non-Riders are more likely than
both Regular and Infrequent Riders to say
they have mixed or low expectations for
quality and that they are not fully confident
Metro can deliver quality service.
Table 21: Differences in Extent to Which Metro Meets Riders and Non-Riders’ Expectations by Rider Status (2015)
All
Riders
Regular
Riders
Infrequent
Riders
Non-
Riders
Expect High Quality / Confident Can Deliver 20% 24% ▲
12% ▼
16% ▼
Expect High Quality / Generally Positive 48% 45% 53% 41%
Mixed Expectations / Not Fully Confident 28% 26% 30% 26%
Low Expectations / Low Confidence 5% 5% ▼
5% ▼
16% ▲▲
Question: GW7 Based on anything you have seen, heard, or directly experienced, which of the following statements best describes how you feel about Metro?
All Riders and Non-Riders 2015
2013 2015 All Riders Regular Riders Infrequent Riders Non-Riders n 2,414 1,840 1,025 922 103 815
nw 2,414 1,840 1,025 412 219 1,207

2015 Rider / Non-Rider Survey 190 | P a g e
Brand Perception
The majority of Riders and Non-Riders agree
that Metro provides excellent customer
service and has high standards for service.
However, the total percentage who agree
decreased in 2015 due to a decrease in the
percentage who somewhat agree. There was
no change in the level of disagreement.
% Agree
2013 2015
Provides Excellent
Customer Service
78% 72% ▼
Has High Standards
for Service
80% 74% ▼
Figure 109: Perceptions of Metro

2015 Rider / Non-Rider Survey 191 | P a g e
Riders and Non-Riders are less likely to agree
that Metro is innovative.
Moreover, the percentage saying that Metro
is NOT innovative increased significantly.
% Agree
2013 2015
Is Innovative 65% 56% ▼
Overall, both Riders and Non-Riders feel that Metro has a commitment to providing quality service—both in terms of product and customer service.
But, they are less likely to feel the agency is innovative.
Riders are more likely than Non-Riders to have a strongly positive Brand Perception of Metro.
In addition, Regular Riders are more likely than Infrequent Riders to have a strongly positive (as measured by the percentage who “strongly”
agree) Brand Perception of Metro.
A significant percentage of Non-Riders and, in some instances, Infrequent Riders say they neither agree nor disagree, suggesting they have no
opinion or not enough information to respond.
% Agree (Combined Strongly and Somewhat Agree)
All Riders Regular Riders Infrequent Riders Non-Riders
Provides Excellent Customer Service 82%▲ 83%▲ 78%▲ 66%▼▼
Has High Standards for Service 82%▲ 83%▲ 81%▲ 70%▼▼
Is Innovative 65% 68%▲ 59%▼▲ 51%▼▼

2015 Rider / Non-Rider Survey 192 | P a g e
Table 22: Provides Excellent Customer Service by Rider Status (2015)
Agree / Disagree:
Provides Excellent Customer Service
All
Riders
Regular
Riders
Infrequent
Riders
Non-
Riders
Strongly
Agree
37% ▼▲
41% ▲▲▲
28% ▼
29% ▼
Somewhat
Agree
45% ▲
42% ▲
50% ▲
37% ▼▼▼
Neutral 5% ▲▼
3% ▼▼▼
8% ▲▼
16% ▲▲▲
Disagree 14% ▼
13% ▼
14% 18% ▲
Table 23: Has High Standards for Service by Rider Status (2015)
Agree / Disagree:
Has High Standards for Service
All
Riders
Regular
Riders
Infrequent
Riders
Non-
Riders
Strongly
Agree
34% 37% ▲
29% 31% ▼
Somewhat
Agree
48% ▲
46% ▲
52% ▲
39% ▼▼▼
Neutral 4% ▲▼▼
1% ▼▼▼
10% ▲▲
10% ▲▲
Disagree 13% ▼
15% ▼
9% ▼
19% ▲
Table 24: Is Innovative by Rider Status (2015)
Agree / Disagree:
Is Innovative
All
Riders
Regular
Riders
Infrequent
Riders
Non-
Riders
Strongly
Agree
22% 25% ▲▲
15% ▼
19% ▼
Somewhat
Agree
43% ▲
43% ▲
44% ▲
32% ▼▼▼
Neutral 8% ▲▼
5% ▼▼▼
13% ▲
14% ▲▲
Disagree 27% ▼
27% ▼
28% 34% ▲▲
Question: GW5 / GW6 Based on anything you have seen, heard, or directly experienced, please tell me if you agree or disagree with each of the following statements? (FOLLOW-UP) Would that be strongly or somewhat (agree/disagree)?
All Riders and Non-Riders 2015
2013 2015 All Riders Regular Riders Infrequent Riders Non-Riders n 2,414 1,840 1,025 922 103 815
nw 2,414 1,840 1,025 412 219 1,207

2015 Rider / Non-Rider Survey 193 | P a g e
External Influences and Brand Perception
The majority of Riders and Non-Riders hear positive things about Metro from their friends and colleagues and in the media, and continue to say they
hear more positive things about Metro from their friends and colleagues than from the media.
The extent to which Riders and Non-Riders strongly agree they hear positive things about Metro has increased significantly. In addition, the
percentage who say they hear negative things has decreased significantly.
% Agree
2013 2015
Hear Positive Things from Friends / Colleagues 61% 60%
Near Positive Things in the Media 56% 58%
Figure 110: Extent to Which Riders and Non-Riders Hear Positive Things about Metro from Friends / Colleagues
Figure 111: Extent to Which Riders and Non-Riders Hear Positive Things about Metro in Media

2015 Rider / Non-Rider Survey 194 | P a g e
There are no significant differences in the extent to which Riders and Non-Riders agree that they hear positive things about Metro.
While the majority of Riders agree that they hear positive things about Metro, they are more likely than Non-Riders to disagree. Notably, a
significant percentage of Infrequent Riders disagree that they hear positive things about Metro in the media.
% Agree (Combined Strongly and Somewhat Agree)
All Riders Regular Riders Infrequent Riders Non-Riders
Hear Positive Things from Friends and Colleagues 62% 64% 59% 58%
Hear Positive Things in the Media 58% 64% 49% 59%
Table 25: Hear Positive Things from Friends and Colleagues by Rider Status (2015)
Agree / Disagree:
Hear Positive Things from Friends and Colleagues
All
Riders
Regular
Riders
Infrequent
Riders
Non-
Riders
Strongly Agree 23%
26%
18%
24%
Somewhat Agree 39% ▲
38%
41%
34% ▼
Neutral 8% ▲▼
6% ▼▼▼
12% ▲
19% ▲▲
Disagree 30% ▲
31% ▲
28% 23% ▼
Table 26: Hear Positive Things in the Media by Rider Status (2015)
Agree / Disagree:
Hear Positive things in the Media
All
Riders
Regular
Riders
Infrequent
Riders
Non-
Riders
Strongly Agree 20%
23%
15%
22%
Somewhat Agree 38%
41%
34%
37%
Neutral 7% ▼
5% ▼
10%
13% ▲▲
Disagree 35% ▲
31% ▼
42% ▲▲
28% ▼▼
Question: GW5 / GW6 Based on anything you have seen, heard, or directly experienced, please tell me if you agree or disagree with each of the following statements? (FOLLOW-UP) Would that be strongly or somewhat (agree/disagree)?
All Riders and Non-Riders 2015
2013 2015 All Riders Regular Riders Infrequent Riders Non-Riders n 2,414 1,840 1,025 922 103 815
nw 2,414 1,840 1,025 412 219 1,207

2015 Rider / Non-Rider Survey 195 | P a g e
Brand Relationship
The majority of Riders and Non-Riders have a
strong Brand Relationship with Metro.
However, the strength of those associations
has weakened somewhat from 2013.
Notably, while the percentage of those who
strongly agree remained relatively stable, the
percentage who somewhat agree decreased
and a greater percentage have neutral
opinions or disagree.
% Agree
2013 2015
Like and Respect
Metro
82% 78%
Agency I Trust 82% 78%
Values it Customers 85% 81%
Figure 112: Brand Relationship

2015 Rider / Non-Rider Survey 196 | P a g e
Overall, the majority of Riders and Non-Riders agree with the three primary elements of Brand Relationship.
Riders are more likely than Infrequent Riders and Non-Riders to have a stronger Brand Relationship with Metro due to a higher percentage of
those who strongly agree with the three statements.
Non-Riders are twice as likely as Riders to disagree that they like and respect Metro; they are also more likely to disagree that it is an agency
they trust. A significant percentage of Non-Riders also have neutral opinions. There are no differences in the extent to which Riders and Non-
Riders disagree that Metro values its customers
% Agree (Combined Strongly and Somewhat Agree)
All Riders Regular Riders Infrequent Riders Non-Riders
Like and Respect Metro 88% 90% 86% 73%
Agency I Trust 88% 89% 85% 74%
Values its Customers 87% 88% 85% 76%
Table 27: Agency I Like and Respect by Rider Status (2015)
Agree / Disagree:
Like and Respect Metro
All
Riders RR INF NON
Strongly Agree
45% ▲
48% ▲
40%
36% ▼▼
Somewhat Agree
43% ▲
42%
46%
37% ▼
Neutral 3% ▼
2% ▼
5%
11% ▲▲
Disagree 8% ▼
8% ▼
8% ▼
16% ▲▲▲
Table 28: Agency I Trust by Rider Status (2015)
Agree / Disagree:
Agency I Trust
All
Riders RR INF NON Strongly
Agree 45%
▲ 48%
▲ 38% 36%
▼▼ Somewhat
Agree 43%
▲ 41%
47%
38% ▼
Neutral 3% ▲▼▼
1% ▼▼▼
6% ▲▲
10% ▲▲
Disagree 10% ▼
10% ▼
9% ▼
17% ▲▲▲
Table 29: Extent to Which Metro Values its Customers by Rider Status (2015)
Agree / Disagree:
Values its Customers
All
Riders RR INF NON Strongly
Agree 40% ▼▲
45% ▲▲▲
30% ▼
36% ▼
Somewhat
Agree 47%
▲ 43%
▼ 55% ▲▲
40% ▼▼
Neutral 3% ▼
2% ▼▼
6% ▲
11% ▲▲
Disagree 10%
10%
10% 13%
Question: GW5 / GW6 Based on anything you have seen, heard, or directly experienced, please tell me if you agree or disagree with each of the following statements? (FOLLOW-UP) Would that be strongly or somewhat (agree/disagree)?
All Riders and Non-Riders 2015
2013 2015 All Riders Regular Riders Infrequent Riders Non-Riders n 2,414 1,840 1,025 922 103 815
nw 2,414 1,840 1,025 412 219 1,207
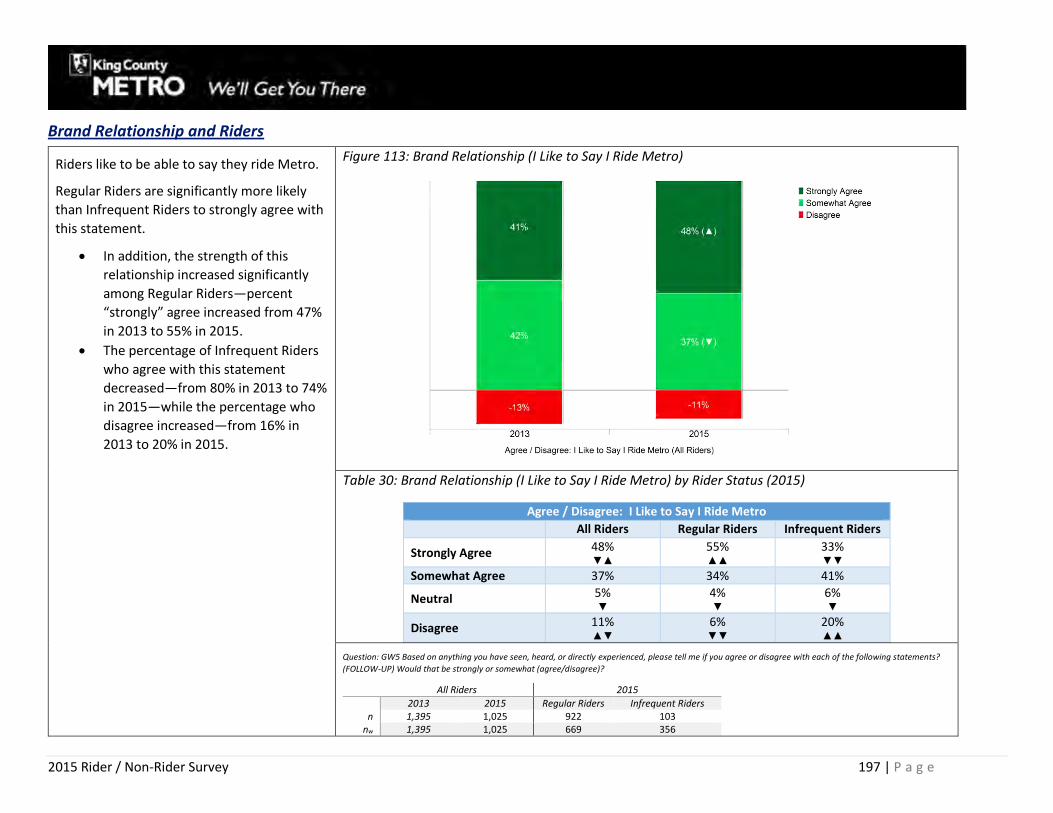
2015 Rider / Non-Rider Survey 197 | P a g e
Brand Relationship and Riders
Riders like to be able to say they ride Metro.
Regular Riders are significantly more likely
than Infrequent Riders to strongly agree with
this statement.
In addition, the strength of this
relationship increased significantly
among Regular Riders—percent
“strongly” agree increased from 47%
in 2013 to 55% in 2015.
The percentage of Infrequent Riders
who agree with this statement
decreased—from 80% in 2013 to 74%
in 2015—while the percentage who
disagree increased—from 16% in
2013 to 20% in 2015.
Figure 113: Brand Relationship (I Like to Say I Ride Metro)
Table 30: Brand Relationship (I Like to Say I Ride Metro) by Rider Status (2015)
Agree / Disagree: I Like to Say I Ride Metro
All Riders Regular Riders Infrequent Riders
Strongly Agree 48% ▼▲
55% ▲▲
33% ▼▼
Somewhat Agree 37% 34% 41%
Neutral 5% ▼
4% ▼
6% ▼
Disagree 11% ▲▼
6% ▼▼
20% ▲▲
Question: GW5 Based on anything you have seen, heard, or directly experienced, please tell me if you agree or disagree with each of the following statements?
(FOLLOW-UP) Would that be strongly or somewhat (agree/disagree)?
All Riders 2015
2013 2015 Regular Riders Infrequent Riders n 1,395 1,025 922 103
nw 1,395 1,025 669 356
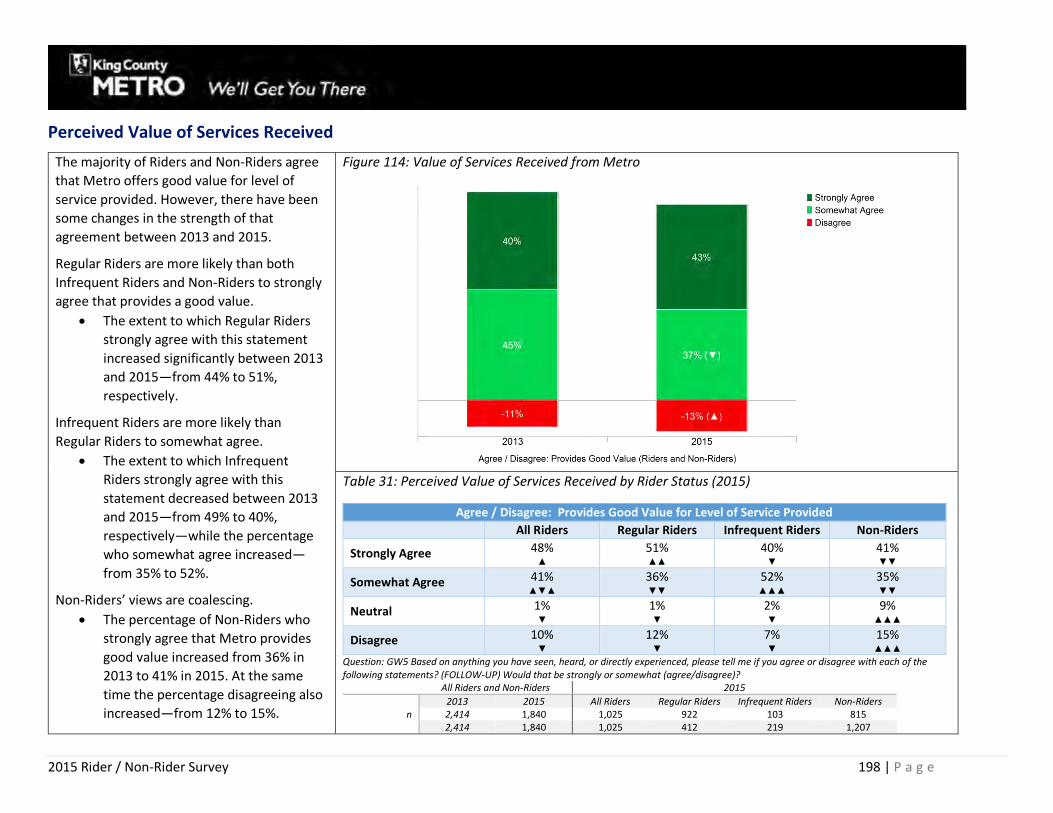
2015 Rider / Non-Rider Survey 198 | P a g e
Perceived Value of Services Received
The majority of Riders and Non-Riders agree
that Metro offers good value for level of
service provided. However, there have been
some changes in the strength of that
agreement between 2013 and 2015.
Regular Riders are more likely than both
Infrequent Riders and Non-Riders to strongly
agree that provides a good value.
The extent to which Regular Riders
strongly agree with this statement
increased significantly between 2013
and 2015—from 44% to 51%,
respectively.
Infrequent Riders are more likely than
Regular Riders to somewhat agree.
The extent to which Infrequent
Riders strongly agree with this
statement decreased between 2013
and 2015—from 49% to 40%,
respectively—while the percentage
who somewhat agree increased—
from 35% to 52%.
Non-Riders’ views are coalescing.
The percentage of Non-Riders who
strongly agree that Metro provides
good value increased from 36% in
2013 to 41% in 2015. At the same
time the percentage disagreeing also
increased—from 12% to 15%.
Figure 114: Value of Services Received from Metro
Table 31: Perceived Value of Services Received by Rider Status (2015)
Agree / Disagree: Provides Good Value for Level of Service Provided
All Riders Regular Riders Infrequent Riders Non-Riders
Strongly Agree 48% ▲
51% ▲▲
40% ▼
41% ▼▼
Somewhat Agree 41% ▲▼▲
36% ▼▼
52% ▲▲▲
35% ▼▼
Neutral 1% ▼
1% ▼
2% ▼
9% ▲▲▲
Disagree 10% ▼
12% ▼
7% ▼
15% ▲▲▲
Question: GW5 Based on anything you have seen, heard, or directly experienced, please tell me if you agree or disagree with each of the following statements? (FOLLOW-UP) Would that be strongly or somewhat (agree/disagree)?
All Riders and Non-Riders 2015
2013 2015 All Riders Regular Riders Infrequent Riders Non-Riders n 2,414 1,840 1,025 922 103 815
2,414 1,840 1,025 412 219 1,207

2015 Rider / Non-Rider Survey 199 | P a g e
Goodwill Index
Calculations
A Goodwill Index has been computed each year since 2013 based on some combination of these questions. In 2014, two indices were created based on which
grouping of questions respondents were asked. In 2015, all respondents were asked all of the questions with the intent being to create a single index. Following
is a description of the process followed to develop the 2015 Goodwill Index.
Step 1: The first step in developing the index was to determine (using regression analysis) the extent to which each of the individual elements within Brand
Perception and Brand Relationship (the two components of goodwill that include multiple elements) contributed to Riders’ and Non-Riders’ expectations for
Metro. This analysis is done separately for Riders and Non-Riders. The coefficients from this analysis were used to compute weighted indices reflecting overall
Brand Perception and Brand Relationship.
Brand Perception is comprised of the six
individual elements shown in Figure 115.
Riders’ Goodwill is most heavily influenced by
their direct experiences with and perceptions
of the service Metro provides, and less so by
what they hear from other sources.
Among the five Brand Perception elements,
Non-Riders’ Goodwill is most strongly
influenced by their perceptions of the
customer service provided. It is also heavily
influenced by what they hear from their
friends and colleagues.
Figure 115: Impact of Individual Brand Perception Elements on Goodwill
0
0.05
0.1
0.15
0.2
0.25
0.3
0.35
High Standardsfor Service
Quality
OverallSatisfaction
ExcellentCustomer
Service
Innovative Hear PositiveThings From
Friends
Hear PositiveThings in Media
Exte
nt
of
Imp
act
on
Go
od
will
Riders Non-Riders

2015 Rider / Non-Rider Survey 200 | P a g e
Riders’ Brand Relationship is measured by the
four elements shown in Figure 116, and
goodwill is most heavily influenced by the
extent to which they feel Metro values its
customers.
Of Non-Riders’ three Brand Relationship
elements, Goodwill is most strongly
influenced by the extent to which they like
and respect Metro and, to a lesser extent, the
extent to which they trust the agency.
Figure 116: Impact of Individual Brand Relationship Elements on Goodwill
0
0.05
0.1
0.15
0.2
0.25
0.3
0.35
0.4
0.45
Metro Values itCustomers
Like and Respect Metro Trust Metro Like to Say I Ride Metro
Exte
nt
of
Imp
act
on
Go
od
will
Riders Non-Riders

2015 Rider / Non-Rider Survey 201 | P a g e
Step 2: We then used regression analysis to determine the extent to which the two overall indices reflecting overall Brand Perceptions and Brand Relationship
and ratings for Perceived Value for the service received (the third component of Goodwill) collectively contributed to overall Goodwill.
Brand Perception is the single most
important driver of Riders’ Goodwill.
Brand Perception and Brand Relationship are
nearly equally important components of Non-
Riders’ Goodwill.
Figure 117: Impact of Three Primary Components of Goodwill on Goodwill
0
0.1
0.2
0.3
0.4
0.5
0.6
0.7
0.8
0.9
Brand Perception Brand Relationship Value
Exte
nt
of
Imp
act
on
Go
od
will
Riders Non-Riders

2015 Rider / Non-Rider Survey 202 | P a g e
Step 3: Using the regression coefficients developed in Step 2, an overall Goodwill Index was computed.
Metro has a moderately high level of
Goodwill (3.83).
Improving Brand Perception (i.e., what they
hear about and feel about Metro) would have
the greatest impact on overall Goodwill,
notably for Riders.
Figure 118: Overall Brand Perception, Brand Relationships, Value, and Goodwill Indices
Computed indices are based on a 5-point scale where “5” means “very high” and “1” means “very low.”
Goodwill3.83
Brand Perception
3.68
Brand Relationship
4.00
Value4.05

2015 Rider / Non-Rider Survey 203 | P a g e
Differences by Rider Status
Riders have higher ratings for all components of the Goodwill Index than do
Non-Riders.
Infrequent Riders’ overall Goodwill Index is somewhat lower than
Regular Riders due to a weaker Brand Relationship Index.
Figure 119: Differences in Brand Perception, Brand Relationship, Value, and Goodwill Indices—Riders and Non-Riders
Figure 120: Differences in Brand Perception, Brand Relationship, Value, and Goodwill Indices—Regular and Infrequent Riders
Computed indices are based on a 5-point scale where “5” means “very high” and “1” means “very low.”
3.863.56
4.183.89
4.243.953.94
3.75
1
2
3
4
5
ALL Riders NON-Riders
Brand Perception Brand Relationship Value Goodwill
3.89 3.804.27
4.034.24 4.24
3.96 3.90
1
2
3
4
5
Regular Riders Infrequent Riders
Brand Perception Brand Relationship Value Goodwill
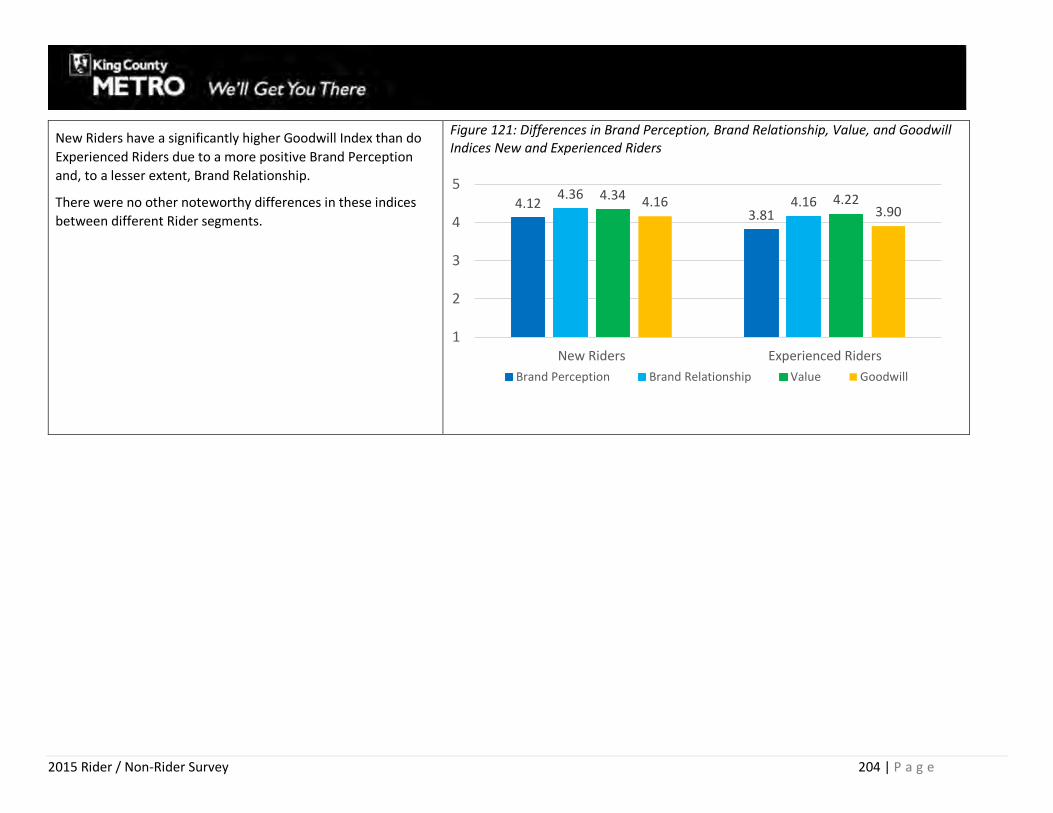
2015 Rider / Non-Rider Survey 204 | P a g e
New Riders have a significantly higher Goodwill Index than do
Experienced Riders due to a more positive Brand Perception
and, to a lesser extent, Brand Relationship.
There were no other noteworthy differences in these indices
between different Rider segments.
Figure 121: Differences in Brand Perception, Brand Relationship, Value, and Goodwill Indices New and Experienced Riders
4.123.81
4.364.164.34 4.224.16
3.90
1
2
3
4
5
New Riders Experienced Riders
Brand Perception Brand Relationship Value Goodwill

2015 Rider / Non-Rider Survey 205 | P a g e
Among Non-Riders, Goodwill decreases as the length of time
since they last rode Metro increases.
Non-Riders with relatively recent experience with Metro
(within the past year) have a Goodwill Index that is somewhat
higher than among current Riders—4.06 compared to 3.94,
respectively. These Non-Riders’ index is between the index
noted in Figure 121 for New versus Experienced Riders. The
lower index for these recent Non-Riders compared to new
Riders is due to a significantly lower Brand Perception Index.
Figure 122: Differences in Brand Perception, Brand Relationship, Value, and Goodwill Indices Non-Riders
3.84
3.483.33
4.25
3.793.64
4.29
3.873.69
4.06
3.673.48
1
2
3
4
5
Ridden in Past Year Ridden Past 1 - 4 Years Never Ridden / No RecentExperience
Brand Perception Brand Relationship Value Goodwill

2015 Rider / Non-Rider Survey 206 | P a g e
FINDINGS: OTHER TOPICS Two other topics were included in the survey: additional details regarding personal safety (Riders’ concerns regarding safety and their perceptions of Metro’s
efforts to improve safety) and impact of the 2015 service changes.
Personal Safety
Summary
Topic What We Found What It Means
Concerns
about Safety
While the majority of Riders do not avoid
riding due to concerns about safety, the
percentage who do increased in 2015.
2013 2014 2015
Avoid Riding Due to Concerns about Safety
22% 20%▼ 27%▲ Significant increase (▲) or (▼) from baseline (2012)
Given the high importance of safety, it is
important to focus on those areas of most
concern to Riders who avoid riding.
Particular focus should be safety onboard
the vehicle due to the conduct of others
after dark, as well as safety while waiting
after dark.
Attitudes
toward
Metro’s
Efforts to
Improve
Safety
Consistent with the increase in concerns
about safety noted above, the percentage
of Riders who strongly agree that Metro
provides a safe and secure transportation
environment decreased. Total agreement
with this statement has not changed.
At the same time, one out of three
respondents strongly agree that Metro is
proactive in its efforts to improve safety,
the same as in 2014. Moreover, the
percentage who agree has increased
significantly since 2013.
% Strongly Agree
2013 2014 2015
Provides a Safe and Secure Environment
35% 49%▲ 43%▼
Is Proactive in Efforts to Improve Safety
26% 33%▲ 34%
% Agree
2013 2014 2015
Provides a Safe and Secure Environment
89% 90%▲ 90%
Is Proactive in Efforts to Improve Safety
67% 70%▲ 76%▲

2015 Rider / Non-Rider Survey 207 | P a g e
Concerns about Safety
While the majority of Riders do not avoid
riding due to concerns about safety, the
percentage of Riders who do say they avoid
riding due to concerns about safety increased
significantly in 2015 and is at the highest
ever.
Figure 123: Extent to Which Riders Avoid Riding Due to Concerns about Safety
Questions: PS3A Do you avoid riding the bus or streetcar due to concerns about your personal safety?
Base: Regular and Infrequent Riders
2013 2014 2015 n 1,395 1,102 1.025
nw 1,395 1,161 1,025
▲ / ▼ indicates a statistically significant change from previous year

2015 Rider / Non-Rider Survey 208 | P a g e
Infrequent Riders are more likely than
Regular Riders to suggest that their concerns
about safety cause them to avoid riding.
Moderate Regular Riders are somewhat more
likely than Frequent Regular Riders to avoid
riding due to safety concerns.
Figure 124: Extent to Which Riders Avoid Riding Due to Concerns about Safety by Rider Status

2015 Rider / Non-Rider Survey 209 | P a g e
Regression analysis was used to determine
which elements of personal safety had the
greatest influence on Riders’ who say they
avoid riding Metro due to concerns about
safety.
Satisfaction with safety after dark, notably
onboard the vehicle as well as waiting, have
the greatest influence on the extent to which
Riders avoid riding Metro due to concerns
about safety.
Figure 125: Factors Influencing the Extent to Which Riders Avoid Riding Metro Due to Concerns about Safety
Onboard Daytime13%
Onboard After Dark42%
Waiting Daytime10%
Waiting After Dark35%
Elements of Safety that Impact Riders' Use of Metro

2015 Rider / Non-Rider Survey 210 | P a g e
Attitudes towards Metro’s Efforts to Improve Safety
Riders generally agree that Metro provides a safe and secure
transportation environment. However, the strength of that agreement
decreased in 2015 after increasing in 2014.
Regular Riders are more likely than Infrequent Riders to strongly
agree that Metro provides a safe and secure transportation
environment—48% compared to 33%, respectively.
Riders are increasingly likely to agree that Metro has been proactive in
improving safety and security—70% in 2014 increasing to 76% in 2015.

2015 Rider / Non-Rider Survey 211 | P a g e
Figure 126: Agreement that Metro Provides a Safe and Secure Environment
Figure 127: Agreement that Metro is Proactive about Safety Improvements
Questions: PS5 As I read each of the following statements please tell me if you agree or disagree with. . . ? (FOLLOW-UP) Would that be strongly or somewhat (agree/disagree)?
Base: Regular and Infrequent Riders
2013 2014 2015 n 1,395 1,161 1,025
nw 1,395 1,161 1,025

2015 Rider / Non-Rider Survey 212 | P a g e
Awareness and Impact of 2015 Service Changes
Topic What We Found What It Means
Awareness
and Impact
of Service
Changes
Nearly two out of three Riders were
aware of service changes made in 2015.
Far fewer (21%) said they were impacted
by these changes. More than twice as
many Riders living in the City of Seattle
said they were impacted compared with
those living throughout the rest of the
county—27% compared to 13%,
respectively. (As the majority of service
changes were made in Seattle, it is likely
that many riders both in and outside of
Seattle were thinking of the 2014 service
reductions, not the changes in 2015.)
Satisfaction with the service changes was
decidedly mixed. Seattle Riders who were
dissatisfied were most concerned about
their new bus stop location (moved or
removed), general inconvenience, and less
frequent service. Frequency of service was
the greatest concern for all other Riders
who were dissatisfied.
% of Riders
Countywide
Aware of Service Change(s) 64%
Impacted by Service
Change(s) 21%
Satisfied with Service
Change(s) 42%
Dissatisfied with Service
Change(s) 48%
% of Riders
Seattle
Aware of Service Change(s) 70%
Impacted by Service
Change(s) 27%
Satisfied with Service
Change(s) 47%
Dissatisfied with Service
Change(s) 44%
The majority of Riders were aware of the
service changes, either due to being
directly impacted or through some type of
communications.
Keeping Riders informed about upcoming
service changes is an important
component of customer satisfaction and
the high level of awareness indicates that
Metro was effective in communicating
these changes.

2015 Rider / Non-Rider Survey 213 | P a g e
Awareness of June / September 2015 Service Changes
Nearly two out of three Riders were aware of
recent services changes (made in June and
September 2015).
Residents of the City of Seattle,
where the majority of service
changes occurred, were much more
likely than those in the balance of
King County to be aware of these
service changes.
Figure 128: Awareness of June / September 2015 Service Changes
Question: SC1 In June and September 2015, Metro added or changed service on approximately 50 routes. Are you aware of these changes?
Don’t know responses excluded from analysis / base.
n nw
Base: All Regular and Infrequent Riders 1,016 1,015
Seattle 458 625
Other King County 558 393
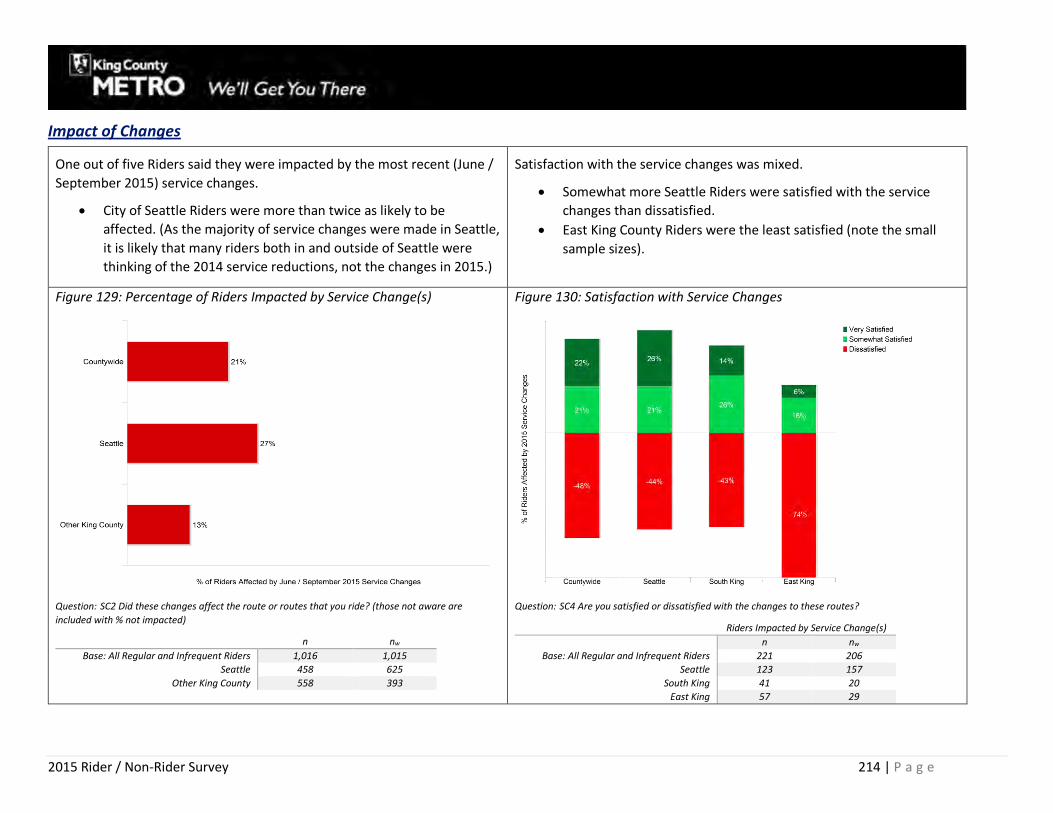
2015 Rider / Non-Rider Survey 214 | P a g e
Impact of Changes
One out of five Riders said they were impacted by the most recent (June /
September 2015) service changes.
City of Seattle Riders were more than twice as likely to be
affected. (As the majority of service changes were made in Seattle,
it is likely that many riders both in and outside of Seattle were
thinking of the 2014 service reductions, not the changes in 2015.)
Satisfaction with the service changes was mixed.
Somewhat more Seattle Riders were satisfied with the service
changes than dissatisfied.
East King County Riders were the least satisfied (note the small
sample sizes).
Figure 129: Percentage of Riders Impacted by Service Change(s)
Question: SC2 Did these changes affect the route or routes that you ride? (those not aware are
included with % not impacted)
n nw
Base: All Regular and Infrequent Riders 1,016 1,015
Seattle 458 625
Other King County 558 393
Figure 130: Satisfaction with Service Changes
Question: SC4 Are you satisfied or dissatisfied with the changes to these routes?
Riders Impacted by Service Change(s)
n nw
Base: All Regular and Infrequent Riders 221 206
Seattle 123 157
South King 41 20
East King 57 29

2015 Rider / Non-Rider Survey 215 | P a g e
Frequency of service was the greatest concern for Riders outside Seattle who were dissatisfied.
Seattle Riders who were dissatisfied were most concerned about their new bus stop location (moved or removed), general inconvenience, and
less frequent service.
Table 32: Reasons for Dissatisfaction with Service Changes
Question: SC4_NEW Why are you dissatisfied with the changes to these routes?

2015 Rider / Non-Rider Survey 216 | P a g e
2015 Rider / Non-Rider Survey
NWRG Project Number KCM_5602958_05_2015_Rider Non-Rider Survey
INSTRUMENT CONVENTIONS:
DENOTES PROGRAMMING INSTRUCTIONS
Text in ALLCAPS is not read to respondents
Red Text in [ALLCAPS SURROUNDED BY BRACKETS] are programming instructions, not read to respondents (note that you should not display red text within the web program)
ME = Mutually Exclusive
NE = Not Equal to
GE = Greater than or Equal to
LT = Less than
LE = Less than or Equal to
Text in (ALLCAPS SURROUNDED BY PARENTHESES BOLD TYPE) are interviewer instructions, not read to respondents
Question marks (?) and ‘X’ or ‘x’ indicate information needed or to be determined in conjunction with the client
INTRODUCTION
INT1 Hello, this is _________ from Bernett Research calling on behalf of King County Metro Transit. We are conducting a county-wide planning study for King County Metro. The study provides important information about Riders and Non-Riders and how they travel and helps Metro improve the region’s transportation system.
This study is being conducted for research purposes only and everything you say will be kept strictly confidential. This call may be monitored or recorded for quality control purposes.
[AS NEEDED: This survey will last approximately 15 to 20 minutes.]
ASKIF CELL PHONE SAMPLE TYPE
INT2 Are you currently driving a car or doing any activity requiring your full attention? IF NO: When is a more convenient time to call you back?
INT3 For this survey I would like to speak with a member of this household who is 16 years of age or older and has ridden a King County Metro bus, 5 or more times in

2015 Rider / Non-Rider Survey 217 | P a g e
the last 30 days. Would that be you or someone else in your household? [ASK TO SPEAK TO REGULAR RIDER]
IF NO REGULAR RIDER, THEN SAY: Is there someone in your household that has ridden a King County Metro bus at least once in the last 30 days? [ASK TO SPEAK TO INFREQUENT RIDER]
IF NO REGULAR OR INFREQUENT RIDER, THEN SAY: CONTINUE TO SCREENER?
01 RIDER AVAILABLE/ SAFE TO TALK --CONTINUE 02 RIDER NOT AVAILABLE / NOT SAFE TO TALK -- SCHEDULE CALL-BACK 03 SPANISH SPEAKING HH 04 OTHER LANGUAGE SPEAKING HH – THANK AND TERMINATE 05 IMMEDIATE/SOFT REFUSAL – SCHEDULE CALLBACK TO REFUSAL CONVERT OR OFFER ONLINE ALTERNATIVE
SCREENING QUESTIONS
BASE: ALL RESPONDENTS
S1 To confirm, are you 16 years of age or older?
01 YES 02 NO 98 DON’T KNOW 99 REFUSED
IF S1 = 01 SKIP TO S2A IF S1 = 02, AND SAMPLETYPE=01, 02, 04, 05, 06, CONTINUE TO S1A. IF SAMPLETYPE=03, THANK AND CONCLUDE - S1: NQ-UNDER 16 (THANK3 TEXT) IF S1 = 98, 99 THANK AND CONCLUDE [S1: SCREENER REFUSAL (THANK5 TEXT)]

2015 Rider / Non-Rider Survey 218 | P a g e
DO NOT SHOW S1A IF SAMPLETYPE=03 (CELL PHONE)
S1A May I please speak with an individual in your household, 16 years of age or older?
01 NEW RESPONDENT AVAILABLE / WILLING TO PARTICIPATE (REREAD INTRO FROM FLYSHEET) [GO BACK TO S1] 02 NEW RESPONDENT NOT AVAILABLE (FOLLOW-INSTRUCTIONS ON NEXT SCREEN) [GO TO “STOP SCREEN” (FROM BOTTOM OF QUESTIONNAIRE) AND
COUNT AS A SCREENER INCOMPLETE] [SURVEY SHOULD RETURN TO S1] 03 NEW RESPONDENT UNWILLING TO PARTICIPATE [THANK AND CONCLUDE - S1: NQ-UNDER 16 (THANK3 TEXT)]
S2A Are you a resident of King County?
01 YES 02 NO 98 DON’T KNOW 99 REFUSED
IF S2A = 01, CONTINUE IF S2A = 02, THANK AND CONCLUDE [S2A: NQ-NON-RESIDENT (THANK2 TEXT)] IF S2A = 98, 99 THANK AND CONCLUDE [SCREENER REFUSAL: S2A (THANK5 TEXT)]
S2C What is your home zip code?
______ ENTER CORRECT ZIP CODE [RANGE 98001 – 98354] 99998 DON’T KNOW 99999 REFUSED
IF S2C EQ 99998 OR 99999, THANK AND CONCLUDE [S2C: SCREENER REFUSAL (THANK5 TEXT)] IF ZIP CODE NOT IN SAMPLE LIST THANK AND CONCLUDE [OUT OF AREA (THANK2 TEXT)]
PROGRAMMER: CREATE VARIABLE = ZONE USING ZIP CODE TABLE DOCUMENT
ASK S2D IF S2C = 98133, 98160, 98177, 98106, 98108, 98126, 98146, 98178
S2D Do you live within the Seattle City limits?
01 YES 02 NO 98 DON’T KNOW 99 REFUSED

2015 Rider / Non-Rider Survey 219 | P a g e
S3A Including yourself, how many people live in your household?
(ENTER RANGE BETWEEN 1 AND 8; IF MORE THAN 8 PEOPLE IN HOUSEHOLD ENTER 8)
_____ ENTER NUMBER OF PERSONS IN HOUSEHOLD [RANGE 1 – 8] 98 DON’T KNOW 99 REFUSED
IF S3A > 01 AND < 98 CONTINUE IF S3A EQ 01 SKIP TO S5A IF S3A = 98, 99 THANK AND CONCLUDE [S3: SCREENER REFUSAL (THANK5 TEXT)]
S3B Including yourself, how many people live in your household who are 16 years of age or older? (ENTER RANGE BETWEEN 1 AND 8; IF MORE THAN 8 PEOPLE IN HOUSEHOLD ENTER 8)
_____ ENTER NUMBER OF PERSONS 16+ IN HOUSEHOLD [RANGE 1 – 8 / NUMBER SHOULD BE <= S3A] 98 DON’T KNOW 99 REFUSED
IF S3B > 01 AND < 98 CONTINUE IF S3B EQ 01 SKIP TO S5A
ASK S4B IF S3B > 1 AND < 98
S4B Including yourself, how many people in your household, 16 years of age or older, have taken at least five (5) one-way rides on a Metro bus in the last 30 days? (AS NEEDED: A round trip counts as two (2) rides. A trip where you had to transfer counts as one ride.)
_____ ENTER NUMBER OF REGULAR RIDERS IN HOUSEHOLD [RANGE 0 TO RESPONSE S3] 98 DON’T KNOW 99 REFUSED
ASK S4A IF S4B < S3B
S4A Including yourself, how many people in your household, 16 years of age or older, have taken between one (1) and four (4) one-way rides on a Metro Bus in the last 30 days? [IF S4B GE 1 AND LT98 SHOW] In addition to the riders in your household who have taken 5 or more rides, Including yourself, how many people in your household, 16 years of age or older, have taken between one (1) and four (4) one-way rides on a Metro Bus in the last 30 days?
(AS NEEDED: A round trip counts as two rides. A trip where you had to transfer counts as one ride.)
___ ENTER NUMBER OF INFREQUENT RIDERS IN HOUSEHOLD [RANGE 0 TO RESPONSE S3-S4B]

2015 Rider / Non-Rider Survey 220 | P a g e
98 DON’T KNOW 99 REFUSED
ASK S5A IF (S3A=1) OR (S3B = 1) OR (S4A > 0 AND S4A < 98) OR (S4B > 0 AND S4B < 98))
S5A Thinking about the last 30 days, how many one-way rides have you taken on a Metro bus? (AS NEEDED: A round trip counts as two (2) one-way rides. A trip where you had to transfer counts as one ride.)
(IF MORE THAN 90, ENTER AS 90) [IF RESPONDENT IS A RIDER BUT CONFUSED BY WHAT IS A ONE-WAY RIDE SELECT DON’T KNOW]
___ ENTER TOTAL NUMBER OF METRO BUS RIDES [RANGE: 0-90] 98 DON’T KNOW 99 REFUSED
ASK S5B IF S5A = 98, 99
S5B Would that be more than four (4) rides on a Metro bus?
01 YES, 5 OR MORE RIDES 02 NO, 1 TO 4 RIDES 03 NO, 0 RIDES / NEVER RIDE 98 DON’T KNOW 99 REFUSED
IF S5A AND S5B, EQ 98 OR 99, THANK AND CONCLUDE [RIDERMODE REFUSED (THANK5)]
TO DETERMINE INDIVIDUAL RIDER STATUS:
COMPUTE NUMRIDES = S5A
CREATE VARIABLE = RIDESTAT
01 REGULAR RIDER – (NUMRIDES>=5 OR (S5B=1)
02 INFREQUENT RIDER - (NUMRIDES=1 THRU 4) OR (S5B=2)
03 NON-RIDER – [(NUMRIDES=0) OR ((S4A=0) AND (S4B=0)) OR (S5B=3)]
PROGRAMMER: IF CANNOT DETERMINE INDIVIDUAL RIDER STATUS, THANK AND CONCLUDE [RIDESTAT UNDETERMINED (THANK99 TEXT)]
2015 Rider / Non-Rider Survey 221 | P a g e
PROGRAMMER: CREATE VARIABLE = HHRIDESTAT
01 REGULAR RIDER HOUSEHOLD:
IF [(RIDESTAT=01) OR (S4B>=1)]
02 INFREQUENT RIDER HOUSEHOLD:
IF ((RIDESTAT=02) AND (S4B=0)) OR
[((RIDESTAT=03)) AND ((S4B=0) AND (S4A >=1)] OR
[(S3=1) AND (RIDESTAT=2)]
03 NONRIDER HOUSEHOLD:
((RIDESTAT=03)) AND ((S4B=0) AND (S4A=0))] OR
[S3A=1 AND (RIDESTAT=03))]
IF RIDESTAT = 01 CONTINUE WITH CURRENT RESPONDENT (SKIP TO S7) IF HHRIDESTAT = 01 AND RIDESTAT NE 01 ASK SEL2
SEL2 To obtain a representative sample of all riders in the area, may I please speak with an individual in your household, 16 years of age or older, who has ridden a Metro bus 5 or more times in the past 30 days?
01 REGULAR RIDER AVAILABLE / WILLING TO PARTICIPATE (REREAD INTRO FROM FLYSHEET) [THE CLIENT WANTS THE SURVEY TO REDIRECT TO S5A (SO THAT WE REASK S5A/S5B AND S6A/S6B TO RECLASSIFY RESPONDENTS AS NECESSARY) – IS IT POSSIBLE FOR YOU TO SKIP BACK TO S5A AND FORCE THE QUESTIONS TO BE ANSWERED AGAIN (ONLY) FOR THESE RESPONDENTS/THIS SCENARIO (SEL2 AND SEL3)?]
02 REGULAR RIDER NOT AVAILABLE (FOLLOW-INSTRUCTIONS ON NEXT SCREEN) [GO TO “STOP SCREEN” (FROM BOTTOM OF QUESTIONNAIRE) AND COUNT AS A SCREENER INCOMPLETE] [SURVEY SHOULD RETURN TO S5A - AS WITH SEL2=1, IS THERE ANYWAY TO MAKE THESE SPECIFIC RESPONDENTS START BACK UP AT (AN UNANSWERED/UNPOPULATED) S5A UPON REENTRY?)]
03 REGULAR RIDER UNWILLING TO PARTICIPATE (CONTINUE WITH RESPONDENT ON THE PHONE) [SKIP TO S7 LOGIC]
IF HHRIDESTAT = 02 AND RIDESTAT = 02 CONTINUE WITH CURRENT RESPONDENT IF HHRIDESTAT = 02 AND RIDESTAT NE 02 ASK SEL3
SEL3 To obtain a representative sample of all riders in the area, may I please speak with an individual in your household, 16 years of age or older, who has ridden a

2015 Rider / Non-Rider Survey 222 | P a g e
Metro bus 1 to 4 times in the past 30 days?
01 INFREQUENT RIDER AVAILABLE / WILLING TO PARTICIPATE (REREAD INTRO FROM FLYSHEET) [GO BACK TO S5A (LIKE SEL2=01)] 02 INFREQUENT RIDER NOT AVAILABLE (FOLLOW-INSTRUCTIONS ON NEXT SCREEN) [GO TO “STOP SCREEN” (FROM BOTTOM OF QUESTIONNAIRE) AND
COUNT AS A SCREENER INCOMPLETE] [GO BACK TO S5A (LIKE SEL2=01)] 03 INFREQUENT RIDER UNWILLING TO PARTICIPATE (CONTINUE WITH RESPONDENT ON THE PHONE) [CONTINUE TO S7]
ASK S7 IF RIDESTAT = 01 OR 02
S7 What Metro bus routes do you take? (ENTER ALL THAT APPLY)
(IF GIVEN “NAME” OF ROUTE, ASK FOR THE ROUTE NUMBER. IF THEY DON’T KNOW THE ROUTE NUMBER, TYPE NAME INTO OTHER SPECIFY)
(IF SAY RAPID RIDE PROBE FOR LINE A, B, C, OR D)
(IF RESPONDENT GIVES A ROUTE NUMBER FOLLOWED BY “EXPRESS”, JUST ENTER THE ROUTE NUMBER – DON’T WORRY ABOUT CAPTURING “EXPRESS”)
____ ENTER ROUTE NUMBER [ALLOW 1 TO 4 DIGITS] ____ ENTER ROUTE NUMBER [ALLOW 1 TO 4 DIGITS] ____ ENTER ROUTE NUMBER [ALLOW 1 TO 4 DIGITS] ____ ENTER ROUTE NUMBER [ALLOW 1 TO 4 DIGITS] (ROUTE HELP LIST) 1001 RAPID RIDE LINE A (FEDERAL WAY TO SEATAC ALONG PACIFIC AVENUE SOUTH AND INTERNATIONAL BLVD) 1002 RAPID RIDE LINE B (BELLEVUE TRANSIT CENTER AND DOWNTOWN REDMOND TRANSIT CENTER VIA CROSSROADS AND OVERLAKE) 1003 RAPID RIDE LINE C (DOWNTOWN SEATTLE AND WEST SEATTLE) 1004 RAPID RIDE LINE D (DOWNTOWN SEATTLE AND BALLARD / CROWN HILL) 1005 RAPID RIDE LINE E (DOWNTOWN SEATTLE AND AURORA VILLAGE TRANSIT CENTER / OPERATES ALONG AURORA AVENUE) 1006 RAPID RIDE LINE F (BURIEN TO RENTON) 1008 DART (600 TO 900 ROUTE NUMBERS) 2005 LINK LIGHT RAIL 2006 SOUNDER 2007 KING COUNTY WATER TAXI 2008 SEATTLE STREETCAR / SOUTH LAKE UNION STREETCAR / STREETCAR / ROUTE 98 9995 OTHER (SPECIFY: ONLY ENTER UNLISTED NON-NUMERIC RESPONSE) 9998 DON'T KNOW 9999 REFUSED
CONTNUE IF (S7 < 500) OR (S7 > 599) OR (S7 = 1001, 1002, 1003, 1004, 1005, 1006, 1007, 1008, 9995)

2015 Rider / Non-Rider Survey 223 | P a g e
IF S7 ONLY EQUALS ROUTE NUMBER BEGINNING WITH 500 OR IF S7 ONLY EQUALS 2005, 2006, 2007, 2008 CHANGE RIDESTAT TO 03 (NON-RIDER)
ASK S7_1 IF MORE THAN ONE METRO ROUTE GIVEN IN S7 (METRO ROUTE INCLUDES ANY ROUTE NUMBER BELOW 500, ANY ROUTE NUMBER GREATER THAN 599, AND THE FOLLOWING LISTED ROUTES: 1001, 1002, 1003, 1004, 1005, 1006, 1007, 1008 / THIS WOULD NOT INCLUDE ANY ROUTE NUMBERS BETWEEN 500-599, AND THE FOLLOWING LISTED ROUTES: 2005, 2006, 2007, 2008)
S7_1 Which Metro bus route do you ride for the trip you take most often?
(AS NEEDED: The one you use most often.)
CAN WE MAKE THIS SO THAT ONLY ROUTES ENTERED/SELECTED IN S7 ARE SHOWN AS POSSIBLE RESPONSE OPTIONS?
____ ENTER ROUTE NUMBER [ALLOW 1 TO 4 DIGITS] ____ ENTER ROUTE NUMBER [ALLOW 1 TO 4 DIGITS] ____ ENTER ROUTE NUMBER [ALLOW 1 TO 4 DIGITS] ____ ENTER ROUTE NUMBER [ALLOW 1 TO 4 DIGITS] (ROUTE HELP LIST) 1001 RAPID RIDE LINE A (FEDERAL WAY TO SEATAC ALONG PACIFIC AVENUE SOUTH AND INTERNATIONAL BLVD) 1002 RAPID RIDE LINE B (BELLEVUE TRANSIT CENTER AND DOWNTOWN REDMOND TRANSIT CENTER VIA CROSSROADS AND OVERLAKE) 1003 RAPID RIDE LINE C (DOWNTOWN SEATTLE AND WEST SEATTLE) 1004 RAPID RIDE LINE D (DOWNTOWN SEATTLE AND BALLARD / CROWN HILL) 1005 RAPID RIDE LINE E (DOWNTOWN SEATTLE AND AURORA VILLAGE TRANSIT CENTER / OPERATES ALONG AURORA AVENUE) 1006 RAPID RIDE LINE F (BURIEN TO RENTON) 1008 DART (600 TO 900 ROUTE NUMBERS) 9995 OTHER (SPECIFY: ONLY ENTER UNLISTED NON-NUMERIC RESPONSE) 9998 DON'T KNOW 9999 REFUSED
QUOTA EVALUATION 1
01 Overall Completes (SET TARGET TO 2400)
QUOTA EVALUATION 2
(CREATE VARIABLE = RIDEAREA_COMBO FOR QUOTA),
01 Seattle / North King County REGULAR RIDER [RIDESTAT=1 AND ZONE=1] (SET TARGET TO 600)

2015 Rider / Non-Rider Survey 224 | P a g e
02 South King County REGULAR RIDER [RIDESTAT=1 AND ZONE=2] (SET TARGET TO 300)
03 East King County REGULAR RIDER [RIDESTAT=1 AND ZONE=3] (SET TARGET TO 300)
04 Seattle / North King County INFREQUENT RIDER OR NON-RIDER [RIDESTAT=2 OR 3 AND ZONE=1] (SET TARGET TO 200)
05 South King County INFREQUENT RIDER OR NON-RIDER [RIDESTAT=2 OR 3AND ZONE=2] (SET TARGET TO 500)
06 East King County INFREQUENT RIDER OR NON-RIDER [RIDESTAT=2 OR 3 AND ZONE=3] (SET TARGET TO 500)
GENERAL RIDERSHIP
BASE: CURRENT REGULAR AND INFREQUENT RIDERS (RIDESTAT = 01, 02)
CREATE VARIABLE GROUP. RANDOMLY ASSIGN HALF OF THE PARTICIPANTS TO GROUP=1 AND HALF TO GROUP=2
M1 How long have you been riding Metro? (READ LIST IF NECESSARY)
01 LESS THAN 3 MONTHS 02 3 TO 6 MONTHS 03 6 MONTHS TO 9 MONTHS 04 9 MONTHS TO 1 YEAR 05 1 TO 2 YEARS 06 3 TO 5 YEARS 07 5 YEARS OR MORE 98 (NEVER READ) DON’T KNOW 99 (NEVER READ) REFUSED
IF M1 LE 03 (6 TO 9 MONTHS) SKIP M1A AND AUTOCODE M1A = 01
IF M1=06 OR 07 SKIP M1A AND AUTOCODE M1A = 02

2015 Rider / Non-Rider Survey 225 | P a g e
IF M1=04, 05, 98, OR 99 ASK M1A
M1A Did you start riding Metro after September of 2014?
01 YES 02 NO 98 DON’T KNOW 99 REFUSED
M5A When you ride a Metro bus, what is the primary purpose of the trip or trips you take most often? [SELECT ALL THAT APPLY] (READ IF RESPONDENT SAYS APPOINTMENTS: Would that be business appointments, medical appointments, or something else?) (READ IF RESPONDENT SAYS TO GET/GO DOWNTOWN: What is the purpose of the trip you take to downtown? OR What do you do downtown? [MULTIPLE SELECT]
01 TO/FROM WORK 02 TO/FROM SCHOOL 03 TO/FROM VOLUNTEERING 04 SHOPPING / ERRANDS 05 BUSINESS APPOINTMENTS 06 MEDICAL APPOINTMENTS 07 APPOINTMENTS OTHER (SPECIFY) 08 FUN / RECREATION / SOCIAL 09 SPECIAL EVENTS (SEAFAIR, BUMBERSHOOT SHUTTLES) 10 JURY DUTY 11 GO DOWNTOWN SEATTLE (CLARIFY BEFORE USING THIS OPTION) 12 GET TO AIRPORT 95 OTHER (SPECIFY) 96 USE FOR ALL TRIPS 97 NO SINGLE PRIMARY PURPOSE 98 DON’T KNOW 99 REFUSED 999 REFUSED
ASK M5C IF M5A HAS MULTIPLE RESPONSES
M5C ONLY SHOW RESPONSE OPTIONS SELECTED IN M5A
M5C You indicated that you use Metro to get to [RESTORE RESPONSES TO M5A]. What is the trip you take most often? 01 TO/FROM WORK 02 TO/FROM SCHOOL

2015 Rider / Non-Rider Survey 226 | P a g e
03 TO/FROM VOLUNTEERING 04 SHOPPING / ERRANDS 05 BUSINESS APPOINTMENTS 06 MEDICAL APPOINTMENTS 07 APPOINTMENTS OTHER (SPECIFY) 08 FUN / RECREATION / SOCIAL 09 SPECIAL EVENTS (SEAFAIR, BUMBERSHOOT SHUTTLES) 10 JURY DUTY 11 GO DOWNTOWN (CLARIFY BEFORE USING THIS OPTION) 12 GET TO AIRPORT 95 OTHER (SPECIFY) 96 USE FOR ALL TRIPS/NO SINGLE PRIMARY PURPOSE [MUTUALLY EXCLUSIVE] 98 DON’T KNOW [MUTUALLY EXCLUSIVE] 99 REFUSED [MUTUALLY EXCLUSIVE]
ASK M5B IF (RIDESTAT = 01 OR 02) AND (M5C<=95)
M5B You indicated that you took [RESTORE NUMRIDES. IF NUMRIDES=0 OR 98/99 THEN PULL IN RESPONSE TEXT AS FOLLOWS: IF S5B=1 “5 OR MORE RIDES” IF S5B=2 “BETWEEN 1 AND 4 RIDES”] one-way trips on Metro in the past 30 days. What percentage of these trips were for [RESTORE RESPONSE TO M5C /IF M5C=7/95, RESTORE OS RESPONSE]?
____ RECORD PERCENTAGE [RANGE 0 TO 100%] 998 DON’T KNOW
DS1A How do you usually get from home to the bus stop you use most often?
01 DRIVE TO PARK-AND-RIDE / DRIVE AND PARK 02 RIDE WITH SOMEONE ELSE / CARPOOL 03 GET DROPPED OFF 04 WALK 05 BICYCLE 06 BUS 95 OTHER (SPECIFY) 98 DON’T KNOW 99 REFUSED
ASK DS1B IF DS1A = 04 OR 05
DS1B Approximately how far is it from your home to the Metro bus stop you use most often? (ENTER NUMBER AND THEN SPECIFY WHETHER RESPONDENTS SAYS NUMBER OF BLOCKS OR NUMBER OF MILES, ALLOW DECIMAL RESPONSES)
___ ENTER NUMBER [ALLOW DECIMALS] [RANGE: 1-90.99]

2015 Rider / Non-Rider Survey 227 | P a g e
03 BLOCKS 04 MILES 93 LESS THAN ONE BLOCK 94 LESS THAN ONE MILE 98 DON’T KNOW 99 REFUSED
M4 Now, thinking about all of your travel around King County, to what extent do you use a Metro bus to get around? Do you use a Metro bus for…
04 All of your transportation needs 03 Most of your transportation needs 02 Some of your transportation needs 01 Very little of your transportation needs 98 DON’T KNOW 99 REFUSED
PT1A What method of transportation do you usually use to get around for most of your personal travel? (AS NEEDED: By “personal travel” we mean non-work travel.) (IF DRIVE, ASK: Would that be alone, or with at least 2 people in the car (CODE AS CARPOOL)) (IF BUS, ASK: Is that a Metro Bus, a Sound Transit Bus, or some other system?) (IF VARIES, ASK: What do you usually do? (OR) What is your most common mode?) (READ LIST ONLY IF NECESSARY) [ENTER ALL THAT APPLY)
01 DRIVE ALONE 02 CARPOOL 03 VANPOOL 04 RIDE A METRO BUS 05 RIDE THE SOUTH LAKE UNION STREETCAR 06 RIDE THE SOUNDER TRAIN 07 RIDE LINK LIGHT RAIL 08 RIDE A SOUND TRANSIT BUS 09 SCHOOL BUS 10 RIDE ANOTHER SYSTEM’S BUS (SPECIFY) 11 MOTORCYCLE 12 BICYCLE 13 WALK 15 DRIVE TO PARK & RIDE LOT 16 KING COUNTY WATER TAXI 17 IT VARIES

2015 Rider / Non-Rider Survey 228 | P a g e
18 TAXI / UBER / LYFT 19 SENIOR SERVICES / PARATRANSIT 95 OTHER (SPECIFY) 98 (NEVER READ) DON’T KNOW 99 (NEVER READ) REFUSED
M6 During which of the following time periods do you currently ride the bus? Do you ride … (READ LIST AND GET A YES OR NO AFTER EACH) (IF RESPONDENT SAYS “SOMETIMES” CODE AS YES/SOMETIMES)
M6#1 Weekdays before 6:00 a.m.
M6#2 Weekdays between 6:00 a.m. and 9:00 a.m.
M6#3 Weekdays between 9:00 a.m. and 3:00 p.m.?
M6#4 Weekdays between 3:00 p.m. and 6:00 p.m.
M6#5 Weekdays between 6:00 p.m. and 7:00 p.m.
M6#6 Evenings between 7:00 and 10:00 p.m.
M6#7 Evenings after 10:00p.m.
M6#8 Any time on Saturday?
M6#9 Any time on Sunday?
01 YES/SOMETIMES 00 NO 98 DON’T KNOW 99 REFUSED
SATINT Next, I am going to ask you about your satisfaction with different aspects of Metro service.
[DISPLAY FOR THE TOP OF EACH RATING SCREEN IN THIS SECTION (AFTER SATINT)] Are you satisfied or dissatisfied with (READ ATTRIBUTE)? (FOLLOW-UP) Would that be very or somewhat (SATISFIED/DISSATISFIED)?
05 VERY SATISFIED 04 SOMEWHAT SATISFIED 02 SOMEWHAT DISSATISFIED 01 VERY DISSATISFIED 03 NEITHER SATISFIED NOR DISSATISFIED / NO OPINION 97 DOES NOT APPLY TO ME 98 DON’T KNOW 99 REFUSED

2015 Rider / Non-Rider Survey 229 | P a g e
LEVEL OF SERVICE
RANDOMIZE M7A, M7C and M7E
M7B Frequency of service
ASK M7B_1 THROUGH M7B_4 IF M7B <= 04
M7B_1 Frequency of service during rush hours
M7B_2 Frequency of service during daytime, non-rush hours
M7B_3 Frequency of evening service between 7:00 and 10:00 pm
M7B_5 Frequency of nighttime service after 10:00 p.m.
M7B_4 Frequency of weekend service
M7A On-time performance
M7C Availability of service where you need to travel
M7E Amount of time it takes to travel
COMFORT / CLEANLINESS BUS INTERIOR
ASK M7G, M7H, M7I AND M7J IF GROUP=1
M7G Inside cleanliness of buses
M7H Availability of seating on the bus
M7I Overcrowding on the bus
M7J Ease of getting on and off due to crowding on the bus
COMFORT / CLEANLINESS BUS STOPS
ASK M7F, M7Q, M7R, M7T, MU AND M7W IF GROUP=1
M7F Cleanliness of shelters and stops
M7Q Availability of seating at shelters and stops
M7T Availability of shelters at bus stops

2015 Rider / Non-Rider Survey 230 | P a g e
M7TT Protection from the weather when waiting
MU Distance from home to bus stop
M7W Ease of getting on and off the bus due to crowding at the bus stops
DRIVERS
ASK M7L, M7M AND M70 IF GROUP=2
M7L Driver helpfulness with route and stop information
M7M Drivers operate the bus in a safe and competent manner
M7O Drivers effectively handle problems on the bus
M7K Driver courtesy
M700 Drivers start and stop the bus smoothly
TRANSFERRING
BASE: CURRENT REGULAR AND INFREQUENT RIDERS (RIDESTAT = 01, 02)
TRIP_5A How many transfers do you make on the trip you take most often?
(AS NEEDED: One-way trip only. Do not include transfers for round trips.) (ENTER 4 IF 4 OR MORE. USE DECIMALS AS NEEDED FOR FRACTIONAL RESPONSES.)
___ ENTER NUMBER OF TRANSFERS [RANGE 0.00 – 4.00] 08 VARIES DEPENDING ON THE BUS 98 DON’T KNOW 99 REFUSED
SKIP TRIP_5B, M9, TRIP_5C, M11, AND M12 TRIP_5A=0, 98, 99 (CONTINUE IF TRIP_5A IS >0 BUT <98)]
TRIP_5B When you transfer are you transferring between a Metro bus and. . . [READ LIST AND ENTER ALL THAT APPLY]
00 Another Metro bus 01 The Seattle Streetcar (AS NEEDED: South Lake Union Streetcar) 02 Link Light Rail 03 A Sound Transit bus 04 Sounder Train

2015 Rider / Non-Rider Survey 231 | P a g e
05 A Pierce Transit Bus 06 Community Transit Bus 07 WATER TAXI / PASSENGER-ONLY FERRY 08 WASHINGTON STATE FERRIES 95 OTHER (SPECIFY) 98 DON’T KNOW 99 REFUSED
M9 Are you satisfied or dissatisfied with the number of transfers you have to take? (FOLLOW-UP) Would that be very or somewhat (satisfied/dissatisfied)?
01 VERY DISSATISFIED 02 SOMEWHAT DISSATISFIED 04 SOMEWHAT SATISFIED 05 VERY SATISFIED 03 NEITHER SATISFIED NOR DISSATISFIED / NO OPINION 97 DOES NOT APPLY TO ME 98 DON’T KNOW 99 REFUSED
TRIP_5C When you transfer, how long do you usually wait? (AS NEEDED: How long do you usually wait, in minutes)
(ENTER MINUTES ONLY. ENTER 60 IF 60 OR MORE) ___ RECORD MINUTES [RANGE 0 TO 60] 97 VARIES 98 DON’T KNOW 99 REFUSED
M11 Are you satisfied or dissatisfied with the wait time when transferring? (FOLLOW-UP) Would that be very or somewhat (satisfied/dissatisfied)?
01 VERY DISSATISFIED 02 SOMEWHAT DISSATISFIED 04 SOMEWHAT SATISFIED 05 VERY SATISFIED 03 NEITHER SATISFIED NOR DISSATISFIED / NO OPINION 97 DOES NOT APPLY TO ME 98 DON’T KNOW 99 REFUSED
M12 Are you satisfied or dissatisfied with the way service connections are scheduled when making transfers?

2015 Rider / Non-Rider Survey 232 | P a g e
(FOLLOW-UP) Would that be very or somewhat (satisfied/dissatisfied)?
01 VERY DISSATISFIED 02 SOMEWHAT DISSATISFIED 04 SOMEWHAT SATISFIED 05 VERY SATISFIED 03 NEITHER SATISFIED NOR DISSATISFIED / NO OPINION 97 DOES NOT APPLY TO ME 98 DON’T KNOW 99 REFUSED
SERVICE CHANGE
BASE: CURRENT REGULAR AND INFREQUENT RIDERS (RIDESTAT = 01, 02)
SC1 In June and September 2015, Metro added or changed service on approximately 50 routes. Are you aware of these changes?
01 YES 02 NO 98 DON’T KNOW 99 REFUSED
ASK SC2 IF SC1 = 01
SC2 Did these changes affect the route or routes that you ride?
01 YES 02 NO 98 DON’T KNOW 99 REFUSED
ASK SC3 AND SC4 IF SC2 = 01
SC3 Which routes were affected?
____ ENTER ROUTE NUMBER [ALLOW 1 TO 4 DIGITS] ____ ENTER ROUTE NUMBER [ALLOW 1 TO 4 DIGITS] 1001 RAPID RIDE LINE A (FEDERAL WAY TO SEATAC ALONG PACIFIC AVENUE SOUTH AND INTERNATIONAL BLVD) 1002 RAPID RIDE LINE B (BELLEVUE TRANSIT CENTER AND DOWNTOWN REDMOND TRANSIT CENTER VIA CROSSROADS AND OVERLAKE) 1003 RAPID RIDE LINE C (DOWNTOWN SEATTLE AND WEST SEATTLE) 1004 RAPID RIDE LINE D (DOWNTOWN SEATTLE AND BALLARD / CROWN HILL) 1005 RAPID RIDE LINE E (DOWNTOWN SEATTLE AND AURORA VILLAGE TRANSIT CENTER / OPERATES ALONG AURORA AVENUE)

2015 Rider / Non-Rider Survey 233 | P a g e
1006 RAPID RIDE LINE F (BURIEN TO RENTON) 9995 OTHER (SPECIFY: ONLY ENTER UNLISTED NON-NUMERIC RESPONSE) 9998 DON'T KNOW 9999 REFUSED
SC4 Are you satisfied or dissatisfied with the changes to these routes? (FOLLOW-UP) Would that be very or somewhat (satisfied/dissatisfied)?
01 VERY DISSATISFIED 02 SOMEWHAT DISSATISFIED 04 SOMEWHAT SATISFIED 05 VERY SATISFIED 03 NEITHER SATISFIED NOR DISSATISFIED / NO OPINION 97 DOES NOT APPLY TO ME 98 DON’T KNOW 99 REFUSED
ASK SC4_NEW IF SC4 = 01 OR 02
SC4_NEW Why are you dissatisfied with the changes to these routes?
[OPEN END]
FARE PAYMENT
BASE: CURRENT REGULAR AND INFREQUENT RIDERS (RIDESTAT = 01, 02)
F0. How do you usually pay your bus fare? Do you use...? (READ THE FIRST FIVE RESPONSE CATEGORIES (IN PROPER CASE) ONLY) (IF RESPONDENT SAYS ORCA CARD, STOP READING LIST, AND PROBE “ANYTHING ELSE”) (IF NO TO ALL, ASK: How do you pay your bus fare?) (REREAD LIST BEFORE ACCEPTING/TYPING IN AN OTHER SPECIFY)
(SELECT ALL THAT APPLY) 00 AN ORCA LIFT CARD [RESPONDENT MAY SAY BUT DO NOT READ: REDUCED FARE FOR INCOME- 01 An ORCA Card 02 Cash 03 Tickets 04 A U-Pass (or Husky Card)

2015 Rider / Non-Rider Survey 234 | P a g e
05 A Regional Reduced Fare Permit, including a Senior Pass and Disability Card/Pass (RRFP) QUALIFIED / LOW-INCOME ADULT RIDERS] 06 ORCA CARD /PASS OR E-PURSE PROVIDED BY / PURCHASED FROM EMPLOYER 07 ACCESS PASS 08 SCHOOL DISTRICT CARD / PASS FROM SCHOOL (PROBE WITH: Is this High School, a local college, or the University of Washington? IF UNIVERSITY OF
WASHINGTON, CODE AS 04 – U-PASS/HUSKY CARD) 94 KING COUNTY EMPLOYEE ID / BADGE 95 OTHER (SPECIFY) (PROBE: READ LIST AGAIN BEFORE ACCEPTING) 98 DON’T KNOW 99 REFUSED
F1 [HIDDEN QUESTION: RECODE F0 RESPONSES BELOW]
00 An ORCA Lift Card [F0=00,] 01 An ORCA Card [F0=01, 07, 08] 02 Cash [F0=02] 03 Tickets [F0=03] 04 A U-Pass (or Husky Card) [F0=04] 05 A Regional Reduced Fare Permit (Includes Senior Pass) [F0=05] 06 EMPLOYER PROVIDED ORCA CARD [F0=06] 94 KING COUNTY EMPLOYEE ID / BADGE [F0=94] 95 OTHER (SPECIFY) [F0=95] 98 DON’T KNOW [F0=98] 99 REFUSED [F0=99]
ASK F1A IF (F1 = 01)
IF (F1=04 OR F1=06 OR F1=94) AUTOCODE F1A AS 01 (ADULT CARD)
IF (F1=00) AUTOCODE F1A AS 00 (ORCA LIFT)
IF (F0=08), AUTO CODE F1A=02 (YOUTH CARD), REGARDLESS OF ANY OTHER RESPONSES AT F0
F1A Is your ORCA card a(n)…
(IF NO TO ALL ASK: Is it something else?)
(READ LIST; SELECT SINGLE RESPONSE) 00 An ORCA Lift card for income-qualified adults [ RESPONDENTS MAY SAY LOW-INCOME BUT DO NOT READ] 01 Full-fare adult card (AS NEEDED: Includes passport, flexpass, or a pass provided by employer or college that is not the University of Washington
(U-DUB))

2015 Rider / Non-Rider Survey 235 | P a g e
02 Youth fare card (AS NEEDED: Includes school district card or pass and youth card) 03 Regional Reduced Fare Permit, including Senior and Disabled Fare Permit (RRFP) 04 U-Pass (or Husky Card) 95 SOMETHING ELSE (SPECIFY) 98 DON’T KNOW 99 REFUSED
ASK F1AA IF F1 = 02 OR 03
F1AA Do you have a Regional Reduced Fare Permit or RRFP?
01 YES 02 NO 98 DON’T KNOW 99 REFUSED
IF FQ11 = 01 RECODE F1 TO 05 AND CONTINUE WITH F1B
ASK F1B IF F1 = 05 (RRFP) AND F1 NE 01 (ORCA)
F1B Is your Regional Reduced Fare Permit on an ORCA Card… (AS NEEDED: which has a whale and the word “ORCA” on it)
01 YES 02 NO 98 DON’T KNOW 99 REFUSED
ASK F1B_1 IF (F1A EQ 03) OR (F1 EQ 05) OR (F1AA=1)
F1B_1 Is your Regional Reduced Fare Permit a…
01 Senior Permit or 02 A Disabled Permit 98 DON’T KNOW 99 REFUSED
CREATE VARIABLE: FARE_PAYMENT AS SINGLE RESPONSE VARIABLE:
FARE_PAYMENT = 01 (CASH / TICKETS) [IF F1 = 02 OR F1=03] AND (F1 NE 1) AND (F1AA NE 1)

2015 Rider / Non-Rider Survey 236 | P a g e
FARE_PAYMENT = 03 (ADULT ORCA) [IF (F1= 01) AND (F1A=01) AND (F1 NOT EQ 05)] OR [F1 = 06 OR F1 = 94]
FARE_PAYMENT =04 (YOUTH ORCA) [IF F1 = 01 AND F1A EQ 02]
FARE_PAYMENT =05 (RRFP ORCA) [(F1=01) AND (F1A=03)] OR [(F1=05) AND (F1B=01)] OR (F1 EQ 01 AND F1 EQ 05)
FARE_PAYMENT =06 (RRFP NOT ORCA) (F1B EQ 02)
FARE_PAYMENT =07 (U-PASS) [IF F1 = 04 OR F1A = 04]
FARE_PAYMENT =08 (ORCA LIFT) [(IF F1 = 00) OR (F1A = 00)]
FARE_PAYMENT =95 (OTHER) [IF F1 = 95 AND NO OTHER OPTION IS SELECTED] OR [EVERYTHING ELSE]
IF F1 IS MULTIPLE CHOICE AND ONE SELECTION IS 95 (OTHER), IGNORE THE 95 WHEN CREATING THE FARE_PAYMENT VARIABLE]
CREATE VARIABLE: ORCA
1 “ORCA CARD” IF FARE_PAYMENT=03 OR 04 OR 05 OR 08
2 “NOT ORCA CARD” IF FARE_PAYMENT=01 OR 06, OR 95
3 “U-PASS” IF FARE_PAYMENT=07
ASK F1D IF ORCA=01
F1D Which do you have on your ORCA card….
01 A monthly pass [AS NEEDED: that allows you to take as many rides as you want during the month,] or… 02 Money in an “electronic purse” or E-purse [AS NEEDED: that allows you to take rides until your purse is empty and you have to add more money] 03 BOTH 04 NO / NEITHER

2015 Rider / Non-Rider Survey 237 | P a g e
05 EMPLOYER / SCHOOL PROVIDED SO I DO NOT KNOW 98 DON’T KNOW 99 REFUSED
ASK F2INT/F2A THROUGH F2B_1 IF (F1D=4 OR 98)
F2INT To help us figure out what is loaded on your card I would like to provide a brief definition of an E-Purse and a Pass. ORCA cards can have an electronic -Purse, called an E-purse, which is like having money stored on a card that can be used to pay your transit fare. The value stored on an E-Purse must be periodically re-loaded by you or your employer.
F2A Do you have an E-Purse on your ORCA card?
(AS NEEDED: Another way to think of the E-Purse is like a Starbucks card, where you or your employer has to periodically add value to the card in order to use it.)
(AS NEEDED: The E-Purse can be reloaded online, at ticket kiosks, Metro Customer Service Centers, or at certain retailers. Do you have an E-Purse on your ORCA card?)
01 YES 02 NO 98 DON’T KNOW 98 REFUSED
F2B_1 ORCA cards can also have a pass that allows you to ride as much as you want during the time the pass is valid. The pass may be called a Regional or Puget
(PRON: PEW-JET) Pass, Passport or U-PASS that either you, your employer or school pays for. Do you have a pass on your ORCA card?
01 YES 02 NO 98 DON’T KNOW 98 REFUSED
F5INT Are you satisfied or dissatisfied with (READ ATTRIBUTE)? (FOLLOW-UP) Would that be very or somewhat (SATISFIED/DISSATISFIED)?
05 VERY SATISFIED 04 SOMEWHAT SATISFIED 02 SOMEWHAT DISSATISFIED 01 VERY DISSATISFIED 03 NEITHER SATISFIED NOR DISSATISFIED / NO OPINION 97 DOES NOT APPLY TO ME 98 DON’T KNOW 99 REFUSED
ALL RIDERS (RIDESTAT = 01, 02]

2015 Rider / Non-Rider Survey 238 | P a g e
F5A Ease of paying fares when boarding
ASK F5B IF ORCA=01 (ORCA CARD) OR FARE_PAYMENT = 07 (U-PASS)
F5B Overall satisfaction with your [RESTORE FARE_PAYMENT}
ASK F5C IF (F1D = 01 OR O3) OR (F2B_1=01)
F5C Ease of loading a pass on your ORCA card
ASK F5D IF (F1D=02 OR 03) OR (F2A=01)
F5D Ease adding value to your E-Purse
ALL RIDERS (RIDESTAT = 01, 02]
F5G Value of service for fare paid
ASK FR4A IF FARE_PAYMENT = 01
F4A You indicated that you use [IF F1=02 INSERT “cash” / IF F1=03, INSERT “tickets”] to pay your fare. Why do you prefer to use [IF F1=02 INSERT “cash” / IF F1=03, INSERT “tickets”] as opposed to an ORCA Card?
(ENTER ALL THAT APPLY) 01 DON’T RIDE OFTEN ENOUGH 02 EASIER TO PAY WITH CASH/TICKETS 03 DON’T HAVE A DEBIT OR CREDIT CARD TO PUT A PASS ON OR ADD VALUE TO AN ORCA CARD 04 NOT ENOUGH LOCATIONS AVAILABLE WHERE I CAN GO TO PUT A PASS ON OR ADD VALUE TO AN ORCA CARD 05 CONCERNS ABOUT LOSING ORCA CARD 06 CONCERNS ABOUT SECURITY / IDENTITY THEFT USING AN ORCA CARD 07 CAN’T AFFORD THE $5 FEE TO PURCHASE AN ORCA CARD 08 DON’T WANT TO / UNWILLING TO PAY THE $5 FEE TO PURCHASE AN ORCA CARD 09 RECEIVE TICKETS FROM SOCIAL SERVICE AGENCY / SCHOOL / WORK 10 HAVEN'T GOT AROUND TO IT / NO TIME / LOST CARD 11 DON'T KNOW ABOUT IT / HAVEN'T LOOKED INTO IT 95 OTHER (SPECIFY) 98 DON’T KNOW 99 REFUSED

2015 Rider / Non-Rider Survey 239 | P a g e
RIDERS’ PERSONAL SAFETY
BASE: CURRENT REGULAR AND INFREQUENT RIDERS (RIDESTAT = 01, 02)
PS1 In the past year, how often have you done each of the following? Would you say frequently, sometimes, rarely, or never?
PS1A Ride the bus when it is dark
PS1C Get on or off a bus or Link Light Rail in the downtown transit tunnel 04 FREQUENTLY/ALWAYS 03 SOMETIMES 02 RARELY 01 NEVER/NO 98 DON’T KNOW 99 REFUSED
PS2INT Are you satisfied or dissatisfied with (READ ATTRIBUTE)? (FOLLOW-UP) Would that be very or somewhat (SATISFIED/DISSATISFIED)?
05 VERY SATISFIED 04 SOMEWHAT SATISFIED 02 SOMEWHAT DISSATISFIED 01 VERY DISSATISFIED 03 NEITHER SATISFIED NOR DISSATISFIED / NO OPINION 97 DOES NOT APPLY TO ME 98 DON’T KNOW 99 REFUSED
PS2A Personal safety on the bus related to the conduct of others during the daytime
PS2C Personal safety waiting for the bus in the daytime
ASK PS2B IF PS1A > 01 AND < 98
PS2B Personal safety on the bus related to the conduct of others after dark
ASK PS2D IF PS1A > 01 AND < 98
PS2D Personal safety waiting for the bus after dark
ASK PS2E IF PS1B_1 > 01 AND < 98

2015 Rider / Non-Rider Survey 240 | P a g e
PS2E Personal safety in the downtown transit tunnel
PS3A Do you avoid riding the bus due to concerns about your personal safety?
(IF YES, READ: Would that be frequently, sometimes, or rarely?) 04 FREQUENTLY 03 SOMETIMES 02 RARELY 01 NEVER / NO, I DO NOT AVOID RIDING 98 DON’T KNOW 99 REFUSED
PS5 Please tell me if you agree or disagree with the following statements. (FOLLOW-UP) Would that be strongly or somewhat (agree/disagree)?
05 STRONGLY AGREE 04 SOMEWHAT AGREE 02 SOMEWHAT DISAGREE 01 STRONGLY DISAGREE 03 NEITHER AGREE NOR DISAGREE / NO OPINION 97 NOT APPLICABLE 98 DON’T KNOW 99 REFUSED
PS5B Metro has been very proactive in improving safety and security
PS5G Metro provides a safe and secure transportation environment
INFORMATION
BASE: CURRENT REGULAR AND INFREQUENT RIDERS (RIDESTAT = 01, 02)
IN4A Do you own a Smartphone? IF YES: Is your Smartphone an I-Phone, an Android phone, or something else?
01 YES--IPHONE 02 YES—ANDROID 03 YES—SOMETHING ELSE 04 NO 98 DON’T KNOW

2015 Rider / Non-Rider Survey 241 | P a g e
99 REFUSED
ASK IN1L IF IN4A = 01 OR 02 OR 03.
IN1L How often do you use a Smartphone to get information about Metro
04 Frequently 03 Sometimes 02 Rarely 01 Never 98 DON’T KNOW 99 REFUSED
ASK IN4B_2 IF IN1L > 01
IN4B_2 Which Smartphone apps or alerts do you use to get information about Metro?
(DO NOT READ LIST AND ENTER ALL THAT APPLY)
01 ONE BUS AWAY 02 TRANSIT APP (SEATTLE TRANSIT) 03 SEATTLEBUS 04 SEATTLE METRO 05 METRO’S TRIP PLANNER APP (m.tripplanner.kingcounty.metro) 06 GOOGLE/ GOOGLE MAPS / GOOGLE TRANSIT 09 METRO ALERTS EMAIL 10 METRO ALERTS TEXT 12 REAL TIME TRAVEL INFORMATION ON SMARTPHONE 13 SOCIAL MEDIA [FOLLOW-UP: Which sites do you use?] 14 METRO’S FACEBOOK PAGE 15 METRO TWEETS [@KCMETROBUS] / TWITTER 16 METRO MATTERS BLOG! 95 OTHER (SPECIFY) 97 NONE 98 DON’T KNOW 99 REFUSED
ASK IN4B_3 IF IN4B_2 NE 05 AND IN4A LE 03

2015 Rider / Non-Rider Survey 242 | P a g e
IN4B_3 Have you heard of and/or used Metro’s Trip Planner App? [AS NEEDED: (m.tripplanner.kingcounty.metro)]
01 YES: AWARE / NOT USED 02 YES: AWARE / USED 03 NO: NOT AWARE / HAVE NOT USED 98 DON’T KNOW 99 REFUSED
NEWIN1 [SHOW IF (IN4A GE 04) OR (IN4B_2 GE 97)] Which of the following do you use to get information about Metro? [SHOW IF IN4B_2 LE 95] What else do you use to get information about Metro?
READ LIST OF ITEMS NOT IN CAPS AND ENTER ALL THAT APPLY. USE FOLLOW-UP PROBES] [IF USE METRO ONLINE, FOLLOW-UP: Do you use the Online Regional Trip Planner when you go to Metro online / Metro’s website??] [IF USE INFORMATION AT STOPS, FOLLOW-UP: Would that be Posted / Printed or Real-Time Information sign?] [IF USE ALERTS, FOLLOW-UP: Do you use Email and/or Text Alerts? ENTER APPROPRIATE RESPONSE] [IF USE SOCIAL MEDIA, FOLLOW-UP: Which sites do you use?] [IF USE SMARTPHONE, FOLLOW-UP: Do you use your Smartphone to get real-time travel information?]
01 Printed timetables 02 Metro Online [FOLLOW-UP: Do you use the Online Regional Trip Planner when you go to Metro online / Metro’s website?] 03 Online Regional Trip Planner [AS NEEDED: the Trip Planner function on Metro Transit’s website. You put in a start and end place and the trip planner
tells you which routes to take] 04 Metro’s Customer Service Call Center (AS NEEDED: 206-553-3000) 05 Information at Stops [FOLLOW-UP: Would that be Posted / Printed or Real-Time Information signs?] 06 POSTED / PRINTED INFORMATION AT STOPS 07 Real-time Information Signs 08 METRO ALERTS [FOLLOW-UP: Do you use Email and/or Text Alerts?] 09 METRO ALERTS EMAIL 10 METRO ALERTS TEXT 12 REAL TIME TRAVEL INFORMATION ON SMARTPHONE 13 SOCIAL MEDIA [FOLLOW-UP: Which sites do you use?] 14 METRO’S FACEBOOK PAGE 15 METRO TWEETS [@KCMETROBUS] / TWITTER 16 METRO MATTERS BLOG! 95 OTHER [SPECIFY] 97 NONE 98 DON’T KNOW 99 REFUSED
2015 Rider / Non-Rider Survey 243 | P a g e
ASK IN3 IF GROUP=2. KEEP LOGIC FOR INDIVIDUAL QUESTION AS WELL.
IN3INT Are you satisfied or dissatisfied with (READ ATTRIBUTE)? (FOLLOW-UP) Would that be very or somewhat (SATISFIED/DISSATISFIED)?
05 VERY SATISFIED 04 SOMEWHAT SATISFIED 02 SOMEWHAT DISSATISFIED 01 VERY DISSATISFIED 03 NEITHER SATISFIED NOR DISSATISFIED / NO OPINION 97 DOES NOT APPLY TO ME 98 DON’T KNOW 99 REFUSED
ASK IN3A ALL GROUP 2 RESPONDENTS
IN3A Overall ability to get information about Metro’s routes and schedules
ASK IN3C IF NEWIN1=02
IN3C Availability of service information on Metro Online (AS NEEDED: Metro’s website)
ASK IN3I IF NEWIN1=05
IN3I Availability of information at bus stops
ASK IN3I_1 IN3I <=4
IN3I_1 Availability of printed information at stop
ASK IN3I_2 IN3I <=4
IN3I_2 Availability of real-time information at stops
ASK IN3F IF NEWIN1=02
IN3F Website posting of service delays or other problems
ASK IN3G IF (NEWIN1=08 OR 09 OR 10) OR (IN4B_2=09 OR 10)
IN3G Alerts via e-mail or text messaging regarding service delays or other problems
ASK IN3G IF IN4B_2 LE 95

2015 Rider / Non-Rider Survey 244 | P a g e
IN3J Availability of information via Smartphones
ASK IN3L ALL GROUP 2 RESPONDENTS
IN3L Ability to provide feedback such as registering a complaint or commendation
ASK IN3K ALL GROUP 2 RESPONDENTS ALWAYS DISPLAY IN3K LAST
IN3K Notification of service changes
ASK IN3K _1 THROUGH IN3K _2 IF IN3K < 03
IN3K_1 Timeliness of notifications
IN3K_2 Adequacy of information provided
ASK IN5_1 IF IN4A LE 03 OR NEWIN1=07
IN5_1 [SHOW IF IN4B_2 LE 95 OR NEWIN1=07] You indicated that you currently use real-time travel information your Smartphone. [SHOW IF IN4B_2 GT 95] You indicated that you have a Smartphone. Would you be interested in receiving real-time information that tells you about…. [READ LIST AND ENTER ALL THAT APPLY]
IN5A Arrival times
IN5C Seats are available on the bus
IN5B Space is available on the bus but may be standing room only
IN5D Comparative travel times between different routes, modes (bus versus rail), etc.
01 YES 02 NO 98 DON’T KNOW 99 REFUSED
ASK IN5_2 IF IN4A LE 03 AND [ANY IN5A TO IN5D =01]
IN5_2 Would you prefer to get real-time information at stops, on your smartphone, or both?
03 AT STOPS

2015 Rider / Non-Rider Survey 245 | P a g e
02 ON SMARTPHONE 01 BOTH 98 DON’T KNOW 99 REFUSED
NON-RIDER TRAVEL
BASE: NON-RIDERS (RIDESTAT = 03)
NON1A Do you use any of the other public transportation services in the area?
01 YES 02 NO 98 DON’T KNOW 99 REFUSED
ASK NON1B IF NON1A EQ 01
NON1B Which do you use? (IF RESPONDENT SAYS “SOUND TRANSIT” CLARIFY WITH: Would that be a Sound Transit Bus, Link Light Rail, or the Sounder Train? )
(READ LIST ONLY IF NEEDED; SELECT ALL THAT APPLY)
00 SEATTLE [SOUTH LAKE UNION] STREETCAR 01 SOUND TRANSIT BUS 02 LINK LIGHT RAIL 03 SOUNDER TRAIN 04 KING COUNTY WATER TAXI 05 MONORAIL 06 COMMUNITY TRANSIT 07 PIERCE TRANSIT 08 KITSAP TRANSIT 09 WASHINGTON STATE FERRIES 95 OTHER (SPECIFY) 98 (NEVER READ) DON’T KNOW 99 (NEVER READ) REFUSED
ASK NON1C IF NON1A EQ 01
NON1C How many one-way trips have you taken on [RESTORE RESPONSE TO NON1B] in the past 30 days?
___ ENTER TOTAL NUMBER OF RIDES [RANGE: 0-90]

2015 Rider / Non-Rider Survey 246 | P a g e
98 DON’T KNOW 99 REFUSED
CREATE VARIABLE: OTHERTRANSITRIDER 01 RIDESTAT= 03 02 RIDESTAT = 03 AND (NON1A EQ 01 AND (NON1C > 04 AND NON1C < 98)
NON2 When was the last time you rode a Metro bus? Was it...
00 Within the last 1 to 3 months 01 Within the past 4 to 6 months 02 Six months to one year ago 03 Between 1 and 5 years ago, or 04 More than 5 years ago? 05 NEVER 98 DON’T KNOW 99 REFUSED
ASK NON2A IF NON2 EQ 00, 01, 02, 03 SKIP TO NON4B IF NON2 EQ 04, 05, 98, 99
NON2A When you rode Metro, what was the primary purpose of the trip you took most often?
(READ IF RESPONDENT SAYS APPOINTMENTS: Would that be business appointments, medical appointments, or something else?) (READ IF RESPONDENT SAYS TO GET/GO DOWNTOWN: What is the purpose of the trip you take to downtown? OR What do you do downtown?) (READ IF RESPONDENT SAYS APPOINTMENTS: Would that be business appointments, medical appointments, or something else?) (READ IF RESPONDENT SAYS TO GET/GO DOWNTOWN: What is the purpose of the trip you take to downtown? OR What do you do downtown?)
01 TO/FROM WORK 02 TO/FROM SCHOOL 03 TO/FROM VOLUNTEERING 04 SHOPPING / ERRANDS 05 APPOINTMENTS 06 FUN / RECREATION / SOCIAL 07 SPECIAL EVENTS (SPORTS, SEAFAIR, BUMBERSHOOT SHUTTLES) 08 JURY DUTY 09 DOWNTOWN 10 AIRPORT 11 NO SINGLE PURPOSE 95 OTHER (SPECIFY)

2015 Rider / Non-Rider Survey 247 | P a g e
98 DON’T KNOW 99 REFUSED
NON4B How far is it from your home to the nearest Metro bus stop? (ENTER NUMBER AND THEN SPECIFY WHETHER RESPONDENTS SAYS NUMBER OF BLOCKS OR NUMBER OF MILES)
___ ENTER NUMBER [ALLOW DECIMALS] [RANGE: 1-90.99] 03 BLOCKS 04 MILES 93 LESS THAN ONE BLOCK 94 LESS THAN ONE MILE 98 DON’T KNOW 99 REFUSED
NON6A Overall, how appealing to you personally is the idea of using Metro? Would you say...
[SHOW SCALE IN THIS ORDER FROM LEFT TO RIGHT:
VERY APPEALING, SOMEWHAT APPEALING, NOT VERY APPEALING, NOT AT ALL APPEALING, NEITHER]
05 Very appealing 04 Somewhat appealing 02 Not very appealing 01 Not at all appealing 03 NEITHER APPEALING NOR UNAPPEALING 98 DON’T KNOW 99 REFUSED
ASK NON6B IF NON6A EQ 03, 04, 05
NON6B If convenient transit service was available to places you typically travel to, how likely would you be to ride Metro? Use an 11-point scale where “0” means “not at all likely” and “10” means “extremely likely.”
00 Not At All Likely 01 02 03 04 05 06 07 08

2015 Rider / Non-Rider Survey 248 | P a g e
09 10 Extremely Likely 98 DON’T KNOW 99 REFUSED
ASK NON6C IF NON6B >= 05 AND <98
NON6C What is the single most important thing that Metro could do to increase your likelihood of using the bus for at least some of your travel?
[OPEN-ENDED RESPONSE]
PARK-AND-RIDE LOTS
BASE: All Respondents
PR1 In the past year, how often have you used a Metro park-and-ride lot. Would you say. . .
[IF YES ASK: Would that be frequently, sometimes, or rarely?]
04 YES - FREQUENTLY 03 YES - SOMETIMES 02 YES - RARELY 01 NO - NEVER 98 DON’T KNOW 99 REFUSED
ASK PR2D IF PR2B PR1 GT 1 AND LT 98
PR2D How do you usually get from home to the park-and-ride lot you use most often? [SINGLE-RESPONSE]
01 DRIVE YOURSELF 02 RIDE WITH SOMEONE ELSE / CARPOOL 03 GET DROPPED OFF 04 WALK 05 BICYCLE 06 BUS 95 OTHER (SPECIFY) 98 DON’T KNOW 99 REFUSED
[ASK PR3A, PR3B, PR3C, IF ((PR1>01) AND (PR1<98))
PR3INT Are you satisfied or dissatisfied with (READ ATTRIBUTE)?

2015 Rider / Non-Rider Survey 249 | P a g e
(FOLLOW-UP) Would that be very or somewhat (SATISFIED/DISSATISFIED)?
05 VERY SATISFIED 04 SOMEWHAT SATISFIED 02 SOMEWHAT DISSATISFIED 01 VERY DISSATISFIED 03 NEITHER SATISFIED NOR DISSATISFIED / NO OPINION 97 DOES NOT APPLY TO ME 98 DON’T KNOW 99 REFUSED
ASK PR3A IF PR2D = 01 OR 02
PR3A Availability of parking
PR3B Personal safety at the park-and-ride lot
ASK PR3C IF PR2D = 01 OR 02
PR3C Security of your automobile at the park-and-ride lot
COMMUTER STATUS
BASE: ALL RESPONDENTS
CS1 Are you currently… (READ LIST UNTIL VALID RESPONSE GIVEN; SELECT ALL THAT APPLY)
01 Employed/SELF-EMPLOYED 02 A student 03 A homemaker 04 Retired 05 Currently not employed 94 DISABLED 95 OTHER (SPECIFY) 98 DON’T KNOW 99 REFUSED
ASK CS1A IF CS1 = 01
CS1A Are you employed…?
01 Full-time

2015 Rider / Non-Rider Survey 250 | P a g e
02 Part-time 03 Self-employed 98 DON’T KNOW 99 REFUSED
ASK CS1B IF CS1 = 02
CS1B Are you a…?
01 Full-time student 22 Part-time student 98 DON’T KNOW 99 REFUSED
ASK CS1C IF CS1 = 01 AND 02
CS1C Which do you consider to be your primary activity?
01 Employed 02 A student 98 DON’T KNOW 99 REFUSED
ASK CS2B IF CS1 = 01
CS2B How many days a week do you travel to a fixed worksite?
_____ ENTER NUMBER OF DAYS [RANGE: 0-7, 98, 99] 98 DON’T KNOW 99 REFUSED
ASK CS2C IF CS2B > 0 AND [(RIDESTAT = 01) OR (RIDESTAT=02)]
CS2C Of the [RESTORE ANSWER TO CS2B] day(s) that you travel to work, how many days do you take a Metro bus as part of that commute?
_____ ENTER NUMBER OF DAYS [RANGE: 0-RESPONSE TO CS2C, 98, 99] 98 DON’T KNOW 99 REFUSED
ASK CS3B IF CS1 = 02

2015 Rider / Non-Rider Survey 251 | P a g e
CS3B How many days a week do you travel to school, that is, you attend class outside your home?
_____ ENTER NUMBER OF DAYS [RANGE: 0-7, 98, 99] 98 DON’T KNOW 99 REFUSED
ASK CS3C IF CS3B > 0 AND [(RIDESTAT = 01) OR (RIDESTAT=02)]
CS3C Of the [RESTORE ANSWER TO CS3B] day(s) that you travel to school, how many days do you take a Metro bus as part of that commute?
_____ ENTER NUMBER OF DAYS [RANGE: 0- RESPONSE TO CS3B, 98, 99] 98 DON’T KNOW 99 REFUSED
CREATE VARIABLE = COMMUTER 01 WORK COMMUTER: CS2B >2 AND <98 02 SCHOOL COMMUTER: CS3B > 2 AND < 98 IF BOTH CS2B AND CS3B > 2 AND < 98 01 WORK COMMUTER IF CS1C = 01 02 SCHOOL COMMUTER IF CS1C = 02 03 NON-COMMUTER ALL ELSE SO LONG AS RIDESTAT=01 OR 02
CREATE VARIABLE = WORK_COMMUTERS 1 “Non-commuters” (CS2B < 3) OR (CS1 NE 1) 2 “Commute, use Metro for all” (CS2B >=3) AND (CS2B=CS2C) 3 “Commute, use Metro for some” (CS2B >=3) AND (CS2B > CS2C) AND (CS2C >= 1) 4 “Commute, not use Metro” [(CS2B >=3) AND (CS2C <1)] OR [(CS2B >= 3) AND (RIDESTAT=3)] CREATE VARIABLE = SCHOOL_COMMUTERS 1 “Non-commuters” (CS3B < 3) OR (CS1 NE 2) 2 “Commute, use Metro for all” (CS3B >=3) AND (CS3B=CS3C) 3 “Commute, use Metro for some” (CS3B >=3) AND (CS3B > CS3C) AND (CS3C >= 1) 4 “Commute, not use Metro” [(CS3B >=3) AND (CS3C <1)] OR [(CS3B >= 3) AND (RIDESTAT=3)] CREATE VARIABLE WORK_SCHOOL_COMMUTE 1 “Non-Commuter“ (WORK_COMMUTER=1) AND OR (SCHOOL_COMMUTER=1) 2 “Work non commuter—school all Metro“ (WORK_COMMUTER=1) AND (SCHOOL_COMMUTER=2)
2015 Rider / Non-Rider Survey 252 | P a g e
3 “Work non commuter—school some Metro (WORK_COMMUTER=1) AND (SCHOOL_COMMUTER=3) 4 “Work non commuter—school no Metro“ (WORK_COMMUTER=1) AND (SCHOOL_COMMUTER=4) 5 “Work all metro—school non-commuter“ (WORK_COMMUTER=2) AND (SCHOOL_COMMUTER=1) 6 “Work all metro—school all Metro“ (WORK_COMMUTER=2) AND (SCHOOL_COMMUTER=2) 7 “Work all metro—school some Metro“ (WORK_COMMUTER=2) AND (SCHOOL_COMMUTER=3) 8 “Work all metro—school no Metro“ (WORK_COMMUTER=2) AND (SCHOOL_COMMUTER=4) 9 “Work some Metro – school non-commuter“ (WORK_COMMUTER=3) AND (SCHOOL_COMMUTER=1) 10 “Work some Metro – school all Metro“ (WORK_COMMUTER=3) AND (SCHOOL_COMMUTER=2) 11 “Work some Metro – school some Metro“ (WORK_COMMUTER=3) AND (SCHOOL_COMMUTER=3) 12 “Work some Metro – school no Metro“ (WORK_COMMUTER=3) AND (SCHOOL_COMMUTER=4) 13 “Work no Metro—school non-commuter“ (WORK_COMMUTER=4) AND (SCHOOL_COMMUTER=1) 14 “Work no Metro—school all Metro“ (WORK_COMMUTER=4) AND (SCHOOL_COMMUTER=2) 15 “Work no Metro—school some Metro“ (WORK_COMMUTER=4) AND (SCHOOL_COMMUTER=3) 16 “Work no Metro—school no Metro“ (WORK_COMMUTER=4) AND (SCHOOL_COMMUTER=4)
ASK C4A IF WORK_SCHOOL_COMMUTE=03 OR 07 OR 09 OR 10 OR 11 OR 12 OR 15
C4A [IF WORK_SCHOOL_COMMUTE=03 OR 07 OR 15 DISPLAY: You indicated that you use Metro for [RESTORE CS3C] of the [RESTORE CS3B] days you
attend classes outside your home. On those days when you don’t use Metro, how do you get to school?
[IF WORK_SCHOOL_COMMUTE=09 OR 10 OR 12 DISPLAY: You indicated that you use Metro for [RESTORE CS2C] of the [RESTORE CS2B] days you
work outside your home. On those days when you don’t use Metro, how do you get to work?
[IF WORK_SCHOOL_COMMUTE=11 DISPLAY: You indicated that you use Metro for [RESTORE CS2C+CS3C] of the [RESTORE CS2B+CS3B] days you
work and attend class outside your home. On those days when you don’t use Metro, how do you get to work or school?
(READ LIST ONLY IF NECESSARY; ENTER ALL THAT APPLY) 01 DRIVE ALONE 02 CARPOOL (2 OR MORE PEOPLE IN CAR) 03 VANPOOL 04 SEATTLE [SOUTH LAKE UNION] STREETCAR 06 RIDE THE SOUNDER TRAIN 07 RIDE LINK LIGHT RAIL 08 RIDE A SOUND TRANSIT BUS 09 SCHOOL BUS 10 RIDE ANOTHER SYSTEM’S BUS (SPECIFY) 11 MOTORCYCLE 12 BICYCLE

2015 Rider / Non-Rider Survey 253 | P a g e
13 WALK 15 DRIVE TO PARK & RIDE LOT 16 KING COUNTY WATER TAXI 95 OTHER (SPECIFY) 98 (NEVER READ) DON’T KNOW 99 (NEVER READ) REFUSED
ASK C4B IF [WORK_SCHOOL_COMMUTE=04 OR 08 OR 12 OR 13 OR 14 OR 15 OR 16]
C4B IF WORK_SCHOOL_COMMUTE = 04 OR 08 OR 12 DISPLAY: You indicated that you do not use Metro to get to school. How do you typically get to school?
IF WORK_SCHOOL_COMMUTE = 13 OR 14 OR 15 DISPLAY: You indicated that you do not use Metro to get to work. How do you typically get to work?
IF WORK_SCHOOL_COMMUTE = 16 DISPLAY: You indicated that you do not use Metro to get to work or school. How do you typically get to work or
school?
(READ LIST ONLY IF NECESSARY; ENTER ALL THAT APPLY) 01 DRIVE ALONE 02 CARPOOL (2 OR MORE PEOPLE IN CAR) 03 VANPOOL 04 SEATTLE [SOUTH LAKE UNION] STREETCAR 06 RIDE THE SOUNDER TRAIN 07 RIDE LINK LIGHT RAIL 08 RIDE A SOUND TRANSIT BUS 09 SCHOOL BUS 10 RIDE ANOTHER SYSTEM’S BUS (SPECIFY) 11 MOTORCYCLE 12 BICYCLE 13 WALK 15 DRIVE TO PARK & RIDE LOT 16 KING COUNTY WATER TAXI 95 OTHER (SPECIFY) 98 (NEVER READ) DON’T KNOW 99 (NEVER READ) REFUSED
ASK C10A IF [WORK_SCHOOL_COMMUTE=04 OR 08 OR 12 OR 13 OR 14 OR 15 OR 16]
C10A IF WORK_SCHOOL_COMMUTE = 04 OR 08 OR 12 DISPLAY: Overall, how appealing to you personally is the idea of using Metro to get to school? Would
you say…
IF WORK_SCHOOL_COMMUTE = 13 OR 14 OR 15 DISPLAY: Overall, how appealing to you personally is the idea of using Metro to get to work? Would you

2015 Rider / Non-Rider Survey 254 | P a g e
say…
IF WORK_SCHOOL_COMMUTE = 16 DISPLAY: Overall, how appealing to you personally is the idea of using Metro to get to work or school? Would you
say…
[SHOW SCALE IN THIS ORDER FROM LEFT TO RIGHT:
VERY APPEALING, SOMEWHAT APPEALING, NOT VERY APPEALING, NOT AT ALL APPEALING, NEITHER]
05 Very appealing 04 Somewhat appealing 02 Not very appealing 01 Not at all appealing 03 NEITHER APPEALING NOR UNAPPEALING 98 DON’T KNOW 99 REFUSED
ASK C10A_1 IF C10A EQ 03, 04, 05
C10A _1 If convenient transit service was available to where you would [work/go to school], how likely would you be to ride Metro? Use an 11-point scale where “0” means “not at all likely” and “10” means “extremely likely.”
00 Not At All Likely 01 02 03 04 05 06 07 08 09 10 Extremely Likely 98 DON’T KNOW 99 REFUSED
ASK C10A _2 IF C10A _1>= 05 AND <98
C10A _2 What is the single most important thing that Metro could do to increase your likelihood of using the bus to get to work or school?
[OPEN-ENDED RESPONSE]
2015 Rider / Non-Rider Survey 255 | P a g e
COMMUTER TRAVEL
BASE: COMMUTERS [(COMMUTER=01) OR (COMMUTER=02)]
SKIP TO GW1A IF (COMMUTER=03)
C1 In what geographic area do you [work / attend school]?
(READ LIST UNTIL VALID RESPONSE GIVEN; SELECT SINGLE RESPONSE) 01 Downtown Seattle Core (AS NEEDED: Downtown is the area between Denny Way on the north to Jackson Street on the South and between I-5 on the
East to the waterfront on the west. Downtown does not include SODO, South Lake Union.) 00 South Lake Union 02 Other areas surrounding Downtown Seattle (AS NEEDED: This includes Pioneer Square, Belltown, International District, Capitol Hill, First Hill, Denny
Regrade, and SODO) 11 On the UW (PRON: YOU-DUB) campus 03 University District 05 Downtown Bellevue 06 Redmond 12 Renton 13 SeaTac / Airport 07 Other areas in East King County 04 Other areas in North King County 08 South King County 09 Tacoma or other areas in Pierce County 10 Everett or other areas in Snohomish (PRON: sno-HOE-mish) County 95 Somewhere else? (SPECIFY) 97 VARIES 98 DON’T KNOW 99 REFUSED
C3A How many miles do you travel from home to [work/school] one-way? (AS NEEDED: Please use your best estimate.)
___ ENTER NUMBER OF MILES 94 LESS THAN ONE MILE 95 MORE THAN 90 MILES 97 VARIES 98 DON'T KNOW 99 REFUSED

2015 Rider / Non-Rider Survey 256 | P a g e
C3B About how long does that usually take you? (ENTER A NUMBER IN EACH FIELD - E.G. 0 HOURS/15 MINUTES, 1 HOUR/0 MINUTES, 1 HOUR/15 MINUTES, ETC.)
___ ENTER IN HOURS RANGE [RANGE: 0-10] ___ ENTER IN MINUTES [RANGE: 0-60] 97 VARIES 98 DON'T KNOW 99 REFUSED
ASK C8A IFC4A = 01, 02, OR 03 OR C4B = 01, 02, 03 INSERT TEXT THAT CORRESPONDS TO COMMUTE MODE AND COMMUTE STATUS.
C8A When you [drive/carpool/vanpool] to [work/school] do you usually park. . .
(READ LIST UNTIL VALID RESPONSE GIVEN) 01 In a garage 02 In a surface lot 03 Paid on-street parking 04 Free on-street parking 05 Free parking lot at [work/school] 95 SOMEWHERE ELSE (SPECIFY) 96 DON’T PARK / GOT DROPPED OFF 98 DON’T KNOW 99 PREFER NOT TO ANSWER

2015 Rider / Non-Rider Survey 257 | P a g e
ASK C9A IF (C8A = 01, 02, 95) INSERT TEXT THAT CORRESPONDS TO COMMUTE STATUS.
C9A Do you personally pay for some or all of your parking at [work/school]? (AS NEEDED: Do you pay for all or some of your parking?)
01 YES, I PAY FOR ALL OF MY PARKING 02 YES, I PAY FOR SOME OF MY PARKING 03 NO 98 DON’T KNOW 99 REFUSED
ASK F3A IF COMMUTER = 01 OR 02 AND ((F1D=01) OR (F1D=02) OR (F1D=03)) OR (F2A=01) OR (F2B_1=01) OR (F1D=05) OR RIDESTAT=03 OR C4B = 01 [METRO RIDERS WHO DO NOT TAKE BUS TO WORK OR SCHOOL]
F3A [IF COMMUTER = 01 OR 02 AND RIDESTAT = 01 OR 02] Does your employer or school pay for part or all of your ORCA pass or E-purse? [IF COMMUTER = 01 OR 02 AND RIDESTAT = 03 OR C4B = 01] Does your employer or school pay for part or all of the cost of an ORCA pass or E-purse? (IF YES, READ: Would that be all or some of the cost?) (AS NEEDED: Would that be your school or your employer?)
01 YES, ALL PAID FOR BY SCHOOL 02 YES, ALL PAID FOR BY EMPLOYER 03 YES, SOME PAID FOR BY SCHOOL 04 YES, SOME PAID FOR BY EMPLOYER 05 NO, NONE PAID FOR BY SCHOOL/EMPLOYER 98 DON’T KNOW 99 REFUSED
CREATE VARIABLE: SUBSIDY = 01 (FULL SUBSIDY) IF F3A = 01 OR F3A = 02 SUBSIDY = 02 (PARTIAL SUBSIDY) IF F3A = 03 OR F3A = 04 OR FARE_PAYMENT = 07 (U-PASS) SUBSIDY = 03 (NO SUBSIDY) IF F3A =05 SUBSIDY = 04 (NOT APPLICABLE) IF (F3A >=97)

2015 Rider / Non-Rider Survey 258 | P a g e
OVERALL SATISFACTION, LOYALTY / ADVOCACY, GOODWILL
BASE: ALL RESPONDENTS
GOODINT These next questions are about your overall general impressions of Metro.
ASK GW1A IF (RIDESTAT = 01) OR (RIDESTAT=02)
GW1A Overall, would you say you are satisfied or dissatisfied with Metro?
(FOLLOW-UP) Would that be very or somewhat (SATISFIED/DISSATISFIED)?
05 VERY SATISFIED 04 SOMEWHAT SATISFIED 02 SOMEWHAT DISSATISFIED 01 VERY DISSATISFIED 03 NEITHER SATISFIED NOR DISSATISFIED / NO OPINION 97 DOES NOT APPLY TO ME 98 DON’T KNOW 99 REFUSED
RANDOMIZE GW5_1 TO GW5_8
GW5 Based on anything you have seen, heard, or directly experienced, please tell me if you agree or disagree with each of the following statements. (FOLLOW-UP) Would that be strongly or somewhat (agree/disagree)?
GW5_1 When I hear my friends and colleagues talking about Metro, I generally hear positive things.
GW5_2 When I read or hear things about Metro in the media or online, I generally hear positive things. (AS NEEDED: By media, I am talking about things like the newspaper, television, and radio. By online, I am talking about things like Internet sites, blogs, Twitter, and Facebook.)
GW5_7 Metro is an agency I like and respect
GW5_8 Metro is an agency I trust
ASK GW5_9 IF RIDESTAT EQ 01 OR 02
GW5_9 I like to be able to say I ride Metro
05 STRONGLY AGREE 04 SOMEWHAT AGREE 02 SOMEWHAT DISAGREE
2015 Rider / Non-Rider Survey 259 | P a g e
01 STRONGLY DISAGREE 03 NEITHER AGREE NOR DISAGREE / NO OPINION 98 DON’T KNOW 99 REFUSED
RANDOMIZE GW6 SERIES
GW6 [INTERVIEWERS READ AS NEEDED] BASED ON ANYTHING YOU HAVE SEEN, HEARD, OR DIRECTLY EXPERIENCED PLEASE TELL ME IF YOU AGREE OR DISAGREE WITH EACH OF THE FOLLOWING STATEMENTS. (FOLLOW-UP) Would that be strongly or somewhat (agree/disagree)?
GW6B Metro offers good value for the level of service provided
GW6D Metro provides excellent customer service
GW6E Metro is innovative
GW6G Metro has consistently high standards for the quality of service they provide
GW6H Metro values its customers
05 STRONGLY AGREE 04 SOMEWHAT AGREE 02 SOMEWHAT DISAGREE 01 STRONGLY DISAGREE 03 NEITHER AGREE NOR DISAGREE / NO OPINION 98 DON’T KNOW 99 REFUSED
GW7 Based on anything you have seen, heard, or directly experienced, which of the following statements best describes how you feel about Metro?
01 I have high expectations of Metro and I am confident that they will continue to provide the best service possible 02 I generally expect high quality service from Metro and I am generally confident that they will provide high quality service 03 I generally expect both good and bad service from Metro and am not fully confident that they will provide the quality of service I would like 04 I have low expectations of Metro and would expect to encounter problems when riding Metro 05 I have very low expectations of Metro and would not ride Metro unless I absolutely had to 98 DON’T KNOW 99 REFUSED

2015 Rider / Non-Rider Survey 260 | P a g e
DEMOGRAPHICS
BASE: All Respondents
NEW SECTION FOR TIMING
DEMO Finally, I have some background questions that will be used to help us analyze the results of the study.
D2 May I please get your age?
__ AGE [RANGE 1-97; NQ TERMINATE IF 1-15 ENTERED (THANK3)] 98 DON’T KNOW 99 REFUSED
ASK D2A IF D2 98, 99
D2A Would that be....
(READ LIST UNTIL VALID RESPONSE GIVEN) 01 16-17 02 18-19 03 20-24 04 25-34 05 35-44 06 45-54 07 55-64 08 65 or Older 98 DON’T KNOW 99 REFUSED
D1 [THIS QUESTION CAN BE LEFT BLANK] (ENTER GENDER OF RESPONDENT BY OBSERVATION. READ QUESTION TEXT ONLY IF NECESSARY)
Are you…
01 MALE 02 FEMALE
D3A Do you have a valid driver’s license?
01 YES

2015 Rider / Non-Rider Survey 261 | P a g e
02 NO 98 DON’T KNOW 99 REFUSED
D3B How many vehicles in working condition does your household have available? (AS NEEDED: Vehicles include cars, trucks, motorcycles, scooters, etc.)
(ENTER 8 IF 8 OR MORE)
__ ENTER NUMBER OF VEHICLES [RANGE 0 – 8] 98 DON’T KNOW 99 REFUSED
ASK D3C IF S3B > 1 AND D3B > 0 AND D3A = 01
D3C Is one of these vehicles available for your personal use?
01 YES 02 NO VEHICLES AVAILABLE FOR PERSONAL USE 98 DON’T KNOW 99 REFUSED
DIS1 Do you have a disability that limits your ability to do one or more major life activities?
(AS NEEDED: Such as walking or climbing stairs, running errands, hearing announcements, using a computer.)
01 YES 02 NO 98 DON’T KNOW 99 REFUSED
ASK DIS2 IF DIS1 = 1 AND (RIDESTAT=01 OR 02)
DIS2 When you ride the bus, which of the following services do you use?
(READ LIST AND ACCEPT ALL THAT APPLY) 01 Priority seating area 02 Use of the lift or ramp OR KNEELING BUS 03 Wheelchair securement area 95 OTHER Other types of assistance to use the bus (SPECIFY) 98 DON’T KNOW

2015 Rider / Non-Rider Survey 262 | P a g e
99 REFUSED
D4A Are you Spanish, Hispanic, or Latino?
(READ IF RESPONDENT SEEMS UNSURE: Are you or were your ancestors Mexican, Puerto Rican, Cuban, Central or South American, or from Spain?)
01 YES 02 NO 98 DON’T KNOW 99 REFUSED
D4B I am going to read a list of race categories. Please choose one or more races you consider yourself to be:
(IF THEY SAY “HISPANIC” PROBE WITH: “In addition to Hispanic, what other race categories do you consider yourself to be?” BEFORE CODING ON LIST AS HISPANIC.)
(SELECT ALL THAT APPLY) 01 White 02 Black or African American 03 American Indian or Alaskan Native 04 Asian or Pacific Islander 05 MULTI-RACE (NO NEED TO SPECIFY) 94 HISPANIC 95 OTHER (SPECIFY) 98 DON’T KNOW 99 REFUSED
D5 Is your total annual household income above or below $35,000 per year?
[IF RESPONDENT STARTS TO SAY “MY INCOME IS…” RE-READ QUESTION]
01 BELOW $35,000 PER YEAR 02 ABOVE $35,000 PER YEAR 98 DON’T KNOW 99 REFUSED
ASK D5A IF D5 EQ 01

2015 Rider / Non-Rider Survey 263 | P a g e
D5A Would that be…?
(READ LIST UNTIL VALID RESPONSE GIVEN) 01 Less than $7,500, 02 $7,500 up to $15,000, 03 $15,000 up to $25,000, or 04 $25,000 up to $35,000? 98 DON’T KNOW 99 REFUSED
ASK D5B D5 EQ 02
D5B Would that be…? (READ LIST UNTIL VALID RESPONSE GIVEN) 01 $35,000 up to $55,000, 02 $55,000 up to $75,000, 03 $75,000 up to $100,000, 04 $100,000 up to $150,000, or 05 $150,000 and up? 98 DON’T KNOW 99 REFUSED
IF SAMPLETYPE = 01 OR 02 (RDD LANDLINE) DO NOT SHOW OPTION 01 IF SAMPLETYPE = 03 (CELLPHONE) DO NOT SHOW OPTION 05
NEWTEL3 Of all the telephone calls that you make and receive do you. . .
01 Only make or receive calls on your cell phone 02 Primarily make or receive calls on your cell phone 03 Use cell phone and landline equally 04 Primarily make or receive calls on your landline 05 Only make or receive calls on your landline 98 DON’T KNOW 99 REFUSED
D8 Metro may be doing other studies in the future. May we contact you again if we do? (AS NEEDED: These could be surveys or focus groups. Your responses to this particular survey will never be connected with you personally.)
01 YES - OKAY TO CONTACT 02 NO - DON’T CONTACT / REFUSED [SKIP TO THANK]

2015 Rider / Non-Rider Survey 264 | P a g e
IF D8 = 01 ASK D8A
D8A May I have your first name, so we will know who to ask for? (IF REFUSED, TYPE MR/MRS REFUSED, DEPENDING ON GENDER)
[OPEN END]
ASK D6 IF (D8=1) AND SAMPTYPE = 03 (CELL PHONE)
D6 For our records, I need to verify your telephone number. Is it... [DISPLAY PHONE]?
01 YES 02 NO 98 DON’T KNOW 99 REFUSED
ASK D6A IF D6 = 02
D6A What is your correct telephone number?
____________ (ENTER CORRECT PHONE NUMBER) (TYPE IN 999-999-9999 for refused)