2016 system evaluation - king countymetro.kingcounty.gov/.../service-guidelines-full... · 2 king...
TRANSCRIPT
2016 System Evaluation Annual Service Guidelines Report
September 2016
ATTACHMENT A

.

KING COUNTY METRO TRANSIT 2016 SYSTEM EVALUATION i
Department of TransportationMetro Transit Division
King Street Center, KSC-TR-0415201 S. Jackson St
Seattle, WA 98104206-553-3000 TTY Relay: 711
www.kingcounty.gov/metro
Alternative Formats Available
206-477-3832 TTY Relay: 711
2016 System Evaluation Annual Service Guidelines Report
September 2016
H/SARAH/SERVICE GUIDELINES 2016 WORKING FOLDER

ii KING COUNTY METRO TRANSIT 2016 SYSTEM EVALUATION
ContentsEXECUTIVE SUMMARY ...........................................................................................................................1
INTRODUCTION ......................................................................................................................................4
SECTION 1. SERVICE GUIDELINES
CORRIDOR ANALYSIS ....................................................................................................... 11
ROUTE PERFORMANCE ANALYSIS .................................................................................... 18
SECTION 2. ALTERNATIVE SERVICES PERFORMANCE AND PROGRESS REPORT .................................. 31
SECTION 3. POTENTIAL CHANGES TO THE SERVICE GUIDELINES AND STRATEGIC PLAN ...................36
FIGURES
Fig. 1 Metro Service Guidelines Process ...................................................................................... 6
Fig. 2 2015 Corridors Below Target Service Levels ................................................................... 15
Fig. 3 Routes Needing Investment to Reduce Passenger Crowding ........................................... 21
Fig. 4 Routes Needing Investment to Improve Schedule Reliability ........................................... 26
Fig. 5 2016 Peak-only Route Analysis Results ........................................................................... 30
TABLES
Table 1 2016 Investment Needs .................................................................................................... 2
Table 2 2016 Investment Needs Systemwide and on Minority and Low-income Routes ................. 9
Table 3 Number of Corridors Serving Centers .............................................................................. 10
Table 4 Summary of Typical Service Levels ...................................................................................11
Table 5 2016 Corridors Below Target Service Levels and Estimated Hours to Meet Service Level Targets, Ordered by Investment Priority ............................................ 13
Table 6 Corridors that Received 2016 Service Investments .......................................................... 14
Table 7 Corridors Served Primarily by Sound Transit .................................................................... 17
Table 8 Priority 1: Routes Needing Investment to Reduce Passenger Crowding ........................... 19
Table 9 Routes Receiving 2016 Service Investments to Relieve Passenger Crowding .................... 20
Table 10 Priority 2: Routes Needing Investment to Improve Schedule Reliability ........................... 22
Table 11 Routes that Received 2016 Service Investments to Improve Schedule Reliability ............. 24
Table 12 2015–2016 Route Productivity Threshold Changes for Top 25% ...................................... 28
Table 13 2015–2016 Route Productivity Threshold Changes for Bottom 25% ................................ 28
Table 14 Shuttle Performance ....................................................................................................... 32

KING COUNTY METRO TRANSIT 2016 SYSTEM EVALUATION iii
APPENDICES
Appendix A: Map of Low-Income and Minority Tracts .................................................................. 39
Appendix B: Map of Activity Centers and Regional Growth/Manufacturing Centers ...................... 40
Appendix C: Route Productivity Data ........................................................................................... 41
Appendix D: Peak Analysis Results ............................................................................................... 48
Appendix E: Route Reliability ....................................................................................................... 50
Appendix F: 2015 Service Changes ............................................................................................... 53
Appendix G: Route-level Ridership ............................................................................................... 59
Appendix H: Corridor Analysis of All-Day Network ....................................................................... 65

iv KING COUNTY METRO TRANSIT 2016 SYSTEM EVALUATION
How We Use the Guidelines to Plan, Assess and Change Service
Where do we provide service?
Corridor analysis: How much service should we provide?
Route performance analysis: How is service performing?
How should we change service?
Our service network is made up of corridors connecting centers
Target service levels are set in two steps
Initial service levelCurrent ridersConnections to centers & frequent peak service that warrant night serviceTarget
Route ProductivityRides/Hr.
Pass.miles/mile
Invest to:• Reduce overcrowding• Improve reliability• Achieve target service levels• Become more productive
Reduce service to:• Meet budget constraints• Re-invest in investment priorities
Make improvements and restructures to:• Match design guidelines
contained in the Service Guidelines
• Meet investment priorities
CENTERS
Transit centers and places where many people work, live or go for services or activities
86 centers across King County today
CORRIDORS
112 Metro corridors serve centers today
ALL-DAY AND PEAK NETWORK
These 112 corridors create Metro’s all-day transit network. Metro provides additional
peak-only service to meet demand.
Productivity (jobs & households)
Social Equity (low-income & minority riders)
Geographic Value (connections to centers)
InitialService Level
1 WHAT IS THE INITIAL SERVICE LEVEL? 2 DOES INITIAL SERVICE LEVEL PROVIDE ENOUGH BUSES?
Service Reliability < 5 minutes late
Top 25%
Bottom 25%
OvercrowdingAvg. max passenger load
< crowding thresholdStanding load < 20 min all service
Peak-only CriteriaTravel time Ridership
Comparison of Target and Existing Service
BelowAbove At
Target Existing
BelowBelow
+ Investment priorities – Reduction priorities Improvements & restructures
Service change
proposals

KING COUNTY METRO TRANSIT 2016 SYSTEM EVALUATION 1
EXECUTIVE SUMMARYThis 2016 System Evaluation (called the Annual Service Guidelines Report in previous years) presents Metro Transit’s assessment of our 2016 All-Day and Peak-Only Network. Using our adopted service guidelines, we analyzed data from the September 26, 2015 to March 25, 2016 service period (unless otherwise noted).
This period pre-dates the March 2016 restructure of Metro service around Sound Transit’s extension of Link to Capitol Hill and the University of Washington (U-Link restructure), so that restructure is not reflected in the data. However, when calculating final investment needs, we made adjustments based on this restructure and on investments planned for fall 2016.
Based on the results, we set target service levels for the corridors where we provide service, and then identified where service-hour investments are needed to meet or move toward the targets. We also analyzed the performance of 186 Metro bus routes and the South Lake Union Streetcar, identifying where investments are needed to improve service quality by reducing passenger crowding and keeping buses on schedule.
The report also includes an annual report on alternative services performance and a status update on the development of the Alternative Services Program.
This year’s report incorporates policy revisions and changes to analytic methodologies that were recommended by the Service Guidelines Task Force in 2015 and approved by the King County Council in June 2016. These revisions modified how Metro evaluates transit service performance. In particular, the corridor analysis now places stronger emphasis on social equity and on geographic value. These changes affect the target amount of bus service Metro should provide throughout the county and the investment needed to meet that target.
The report’s findings were also affected by a number of recent developments. These include substantial service investments made by the City of Seattle and Metro in June and September 2015, continuing growth in population and employment in our region, and worsening traffic congestion. These changes affect ridership as well as crowding on buses and schedule reliability.

2 KING COUNTY METRO TRANSIT 2016 SYSTEM EVALUATION
Investment needsThe 2016 system evaluation found a total estimated need of approximately 519,450 annual service hours to meet Metro’s service quality objectives and target service levels after making adjustments for the 2016 restructure and service investments. This need represents an increase of about 14 percent above the size of the system in fall 2015 through winter 2016.
TABLE 12016 Investment Needs
(Based on fall 2015 – winter 2016 data, adjusted for 2016 service investments)
Priority Investment Purpose Estimated Annual Hours Needed
1 Reduce passenger crowding 12,800
2 Improve schedule reliability 18,350
3Increase service to meet target service levels on corridors in the All-Day and Peak-Only Network
488,300
Total investment need 519,450
4Increase service on highly productive routes: A substantial portion of the growth needed to meet the Transportation 2040 goals (an additional 2.5 million annual service hours) will be on highly productive services.
Changes in investment needs since 2015The total investment need of 519,450 annual service hours is more than the 471,650 hour need identified in the 2015 analysis. This increase was expected because of the changes made to the service guidelines in response to the Service Guidelines Task Force recommendations. The changes are detailed on page 7.
Investment priorities 1 and 2: Service quality needs. Over the past 18 months, Metro and the City of Seattle made investments to meet previously identified needs to reduce crowding and improve reliability. Total 2016 service quality needs are 20 percent lower than last year’s. Compared to 2015, annual service hours needed to reduce passenger crowding decreased 11 percent, from 14,400 to 12,800; hours needed to improve schedule reliability decreased 22 percent, from 23,550 to 18,350.
Our continued identification of crowded services this year reflects ridership growth—stemming in part from our service investments—and the standardization of our passenger crowding methodology (see Section 1, Route Performance Analysis). Crowding is spread fairly evenly throughout the county, reflecting high demand countywide for services connecting to the densest areas of the county.
The ability of buses to arrive on time was negatively affected by record ridership, roadway congestion, and construction impacts—despite substantial investments to improve reliability. We noted some significant declines in PM peak reliability, particularly on routes 308, 303 Express, 113, 107, 18 Express, 197, 148, 9 Express, and 249. Service-hour investments to improve reliability can do only so much, so Metro will be looking for opportunities to partner with local governments to make capital improvements, such as bus lanes and transit signal priority, that help buses move through congestion better.
Investment priority 3: Service to meet corridor target service levels. Target service levels represent the amount of service Metro ought to provide on transit corridors in our All-Day and Peak-Only Network. We determine the target levels using indicators of productivity, social equity, and geographic value. Meeting target service levels typically requires the addition of many trips in one or more time periods of the day, or complete revisions of route schedules.

KING COUNTY METRO TRANSIT 2016 SYSTEM EVALUATION 3
Most of the increase in service-level need stemmed from the changes in how we conduct the corridor analysis, made in response to the Service Guidelines Task Force recommendations. Additional factors are now included in the analysis, and corridors can earn a range of points on each factor, in contrast to the previous method which awarded points in an “all or nothing” manner. (See page 7 for more details.) Target service levels changed for some corridors as a result of changes in ridership, land use, and the distribution of low-income and minority populations in King County.
Investment priority 4: Highly productive routes. Investment in highly productive services is the fourth investment priority. Of the 187 routes evaluated, 80 were in the top 25 percent on one or both of our route productivity measures for at least one time period.
Highly productive routes generally serve areas where there is latent demand for transit. Although we know from experience that investments in very productive routes result in higher ridership, the guidelines do not attempt to quantify the service hours that would be necessary to satisfy that demand. Some of these highly productive routes also need investments because they are overcrowded, unreliable, or on corridors where service is not at the target level; many are targeted for investment to address these issues, while others receive investment when a service restructure is undertaken.
The regional contextThe total 519,450 hour investment need represents only part of the transit growth expectation in the Puget Sound region’s Transportation 2040 plan. To meet the plan’s target, Metro would have to increase the amount of service it provides by approximately 2.5 million hours. Metro’s proposed long-range plan, METRO CONNECTS, has identified corridors throughout the county where significant investment will be required to support projected growth in jobs and population. Metro will continue to use the service guidelines to evaluate system performance and identify near-term investment needs.
Alternative ServicesThis report also reviews the performance and progress of Metro’s Alternative Services Program, which brings a range of mobility services to parts of King County that do not have the infrastructure, density, or land use to support traditional fixed-route bus service.
This program expanded over the past year with the successful launch of three innovative service solutions: Real-Time Rideshare, Community Van, and TripPool. These services expand on the success of three Community Shuttles launched in 2015 (Snoqualmie Valley, Mercer Island, and Burien). The two community shuttles for which historical data is available experienced mostly steady ridership compared to 2015; the Snoqualmie Valley Shuttle saw a slight increase, while the Upper Snoqualmie Valley service saw a slight decrease.
Metro continues to conduct outreach in partner communities—Redmond, southeast King County, Vashon Island, Bothell and Woodinville, Kenmore and Kirkland, Sammamish, and Lake Forest Park and Shoreline. We are collaborating with these and other communities to learn about transportation needs and gaps and then develop customized mobility solutions.
Metro at a Glance (2015)Service area: 2,134 square miles
Population: 2.05 million (est.)
Employment: 1.1 million (est.)
Fixed-route ridership: 121.8 million
Vanpool ridership: 3.6 million
Access ridership: 1.3 million
Annual service hours: 3.7 million
Active fleet: 1,472
Bus stops: over 8,000
Park-and-rides: 130
Park-and ride spaces: 25,468

4 KING COUNTY METRO TRANSIT 2016 SYSTEM EVALUATION
INTRODUCTIONThis 2016 System Evaluation includes the following information to fulfill reporting requirements:
Analysis of Metro’s 2016 All-Day and Peak-Only Network, as required by King County Ordinance 17143
An annual report on Alternative Services performance, as required by Motion 13736
The service guidelines define a transparent process using objective data that helps Metro make decisions about adding, reducing and changing transit service to deliver productive, high quality service where it’s needed most.
The service guidelines balance productivity and fairness. They help us use public tax and fare dollars as effectively as possible to provide high-quality service that gets people where they want to go, serves areas that have many low-income and minority residents, and responds to public transportation needs throughout the county.
About the service guidelinesMetro uses service guidelines to plan and manage our transit system and to let the public see the basis of our proposals to expand, reduce, or revise service. We developed the guidelines in response to a recommendation of the 2010 Regional Transit Task Force and included them in our Strategic Plan for Public Transportation, which was adopted by the King County Council in 2011.
The Strategic Plan and Service Guidelines have been updated several times since then. The most recent amendments were proposed in 2015 and adopted by the King County Council in June 2016. Many of these changes responded to recommendations from the 2015 Service Guidelines Task Force. The Service Guidelines revisions modify how we evaluate transit service. In particular, the analysis of transit corridors places stronger emphasis on social equity and on geographic value. These changes affect the target amount of bus service Metro should provide throughout the county and the investment need required to meet that target.

KING COUNTY METRO TRANSIT 2016 SYSTEM EVALUATION 5
For more information about the Service Guidelines Task Force, visit http://kingcounty.gov/metro/serviceguidelinestaskforce.
For more information about Metro’s Strategic Plan and Service Guidelines, visit http://kingcounty.gov/metro/strategicplan.
This is the sixth annual service guidelines report, now titled System Evaluation. It presents the results of our analysis of data for the Metro system from the Sept. 26, 2015 to March 25, 2016 service change period (unless otherwise noted) and identifies services that are candidates for investment, change, or reduction. It serves as a snapshot of Metro service in one six-month period. Previously, we produced the report based on spring data, but we now have only two rather than three service changes per year. To meet reporting requirements, we now analyze fall/winter data.
When Metro makes service decisions to match budget projections—whether resources are shrinking, stable, or growing—the service guidelines help by identifying investment and reduction priorities. The service guidelines were used in 2013 and 2014 to develop a plan for service reductions to close Metro’s revenue shortfall. They were also used when determining how new revenue from the City of Seattle’s Transportation Benefit District and Metro’s budget savings1 would be invested, and they were used to program investments in 2016. We will continue looking for ways to improve the system regardless of the future funding situation.
What is in this report?This report is organized to lead readers through the following questions:
Where should service be provided? The Corridor Analysis portion of Section 1 presents the results of our analysis of transit corridors throughout the county that determines how well they are being served and where need exists.
How is my route doing? The Route Performance Analysis portion of Section 1 presents the results of our route performance analysis. It also identifies specific investment needs based on service quality issues (overcrowding and poor reliability).
Where and how is Metro investing in alternative services? Section 2 provides information about the performance of alternative services and steps we are taking to expand these services.
What potential changes to policies are on the horizon? Section 3 briefly covers potential future changes to the guidelines, including preliminary ideas about how the guidelines would interface with Metro’s proposed long-range plan, METRO CONNECTS.
Figure 1, on page 6, summarizes how we analyze the transit system. We review the results to estimate and prioritize investment needs. The analysis also guides service restructures and reductions when they become necessary.
1 These savings resulted from a combination of process efficiencies Metro implemented, higher-than-expected sales tax revenues, and lower-than-expected fuel prices.

6 KING COUNTY METRO TRANSIT 2016 SYSTEM EVALUATION
*Service Design Principles contained in the Service Guidelines guide changes to the system and are considered when we plan for service changes.
Corridor analysis
Step 1:• Productivity (households, jobs, and
student enrollment along corridors)• Social equity (ridership in
low-income and minority areas)• Geographic value (connections to
growth, employment and transit activity centers)
Step 2:• Ridership• Cost recovery• Completeness of the night network
SERVICE CHANGES AND PROPOSALS*
RestructuresRestructures Additions Reductions
Route performance analysis
Passenger loads• Load factors (passenger crowding)• 20 minute standing load
Reliability• On-time performance
Route productivity• Rides per platform hour• Passenger miles per platform mile
Analysis of peak-only routes• Travel time• Ridership
Route and corridor performance1. Potential for major reduction2. Investment priorities
FIGURE 1
Metro Service Guidelines Process

KING COUNTY METRO TRANSIT 2016 SYSTEM EVALUATION 7
Changes to the Service GuidelinesBased on recommendations from the Service Guidelines Task Force, the King County Council adopted the following changes to the service guidelines in 2016. We used the updated guidelines to produce this report, and some scores were affected as a result.
Corridor productivity. One policy change affected corridor productivity: we now count park-and-ride stalls (weighted by an average occupancy factor of 1.1) alongside the number of households served by each corridor. Many corridors serving park-and-rides saw productivity score increases this year. Overall, shifts in scores this year were minor, with only one corridor losing or gaining more than two points: corridor 51 (Route 150 between Kent Station and downtown Seattle) saw a large increase in both households and jobs and gained four productivity points.
Social equity. Two policy changes affected this portion of the corridor analysis:
The definition of “low income” changed from 100 percent to 200 percent of the federal poverty level to align with other programs and policies.
Previously, corridors would receive either zero or five points for each of the social equity categories (low income and minority). Now, corridors can score either zero, three, or five points. This change was designed to prevent large swings in scores from year to year resulting from relatively minor changes in the demographic landscape.
These policy changes shuffled scores around, but ultimately resulted in a net increase in social equity scores systemwide. When changes to demographics were taken into account, two corridors received fewer minority points (losing only two points, whereas previously they would have lost all five), while 12 corridors’ scores increased. Six corridors received lower low-income scores, while 19 received higher low-income scores.
Geographic value. The updates to the Service Guidelines significantly revamped this measure. All corridors that serve any designated center now receive at least two points. Primary connections between transit activity centers receive five points, while primary connections between activity centers and regional centers receive seven points. Primary connections between regional centers receive 10 points. This change had by far the largest impact on corridor scores. A total of 76 corridors received more points than last year, with the average increase being 3.7 points.
Service types. Routes are classified into groups so that when we look at their productivity, only like routes are compared. The previous system had two groups: Seattle core and non-Seattle core. The names of these groups were changed, and a third category for DART and shuttle service was added to better reflect the value of these services:
Urban routes, which connect to the greater downtown Seattle area and the University District, including commuter routes.
Suburban routes, which operate in other areas of Seattle and King County.
DART and shuttle services, which serve more rural areas and specialized markets.
Urban routes are expected to perform at a higher level because their market potential is greater than Suburban routes. DART routes and shuttles are evaluated separately as they have characteristics that set them apart from traditional fixed-route service and add value where traditional, big-bus service is inefficient.
Crowding. This year, we standardized the way we measure crowding so that each type of bus in our diverse fleet is measured fairly against the others. Since different buses have different numbers of seats, we moved away from a seats-based metric to an area-based metric. A crowding threshold is computed for each type of bus based on the number of seats and the space available for standing.

8 KING COUNTY METRO TRANSIT 2016 SYSTEM EVALUATION
Providing service where it’s needed most: how the guidelines advance social equity and geographic valueMetro strives to provide equitable access to public transportation for everyone in our community and to deliver value throughout King County. The Service Guidelines help us by defining criteria and processes for analyzing and planning transit service that advances social equity and provides geographic value.
Social equity
One of the most important processes is that of setting target service levels for corridors in the All-Day and Peak-Only Network. The guidelines define a process for determining a social equity score that makes up 25 percent of each corridor’s total service-level score. First, we categorize census tracts as low income and minority using the most recent and best available census data (Appendix A). For each corridor, we compute the percentage of boardings that occur in those areas and compare it to the countywide average.
In previous years, corridors that exceeded the countywide average scored social equity points and were designated as low-income and/or minority corridors, while corridors below the average did not receive points. This year, corridors that exceed the countywide average still receive the most social equity points, but corridors just below the average also receive some points. This change results in a greater number of corridors being classified as low income and minority.
We also changed our definition of low income from 100 percent to 200 percent of the federal poverty level to align with other programs and policies and to include a larger proportion of transit-dependent populations.
The social equity score is combined with scores for productivity (50 percent of the total) and geographic value (25 percent) to determine a preliminary target service level for each corridor. The next step is to increase the service level if necessary to serve the actual number of current riders. This step helps ensure we set target service levels that will accommodate areas where many people have few transportation options and rely on Metro to get around.
The investment priorities defined in the guidelines also benefit corridors where low-income households and minorities use transit. Table 2 shows the findings of the 2016 System Evaluation for investment needed to reduce overcrowding, improve reliability, and meet target service levels systemwide and on low-income and minority routes and corridors. Compared to 2015, the investment needed to reduce crowding on minority and low-income routes increased proportionally, while the investment needed to improve reliability proportionally remained about the same. The investment needed to meet target service levels on low-income and minority corridors increased in both absolute and proportional terms; this is due in large part to an increase in the number of corridors designated as low-income and/or minority that has resulted from the policy changes outlined above.

KING COUNTY METRO TRANSIT 2016 SYSTEM EVALUATION 9
TABLE 22016 Investment Needs Systemwide and on Minority and Low-income Routes
Priority Investment Category
Estimated total hours
needed
Hours needed on minority
routes/corridors
% of total need
Hours needed on low-income
routes/corridors
% of total need
Passenger crowding 12,800 6,500 50% 4,000 31%
Schedule reliability 18,350 10,350 56% 10,400 57%
Meeting target service levels 488,300 394,700 81% 346,700 71%
We also consider historically disadvantaged populations and people who depend on transit when we develop proposals to add, reduce, or revise service. We continuously strive to reach or maintain established target service levels. When reducing low-performing service, we avoid making reductions on corridors that are below target service levels, and ensure that low-income and minority communities are not disproportionately affected.
Our updated Service Guidelines outline other ways we avoid disproportionate impacts, including by conducting robust public outreach that engages people who have low incomes or are members of minority groups—including those who speak little or no English. We develop partnerships with community organizations, have public open houses and information tables at convenient times and locations, translate public communication materials, and offer to have language interpreters at meetings. This outreach greatly informs our service change planning.
We follow the requirements and guidance of the following policy measures:
Title VI of the Civil Rights Act, which prohibits discrimination on the basis of race, color or national origin.
King County Ordinance 16948, related to the “fair and just” principle of the King County Strategic Plan, which strives to eliminate inequities and social injustices based on race, income, and neighborhood.
King County Executive Order on Translation, which requires county agencies to ensure that public communications are culturally and linguistically appropriate for the target audience, including people with limited English proficiency.
For example, Ordinance 16948 lists 13 “determinants of equity.” When planning changes to service we strive to maintain or improve public transportation connections and access to the determinants of equity, including health care, education, food, housing, employment, and other activities of daily living and civic engagement.

10 KING COUNTY METRO TRANSIT 2016 SYSTEM EVALUATION
Geographic value
To help us deliver value throughout the county’s geographic area, the guidelines identify the primary transit connections between centers on the basis of ridership and travel time. Centers are activity nodes that are the basis of the countywide transit network. They include regional growth centers, manufacturing/industrial centers, and transit activity centers. Transit activity centers include major destinations and transit attractions such as large employment sites, hospitals and clinics, and social service facilities.
In the process for setting target service levels, we assign higher service levels to corridors that serve centers.
TABLE 3 Number of Corridors Serving Centers
Primary Connections Number of Corridors
Between regional growth centers and manufacturing/industrial centers 31
Between a transit activity center and a regional growth center and manufacturing/industrial center 43
Between transit activity centers 7
Other Connections Number of Corridors
Serving any center (other than those already counted) 29
The guidelines also incorporate geographic value by classifying routes by service type, so that we compare similar routes when assessing route productivity. (See map in Appendix B.)

KING COUNTY METRO TRANSIT 2016 SYSTEM EVALUATION 11
SECTION 1
CORRIDOR ANALYSISThe Service Guidelines establish transit corridors throughout the county that make up the All-Day and Peak-Only Network. Each of these corridors is assigned a target service level (how often the bus comes) based on a two-step process. The first step sets an initial service level based on productivity, social equity, and geographic value. The second step ensures that existing riders can be accommodated by the initial service level and, if not, raises the service level to arrive at the final target service level. Target service levels at night can also be increased in step 2, depending on the frequency of each corridor’s service in the peak period and the connections between centers that each corridor provides. Table 4 shows the typical service levels. The corridor analysis compares the target service levels to existing service to determine whether a corridor is below, at, or above the target levels. The steps of the corridor analysis as well as the results are in Appendix H.
The data analyzed is from the Sept. 26, 2015–March 25, 2016 service period, so it reflects the service additions made in June and September 2015. Based on this data, no corridors had their routing changed since the last reporting period; corridors affected by the March 2016 U-Link restructure and the September 2016 southeast Seattle restructure will be addressed in next year’s report. We used this data to comply with reporting timelines, as we now have only two service changes per year. When calculating investment needs, the additional service investments made in 2016, including the U-Link restructure, were taken into account. TABLE 4
Summary of Typical Service Levels
Service family
Service Level: Frequency (minutes) Days of service
Hours of servicePeak* Off-peak Night
Very frequent 15 or more frequent15 or more frequent
30 or more frequent
7 days 16-24 hours
Frequent 15 or more frequent 30 30 7 days 16-24 hoursLocal 30 30–60 ** 5-7 days 12-16 hoursHourly 60 60 -- 5 days 8-12 hours Peak 8 trips/day minimum -- -- 5 days Peak
Alternative services
Determined by demand and community collaboration process
* Peak periods are 5–9 a.m. and 3–7 p.m. weekdays; off-peak are 9 a.m. to 3 p.m. weekdays and 5 a.m. to 7 p.m. weekends; night is 7 p.m. to 5 a.m. all days.
** Night service on local corridors is determined by ridership and connections.
What changed?
The definition of “low income” changed from 100 percent to 200 percent of the federal poverty level.
Corridors have more opportunity to receive low-income and minority points.
Geographic value has a higher emphasis; all corridors connecting centers are valued.
Park-and-ride stalls are now included in the productivity measure.

12 KING COUNTY METRO TRANSIT 2016 SYSTEM EVALUATION
Changes to land-use patterns, demographics, and the transit network produce fluctuations in the corridor analysis from year to year. Corridor scores are detailed in Appendix H and are summarized below.
After taking the 2016 restructures and service investments into account, we identified an estimated need of 488,300 annual service hours to bring corridors to their target service levels (priority 3). Our analysis found that 59 corridors are below target service levels in one or more time periods. Sixteen corridors are new to this list.
This year’s identified need is higher than the 2015 need of 433,700 annual service hours. Most of this increase in need is due to the policy changes explained earlier, and we expected the increase to be quite a bit larger. However, the effects of the policy changes were mitigated by recent investments and restructures and by redeploying service hours gained by integrating with Link light rail. These activities reduced the investment need by about 96,000 annual service hours.
Table 5 lists the corridors that still have investment need; they are also shown in Figure 2. Some corridors’ primary routes were deleted after our data collection period; in these cases, the new primary route is shown in parentheses.
Priority for corridor investments was established according to the service guidelines by ordering the corridors in descending order of points, first by the geographic value score, then by the corridor productivity score, and finally by the social equity score. This priority order helps ensure service investments are equitably distributed and productive.
Compared to last year, the analysis resulted in more corridors being identified for very frequent or frequent service, which also means that more corridors were identified as below their target service levels (hence the growth in the number of corridors with investment needs). Final target service levels for each corridor, along with scoring details, are listed in Appendix G.
What are corridors and routes?Corridors are major transit pathways that connect regional growth, manufacturing/industrial, and activity centers; park-and-rides and transit hubs; and major destinations throughout King County. The Service Guidelines corridor analysis evaluates and sets target service levels for the corridors making up the All-Day and Peak-Only Network.
Routes are the actual bus services provided. Service within a single corridor might be provided by multiple bus routes. For example, the corridor between Renton and Enumclaw via Maple Valley and Black Diamond is served by two different routes, 143X and 907. Some routes also cover multiple corridors. For example, Route 271 serves three distinct travel markets: Issaquah-Eastgate, Eastgate-Bellevue, and Bellevue-University District. The service guidelines evaluate routes for productivity and service quality (overcrowding and reliability).

KING COUNTY METRO TRANSIT 2016 SYSTEM EVALUATION 13
TABLE 52016 Corridors Below Target Service Levels and Estimated Hours to
Meet Service Level Targets, Ordered by Investment PriorityShading indicates corridor is new to list of corridors below target service level
Corridor number Between And Major routeEstimated hours to
meet target
18 Burien Seattle CBD 131 13,500
20 Capitol Hill White Center 60 18,300
51 Kent Seattle CBD 150 7,600
84 Renton Seattle CBD 101/102 7,300
50 Kent Renton 169 12,900
83 Renton Burien F Line 4,800
81 Redmond Totem Lake 930 10,900
3 Auburn Burien 180 9,100
4 Auburn/GRCC Federal Way 181 6,500
33 Federal Way Kent 183 12,800
52 Kent Renton 153 13,900
41 Issaquah Overlake 269 26,200
100 Tukwila Des Moines 156 5,000
38 Greenwood Seattle CBD 5 4,800
61 Magnolia Seattle CBD 24 10,600
35 Fremont U. District 31/32 4,100
92 Sand Point U. District 30 (74EX) 22,500
19 Burien Seattle CBD 132 15,300
93 Shoreline U. District 373EX 32,600
86 Renton Seattle CBD 106 7,400
112 White Center Seattle CBD 125 8,800
94 Shoreline CC Northgate 345 4,800
73 Overlake Bellevue 249 12,400
87 Renton Renton Highlands 105 6,300
6 Aurora Village Northgate 346 4,700
16 Bellevue Renton 240 10,400
90 Richmond Beach Northgate 348 6,400
7 Avondale Kirkland 248 4,200
54 Kirkland Factoria 245 7,400
2 Alki SODO 50 7,400
37 Green River CC Kent 164 5,900
80 Redmond Eastgate 221 8,200
1 Admiral District Southcenter 128 9,100
31 Fairwood Renton 148 5,200
48 Kent Burien 166 5,500
101 Tukwila Fairwood 906 15,200
49 Kent Maple Valley 168 7,500
82 Redmond Fall City 224 7,600

14 KING COUNTY METRO TRANSIT 2016 SYSTEM EVALUATION
Corridor number Between And Major routeEstimated hours to meet
target
108 UW Bothell Redmond 931 3,600
30 Enumclaw Auburn 186/915 3,800
42 Issaquah North Bend 208 10,200
88 Renton Enumclaw 143/907 2,500
95 Shoreline CC Lake City 330 3,300
44 Kenmore Shoreline 331 9,800
24 Colman Park Seattle CBD 27 7,700
64 Mount Baker Seattle CBD 14 11,400
26 Discovery Park Seattle CBD 33 4,300
72 Overlake Bellevue 226 6,800
27 Eastgate Bellevue 241 4,700
58 Laurelhurst U. District 25 (78) 4,000
28 Eastgate Bellevue 246 6,100
71 Othello Station SODO 50 7,400*
89 Renton Highlands Renton 908 3,000
102 Twin Lakes Federal Way 903 1,700
103 Twin Lakes Federal Way 187 1,300
74 Pacific Auburn 917 3,100
91 S Vashon N Vashon 118 1,200
46 Totem Lake Finn Hill, Juanita --** 9,500
47 Kennydale Renton --** 7,200
Total 488,300
* Identical to need on corridor 2
** Corridors 46 and 47 do not have service along the full extent of the corridor. This precludes analyzing and ranking these corridors in the same way as all other corridors. Therefore, Metro may invest in these two corridors irrespective of their current ranking, but rather based on historical data. The need shown for these two corridors reflects the service hours required to provide 60-minute service in the peak and off-peak time periods.
Corridors that received investments in 2016 to help meet target service levels are listed in Table 6.
TABLE 6Corridors that Received 2016 Service Investments
Corridor ID Major Route Between And Via
16 240 Bellevue Renton Newcastle, Factoria
38 5 Greenwood Seattle CBD Greenwood Ave N
56 75 Northgate U District NE 45th St
57 65 Lake City U District 35th Ave NE
69 16 (62) Northgate Seattle CBD Green Lake, Wallingford
84 101/102 Renton Seattle CBD MLK Jr Way, I-5
86 106 Renton Seattle CBD Skyway, S. Beacon Hill
93 373EX Shoreline U. District Jackson Park, 15th Ave NE
99 124 Tukwila Seattle CBD Pacific Hwy S, 4th Ave S
105 49 U. District Seattle CBD Broadway

KING COUNTY METRO TRANSIT 2016 SYSTEM EVALUATION 15
Seattle
Kent
Bellevue
Auburn
Kirkland
Federal Way
Sammamish
Burien
SeaTac
Issaquah
Tukwila
Shoreline
Bothell
Kenmore
Covington
Enumclaw
Woodinville
Newcastle
Pacific
Snoqualmie
DesMoines
MapleValley
BlackDiamond
MercerIsland
Duvall
NorthBend
Medina
LakeForest
Park
Algona
NormandyPark
ClydeHill
Carnation
Milton
Hunts Point
YarrowPoint
Redmond
BeauxArts
Renton
June 10, 2016
The information included on this map has been compiled by King County staff from a varietyof sources and is subject to change without notice. King County makes no representationsor warranties, express or implied, as to accuracy, completeness, timeliness, or rightsto the use of such information. This document is not intended for use as a survey productKing County shall not be liable for any general, special, indirect, incidental, orconsequential damages including, but not limited to, lost revenues or lost profitsresulting from the use or misuse of the information contained on this map. Any sale of thismap or information on this map is prohibited except by written permission of King County.CF: GL2015_Corridorbelow
0 1 2
MilesService Guidelines Report
Spring 2016CORRIDORS BELOW TARGET SERVICE LEVEL
Corridor below target service for any period
King County cityCorridors 46 and 47 have identified need but are notcurrently served by any routes. They are thereforenot depicted on this map.
FIG. 2
2016 Corridors Below Target Service Levels
16 KING COUNTY METRO TRANSIT 2016 SYSTEM EVALUATION
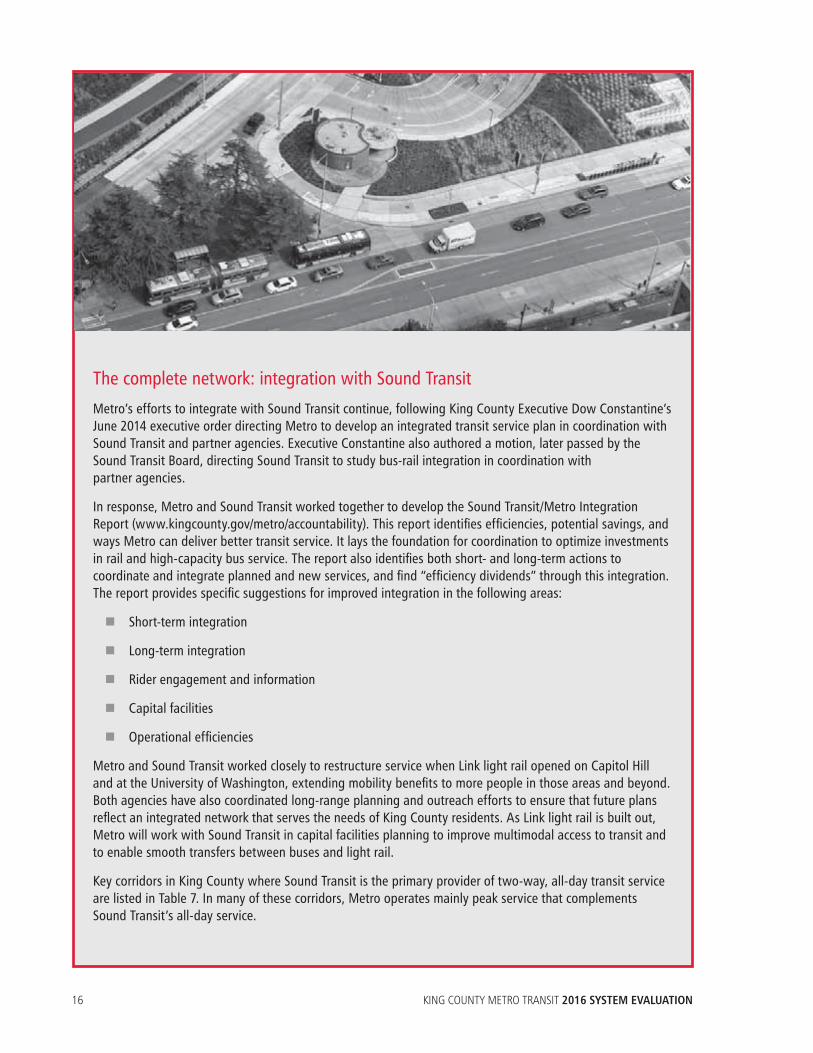
The complete network: integration with Sound Transit
Metro’s efforts to integrate with Sound Transit continue, following King County Executive Dow Constantine’s June 2014 executive order directing Metro to develop an integrated transit service plan in coordination with Sound Transit and partner agencies. Executive Constantine also authored a motion, later passed by the Sound Transit Board, directing Sound Transit to study bus-rail integration in coordination with partner agencies.
In response, Metro and Sound Transit worked together to develop the Sound Transit/Metro Integration Report (www.kingcounty.gov/metro/accountability). This report identifies efficiencies, potential savings, and ways Metro can deliver better transit service. It lays the foundation for coordination to optimize investments in rail and high-capacity bus service. The report also identifies both short- and long-term actions to coordinate and integrate planned and new services, and find “efficiency dividends” through this integration. The report provides specific suggestions for improved integration in the following areas:
Short-term integration
Long-term integration
Rider engagement and information
Capital facilities
Operational efficiencies
Metro and Sound Transit worked closely to restructure service when Link light rail opened on Capitol Hill and at the University of Washington, extending mobility benefits to more people in those areas and beyond. Both agencies have also coordinated long-range planning and outreach efforts to ensure that future plans reflect an integrated network that serves the needs of King County residents. As Link light rail is built out, Metro will work with Sound Transit in capital facilities planning to improve multimodal access to transit and to enable smooth transfers between buses and light rail.
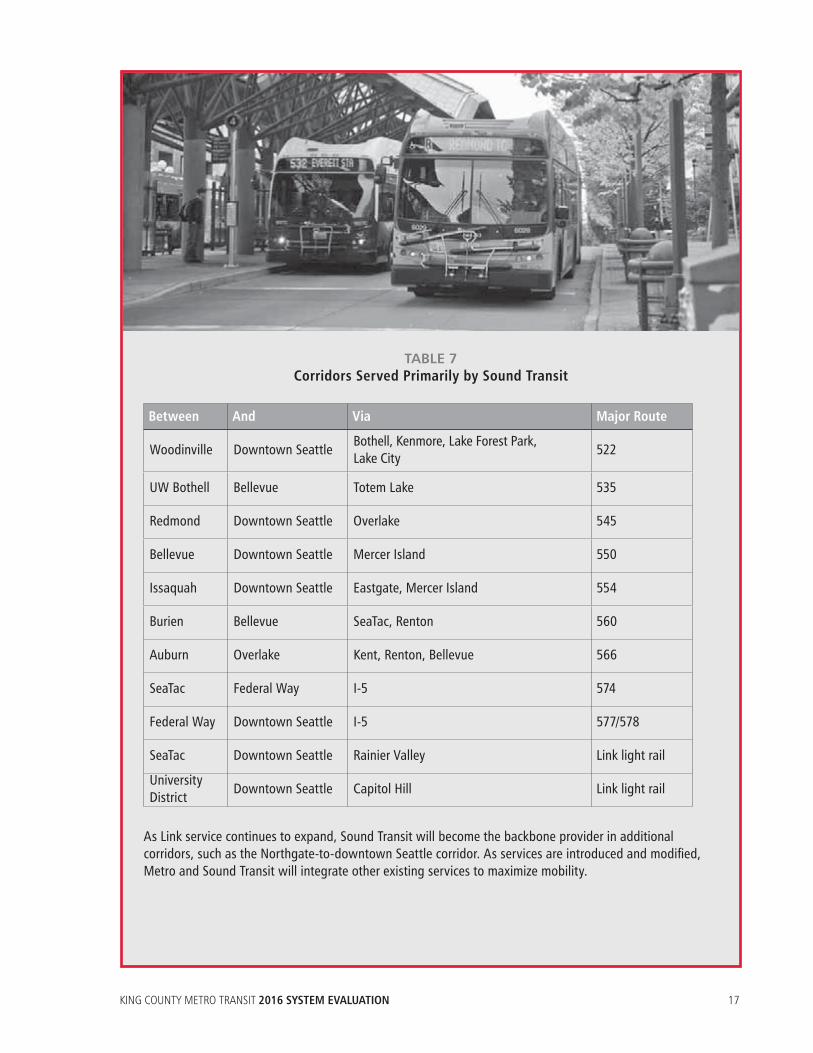
Key corridors in King County where Sound Transit is the primary provider of two-way, all-day transit service are listed in Table 7. In many of these corridors, Metro operates mainly peak service that complements Sound Transit’s all-day service.
KING COUNTY METRO TRANSIT 2016 SYSTEM EVALUATION 17
TABLE 7Corridors Served Primarily by Sound Transit
Between And Via Major Route
Woodinville Downtown SeattleBothell, Kenmore, Lake Forest Park, Lake City
522
UW Bothell Bellevue Totem Lake 535
Redmond Downtown Seattle Overlake 545
Bellevue Downtown Seattle Mercer Island 550
Issaquah Downtown Seattle Eastgate, Mercer Island 554
Burien Bellevue SeaTac, Renton 560
Auburn Overlake Kent, Renton, Bellevue 566
SeaTac Federal Way I-5 574
Federal Way Downtown Seattle I-5 577/578
SeaTac Downtown Seattle Rainier Valley Link light rail
University District
Downtown Seattle Capitol Hill Link light rail
As Link service continues to expand, Sound Transit will become the backbone provider in additional corridors, such as the Northgate-to-downtown Seattle corridor. As services are introduced and modified, Metro and Sound Transit will integrate other existing services to maximize mobility.
18 KING COUNTY METRO TRANSIT 2016 SYSTEM EVALUATION
ROUTE PERFORMANCE ANALYSISMetro analyzes the performance of bus routes using several metrics.
First, we assess service quality by measuring passenger crowding and reliability (the lateness of buses). Reducing crowding and improving reliability are our top two investment priorities, and the results of the analysis define our service quality investment needs.
Next, we analyze route productivity to determine which routes are heavily used.
Finally, we analyze peak-only routes to ensure that the value they add justifies their higher cost.
Along with the corridor analysis, the resulting data helps us generate and prioritize investments and, when necessary, determine reduction priorities. This section describes how we do these analyses and presents the results. It is the starting point for planning service revisions but is not a service change proposal. As with the corridor analysis, the data analyzed was from the Sept. 26, 2015–March 25, 2016 service period, unless otherwise noted, and the investment needs are adjusted for 2016 service investments and the U-Link restructure.
Crowding (Priority 1)Investing in the most crowded routes is the highest priority in the service guidelines. When service is chronically very crowded, it has a negative impact on riders and slows service. Crowding is defined as a trip that, on average, either exceeds a threshold based on the number of seats and the space available for standing, or has people standing for longer than 20 minutes. The crowding thresholds are set so that we accept standing passengers on many of our services, but take action where crowding is at an unacceptable level and where it occurs regularly. To ensure investments are warranted to address problems, we may consider performance over a longer period than a single service change.
This year, we identified a total need of 12,800 annual service hours to relieve crowding. Table 8 and Figure 3 identify routes that need additional trips to reduce crowding after taking the 2016 service investments into account. While the guidelines provide route-level estimates for need, we determine the actual investment any route receives by conducting a detailed analysis using the latest system data available. Changes in ridership patterns and the particular solutions we develop can either increase or decrease the number of hours we actually invest in a route.
What changed?
The measurement of crowding was standardized so all buses are treated equally.

KING COUNTY METRO TRANSIT 2016 SYSTEM EVALUATION 19
TABLE 8Priority 1: Routes Needing Investment to Reduce Passenger Crowding
Shading indicates route is new to list of routes needing investment to reduce crowding
Route Description DayAnnual Hours
Needed
D Line Crown Hill–Ballard-Seattle Center–Seattle CBD Weekday 1,050
5 Shoreline CC–Seattle CBD Weekday 300
14 Mount Baker–Seattle CBD Weekday 250
15EX Blue Ridge–Ballard–Seattle CBD Weekday 400
18EX North Beach–Ballard–Seattle CBD Weekday 350
24 Magnolia–Seattle CBD Weekday 250
101 Renton TC–Seattle CBD Weekday 300
102 Fairwood–Renton TC–Seattle CBD Weekday 450
116EX Fauntleroy Ferry–Seattle CBD Weekday 450
118EX Tahlequah–Vashon Weekday 700
119 Dockton–Vashon Weekday 200
122 Highline CC–Burien TC–Seattle CBD via Des Moines Memorial Dr S Weekday 500
125 Westwood Village–Seattle CBD Weekday 200
128 Southcenter–Westwood Village–Admiral District Weekday 500
132 Burien TC–South Park–Seattle CBD Weekday 350
158 Kent East Hill–Seattle CBD Weekday 550
167 Renton–Newport Hills–University District Weekday 900
177 Federal Way–Seattle CBD Weekday 450
212 Eastgate–Seattle CBD Weekday 700
216 Sammamish–Seattle CBD Weekday 500
219 Redmond–Sammamish–Seattle CBD Weekday 550
252 Kingsgate–Seattle CBD Weekday 400
255 Brickyard–Kirkland TC–Seattle CBD Weekday 750
257 Brickyard–Seattle CBD Weekday 400
268 Redmond–Seattle CBD Weekday 500
271 Issaquah–Bellevue–University District Weekday 400
355EX Shoreline CC–University District–Seattle CBD Weekday 450
Total 12,800
Routes receiving investments in 2016 to relieve passenger crowding are listed in Table 9.

20 KING COUNTY METRO TRANSIT 2016 SYSTEM EVALUATION
TABLE 9Routes Receiving 2016 Service Investments to Relieve Passenger Crowding
Route Description Route Description
C Line Westwood Village – Alaska Junction – South Lake Union
D Line Ballard – Seattle Center – Pioneer Square
E Line Aurora Village – Seattle CBD 5 Shoreline CC – Seattle CBD
15EX Blue Ridge – Ballard – Seattle CBD 21EX Arbor Heights – Westwood Village – Seattle CBD
27 Colman Park – Leschi Park – Seattle CBD 40 Northgate TC – Ballard – Seattle CBD via Leary Ave NW
62 Sand Point – Green Lake – Seattle CBD 65 Jackson Park – Lake City – University District
67 Northgate TC – University District 75 Northgate TC – Lake City – Seattle CBD
76 Wedgwood – Seattle CBD 77 North City – Seattle CBD
101 Renton TC – Seattle CBD 120 Burien TC – Westwood Village – Seattle CBD
214 Issaquah – Seattle CBD 216 Sammamish – Seattle CBD
218 Issaquah Highlands – Seattle CBD 219 Redmond – Sammamish – Seattle CBD
240 Bellevue – Newcastle – Renton 255 Brickyard – Kirkland TC – Seattle CBD
301EX Aurora Village – Seattle CBD 316 Meridian Park – Seattle CBD
372EX Woodinville – Lake City – University District
Overall need decreased about 11 percent from last year.2 We identified a total of 27 routes as having chronic crowding issues; 21 routes are new to the list, a result of standardizing our measurement. Crowding is spread fairly evenly throughout the county, reflecting high demand countywide for services connecting to the densest areas of the county. Metro and Seattle investments in popular, crowded routes induce more demand, much in the same way that widening a highway induces more people to drive.
Table 9 includes routes that received reliability investments as part of restructures. A restructure enables all involved routes to be reblocked, rescheduled, and in some cases split into two parts to improve reliability. In essence, service hours are “picked up” from the restructure area and “laid down” in a new way that serves customers better and more reliably.
Routes 3, 60, 301, 303, and 312 have trips that are close to the crowding threshold, or that are over the threshold but have excess capacity within 15 minutes. These routes are on our watch list. Routes 18 Express, 132, 252, 257, and 271 were previously on the watch list and are now identified as having investment need.
2 Standardizing our measurement of crowding required an improved methodology. An apples-to-apples comparison reveals that crowding need – based on the new methodology – actually increased over last year

KING COUNTY METRO TRANSIT 2016 SYSTEM EVALUATION 21
FIG. 3
Routes Needing Investment to Reduce Passenger Crowding
VashonIsland
Seattle
Kent
Bellevue
Auburn
Kirkland
Federal Way
Sammamish
Burien
SeaTac
Issaquah
Tukwila
Shoreline
Bothell
Kenmore
Covington
Enumclaw
Woodinville
Newcastle
Pacific
Snoqualmie
DesMoines
MapleValley
BlackDiamond
MercerIsland
Duvall
North Bend
Medina
LakeForest
Park
Algona
NormandyPark
ClydeHill
Carnation
Milton
Hunts Point
YarrowPoint
Redmond
BeauxArts
Renton
0 1 2
Miles
June 9, 2016
The information included on this map has been compiled by King County staff from a varietyof sources and is subject to change without notice. King County makes no representationsor warranties, express or implied, as to accuracy, completeness, timeliness, or rightsto the use of such information. This document is not intended for use as a survey productKing County shall not be liable for any general, special, indirect, incidental, orconsequential damages including, but not limited to, lost revenues or lost profitsresulting from the use or misuse of the information contained on this map. Any sale of thismap or information on this map is prohibited except by written permission of King County.
CF: GL2016_Overcrowding
Routes Needing Investmentto Reduce Passenger Crowding
Service Guidelines Report
Routes needing investmentKing County city
22 KING COUNTY METRO TRANSIT 2016 SYSTEM EVALUATION
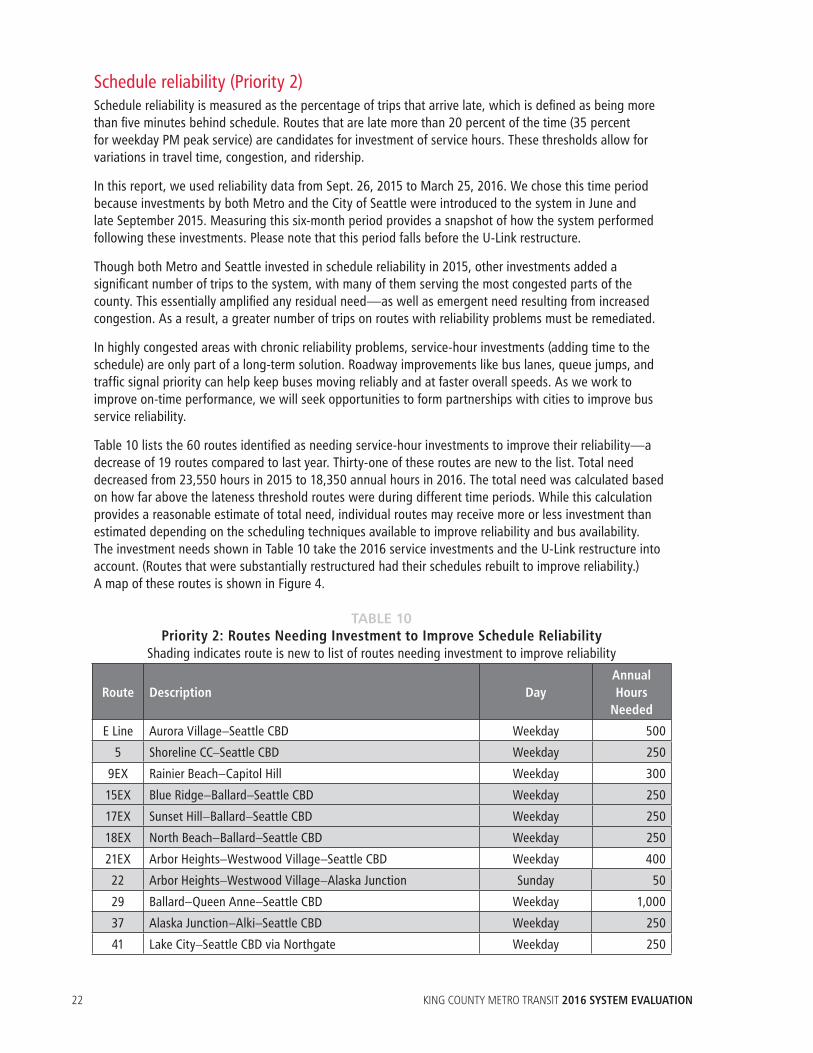
Schedule reliability (Priority 2)Schedule reliability is measured as the percentage of trips that arrive late, which is defined as being more than five minutes behind schedule. Routes that are late more than 20 percent of the time (35 percent for weekday PM peak service) are candidates for investment of service hours. These thresholds allow for variations in travel time, congestion, and ridership.
In this report, we used reliability data from Sept. 26, 2015 to March 25, 2016. We chose this time period because investments by both Metro and the City of Seattle were introduced to the system in June and late September 2015. Measuring this six-month period provides a snapshot of how the system performed following these investments. Please note that this period falls before the U-Link restructure.
Though both Metro and Seattle invested in schedule reliability in 2015, other investments added a significant number of trips to the system, with many of them serving the most congested parts of the county. This essentially amplified any residual need—as well as emergent need resulting from increased congestion. As a result, a greater number of trips on routes with reliability problems must be remediated.
In highly congested areas with chronic reliability problems, service-hour investments (adding time to the schedule) are only part of a long-term solution. Roadway improvements like bus lanes, queue jumps, and traffic signal priority can help keep buses moving reliably and at faster overall speeds. As we work to improve on-time performance, we will seek opportunities to form partnerships with cities to improve bus service reliability.
Table 10 lists the 60 routes identified as needing service-hour investments to improve their reliability—a decrease of 19 routes compared to last year. Thirty-one of these routes are new to the list. Total need decreased from 23,550 hours in 2015 to 18,350 annual hours in 2016. The total need was calculated based on how far above the lateness threshold routes were during different time periods. While this calculation provides a reasonable estimate of total need, individual routes may receive more or less investment than estimated depending on the scheduling techniques available to improve reliability and bus availability. The investment needs shown in Table 10 take the 2016 service investments and the U-Link restructure into account. (Routes that were substantially restructured had their schedules rebuilt to improve reliability.) A map of these routes is shown in Figure 4.
TABLE 10Priority 2: Routes Needing Investment to Improve Schedule Reliability
Shading indicates route is new to list of routes needing investment to improve reliability
Route Description DayAnnual Hours
Needed
E Line Aurora Village–Seattle CBD Weekday 500
5 Shoreline CC–Seattle CBD Weekday 250
9EX Rainier Beach–Capitol Hill Weekday 300
15EX Blue Ridge–Ballard–Seattle CBD Weekday 250
17EX Sunset Hill–Ballard–Seattle CBD Weekday 250
18EX North Beach–Ballard–Seattle CBD Weekday 250
21EX Arbor Heights–Westwood Village–Seattle CBD Weekday 400
22 Arbor Heights–Westwood Village–Alaska Junction Sunday 50
29 Ballard–Queen Anne–Seattle CBD Weekday 1,000
37 Alaska Junction–Alki–Seattle CBD Weekday 250
41 Lake City–Seattle CBD via Northgate Weekday 250

KING COUNTY METRO TRANSIT 2016 SYSTEM EVALUATION 23
Route Description DayAnnual Hours
Needed
55 Admiral District–Alaska Junction–Seattle CBD Weekday 300
57 Alaska Junction–Seattle CBD Weekday 250
60 Westwood Village–Georgetown–Capitol Hill Weekday 1,300
83 Seattle CBD–Ravenna Weekday 300
84 Seattle CBD–Madison Park–Madrona Saturday 50
99 International District–Waterfront Weekday 250
101 Renton TC–Seattle CBD Saturday, Sunday 150
102 Fairwood–Renton TC–Seattle CBD Weekday 250
111 Lake Kathleen–Seattle CBD Weekday 300
113 Shorewood–Seattle CBD Weekday 250
114 Renton Highlands–Seattle CBD Weekday 250
119EX Dockton–Seattle CBD via ferry Weekday 250
121 Highline CC -Burien TC–Seattle CBD via First Ave S Weekday 500
122Highline CC -Burien TC–Seattle CBD via Des Moines Memorial Dr S Weekday 400
123 Burien–Seattle CBD Weekday 250
128 Southcenter–Westwood Village–Admiral District Weekday 300
143 Black Diamond–Renton TC–Seattle CBD Weekday 600
148 Fairwood–Renton TC Weekday 250
150 Kent Station–Southcenter–Seattle CBD Weekday 250
153 Kent Station–Renton TC Weekday 250
157 Lake Meridian–Seattle CBD Weekday 300
158 Kent East Hill–Seattle CBD Weekday 400
159 Timberlane–Seattle CBD Weekday 250
164 Green River CC–Kent Station Weekday 250
168 Maple Valley–Kent Station Saturday 50
177 Federal Way–Seattle CBD Weekday 300
180 Auburn–SeaTac Airport–Burien TC Weekday 400
182 NE Tacoma–Federal Way TC Weekday 250
187 Federal Way TC–Twin Lakes Saturday 50
192 Star Lake–Seattle CBD Weekday 250
193EX Federal Way–First Hill Weekday 500
197 Twin Lakes–University District Weekday 500
217 Issaquah–Eastgate–Seattle CBD Weekday 250
221 Education Hill–Overlake–Eastgate Saturday 50
232 Duvall–Bellevue Weekday 250
244 Kenmore–Overlake Weekday 250
246 Eastgate–Factoria–Bellevue Weekday 250

24 KING COUNTY METRO TRANSIT 2016 SYSTEM EVALUATION
Route Description DayAnnual Hours
Needed
252 Kingsgate–Seattle CBD Weekday 250
269 Issaquah–Overlake Weekday 250
271 Issaquah–Bellevue–University District Saturday 50
303EX Shoreline–First Hill Weekday 500
304 Richmond Beach–Seattle CBD Weekday 250
308 Horizon View–Seattle CBD Weekday 250
309EX Kenmore–First Hill Weekday 250
312EX Bothell–Seattle CBD Weekday 600
330 Shoreline CC–Lake City Weekday 250
331 Shoreline CC–Kenmore Saturday 50
345 Shoreline CC–Northgate Saturday 50
355EX Shoreline CC–University District–Seattle CBD Weekday 600
Total 18,350
Routes that received investments in 2016 to improve schedule reliability are listed in Table 11.
TABLE 11Routes that Received 2016 Service Investments to Improve Schedule Reliability
Route Description Route Description
C Line Westwood Village–Alaska Junction– South Lake Union
D Line Crown Hill–Ballard–Seattle Center– Pioneer Square
E Line Aurora Village–Seattle CBD 8 Rainier Beach–Capitol Hill–Seattle Center
48 Mount Baker–University District–Loyal Heights
62 Sand Point–Green Lake–Seattle CBD
101 Renton TC–Seattle CBD 102 Fairwood–Renton TC–Seattle CBD
105 Renton Highlands–Renton TC 111 Lake Kathleen–Seattle CBD
114 Renton Highlands–Seattle CBD 128 Southcenter–Westwood Village– Admiral District
131 Burien TC–Highland Park–Seattle CBD 132 Burien TC–South Park–Seattle CBD
166 Kent Station–Burien TC 167 Renton–Newport Hills–University District
168 Maple Valley–Kent Station 177 Federal Way–Seattle CBD
178 South Federal Way–Seattle CBD 179 Twin Lakes–Seattle CBD
180 Auburn–SeaTac Airport–Burien TC 190 Redondo Heights–Seattle CBD
192 Star Lake–Seattle CBD 193 Federal Way–First Hill

KING COUNTY METRO TRANSIT 2016 SYSTEM EVALUATION 25
Route Description Route Description
216 Sammamish–Seattle CBD 218 Issaquah Highlands–Seattle CBD
219 Redmond–Sammamish–Seattle CBD 240 Bellevue–Newcastle–Renton
242 North City–Overlake 245 Kirkland–Overlake–Factoria
255 Brickyard–Kirkland TC–Seattle CBD 257 Brickyard–Seattle CBD
268 Redmond–Seattle CBD 269 Issaquah–Overlake
277 Juanita–University District 301EX Shoreline–First Hill
309 Kenmore–First Hill 311 Woodinville–Seattle CBD
316 Meridian Park–Seattle CBD 355EX Shoreline CC–University District–Seattle CBD
372EX Woodinville–Lake City–University District 601 Seattle CBD–Group Health (Tukwila)
Table 11 includes routes that received reliability investments as part of restructures. A restructure enables all involved routes to be reblocked, rescheduled, and in some cases split into two parts to improve reliability. In essence, service hours are “picked up” from the restructure area and “laid down” in a new way that serves customers better and more reliably.
The vast majority of the need is due to late arrivals on weekdays throughout the day, although there is a concentration in the peak periods. Routes 24, 33, 43, 105, 166, 178, 179, 190, 216, 240, 257, 268, 301EX, and 601 recently received reliability investments and are no longer identified as needing investment. Routes that were restructured in March and September 2016 are being monitored and will receive investment as needs are identified and resources are available.
Reliability substantially improved this year on several routes: 1, 4, 14, 56, 57, 119 Express, 143, 169, 208, 237, 277, 301, and 342. Reliability investments, schedule adjustments, the completion of construction projects, and traffic signal enhancements contributed to these improvements. Some of these routes are still targeted for reliability improvements as they do not meet standards.
PM peak reliability declined most dramatically (in descending order) on routes 308, 303 Express, 113, 107, 18 Express, 197, 148, 9 Express, and 249. Some of these routes, however, still meet performance standards.

26 KING COUNTY METRO TRANSIT 2016 SYSTEM EVALUATION
FIG. 4
Routes Needing Investment to Improve Schedule Reliability
VashonIsland
Seattle
Kent
Bellevue
Auburn
Kirkland
Federal Way
Sammamish
Burien
SeaTac
Issaquah
Tukwila
Shoreline
Bothell
Kenmore
Covington
Enumclaw
Woodinville
Newcastle
Pacific
Snoqualmie
DesMoines
MapleValley
BlackDiamond
MercerIsland
Duvall
North Bend
Medina
LakeForest
Park
Algona
NormandyPark
ClydeHill
Carnation
Milton
Hunts Point
YarrowPoint
Redmond
BeauxArts
Renton
0 1 2
Miles
Routes needing investmentKing County city
June 28, 2016
The information included on this map has been compiled by King County staff from a varietyof sources and is subject to change without notice. King County makes no representationsor warranties, express or implied, as to accuracy, completeness, timeliness, or rightsto the use of such information. This document is not intended for use as a survey productKing County shall not be liable for any general, special, indirect, incidental, orconsequential damages including, but not limited to, lost revenues or lost profitsresulting from the use or misuse of the information contained on this map. Any sale of thismap or information on this map is prohibited except by written permission of King County.
CF: GL2016_Reliability
Service Guidelines Report
Routes Needing Investmentto Improve Reliability

KING COUNTY METRO TRANSIT 2016 SYSTEM EVALUATION 27
Route productivityMetro must become more productive and carry more riders to help fulfill the expectation for public transportation set in the Puget Sound Regional Council’s Transportation 2040 plan—one reason why the Service Guidelines define highly productive services as an investment priority. Investing in highly productive routes in areas where there is latent demand for transit will result in higher ridership. A substantial portion of the growth needed to meet the Transportation 2040 service level (an additional 2.5 million annual service hours) will be on highly productive services.
Metro has demonstrated that investments in highly productive service lead to increased ridership. We will continue to invest in highly productive routes when we restructure service, form service partnerships with local jurisdictions, or have other opportunities.
Route productivity determines investments under priority 4. We assess each route’s productivity using two measures:
Rides per platform hour – total ridership divided by the total hours a bus travels from the time it leaves its base until it returns.
Passenger miles per platform mile – total miles traveled by all passengers divided by the total miles the bus operates from its base until it returns.
We analyze route productivity in peak, off-peak, and night periods by service type.
Highly productive routes are defined as those that perform in the top 25 percent of routes in the same service type on one or both measures in at least one time period; these routes are targeted for investment priority 4. In the current reporting period, of the 187 routes evaluated, 80 were in the top 25 percent in at least one time period on one or both productivity measures.
Routes below the productivity threshold are defined as those in the bottom 25 percent of routes in each service type that operate in the same time period. In the current reporting period, 92 routes were in the bottom 25 percent in at least one period on one or both route productivity measures. These routes are identified as candidates for reduction if and when Metro must make service cuts. The routes failing on both measures would be considered for reduction first.
Change in route productivity thresholds. The route productivity thresholds change in each annual report to reflect current network performance. From 2015 to 2016, route productivity and the productivity thresholds for urban routes decreased. This is a result of the Metro’s significant investment via the City of Seattle’s community mobility contract, which boosted both platform hours and miles on those routes. Ridership usually takes several years to grow, particularly after such large increases in service, so the productivity drop was neither unexpected nor unusual. Route productivity in the suburban category increased slightly, in part because of the separation of DART routes into their own category.
Route productivity threshold changes between 2015 and 2016 are shown in Tables 12 and 13. A full table showing route productivity is in Appendix C.
What changed?
A new service type for DART and shuttle service was added
DART routes are only compared to other like routes, reflecting the value they bring to the system.

28 KING COUNTY METRO TRANSIT 2016 SYSTEM EVALUATION
TABLE 122015–2016 Route Productivity Threshold Changes for Top 25%
Service Type Year
Peak Off Peak Night
Rides/ Platform
Hour
Passenger Miles/
Platform Mile
Rides/ Platform
Hour
Passenger Miles/
Platform Mile
Rides/ Platform
Hour
Passenger Miles/
Platform Mile
Suburban2016 27.0 8.8 27.3 9.5 17.8 6.22015* 26.7 8.4 27.0 8.3 18.4 6.3
Change 0.3 0.4 0.3 1.2 -0.6 -0.1
Urban2016 47.2 18.1 48.2 14.9 28.0 8.92015* 51.7 18.4 52.5 15.7 34.4 10.7
Change -4.5 -0.3 -4.3 -0.8 -6.4 -1.8
DART/Shuttle2016 13.4 2.5 15.3 3.5 12.4 2.22015* - - - - - -
Change - - - - - -
TABLE 13
2015–2016 Route Productivity Threshold Changes for Bottom 25%
Service Type Year
Peak Off Peak Night
Rides/ Platform
Hour
Passenger Miles/
Platform Mile
Rides/ Platform
Hour
Passenger Miles/
Platform Mile
Rides/ Platform
Hour
Passenger Miles/
Platform Mile
Suburban2016 14.9 4.6 14.5 4.6 10.5 3.12015* 13.4 3.6 14.0 3.7 11.1 2.8
Change 1.5 1.0 0.5 0.9 -0.6 -0.3
Urban2016 27.5 11.4 33.1 9.3 17.5 4.82015* 26.4 11.6 36.0 10.2 22.2 6.2
Change 1.1 -0.2 -2.9 -0.9 -4.7 -1.4
DART/Shuttle2016 8.4 1.3 9.3 2.2 12.4 2.2
2015* - - - - - -Change - - - - - -
* DART/Shuttle category did not exist in 2015. The 2015 thresholds shown for the Urban category correspond to the old Seattle core category, and the 2015 thresholds for the Suburban category correspond to the old Non-Seattle core category.

KING COUNTY METRO TRANSIT 2016 SYSTEM EVALUATION 29
Many services that performed well in 2015 continued to do so in 2016. Some notable groups of highly productive routes include:
RapidRide lines. Investments to improve frequency and quality of service have resulted in ridership growth in all RapidRide corridors. The A, B, D, E, and F Lines remain in the top 25 percent of routes on both performance measures in all time periods. The C Line is in the top 25 percent of routes on one or both performance measures in all time periods. Overall RapidRide ridership has grown 53 percent over the baseline of the regular routes they replaced.
Peak-only routes serving east King County park-and-rides. Several peak routes that provide service between downtown Seattle and Eastgate Park-and-Ride (and beyond), including routes 212, 216, 218, and 219, perform well on passenger miles per platform mile. This measure indicates service is well-used and buses are full along most of their routes. Routes 252, 255, 257, and 268 also perform well on this measure.
Routes that connect neighborhoods to Northgate. The network of all-day routes in north King County connects several neighborhoods with the high-performing Route 41, which connects Northgate to downtown Seattle. Routes 345, 346, and 347 provide neighborhood circulation as well as a connection to Northgate and perform well in the peak period.
Services connecting to Kent Station. Routes 164, 166, and 169 perform well all day and are among the top performers in the suburban category. Route 913, connecting Riverview to Kent Station, is a top-performing route in the DART category. Routes 128 and 180 connecting other south county destinations also performed well.
Seattle CBD to Capitol Hill routes. Routes 8, 10, 11, 12, and 49 serve two high-demand markets and stand out as top performers in the system. The March 2016 opening of Link light rail and Metro’s restructure will reduce these routes’ performance in the near term.
Commuter routes serving north Seattle. Routes 5, 17 Express, 18 Express, 74 Express, and 316 are the top-performing commuter routes. These highly successful routes operate in areas that have high demand, including Ballard, the University District, northeast Seattle, and Shoreline.
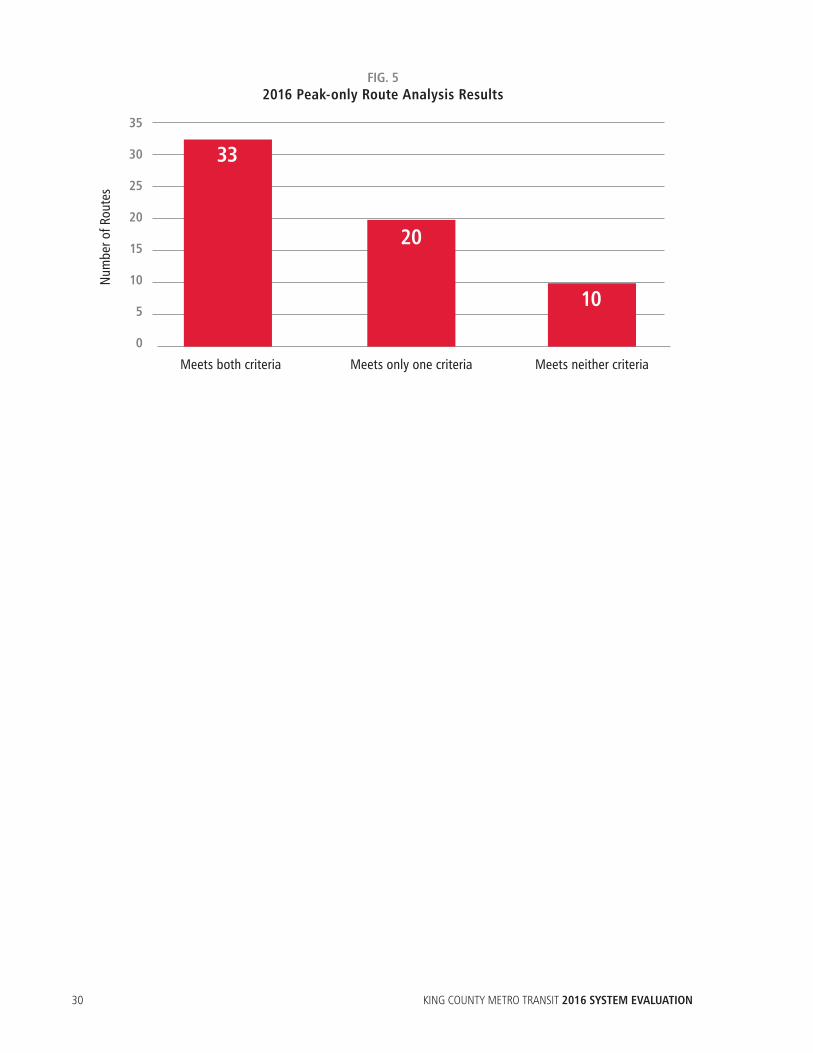
Peak analysis This analysis compares the rides per trip and the travel times of routes that operate only in the peak period to those that provide alternative local service. For a peak-only route to be justified, it must have at least 90 percent of the rides per trip that its alternative local service has (in the peak period), and must be at least 20 percent faster than its alternative. Information about whether routes meet one or both criteria is used in planning future service changes. Peak-only routes meeting neither criteria may be considered for change or restructuring to improve performance and to use resources more efficiently.
In 2016 Metro analyzed 63 peak-only routes. Eight peak-only routes included in the corridor analysis were not considered in the peak analysis; these routes are assumed to need all-day service, and the investments required to meet their targets are included in the priority 3 needs presented in Section 1, Corridor Analysis.
Results are largely similar to last year’s, with only a couple of routes changing status. The results of the peak analysis are in Figure 5 and Appendix D.
What changed?
No changes were made to the analysis, but peak routes now have an added layer of protection when Metro is forced to reduce service.
30 KING COUNTY METRO TRANSIT 2016 SYSTEM EVALUATION
FIG. 52016 Peak-only Route Analysis Results
35
30
25
20
15
10
5
0
Meets both criteria Meets only one criteria Meets neither criteria
Num
ber o
f Rou
tes
33
10
20

KING COUNTY METRO TRANSIT 2016 SYSTEM EVALUATION 31
SECTION 2
ALTERNATIVE SERVICES PERFORMANCE AND PROGRESS REPORT
This section presents the annual progress report for the King County Metro Transit Five-Year Implementation Plan for Alternatives to Traditional Transit Service Delivery (“Five Year Implementation Plan”), complying with the requirement for an annual report in King County Motion 13736. Data used for this section aligns with the timeframe of the data used to evaluate fixed-route service in this report. In June 2016, the recommendations made by the Service Guidelines Task Force, including those concerning the Alternative Services program, were incorporated into Metro’s Strategic Plan for Public Transportation and Service Guidelines (Ordinance 18301). Annual reporting for alternative services is combined with the annual Service Guidelines Report so readers get a comprehensive overview of services and performance.
Metro’s Alternative Services Program brings a range of mobility services to parts of King County that do not have the infrastructure, density, or land use to support traditional fixed-route bus service. This section reviews our alternative services plans and the performance of services that were operating in spring 2016.
The King County Council approved a $12 million budget for the 2015/2016 biennium for an alternative services demonstration program. The Council’s direction for this period is to mitigate the impact of services that were eliminated or reduced in September 2014, to “right-size” service in areas identified in the five-year implementation plan, and to implement projects that complement existing fixed-route or DART service.
In the 2015 Service Guidelines Report, we reported the launch of four Community Shuttle services--two in the Snoqualmie Valley and one each on Mercer Island and in Burien. In 2015 and 2016 we have monitored ridership closely and adjusted schedules where necessary. We have worked closely with the partner communities to continue promoting these services to build ridership. Performance of these shuttle routes is reported below.
One of the most significant accomplishments of the Alternative Services Program in 2015/2016 has been the successful launch of three innovative service solutions—Real-Time Rideshare, Community Van, and TripPool. These service solutions are completely new concepts that leverage Metro’s long-standing success in rideshare operations in combination with emerging mobile technologies. We have spent the past year refining the service specifications, building solid community partnerships, developing the market, building customer awareness, and recruiting volunteer drivers.

32 KING COUNTY METRO TRANSIT 2016 SYSTEM EVALUATION
The other focus of 2015/2016 has been to conduct community outreach in partner communities to learn about transportation needs and gaps and develop customized service solutions to meet the identified needs. We have continued outreach in southeast King County and initiated new processes with Vashon Island, Bothell and Woodinville, Kirkland and Kenmore, Sammamish, and Lake Forest Park and Shoreline.
Annual shuttle performance reportMetro collects and analyzes ridership data for alternative services solutions. The performance of routes 629 (started in 2013), 628, 630, and 631 are described in Table 14. Note the reporting periods have changed from 2015 to 2016 to better align with the reporting timelines of other Metro services. Changes to the reporting period are reflected in performance metrics because ridership is often seasonal, decreasing during the winter and summer months when many riders are on vacation.
TABLE 14Shuttle Performance
RouteCost per
vehicle trip (2015)***
Cost per vehicle trip
(2016)**
Cost per ride (2015)
Cost per ride (2016)**
Rides per
hour (2015)
Rides per hour (2016)**
628 $45.34 $47.25 $20.39 $19.91 2.87 3.04
629 $55.01* $64.51* $12.96* $15.70* 2.55 2.51
630 n/a $105.96 n/a $9.19 n/a 10.18
631 n/a $48.27 n/a $11.30 n/a 8.35
* After the Snoqualmie Tribe contribution of $50,000/year which is paid in monthly installments directly to Snoqualmie Valley Transit.
** October 2015-March 2016
*** Route 629 reporting period was January–June 2015, Route 628 reporting period was mid-February through June 2015
Snoqualmie – Route 628 In September 2014, Metro routes 215 and 209 were eliminated because of their low performance, in accordance with the service guidelines. This made the Upper Snoqualmie Valley (North Bend, Snoqualmie, and Issaquah) a candidate for an alternative services project to mitigate the loss of these routes. In February 2015, in partnership with the community, Metro launched Route 628 to serve the corridor between North Bend, Snoqualmie, and Issaquah Highlands during the weekday peak period.
Route 628 offers weekday service in the morning and evening between North Bend and the Issaquah Highlands Park-and-Ride, with flexible service areas in two neighborhoods in Issaquah Highlands. Performance on Route 628 has improved, with rides per hour going up from 2.87 in 2015 to 3.04 in 2016. Cost per ride has decreased from $20.39 in 2015 to $19.91 in 2016. Cost per vehicle trip increased from $45.34 in 2015 to $47.25. Metro pays the contractor a flat hourly operating rate, so the increase in cost per vehicle trip can be attributed to the change in reporting period (differences in the number of service days etc.).

KING COUNTY METRO TRANSIT 2016 SYSTEM EVALUATION 33
Snoqualmie Valley – Route 629 The Snoqualmie Valley Shuttle, Route 629, was created in partnership with the Snoqualmie Tribe, which contributes $50,000 a year to its operation. It is operated by Snoqualmie Valley Transportation (SVT), a local nonprofit organization. The shuttle serves Duvall, Carnation, Fall City, Snoqualmie, and North Bend, with flexible service areas at the north and south ends of the route.
In 2016, Route 629 provided 2.51 rides per hour at a cost of $15.70 per boarding compared to 2.55 rides per hour at a cost of $12.96 per boarding in 2015 (after the Snoqualmie Tribe’s contribution). Part of this decrease in performance can be attributed to a single, low-performing month (December 2015) that greatly affected data tied to ridership.
The cost per vehicle trip increased on Route 629 from $55.01 in 2015 to $64.51 in 2016 (after the Snoqualmie Tribe contribution). This is because the invoiced costs in the reporting period of October 2015 to March 2016 were higher than the invoiced costs of January to June 2015. Included in SVT invoice costs are exact maintenance, training, marketing, and equipment costs, which vary significantly month to month. For example, SVT invoiced Metro more than $5,000 in January 2016 for one-time ADA safety equipment upgrades and marketing expenses.
Mercer Island – Route 630 In September 2014, Metro routes 202 and 205 were deleted because of their low performance in accordance with the service guidelines. The Mercer Island community was identified as a mitigation candidate for alternative services because of the lack of service in the areas where routes were eliminated.
In partnership with the cities of Mercer Island and Seattle, Community Shuttle Route 630 was launched on June 8, 2015. This one-way peak-only service connects Mercer Island to downtown Seattle and First Hill. Route 630 is made possible through a financial partnership between the City of Mercer Island, the City of Seattle, and Metro, and is operated by Hopelink. With 10 daily trips, Route 630 primarily serves weekday commuters with a flexible service area along Island Crest Way. A new leased park-and-ride lot at the Congregational Church provides additional parking spaces to improve access to transit service. In 2016, Route 630 provided 10.18 rides per hour at a cost of $9.19 per ride. The cost per vehicle trip was $105.96.
Burien – Route 631 After Metro Route 139 was deleted in September 2014 because of low performance, creating a midday service gap, Burien was identified as a mitigation candidate for alternative services. In partnership with the community, the Burien Community Shuttle Route 631 was launched on June 8, 2015. This service provides off-peak weekday local circulation and connections to the regional transit network.
On weekdays, Route 631 makes a clockwise loop serving Burien Transit Center, Highline Medical Center, and Gregory Heights. Route 631 makes 17 trips between 8 a.m. and 5 p.m. and includes a flexible service area that allows residents to book a pick-up in advance. This service is made possible through an in-kind partnership between the City of Burien and Metro. In 2016, Route 631 provided 8.35 rides per hour at a cost of $11.30 per boarding. The cost per vehicle trip is $48.27.

34 KING COUNTY METRO TRANSIT 2016 SYSTEM EVALUATION
2016 servicesThe following services launched in 2016. Metro is working to build performance evaluation systems for these mobility products.
Redmond Real-Time Rideshare Building on a commute needs assessment conducted in 2014, Metro is partnering with the City of Redmond to pilot a new flexible ridesharing promotion targeted at the southeast Redmond and Willows Road employment centers. The Redmond Real-Time Rideshare project involves collaboration with app vendor iCarpool. The iCarpool app allows drivers to offer and accept rides in real-time and receive cashless reimbursement for gas from riders.
Redmond Real-Time Rideshare is a strategy to promote coordinated ridesharing in real-time. Metro and Redmond have developed an incentive structure, Emergency Ride Home benefit, and ad campaign to foster real-time ridesharing in Redmond. The app launched in January 2016 and Metro, Redmond, and the vendor continue collaborating to build the pool of potential riders and drivers.
Community Van Duvall was identified as a candidate community in the 2012 Five Year Implementation Plan. As the result of work with community stakeholders, Duvall became the first community to start a Community Van service—which includes a Community Transportation Hub—in June 2016. The Duvall Community Van addresses the need for local midday, evening, and weekend mobility options. Vans are driven by volunteers and coordinated by a paid community transportation coordinator. Metro provides the vans, fuel, maintenance, insurance, and funding for the part-time coordinator’s salary. This service is now open to the public and Metro will monitor ridership, vehicle use, and costs, which will be reported in the 2017 Service Guidelines Report.
TripPool As further mitigation of the September 2014 deletion of Mercer Island bus routes, Metro and the City of Mercer Island partnered to pilot a TripPool project to address commuter needs and park-and-ride capacity issues. TripPool is a “first-mile connection” pilot program that provides a rideshare connection between home neighborhood and transit. Metro provides commuter vans that make one round trip each work day to a park-and-ride or transit center where they have reserved parking space. Volunteer drivers pick up and drop off registered riders along the way. TripPool trip requests, pick-up locations, and fares are coordinated by riders and drivers on their smartphones through the free mobile app, iCarpool. The Mercer Island TripPool service was launched in spring 2015. This service is now open to the public and Metro will monitor ridership, vehicle utilization, and costs, which will be reported in the 2017 Service Guidelines Report.
Redmond LOOP The Redmond LOOP is a unique hybrid solution that combines the smaller Community Van vehicles with the paid driver and route design of a Community Shuttle. The Redmond LOOP makes nine daily trips, traveling clockwise from the Redmond Transit Center to Bella Bottega, north along 160th Ave NE, east along 104th, south on Avondale to Bear Creek Park-and-Ride, west on Redmond Way and back to the Redmond Transit Center via NE 166th. The service has one flexible service area on Education Hill and four flexible destinations for which riders may arrange a drop-off or pick-up. The Redmond LOOP is operated by an employee of the City of Redmond’s sub-contractor, Hopelink. This project was made possible through a financial partnership with the City of Redmond. A soft launch of the Redmond LOOP started June 30, 2016. Full launch will occur with the September 2016 service change.

KING COUNTY METRO TRANSIT 2016 SYSTEM EVALUATION 35
Ongoing projects
3 Ordinance 18110 directs the Alternative Services program to develop a “plan for implementation of an alternative services program providing service between the campus of the University of Washington-Bothell and Cascadia Community College and the cities of Woodinville and Bothell, which shall be designed to address travel needs of college students and employees; individuals living or working in the cities of Woodinville and Bothell; and other transit consumers.”
Southeast King County Southeast King County was identified as a candidate for alternative services in the Five-Year Implementation Plan. Outreach began in May 2015. Working with community stakeholders, the Alternative Services team developed a set of concepts to improve access and mobility in southeast King County, including fixed-route transit service changes, an Emergency Ride Home Program, a Community Van program, and Rideshare promotions. The fixed-route transit service changes are being phased in, starting in September 2015 with an additional evening trip on Route 186 leaving Auburn Station at 7 p.m. In March 2016, 2,062 service hours were added to Route 915 to improve frequency from every 90 minutes to every 60 minutes between Enumclaw and Auburn. Metro is negotiating service partnerships to implement the other solutions.
Vashon Island Vashon Island was identified as a candidate for alternative services in the Five-Year Implementation Plan. Outreach began in September 2015 and continued through summer 2016. The Vashon Island Stakeholder Working Group has evaluated different concepts for implementation, including Community Van, Community Hub, Real-Time Ridesharing, and Open Door Access.
Bothell-Woodinville Bothell and Woodinville were identified as candidate communities for alternative services in legislation adopted by the County Council in September 2015.3 Outreach began in the first quarter of 2016. A suite of alternative service concepts was developed during the second quarter and include Community Van, Real-Time Rideshare, Commuter Van, an education campaign, and a promotional partnership between the Woodinville Tourism District and the transportation network company industry. Metro is identifying partners to support implementation.
Kenmore-Kirkland In September 2014, three Metro routes were deleted because of their low performance, in accordance with the service guidelines. These routes had served residential areas of Kenmore and the Juanita/Finn Hill area of Kirkland, and these areas were selected as mitigation candidates for alternative service. Two separate projects have been defined and are running in parallel: one in north Kenmore to mitigate the loss of Route 306, and one in south Kenmore and Kirkland to mitigate the loss of routes 260 and DART 935. Community outreach took place in summer 2016 in partnership with the cities of Kirkland and Kenmore.
Sammamish In September 2014, Metro deleted poorly performing DART Route 927, which had served Sammamish, Issaquah, and the Klahanie area (which has since been incorporated into the City of Sammamish). Because of the lack of underlying service in Klahanie, the City of Sammamish was identified as a candidate for mitigation candidate through alternative services. Metro and the City of Sammamish staff will conduct community outreach in fall 2016.
Lake Forest Park, Shoreline The cities of Lake Forest Park and Shoreline were impacted by the September 2014 reductions in Route 331 evening service. Because these communities have no underlying evening service, they were identified as candidates for mitigation projects. Metro has begun discussions with the jurisdictions about working together on an alternative services project.
Community-generated projects The 2015/2016 Biennial Budget Ordinance 17941 identified alternative services projects that would complement the existing fixed-route bus and DART network as the third program priority. Projects will be selected from community-generated project ideas resulting from a call for letters of interest that will be advertised in the beginning of the fourth quarter of 2016. We intend to select candidate communities by the end of 2016 so we can begin community engagement in early 2017.
36 KING COUNTY METRO TRANSIT 2016 SYSTEM EVALUATION
SECTION 3
POTENTIAL CHANGES TO THE SERVICE GUIDELINES AND STRATEGIC PLAN
Alternative Services performance measurementOrdinance 18301, approving updates to Metro’s Strategic Plan for Public Transportation and Service Guidelines, directs Metro to provide updates to the Regional Transit Committee (RTC) on the implementation of the Alternative Services Program. A third quarter 2016 update was provided to RTC in September. The fourth quarter 2016 update will be delivered in November alongside this report and will include a schedule and process for evaluating the prioritization criteria contained in the service guidelines to aid in prioritizing projects when the demand for alternative services exceeds the revenues necessary to fund said services. Throughout 2017, quarterly updates will include a discussion of the schedule and process for evaluating the prioritization criteria. Recommended options for prioritization criteria resulting from this process will be incorporated into the fourth quarter update.
The Alternative Services Program is primarily community-driven and depends on close partnerships between Metro and local governments. The program conducts substantial outreach to understand community needs and tailors mobility solutions to suit. A wide array of products and services can be provided, each with its own characteristics and goals. A performance measurement system must be sufficiently flexible and adaptable to accommodate wide-ranging objectives and service characteristics.
Metro has developed pilot product performance measures for evaluating demonstration services that are currently operating or in planning. As the program matures, and assuming it becomes a permanently funded program, these or other performance measures may be formally incorporated into the Service Guidelines. The Service Guidelines Report would be the means for reporting annually on alternative services performance, as required by Motion 13736.

KING COUNTY METRO TRANSIT 2016 SYSTEM EVALUATION 37
Integration with Metro’s long-range planMETRO CONNECTS presents a vision for public transportation in King County that provides more mobility to more people. This vision was developed in close coordination with cities and stakeholders throughout the county. It defines two future transit networks, one for 2025 and another for 2040. Both of these networks differ in substantial ways from our current service network.
In order to achieve this vision, Metro’s resources would have to grow and the service network would have to evolve. METRO CONNECTS, if approved, will take shape through a series of rolling six-year implementation programs. These six-year plans will review existing revenues, existing needs, and the long-range plan network, and then develop projects in conjunction with cities and affected communities. Metro will lead this collaborative process to reconcile these projects with needs identified through the annual service guidelines assessment. Major drivers of these implementation programs will include:
the expansion of Link light rail
efforts to further integrate service with Sound Transit and, at the peripheries of the county, Community Transit and Pierce Transit
expansion of the RapidRide program
changes to roadway networks
changes in land-use patterns as reflected in local governments’ comprehensive plans.
As these processes proceed, and assuming service change proposals are approved by the King County Council, the network of corridors defined in the Service Guidelines will necessarily evolve and change. These types of network changes have occurred in the past, and Metro has continued to evaluate corridors in the context of the network in place after each restructure.
Metro will continue using the Service Guidelines to determine investment needs for each corridor to inform short- and long-range service planning.

A-38 KING COUNTY METRO TRANSIT 2016 SYSTEM EVALUATION
APPENDICESAppendix A: Map of Low-Income and Minority Tracts
Appendix B: Map of Activity Centers and Regional Growth/Manufacturing Centers
Appendix C: Route Productivity Data
Appendix D: Peak Analysis Results
Appendix E: Route Reliability
Appendix F: 2015 Service Changes
Appendix G: Route-level Ridership
Appendix H: Corridor Analysis of All-Day Network

KING COUNTY METRO TRANSIT 2016 SYSTEM EVALUATION A-39
Appendix A: King County Low-Income and Minority Census Tracts
June 28, 2016
The information included on this map has been compiled by King County staff from a varietyof sources and is subject to change without notice. King County makes no representationsor warranties, express or implied, as to accuracy, completeness, timeliness, or rightsto the use of such information. This document is not intended for use as a survey productKing County shall not be liable for any general, special, indirect, incidental, orconsequential damages including, but not limited to, lost revenues or lost profitsresulting from the use or misuse of the information contained on this map. Any sale of thismap or information on this map is prohibited except by written permission of King County.
CF: GL2016_LowInc&Min
0 1 2
Miles
Service Guidelines Report
King County Low Income &Minority Census Tracts
L a keWa sh in g to n
La
ke
Sa
mm
a
mi s
h
Census Tracts*
*2014 Geography2010 - 2014 ACS data
Low Income
Both low incomeand minorityNeither low incomenor minority
Minority
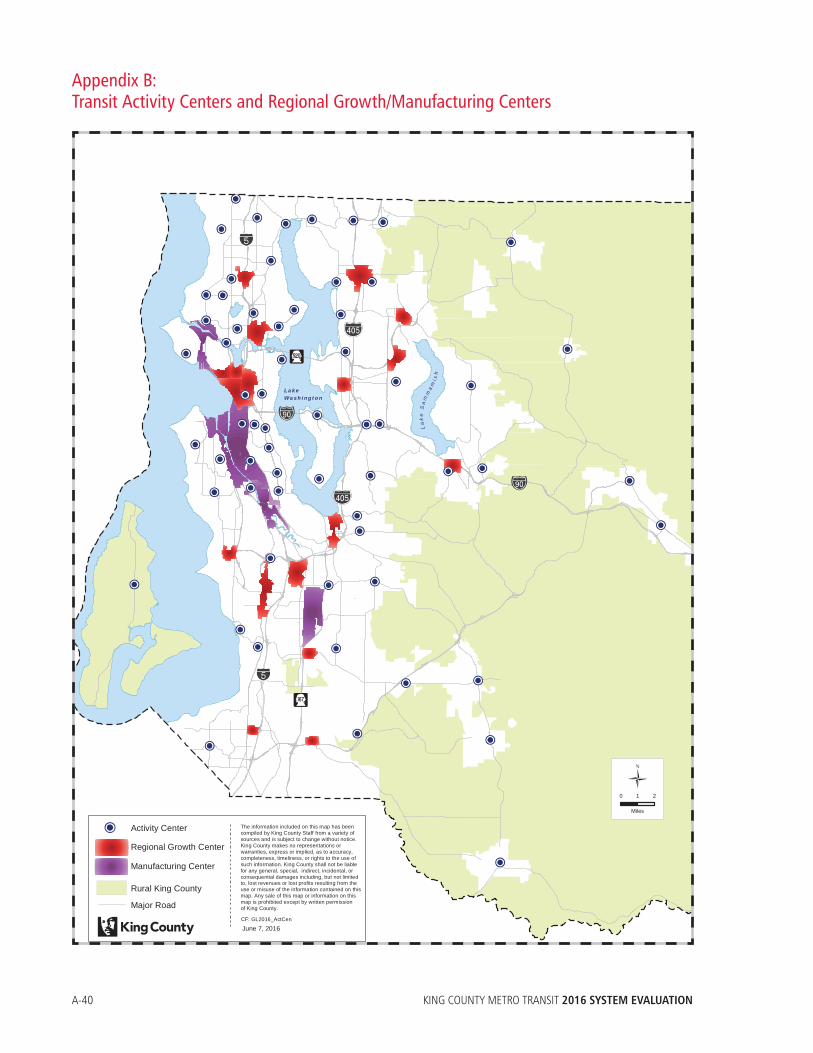
A-40 KING COUNTY METRO TRANSIT 2016 SYSTEM EVALUATION
Appendix B: Transit Activity Centers and Regional Growth/Manufacturing Centers
La
ke
Sa
mm
am
i sh
La k eWa s h i ng t o n
0 1 2
Miles
Activity Center
Regional Growth Center
Manufacturing Center
Rural King County
The information included on this map has beencompiled by King County Staff from a variety ofsources and is subject to change without notice.King County makes no representations orwarranties, express or implied, as to accuracy,completeness, timeliness, or rights to the use ofsuch information. King County shall not be liablefor any general, special, indirect, incidental, orconsequential damages including, but not limitedto, lost revenues or lost profits resulting from theuse or misuse of the information contained on thismap. Any sale of this map or information on thismap is prohibited except by written permissionof King County.Major RoadCF: GL2016_ActCen
June 7, 2016

KING COUNTY METRO TRANSIT 2016 SYSTEM EVALUATION A-41
Appendix C: Route Productivity DataSuburban Routes
Route Description
Peak Off Peak Night
Rides/ Platform
Hour
Passenger Miles/
Platform Mile
Rides/ Platform
Hour
Passenger Miles/
Platform Mile
Rides/ Platform
Hour
Passenger Miles/
Platform Mile
22 Arbor Heights–Westwood Village– Alaska Junction 16.6 3.4 9.2 2.0 4.3 1.2
50 Alki–Columbia City–Othello Station 24.8 5.8 22.4 5.6 9.0 2.2
105 Renton Highlands–Renton TC 30.8 7.9 27.0 7.9 15.3 4.6
107 Renton TC–Rainier Beach 24.3 6.3 22.7 6.3 12.7 3.5
118 Tahlequah–Vashon 10.9 2.2 10.6 1.6 9.1 2.3
119 Dockton–Vashon 14.8 1.6 9.4 1.1
128 Southcenter–Westwood Village–Admiral District 31.0 9.9 32.0 10.4 14.0 4.5
148 Fairwood–Renton TC 14.4 5.0 16.5 6.1 18.2 6.9
153 Kent Station–Renton TC 19.8 5.8
154 Tukwila Station–Boeing Industrial 18.4 4.5
156 Southcenter–SeaTac Airport–Highline CC 18.9 5.6 18.1 6.5 10.4 3.6
164 Green River CC–Kent Station 42.7 12.5 42.7 16.0 24.7 7.4
166 Kent Station–Burien TC 25.9 9.3 27.6 10.0 16.3 5.4
168 Maple Valley–Kent Station 24.6 7.6 25.1 8.5 18.4 4.9
169 Kent Station–East Hill–Renton TC 41.2 16.5 40.3 15.8 24.8 9.2
180 Auburn–SeaTac Airport–Burien TC 33.3 11.1 32.1 12.1 15.6 6.3
181 Twin Lakes P&R–Green River CC 26.2 8.3 25.5 9.0 15.1 3.9
182 NE Tacoma–Federal Way TC 14.9 3.8 20.1 6.3
183 Federal Way–Kent Station 20.5 6.4 20.8 9.9
186 Enumclaw–Auburn Station 10.8 2.8
187 Federal Way TC–Twin Lakes 25.1 6.1 28.7 7.6 13.9 3.0
200 Downtown Issaquah–North Issaquah 10.3 2.2
201 South Mercer Island–Mercer Island P&R via Mercer Way 3.8 0.6
204 South Mercer Island–Mercer Island P&R via Island Crest 11.2 2.3 10.4 2.7
208 Issaquah–North Bend 9.4 5.6 8.9 5.7 2.5 1.4
221 Education Hill–Overlake–Eastgate 19.6 5.5 19.1 5.0 9.8 2.1
224 Duvall–Redmond TC 7.8 3.3 7.9 3.5
226 Eastgate–Crossroads–Bellevue 27.3 7.1 26.3 6.3 12.9 3.2
232 Duvall–Bellevue 18.4 7.1
234 Kenmore–Kirkland TC–Bellevue 22.9 8.0 17.2 5.8 11.6 3.6
235 Kingsgate–Kirkland TC–Bellevue 21.2 7.0 15.9 6.1 10.6 3.7
236 Woodinville–Totem Lake–Kirkland 8.3 2.3 8.3 2.5

A-42 KING COUNTY METRO TRANSIT 2016 SYSTEM EVALUATION
Route Description
Peak Off Peak Night
Rides/ Platform
Hour
Passenger Miles/
Platform Mile
Rides/ Platform
Hour
Passenger Miles/
Platform Mile
Rides/ Platform
Hour
Passenger Miles/
Platform Mile
237 Woodinville–Bellevue 21.3 9.1
238 Bothell–Totem Lake–Kirkland 11.4 3.2 12.6 3.8
240 Bellevue–Newcastle–Renton 26.5 10.4 23.5 10.4 13.7 6.5
241 Eastgate–Factoria–Bellevue 23.5 5.6 16.2 4.2 10.0 2.5
242 North City–Overlake 16.7 9.3
244 Kenmore–Overlake 12.8 4.7
245 Kirkland–Overlake–Factoria 26.9 7.9 23.1 6.8 15.2 3.7
246 Eastgate–Factoria–Bellevue 13.7 3.0 12.1 2.7
248 Avondale–Redmond TC–Kirkland 21.0 5.8 17.8 4.9 10.3 2.7
249 Overlake–South Kirkland–South Bellevue 18.5 4.5 13.2 3.4
269 Issaquah–Overlake 11.4 4.6
330 Shoreline CC–Lake City 23.8 6.1 32.0 10.0
331 Shoreline CC–Kenmore 17.9 5.8 19.6 5.5
342 Shoreline–Bellevue TC–Renton 19.4 10.6
345 Shoreline CC–Northgate 35.6 8.7 35.4 8.5 11.5 4.3
346 Aurora Village–Northgate 33.5 9.6 26.9 8.1 11.7 4.6
347 Mountlake Terrace–Northgate 27.7 7.7 24.0 6.5 18.2 6.0
348 Richmond Beach–Northgate 28.0 6.5 25.8 6.2 17.4 5.3
A Line Federal Way–Tukwila 55.1 15.3 58.9 18.7 38.7 11.1
B Line Bellevue–Crossroads–Redmond 43.5 12.2 36.7 10.4 25.8 6.4
F Line Renton–Burien 31.4 9.3 33.9 11.1 21.9 6.7
Fall 2015 Thresholds: Suburban Routes Peak Off Peak Night
Bottom 25% 14.9 4.6 14.5 4.6 10.5 3.1
Top 25% 27.0 8.8 27.3 9.5 17.8 6.2

KING COUNTY METRO TRANSIT 2016 SYSTEM EVALUATION A-43
DART/Shuttles
Route Description
Peak Off Peak Night
Rides/ Platform
Hour
Passenger Miles/
Platform Mile
Rides/ Platform
Hour
Passenger Miles/
Platform Mile
Rides/ Platform
Hour
Passenger Miles/
Platform Mile
901DART Mirror Lake–Federal Way TC 15.2 2.9 15.4 2.4 12.4 2.2
903DART Twin Lakes–Federal Way TC 10.3 1.9 14.5 3.2
906DART Fairwood–Southcenter 13.1 5.2 13.4 6.6
907DART Enumclaw–Renton TC 3.4 1.3 5.2 2.6
908DART Renton Highlands–Renton TC 9.7 1.7 6.9 1.7
910DART North Auburn–SuperMall 11.1 1.8
913DART Kent Station–Riverview 14.8 2.2
914DART Kent–Kent East Hill 18.5 3.5
915DART Enumclaw–Auburn Station 19.7 5.2
916DART Kent–Kent East Hill 14.9 3.5
917DART Pacific–Auburn 13.4 2.5 8.8 2.1
930DART Kingsgate–Redmond 8.4 1.2
931DART Bothell–Redmond 4.9 1.2
Fall 2015 Thresholds: DART/Shuttles Peak Off Peak Night
Bottom 25% 8.4 1.3 9.3 2.2 12.4 2.2
Top 25% 13.4 2.5 15.3 3.5 12.4 2.2

A-44 KING COUNTY METRO TRANSIT 2016 SYSTEM EVALUATION
Urban Routes
Route Description
Peak Off Peak Night
Rides/ Platform
Hour
Passenger Miles/
Platform Mile
Rides/ Platform
Hour
Passenger Miles/
Platform Mile
Rides/ Platform
Hour
Passenger Miles/
Platform Mile
1* Kinnear–Seattle CBD 50.4 12.8 36.8 8.5 19.1 4.9
2* West Queen Anne–Seattle CBD– Madrona Park 53.4 11.8 48.2 10.1 23.9 5.6
3* North Queen Anne–Seattle CBD– Madrona Park 59.0 11.7 48.5 9.9 20.7 4.5
4* East Queen Anne–Seattle CBD– Judkins Park 46.5 10.5 35.0 7.5 18.4 4.5
5* Shoreline CC–Seattle CBD 53.7 18.5 43.8 15.1 23.1 7.7
5EX* Shoreline CC–Seattle CBD 40.0 14.6
7* Rainier Beach–Seattle CBD 47.2 13.7 53.6 15.2 29.9 10.1
8* Seattle Center–Capitol Hill–Rainier Beach 52.3 11.5 40.0 9.7 24.1 5.6
9EX* Rainier Beach–Capitol Hill 34.8 9.6 44.5 14.3
10* Capitol Hill–Seattle CBD 55.4 10.4 48.5 9.2 28.0 5.6
11* Madison Park–Seattle CBD 51.5 11.5 43.3 8.9 25.5 4.5
12* Interlaken Park–Seattle CBD 57.5 10.4 36.3 6.8 11.4 2.7
13* Seattle Pacific University–Queen Anne–Seattle CBD 51.5 13.2 51.4 12.4 27.9 6.9
14* Mount Baker–Seattle CBD 47.4 10.2 39.6 8.2 19.5 4.2
15EX Blue Ridge–Ballard–Seattle CBD 44.6 17.6
16 Northgate TC–Wallingford–Seattle CBD 34.6 12.5 25.2 8.9 13.5 4.6
17EX Sunset Hill–Ballard–Seattle CBD 51.8 19.2
18EX* North Beach–Ballard–Seattle CBD 54.9 20.4
19* West Magnolia–Seattle CBD 27.9 8.1
21* Arbor Heights–Westwood Village– Seattle CBD 41.2 15.4 28.3 10.6 17.2 6.6
21EX* Arbor Heights–Westwood Village– Seattle CBD 33.2 13.7
24* Magnolia–Seattle CBD 46.6 12.9 27.1 9.3 13.8 4.4
25 Laurelhurst–University District–Seattle CBD 18.9 4.5 19.0 4.5
26* East Green Lake–Wallingford–Seattle CBD 51.9 14.4 33.4 9.6 17.5 5.9
26EX* East Green Lake–Wallingford–Seattle CBD 50.6 16.7
27* Colman Park–Leschi Park–Seattle CBD 28.4 7.2
28* Whittier Heights–Ballard–Seattle CBD via Leary Ave NW 48.2 11.5 29.2 8.9 16.3 4.3
28EX* Broadview–Ballard–Seattle CBD via Leary Ave NW 42.4 13.6

KING COUNTY METRO TRANSIT 2016 SYSTEM EVALUATION A-45
Route Description
Peak Off Peak Night
Rides/ Platform
Hour
Passenger Miles/
Platform Mile
Rides/ Platform
Hour
Passenger Miles/
Platform Mile
Rides/ Platform
Hour
Passenger Miles/
Platform Mile
29 Ballard–Queen Anne–Seattle CBD 36.6 7.9
30 Sand Point–University District 19.4 4.2
31* University District–Fremont–Magnolia 36.5 8.2 33.2 8.0
32* University District–Fremont–Seattle Center 43.2 13.2 35.5 10.8 25.9 6.6
33* Discovery Park–Seattle CBD 44.8 12.4 26.4 6.5 14.1 4.0
36 Othello Station–Beacon Hill–Seattle CBD 47.2 12.9 49.2 13.1 23.0 6.1
37* Alaska Junction–Alki–Seattle CBD 19.3 8.5
40* Northgate TC–Ballard–Seattle CBD via Leary Av NW 45.9 13.4 37.6 11.4 19.8 6.5
41* Lake City–Seattle CBD via Northgate 59.7 27.3 48.7 22.6 27.4 13.3
43* University District–Capitol Hill–Seattle CBD 52.4 14.7 41.1 10.6 24.8 7.1
44* Ballard–Wallingford–Montlake 61.2 17.5 46.0 12.0 32.8 8.8
47* Summit–Seattle CBD 33.0 6.8 20.6 4.2
48* Mount Baker–University District–Loyal Heights 49.1 14.1 45.0 13.3 25.8 7.2
49* University District–Capitol Hill– Seattle CBD 60.9 20.7 48.5 14.8 36.3 10.6
55* Admiral District–Alaska Junction– Seattle CBD 32.1 13.6
56* Alki–Seattle CBD 35.5 14.1
57* Alaska Junction–Seattle CBD 36.9 15.4
60* Westwood Village–Georgetown–Capitol Hill 39.4 11.8 35.2 10.9 15.8 4.6
64EX* Lake City–First Hill 29.9 10.0
65* Lake City–University District 35.5 8.8 40.0 9.0 23.8 6.9
66EX Northgate TC–Eastlake–Seattle CBD 45.5 14.3 30.6 9.7 15.9 4.6
67* Northgate TC–University District 42.2 10.5 43.4 11.7 29.0 6.8
68 Northgate TC–Ravenna–University District 42.3 10.2 45.4 9.9
70* University District–Seattle CBD 51.6 15.6 32.8 9.7 14.1 4.6
71 Wedgwood–University District– Seattle CBD 61.0 21.1 52.0 19.7 25.5 8.2
72 Lake City–University District– Seattle CBD 61.9 21.8 53.8 18.7 25.7 8.4
73* Jackson Park–University District– Seattle CBD 60.6 23.6 53.7 19.9 28.0 10.1
74EX Sand Point–Seattle CBD 54.8 18.8
75 Northgate TC–Lake City–Seattle CBD 45.1 11.2 47.0 11.5 31.7 7.7
76* Wedgwood–Seattle CBD 36.4 13.8

A-46 KING COUNTY METRO TRANSIT 2016 SYSTEM EVALUATION
Route Description
Peak Off Peak Night
Rides/ Platform
Hour
Passenger Miles/
Platform Mile
Rides/ Platform
Hour
Passenger Miles/
Platform Mile
Rides/ Platform
Hour
Passenger Miles/
Platform Mile
77EX North City–Seattle CBD 45.1 22.2
82* Seattle CBD–Greenwood 10.3 5.9
83* Seattle CBD–Ravenna 13.8 7.2
84* Seattle CBD–Madison Park–Madrona 8.0 1.9
98 South Lake Union Streetcar 58.6 9.9 40.5 6.8 13.6 2.3
99 International District–Waterfront 22.7 5.8 11.7 2.6
101* Renton TC–Seattle CBD 44.1 22.7 49.5 26.4 32.6 19.0
102 Fairwood–Renton TC–Seattle CBD 38.4 21.7
106 Renton TC–Rainier Beach–Seattle CBD 41.3 13.7 38.3 14.2 21.1 8.5
111 Lake Kathleen–Seattle CBD 25.2 16.3
113 Shorewood–Seattle CBD 22.9 11.0
114 Renton Highlands–Seattle CBD 21.8 13.0
116EX Fauntleroy Ferry–Seattle CBD 18.5 6.3
118EX Tahlequah–Seattle CBD via ferry 18.9 8.6
119EX Dockton–Seattle CBD via ferry 19.0 9.4
120* Burien TC–Westwood Village–Seattle CBD 41.7 18.3 44.6 20.1 32.5 15.3
121 Highline CC -Burien TC–Seattle CBD via First Ave S 20.4 9.7
122 Highline CC -Burien TC–Seattle CBD via Des Moines Memorial Dr S 24.8 11.8
123 Burien–Seattle CBD 28.6 17.7
124* Tukwila–Georgetown–Seattle CBD 33.7 12.0 34.9 14.8 21.8 8.9
125* Westwood Village–Seattle CBD 38.1 15.3 25.3 11.2 17.7 8.0
131* Burien TC–Highland Park–Seattle CBD 41.5 17.2 37.1 15.1 21.3 9.7
132* Burien TC–South Park–Seattle CBD 34.7 14.6 29.4 12.8 17.4 7.7
143* Black Diamond–Renton TC–Seattle CBD 17.1 11.4
150 Kent Station–Southcenter–Seattle CBD 41.3 20.4 37.4 18.8 29.3 18.0
157 Lake Meridian–Seattle CBD 13.5 9.8
158 Kent East Hill–Seattle CBD 25.5 17.6
159 Timberlane–Seattle CBD 18.9 13.3
167 Renton–Newport Hills–University District 25.9 21.4
177 Federal Way–Seattle CBD 20.4 12.6
178 South Federal Way–Seattle CBD 20.6 14.3
179 Twin Lakes–Seattle CBD 21.8 16.3
190 Redondo Heights–Seattle CBD 20.4 13.6
192 Star Lake–Seattle CBD 19.4 12.9

KING COUNTY METRO TRANSIT 2016 SYSTEM EVALUATION A-47
Route Description
Peak Off Peak Night
Rides/ Platform
Hour
Passenger Miles/
Platform Mile
Rides/ Platform
Hour
Passenger Miles/
Platform Mile
Rides/ Platform
Hour
Passenger Miles/
Platform Mile
193EX Federal Way–First Hill 24.6 17.0
197 Twin Lakes–University District 21.9 18.1
212 Eastgate–Seattle CBD 41.3 21.9 54.4 25.1
214 Issaquah–Seattle CBD 28.7 17.6
216 Sammamish–Seattle CBD 33.2 23.9
217 Issaquah–Eastgate–Seattle CBD 25.8 17.2
218 Issaquah Highlands–Seattle CBD 37.6 23.9
219 Redmond–Sammamish–Seattle CBD 30.2 24.9
252 Kingsgate–Seattle CBD 29.0 18.3
255 Brickyard–Kirkland TC–Seattle CBD 36.6 19.4 25.3 13.2 23.2 12.2
257 Brickyard–Seattle CBD 28.6 18.6
268 Redmond–Seattle CBD 33.2 22.6
271 Issaquah–Bellevue–University District 26.5 11.4 25.2 10.9 17.5 7.7
277 Juanita–University District 13.0 5.4
301 Aurora Village–Seattle CBD 34.5 20.0
303EX Shoreline–First Hill 31.2 15.9
304 Richmond Beach–Seattle CBD 30.5 17.9
308 Horizon View–Seattle CBD 26.0 14.9
309EX* Kenmore–First Hill 32.6 17.7
311 Woodinville–Seattle CBD 27.5 18.5
312EX Bothell–Seattle CBD 32.0 16.0
316* Meridian Park–Seattle CBD 50.7 21.1
355EX Shoreline CC–University District– Seattle CBD 31.8 11.1
372EX* Bothell/Lake City–University District 38.1 13.2 40.2 14.5 35.6 8.9
373EX Aurora Village–University Village 30.5 11.4
601EX Seattle CBD–Group Health (Tukwila) 5.3 2.3
C Line* Westwood Village–Alaska Junction–Seattle CBD 52.5 21.8 43.7 18.2 28.0 12.7
D Line* Ballard–Seattle Center–Seattle CBD 74.8 20.2 63.6 17.9 42.3 12.2
E Line* Aurora Village–Seattle CBD 63.5 24.0 57.5 22.7 39.4 14.7
Fall 2015 Thresholds: Urban Routes Peak Off Peak Night
Bottom 25% 27.5 11.4 33.1 9.3 17.5 4.8
Top 25% 47.2 18.1 48.2 14.9 28.0 8.9
* Designates routes receiving Seattle investments

A-48 KING COUNTY METRO TRANSIT 2016 SYSTEM EVALUATION
Appendix D: Peak Route Analysis
Route Description Alternative Route(s)*
Ridership 90% of
Alternative
Travel Time 20% faster
than Alternative
5EX Greenwood–Seattle CBD 5 No No
15EX Blue Ridge–Ballard–Seattle CBD D Line Yes Yes
17EX Sunset Hill–Ballard–Seattle CBD 29 Yes Yes
18EX North Beach–Ballard–Seattle CBD 40 No No
21EX Arbor Heights–Westwood Village–Seattle CBD 21 Yes Yes
29 Ballard–Queen Anne–Seattle CBD 2 Yes Yes
37 Alaska Junction–Alki–Seattle CBD 773 Yes Yes
55 Admiral District–Alaska Junction–Seattle CBD 50 Yes No
56 Alki–Seattle CBD 50 Yes Yes
57 Alaska Junction–Seattle CBD 56 Yes No
64EX Lake City–First Hill 76 Yes Yes
74EX Sand Point–Seattle CBD 30** Yes No
76 Wedgwood–Seattle CBD 71EX*** No No
77EX North City–Seattle CBD 73 Yes Yes
99 International District–Waterfront None Yes Yes
102 Fairwood–Renton TC–Seattle CBD 148 Yes No
111 Lake Kathleen–Seattle CBD None Yes Yes
113 Shorewood–Seattle CBD None Yes Yes
114 Renton Highlands–Seattle CBD 240 Yes Yes
116EX Fauntleroy Ferry–Seattle CBD C Line No No
118EX Tahlequah–Seattle CBD via ferry 118 Yes No
119EX Dockton–Seattle CBD via ferry 119 Yes No
121 Highline CC -Burien TC–Seattle CBD via First Ave S 166 Yes Yes
122 Highline CC -Burien TC–Seattle CBD via Des Moines Memorial Dr S 156 Yes Yes
123 Burien–Seattle CBD 121 No No
154 Tukwila Station–Boeing Industrial 124 No No
157 Lake Meridian–Seattle CBD None Yes Yes
158 Kent East Hill–Seattle CBD 164 Yes No
159 Timberlane–Seattle CBD 164 Yes No
167 Renton–Newport Hills–University District 560EX Yes Yes
Peak-only routes 27, 143, 153, 186, 269, 373 Express, 930, and 931 are included in the corridor analysis because they each serve as the only route on one of Metro’s 110 corridors during at least one time period. These routes are not analyzed as part of the peak analysis because their target service levels are set by the corridor analysis.
* Alternative routes must serve at least 50% of riders on the peak-only route.
** Route 30 was the alternative for Route 74EX through March 2016 and was used for this analysis. In the future, the alternative will be Route 75 to Link with a transfer at UW Station.
*** Route 71EX was the alternative for Route 76 through March 2016 and was used for this analysis. In the future, the alternative will be Route 71 to Link with a transfer at UW Station.

KING COUNTY METRO TRANSIT 2016 SYSTEM EVALUATION A-49
Route Description Alternative Route(s)*
Ridership 90% of
Alternative
Travel Time 20% faster
than Alternative
177 Federal Way–Seattle CBD 577EX No No
178 South Federal Way–Seattle CBD 177 Yes No
179 Twin Lakes–Seattle CBD 181 Yes No
190 Redondo Heights–Seattle CBD 574EX Yes Yes
192 Star Lake–Seattle CBD 574EX Yes Yes
193EX Federal Way–First Hill None Yes Yes
197 Twin Lakes–University District 181 Yes Yes
201 South Mercer Island–Mercer Island P&R via Mercer Way None Yes Yes
212 Eastgate–Seattle CBD 554EX Yes No
214 Issaquah–Seattle CBD 554EX No No
216 Sammamish–Seattle CBD 269 Yes No
217 Issaquah–Eastgate–Seattle CBD 554EX No Yes
218 Issaquah Highlands–Seattle CBD 554EX No Yes
219 Redmond–Sammamish–Seattle CBD None Yes Yes
232 Duvall–Bellevue 248 Yes Yes
237 Woodinville–Bellevue 311 No Yes
244 Kenmore–Overlake 234 No No
252 Kingsgate–Seattle CBD 255 No Yes
257 Brickyard–Seattle CBD 238 Yes Yes
268 Redmond–Seattle CBD 545 No Yes
277 Juanita–University District 235 Yes Yes
301 Aurora Village–Seattle CBD E Line No Yes
303EX Shoreline–First Hill None Yes Yes
304 Richmond Beach–Seattle CBD 348 Yes Yes
308 Horizon View–Seattle CBD 331 Yes No
309EX Kenmore–First Hill 312EX Yes Yes
311 Woodinville–Seattle CBD None Yes Yes
312EX Bothell–Seattle CBD 522EX Yes No
316 Meridian Park–Seattle CBD 16** Yes Yes
342 Shoreline–Bellevue TC–Renton None Yes Yes
355EX Shoreline CC–University District–Seattle CBD 5 No No
601EX Seattle CBD–Group Health (Tukwila) None Yes Yes
913DART Kent Station–Riverview None Yes Yes
* Alternative routes must serve at least 50% of riders on the peak-only route.
** Route 16 was the alternative for Route 316 through March 2016 and was used for this analysis. In the future, the alternative will be Route 346 to Route 26 with a transfer at Northgate.

A-50 KING COUNTY METRO TRANSIT 2016 SYSTEM EVALUATION
Appendix E: Route Reliability
Route All-Day % Late
PM % Late
Saturday % Late
Sunday % Late Route All-Day
% LatePM
% LateSaturday % Late
Sunday % Late
1 13% 15% 19% 16% 41 19% 36% 6% 8%
2 17% 20% 8% 12% 43 17% 30% 24% 8%
3 18% 19% 17% 14% 44 10% 12% 15% 5%
4 14% 15% 12% 13% 47 12% 30% 12% 5%
5EX 19% 19% -- -- 48 24% 36% 34% 16%
5 21% 32% 17% 10% 49 24% 37% 13% 11%
7 19% 22% 16% 11% 50 15% 20% 8% 13%
8 30% 39% 19% 17% 55 28% 42% -- --
9EX 36% 45% -- -- 56 15% 24% -- --
10 28% 37% 8% 7% 57 30% 45% -- --
11 25% 45% 26% 17% 60 27% 40% 13% 7%
12 22% 31% 4% 11% 64EX 47% 54% -- --
13 17% 20% 11% 9% 65 16% 19% 14% 7%
14 15% 20% 10% 13% 66EX 23% 29% 10% 9%
15EX 21% 16% -- -- 67 14% 21% 12% 8%
16 20% 29% 23% 20% 68 24% 28% 13% 5%
17EX 21% 34% -- -- 70 19% 35% 12% 6%
18EX 26% 37% -- -- 71EX 15% 25% 17% 8%
19 17% 20% -- -- 71 7% 6% 15% 23%
21EX 30% 35% -- -- 72EX 17% 33% 18% 7%
21 17% 29% 18% 9% 72 12% -- 17% 17%
22 4% 9% 19% 27% 73EX 13% 26% 14% 8%
24 31% 27% 24% 12% 73 4% 17% 6% 4%
25 30% 68% -- -- 74EX 21% 27% -- --
26EX 22% 20% -- -- 75 19% 29% 20% 15%
26 31% 34% 29% 18% 76 14% 11% -- --
27 24% 36% 28% 19% 77EX 18% 19% -- --
28EX 33% 42% -- -- 82 10% -- 10% 5%
28 31% 38% 28% 23% 83 37% -- 18% 26%
29 44% 51% -- -- 84 13% -- 49% 7%
30 4% 4% -- -- 99 23% 34% -- --
31 32% 41% 23% -- 101 24% 28% 26% 21%
32 27% 36% 30% 24% 102 29% 36% -- --
33 21% 31% 22% 15% 105 28% 51% 23% 21%
36 16% 21% 10% 12% 106 24% 25% 15% 14%
37EX 12% -- -- -- 107 23% 34% 15% 8%
37 48% 48% -- -- 111 40% 51% -- --
40 18% 27% 19% 19% 113 32% 33% -- --
114 42% 46% -- -- 190 41% 28% -- --
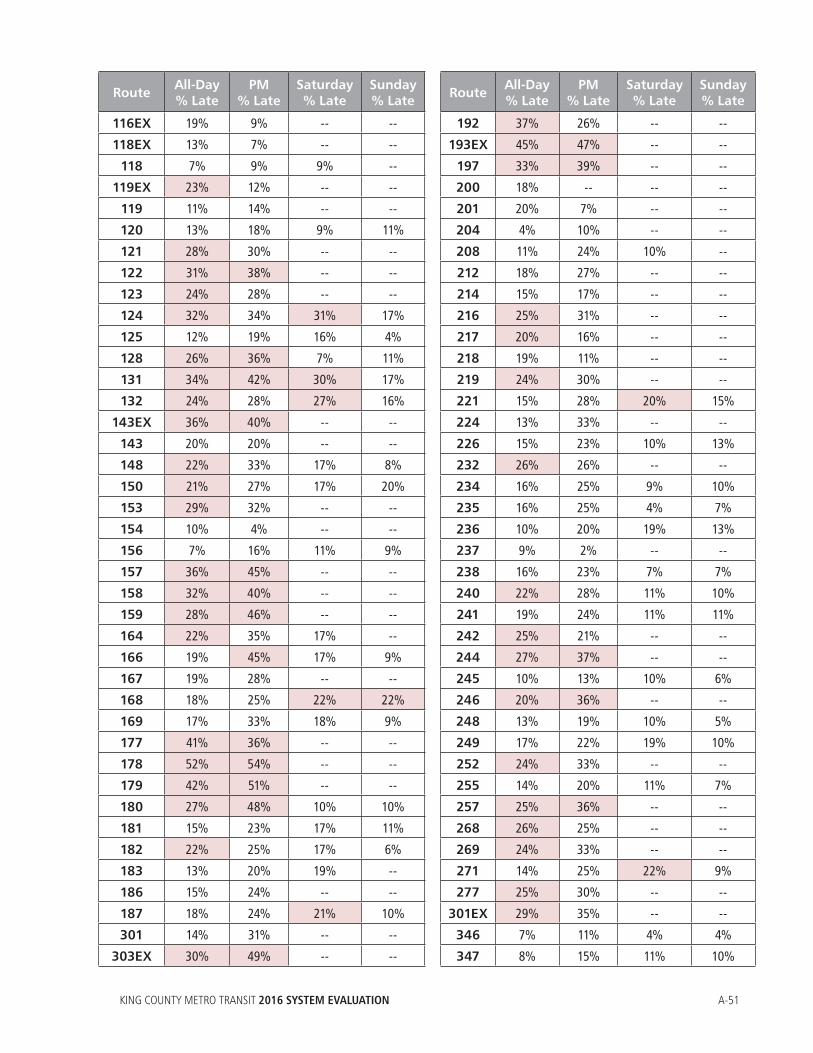
KING COUNTY METRO TRANSIT 2016 SYSTEM EVALUATION A-51
Route All-Day % Late
PM % Late
Saturday % Late
Sunday % Late Route All-Day
% LatePM
% LateSaturday % Late
Sunday % Late
116EX 19% 9% -- -- 192 37% 26% -- --
118EX 13% 7% -- -- 193EX 45% 47% -- --
118 7% 9% 9% -- 197 33% 39% -- --
119EX 23% 12% -- -- 200 18% -- -- --
119 11% 14% -- -- 201 20% 7% -- --
120 13% 18% 9% 11% 204 4% 10% -- --
121 28% 30% -- -- 208 11% 24% 10% --
122 31% 38% -- -- 212 18% 27% -- --
123 24% 28% -- -- 214 15% 17% -- --
124 32% 34% 31% 17% 216 25% 31% -- --
125 12% 19% 16% 4% 217 20% 16% -- --
128 26% 36% 7% 11% 218 19% 11% -- --
131 34% 42% 30% 17% 219 24% 30% -- --
132 24% 28% 27% 16% 221 15% 28% 20% 15%
143EX 36% 40% -- -- 224 13% 33% -- --
143 20% 20% -- -- 226 15% 23% 10% 13%
148 22% 33% 17% 8% 232 26% 26% -- --
150 21% 27% 17% 20% 234 16% 25% 9% 10%
153 29% 32% -- -- 235 16% 25% 4% 7%
154 10% 4% -- -- 236 10% 20% 19% 13%
156 7% 16% 11% 9% 237 9% 2% -- --
157 36% 45% -- -- 238 16% 23% 7% 7%
158 32% 40% -- -- 240 22% 28% 11% 10%
159 28% 46% -- -- 241 19% 24% 11% 11%
164 22% 35% 17% -- 242 25% 21% -- --
166 19% 45% 17% 9% 244 27% 37% -- --
167 19% 28% -- -- 245 10% 13% 10% 6%
168 18% 25% 22% 22% 246 20% 36% -- --
169 17% 33% 18% 9% 248 13% 19% 10% 5%
177 41% 36% -- -- 249 17% 22% 19% 10%
178 52% 54% -- -- 252 24% 33% -- --
179 42% 51% -- -- 255 14% 20% 11% 7%
180 27% 48% 10% 10% 257 25% 36% -- --
181 15% 23% 17% 11% 268 26% 25% -- --
182 22% 25% 17% 6% 269 24% 33% -- --
183 13% 20% 19% -- 271 14% 25% 22% 9%
186 15% 24% -- -- 277 25% 30% -- --
187 18% 24% 21% 10% 301EX 29% 35% -- --
301 14% 31% -- -- 346 7% 11% 4% 4%
303EX 30% 49% -- -- 347 8% 15% 11% 10%

A-52 KING COUNTY METRO TRANSIT 2016 SYSTEM EVALUATION
Route All-Day % Late
PM % Late
Saturday % Late
Sunday % Late Route All-Day
% LatePM
% LateSaturday % Late
Sunday % Late
304 22% 24% -- -- 348 15% 28% 20% 8%
308 20% 36% -- -- 355EX 36% 56% -- --
309EX 34% 56% -- -- 372EX 24% 33% 2% 3%
311 18% 29% -- -- 373EX 26% 48% -- --
312EX 26% 30% -- -- A Line 18% 21% -- --
316 21% 25% -- -- B Line 14% 17% -- --
330 22% 34% -- -- C Line 21% 24% -- --
331 15% 20% 21% 11% D Line 20% 23% -- --
342 18% 20% -- -- E Line 23% 25% -- --
345 11% 19% 21% 9% F Line 15% 16% -- --

KING COUNTY METRO TRANSIT 2016 SYSTEM EVALUATION A-53
Appendix F: 2016 Service ChangesRoute(s) Summary of Change Type of Change
MARCH SERVICE CHANGE
5* Adjust layover for selected trips near Central Base Terminal change
8*Improve reliability by splitting route into two segments and improving frequency
Reliability improvement, increased frequency
10* Revise outbound routing to improve transit flow Revised routing
16 Delete route Deleted route
25 Delete route Deleted route
346 Minor schedule adjustment on Saturdays Schedule adjustment
177, 178, 179
Temporary relocation of layover in Belltown due to construction Terminal change
158 Terminal for Route 158 will shift from on Blanchard St nearside of 6th Ave Terminal change
3*, 4* Revise the layovers for routes 3 and 4 on Queen Anne Terminal change
105 Trips added on Saturday and Sunday Added trips
60*, 193, 303
Revise routing on First Hill from Spruce St to Fir St Revised routing
931 Expansion of DART area in Woodinville Revised routing
24*, 31* Relocate layover area in Magnolia Terminal change
27* Add new p.m. trip to address overcrowding Added trips
30 Delete route Deleted route
36 Revise and through-route two late night trips with route 70Revised routing, schedule adjustment
38* Split Route 8 into two segments at Mount Baker Transit Center New route added
40*Shift inbound routing to Westlake Avenue; add new inbound trip; increase span
Revised routing, added trips, Increased span
41* Relocate terminal for selected trips Terminal change
43* Reduce route 43 to a peak only, peak direction route Service reduction
45Split route 48 into two segments; northern portion between Loyal Heights and U district will be called route 45; improve evening frequency and span
New route added
48*Split route 48 into two segments; southern portion between Mount Baker and U district will be called route 48; improve frequency; restore service on 23rd Ave
Revised routing, increased frequency
49*Revise terminals at both ends; improve weekday and Saturday frequencies; add owl trip; revise outbound routing to improve transit flow
Revised routing, increased frequency, added trips
62New route connecting Sand Point, View Ridge, Bryant, Ravenna, Roosevelt, Green Lake, Wallingford, Fremont, S Lake Union, and downtown Seattle
New route added
63New route connecting Northgate, Maple Leak, Green Lake, S Lake Union and First Hill
New route added
64EX*Revise routing to serve S Lake Union instead of center of downtown Seattle
Revised routing

A-54 KING COUNTY METRO TRANSIT 2016 SYSTEM EVALUATION
Route(s) Summary of Change Type of Change
65* Revise routing; improve frequency; through-route with route 67Revised routing, increased frequency
66 Delete route Deleted route
67* Revise routing; improve frequency and span; through-route with Route 65 Revised routing, increased span
68 Delete route Deleted route
70* Increase span and peak frequencyIncreased span, increased frequency
71Shorten route to operate between Wedgwood and the U district; delete Sunday service
Revised routing, decreased service
72 Delete route Deleted route
73*Shorten route to operate between Jackson Park and the U district; delete peak direction service; delete Sunday service
Revised routing, decreased service
74Provide additional trips; revise routing to serve the Roosevelt/11th Ave NE couplet
Added trips, revised routing
76* Add three AM and three PM trips; improve frequency and spanAdded trips, increased frequency, increased span
77 Add 1 AM trip to address overcrowding Added trips, increased span
78 Create new route to connect Laurelhurst and the U district New route added
120* Add two AM and three p.m. trips Added trips
179 Add two AM and two p.m. peak trips Added trips
190 Add two AM and two p.m. peak trips Added trips
200 Extend route from Issaquah-Highlands P&R to Swedish Medical Center Revised routing
214 Add one AM trip Added trips
238 Extend route from UWB/CCC to Woodinville on weekdays only Revised routing
240Add two AM and one PM trip to address overcrowding; schedule adjustments
Added trips, schedule adjustment
242 Delete route Deleted route
255Add one AM and one PM peak trips; move from Bay B to Bay A in the DSTT; schedule adjustments
Added trips, schedule adjustment
301Add one AM and one PM. peak trips to address overcrowding; schedule adjustments, adjust layover
Added trips, schedule adjustment, terminal change
309EX*Revise PM routing between First Hill and South Lake Union to improve speed and reliability
Revised routing, reliability improvement
316 Add three AM and two PM peak trips; improve frequency and spanAdded trips, increased frequency, increased span
355Revise AM routing to better coordinate with the revised Route 74 due to construction
Revised routing
372EX*Improve frequency and span; shorten route to UW Bothell; add weekend service between Lake City and U District, revise express stop instructions to include additional stops
Increased frequency, increased span, revised routing, added trips, added stops
373 Revise route to serve UW Station; add peak period trips Revised routing, added trips
E Line* Add four AM and four PM weekday trips to address overcrowding Added trips

KING COUNTY METRO TRANSIT 2016 SYSTEM EVALUATION A-55
Route(s) Summary of Change Type of Change
915 Improve weekday-midday frequency Increased frequency
101*, 102Add one AM and two PM weekday peak trips; add one Saturday and four Sunday trips
Added trips
101*, 102, 167, 169
Revise routing to be more direct Revised routing
131*, 132* Change through-routes to routes 26 EX and 28 EX Revised routing
15, 17, 18EX*
Adjust layover near Central Base Terminal change
166, 180, 631
Adjust bay assignments at the Burien Transit Center Terminal change
18EX* Adjust 7:21 AM trip to depart at 7:26 AM Schedule adjustment
2*, 13* Convert second to last Route 2 trip into a Route 13 trip Schedule adjustment
216, 218, 219
Add three new trips; schedule adjustmentsAdded trips, schedule adjustment
24*, 124 Schedule adjustment to improve span and operate a more even frequencySchedule adjustment, increased span, increased frequency
26, 26EX*Combine local and express variants; extend route to Northgate Transit Center
Revised routing
28, 28EX*Combine local and express variants; revise routing to use N 39th St to access Aurora Ave N
Revised routing
308, 312 Adjust layover for Routes 308, 312 Revised routing
31*, 32*, 75Improve frequency of route 75; through-route trips on routes 31/32 with Route 75; revise routing in Wallingford
Increased frequency, revised routing
33*, 27* Adjust schedule to have evening trips depart eight minutes earlier Schedule adjustment
43*, 44*Separate four of the seven planned PM Peak Route 43 trips from Route 44 to improve reliability for the Route 44; add a new Route 44 outbound trip
Reliability improvement
5EX* Add a new PM express trip to help address overcrowding Added trips
63, 64EX* Revise PM routing between first Hill and S Lake Union Revised routing
C Line*, D Line*
Split the C and D lines; extend C line to S Lake Union; extend D line to 5th Ave S
Revised routing

A-56 KING COUNTY METRO TRANSIT 2016 SYSTEM EVALUATION
Route(s) Summary of Change Type of Change
JUNE SERVICE CHANGE
3* Add new pm trip to address overcrowding at Garfield HS Added trips
7*Add trips to address to address overcrowding at Franklin HS, reschedule trips to reflect new bell times
Added trips, schedule adjustment
38* Add trips to address overcrowding at Franklin HS Added trips
55* Add trips to address overcrowding at West Seattle HS Added trips
60* Add trips to address overcrowding at Cleveland HS Added trips
346 Delete school tripper Deleted trips
D Line* Delete two trippers, adjust other trips to address new bell time Deleted trips
31* Remove “reduced weekday” designation from one AM trip Schedule adjustment
891, 892, 894
Delete Wednesday AM service on school routes serving Mercer Island School District
Service reduction
E Line*Add new trip to address overcrowding at Ingraham HS, adjust other trips to address new bell time
Added trips, schedule adjustment
823Adjust schedule to reflect later bell time. Adjust PM routing to no longer serve International School.
Schedule adjustment
824Adjust schedule to reflect later bell time. Adjust PM routing to no longer serve International School.
Schedule adjustment
886Create new Bellevue School District route to serve between Newport/Bellevue/International high schools.
New route added
887Adjust schedule to reflect later bell time. Adjust PM routing to no longer serve International school.
Schedule adjustment
888Adjust schedule to reflect later bell time. Adjust PM routing to no longer serve International school.
Schedule adjustment
889 Adjust schedule to reflect later bell time. Schedule adjustment
73*, 373 Add trips to address overcrowding at Roosevelt HS Added trips
SEPTEMBER SERVICE CHANGE
8* Improve frequency to South Lake Union in the 6:00–6:30 PM time period Increased frequency
15 Add one AM trip to relieve overcrowding Added trips
17 Improve capacity and frequency into downtown Seattle and Ballard Increased frequency
18EX* Improve capacity and frequency into downtown Seattle and Ballard Increased frequency
24* Improve frequency on weekdays and Saturdays Increased frequency
27* Minor routing revision due to a construction project on Yesler Way Revised routing
27* Revise through routing and CBD stop pattern Revised routing
33* Revise through routing and CBD stop pattern Revised routing
33* Improve frequency on weekdays and Saturdays Increased frequency
38* Discontinue route Deleted route
40* Improve capacity and frequency of service Increased frequency
45* Adjust trip times, consolidate low ridership trips Schedule adjustment
48* Add two trips; adjust evening trip times Added trips, schedule adjustment
48* Routing revision due to construction project Revised routing

KING COUNTY METRO TRANSIT 2016 SYSTEM EVALUATION A-57
Route(s) Summary of Change Type of Change
62 Add a new morning trip, adjust trip timesAdded trips, schedule adjustment
63 Add a new southbound trip, revise PM routing Added trips, revised routing
64EX* Revise PM routing Revised routing
65*, 67*Cancel the morning “reduced weekday” trip on Route 65; add new PM trip on Route 65; adjust trip times on Route 67
Added trips, schedule adjustment
71Adjust schedule to stagger trips from Route 373 trips between NE 65th/15th NE and UW Station
Schedule adjustment
73* Add Sunday service to east side of Maple Leaf Added trips
75 Delete one late outbound AM trip Service reduction
76* Adjust trip times Schedule adjustment
77 Add four new trips Added trips
106Revise routing to operate through Rainier Valley to the International District
Revised routing
107Revise and extend routing to S Lander St/15th Ave S via Beacon Hill and Georgetown
Revised routing
118 Add Sunday service on Route 118 Added service
120* Add new AM trip Added trips
124* Improve frequency on weekdays and Saturdays Increased frequency
131*Add one new inbound Route 26X, consolidate two Route 131 outbound AM trips
Schedule adjustment
132* Adjust trips times to smooth headways during peak Schedule adjustment
143* Revise routing due to new construction Revised routing
148Revise and extend routing to S Lander St/15th Ave S via Beacon Hill and Georgetown
Revised routing, increased span
193 Revise AM inbound routing Added trips
243New express route to serve between Overlake Transit Center and Kenmore Park-and-Ride
New route added
244 Connect new Route 243 Express trips to some Route 244 trips Schedule adjustment
249 Revise to operate as a live loop in South Bellevue and Beaux Arts Revised routing
303 Revise PM routing Revised routing
304 Minor routing revision due to construction project on Yesler Way Revised routing
309EX* Revise PM routing Revised routing
316 Adjust trip times Schedule adjustment
355 Minor routing revision due to construction project on Yesler Way Revised routing
372EX* Add one AM and two PM trips; adjust schedule Added trips
373 Add one pair of new stops Added stops
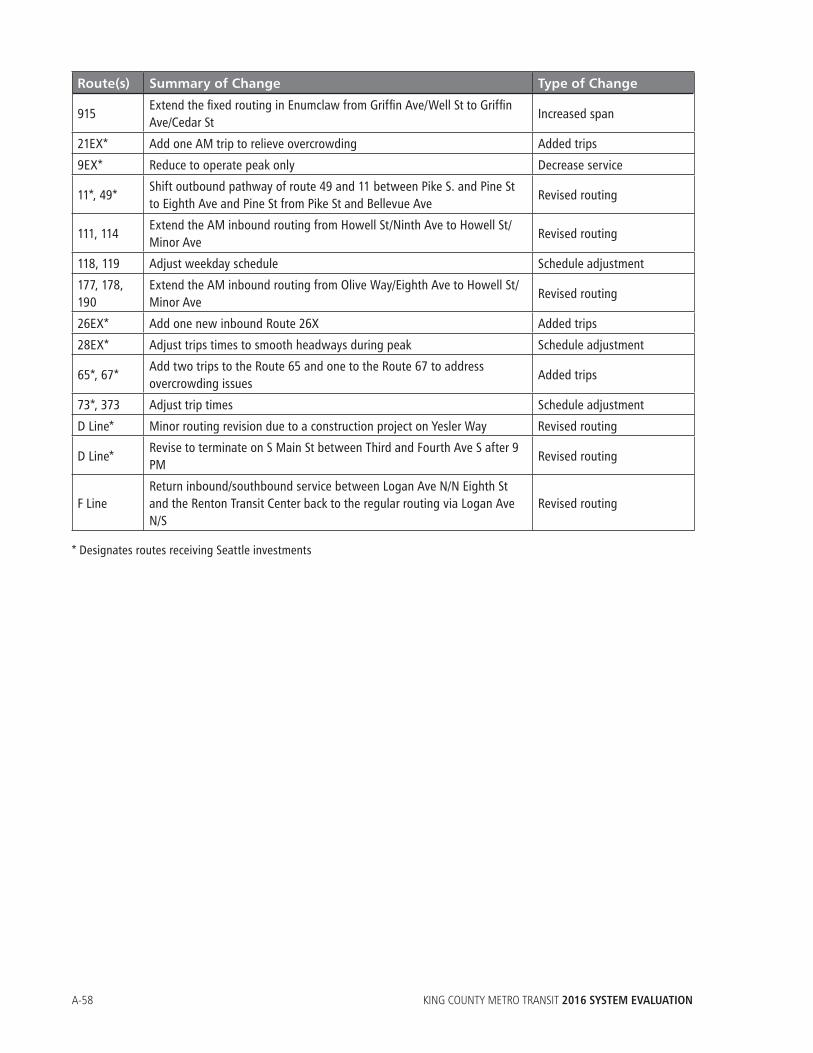
A-58 KING COUNTY METRO TRANSIT 2016 SYSTEM EVALUATION
Route(s) Summary of Change Type of Change
915Extend the fixed routing in Enumclaw from Griffin Ave/Well St to Griffin Ave/Cedar St
Increased span
21EX* Add one AM trip to relieve overcrowding Added trips
9EX* Reduce to operate peak only Decrease service
11*, 49*Shift outbound pathway of route 49 and 11 between Pike S. and Pine St to Eighth Ave and Pine St from Pike St and Bellevue Ave
Revised routing
111, 114Extend the AM inbound routing from Howell St/Ninth Ave to Howell St/Minor Ave
Revised routing
118, 119 Adjust weekday schedule Schedule adjustment
177, 178, 190
Extend the AM inbound routing from Olive Way/Eighth Ave to Howell St/Minor Ave
Revised routing
26EX* Add one new inbound Route 26X Added trips
28EX* Adjust trips times to smooth headways during peak Schedule adjustment
65*, 67*Add two trips to the Route 65 and one to the Route 67 to address overcrowding issues
Added trips
73*, 373 Adjust trip times Schedule adjustment
D Line* Minor routing revision due to a construction project on Yesler Way Revised routing
D Line*Revise to terminate on S Main St between Third and Fourth Ave S after 9 PM
Revised routing
F LineReturn inbound/southbound service between Logan Ave N/N Eighth St and the Renton Transit Center back to the regular routing via Logan Ave N/S
Revised routing
* Designates routes receiving Seattle investments

KING COUNTY METRO TRANSIT 2016 SYSTEM EVALUATION A-59
Appendix G: Route-level Ridership (weekday average, spring 2015 and fall 2015)
RouteWeekday Rides in
Spring 2015
Weekday Rides in Fall
2015
Change in Rides
Weekday Platform Hours in
Spring 2015
Weekday Platform Hours in Fall 2015
Change in Platform
Hours
1 2,400 2,600 200 48 65 17
2 5,600 6,200 600 127 136 9
3 6,400 7,700 1,300 133 150 17
4 5,300 3,700 -1,600 113 99 -14
5 8,100 8,300 200 153 183 30
7 13,400 12,300 -1,100 250 259 9
8 10,000 9,400 -600 211 212 1
9 2,900 2,900 0 65 77 12
10 4,700 4,800 100 84 94 10
11 3,400 4,000 600 65 89 24
12 3,600 3,700 100 74 84 10
13 3,300 2,900 -400 61 60 -1
14 2,800 3,400 600 66 84 18
15EX 1,100 1,300 200 21 27 6
16 4,900 4,900 0 163 177 14
17EX 900 900 0 15 18 3
18EX 900 1,000 100 18 21 3
19 0 300 300 0 12 12
21 5,000 4,900 -100 140 141 1
22 200 200 0 16 16 0
24 2,500 2,300 -200 61 69 8
25 500 600 100 27 33 6
26EX 700 700 0 15 15 0
26 3,000 2,900 -100 73 75 2
27 700 1,300 600 22 41 19
28EX 1,200 1,200 0 28 28 0
28 2,900 2,900 0 74 81 7
29 1,200 1,200 0 33 33 0
30 400 500 100 22 26 4
31 1,900 1,900 0 52 52 0
32 2,800 2,700 -100 71 71 0
33 2,100 2,000 -100 55 58 3
36 10,700 10,600 -100 232 232 0
37 200 200 0 11 11 0
40 9,300 10,900 1,600 207 273 66
41 10,000 10,100 100 179 190 11

A-60 KING COUNTY METRO TRANSIT 2016 SYSTEM EVALUATION
RouteWeekday Rides in
Spring 2015
Weekday Rides in Fall
2015
Change in Rides
Weekday Platform Hours in
Spring 2015
Weekday Platform Hours in Fall 2015
Change in Platform
Hours
43 7,600 7,000 -600 148 152 4
44 7,600 8,100 500 136 154 18
47 0 700 700 0 23 23
48 12,300 11,500 -800 246 239 -7
49 7,800 7,400 -400 132 142 10
50 2,200 2,400 200 109 109 0
55 800 1,000 200 22 30 8
56 800 700 -100 19 20 1
57 400 400 0 10 11 1
60 5,300 5,300 0 141 151 10
64EX 800 800 0 25 26 1
65 3,200 3,300 100 87 88 1
66EX 3,300 3,200 -100 88 92 4
67 1,700 1,700 0 41 41 0
68 2,100 2,200 100 48 47 -1
70 4,700 5,600 900 102 147 45
71 5,100 4,800 -300 91 96 5
72 4,800 4,800 0 83 95 12
73 5,900 6,000 100 101 114 13
74EX 1,300 1,300 0 22 24 2
75 4,600 4,400 -200 98 99 1
76 1,200 1,200 0 21 32 11
77EX 1,100 900 -200 18 20 2
82 <50 <50 0 4 4 0
83 100 100 0 4 4 0
84 <50 <50 0 3 3 0
99 400 300 -100 16 16 0
101 5,200 5,000 -200 109 110 1
102 1,000 1,000 0 25 25 0
105 1,100 1,000 -100 37 37 0
106 5,400 5,100 -300 134 135 1
107 1,400 1,500 100 63 66 3
111 900 900 0 36 35 -1
113 300 300 0 12 12 0
114 400 400 0 18 18 0
116EX 600 600 0 30 31 1
118EX 200 200 0 10 11 1
118 300 300 0 33 33 0

KING COUNTY METRO TRANSIT 2016 SYSTEM EVALUATION A-61
RouteWeekday Rides in
Spring 2015
Weekday Rides in Fall
2015
Change in Rides
Weekday Platform Hours in
Spring 2015
Weekday Platform Hours in Fall 2015
Change in Platform
Hours
119EX 100 100 0 5 5 0
119 100 200 100 13 13 0
120 9,200 8,900 -300 209 213 4
121 1,000 1,000 0 47 47 0
122 600 600 0 25 25 0
123 400 300 -100 12 12 0
124 3,600 3,200 -400 97 100 3
125 2,000 2,000 0 58 58 0
128 4,200 4,000 -200 134 134 0
131 3,200 3,100 -100 81 80 -1
132 3,200 3,000 -200 101 99 -2
143 600 600 0 27 33 6
148 600 600 0 38 40 2
150 7,300 7,200 -100 185 186 1
153 400 400 0 20 21 1
154 100 200 100 8 8 0
156 1,200 1,200 0 65 65 0
157 200 200 0 16 16 0
158 600 600 0 24 25 1
159 500 400 -100 23 24 1
164 2,100 2,000 -100 48 48 0
166 2,300 2,100 -200 78 80 2
167 400 400 0 16 16 0
168 1,700 1,600 -100 68 68 0
169 3,300 3,000 -300 78 79 1
177 600 600 0 30 30 0
178 700 600 -100 29 29 0
179 600 700 100 30 30 0
180 4,600 4,400 -200 148 148 0
181 2,300 2,200 -100 86 87 1
182 500 500 0 28 28 0
183 700 700 0 34 34 0
186 200 200 0 19 20 1
187 500 500 0 20 20 0
190 400 400 0 19 19 0
192 200 200 0 12 12 0
193EX 600 700 100 27 27 0
197 800 800 0 37 37 0

A-62 KING COUNTY METRO TRANSIT 2016 SYSTEM EVALUATION
RouteWeekday Rides in
Spring 2015
Weekday Rides in Fall
2015
Change in Rides
Weekday Platform Hours in
Spring 2015
Weekday Platform Hours in Fall 2015
Change in Platform
Hours
200 100 100 0 13 13 0
201 <50 <50 0 3 3 0
204 200 200 0 19 19 0
208 200 100 -100 17 17 0
212 2,700 2,900 200 62 68 6
214 1,200 1,200 0 40 41 1
216 1,000 900 -100 24 26 2
217 200 200 0 8 8 0
218 1,100 1,100 0 23 29 6
219 1,000 800 -200 29 28 -1
221 1,500 1,500 0 80 80 0
224 100 100 0 16 16 0
226 1,700 1,700 0 61 63 2
232 400 400 0 22 23 1
234 1,400 1,500 100 73 74 1
235 1,100 1,200 100 66 66 0
236 500 500 0 59 61 2
237 100 100 0 5 6 1
238 800 800 0 65 65 0
240 2,400 2,400 0 97 97 0
241 800 800 0 39 41 2
242 400 400 0 23 24 1
244 200 200 0 19 18 -1
245 3,900 3,700 -200 146 148 2
246 400 400 0 29 29 0
248 1,000 1,000 0 55 55 0
249 1,100 1,000 -100 56 56 0
252 700 700 0 25 25 0
255 6,900 6,900 0 218 218 0
257 600 600 0 23 22 -1
268 500 500 0 15 15 0
269 600 600 0 50 50 0
271 6,200 5,900 -300 222 223 1
277 300 200 -100 19 19 0
301 1,600 1,600 0 47 48 1
303EX 1,300 1,300 0 39 40 1
304 400 500 100 15 15 0
308 200 200 0 9 9 0

KING COUNTY METRO TRANSIT 2016 SYSTEM EVALUATION A-63
RouteWeekday Rides in
Spring 2015
Weekday Rides in Fall
2015
Change in Rides
Weekday Platform Hours in
Spring 2015
Weekday Platform Hours in Fall 2015
Change in Platform
Hours
309EX 500 500 0 14 15 1
311 1,100 1,100 0 43 42 -1
312EX 2,200 2,400 200 61 76 15
316 1,000 900 -100 16 17 1
330 400 400 0 14 14 0
331 900 1,000 100 47 47 0
342 300 300 0 17 17 0
345 1,300 1,300 0 38 38 0
346 1,400 1,300 -100 43 43 0
347 1,400 1,400 0 56 56 0
348 1,300 1,500 200 56 56 0
355EX 900 900 0 31 30 -1
372EX 4,900 5,000 100 126 129 3
373EX 900 900 0 29 31 2
601EX <50 <50 0 5 5 0
A Line 10,100 9,800 -300 179 179 0
B Line 6,600 6,500 -100 160 161 1
C Line 8,300 9,100 800 172 196 24
D Line 11,700 12,300 600 161 183 22
E Line 15,800 16,400 600 271 284 13
F Line 5,700 5,700 0 178 178 0
773 100 200 100 8 16 8
775 100 200 100 5 9 4
823 100 0 -100 2 1 -1
824 100 100 0 2 1 -1
887 100 100 0 2 2 0
888 100 100 0 2 2 0
889 100 100 0 2 2 0
891 100 100 0 3 3 0
892 100 100 0 2 2 0
893 100 100 0 2 1 -1
894 100 100 0 2 2 0
895 <50 100 50 2 1 -1
901DART 300 300 0 18 18 0
903DART 300 300 0 19 24 5
906DART 400 300 -100 26 26 0
907DART 100 100 0 19 19 0
908DART 100 100 0 10 10 0

A-64 KING COUNTY METRO TRANSIT 2016 SYSTEM EVALUATION
RouteWeekday Rides in
Spring 2015
Weekday Rides in Fall
2015
Change in Rides
Weekday Platform Hours in
Spring 2015
Weekday Platform Hours in Fall 2015
Change in Platform
Hours
910DART 100 100 0 9 9 0
913DART 200 200 0 13 12 -1
914DART 200 200 0 10 10 0
915DART 200 100 -100 7 7 0
916DART 200 200 0 11 11 0
917DART 200 200 0 14 14 0
930DART 100 100 0 13 13 0
931DART 100 100 0 28 28 0
952 300 300 0 26 26 0
980 <50 <50 0 1 1 0
981 <50 <50 0 2 2 0
982 100 100 0 3 3 0
984 <50 <50 0 2 2 0
986 100 100 0 3 3 0
987 100 100 0 3 3 0
988 100 100 0 3 3 0
989 100 100 0 4 3 -1
994 100 100 0 3 3 0
995 <50 100 50 3 3 0

KING COUNTY METRO TRANSIT 2016 SYSTEM EVALUATION A-65
Appendix H: Corridor Analysis of All-Day NetworkThe corridor analysis tables listed on the following pages are based on data from fall 2015 to winter 2016. This period pre-dates significant restructures to the system in March and September 2016, so some of the route associations in the table are outdated. Metro is undertaking a process to re-assign routes to corridors affected by these restructures.
The tables reflect the following updates to the service guidelines:
Addition of park-and-rides stalls to the households metric
Change in definition of low-income from 100% to 200% of the federal poverty level
New point structure for social equity scores
New system to classify connections to centers
New point structure for geographic value scores
Removal of the redundant cost recovery element

A-66 KING COUNTY METRO TRANSIT 2016 SYSTEM EVALUATION
CORRIDOR ID NUMBER
BETW
EEN
AND
VIA
MAJOR ROUTE
HOUSEHOLDS/CORRIDOR MILE
POINTS
JOBS/CORRIDOR MILE
POINTS
MINORITY
POINTS
LOW-INCOME
POINTS
CONNECTION TYPE
POINTS
TOTAL SCORE
RAPIDRIDE
PEAK
OFFPEAK
NIGHT
1Ad
mira
l Dist
rict
Sout
hcen
ter
Calif
orni
a Av
e SW
, Mili
tary
Rd,
TIB
S12
81,
068
297
92
67%
567
%5
RGC/
MIC
- TA
C7
2115
3030
2Al
kiSO
DOAl
aska
Junc
tion
501,
241
42,
215
424
%0
24%
0RG
C/M
IC -
TAC
715
3030
03
Aubu
rnBu
rien
Kent
, Sea
Tac
180
672
21,
199
265
%5
99%
5RG
C/M
IC -
RGC/
MIC
1024
1530
304
Aubu
rn/G
RCC
Fede
ral W
ay15
th S
t SW
, Lea
Hill
Rd
181
763
21,
211
259
%5
88%
5RG
C/M
IC -
RGC/
MIC
1024
1530
305
Auro
ra V
illag
eSe
attle
CBD
Auro
ra A
ve N
E Li
ne2,
677
89,
207
857
%5
60%
5RG
C/M
IC -
TAC
733
Yes
< 15
1515
6Au
rora
Vill
age
Nor
thga
teM
erid
ian
Av N
346
1,44
94
2,20
14
66%
555
%3
RGC/
MIC
- TA
C7
2315
3030
7Av
onda
leKi
rkla
ndN
E 85
th S
t, N
E Re
dmon
d W
y, A
vond
ale
Wy
NE
248
1,29
04
1,61
74
54%
50%
0RG
C/M
IC -
TAC
720
1530
308
Balla
rdU.
Dist
rict
Gree
n La
ke, G
reen
woo
d48
2,44
08
9,02
28
9%0
44%
3RG
C/M
IC -
TAC
726
1515
309
Balla
rdN
orth
gate
Holm
an R
oad,
Nor
thga
te40
2,45
58
3,39
56
11%
011
%0
RGC/
MIC
- RG
C/M
IC10
2415
3030
10Ba
llard
Seat
tle C
BD15
th A
ve W
D Li
ne3,
914
1014
,371
100%
00%
0RG
C/M
IC -
RGC/
MIC
1030
Yes
< 15
1515
11Ba
llard
U. D
istric
tW
allin
gfor
d (N
45t
h St
)44
2,67
58
14,8
3610
17%
017
%0
RGC/
MIC
- RG
C/M
IC10
2815
1530
12Ba
llard
Seat
tle C
BDBa
llard
/Inte
rbay
MIC
, Fre
mon
t, So
uth
Lake
Uni
on40
3,57
910
23,7
3910
14%
021
%0
RGC/
MIC
- RG
C/M
IC10
3015
1530
13Be
acon
Hill
Seat
tle C
BDBe
acon
Ave
361,
827
611
,478
1095
%5
100%
5O
ther
228
1515
3014
Belle
vue
East
gate
Lake
Hill
s Con
nect
or27
185
12
5,45
96
98%
548
%3
RGC/
MIC
- TA
C7
2315
3030
15Be
llevu
eRe
dmon
dN
E 8t
h St
, 156
th A
ve N
EB
Line
1,42
54
5,06
96
89%
512
%0
RGC/
MIC
- RG
C/M
IC10
25Ye
s<
1515
1516
Belle
vue
Rent
onN
ewca
stle
, Fac
toria
240
1,13
92
3,71
26
92%
542
%3
RGC/
MIC
- TA
C7
2315
3030
17Bu
rien
Seat
tle C
BDDe
lridg
e, A
mba
um12
01,
519
46,
863
870
%5
93%
5RG
C/M
IC -
RGC/
MIC
1032
1515
3018
Burie
nSe
attle
CBD
1st A
ve S
, Sou
th P
ark,
Airp
ort W
y13
11,
627
49,
702
866
%5
100%
5RG
C/M
IC -
RGC/
MIC
1032
1515
3019
Burie
nSe
attle
CBD
Des M
oine
s Mem
Dr,
Sout
h Pa
rk13
21,
346
48,
711
869
%5
100%
5RG
C/M
IC -
TAC
729
1515
3020
Capi
tol H
illW
hite
Cen
ter
Sout
h Pa
rk, G
eorg
etow
n, B
eaco
n Hi
ll, F
irst H
ill60
2,06
76
5,42
76
89%
587
%5
RGC/
MIC
- RG
C/M
IC10
3215
1530
21Ca
pito
l Hill
Seat
tle C
BD15
th A
ve E
105,
519
1023
,000
100%
086
%5
Oth
er2
2715
1530
22Ca
pito
l Hill
Seat
tle C
BDM
adiso
n St
125,
695
1041
,926
100%
010
0%5
Oth
er2
2715
1530
23Ce
ntra
l Dist
rict
Seat
tle C
BDE
Jeffe
rson
St
3/4
6,93
710
38,1
7310
74%
510
0%5
RGC/
MIC
- RG
C/M
IC10
4015
1530
24Co
lman
Par
kSe
attle
CBD
Lesc
hi, Y
esle
r27
4,67
110
22,1
7210
89%
561
%5
Oth
er2
3215
1530
25Co
wen
Par
kSe
attle
CBD
Univ
ersit
y W
ay, I
-571
EX/7
2EX/
73EX
/74E
X2,
164
622
,880
1071
%5
100%
5RG
C/M
IC -
RGC/
MIC
1036
1515
3026
Disc
over
y Pa
rkSe
attle
CBD
Gilm
an A
ve W
, 22n
d Av
e W
, Tho
rndy
ke A
v W
333,
270
1013
,945
100%
01%
0O
ther
222
1530
3027
East
gate
Belle
vue
New
port
Wy
, S. B
elle
vue,
112
th24
11,
331
46,
286
880
%5
32%
0O
ther
219
1530
3028
East
gate
Belle
vue
Som
erse
t, Fa
ctor
ia, W
oodr
idge
246
1,18
42
5,52
58
86%
516
%0
Oth
er2
1730
300
29Ea
stga
teO
verla
kePh
anto
m L
ake
226
896
22,
579
432
%0
15%
0O
ther
28
6060
030
Enum
claw
Aubu
rnAu
burn
Wy
S, S
R 16
418
6/91
526
10
394
043
%3
86%
5RG
C/M
IC -
TAC
715
3030
031
Fairw
ood
Rent
onS
Puge
t Dr,
Roya
l Hill
s14
891
72
1,00
22
99%
571
%5
RGC/
MIC
- TA
C7
2115
3030
32Fe
dera
l Way
SeaT
acSR
-99
A Li
ne99
02
2,22
04
100%
510
0%5
RGC/
MIC
- RG
C/M
IC10
26Ye
s<
1515
1533
Fede
ral W
ayKe
ntM
ilita
ry R
oad
183
996
282
12
94%
589
%5
RGC/
MIC
- RG
C/M
IC10
2415
3030
34Fr
emon
tSe
attle
CBD
Dext
er A
ve N
26/2
84,
697
1028
,105
104%
05%
0RG
C/M
IC -
TAC
727
1515
3035
Frem
ont
U. D
istric
tN
40t
h St
31/3
22,
219
627
,764
1010
%0
10%
0RG
C/M
IC -
TAC
723
1530
3036
Frem
ont
Whi
ttie
r Hts
8th
Av N
W, 3
rd A
v N
W28
1,66
14
1,71
64
0%0
0%0
TAC
- TAC
513
3030
037
Gree
n Ri
ver C
CKe
nt13
2nd
Ave
SE16
498
02
1,89
34
82%
587
%5
RGC/
MIC
- TA
C7
2315
3030
38Gr
eenw
ood
Seat
tle C
BDGr
eenw
ood
Ave
N5
4,04
710
14,1
1810
4%0
4%0
RGC/
MIC
- TA
C7
2715
1530
39Hi
gh P
oint
Seat
tle C
BD35
th A
ve S
W21
2,17
56
10,7
1210
63%
563
%5
RGC/
MIC
- TA
C7
3315
1530
† Fi
gure
s rou
nded
for d
ispla
y pu
rpos
es.
Thre
shol
dPo
ints
Thre
shol
dPo
ints
Thre
shol
dPo
ints
Thre
shol
dPo
ints
Thre
shol
dPo
ints
Poin
tsPo
ints
Poin
ts>
3000
10>
1025
010
FR: 5
0%5
FR: 5
9%5
RGC/
MIC
- RG
C/M
IC10
1519
-40
25-4
0--
> 24
008
> 55
008
DART
: 46%
5DA
RT: 4
4%5
RGC/
MIC
- TA
C7
3010
-18
10-2
419
-40
> 18
006
> 30
006
FR: 3
2%3
FR: 4
1%3
TAC
- TAC
560
0-9
0-9
-->
1200
4>
1400
4DA
RT: 3
2%3
DART
: 24%
3O
ther
2>
600
2>
500
2(F
R: F
ixed
-rou
te)
(RGC
: Reg
iona
l Gro
wth
Cen
ter)
(DAR
T: D
ial-a
-Rid
e Tr
ansit
)(M
IC: M
anuf
actu
ring/
Indu
stria
l Cen
ter)
(TAC
: Tra
nsit
Activ
ity C
ente
r)
Conn
ectio
nsLa
nd U
se -
Prod
uctiv
itySo
cial
Equ
ity -
Dem
ogra
phic
sGe
ogra
phic
Val
ue -
Conn
ectio
ns to
Cen
ters
Initi
al T
arge
t Ser
vice
Le
vels
Leve
ls
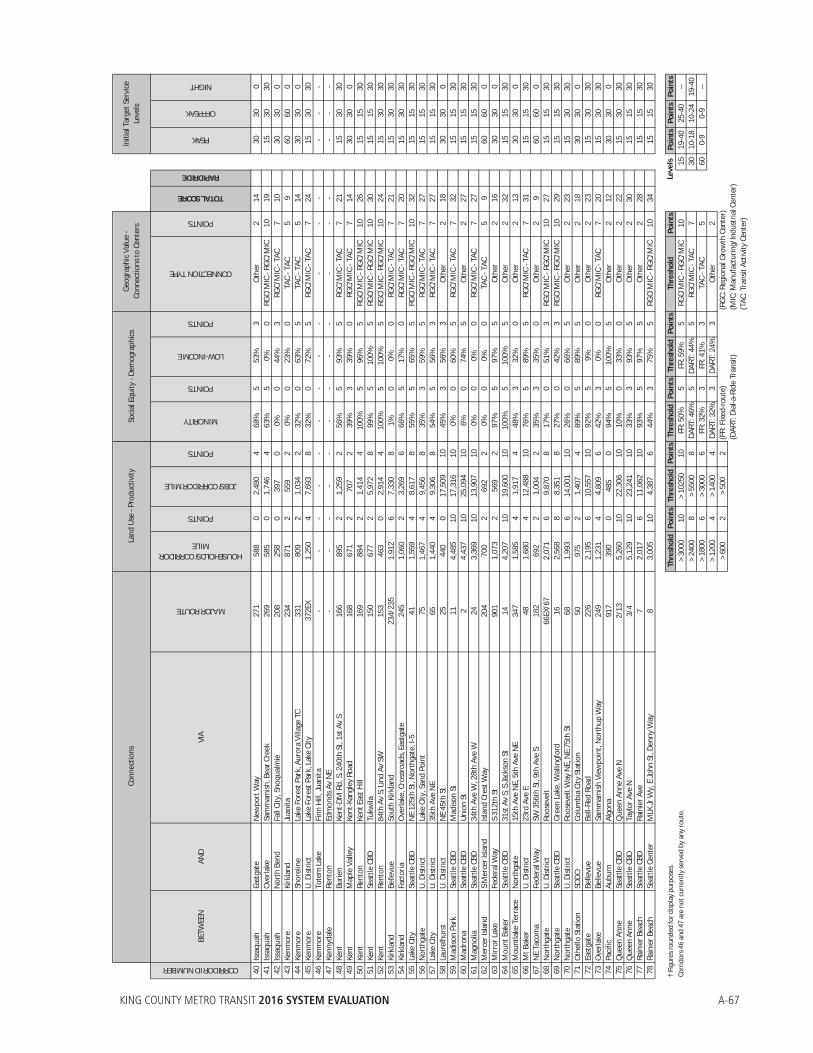
KING COUNTY METRO TRANSIT 2016 SYSTEM EVALUATION A-67
CORRIDOR ID NUMBER
BETW
EEN
AND
VIA
MAJOR ROUTE
HOUSEHOLDS/CORRIDOR MILE
POINTS
JOBS/CORRIDOR MILE
POINTS
MINORITY
POINTS
LOW-INCOME
POINTS
CONNECTION TYPE
POINTS
TOTAL SCORE
RAPIDRIDE
PEAK
OFFPEAK
NIGHT
40Iss
aqua
hEa
stga
teN
ewpo
rt W
ay27
158
80
2,48
04
68%
553
%3
Oth
er2
1430
300
41Iss
aqua
hO
verla
keSa
mm
amish
, Bea
r Cre
ek26
958
50
1,74
64
63%
50%
0RG
C/M
IC -
RGC/
MIC
1019
1530
3042
Issaq
uah
Nor
th B
end
Fall
City
, Sno
qual
mie
208
258
039
70
0%0
44%
3RG
C/M
IC -
TAC
710
3030
043
Kenm
ore
Kirk
land
Juan
ita23
487
12
559
20%
023
%0
TAC
- TAC
59
6060
044
Kenm
ore
Shor
elin
eLa
ke F
ores
t Par
k, A
uror
a Vi
llage
TC
331
809
21,
034
232
%0
63%
5TA
C - T
AC5
1430
300
45Ke
nmor
eU.
Dist
rict
Lake
For
est P
ark,
Lak
e Ci
ty37
2EX
1,25
04
7,69
38
32%
072
%5
RGC/
MIC
- TA
C7
2415
3030
46Ke
nmor
eTo
tem
Lak
eFi
nn H
ill, J
uani
ta-
--
--
--
--
--
--
--
47Ke
nnyd
ale
Rent
onEd
mon
ds A
v N
E-
--
--
--
--
--
--
--
48Ke
ntBu
rien
Kent
-DM
Rd,
S. 2
40th
St,
1st A
v S
166
895
21,
259
256
%5
93%
5RG
C/M
IC -
TAC
721
1530
3049
Kent
Map
le V
alle
yKe
nt-K
angl
ey R
oad
168
671
270
72
39%
339
%0
RGC/
MIC
- TA
C7
1430
300
50Ke
ntRe
nton
Kent
Eas
t Hill
169
884
21,
414
410
0%5
96%
5RG
C/M
IC -
RGC/
MIC
1026
1515
3051
Kent
Seat
tle C
BDTu
kwila
150
677
25,
972
899
%5
100%
5RG
C/M
IC -
RGC/
MIC
1030
1515
3052
Kent
Rent
on84
th A
v S,
Lin
d Av
SW
153
463
02,
914
410
0%5
100%
5RG
C/M
IC -
RGC/
MIC
1024
1530
3053
Kirk
land
Belle
vue
Sout
h Ki
rkla
nd23
4/23
51,
912
67,
330
81%
00%
0RG
C/M
IC -
TAC
721
1530
3054
Kirk
land
Fact
oria
Ove
rlake
, Cro
ssro
ads,
East
gate
245
1,06
02
3,26
96
66%
517
%0
RGC/
MIC
- TA
C7
2015
3030
55La
ke C
itySe
attle
CBD
NE
125t
h St
, Nor
thga
te, I
-541
1,55
94
8,61
78
55%
565
%5
RGC/
MIC
- RG
C/M
IC10
3215
1530
56N
orth
gate
U. D
istric
tLa
ke C
ity, S
and
Poin
t75
1,46
74
9,45
68
35%
359
%5
RGC/
MIC
- TA
C7
2715
1530
57La
ke C
ityU.
Dist
rict
35th
Ave
NE
651,
440
49,
306
854
%5
56%
3RG
C/M
IC -
TAC
727
1515
3058
Laur
elhu
rst
U. D
istric
tN
E 45
th S
t25
440
017
,509
1045
%3
56%
3O
ther
218
3030
059
Mad
ison
Park
Seat
tle C
BDM
adiso
n St
114,
485
1017
,316
100%
060
%5
RGC/
MIC
- TA
C7
3215
1530
60M
adro
naSe
attle
CBD
Unio
n St
24,
437
1025
,094
106%
074
%5
Oth
er2
2715
1530
61M
agno
liaSe
attle
CBD
34th
Ave
W, 2
8th
Ave
W24
3,36
910
13,9
0710
0%0
0%0
RGC/
MIC
- TA
C7
2715
1530
62M
erce
r Isla
ndS
Mer
cer I
sland
Islan
d Cr
est W
ay20
470
02
692
20%
00%
0TA
C - T
AC5
960
600
63M
irror
Lak
eFe
dera
l Way
S 31
2th
St90
11,
073
256
92
97%
597
%5
Oth
er2
1630
300
64M
ount
Bak
erSe
attle
CBD
31st
Av
S, S
Jack
son
St14
4,20
710
19,6
0010
100%
510
0%5
Oth
er2
3215
1530
65M
ount
lake
Ter
race
Nor
thga
te15
th A
ve N
E, 5
th A
ve N
E34
71,
585
41,
917
448
%3
32%
0O
ther
213
3030
066
Mt B
aker
U. D
istric
t23
rd A
ve E
481,
680
412
,488
1076
%5
89%
5RG
C/M
IC -
TAC
731
1515
3067
NE
Taco
ma
Fede
ral W
aySW
356
th S
t, 9t
h Av
e S
182
692
21,
004
235
%3
35%
0O
ther
29
6060
068
Nor
thga
teU.
Dist
rict
Roos
evel
t66
EX/6
72,
071
69,
870
817
%0
51%
3RG
C/M
IC -
RGC/
MIC
1027
1515
3069
Nor
thga
teSe
attle
CBD
Gree
n La
ke, W
allin
gfor
d16
2,56
88
8,35
18
27%
042
%3
RGC/
MIC
- RG
C/M
IC10
2915
1530
70N
orth
gate
U. D
istric
tRo
osev
elt W
ay N
E, N
E 75
th S
t68
1,99
36
14,0
0110
26%
066
%5
Oth
er2
2315
3030
71O
thel
lo S
tatio
nSO
DOCo
lum
bia
City
Sta
tion
5097
52
1,40
74
89%
589
%5
Oth
er2
1830
300
72Ea
stga
teBe
llevu
eBe
ll-Re
d Ro
ad22
62,
195
610
,557
1092
%5
9%0
Oth
er2
2315
3030
73O
verla
keBe
llevu
eSa
mm
amish
Vie
wpo
int,
Nor
thup
Way
249
1,23
14
4,80
96
42%
30%
0RG
C/M
IC -
TAC
720
1530
3074
Paci
ficAu
burn
Algo
na91
739
00
485
094
%5
100%
5O
ther
212
3030
075
Que
en A
nne
Seat
tle C
BDQ
ueen
Ann
e Av
e N
2/13
5,26
010
22,3
0610
10%
033
%0
Oth
er2
2215
3030
76Q
ueen
Ann
eSe
attle
CBD
Tayl
or A
ve N
3/4
5,12
910
23,2
4110
33%
393
%5
Oth
er2
3015
1530
77Ra
inie
r Bea
chSe
attle
CBD
Rain
ier A
ve7
2,01
76
11,0
6210
93%
597
%5
Oth
er2
2815
1530
78Ra
inie
r Bea
chSe
attle
Cen
ter
MLK
Jr W
y, E
John
St,
Denn
y W
ay8
3,00
510
4,38
76
44%
375
%5
RGC/
MIC
- RG
C/M
IC10
3415
1530
† Fi
gure
s rou
nded
for d
ispla
y pu
rpos
es.
Thre
shol
dPo
ints
Thre
shol
dPo
ints
Thre
shol
dPo
ints
Thre
shol
dPo
ints
Thre
shol
dPo
ints
Poin
tsPo
ints
Poin
tsCo
rrid
ors 4
6 an
d 47
are
not
cur
rent
ly se
rved
by
any
rout
e.>
3000
10>
1025
010
FR: 5
0%5
FR: 5
9%5
RGC/
MIC
- RG
C/M
IC10
1519
-40
25-4
0--
> 24
008
> 55
008
DART
: 46%
5DA
RT: 4
4%5
RGC/
MIC
- TA
C7
3010
-18
10-2
419
-40
> 18
006
> 30
006
FR: 3
2%3
FR: 4
1%3
TAC
- TAC
560
0-9
0-9
-->
1200
4>
1400
4DA
RT: 3
2%3
DART
: 24%
3O
ther
2>
600
2>
500
2(F
R: F
ixed
-rou
te)
(RGC
: Reg
iona
l Gro
wth
Cen
ter)
(DAR
T: D
ial-a
-Rid
e Tr
ansit
)(M
IC: M
anuf
actu
ring/
Indu
stria
l Cen
ter)
(TAC
: Tra
nsit
Activ
ity C
ente
r)
Conn
ectio
nsLa
nd U
se -
Prod
uctiv
itySo
cial
Equ
ity -
Dem
ogra
phic
sGe
ogra
phic
Val
ue -
Conn
ectio
ns to
Cen
ters
Initi
al T
arge
t Ser
vice
Le
vels
Leve
ls

A-68 KING COUNTY METRO TRANSIT 2016 SYSTEM EVALUATION
CORRIDOR ID NUMBER
BETW
EEN
AND
VIA
MAJOR ROUTE
HOUSEHOLDS/CORRIDOR MILE
POINTS
JOBS/CORRIDOR MILE
POINTS
MINORITY
POINTS
LOW-INCOME
POINTS
CONNECTION TYPE
POINTS
TOTAL SCORE
RAPIDRIDE
PEAK
OFFPEAK
NIGHT
79Ra
inie
r Bea
chCa
pito
l Hill
Rain
ier A
ve9E
X2,
292
65,
647
891
%5
93%
5TA
C - T
AC5
2915
1530
80Re
dmon
dEa
stga
te14
8th
Ave,
Cro
ssro
ads,
Belle
vue
Colle
ge22
186
52
2,15
94
81%
543
%3
RGC/
MIC
- TA
C7
2115
3030
81Re
dmon
dTo
tem
Lak
eW
illow
s Roa
d93
081
32
2,40
84
77%
50%
0RG
C/M
IC -
RGC/
MIC
1021
1530
3082
Redm
ond
Fall
City
Duva
ll, C
arna
tion
224
469
055
32
52%
50%
0RG
C/M
IC -
TAC
714
3030
083
Rent
onBu
rien
S 15
4th
StF
Line
697
21,
718
487
%5
89%
5RG
C/M
IC -
RGC/
MIC
1026
Yes
< 15
1515
84Re
nton
Seat
tle C
BDM
LK Jr
Wy,
I-5
101/
102
875
26,
957
896
%5
100%
5RG
C/M
IC -
RGC/
MIC
1030
1515
3085
Rent
onRa
inie
r Bea
chW
est H
ill, R
aini
er V
iew
107
865
258
72
100%
510
0%5
Oth
er2
1630
300
86Re
nton
Seat
tle C
BDSk
yway
, S. B
eaco
n Hi
ll10
61,
161
27,
336
895
%5
94%
5RG
C/M
IC -
TAC
727
1515
3087
Rent
onRe
nton
Hig
hlan
dsN
E 4t
h St
, Uni
on A
ve N
E10
51,
335
42,
592
497
%5
92%
5RG
C/M
IC -
TAC
725
1515
3088
Rent
onEn
umcl
awM
aple
Val
ley,
Bla
ck D
iam
ond
143E
X/90
721
50
271
011
%0
0%0
RGC/
MIC
- TA
C7
760
600
89Re
nton
Hig
hlan
dsRe
nton
NE
7th
St, E
dmon
ds A
v N
E90
81,
080
22,
797
481
%5
72%
5O
ther
218
3030
090
Rich
mon
d Be
ach
Nor
thga
teRi
chm
ond
Bch
Rd, 1
5th
Ave
NE
348
1,69
34
2,03
14
53%
548
%3
RGC/
MIC
- TA
C7
2315
3030
91S
Vash
onN
Vas
hon
Valle
y Ce
nter
118
510
710
0%0
0%0
Oth
er2
260
600
92Sa
nd P
oint
U. D
istric
tN
E 55
th S
t30
1,65
74
13,7
2710
9%0
74%
5RG
C/M
IC -
TAC
726
1515
3093
Shor
elin
eU.
Dist
rict
Jack
son
Park
, 15t
h Av
NE
373E
X1,
272
46,
520
873
%5
52%
3RG
C/M
IC -
TAC
727
1515
3094
Shor
elin
e CC
Nor
thga
teN
130
th S
t, M
erid
ian
Av N
345
1,56
54
3,79
66
34%
358
%3
RGC/
MIC
- TA
C7
2315
3030
95Sh
orel
ine
CCLa
ke C
ityN
155
th S
t, Ja
ckso
n Pa
rk33
01,
418
41,
884
431
%0
81%
5TA
C - T
AC5
1830
300
96Sh
orel
ine
CCGr
eenw
ood
Gree
nwoo
d Av
N5
1,86
76
2,30
14
11%
031
%0
TAC
- TAC
515
3030
097
Tote
m L
ake
Seat
tle C
BDKi
rkla
nd, S
R-52
025
51,
258
46,
239
86%
016
%0
RGC/
MIC
- RG
C/M
IC10
2215
3030
98W
oodi
nvill
eKi
rkla
ndKi
ngsg
ate
236
1,08
62
882
231
%0
0%0
RGC/
MIC
- TA
C7
1130
300
99Tu
kwila
Seat
tle C
BDPa
cific
Hw
y S,
4th
Ave
S12
41,
671
49,
701
890
%5
94%
5RG
C/M
IC -
RGC/
MIC
1032
1515
3010
0Tu
kwila
Des M
oine
sM
cMic
ken
Heig
hts,
Sea-
Tac
156
555
01,
165
293
%5
86%
5RG
C/M
IC -
RGC/
MIC
1022
1530
3010
1Tu
kwila
Fairw
ood
S 18
0th
St, C
arr R
oad
906
590
01,
401
410
0%5
78%
5RG
C/M
IC -
TAC
721
1530
3010
2Tw
in L
akes
Fede
ral W
aySW
Cam
pus D
r, 1s
t Ave
S90
31,
106
21,
190
210
0%5
98%
5O
ther
216
3030
010
3Tw
in L
akes
Fede
ral W
ayS
320t
h St
187
908
259
62
100%
589
%5
Oth
er2
1630
300
104
U. D
istric
tSe
attle
CBD
East
lake
, Fai
rvie
w70
/71/
72/7
33,
388
1034
,680
1037
%3
64%
5RG
C/M
IC -
RGC/
MIC
1038
1515
3010
5U.
Dist
rict
Seat
tle C
BDBr
oadw
ay49
3,65
410
21,1
7210
42%
375
%5
RGC/
MIC
- RG
C/M
IC10
3815
1530
106
U. D
istric
tBe
llevu
eSR
-520
271
851
212
,018
1082
%5
7%0
RGC/
MIC
- RG
C/M
IC10
2715
1530
107
U. D
istric
tSe
attle
CBD
Lake
view
252,
636
824
,878
1021
%0
53%
3O
ther
223
1530
3010
8U
W B
othe
llRe
dmon
dW
oodi
nvill
e, C
otta
ge L
ake
931
473
01,
004
215
%0
0%0
RGC/
MIC
- TA
C7
960
600
109
UW B
othe
ll/CC
CKi
rkla
nd13
2nd
Ave
NE,
Lk
Was
h Vo
ch T
ech
238
1,01
82
1,57
24
13%
06%
0RG
C/M
IC -
TAC
713
3030
011
0W
edgw
ood
Cow
en P
ark
View
Rid
ge, N
E 65
th S
t71
EX1,
363
447
40
0%0
11%
0O
ther
26
6060
011
1W
est S
eatt
leSe
attle
CBD
Faun
tlero
y, A
lask
a Ju
nctio
nC
Line
2,26
46
8,73
28
18%
018
%0
RGC/
MIC
- TA
C7
21Ye
s<
1515
1511
2W
hite
Cen
ter
Seat
tle C
BD16
th A
ve S
W, S
SCC
125
740
26,
117
895
%5
95%
5RG
C/M
IC -
TAC
727
1515
30
† Fi
gure
s rou
nded
for d
ispla
y pu
rpos
es.
Thre
shol
dPo
ints
Thre
shol
dPo
ints
Thre
shol
dPo
ints
Thre
shol
dPo
ints
Thre
shol
dPo
ints
Poin
tsPo
ints
Poin
ts>
3000
10>
1025
010
FR: 5
0%5
FR: 5
9%5
RGC/
MIC
- RG
C/M
IC10
1519
-40
25-4
0--
> 24
008
> 55
008
DART
: 46%
5DA
RT: 4
4%5
RGC/
MIC
- TA
C7
3010
-18
10-2
419
-40
> 18
006
> 30
006
FR: 3
2%3
FR: 4
1%3
TAC
- TAC
560
0-9
0-9
-->
1200
4>
1400
4DA
RT: 3
2%3
DART
: 24%
3O
ther
2>
600
2>
500
2(F
R: F
ixed
-rou
te)
(RGC
: Reg
iona
l Gro
wth
Cen
ter)
(DAR
T: D
ial-a
-Rid
e Tr
ansit
)(M
IC: M
anuf
actu
ring/
Indu
stria
l Cen
ter)
(TAC
: Tra
nsit
Activ
ity C
ente
r)
Conn
ectio
nsLa
nd U
se -
Prod
uctiv
itySo
cial
Equ
ity -
Dem
ogra
phic
sGe
ogra
phic
Val
ue -
Conn
ectio
ns to
Cen
ters
Initi
al T
arge
t Ser
vice
Le
vels
Leve
ls

KING COUNTY METRO TRANSIT 2016 SYSTEM EVALUATION A-69
CORRIDOR ID NUMBER
BETW
EEN
AND
VIA
MAJOR ROUTE
1Ad
mira
l Dist
rict
Sout
hcen
ter
Calif
orni
a Av
e SW
, Mili
tary
Rd,
TIB
S12
82
Alki
SODO
Alas
ka Ju
nctio
n50
3Au
burn
Burie
nKe
nt, S
eaTa
c18
04
Aubu
rn/G
RCC
Fede
ral W
ay15
th S
t SW
, Lea
Hill
Rd
181
5Au
rora
Vill
age
Seat
tle C
BDAu
rora
Ave
NE
Line
6Au
rora
Vill
age
Nor
thga
teM
erid
ian
Av N
346
7Av
onda
leKi
rkla
ndN
E 85
th S
t, N
E Re
dmon
d W
y, A
vond
ale
Wy
NE
248
8Ba
llard
U. D
istric
tGr
een
Lake
, Gre
enw
ood
489
Balla
rdN
orth
gate
Holm
an R
oad,
Nor
thga
te40
10Ba
llard
Seat
tle C
BD15
th A
ve W
D Li
ne11
Balla
rdU
. Dist
rict
Wal
lingf
ord
(N 4
5th
St)
4412
Balla
rdSe
attle
CBD
Balla
rd/In
terb
ay M
IC, F
rem
ont,
Sout
h La
ke U
nion
4013
Beac
on H
illSe
attle
CBD
Beac
on A
ve36
14Be
llevu
eEa
stga
teLa
ke H
ills C
onne
ctor
271
15Be
llevu
eRe
dmon
dN
E 8t
h St
, 156
th A
ve N
EB
Line
16Be
llevu
eRe
nton
New
cast
le, F
acto
ria24
017
Burie
nSe
attle
CBD
Delri
dge,
Am
baum
120
18Bu
rien
Seat
tle C
BD1s
t Ave
S, S
outh
Par
k, A
irpor
t Wy
131
19Bu
rien
Seat
tle C
BDDe
s Moi
nes M
em D
r, So
uth
Park
132
20Ca
pito
l Hill
Whi
te C
ente
rSo
uth
Park
, Geo
rget
own,
Bea
con
Hill,
Firs
t Hill
6021
Capi
tol H
illSe
attle
CBD
15th
Ave
E10
22Ca
pito
l Hill
Seat
tle C
BDM
adiso
n St
1223
Cent
ral D
istric
tSe
attle
CBD
E Je
ffers
on S
t3/
424
Colm
an P
ark
Seat
tle C
BDLe
schi
, Yes
ler
2725
Cow
en P
ark
Seat
tle C
BDUn
iver
sity
Way
, I-5
71EX
/72E
X/73
EX/7
4EX
26Di
scov
ery
Park
Seat
tle C
BDGi
lman
Ave
W, 2
2nd
Ave
W, T
horn
dyke
Av
W33
27Ea
stga
teBe
llevu
eN
ewpo
rt W
y , S
. Bel
levu
e, 1
12th
241
28Ea
stga
teBe
llevu
eSo
mer
set,
Fact
oria
, Woo
drid
ge24
629
East
gate
Ove
rlake
Phan
tom
Lak
e22
630
Enum
claw
Aubu
rnAu
burn
Wy
S, S
R 16
418
6/91
531
Fairw
ood
Rent
onS
Puge
t Dr,
Roya
l Hill
s14
832
Fede
ral W
aySe
aTac
SR-9
9A
Line
33Fe
dera
l Way
Kent
Mili
tary
Roa
d18
334
Frem
ont
Seat
tle C
BDDe
xter
Ave
N26
/28
35Fr
emon
tU.
Dist
rict
N 4
0th
St31
/32
36Fr
emon
tW
hitt
ier H
ts8t
h Av
NW
, 3rd
Av
NW
2837
Gree
n Ri
ver C
CKe
nt13
2nd
Ave
SE16
438
Gree
nwoo
dSe
attle
CBD
Gree
nwoo
d Av
e N
539
High
Poi
ntSe
attle
CBD
35th
Ave
SW
21
† Fi
gure
s rou
nded
for d
ispla
y pu
rpos
es.
Conn
ectio
ns
PEAK
OFFPEAK
NIGHT
PEAK
OFFPEAK
NIGHT
PRIMARY CONNECTIONSBETWEEN URBAN CENTERS
CORRIDOR HAS 15 MINPEAK SERVICE
ADD WHAT FREQUENCYNIGHT SERVICE?
PEAK
OFFPEAK
NIGHT
PEAK
OFFPEAK
NIGHT
RESULTINGSERVICE FAMILY
23%
51%
25%
--
--
3030
--
-15
3030
Freq
uent
59%
46%
23%
1-
--
3030
1-
-15
3030
Freq
uent
27%
53%
35%
--
-60
3030
--
-15
3030
Freq
uent
17%
34%
23%
--
-60
3030
--
-15
3030
Freq
uent
118%
75%
55%
21
--
3030
21
-<
15<
1515
Very
Fre
quen
t22
%31
%12
%-
--
-30
30-
--
1530
30Fr
eque
nt16
%29
%19
%-
--
-30
30-
--
1530
30Fr
eque
nt13
1%50
%71
%2
-1
-30
302
-1
< 15
1515
Very
Fre
quen
t12
1%75
%73
%2
11
6030
302
11
< 15
1515
Very
Fre
quen
t10
1%74
%48
%1
1-
6030
301
1-
< 15
< 15
15Ve
ry F
requ
ent
108%
44%
81%
1-
160
3030
1-
1<
1515
15Ve
ry F
requ
ent
121%
38%
73%
2-
160
3030
2-
1<
1515
15Ve
ry F
requ
ent
122%
89%
85%
21
1-
3030
21
1<
15<
1515
Very
Fre
quen
t44
%48
%24
%-
--
-30
30-
--
1530
30Fr
eque
nt49
%30
%25
%-
--
6030
30-
--
< 15
1515
Very
Fre
quen
t19
%43
%11
%-
--
-30
30-
--
1530
30Fr
eque
nt11
8%39
%50
%2
--
6030
302
--
< 15
1530
Very
Fre
quen
t28
%21
%29
%-
--
6030
30-
--
1515
30Ve
ry F
requ
ent
28%
18%
26%
--
--
3030
--
-15
1530
Very
Fre
quen
t69
%39
%41
%1
--
6030
301
--
< 15
1530
Very
Fre
quen
t13
0%49
%91
%2
-1
-30
302
-1
< 15
1515
Very
Fre
quen
t10
6%33
%32
%1
--
-30
301
--
< 15
1530
Very
Fre
quen
t11
3%94
%67
%2
11
6030
302
11
< 15
< 15
15Ve
ry F
requ
ent
42%
13%
25%
--
--
3030
--
-15
1530
Very
Fre
quen
t16
4%97
%0%
21
-60
3030
21
-<
15<
1530
Very
Fre
quen
t62
%23
%22
%1
--
-30
301
--
< 15
3030
Freq
uent
14%
22%
7%-
--
-30
30-
--
1530
30Fr
eque
nt9%
9%N
/A-
--
--
--
--
3030
0Lo
cal
48%
43%
12%
--
--
--
--
-60
600
Hour
ly29
%11
%N
/A-
--
--
--
--
3030
0Lo
cal
22%
27%
23%
--
--
3030
--
-15
3030
Freq
uent
48%
47%
35%
--
-60
3030
--
-<
1515
15Ve
ry F
requ
ent
11%
14%
N/A
--
-60
3030
--
-15
3030
Freq
uent
114%
33%
54%
2-
--
3030
2-
-<
1515
30Ve
ry F
requ
ent
91%
81%
68%
11
1-
3030
11
1<
1515
15Ve
ry F
requ
ent
54%
15%
15%
--
--
--
--
-30
300
Loca
l34
%46
%23
%-
--
-30
30-
--
1530
30Fr
eque
nt96
%38
%78
%1
-1
-30
301
-1
< 15
1515
Very
Fre
quen
t51
%33
%38
%-
--
-30
30-
--
1515
30Ve
ry F
requ
ent
Ride
rshi
p*Pe
akO
ffPe
akN
ight
110%
22
255
%1
11
Fina
l Tar
get S
ervi
ce L
evel
s and
Fam
ilyO
ther
Pol
icy-
base
d N
ight
Se
rvic
e Ad
ditio
nsSe
rvic
e Le
vel
Impr
ovem
ents
Load
s at P
relim
inar
y Se
rvic
e Le
vel *
Load
-Bas
ed S
ervi
ce L
evel
Im
prov
emen
ts
* Th
e av
erag
e lo
ad's
prop
ortio
n to
the
crow
ding
th
resh
old.
Rid
ersh
ip se
rvic
e le
vel i
mpr
ovem
ents
mov
e th
e pr
elim
inar
y le
vels
of se
rvic
e up
one
or t
wo
leve
ls, e
.g. a
rid
ersh
ip se
rvic
e le
vel i
mpr
ovem
ent o
f 2 c
hang
es a
30
min
. se
rvic
e to
<15
or a
60
min
. ser
vice
to 1
5, e
tc.
Abov
e Ta
rget
Belo
w T
arge
tAt
Tar
get

A-70 KING COUNTY METRO TRANSIT 2016 SYSTEM EVALUATION
CORRIDOR ID NUMBER
BETW
EEN
AND
VIA
MAJOR ROUTE
40Iss
aqua
hEa
stga
teN
ewpo
rt W
ay27
141
Issaq
uah
Ove
rlake
Sam
mam
ish, B
ear C
reek
269
42Iss
aqua
hN
orth
Ben
dFa
ll Ci
ty, S
noqu
alm
ie20
843
Kenm
ore
Kirk
land
Juan
ita23
444
Kenm
ore
Shor
elin
eLa
ke F
ores
t Par
k, A
uror
a Vi
llage
TC
331
45Ke
nmor
eU.
Dist
rict
Lake
For
est P
ark,
Lak
e Ci
ty37
2EX
46Ke
nmor
eTo
tem
Lak
eFi
nn H
ill, J
uani
ta-
47Ke
nnyd
ale
Rent
onEd
mon
ds A
v N
E-
48Ke
ntBu
rien
Kent
-DM
Rd,
S. 2
40th
St,
1st A
v S
166
49Ke
ntM
aple
Val
ley
Kent
-Kan
gley
Roa
d16
850
Kent
Rent
onKe
nt E
ast H
ill16
951
Kent
Seat
tle C
BDTu
kwila
150
52Ke
ntRe
nton
84th
Av
S, L
ind
Av S
W15
353
Kirk
land
Belle
vue
Sout
h Ki
rkla
nd23
4/23
554
Kirk
land
Fact
oria
Ove
rlake
, Cro
ssro
ads,
East
gate
245
55La
ke C
itySe
attle
CBD
NE
125t
h St
, Nor
thga
te, I
-541
56N
orth
gate
U. D
istric
tLa
ke C
ity, S
and
Poin
t75
57La
ke C
ityU
. Dist
rict
35th
Ave
NE
6558
Laur
elhu
rst
U. D
istric
tN
E 45
th S
t25
59M
adiso
n Pa
rkSe
attle
CBD
Mad
ison
St11
60M
adro
naSe
attle
CBD
Unio
n St
261
Mag
nolia
Seat
tle C
BD34
th A
ve W
, 28t
h Av
e W
2462
Mer
cer I
sland
S M
erce
r Isla
ndIsl
and
Cres
t Way
204
63M
irror
Lak
eFe
dera
l Way
S 31
2th
St90
164
Mou
nt B
aker
Seat
tle C
BD31
st A
v S,
S Ja
ckso
n St
1465
Mou
ntla
ke T
erra
ceN
orth
gate
15th
Ave
NE,
5th
Ave
NE
347
66M
t Bak
erU.
Dist
rict
23rd
Ave
E48
67N
E Ta
com
aFe
dera
l Way
SW 3
56th
St,
9th
Ave
S18
268
Nor
thga
teU.
Dist
rict
Roos
evel
t66
EX/6
769
Nor
thga
teSe
attle
CBD
Gree
n La
ke, W
allin
gfor
d16
70N
orth
gate
U. D
istric
tRo
osev
elt W
ay N
E, N
E 75
th S
t68
71O
thel
lo S
tatio
nSO
DOCo
lum
bia
City
Sta
tion
5072
East
gate
Belle
vue
Bell-
Red
Road
226
73O
verla
keBe
llevu
eSa
mm
amish
Vie
wpo
int,
Nor
thup
Way
249
74Pa
cific
Aubu
rnAl
gona
917
75Q
ueen
Ann
eSe
attle
CBD
Que
en A
nne
Ave
N2/
1376
Que
en A
nne
Seat
tle C
BDTa
ylor
Ave
N3/
477
Rain
ier B
each
Seat
tle C
BDRa
inie
r Ave
778
Rain
ier B
each
Seat
tle C
ente
rM
LK Jr
Wy,
E Jo
hn S
t, De
nny
Way
8
† Fi
gure
s rou
nded
for d
ispla
y pu
rpos
es.
Corr
idor
s 46
and
47 a
re n
ot c
urre
ntly
serv
ed b
y an
y ro
ute.
Conn
ectio
ns
PEAK
OFFPEAK
NIGHT
PEAK
OFFPEAK
NIGHT
PRIMARY CONNECTIONSBETWEEN URBAN CENTERS
CORRIDOR HAS 15 MINPEAK SERVICE
ADD WHAT FREQUENCYNIGHT SERVICE?
PEAK
OFFPEAK
NIGHT
PEAK
OFFPEAK
NIGHT
RESULTINGSERVICE FAMILY
26%
23%
24%
--
--
--
--
-30
300
Loca
l11
%N
/AN
/A-
--
6030
30-
--
1530
30Fr
eque
nt0%
8%N
/A-
--
--
--
--
3030
0Lo
cal
53%
22%
12%
--
--
--
--
-60
600
Hour
ly59
%36
%N
/A1
--
-30
301
--
1530
30Fr
eque
nt10
0%47
%39
%1
--
-30
301
--
< 15
3030
Freq
uent
--
--
--
--
--
--
6060
0Ho
urly
--
--
--
--
--
--
6060
0Ho
urly
24%
42%
27%
--
--
3030
--
-15
3030
Freq
uent
71%
33%
43%
1-
--
3030
1-
-15
3030
Freq
uent
29%
26%
36%
--
-60
3030
--
-15
1530
Very
Fre
quen
t65
%38
%48
%1
--
6030
301
--
< 15
1530
Very
Fre
quen
t21
%N
/AN
/A-
--
6030
30-
--
1530
30Fr
eque
nt46
%43
%32
%-
--
-30
30-
--
1530
30Fr
eque
nt61
%73
%25
%1
1-
-30
301
1-
< 15
1530
Very
Fre
quen
t14
3%48
%86
%2
-1
6030
302
-1
< 15
1515
Very
Fre
quen
t0%
21%
0%-
--
-30
30-
--
1515
30Ve
ry F
requ
ent
68%
21%
37%
1-
--
3030
1-
-<
1515
30Ve
ry F
requ
ent
14%
6%N
/A-
--
--
--
--
3030
0Lo
cal
79%
48%
58%
1-
1-
3030
1-
1<
1515
15Ve
ry F
requ
ent
82%
49%
62%
1-
1-
3030
1-
1<
1515
15Ve
ry F
requ
ent
45%
14%
26%
--
--
3030
--
-15
1530
Very
Fre
quen
t36
%12
%N
/A-
--
--
--
--
6060
0Ho
urly
33%
19%
29%
--
--
--
--
-30
300
Loca
l84
%34
%58
%1
-1
-30
301
-1
< 15
1515
Very
Fre
quen
t49
%25
%42
%-
--
--
--
--
3030
0Lo
cal
98%
50%
71%
1-
1-
3030
1-
1<
1515
15Ve
ry F
requ
ent
42%
29%
16%
--
--
--
--
-60
600
Hour
ly87
%35
%49
%1
--
6030
301
--
< 15
1530
Very
Fre
quen
t85
%28
%49
%1
--
6030
301
--
< 15
1530
Very
Fre
quen
t69
%50
%N
/A1
--
-30
301
--
< 15
3030
Freq
uent
59%
46%
23%
1-
--
3030
1-
-15
3030
Freq
uent
24%
43%
12%
--
--
3030
--
-15
3030
Freq
uent
13%
15%
16%
--
--
3030
--
-15
3030
Freq
uent
20%
9%N
/A-
--
--
--
--
3030
0Lo
cal
89%
98%
79%
11
1-
3030
11
1<
1515
15Ve
ry F
requ
ent
79%
45%
64%
1-
1-
3030
1-
1<
1515
15Ve
ry F
requ
ent
93%
65%
75%
11
1-
3030
11
1<
15<
1515
Very
Fre
quen
t48
%32
%21
%-
--
6030
30-
--
1515
30Ve
ry F
requ
ent
Ride
rshi
p*Pe
akO
ffPe
akN
ight
110%
22
255
%1
11
Fina
l Tar
get S
ervi
ce L
evel
s and
Fam
ilyO
ther
Pol
icy-
base
d N
ight
Se
rvic
e Ad
ditio
nsSe
rvic
e Le
vel
Impr
ovem
ents
Load
s at P
relim
inar
y Se
rvic
e Le
vel *
Load
-Bas
ed S
ervi
ce L
evel
Im
prov
emen
ts
* Th
e av
erag
e lo
ad's
prop
ortio
n to
the
crow
ding
th
resh
old.
Rid
ersh
ip se
rvic
e le
vel i
mpr
ovem
ents
mov
e th
e pr
elim
inar
y le
vels
of se
rvic
e up
one
or t
wo
leve
ls, e
.g. a
rid
ersh
ip se
rvic
e le
vel i
mpr
ovem
ent o
f 2 c
hang
es a
30
min
. se
rvic
e to
<15
or a
60
min
. ser
vice
to 1
5, e
tc.
Abov
e Ta
rget
At T
arge
tBe
low
Tar
get

KING COUNTY METRO TRANSIT 2016 SYSTEM EVALUATION A-71
CORRIDOR ID NUMBER
BETW
EEN
AND
VIA
MAJOR ROUTE
79Ra
inie
r Bea
chCa
pito
l Hill
Rain
ier A
ve9E
X80
Redm
ond
East
gate
148t
h Av
e, C
ross
road
s, Be
llevu
e Co
llege
221
81Re
dmon
dTo
tem
Lak
eW
illow
s Roa
d93
082
Redm
ond
Fall
City
Duva
ll, C
arna
tion
224
83Re
nton
Burie
nS
154t
h St
F Li
ne84
Rent
onSe
attle
CBD
MLK
Jr W
y, I-
510
1/10
285
Rent
onRa
inie
r Bea
chW
est H
ill, R
aini
er V
iew
107
86Re
nton
Seat
tle C
BDSk
yway
, S. B
eaco
n Hi
ll10
687
Rent
onRe
nton
Hig
hlan
dsN
E 4t
h St
, Uni
on A
ve N
E10
588
Rent
onEn
umcl
awM
aple
Val
ley,
Bla
ck D
iam
ond
143E
X/90
789
Rent
on H
ighl
ands
Rent
onN
E 7t
h St
, Edm
onds
Av
NE
908
90Ri
chm
ond
Beac
hN
orth
gate
Rich
mon
d Bc
h Rd
, 15t
h Av
e N
E34
891
S Va
shon
N V
asho
nVa
lley
Cent
er11
892
Sand
Poi
ntU.
Dist
rict
NE
55th
St
3093
Shor
elin
eU.
Dist
rict
Jack
son
Park
, 15t
h Av
NE
373E
X94
Shor
elin
e CC
Nor
thga
teN
130
th S
t, M
erid
ian
Av N
345
95Sh
orel
ine
CCLa
ke C
ityN
155
th S
t, Ja
ckso
n Pa
rk33
096
Shor
elin
e CC
Gree
nwoo
dGr
eenw
ood
Av N
597
Tote
m L
ake
Seat
tle C
BDKi
rkla
nd, S
R-52
025
598
Woo
dinv
ille
Kirk
land
King
sgat
e23
699
Tukw
ilaSe
attle
CBD
Paci
fic H
wy
S, 4
th A
ve S
124
100
Tukw
ilaDe
s Moi
nes
McM
icke
n He
ight
s, Se
a-Ta
c15
610
1Tu
kwila
Fairw
ood
S 18
0th
St, C
arr R
oad
906
102
Twin
Lak
esFe
dera
l Way
SW C
ampu
s Dr,
1st A
ve S
903
103
Twin
Lak
esFe
dera
l Way
S 32
0th
St18
710
4U.
Dist
rict
Seat
tle C
BDEa
stla
ke, F
airv
iew
70/7
1/72
/73
105
U. D
istric
tSe
attle
CBD
Broa
dway
4910
6U
. Dist
rict
Belle
vue
SR-5
2027
110
7U
. Dist
rict
Seat
tle C
BDLa
kevi
ew25
108
UW
Bot
hell
Redm
ond
Woo
dinv
ille,
Cot
tage
Lak
e93
110
9U
W B
othe
ll/CC
CKi
rkla
nd13
2nd
Ave
NE,
Lk
Was
h Vo
ch T
ech
238
110
Wed
gwoo
dCo
wen
Par
kVi
ew R
idge
, NE
65th
St
71EX
111
Wes
t Sea
ttle
Seat
tle C
BDFa
untle
roy,
Ala
ska
Junc
tion
C Li
ne11
2W
hite
Cen
ter
Seat
tle C
BD16
th A
ve S
W, S
SCC
125
† Fi
gure
s rou
nded
for d
ispla
y pu
rpos
es.
Conn
ectio
ns
PEAK
OFFPEAK
NIGHT
PEAK
OFFPEAK
NIGHT
PRIMARY CONNECTIONSBETWEEN URBAN CENTERS
CORRIDOR HAS 15 MINPEAK SERVICE
ADD WHAT FREQUENCYNIGHT SERVICE?
PEAK
OFFPEAK
NIGHT
PEAK
OFFPEAK
NIGHT
RESULTINGSERVICE FAMILY
52%
16%
N/A
--
--
3030
--
-15
1530
Very
Fre
quen
t17
%36
%8%
--
--
3030
--
-15
3030
Freq
uent
13%
N/A
N/A
--
-60
3030
--
-15
3030
Freq
uent
9%5%
N/A
--
--
--
--
-30
300
Loca
l21
%28
%15
%-
--
6030
30-
--
< 15
1515
Very
Fre
quen
t13
0%27
%49
%2
--
6030
302
--
< 15
1530
Very
Fre
quen
t80
%37
%27
%1
--
-30
301
--
1530
30Fr
eque
nt58
%18
%29
%1
--
-30
301
--
< 15
1530
Very
Fre
quen
t19
%13
%25
%-
--
-30
30-
--
1515
30Ve
ry F
requ
ent
77%
5%N
/A1
--
--
-1
--
3060
0Lo
cal
10%
8%N
/A-
--
--
--
--
3030
0Lo
cal
30%
32%
26%
--
--
3030
--
-15
3030
Freq
uent
91%
22%
16%
1-
--
--
1-
-30
600
Loca
l15
%N
/AN
/A-
--
-30
30-
--
1515
30Ve
ry F
requ
ent
49%
N/A
N/A
--
--
3030
--
-15
1530
Very
Fre
quen
t23
%43
%16
%-
--
-30
30-
--
1530
30Fr
eque
nt7%
15%
N/A
--
--
--
--
-30
300
Loca
l96
%38
%19
%1
--
-30
301
--
1530
30Fr
eque
nt12
1%56
%44
%2
1-
6030
302
1-
< 15
1530
Very
Fre
quen
t22
%14
%16
%-
--
--
--
--
3030
0Lo
cal
42%
17%
27%
--
-60
3030
--
-15
1530
Very
Fre
quen
t13
%22
%13
%-
--
6030
30-
--
1530
30Fr
eque
nt9%
22%
N/A
--
--
3030
--
-15
3030
Freq
uent
41%
16%
N/A
--
--
--
--
-30
300
Loca
l29
%12
%20
%-
--
--
--
--
3030
0Lo
cal
115%
40%
75%
2-
160
3030
2-
1<
1515
15Ve
ry F
requ
ent
65%
39%
75%
1-
160
3030
1-
1<
1515
15Ve
ry F
requ
ent
89%
48%
48%
1-
-60
3030
1-
-<
1515
30Ve
ry F
requ
ent
14%
11%
N/A
--
--
3030
--
-15
3030
Freq
uent
19%
N/A
N/A
--
--
--
--
-60
600
Hour
ly22
%27
%N
/A-
--
--
--
--
3030
0Lo
cal
90%
56%
25%
11
--
--
11
-30
300
Loca
l11
8%75
%49
%2
1-
-30
302
1-
< 15
< 15
15Ve
ry F
requ
ent
54%
24%
36%
--
--
3030
--
-15
1530
Very
Fre
quen
t
Ride
rshi
p*Pe
akO
ffPe
akN
ight
110%
22
255
%1
11
* Th
e av
erag
e lo
ad's
prop
ortio
n to
the
crow
ding
th
resh
old.
Rid
ersh
ip se
rvic
e le
vel i
mpr
ovem
ents
mov
e th
e pr
elim
inar
y le
vels
of se
rvic
e up
one
or t
wo
leve
ls, e
.g. a
rid
ersh
ip se
rvic
e le
vel i
mpr
ovem
ent o
f 2 c
hang
es a
30
min
. se
rvic
e to
<15
or a
60
min
. ser
vice
to 1
5, e
tc.
Abov
e Ta
rget
At T
arge
t
Oth
er P
olic
y-ba
sed
Nig
ht
Serv
ice
Addi
tions
Serv
ice
Leve
l Im
prov
emen
tsFi
nal T
arge
t Ser
vice
Lev
els a
nd F
amily
Load
s at P
relim
inar
y Se
rvic
e Le
vel *
Load
-Bas
ed S
ervi
ce L
evel
Im
prov
emen
ts
Belo
w T
arge
t