office of industries working paper u.s. … · · 2013-09-09and the pine wood nematode, which may...
TRANSCRIPT
Wood Packaging SPS Regulations: Effects on U.S. Imports and Containerized Trade
No. ID -20
OFFICE OF INDUSTRIES WORKING PAPERU.S. INTERNATIONAL TRADE COMMISSION
Cathy JabaraDavid Ingersoll
Office of Industries U.S. International Trade Commission
Mary BurfisherUnited States Naval Academy
September 2008
Cathy Jabara is a Senior Economist and David Ingersoll is a Senior Environmental Specialist with theOffice of Industries of the U.S. International Trade Commission. Mary Burfisher is a Visiting Professorat the United States Naval Academy. Office of Industries working papers are the result of the ongoingprofessional research of USITC Staff and are solely meant to represent the opinions and professionalresearch of individual authors. These papers are not meant to represent in any way the views of the U.S.International Trade Commission or any of its individual Commissioners. Working papers are circulatedto promote the active exchange of ideas between USITC Staff and recognized experts outside the USITC,and to promote professional development of Office staff by encouraging outside professional critique ofstaff research.
Address correspondence to:Office of Industries
U.S. International Trade CommissionWashington, DC 20436 USA

1 The views expressed in this paper are not meant to represent in any way the views of the U.S. InternationalTrade Commission or any of its individual Commissioners. The authors thank Marinos Tsigas for helpful commentsand review.
Wood Packaging SPS Regulations: Effects on U.S. Imports and Containerized Trade1
Cathy Jabara, Mary Burfisher, David Ingersoll
September 2008
Abstract
International standards for wood packaging material (WPM) used in international trade were fullyimplemented by the United States in July 2006. These standards were based on guidelines of theInternational Plant Protection Convention (IPPC) and were designed to meet the pest eradication concernsof the countries party to the agreement. Other countries, such as Australia, the European Union, China,Canada, Mexico and New Zealand, have also implemented the IPPC standards. The IPPC standardsrequire that WPM in international trade be either heat treated or fumigated with methyl bromide, andmarked with an approved international logo. These standards are expected to raise the costs of woodpackaging material used in international trade.
This paper analyzes how the effects of a sanitary and phytosanitary (SPS) regulation, such as thetreatment of wood packaging, can be analyzed using a global model of international trade. The paperconcentrates on the effects on U.S. imports and on the use of wood pallets, the most common type ofwood packaging used in international trade. The paper includes a pallet database, based on U.S.containerized vessel trade and truck imports, to estimate the number of pallets that might be subject tothese new import regulations. The Global Trade Analysis Project (GTAP) model was used to analyzehow changes in pallet costs could affect U.S. imports. The increased pallet costs were incorporated intothe model through the international trade and transport margins for various U.S. import sectors.
The paper includes three scenarios: (1) adoption of wood pallet treatment by all U.S. trading partners,except China, which had already met the IPPC standards, and Canada, which is exempted from U.S.wood pallet regulations, (2) requirements for alternative packaging (low-cost scenario), and (3)requirements for alternative packaging (high-cost scenario). The purpose of the last two scenarios is tofurther test the model to see how increased pallet costs could impact trade. The results indicate that theimpact of changes in pallet costs is small due to the low value of the pallet in trade and transportationcosts, but that some sectors, such as agriculture, are more likely affected. Additionally, imports fromChina and Canada may receive a small competitive benefit from U.S. pallet requirements due to the factthat these countries do not have to implement changes to meet the requirements in the U.S. market.However, should the United States adopt additional pallet treatment regulations, such as for alternativepackaging, that affect China, the latter’s imports would be the most likely affected due to the importanceof China in U.S. containerized trade. Model results indicate that Latin America also has aggregate gainsin exports to the U.S. because its transport margins in some large traded sectors are lower than othersuppliers to the U.S. market.

2 Wood packaging used in international trade includes wood pallets, dunnage, crating, cases, and skids. Thispaper analyzes wood pallets, as there is little quantitative information on the extent of use of other wood packagingmaterials.
2
Introduction
Wood packaging can play host to insect and disease pests, including the Asian long-horned beetle
and the pine wood nematode, which may escape and become established in the importing country. This
has led to international standards, which were fully implemented in 2006 by the United States as well as
other countries, requiring treatment for wood pallets and other wood packaging used in international
trade. These treatments are expected to raise the cost of wood pallets used in international trade, but the
extent to which treatment costs will affect international trade in specific commodities, has not been
analyzed. The purpose of this paper is to examine the possible effects of certain regulations (treatment of
wood pallets and requirements for alternative packaging) on U.S. imports in a multi-commodity context
using the Global Trade Analysis Project (GTAP) model (Hertel,1997). The paper may be of interest to
economists and researchers interested in examining how SPS regulations, such as the pallet treatment, can
be analyzed as to the effects on international trade.
Concern with regulating treatment for wood pallets2 in international trade first surfaced in 1998
when the Animal and Plant Health Inspection Service (APHIS) of the U.S. Department of Agriculture
(USDA) issued an interim rule requiring that all solid wood packaging material (SWPM) from China be
treated with preservatives, heat-treated, or fumigated prior to arrival in the United States (USDA, APHIS,
1998). These requirements followed the interception of three taxa and one beetle on SWPM from China.
In 2001, the EU adopted emergency measures requiring treatment and marking of all new and used
coniferous, nonmanufactured wood packing material (WPM) originating in the United States, Canada,
China, and Japan. In March 2002, the United States, along with other countries party to the International
Plant Protection Convention (IPPC), signed the International Standards for Phytosanitary Measures
Guidelines for Regulating Wood Packaging Material in International Trade (ISPM 15). The ISPM 15
regulations were fully implemented in July 2006 by the United States. All WPM entering or transiting
through the United States must be either heat treated or fumigated with methyl bromide, as outlined in the

3 Requirements for alternative packaging are not part of the IPPC standards. However, however we analyze thisscenario in the paper to examine how increased pallet costs might affect international trade.
3
IPPC standards, and marked with an approved international logo certifying it has been appropriately
treated. In regard to the adoption of the rules in the United States, the rules do not apply to WPM for
domestic use in the United States, or to wood packaging material in bilateral trade between the United
States and Canada. (USDA, APHIS, 2006).
This paper concentrates on likely economic effects of wood pallet treatment on U.S. imports.3 A
pallet is a movable platform used for storing or moving freight. A difficulty in any economic analysis of
wood pallets is that use of pallets is limited to supply chains servicing specific manufactured and/or value
added products. As such, we first create a data set to examine the use of pallets in U.S. imports. Second,
using calculated weights of the share of pallet costs in the transport margins, we then estimate some likely
effects of wood pallet treatment costs and alternative packing costs on U.S. imports for various pallet-
using U.S. import sectors.
Review of Literature
Strategic Design and Development (2002) completed a study of the Australian pallet in domestic
and international logistics for various industry groups in Australia. The authors noted that not all supply
chains are serviced by pallets, leading to a lack of specific data on the use of pallets in the movement of
specific commodities. They developed three categories of goods based on the extent to which they might
be on pallets: (1) bulk commodities and refined products, or automotive vehicles, that are never palletized
or containerized; (2) break bulk cargoes that may be in packages and containers, and may be palletized;
and (3) goods that are almost always containerized in domestic use, such as grocery and consumer items,
whose import/export movements may employ pallets or slip-sheeting, or are hand-stacked within the
container.
APHIS (2003) examined the likely impact of increased pallet treatments costs on U.S. imports as
whole, but not on specific commodities in its regulatory analysis of the wood packaging rule. APHIS’
analysis of treatment costs used data on standard 48" x 40" pallets, the most commonly used size of pallet,

4 This number is based on the assumption that pallets used to transport imported goods accounted for 25 percentof the number of new pallets manufactured each year in the United States in 2001. This share is based on the estimated share of imports less petroleum and related products in personal consumption expenditures of durable andnondurable goods.
4
which accounts for 31 percent of all pallet sizes. APHIS estimated that 70 percent of all goods traded
internationally are accompanied by some type of solid wood packing material.
The APHIS analysis noted that increased pallet costs may add to the cost of packaging and
transporting goods, which in turn, would affect importers of goods transported on pallets. However,
APHIS’ impact analysis found that increased pallet costs were not expected to have a measurable impact
on trade due to the small cost of the pallet compared to the value of trade. APHIS assumed that, in 2001,
approximately 100 to 125 million pallets per year were used for goods imported into the United States.4
Based on a price of $4 per imported pallet, APHIS estimated that imported pallets accounted for .044
percent of the value of U.S. imports of goods in 2001. Increased treatment costs of approximately $2 per
pallet were not expected to appreciably affect the overall value of U.S. trade.
The APHIS analysis also noted that as all countries signatory to the IPPC adopt the new treatment
standards, U.S. exports on wood pallets will also be affected. However, according to APHIS, a
significant portion of U.S. softwood lumber pallets is kiln dried and thus meets the IPPC standards (p.
17). Hicks estimated in 2001 upward of 30 percent of new pallets produced annually in the United States,
as well as a higher percentage of new pallets used for exports, are made of entirely of softwood
(coniferous) lumber.
Molina-Murillo, et. al. (2005) examined the impact of U.S. adoption of the IPPC standards on
U.S. exporters to gain insight into the role of wood pallets in the international supply chain and
competition from alternative materials. Based on a survey of U.S. exporters of containerized products in
September, 2003, the study estimated the number of pallets used in U.S. exports at 60-70 million. The
study estimated the number of export pallets based on shipments in twenty-foot equivalent units (TEUs),
and response data from the survey that indicated that 90 percent of containers shipped include pallets, 93
percent of such pallets are made of wood, and that containers with pallets held, on average 20.75 pallets.

5
The study further found that pallet strength and price are the major attributes associated with purchase of
pallets.
A study by Ray et. al. (2007) examined the likely impact of EU Directive 2004/102/EC that will
require wood packaging materials to be “debarked” by 2009. Their study showed the proposed EU
regulation could add $2.7 billion over 10 years to the cost of U.S. pallets in international trade. Ray. et.
al. examined the potential that such regulations could lead to replacement of solid wood pallets with
alternatives, such as plastic pallets. They estimated that a one-way plastic pallet could cost from $15 to
$43.75 per pallet, compared to current U.S. pallet prices of $8 to $12.
A final paper by Raballand and Aldaz-Carroll (2005) examined the impact of the multiplicity of
different pallet sizes on trade costs. The authors found depalletizing and repalletizing goods, due to
differing standards among countries, resulted increased delivery time and cost.
Estimates of Pallet Use in U.S. Imports
Imports may enter the United States by vessel, air, rail, truck, or pipeline. For estimates of pallet
use in U.S. imports, we concentrated on imports via containerized vessels and by truck. As noted by
Strategic Design and Development (2002), pallets may be used in break bulk shipping, which is not
containerized, and not all containers include pallets. However, containerized vessel trade is a good start
for this estimation, given the extensive use of pallets in this mode. The Department of Commerce (DOC),
through its USA Trade Online database, provides detailed information on the shipping values and
volumes, by vessel and air, for U.S. imports and exports, including containerized vessel shipments for
2006. Although shipments by air may use wood pallets, there is less known about their use of pallets as
compared to containerized vessel traffic.
Truck and rail shipments are important for U.S. imports entering from Canada and Mexico. The
Bureau of Transportation Statistics (BTS) TransBorder database includes detailed data by transport mode
for trade between NAFTA countries. We included data on truck shipments from this database for Mexico
to account for pallet use in container trucks. We did not include truck shipments from Canada because,
for the purpose of the IPPC regulations and pallet treatment, Canadian pallets are treated the same as

5 Rail shipments may also use pallets, but such use was not estimated in the paper. In 2006, U.S. imports fromMexico via rail amounted to $25.9 billion compared to $126.5 billion via truck as estimated by the BTS (PressRelease, 2007). 6 This information was conveyed via a U.S. customs officer and by a representative from the Maersk shippingline.
6
those manufactured for domestic use in the United States, and thus do not require treatment. In 2006,
shipments by truck accounted for 61.1 percent of U.S. goods trade with NAFTA partners.5
Containerized Vessel Trade
In 2006, U.S. imports via containerized vessels amounted to $511.3 billion, or 27.6 percent of
total U.S. imports (figure 1). China was the largest source of such imports, accounting for 37.9 percent of
containerized vessel imports, followed by the European Union (EU-25) and Japan. Containerized vessel
imports also accounted for the bulk of U.S. imports from China (67.1 percent), as well as from Indonesia
(66.6 percent), and from Vietnam (75.3 percent). U.S. containerized vessel imports tend to be highly
concentrated among certain countries. The top 11 countries (including the EU-25) accounted for 90.7
percent of containerized vessel imports in 2006.
Examination of U.S. containerized vessel imports by commodity sector indicates that textiles,
apparel, and footwear tend to be the most highly containerized, with 72.2 percent of such imports arriving
in containers in 2006, followed by agricultural products (55.0 percent) and chemicals and plastics (33.3
percent) (figure 2). However, textiles, apparel, and footwear are unlikely to be palletized, as most
containers include garments hung on racks or products stacked in cardboard boxes.6 Agricultural
products are most likely to use pallets in U.S. imports. Some products, such as fertilizers, petroleum,

7
287.8330.6
148.1
38.2 45.8
946.1
193
92.755.2
18.9 15.2
134.2
China EU-25 Japan Taiwan KoreaS All Other0
200
400
600
800
1,000
Total Container vessel
Figure 1. U.S. imports total and by vessel container
Source: U.S. Department of Commerce
72.2
55
33.3 32.229.2 26.7
0.4
28.3
0
10
20
30
40
50
60
70
80
Textiles/apparel/footwear Agricultural products Chemicals/plasticsWood/paper/pulp Manufactures Metals/stonePetroleum/fertilizers Total products
Figure 2. Share of U.S. Imports by Container Vessel
Source: U.S. Department of Commerce

7 This information was conveyed via a representative from Louis Dreyfus, a major coffee importer. 8 As noted earlier, since the purpose of the paper is to estimate pallet use for economic analysis of pallet treatmentcosts, the shipments via truck from Canada were not included because Canadian pallets are treated the same as U.S.domestic pallets and do not require treatment.
8
and some petroleum products are shipped in bulk, and only a few products in these sectors are
containerized. Air shipments tend to be important for pharmaceutical products, therefore containerized
vessel values for such products are relatively low compared to other sectors.
For the largest source of U.S. containerized imports, China, nine HS chapters accounted for 70
percent of the containerized vessel import value in 2006: nuclear reactors, boilers, and machinery;
electrical machinery; furniture, bedding and lamps; toys, games, and sports equipment; footwear; plastics;
articles of iron and steel; leather, saddlery, and handbags; and certain vehicles and accessories. For
Indonesia, apparel, electrical machinery, and rubber articles accounted for the bulk of U.S. containerized
imports. In the case of Vietnam, containerized imports were largely apparel and footwear, furniture and
bedding, fish, and coffee. Unroasted coffee beans are also unlikely to be palletized. Such products are
usually shipped in lined containers, or in bags placed directly in the containers, and then palletized on
reaching the United States.7
Adjustment for Truck Shipments from Mexico
Estimates of containerized trade using vessel port traffic, shown in figure 1, understate the
importance of shipments from Canada and Mexico, the United States’ first and third-largest import
suppliers in 2006. In particular, imports from these countries may enter by containerized trucks and be
palletized, similarly to containerized vessel traffic. As an example of this key omission, a representative
from the Fresh Produce Association of the Americas, a trade association whose members import fruits
and vegetables from Mexico, indicated that most fruits and vegetables imported from Mexico are shipped
in containerized trucks and packed on wooden pallets.
To account for U.S. imports via truck in the estimation of pallet use, we added in the value and
volume data for U.S. imports via truck for Mexico8 from the BTS TransBorder database. In 2006,
9 Molina-Murillo et. al. adjusted their estimates of pallets used in exports by deducting for containers that do notinclude pallets and for pallets not made of wood.
9
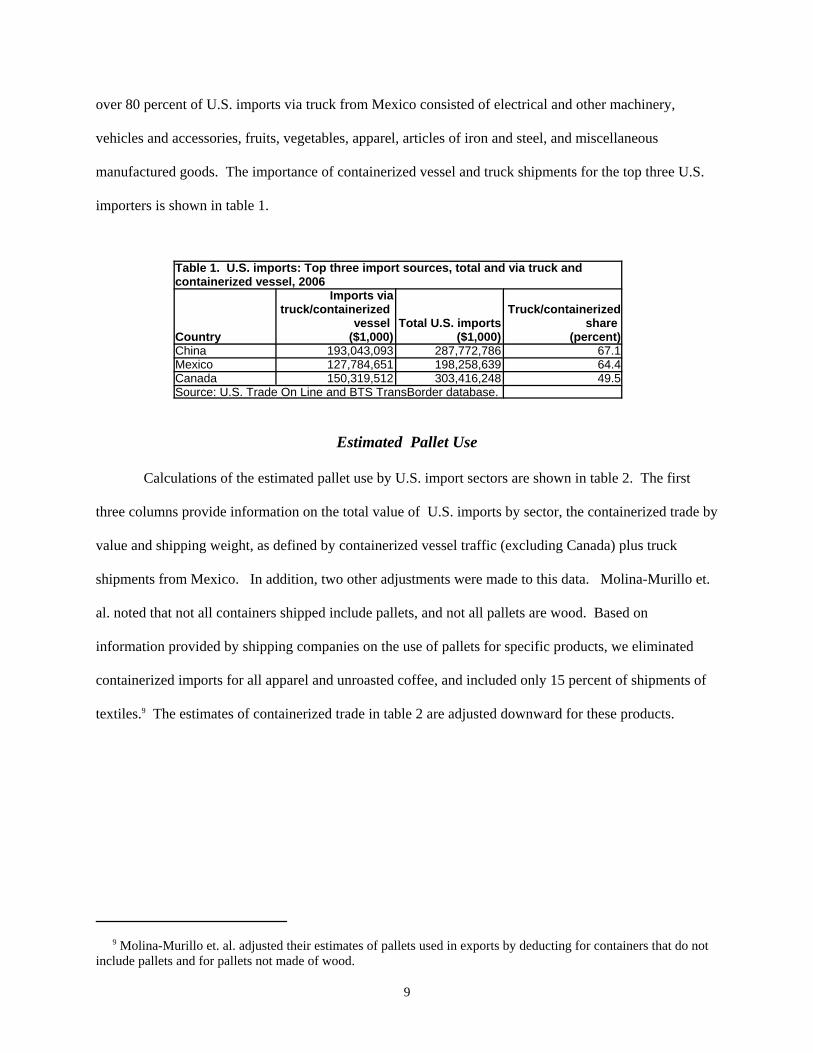
over 80 percent of U.S. imports via truck from Mexico consisted of electrical and other machinery,
vehicles and accessories, fruits, vegetables, apparel, articles of iron and steel, and miscellaneous
manufactured goods. The importance of containerized vessel and truck shipments for the top three U.S.
importers is shown in table 1.
Table 1. U.S. imports: Top three import sources, total and via truck andcontainerized vessel, 2006
Country
Imports viatruck/containerized
vessel ($1,000)
Total U.S. imports($1,000)
Truck/containerizedshare
(percent)China 193,043,093 287,772,786 67.1Mexico 127,784,651 198,258,639 64.4Canada 150,319,512 303,416,248 49.5Source: U.S. Trade On Line and BTS TransBorder database.
Estimated Pallet Use
Calculations of the estimated pallet use by U.S. import sectors are shown in table 2. The first
three columns provide information on the total value of U.S. imports by sector, the containerized trade by
value and shipping weight, as defined by containerized vessel traffic (excluding Canada) plus truck
shipments from Mexico. In addition, two other adjustments were made to this data. Molina-Murillo et.
al. noted that not all containers shipped include pallets, and not all pallets are wood. Based on
information provided by shipping companies on the use of pallets for specific products, we eliminated
containerized imports for all apparel and unroasted coffee, and included only 15 percent of shipments of
textiles.9 The estimates of containerized trade in table 2 are adjusted downward for these products.

10
Table 2. U.S. imports and estimated pallet data, 2006Sector
Imports($1,000)1
(1)
Containerized/truckimports
($1,000)2
(2)
Containerized/truckimports
shipping weight(metric tons)2
(3)
Twenty-footequivalent units
(TEUs)3
(4)
Number ofpallets4
(5)
Pallet/margin(percent)5
(6)Meats 6,808,262 4,620,815 1,435,686 200,403 4,008,057 13.4Fruits and vegetables 11,123,251 8,070,685 10,751,230 1,500,730 30,014,601 19.1Grains, milled grains 1,723,637 690,014 1,070,388 149,412 2,988,241 20.9Oilseeds, fats, oils 4,710,145 2,550,322 1,238,540 172,884 3,457,677 16.2Processed products,beverages, tobacco 38,009,299 25,083,486 15,462,070 2,158,301 43,166,025 18.3Fish, other agriculture 20,232,047 8,127,613 1,859,691 259,588 5,191,767 3.9Salt, ores, slags 6,024,975 1,179,208 7,360,994 1,027,498 20,549,955 14.5Petroleum, fertilizers 337,052,681 1,355,543 5,445,802 760,162 15,203,244 1.4Chemicals, plastics 131,719,688 57,066,935 20,048,438 2,798,498 55,969,955 9.6Pharmaceuticals 42,349,177 6,512,142 121,675 16,984 339,685 1.3Hides, furskins 10,738,423 6,764,946 996,914 139,156 2,783,121 3.7Wood, pulp, paper 50,424,853 17,648,240 12,700,630 1,772,841 35,456,812 13.1Textiles, apparel,footwear 113,299,000 4,747,255 848,683 118,465 2,369,300 0.4Stone, ceramic, 17,554,819 13,459,526 15,470,251 2,159,443 43,188,864 19.8Metals and articles 158,286,716 47,497,993 19,354,504 2,701,634 54,032,674 9.7Machinery 473,101,271 213,397,749 22,049,381 3,077,803 61,556,061 5.4Vehicles, transport 236,269,473 47,555,690 8,152,142 1,137,932 22,758,632 5.7Manufactures 137,130,083 75,999,115 16,200,657 2,261,398 45,227,965 5.6
Total 1,796,557,800 542,327,185 160,567,676 22,413,132 448,262,636Source: USA Trade Online, BTS TransBorder database.1Imports in HS chapters 1-97 only.2Includes imports via containerized vessels and truck shipments from Mexico. Data do not included containerized shipments of apparel orunroasted coffee, and include only 15 percent of shipments of textile products.3Shipping weight divided by 7.164 mt per TEU.4TEU multiplied by 20 pallets per TEU.5Number of pallets multiplied by $9 per pallet to get the pallet value. Pallet/margin percent is the share of the pallet value divided by the transportmargin between cost, insurance, and freight (c.i.f.) and customs value imports in 2006.

10 The TEU is a measure of containerized cargo capacity equal to one standard container. 11 For example, the average containerized value of imports per pallet for agricultural products in HS chapters 1-24is estimated at $760 while for manufactured goods in HS chapters 90-97, this value is $3,500.
11
Column 4 shows the estimated number of shipping containers, based on standard twenty-foot
equivalent units (TEUs) for the volume shipped.10 The DOT/BTS (2003) estimated the volume of U.S.
containerized imports via coastal ports in 2001 (80.7 million metric tons) and the corresponding TEUs
(11.3 million), providing a relationship of 7.164 metric tons per TEU in that year. This same relationship
was applied to the containerized volume data for 2006 for each sector to provide the estimated TEUs.
The number of pallets (column 5) was estimated based on 20 pallets per TEU (Molina-Murillo, et. al.).
Column 6 shows the estimated relationship between pallet cost and the margin between imports
valued at cost plus insurance and freight (cif) and customs value. This relationship is used as a ball park
estimate of the share of the pallet value in international transport cost. The data were used in the GTAP
analysis below to analyze the effects of pallet treatment costs on U.S. imports. According to the Wood
Pallet and Container Association, the current cost of a new, standard pallet ranges from $8-$12. Imported
pallets tend to be new, and usually lower priced, than U.S. pallets. Thus, we multiplied the number of
pallets by $9 per pallet, which is at the lower part of the range, to get this estimate.
The pallet margin shares take into account both the estimated pallet usage and the value of trade.
For example, most agricultural products (except other agriculture) and the stone and ceramic sector have
relatively high pallet share margins due to higher containerized volumes and the lower estimated product
value per pallet. The lowest pallet margin shares, aside from products commonly shipped in bulk such as
fertilizers and petroleum, are those for manufactured goods and vehicles, where pallets may be used less
and/or the value per pallet is higher.11 Figure 3 summarizes the pallet margin shares for the top sectors.

12
Analysis of Pallet Treatment Costs on U.S. Imports
In this section, we analyze the likely effects of pallet treatment regulations implemented by the
United States in 2006. In addition to treatment costs, we also look at scenarios in which the United States
imposes requirements that pallets used in U.S. imports be made from alternative material. The purpose of
these scenarios is to further test the model as to the impact of higher pallet costs in international trade. In
comments submitted to APHIS regarding treatment options, some environmental groups were concerned
that the IPPC regulations would cause other harm to the environment, namely increased depletion of the
ozone layer due to use of methyl bromide as a fumigant (APHIS, 2003). Thus, APHIS was urged to
examine the use of pallets made from materials other than wood.
Pallet Treatment Costs in the GTAP Model
For the analysis, we use a 7-region, 22-sector version of the standard GTAP model. The seven
regions (U.S., Canada, China, EU-25, Asia, Latin America, and ROW) were defined based on the major
import sources for U.S. containerized trade shown in table 1. We defined the 22 sectors of the model by
aggregating industries that have similar magnitudes of pallet use relative to the total costs of transporting
20.919.8
19.118.3
16.2
14.513.4 13.1
10
Grains Stone/ceramic Fr/vegetable Proc Agriculture Oilseeds/fats Salt/ores Meats Wood/paper Chemical/metals0
5
10
15
20
25Figure 3. Share of pallet costs in transport margins
Source: Authors’ calculations

13
goods from the exporting to the importing country. The model has two factors of production (labor and
capital). We assume a standard GTAP closure.
An advantage of the GTAP framework in this analysis is that the database and model explicitly
account for trade and transportation costs in bilateral trade flows. Data on trade and transport margins in
GTAP are based on detailed (SITC4 and 5 digit-level) commodity statistics for 1997 from the United
States Bureau of the Census, Foreign Trade Statistics. U.S. statistics report the import value of
commodities including cost, insurance and freight (cif) charges, but excluding import tariffs. U.S.
statistics also report the customs import value (civ) of commodities. Similar to free on board (fob) values,
the civ is the price of a merchandise import excluding freight, insurance, and import duties. Differences
between cif and civ for U.S. imports therefore provide a measure of trade and transport margins on a
bilateral and commodity basis.
Gehlhar and MacDougal (2002, 2005) describe their procedure for extrapolating information on
U.S. bilateral trade and transport margins to the GTAP database on global bilateral margins. Treating
U.S. trade and transport margins as representative of typical costs, trade-weighted U.S. margins are
applied to all global trade flows with exceptions for some commodities, and with lower margins assumed
for intra-regional bilateral trade flows.
The bilateral trade and transportation margins that apply to U.S. imports in the model are reported
in table 3 as a proportion of the cif value. Note the variation in margin rates across commodities. In
general, margin rates are relatively high for products with a low value per ton, particularly minerals,
mineral products, wood/paper products, and some agricultural products. Differences in margin rates also
vary due to the location of trade partners, with costs for many commodities being lower for U.S. imports
from Canada compared to other regions. Differences in margin rates for a commodity across trade
partners are also due to differences in the composition of the commodity and in the underlying transport
costs.

14
Table 3. GTAP model: Trade and transport margins as a share of U.S. cif import value
Canada China EU-25LatinAmerica Asia ROW
Cereals 2.23 0.35 5.51 4.67 12.20 3.31Horticulture 9.16 3.10 20.62 14.13 7.65 12.95Oilseeds 2.44 4.37 4.10 4.58 4.45 4.91Misc. pallet-using ag. 5.17 8.58 8.94 10.57 9.48 6.15Other agric. 10.00 2.92 4.19 12.11 8.67 4.88Natural Resources 2.72 5.93 6.37 5.16 8.59 6.19Minerals 14.01 16.33 15.55 20.63 14.31 11.64Meat prods. 2.13 1.35 2.84 4.74 7.22 6.75Oils and fats 2.74 4.56 5.65 4.81 10.77 5.25Dairy prods. 2.79 1.51 4.20 4.47 5.32 4.31Sugar and prods. 3.59 3.66 7.35 9.96 9.21 10.05Other food preps. 3.13 6.29 6.29 6.67 5.49 6.48Beverages 2.84 2.58 4.74 3.23 5.06 5.02Textiles/leather 2.35 5.69 5.54 3.27 4.93 4.41Wood/paper 4.64 9.18 7.78 5.80 9.27 9.44Petroleum/coal 3.53 8.66 6.81 6.79 6.91 7.27Chems., rubber, plastic 2.82 6.43 2.15 3.94 4.65 3.36Mineral prods. 5.66 11.16 11.10 10.25 11.48 11.90Metal prods. 2.29 6.50 5.42 4.43 6.29 3.44Vehicles and parts 1.07 6.28 1.79 1.18 2.50 1.87Electronics, other mfg. 1.57 4.43 2.58 1.43 2.29 1.73Source: GTAP, v.6, 2001.
In the GTAP model, when a single margin has been specified, the trade and transport margin
(VTFSD) on good I from region r to region s is described as the price gap between the cif and customs
value imports:
VTFSD(i,r,s) = VIWS(i,r,s) - VXWD(i,r,s)
here VIWS is the cif value of imports and VXWD is the customs value of imports. The quantity of
bilateral trade and transport services (QTFMSD) are assumed to be demanded in fixed proportion to
traded quantities (QXS):
QTMFSD(i,r,s) * ATMFSD(i,r,s) = QXS(i,r,s)
where ATMFSD refers to the bilateral, commodity-specific level of technical efficiency of trade and
transport margin services. A negative change in this productivity parameter raises the amount of margin
services required for a bilateral trade, and therefore directly raises the cif price of an import. We use this
productivity parameter in our model simulations to introduce changes in the costs of trade and transport
services due to changes in regulations regarding treatment of pallets. We assume that our estimated

12 Note that as all countries adopt IPPC pallet guidelines, all global imports will be affected. The scenariosanalyzed in this paper are from a U.S. perspective.
15
percentage change in bilateral margin costs due to new pallet regulations is equivalent to a change in
quantity of margin services required for the bilateral trade route.
GTAP Scenarios
We use the model to explore three scenarios as to the effects on U.S. imports:12
• (1) Heat/fumigation treatment--We assume that new global treatment requirements will lead to
EU-25, Asia, Latin America and ROW adoption of pallet treatment in their global trade. We
assume no change in Chinese, U.S. or Canadian treatment under the assumptions that this trade
has already adjusted to meet bilateral European and U.S. regulatory requirements. Canadian
pallets are treated the same as U.S. pallets.
• (2) Pallet treatment plus low-cost alternative packaging--The change in treatment in (1) is
combined with the imposition of alternative packaging rules unilaterally by the United States.
China is assumed to adopt alternative packaging with respect to the United States. EU-25, Asia,
Latin America and ROW adopt both treatment and alternative packaging practices to the United
States, but treatment only to non-U.S. trade partners. There are no changes in U.S. or Canadian
packaging practices.
• (3) Pallet treatment plus high-cost alternative packaging–Pallet treatment is combined with
alternative packaging requirements by the United States, but at a higher cost. China adopts
alternative packaging with respect to the United States. EU-25, Asia, Latin America and ROW
adopt both treatment and alternative packaging practices to the U.S., but heat treatment only to
non-U.S. trade partners. There are no changes in U.S. or Canadian packaging practices.
The effects of the changes in scenarios 1, 2, and 3 on commodity margin costs are shown in table
4. The percent changes are based on the change in pallet costs and the share of the pallet cost in the
commodity transport margin (table 2, column 6). The pallet treatment is assumed to raise the cost of the

16
pallet by 22 percent, at a cost of $2 per pallet. The cost of alternative pallet packaging is assumed to
range from $15 per pallet (low-cost scenario) to about $28 per pallet (high-cost scenario), which is within
the range described by Ray et. al. The costs associated with alternative packaging do not include disposal
or other adjustment costs.
Results
Our results support these general conclusions:
At the aggregate level, impacts of pallet treatment regulations on the value of U.S. imports by
region is relatively low, with changes in regional imports of $151 million or less from the base year of
the model (2001) (table 5). Trade expansion by China and Canada is mainly explained by trade diversion,
as other countries’ trade and transport margins increase. Latin America also has aggregate gains in
exports to the United States because its transport margins in some large traded sectors (electronics and
vehicles and parts) have a lower share as a percent of the cif price as compared to other suppliers to the
U.S. market. The changes in bilateral trade are very small (less that 0.1 percent) as shown in figure 4, and
the percentage change in overall U.S. imports is negligible.

17
Table 4. Effects of new pallet regulations on margin costs (percent change frombase margin cost)
Alternative packagingPallettreatment Low cost High cost
Cereals 5.6 9.1 37.2Horticulture 5.6 9.1 37.2Oilseeds 2.2 3.6 14.9Misc. pallet-using agriculture 4.4 7.3 29.8Other agriculture 1.1 1.8 7.4Natural resources 0.4 0.7 3.0Minerals 3.3 5.5 22.3Meat products 3.3 5.5 22.3Oils and fats 4.4 7.3 29.8Dairy products 3.3 5.5 22.3Sugar and products 3.3 5.5 22.3Other food preparations 5.6 9.1 37.2Beverages 4.4 7.3 29.8Textiles/leather 0.4 0.7 3.0Wood, pulp, paper 2.2 3.6 14.9Petroleum/coal 0.4 0.7 3.0Chemicals, rubber, plastics 2.2 3.6 14.9Mineral products 2.2 3.6 14.9Metal products 2.2 3.6 14.9Vehicles and accessories 1.1 1.8 7.4Electronics, othermanufacturing 1.1 1.8 7.4Source: Authors’ calculations.Note: Pallet shares were rounded and range from 2-25 percent.
Table 5. Change in value of U.S. imports ($US million, fob value)
Canada China EU-25Latin
America Asia ROW
U.S.global
importsPallet treatment 50.9 66.4 -143.4 139.7 -150.5 46.0 9.1Treatment plus low-cost alternativepackaging 336.1 -848.6 -480.8 9.9 -405.2 -75.5 -1,464.1Treatment plus high-cost alternatepackaging 1,357.0 -2,050.9 -2,258.1 -890.1 -2,598.0 -773.4 -7,213.5Source: Authors’ calculations.
The addition of alternative packaging requirements leads to a reduction in the value of U.S.
overall imports, and to increased trade diversion of U.S. imports toward Canadian supply, given that in
this scenario increased pallet costs are also applied to Chinese trade. The high estimate of the alternative

18
treatment cost leads to more substantial changes in bilateral import sourcing by the United States – of up
to $2.6 billion in the case of Asian supply. But these changes in flows are in all cases less than 1.6
percent of the initial regional imports, valued in fob. U.S. imports from China show the greatest decline
in the alternative packaging scenarios. This seems reasonable given that China is the largest source of
containerized U.S. imports.
Canada China EU-25 LatAmer Asia ROW United States-2
-1.5
-1
-0.5
0
0.5
1
Heat treatment Heat + alt. packaging (low cost)
Heat + alt. packaging (high cost)
Figure 4. Effects of pallet regulations on U.S. imports
Source: Authors calculations

19
Sectoral Effects
The general equilibrium framework captures the macroeconomic implications of pallet
regulations that raise transport costs for imports. Similar to the imposition of a tariff, a transport
regulation raises the domestic price of the import, reducing domestic demand for it and causing its world
price to fall relative to that of the home good. Similar to tariffs, this appreciation of the importer’s real
exchange rate helps offset the effects of the regulation on import demand. In the pallet treatment only
experiment, we find exchange rate appreciation in the United States, Canada and China and depreciation
in the EU-25, Latin America, Asia and ROW (table 6). The real exchange rate appreciation of the U.S.
mitigates the effects of higher margin costs in dampening U.S. demand for imports from the regions
facing new treatment regulations. For products with low margin costs – vehicles and parts, and
electronics/misc. manufactures, the U.S. appreciation becomes dominant, and leads to increased U.S.
imports of low-margin goods from the EU-25, Latin America, Asia and the ROW. Real exchange rate
appreciation in Canada and China causes their exports of low-margin goods to the U.S. to decline.
Table 6. Effects of pallet regulations and alternative packaging requirements on real exchange rates(percent change from base)
UnitedStates Canada China EU25
LatinAmerica Asia ROW
Pallet treatment 0.05 0.06 0.06 -0.02 -0.05 -0.04 -0.05Treatment plus low-costalternative packaging 0.06 0.12 0.02 -0.03 -0.06 -0.05 -0.05Treatment plus high-costalternate packaging 0.10 0.36 -0.05 -0.04 -0.14 -0.08 -0.08Source: Authors’ calculations. Real exchange rate is defined as the ratio between the average countryfactor price and the world factor price index.
The impacts of pallet treatment only and pallet treatment plus the high-cost alternative packaging
scenarios on individual commodity sectors are shown in appendix figures 1 and 2. For most
commodities, the impact of pallet treatment costs on the import value to the United States is relatively low
– 1 percent or less (appendix table 1). Agricultural products experience the largest percentage changes,
on a value basis–with horticultural products and vegetable oils experiencing the largest declines in U.S.
imports. These commodities generally have higher shocks to the trade and transport margins, due to the
higher use of pallets and their importance in trade and transport margins. The high-cost alternative

20
packaging scenario shows a higher impact on commodity sectors. In this scenario, the largest impacts are
on agricultural products, with products such as textiles and leather, and petroleum and coal, which have
low pallet use, exhibiting small increases in trade. In this scenario, products such as vehicles and parts,
and electronics, show a small percentage decline, due to the inclusion of higher pallet costs on China’s
trade.
Conclusions
As globalization and international trade expands, new regulations on trade may arise due to
environmental concerns. In this paper, we analyzed how the impact of an SPS measure, such as
treatment and alternative packaging rules for wood pallets used in international trade, could be treated in a
global model of international trade. We created a database to estimate the use of pallets in U.S. imports,
and explored how increased pallet costs might affect sectoral trade with the use of the GTAP model.
Increased pallet costs were incorporated into the model through the international trade and transport
margins. Although the effects appear to be small, the data and model results indicate that agricultural
products might be the most affected with increased pallet costs. In addition, U.S. imports from China
could be the most affected if pallet rules are introduced that would involve additional pallet costs due to
China’s role as the largest U.S. supplier of containerized vessel trade. The alternative packaging rules
examined do not include disposal or other costs that might be associated with pallets made from
alternative materials.

21
Bibliography
Gehlhar, Mark and Robert McDougall (2002). “V5 Documentation: Chapter 15d: Transportation Marginsand Modes – GTAPv.5.” https://www.gtap.agecon.purdue.edu/resources/download/834.PDF
Gehlhar, Mark and Robert McDougall (2006). “V6 Documentation: Chapter 15d: Transport Margins andModes.” https://www.gtap.agecon.purdue.edu/resources/download/2431.pdf
Hertel, T.W., Global Trade Analysis: Modeling and Applications. Cambridge University Press,Cambridge and New York.
Hicks, Michael. “New Regs in the European Union (EU) Require Treatment for Wood PackingMaterial,” AGExporter, Sept. 1, 2001. http://www.encyclopedia.com/doc/1G1-79088030.html.
Molina-Murillo, S., et. al. (2005). “Impact of International Phytosanitary Standards on Wood PackagingMaterial End Users: Pre-implementation Assessment.” Forest Products Journal, 55(9):24-26.
Raballand, Gael and Enrique Aldaz-Carroll (2005). “How Do Differing Standards Increase Trade Costs? The Case of Pallets,” World Bank Policy Research Working Paper 3519, February.
Ray, Charles D., et. al. (forthcoming 2007). “Economic and Environmental Impact Assessment of Proposed Bark-Free Requirements for Wooden Pallets in International Trade,” Forest Products Journal.
Strategic Design and Development (2002). Review of Domestic and International Pallet Standards andOngoing Operational and Cost implications to Australian Domestic and International Logistics:Final Report, March. http://www.strategicdesign.com.au./files/Pallet-Report.pdf.
U.S. Department of Agriculture (USDA), Animal Plant Health Inspection Service (APHIS) (1998). Interim Rule on Solid Wood Packing Material From China, Press Release, October.www.aphis.usda.gov/lpa/pubs/fsheet_faq_notice/faq_phwpack.html.
__________________ (2003). Regulatory Impact Analysis of the Proposed Rule to Adopt the International Standard on Wood Packing Material in International Trade. Docket No. 02-032-2. http://www.aphis.usda.gov/import_export/plants_plant_imports/downloads/SWPMRIA42103.pdf.
__________________ (2006). Second Phase of Enforcement for Wood Packaging Material Import Regulations to Begin Feb. 1,” News Release, January.www.aphis.usda.gov/newsroom/content/2006/01/wpmsecphase.shtml.
U.S. Department of Commerce. USA Trade Online. http://www.usatradeonline.gov.
U.S. Department of Transportation (DOT) Bureau of Transportation Statistics (BTS). TransBorderFreight Data. http://www.bts.gov/transborder/.
__________________ (2007). Increased Trade Spurs Growth in North American FreightTransportation” Special Report. May. www.bts.gov/publications/bts_special_report/2007_05/ .

22
__________________ (2007). 2006 Surface Trade with Canada and Mexico Rose 8.9 Percent from 2005.” Press Release. March.
www.bts.gov/press_releases/2007/bts010_07/html/bts010_07.html.
__________________ (2003). U.S. International Trade and Freight Transportation Trends. BTS03-02.Washington, DC. www.bts.gov/publications/us_international_.

23
CerealsHorticulture
OilseedsMisAgPallet
OtherAgNR
MineralsMeat
VegoilsDairyprods
SugarprodsFoodpreps
BeveragesTexLeather
WoodprodsPetrolcoal
ChemrubplMinrlprods
MetalprodsVehicles
ElectronicsServices
-0.8
-0.6
-0.4
-0.2
0
0.2Appendix figure 1. Effects of pallet treatment on U.S. imports
Source: Authors’ calculations
CerealsHorticulture
OilseedsMisAgPallet
OtherAgNR
MineralsMeat
VegoilsDairyprods
SugarprodsFoodpreps
BeveragesTexLeather
WoodprodsPetrolcoal
ChemrubplMinrlprods
MetalprodsVehicles
ElectronicsServices
-7
-6
-5
-4
-3
-2
-1
0
1Appendix figure 2. Pallet treatment and alternative packaging (high cost)
Source: Authors’ calculations