ocean acidification - stem...
TRANSCRIPT

©Center for Microbial Oceanography: Research and Education (C-MORE). Materials may be duplicated and distributed for educational, non-commercial purposes only.
OCEAN ACIDIFICATION
Grade Level: This kit is appropriate for students in grades 6–12. Standards: This kit is aligned with state science and math content standards for Hawai‘i, California and Oregon, as well as national Ocean Literacy Principles. Overview: This two-lesson kit familiarizes students with the causes and consequences of ocean acidification: the process by which our ocean is becoming increasingly acidic. Briefly, ocean acidification is caused by increasing atmospheric concentrations of CO2, some of which dissolves in the ocean and forms an acid. An acidic ocean poses threats to marine ecosystems, such as coral reefs. Ocean acidification is one of the most serious environmental issues facing the planet and is predicted to have devastating impacts within the next century. Lesson 1 includes a simple hands-on experiment, a short PowerPoint, and optional readings with worksheets. In Lesson 2, students conduct a more in-depth experiment with electronic probes to simulate the process of ocean acidification. A pre- and post- survey is included. Each lesson will require approximately an hour. Suggestions for Curriculum Placement: This science kit can be successfully integrated into earth science, biology, environmental science, marine science, or chemistry curricula. These lessons provide students with experience using the scientific method and an opportunity to generate hypotheses, collect data through hands-on experimentation, and analyze results. For earth science classes, these lessons highlight how compounds such as CO2 move between the ocean and the atmosphere as part of a geochemical cycle. For biology classes, students learn how changes in these cycles affect organisms and ecosystems. For environmental science courses, these lessons emphasize the effects of human activities on the environment. For marine science classes, students learn about the physical characteristics of the ocean. Finally, for chemistry classes, these lessons help students understand the importance of pH, and can follow a lesson on acids and bases. Materials: (Paper materials contained in binder are shown in BOLD CAPS) Front Binder Materials
1. CD with narrated PowerPoint presentations (also contains electronic versions of binder materials) 2. DVD with lecture on ocean acidification by C-MORE scientist Dr. Scott Doney 3. C-MORE Key Concepts in Microbial Oceanography brochure 4. C-MORE Microbial Oceanography: Resources For Teachers brochure 5. Current: The Journal of Marine Education (Special Issue on Ocean Acidification)
Lesson 1: Introduction to Ocean Acidification Materials are provided for 20–30 students to work in 5 groups of 4–6 students per group.
6. TEACHER GUIDE – Lesson 1: Introduction to Ocean Acidification 7. OCEAN ACIDIFICATION SURVEY 8. TEACHER ANSWER KEY to OCEAN ACIDIFICATION SURVEY 9. POWERPOINT SCRIPT 10. HONOLULU DECLARATION article 11. STUDENT WORKSHEET – Lesson 1a: Honolulu Declaration 12. TEACHER ANSWER KEY – Lesson 1a: Honolulu Declaration 13. THE DANGERS OF OCEAN ACIDIFICATION article 14. STUDENT WORKSHEET – Lesson 1b: The Dangers of Ocean Acidification 15. TEACHER ANSWER KEY – Lesson 1b: The Dangers of Ocean Acidification

16. 5 bottles of vinegar 17. 5 bags of coral (white) sand 18. 5 bags of basalt (black) sand 19. 5 Petri dishes (with lids) 20. 5 plastic droppers
Lesson 2: Yeast Experiment Materials are provided for 20–30 students to work in 5 groups of 4–6 students per group.
21. TEACHER GUIDE – Lesson 2: Yeast Experiment 22. MATERIALS PHOTO GUIDE – Lesson 2: Yeast Experiment 23. ZIPLOC CONTENTS CHECKLIST – Lesson 2: Yeast Experiment 24. STUDENT INSTRUCTIONS (pH group) – Lesson 2: Yeast Experiment (5 copies) 25. STUDENT INSTRUCTIONS (CO2 group) – Lesson 2: Yeast Experiment (5 copies) 26. STUDENT WORKSHEET – Lesson 2: Yeast Experiment 27. TEACHER ANSWER KEY – Lesson 2: Yeast Experiment 28. 5 Vernier LabQuest data recorders 29. Electric kettle 30. 5 large Ziploc bags, each containing:
• 1 pH probe, stored in solution • 1 CO2 probe • 2 round 500 ml bottles • 1 square 125 ml bottle • 1 BioChamber (bottle with hole in the side) • 1 funnel • 1 timer • 1 piece of rubber tubing connected with straight connectors to a small, black stopper (#6) at one end
and a large, white stopper at the other (#8) • 1 piece of rubber tubing connected with a straight connector at one end to a large, white stopper (#8)
31. Bag of sugar and yeast packets 32. Scissors 33. Extra pH storage solution
Other materials
34. GLOSSARY 35. TEACHER EVALUATION 36. SUPPLY CHECKLIST 37. Speakers 38. Manuals for electric kettle, pH probe, and CO2 probe
Materials Not Included in this Kit:
39. Computer 40. Projector
State Standards for Hawai‘i, California and Oregon. The following science and math standards and benchmarks can be addressed through this C-MORE science kit: Hawai‘i Content & Performance Standards (HCPS III): Science Standard 1: The Scientific Process: SCIENTIFIC INVESTIGATION: Discover, invent, and investigate using the skills necessary to engage in the scientific process.

Grades 6–8 Benchmarks for Science: SC.6.1.1 Formulate a testable hypothesis that can be answered through a controlled experiment. SC.6.1.2 Use appropriate tools, equipment, and techniques to safely collect, display, and analyze data. SC.7.1.1 Design and safely conduct a scientific investigation to answer a question or test a hypothesis. SC.8.1.1 Determine the link(s) between evidence and the conclusion(s) of an investigation. SC.8.1.2 Communicate the significant components of the experimental design and results of a scientific investigation.
Grades 9–12 Benchmarks for Science: SC.PS/BS/ES.1.2 Design and safely implement an experiment, including the appropriate use of tools and techniques to organize, analyze, and validate data. SC.PS/BS/ES.1.3 Defend and support conclusions, explanations, and arguments based on logic, scientific knowledge, and evidence from data. SC.PS/BS/ES.1.4 Determine the connection(s) among hypotheses, scientific evidence, and conclusions. Science Standard 2: The Scientific Process: NATURE OF SCIENCE: Understand that science, technology, and society are interrelated.
Grades 6–8 Benchmarks for Science: SC.8.2.1 Describe significant relationships among society, science, and technology and how one impacts the other.
Grades 9–12 Benchmarks for Science: SC.ES.2.3 Explain the impact of humans on the Earth system. SC.ES.2.4 Describe technologies used to collect information about the universe.
Science Standard 3: Life and Environmental Sciences: ORGANISMS AND THE ENVIRONMENT: Understand the unity, diversity, and interrelationships of organisms, including their relationship to cycles of matter and energy in the environment.
Grades 9–12 Benchmarks for Science: SC.BS.3.1 Describe biogeochemical cycles within ecosystems. Science Standard 5: Life and Environmental Sciences: DIVERSITY, GENETICS, AND EVOLUTION: Understand genetics and biological evolution and their impact on the unity and diversity of organisms.
Grades 6–8 Benchmarks for Science: SC.8.5.1 Describe how changes in the physical environment affect the survival of organisms. Science Standard 6: Physical, Earth, and Space Sciences: NATURE OF MATTER AND ENERGY: Understand the nature of matter and energy, forms of energy (including waves) and energy transformations, and their significance in understanding the structure of the universe.
Grades 6–8 Benchmarks for Science: SC.6.6.8 Recognize changes that indicate that a chemical reaction has taken place.
Science Standard 8: Physical, Earth, and Space Sciences: EARTH AND SPACE SCIENCE: Understand the Earth and its processes, the solar system, and the universe and its content.
Grades 6–8 Benchmarks for Science: SC.8.8.7 Describe the physical characteristics of oceans.
Grades 9–12 Benchmarks for Science: SC.ES.8.1 Describe how elements and water move through solid Earth, the oceans, atmosphere, and living things as part of geochemical cycles. Math Standard 9: Patterns, Functions, and Algebra: PATTERNS AND FUNCTIONAL RELATIONSHIPS: Understand various types of patterns and functional relationships.

Grades 6–8 Benchmarks for Math: MA.6.9.1 Represent visual and numerical patterns with tables and graphs and generalize the "rule" using words and symbols. Math Standard 11: Data Analysis, Statistics, and Probability: FLUENCY WITH DATA: Pose questions and collect, organize, and represent data to answer those questions. Grades 9–12 Benchmarks for Math: MA.S.11.1 Develop a hypothesis for an investigation or experiment. Chemistry Standard 3: Chemistry: PROPERTIES OF MATTER: Understand different states of matter.
Grades 9–12 Benchmarks for Chemistry: SC.CH.3.2 Use the pH scale to characterize acid and base solutions.
Content Standards for California Public Schools:
Grade 6 – Standard 7a. Develop a hypothesis. Investigation and Experimentation
Grade 6 – Standard 7e. Recognize whether evidence is consistent with a proposed explanation. Grade 7 – Standard 7b. Use a variety of print and electronic resources (including the World Wide Web) to collect information and evidence as part of a research project. Grade 7 – Standard 7c. Communicate the logical connection among hypotheses, science concepts, tests conducted, data collected, and conclusions drawn from the scientific evidence. Grades 9–12 – Standard 1l. Analyze situations and solve problems that require combining and applying concepts from more than one area of science.
Grade 8 – Standard 5a. Students know reactant atoms and molecules interact to form products with different chemical properties.
Physical Sciences
Grade 8 – Standard 5e. Students know how to determine whether a solution is acidic, basic, or neutral.
Grades 9–12 – Standard 5d. Students know how to use the pH scale to characterize acid and base solutions. Chemistry
Grades 9–12 – Standard 6b. Students know how to analyze changes in an ecosystem resulting from changes in climate, human activity, introduction of nonnative species, or changes in population size. Grades 9–12 – Standard 7b. Students know the global carbon cycle: the different physical and chemical forms of carbon in the atmosphere, oceans, biomass, fossil fuels, and the movement of carbon among these reservoirs. Mathematical Reasoning Grade 7 – Standard 3.1. Evaluate the reasonableness of the solution in the context of the original situation. Algebra I Grades 8–12 – Standard 24.2. Students identify the hypothesis and conclusion in logical deduction.
State of Oregon Standards by Design: Scientific Inquiry 6.3S.2 Organize and display relevant data, construct an evidence-based explanation of the results of an investigation,
and communicate the conclusions. 8.3S.3 Explain how scientific explanations and theories evolve as new information becomes available. H.3S.1 Based on observations and science principles, formulate a question or hypothesis that can be investigated
through the collection and analysis of relevant information. H.3S.5 Explain how technological problems and advances create a demand for new scientific knowledge and
how new knowledge enables the creation of new technologies.

Interaction and Change 7.2E.3 Evaluate natural processes and human activities that affect global environmental change and suggest and
evaluate possible solutions to problems. H.2L.1 Explain how energy and chemical elements pass through systems. Describe how chemical elements are
combined and recombined in different ways as they cycle through the various levels of organization in biological systems.
H.2L.2 Explain how ecosystems change in response to disturbances and interactions. Analyze the relationships among biotic and abiotic factors in ecosystems.
H.2E.4 Evaluate the impact of human activities on environmental quality and the sustainability of Earth systems. Describe how environmental factors influence resource management.
Algebra 6.3.5 Represent, analyze, and determine relationships and patterns using tables, graphs, words and when
possible, symbols. Data Analysis and Algebra 8.2.1 Organize and display data (e.g., histograms, box-and-whisker plots, scatter plots) to pose and answer
questions; and justify the reasonableness of the choice of display. Analysis H.1S.3 Compare and draw conclusions about two or more data sets using graphical displays or central tendencies and
range.
Ocean Literacy Principles. The following ocean literacy principles can be addressed through these lessons:
Ocean Literacy Principle 2: The ocean and life in the ocean shape the features of the Earth. d. Sand consists of tiny bits of animals, plants, rocks and minerals. Most beach sand is eroded from land sources and
carried to the coast by rivers, but sand is also eroded from coastal sources by surf. Sand is redistributed by waves and coastal currents seasonally.
Ocean Literacy Principle 3: The ocean is a major influence on weather and climate. a. The ocean controls weather and climate by dominating the Earth's energy, water and carbon systems. e. The ocean dominates the Earth's carbon cycle. Half the primary productivity on Earth takes place in the sunlit
layers of the ocean and the ocean absorbs roughly half of all carbon dioxide added to the atmosphere. f. The ocean has had, and will continue to have, a significant influence on climate change by absorbing, storing, and
moving heat, carbon and water.
Ocean Literacy Principle 6: The ocean and humans are inextricably interconnected. b. From the ocean we get foods, medicines, and mineral and energy resources. In addition, it provides jobs, supports
our nation's economy, serves as a highway for transportation of goods and people, and plays a role in national security.
c. The ocean is a source of inspiration, recreation, rejuvenation and discovery. It is also an important element in the heritage of many cultures.
e. Humans affect the ocean in a variety of ways. Laws, regulations and resource management affect what is taken out and put into the ocean. Human development and activity leads to pollution (point source, non-point source, and noise pollution) and physical modifications (changes to beaches, shores and rivers). In addition, humans have removed most of the large vertebrates from the ocean.
g. Everyone is responsible for caring for the ocean. The ocean sustains life on Earth and humans must live in ways that sustain the ocean. Individual and collective actions are needed to effectively manage ocean resources for all.

References: Doney, S.C. (2006) The Dangers of Ocean Acidification. Scientific American. March: 58-65 Doney, S.C., V. Fabry, R.A. Feely , and J. Kleypas (2009) Ocean Acidification: The Other CO2 problem. The Annual
Review of Marine Science. 1: 169-192. Doney, S.C. and R.A. Feely (2009) Ocean Acidification. Education in Chemistry (Royal Society of Chemistry). 46(6):
182-187 National Resources Defense Council (2009) ACID TEST: The Global Challenge of Ocean Acidification (documentary film
available on http://www.nrdc.org/oceans/acidification/aboutthefilm.asp) Special Issue: Ocean Acidification-from Ecological Impacts to Policy Opportunities. (2009) Current: The Journal of
Marine Education. 25(1): 1-45. The Nature Conservancy. (2008) Scientists unveil “Honolulu Declaration” to address Ocean Acidification. Barcelona,
Spain. Press Release, October 8, 2008. http://www.ocean-acidification.net/ http://oceanacidification.wordpress.com/ http://www.pmel.noaa.gov/co2/OA/
A three-part interview with Dr. Richard Feely, NOAA lead scientist conducting research on ocean acidification (Flash video format): Part I: What is ocean acidification? http://seagrant.oregonstate.edu/video/flash/acidification-1.html Part II: How are ocean animals affected? http://seagrant.oregonstate.edu/video/flash/acidification-2.html Part III: How will ocean ecosystems be affected? http://seagrant.oregonstate.edu/video/flash/acidification-3.html

TEACHER GUIDE Lesson 1: Introduction to Ocean Acidification
Time Required: 60 minutes. Advance preparation time will vary from 20 minutes to more than 1 hour, depending on which readings and background materials you choose to review. Structure: This lesson familiarizes students with the causes and consequences of ocean acidification through a simple hands-on experiment and a narrated PowerPoint. Readings and accompanying worksheets may be begun in class or assigned for homework. For the experiment, we recommend students divide into small groups of 4–6 students. Materials are provided for five groups. A combined pre- and post- survey for Lessons 1 and 2 is included. The pre-survey is given at the beginning of Lesson 1 and the post-survey is given at the end of Lesson 2. Materials: (Paper materials contained in binder are shown in BOLD CAPS) Materials are provided for 20–30 students to work in five groups of 4–6 students per group.
1. CD with narrated PowerPoint Presentation (also contains electronic versions of binder materials) 2. DVD with lecture on ocean acidification by C-MORE scientist Dr. Scott Doney 3. Speakers 4. Current: The Journal of Marine Education (Special Issue on Ocean Acidification) 5. OCEAN ACIDIFICATION SURVEY 6. TEACHER ANSWER KEY to OCEAN ACIDIFICATION SURVEY 7. POWERPOINT SCRIPT 8. HONOLULU DECLARATION article 9. STUDENT WORKSHEET – Lesson 1a: Honolulu Declaration 10. TEACHER ANSWER KEY – Lesson 1a: Honolulu Declaration 11. THE DANGERS OF OCEAN ACIDIFICATION article 12. STUDENT WORKSHEET – Lesson 1b: The Dangers of Ocean Acidification 13. TEACHER ANSWER KEY – Lesson 1b: The Dangers of Ocean Acidification 14. 5 bottles of vinegar 15. 5 bags of coral (white) sand 16. 5 bags of basalt (black) sand 17. 5 Petri dishes (with lids) 18. 5 plastic droppers
Materials Not Included in this Kit but Needed for Lesson 1:
19. Computer 20. Projector
Advance Preparation:
1. Familiarize yourself with the contents of this kit. The science kit contains a Ziploc bag labeled “Lesson 1”. Make sure it contains 5 bottles of vinegar, 5 bags of coral (white) sand, 5 bags of basalt (black) sand, 5 Petri dishes (with lids) and 5 plastic droppers. The remaining supplies (such as electronic probes and data recorders) are for Lesson 2.
2. A short (7 minute), narrated PowerPoint entitled “Ocean Acidification: Will the reef survive?” can be found on the CD located in the binder. This presentation will be used to introduce your students to ocean acidification. Load the PowerPoint presentation onto your computer by dragging the file from the CD onto the computer desktop. Eject the CD and return it to the binder.
3. Speakers are included in the kit for playing the narrated presentation. Refer to the laminated manual attached to the speaker storage case for set-up instructions.
4. If you prefer to present the information yourself using the non-narrated version of the PowerPoint presentation, a POWERPOINT SCRIPT is included as a guide.

5. Review the two student readings and corresponding worksheets: a. A press release from The Nature Conservancy on the “Honolulu Declaration” (middle school level). b. A Scientific American article entitled “The Dangers of Ocean Acidification” by Dr. Scott Doney, a C-MORE
researcher and Senior Scientist at the Woods Hole Oceanographic Institution (high school level).
6. Select either or both readings to assign to your students. Photocopy or print the appropriate reading(s) and corresponding STUDENT WORKSHEET(s). Answers to the STUDENT WORKSHEET – Lesson 1a: Honolulu Declaration and STUDENT WORKSHEET – Lesson 1b: The Dangers of Ocean Acidification can be found on the accompanying TEACHER ANSWER KEY – Lesson 1a: Honolulu Declaration and TEACHER ANSWER KEY –Lesson 1b: The Dangers of Ocean Acidification.
7. Photocopy or print OCEAN ACIDIFICATION SURVEY (two per student). This is given as a pre-survey at the beginning of this lesson. It will also be given as a post-survey at the end of Lesson 2.
8. In addition to the lesson materials, the kit contains several resources that you may review to expand your understanding of ocean acidification. A one-hour DVD lecture by C-MORE scientist Dr. Scott Doney provides a thorough review of the causes and consequences of ocean acidification. This DVD is located in the kit binder. A special issue of Current: The Journal Of Marine Education on ocean acidification also provides useful information. A hard copy of this journal is in the kit binder, and a pdf version can be found on the CD.
Instructional Procedures:
1. Pass out OCEAN ACIDIFICATION SURVEY (one per student). Have students check the pre-survey box and answer the questions (allow 5 minutes). After Lesson 2 is completed, the students will answer these same questions as a post-survey. A TEACHER ANSWER KEY is provided for your convenience.
2. Students will now conduct a simple hands-on experiment with sand and vinegar to examine how ocean acidification affects marine life. To perform the experiment, divide the class into 5 groups. Provide each group of students with a Petri dish and lid, a bottle of vinegar, a small bag of calcium carbonate (white) sand, a small bag of basalt (black) sand, and a plastic dropper. Have students from each group place a pinch of calcium carbonate sand in the Petri dish, and a pinch of basalt sand in the lid of their Petri dish. Instruct the students to use their plastic droppers to drop approximately 5 drops of acidic solution (vinegar) onto each of their sand samples.
3. Watch what happens! The calcium carbonate sand will begin to produce CO2 bubbles as it dissolves in the acidic solution. Just as the calcium carbonate sand dissolves in the vinegar solution, the calcium carbonate shells of marine organisms will also dissolve in a more acidic ocean.
4. Keep in mind that vinegar is much more acidic than the ocean, so the biological effects of ocean acidification will not occur as rapidly as you observe in class. The basalt sand contains no calcium carbonate, and will not dissolve in the acidic solution.
5. Play the narrated PowerPoint presentation to familiarize your students with the causes and consequences of ocean acidification. The last few slides describe the yeast experiment to be performed in Lesson 2.
6. If class time remains, have your students begin to read the article(s) you selected and fill in the appropriate worksheet(s). Have students complete the reading(s) and worksheet(s) for homework.
Clean-up: 1. To clean up, have students scrape the sand from their dishes into a garbage can or waste container before
washing them in the sink. Sand will clog the drain of a sink, so make sure the sand is removed before washing! Allow the Petri dishes to dry.
2. Have students return ALL supplies (including any unused sand). Inspect the supplies as students turn them in to make sure everything is accounted for and stored properly.
Mahalo!

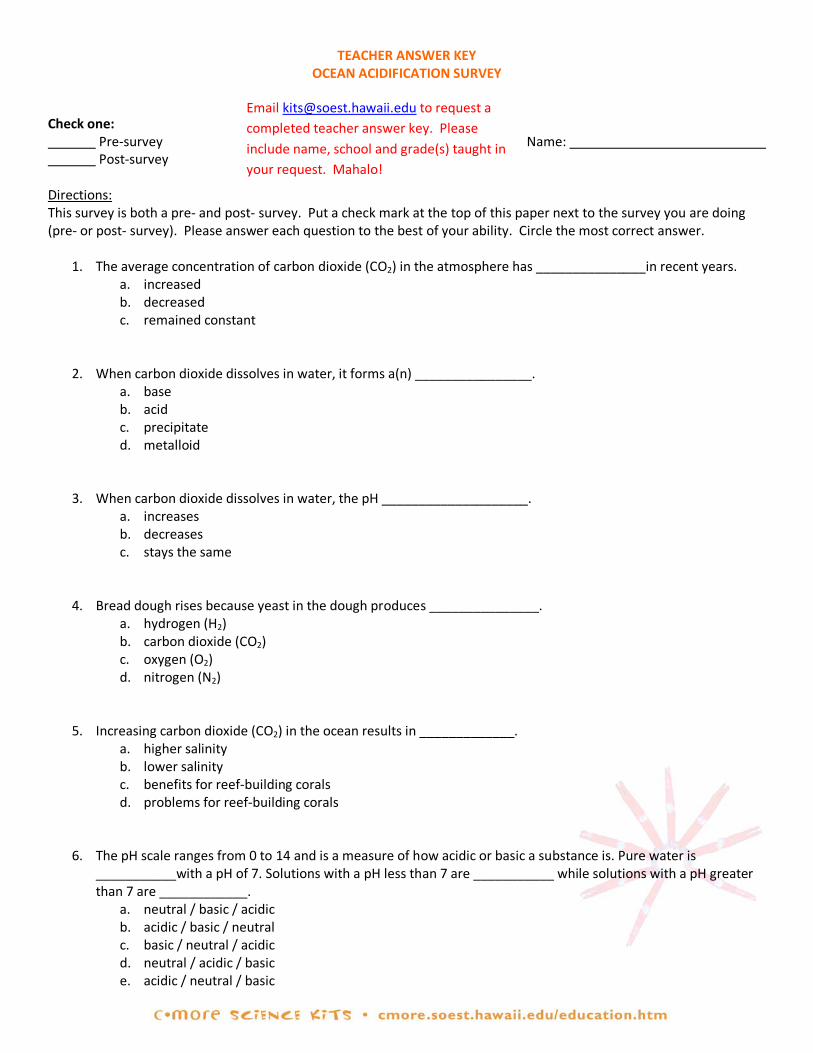
OCEAN ACIDIFICATION SURVEY Check one: Pre-survey Name: Post-survey Directions: This survey is both a pre- and post- survey. Put a check mark at the top of this paper next to the survey you are doing (pre- or post- survey). Please answer each question to the best of your ability. Circle the most correct answer.
1. The average concentration of carbon dioxide (CO2) in the atmosphere has _______________in recent years. a. increased b. decreased c. remained constant
2. When carbon dioxide dissolves in water, it forms a(n) ________________. a. base b. acid c. precipitate d. metalloid
3. When carbon dioxide dissolves in water, the pH ____________________. a. increases b. decreases c. stays the same
4. Bread dough rises because yeast in the dough produces _______________. a. hydrogen (H2) b. carbon dioxide (CO2) c. oxygen (O2) d. nitrogen (N2)
5. Increasing carbon dioxide (CO2) in the ocean results in _____________. a. higher salinity b. lower salinity c. benefits for reef-building corals d. problems for reef-building corals
6. The pH scale ranges from 0 to 14 and is a measure of how acidic or basic a substance is. Pure water is ___________with a pH of 7. Solutions with a pH less than 7 are ___________ while solutions with a pH greater than 7 are ____________.
a. neutral / basic / acidic b. acidic / basic / neutral c. basic / neutral / acidic d. neutral / acidic / basic e. acidic / neutral / basic

7. If the pH of a solution changes from 2 to 3, there is a ___________change in acidity.
a. 1 x b. 2 x c. 10x d. 20x
8. The salmon fishing industry is a multibillion dollar business that supplies food for a large population of the world. How could ocean acidification affect this industry?
a. It would not have any impact on the industry b. It would increase fishing stocks c. It would decrease fishing stocks
9. Please share your opinion and circle how you feel about the following statement (question not scored): Higher levels of carbon dioxide emissions have a negative effect on the ocean environment.
Strongly Disagree Disagree Neutral Agree Strongly Agree
TEACHER ANSWER KEY OCEAN ACIDIFICATION SURVEY
Check one: Pre-survey Name: Post-survey Directions: This survey is both a pre- and post- survey. Put a check mark at the top of this paper next to the survey you are doing (pre- or post- survey). Please answer each question to the best of your ability. Circle the most correct answer.
1. The average concentration of carbon dioxide (CO2) in the atmosphere has _______________in recent years. a. increased b. decreased c. remained constant
2. When carbon dioxide dissolves in water, it forms a(n) ________________. a. base b. acid c. precipitate d. metalloid
3. When carbon dioxide dissolves in water, the pH ____________________. a. increases b. decreases c. stays the same
4. Bread dough rises because yeast in the dough produces _______________. a. hydrogen (H2) b. carbon dioxide (CO2) c. oxygen (O2) d. nitrogen (N2)
5. Increasing carbon dioxide (CO2) in the ocean results in _____________. a. higher salinity b. lower salinity c. benefits for reef-building corals d. problems for reef-building corals
6. The pH scale ranges from 0 to 14 and is a measure of how acidic or basic a substance is. Pure water is ___________with a pH of 7. Solutions with a pH less than 7 are ___________ while solutions with a pH greater than 7 are ____________.
a. neutral / basic / acidic b. acidic / basic / neutral c. basic / neutral / acidic d. neutral / acidic / basic e. acidic / neutral / basic
Email [email protected] to request a completed teacher answer key. Please include name, school and grade(s) taught in your request. Mahalo!

7. If the pH of a solution changes from 2 to 3, there is a ___________change in acidity. a. 1 x b. 2 x c. 10x d. 20x
8. The salmon fishing industry is a multibillion dollar business that supplies food for a large population of the world. How could ocean acidification affect this industry?
a. It would not have any impact on the industry b. It would increase fishing stocks c. It would decrease fishing stocks
9. Please share your opinion and circle how you feel about the following statement (question not scored): Higher levels of carbon dioxide emissions have a negative effect on the ocean environment.
Strongly Disagree Disagree Neutral Agree Strongly Agree
For information only, do not grade question 9.
Email [email protected] to request a completed teacher answer key. Please include name, school and grade(s) taught in your request. Mahalo!

POWERPOINT SCRIPT
Slide 1 (Title slide): Ocean Acidification: Will the reef survive? Slide 2: The worldwide consumption of fossil fuels such as coal, oil, and natural gas releases 11 billion tons of carbon dioxide into the atmosphere every year.
Slide 3: Because of this, the concentration of carbon dioxide in the atmosphere is increasing at an alarming rate. This graph shows the concentration of carbon dioxide in the atmosphere from 1700 to the present. Starting at about 1950 (click), when people started burning lots of fossil fuels, the slope of this line starts rising very steeply, showing that the amount of carbon dioxide in the atmosphere is rapidly increasing. Slide 4: Some of this carbon dioxide remains in the atmosphere, where it contributes to global warming. About one-third of it, however, gets dissolved in the ocean, causing a potentially more serious problem: ocean acidification. Slide 5: Ocean acidification poses a threat to shell-forming organisms like corals and calcifying plankton, because in a more acidic ocean, these creatures will not be able to create their shells and grow. To understand why this is the case, we need to review a bit of chemistry. Slide 6: First, the pH scale, which ranges from 0 to 14, is a measure of how acidic or basic a substance is. Pure water is neutral with a pH of 7. Solutions with a pH less than 7 are acidic and those with a pH greater than 7 are basic. The pH scale is logarithmic, meaning a difference of one pH unit is equal to a ten-fold change in acidity, which is determined by the concentration of hydrogen ions in a substance. As seen on this scale, grapefruit (click), which has a pH of 3, is ten times more acidic than tomato juice (click), which has a pH of 4. Vinegar (click), which has a pH of 2, is 100 times more acidic than tomato juice (click). Because the pH scale is logarithmic, even small changes in the pH of the ocean can have significant effects on marine organisms. Slide 7: So how does carbon dioxide affect ocean chemistry? When carbon dioxide dissolves in water (click), it forms carbonic acid (click), which lowers the pH of the water (click). The carbon dioxide also reacts with other carbon containing compounds, such as carbonate ions (click), which are naturally dissolved in seawater. Carbonate ions are important because they combine with calcium to form calcium carbonate, which is what marine organisms use to make their shells. However, in the presence of carbon dioxide, the carbonate ions react (click) and form bicarbonate ions. Thus, (click) the concentration of carbonate ions in the ocean decreases. Unfortunately, organisms cannot use bicarbonate ions to build their shells. So, to recap, an increase in carbon dioxide in the atmosphere threatens calcifying organisms in two ways. First, a decreased pH makes the water more corrosive. This can actually cause shells to dissolve. Second, a reduction in the concentration of carbonate ions means there is not enough calcium carbonate for organisms such as corals and calcifying plankton to make new shells and grow.

Slide 8: Pteropods and coccolithophores, shown here (click), are two types of calcifying plankton that are being impacted by ocean acidification. These planktonic organisms are microorganisms: they can only be seen with the aid of a microscope. The pteropod is a kind of zooplankton, meaning it is a planktonic animal. It is actually a tiny marine snail. The coccolithophore is a microscopic algae, and is a type of phytoplankton. All phytoplankton undergo photosynthesis and generate oxygen, but the calcium carbonate plates that surround coccolithophores make them unique. Despite their small size, these organisms are very important to the survival of our marine ecosystems, because they form the base of the marine food web. Slide 9: Zooplankton, such as pteropods, feast on the tiny coccolithophores (click). In turn, the pteropods are critical food sources for larger marine animals like fish (click) and whales (click). If coccolithophores and pteropods become less abundant due to ocean acidification, there will be less food for animals higher up the food chain (click). Slide 10: Similarly, ocean acidification is predicted to dramatically alter coral reefs, as shown here. The photo on the left (click) shows a relatively healthy reef, with a carbon dioxide concentration of 375 ppm. As you move from left to right, the concentration of carbon dioxide in the water increases, meaning that the pH decreases. In the photo on the right (click), where the carbon dioxide concentration is greater than 500ppm, we can see that the reef is severely degraded, and very few corals survive. Many organisms live on coral reefs, and if corals disappear, they won't be able to find food or shelter. Ocean acidification therefore represents a serious threat to the survival of many marine ecosystems. Because ocean acidification is so important, it's a good idea to learn as much about it as we can. To do so, you're going to do an experiment in which you simulate ocean acidification, using yeast to generate carbon dioxide. The carbon dioxide released by the yeast will mimic the carbon dioxide humans release into the environment through the burning of fossil fuels. Slide 11: Yeast are tiny, eukaryotic organisms, shown here. Humans use yeast for many purposes, such as baking bread. When you purchase yeast at the store, it looks like this (click), and is in a dormant state. When given food, such as sugar (click), the yeast become active, and use the sugar to produce energy. In the process, the yeast release carbon dioxide as a waste product. These carbon dioxide bubbles are what make your bread fluffy, and they are what we'll be using to simulate ocean acidification. Slide 12: The class will divide into groups. Within each group, half of the students will be measuring the amount of carbon dioxide the yeast generate over time, while the other half will be measuring how this carbon dioxide affects the pH of water. To make these measurements, each group will be given a LabQuest, which records this data when connected to a carbon dioxide probe and a pH probe. Slide 13: To activate the yeast, and cause them to respire, they will be dissolved in water and given food in the form of sugar. This will cause the yeast to produce carbon dioxide gas. Slide 14: The carbon dioxide gas will then be directed through rubber tubing to one of two places: a chamber of air, where carbon dioxide is measured, as seen on the left, or a bottle of water, where we can measure how this change in carbon dioxide concentration affects the pH of water, as seen on the right. You will be given a handout that details how to set up the experiment. But before you start, make a prediction. After the yeast is activated, what will happen to the pH and CO2 levels over time?

Name: Period: Group Members:
STUDENT WORKSHEET Lesson 1a: Honolulu Declaration
1. What did scientists in Florida declare as “the largest and most significant threat that oceans face today”? 2. In your own words, what does the “Honolulu Declaration on Ocean Acidification and Reef Management” hope
to accomplish?
3. In your own words, the two major strategies supported by the declaration are:
a.
b. 4. What are two actions you could take to help support these strategies? 5. If coral reefs in Hawai‘i are unable to survive due to ocean acidification, what effects would this have on your
life? List three examples.
TEACHER ANSWER KEY
Lesson 1a: Honolulu Declaration
1. What did scientists in Florida declare as “the largest and most significant threat that oceans face today”? 2. In your own words, what does the “Honolulu Declaration on Ocean Acidification and Reef Management” hope
to accomplish?
3. The two major strategies supported by the declaration are: 4. What are two actions you could take to help support these strategies? 5. If coral reefs in Hawai‘i are unable to survive due to ocean acidification, what effects would this have on your
life? List three examples.
Email [email protected] to request a completed teacher answer key. Please include name, school and grade(s) taught in your request. Mahalo!

Name: Period: Group Members:
STUDENT WORKSHEET Lesson 1b: The Dangers of Ocean Acidification
1. Why was Mauna Loa chosen as a location to measure CO2 concentrations in the atmosphere?
2. Why are carbon dioxide levels in the atmosphere increasing?
3. How does carbon dioxide cause the pH of the ocean to decrease? 4. What types of organisms are threatened by ocean acidification? Why?
5. Are cold water or warm water ecosystems more susceptible to ocean acidification? Why?
6. What is one type of experiment the author suggests that scientists could perform to gain a better understanding
of the threat that ocean acidification poses to marine environments?
7. If the geologic record shows that CO2 levels have been higher in the past than they are today, why are current
changes in CO2 levels such a concern?
TEACHER ANSWER KEY Lesson 1b: The Dangers of Ocean Acidification
1. Why was Mauna Loa chosen as a location to measure CO2 concentrations in the atmosphere?
2. Why are carbon dioxide levels in the atmosphere increasing?
3. How does carbon dioxide cause the pH of the ocean to decrease?
4. What types of organisms are directly threatened by ocean acidification? Why?
5. Are cold water or warm water ecosystems more susceptible to ocean acidification? Why?
6. What is one type of experiment the author suggests that scientists could perform to gain a better understanding of the threat that ocean acidification poses to marine environments?
7. If the geologic record shows that CO2 levels have been higher in the past than they are today, why are current changes in CO2 levels such a concern?
Email [email protected] to request a completed teacher answer key. Please include name, school and grade(s) taught in your request. Mahalo!

TEACHER GUIDE Lesson 2: Yeast Experiment
Time Required: 60 minutes. Advance preparation time is approximately 60 minutes, excluding the ~8 hours required to charge the LabQuests.
Structure: This lesson provides an in-depth experiment that simulates the process of ocean acidification. Students will work in groups of 4–6 students. Materials are provided for five groups. A post-survey is given at the end of this lesson; the pre-survey was given at the beginning of Lesson 1. Materials: (Paper materials contained in binder are shown in BOLD CAPS) Materials are provided for 20–30 students to work in five groups of 4–6 students per group.
1. MATERIALS PHOTO GUIDE – Lesson 2: Yeast Experiment 2. ZIPLOC CONTENTS CHECKLIST – Lesson 2: Yeast Experiment 3. STUDENT INSTRUCTIONS (pH group) – Lesson 2: Yeast Experiment (5 copies) 4. STUDENT INSTRUCTIONS (CO2 group) – Lesson 2: Yeast Experiment (5 copies) 5. STUDENT WORKSHEET – Lesson 2: Yeast Experiment 6. TEACHER ANSWER KEY – Lesson 2: Yeast Experiment 7. Manuals For LabQuest, pH probe, and CO2 probe 8. 5 Vernier LabQuest data recorders 9. Electric kettle 10. 5 large Ziploc bags, each containing:
• 1 pH probe, stored in solution • 1 CO2 probe • 2 round 500 ml bottles • 1 square 125 ml bottle • 1 BioChamber (bottle with hole in the side) • 1 funnel • 1 timer • 1 piece of rubber tubing connected with straight connectors to a small, black stopper (#6) at one end
and a large, white stopper at the other (#8) • 1 piece of rubber tubing connected with a straight connector at one end to a large, white stopper (#8)
11. Bag of sugar and yeast packets 12. Extra pH storage solution
Materials Not Included in this Kit but may be Optionally Used for Lesson 2:
13. Computer 14. Projector
Advance Preparation (assuming students will be divided into 5 groups):
1. Photocopy or print the STUDENT WORKSHEET – Lesson 2: Yeast Experiment (one per student) and the ZIPLOC CONTENTS CHECKLIST – Lesson 2: Yeast Experiment (3 copies). Cut each ZIPLOC CONTENTS CHECKLIST in two.
2. Photocopy or print the TEACHER EVALUATION and the SUPPLY CHECKLIST.
3. Locate the photocopies of the OCEAN ACIDIFICATION SURVEY (one per student) that you printed as part of your Advance Preparation for Lesson 1. (You printed two copies per student but only administered one as a pre-survey).
4. Familiarize yourself with the sensors and LabQuest. These are expensive pieces of equipment, with each set-up costing approximately $750. Please take care of them! Make sure the LabQuests are fully charged before class (they take 8 hours to fully charge). It is not necessary to calibrate the equipment.
5. Organize the materials for the experiment. See the MATERIALS PHOTO GUIDE – Lesson 2: Yeast Experiment for photos of each item. Experiment materials are divided into 5 Ziploc bags (contents of each bag are listed in the
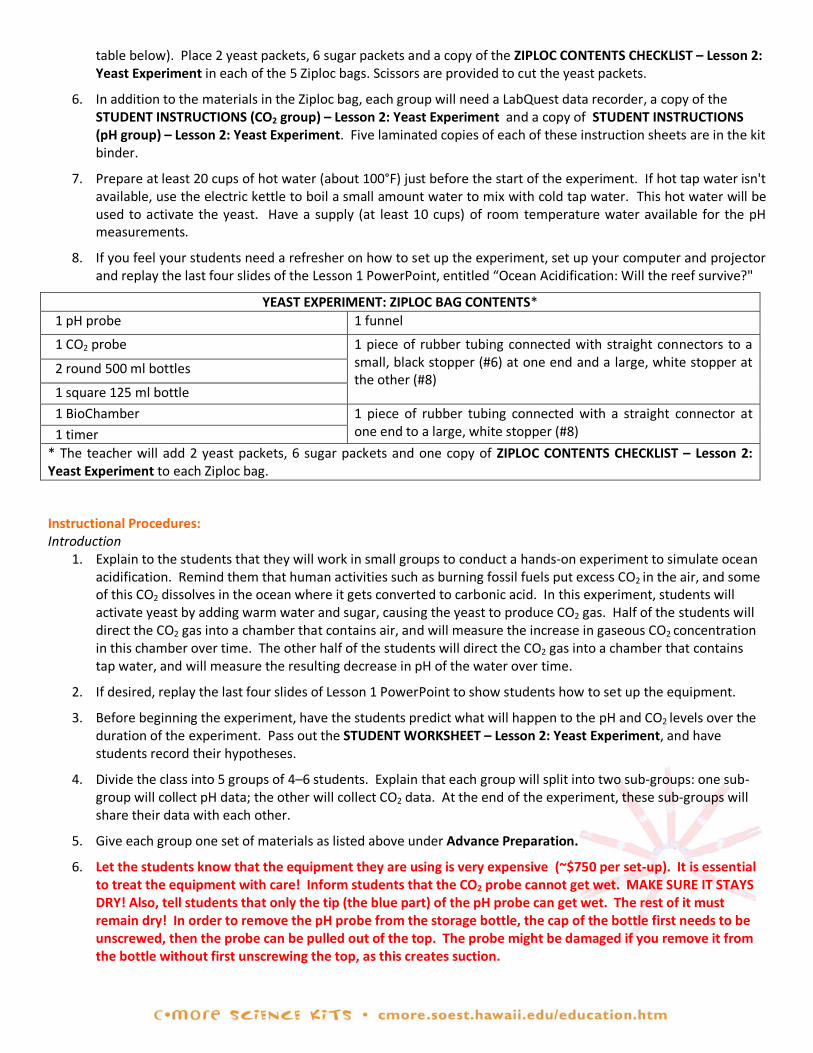
table below). Place 2 yeast packets, 6 sugar packets and a copy of the ZIPLOC CONTENTS CHECKLIST – Lesson 2: Yeast Experiment in each of the 5 Ziploc bags. Scissors are provided to cut the yeast packets.
6. In addition to the materials in the Ziploc bag, each group will need a LabQuest data recorder, a copy of the STUDENT INSTRUCTIONS (CO2 group) – Lesson 2: Yeast Experiment and a copy of STUDENT INSTRUCTIONS (pH group) – Lesson 2: Yeast Experiment. Five laminated copies of each of these instruction sheets are in the kit binder.
7. Prepare at least 20 cups of hot water (about 100°F) just before the start of the experiment. If hot tap water isn't available, use the electric kettle to boil a small amount water to mix with cold tap water. This hot water will be used to activate the yeast. Have a supply (at least 10 cups) of room temperature water available for the pH measurements.
8. If you feel your students need a refresher on how to set up the experiment, set up your computer and projector and replay the last four slides of the Lesson 1 PowerPoint, entitled “Ocean Acidification: Will the reef survive?"
YEAST EXPERIMENT: ZIPLOC BAG CONTENTS* 1 pH probe 1 funnel
1 CO2 probe 1 piece of rubber tubing connected with straight connectors to a small, black stopper (#6) at one end and a large, white stopper at the other (#8)
2 round 500 ml bottles
1 square 125 ml bottle
1 BioChamber 1 piece of rubber tubing connected with a straight connector at one end to a large, white stopper (#8) 1 timer
* The teacher will add 2 yeast packets, 6 sugar packets and one copy of ZIPLOC CONTENTS CHECKLIST – Lesson 2: Yeast Experiment to each Ziploc bag.
Instructional Procedures: Introduction
1. Explain to the students that they will work in small groups to conduct a hands-on experiment to simulate ocean acidification. Remind them that human activities such as burning fossil fuels put excess CO2 in the air, and some of this CO2 dissolves in the ocean where it gets converted to carbonic acid. In this experiment, students will activate yeast by adding warm water and sugar, causing the yeast to produce CO2 gas. Half of the students will direct the CO2 gas into a chamber that contains air, and will measure the increase in gaseous CO2 concentration in this chamber over time. The other half of the students will direct the CO2 gas into a chamber that contains tap water, and will measure the resulting decrease in pH of the water over time.
2. If desired, replay the last four slides of Lesson 1 PowerPoint to show students how to set up the equipment.
3. Before beginning the experiment, have the students predict what will happen to the pH and CO2 levels over the duration of the experiment. Pass out the STUDENT WORKSHEET – Lesson 2: Yeast Experiment, and have students record their hypotheses.
4. Divide the class into 5 groups of 4–6 students. Explain that each group will split into two sub-groups: one sub-group will collect pH data; the other will collect CO2 data. At the end of the experiment, these sub-groups will share their data with each other.
5. Give each group one set of materials as listed above under Advance Preparation.
6. Let the students know that the equipment they are using is very expensive (~$750 per set-up). It is essential to treat the equipment with care! Inform students that the CO2 probe cannot get wet. MAKE SURE IT STAYS DRY! Also, tell students that only the tip (the blue part) of the pH probe can get wet. The rest of it must remain dry! In order to remove the pH probe from the storage bottle, the cap of the bottle first needs to be unscrewed, then the probe can be pulled out of the top. The probe might be damaged if you remove it from the bottle without first unscrewing the top, as this creates suction.

7. Have each group double-check that they have all materials listed on the STUDENT INSTRUCTIONS – Lesson 2: Yeast Experiment handouts.
Data Collection 1. Instruct the student groups to divide into their two sub-groups.
2. Have each sub-group set up their equipment by following the directions on the STUDENT INSTRUCTIONS (CO2 group) – Lesson 2: Yeast Experiment and STUDENT INSTRUCTIONS (pH group) – Lesson 2: Yeast Experiment handouts. The pH group will need room temperature water at this time.
3. For the pH group, it is VERY IMPORTANT that the students allow sufficient time for their pH sensor to equilibrate before starting the experiment. If the sensor is not equilibrated, students may actually observe an increase in the pH value (and incorrectly surmise that the water is becoming more basic) during the experiment. As they are waiting for the sensors to calibrate, students should make a prediction about what will happen to the pH and CO2 levels during the course of the experiment, and record their answers on the STUDENT WORKSHEET.
4. The students are now ready to begin the experiment. You will need to provide students with hot water to activate the yeast. An electric kettle is provided if hot tap water is not available. Have the pH and CO2 sub-groups begin the experiment at the same time. If you prefer, the entire class can begin the experiment at the same time. Measurements should be recorded every 3 minutes, using the 3-minute hourglass timer.
5. When students activate the yeast, they only need to stir the solution for about 5 seconds. This is the only time that the solution needs to be stirred! Do not overmix, as this will affect the rate of the reaction.
6. Students may ask why they can't direct the CO2 gas from a single bottle of activated yeast into both the CO2 chamber and the water sample for pH. Explain to them that one bottle of yeast does not produce enough pressure to travel through both tubes, so it is necessary for the pH and the CO2 groups to activate yeast in separate bottles.
7. During the experiment, each student will individually record their data on their STUDENT WORKSHEET – Lesson 2: Yeast Experiment. Because observations are only recorded every 3 minutes, there may be some down-time during the 24 minute experiment. If you think your students might get restless, you can have them read the HONOLULU DECLARATION article and to complete STUDENT WORKSHEET – Lesson 1a: Honolulu Declaration, if they have not done so already. However, make sure this does not interfere with the experiment itself.
8. At the end of the experiment, instruct the sub-groups to share data so that each student has both CO2 and pH data.
9. Have students complete the graphing exercise and answer all questions on the STUDENT WORKSHEET – Lesson 2: Yeast Experiment. In order to make the change in pH evident in a graph of the pH data, students need to scale the y-axis appropriately. The scale should not run from 0–14; it should just cover the range of pH observed in the experiment (see example on TEACHER ANSWER KEY – Lesson 2: Yeast Experiment, where answers to all of the worksheet questions can be found).
Trouble-shooting 1. If the yeast doesn't bubble up, the water may have been too hot or the students may have overmixed it. Water
should not be so hot as to cause burning. Try again with a new yeast packet and new sugar packets.
2. If the yeast bubbles up but the CO2 reading doesn't increase, check your seals on the CO2 set-up (the gas may be escaping).
3. If the yeast bubbles up but the pH isn't decreasing, check your seals on the pH set-up. Also check that the tube from the yeast bottle is submerged in the water in the square bottle (you should see bubbles coming out of the water). If the pH is increasing, the pH probe may not have had sufficient time to equilibrate.
4. If your data recorder isn't displaying the sensor values, check that the probes are connected properly. Alternatively, the battery may need charging.

Assessment and Clean-up: 1. Pass out OCEAN ACIDIFICATION SURVEY (one per student). Have students check the post-survey box and
answer the questions (allow 5 minutes). A TEACHER ANSWER KEY is provided in Lesson 1.
2. As the students are completing their surveys, we would be grateful if you would complete the TEACHER EVALUATION in this kit. All comments, corrections, and suggestions are very welcome. If you prefer, you can complete the evaluation online (see TEACHER EVALUATION for website address).
3. Have students discard their empty yeast and sugar packets. Students need to rinse and dry the 500 ml bottles that contained the yeast, the funnel, as well as the 125 ml bottles that were used in the pH experiment. Please make sure students DO NOT wash either of the probes during clean-up. When storing the pH probes, remind students that the top should be removed from the storage bottle, then the probe can be inserted through the top, and finally the top can be screwed back on to the storage bottle. There is extra pH storage solution (which goes in the storage bottles) in the kit in case of any spills. Please make sure that the tips of the pH probes are immersed in storage solution in each of the storage bottles. To prevent damage to the tips, they should not touch the bottom of the storage bottles.
4. Have students repack their supplies and complete the ZIPLOC CONTENTS CHECKLIST. Inspect the supplies as the students turn them in to make sure everything is accounted for and stored properly.
5. Re-pack the kit for return to C-MORE. Double check that all the items are included by completing the SUPPLY CHECKLIST. Please make a note of missing, broken, or damaged items so that they can be replaced. Please pack the kit so that the materials are stored as they were when you received them. Please also include a copy of the students' pre- and post-surveys.
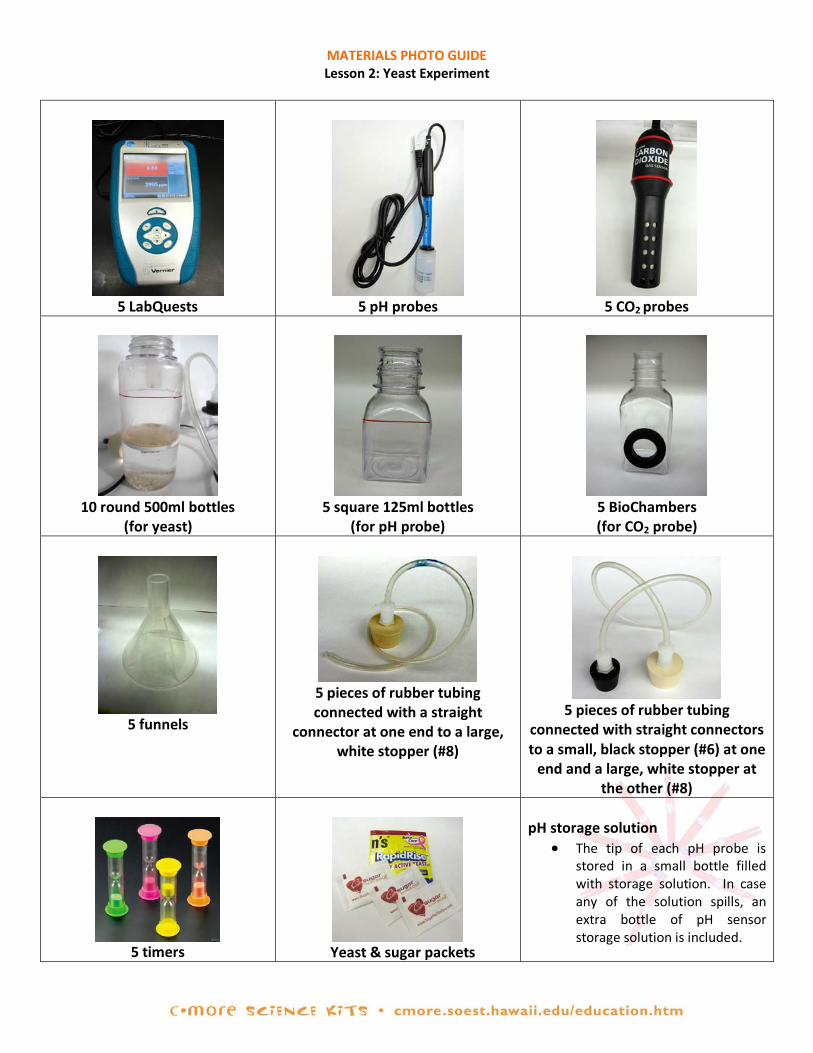
MATERIALS PHOTO GUIDE Lesson 2: Yeast Experiment
5 LabQuests
5 pH probes
5 CO2 probes
10 round 500ml bottles
(for yeast)
5 square 125ml bottles
(for pH probe)
5 BioChambers (for CO2 probe)
5 funnels
5 pieces of rubber tubing connected with a straight
connector at one end to a large, white stopper (#8)
5 pieces of rubber tubing
connected with straight connectors to a small, black stopper (#6) at one
end and a large, white stopper at the other (#8)
5 timers
Yeast & sugar packets
pH storage solution
• The tip of each pH probe is stored in a small bottle filled with storage solution. In case any of the solution spills, an extra bottle of pH sensor storage solution is included.
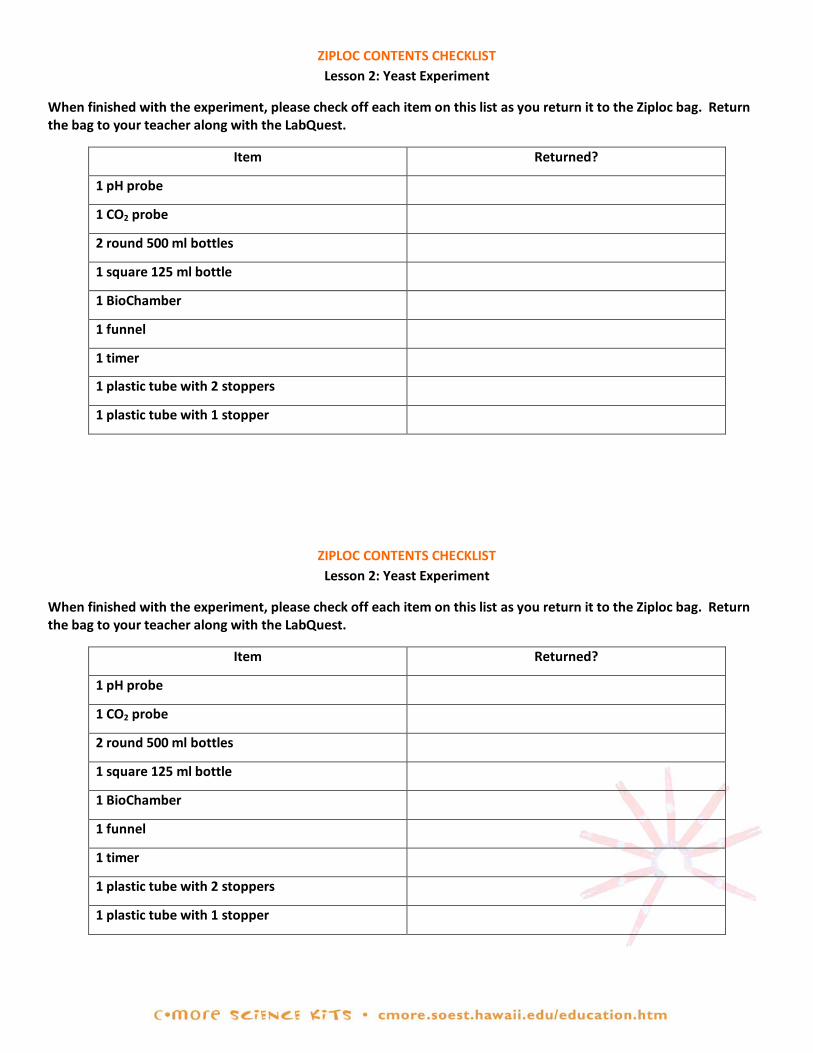
ZIPLOC CONTENTS CHECKLIST Lesson 2: Yeast Experiment
When finished with the experiment, please check off each item on this list as you return it to the Ziploc bag. Return the bag to your teacher along with the LabQuest.
Item Returned?
1 pH probe
1 CO2 probe
2 round 500 ml bottles
1 square 125 ml bottle
1 BioChamber
1 funnel
1 timer
1 plastic tube with 2 stoppers
1 plastic tube with 1 stopper
ZIPLOC CONTENTS CHECKLIST
Lesson 2: Yeast Experiment
When finished with the experiment, please check off each item on this list as you return it to the Ziploc bag. Return the bag to your teacher along with the LabQuest.
Item Returned?
1 pH probe
1 CO2 probe
2 round 500 ml bottles
1 square 125 ml bottle
1 BioChamber
1 funnel
1 timer
1 plastic tube with 2 stoppers
1 plastic tube with 1 stopper

STUDENT INSTRUCTIONS (pH group) Lesson 2: Yeast Experiment
In this experiment, you will be activating yeast, which creates carbon dioxide (CO2). The CO2 gas will be bubbled into a sample of water, where you will measure how the pH of the water changes over time. The other members of your group will be doing the same experiment, but they will measure the change in CO2 concentration over time in an air sample. At the end of the experiment, you will exchange data with the other members of your group.
Set up the LabQuest 1. The equipment you will use in this experiment is very expensive. Each set-up costs
approximately $750, so make sure to treat the equipment with care. A LabQuest (photo at right), a funnel, and a timer will be shared with all members of your group, including those measuring CO2.
2. For your half of the experiment, gather 1 packet of yeast, 3 packets of sugar, and the following items:
pH probe
1 round 500 ml bottle
1 square 125 ml bottle
1 piece of rubber tubing
connected with a straight connector at one end to a
large, white stopper
3. Fill the square 125ml bottle to the red line with room temperature water. To remove the pH probe from its storage container, UNSCREW THE LID FIRST and then gently pull the sensor out of the top. Be careful not to spill the storage solution. Insert the sensor into the square bottle as in the photo to the right. The tip (blue end) of the probe should be submerged in the water. The rest of the probe should remain dry! It is NOT waterproof!
4. Connect the pH probe to the port labeled CH1 on the back of the LabQuest.
5. When the CO2 group is ready, turn on the LabQuest by pressing the silver button in the upper left corner. A box should appear on the screen labeled CH 1: pH. The sensor will need to equilibrate before beginning the experiment. GENTLY swirl the probe in the water for 3 minutes; during this time the pH should rise. After 3 minutes, stop swirling. Watch the readings on the LabQuest, and wait for the pH reading to settle. The pH reading should be stable for approximately 1 minute before beginning the experiment. It is very important that the sensor equilibrate, so be patient! The sensor should give a pH of approximately 6–8. The pH of pure water is 7, but tap water often contains harmless, dissolved minerals that can affect its pH.
6. As you are waiting for the sensors to equilibrate, make a prediction as to what will happen to the pH and CO2
levels during the course of the experiment (question 1 on the STUDENT WORKSHEET).

Activate the Yeast 7. You will start your experiment at the same time as the CO2 group. When both
groups have their equipment set up, fill your round 500 ml bottle up to the white line with water that is hot to the touch. Your set-up should look like the picture to the right.
8. At the same time as the CO2 group, use the funnel to add 3 packets of sugar to the
hot water, and then add 1 packet of yeast. Stir by swirling the bottle for 5 seconds (This is the only time you need to stir the solution. Do not overmix!), then QUICKLY insert the white, rubber stopper into the top of the bottle. Make sure the seal is tight. Place the attached rubber tubing into the room-temperature water with your pH sensor.
Data Collection 9. Start your timer (which runs for 3 minutes) and record your initial pH reading in the table on your STUDENT
WORKSHEET. (The CO2 group should be recording measurements at the same time as you.) The yeast solution should begin to foam as in the picture below. In a few minutes, the gas being produced by the yeast should travel through the rubber tubing, producing bubbles in the water where pH is being measured. If you do not observe bubbles after the yeast solution has started to foam, you probably have a leak in your bottle or tubing. Check your rubber stopper seal.
10. Follow the instructions on your STUDENT WORKSHEET for collecting your data. You will be making
observations and recording the pH every 3 minutes.
11. When the foam reaches the red line on the bottle (or after 24 minutes – whichever comes first), stop the experiment by removing the stopper from your bottle and unplug your probe from the LabQuest. Do not let the foam pass the red line.
When the foam reaches the red
line, stop the experiment.
Don't let the foam rise above the
red line, as shown here!
12. Make sure the CO2 group is done, and then turn off the LabQuest by pressing the silver button in the upper left corner. Rinse and dry the round 500ml bottle that had the yeast in it, the funnel, and the 125 ml bottle that had the water in it. DO NOT rinse the pH probe! To store the pH probe, make sure the cap of the storage bottle is unscrewed before inserting the probe through the cap, then tighten the cap back onto the storage bottle. The tip of the sensor should be immersed in the storage solution, but should not touch the bottom of the container. Throw away your empty yeast and sugar packets.
13. Return all supplies to your teacher for inspection. Double check that all items are included by completing the ZIPLOC CONTENTS CHECKLIST. Please tell your teacher if there are any missing, broken, or damaged items so that they can be replaced.

STUDENT INSTRUCTIONS (CO2 group) Lesson 2: Yeast Experiment
In this experiment, you will be activating yeast, which creates carbon dioxide (CO2). The carbon dioxide will be directed into a chamber of air so that you can measure how much CO2 is generated over time. The other members of your group will be doing the same experiment, but they will measure how the CO2 generated affects the pH of water over time. At the end of the experiment, you will exchange data with the other members of your group.
Set up the LabQuest 1. The equipment you will use in this experiment is very expensive. Each set-up costs
approximately $750, so make sure to treat the equipment with care. A LabQuest (photo at right), a funnel, and a timer will be shared with all members of your group, including those measuring pH.
2. For your half of the experiment, gather 1 packet of yeast, 3 packets of sugar and the following items:
CO2 probe
1 round 500 ml bottle
1 BioChamber
1 piece of rubber tubing connected
with straight connectors to a small, black stopper at one end
and a large, white stopper at the other end
3. Connect the CO2 probe to the port labeled CH2 on the back of the LabQuest.
4. Make sure the CO2 probe is set to high (switch is at the top of the probe). Place the CO2 probe horizontally in the BioChamber. The bottle will be on its side, and the probe will enter the bottle through the bottle top, as in the photo at right. The CO2 probe cannot get wet. Make sure it stays dry!
5. Collect your piece of rubber tubing with the stoppers at both ends. Place the small black stopper in the hole in the side of the BioChamber, as in the photo at right. Make sure the seal is tight.
6. When the pH group is ready, turn on the LabQuest by pressing the silver button in the upper left corner. A box should appear on the screen labeled CH 2: CO2. Let the sensor equilibrate for a few minutes. The sensor should give a CO2 concentration somewhere between 300–600 ppm (higher if the ventilation in your classroom is poor). Allow a few minutes for the sensor to produce a stable value.

7. As you are waiting for the sensors to equilibrate, make a prediction as to what will happen to the pH and CO2
levels during the course of the experiment (question 1 on the STUDENT WORKSHEET).
Activate the Yeast 8. You will start your experiment at the same time as the pH group. When
both groups have their equipment set up, fill your round 500 ml bottle up to the white line with water that is hot to the touch. Your set-up should look like the picture to the right.
9. Use the funnel to add 3 packets of sugar to the hot water, and then add 1 packet of yeast. Stir gently by swirling the bottle for approximately 5 seconds (This is the only time you need to stir the solution. Do not overmix!), then QUICKLY insert the white rubber stopper into the top of the bottle. Make sure this stopper is sealed.
Data Collection 10. Start your timer (which runs for 3 minutes) and record your initial CO2 reading in the table on your STUDENT
WORKSHEET (The pH group should be recording measurements at the same time as you.). The yeast solution should begin to foam as in the picture below. The gas produced by the yeast will travel through the rubber tubing into the chamber where you are measuring CO2 concentration.
11. Follow the instructions on your STUDENT WORKSHEET for collecting your data. You will be making observations and recording the CO2 concentration every 3 minutes.
12. When the foam reaches the red line on the bottle (or after 24 minutes – whichever comes first), stop the
experiment by removing both stoppers from your bottles and unplug your probe from the LabQuest. Do not let the foam pass the red line.
13. Make sure the pH group is done, and then turn off the LabQuest by pressing the silver button in the upper left corner. Rinse and dry the round 500ml bottle that had the yeast in it and the funnel. DO NOT rinse the CO2 sensor or BioChamber! Place the CO2 sensor in its box. Throw away your empty yeast and sugar packets.
14. Repack your Ziploc, and return all supplies to your teacher for inspection. Double check that all items are included by completing the ZIPLOC CONTENTS CHECKLIST. Please tell your teacher if there are any missing, broken, or damaged items so that they can be replaced.
When the foam reaches the red
line, stop the experiment!
Don't let the foam rise above the
red line, as shown here!
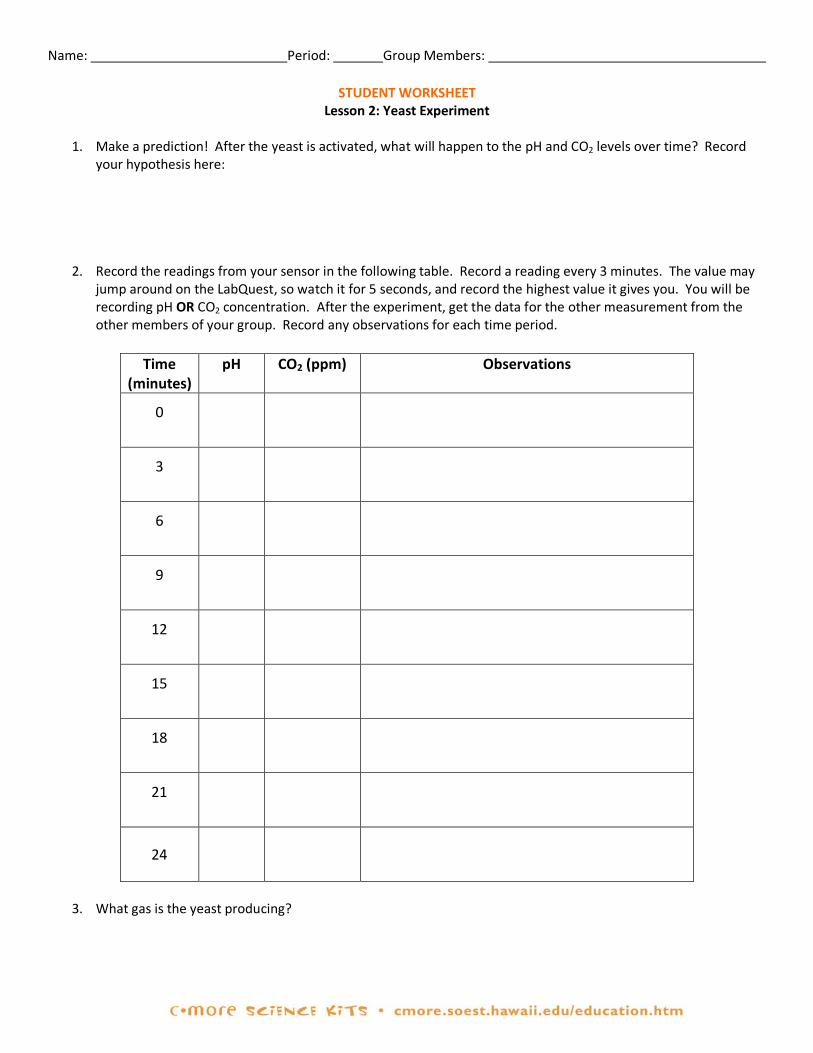
Name: Period: Group Members:
STUDENT WORKSHEET Lesson 2: Yeast Experiment
1. Make a prediction! After the yeast is activated, what will happen to the pH and CO2 levels over time? Record
your hypothesis here:
2. Record the readings from your sensor in the following table. Record a reading every 3 minutes. The value may jump around on the LabQuest, so watch it for 5 seconds, and record the highest value it gives you. You will be recording pH OR CO2 concentration. After the experiment, get the data for the other measurement from the other members of your group. Record any observations for each time period.
Time
(minutes) pH CO2 (ppm) Observations
0
3
6
9
12
15
18
21
24
3. What gas is the yeast producing?
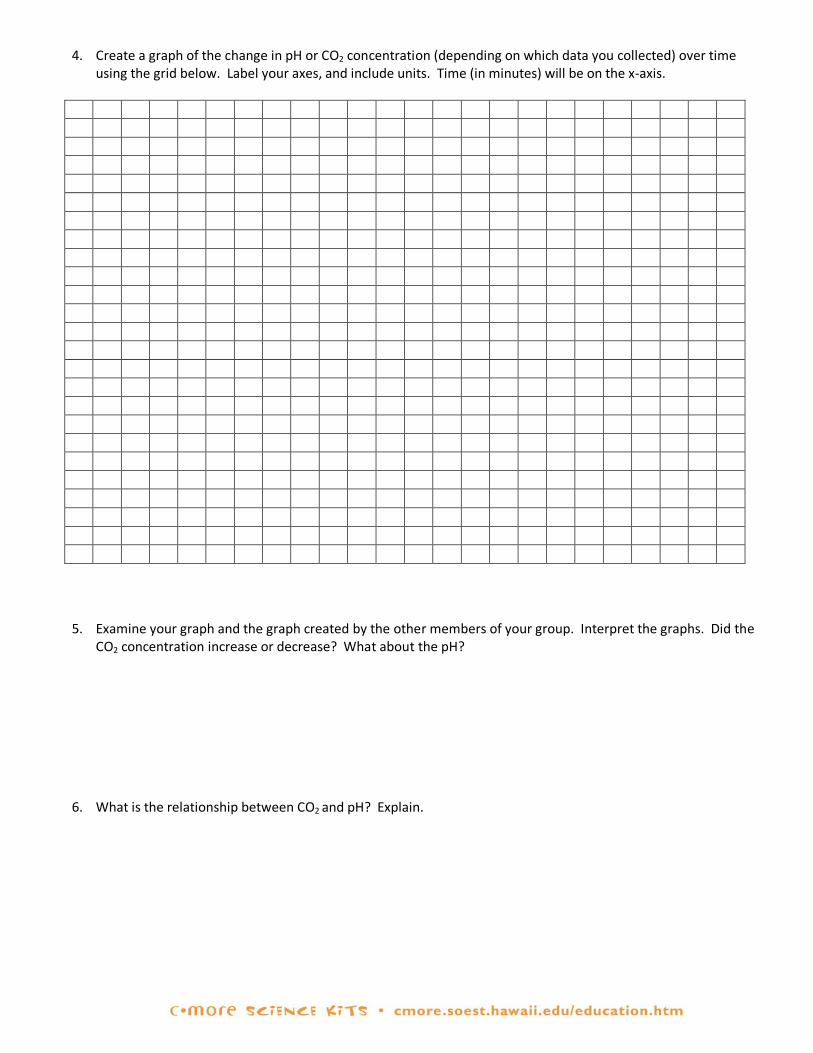
4. Create a graph of the change in pH or CO2 concentration (depending on which data you collected) over time using the grid below. Label your axes, and include units. Time (in minutes) will be on the x-axis.
5. Examine your graph and the graph created by the other members of your group. Interpret the graphs. Did the CO2 concentration increase or decrease? What about the pH?
6. What is the relationship between CO2 and pH? Explain.

7. The following graphs show changes in the levels of atmospheric and oceanic carbon dioxide over the past 20
years, as well as a corresponding change in ocean pH. The x-axis measures time in years, from October 1988 until December 2007. The y-axis of the top graph measures CO2 concentration. This top graph shows how the CO2 concentration in both the atmosphere (red line) and ocean (blue line) change with time. The actual data collected are shown with dots, and each line is the "best fit" to the data. The y-axis of the bottom graph measures pH of the ocean. Use the graphs to answer the following questions.
a. How much carbon dioxide was in the atmosphere in 1988? ________ 2007? __________
b. How much carbon dioxide was in the ocean in 1988? _________ 2007? ___________
c. What was the pH of the ocean in 1988? _________ 2007? ___________
Data from the Hawai‘i Ocean Time Series (HOT) and the Mauna Loa Observatory.
8. How do the data in these graphs compare to the data you collected?
9. According to these data and the data you collected, how do you think increasing atmospheric CO2 will affect marine organisms?

TEACHER ANSWER KEY Lesson 2: Yeast Experiment
1. Make a prediction! After the yeast is activated, what will happen to the pH and CO2 levels over time? Record your hypothesis here:
2. Record the readings from your sensor in the following table. Record a reading every 3 minutes. The value may be jumping around on the LabQuest Handheld, so watch it for 5 seconds, and record the highest value it gives you. You will be recording pH OR CO2 concentration. After the experiment, get the data for the other measurement from the other members of your group. Record any observations for each time period.
Time (minutes) pH CO2 (ppm) Observations
0
3
6
9
12
15
18
21
24
3. What gas is the yeast producing?
Email [email protected] to request a completed teacher answer key. Please include name, school and grade(s) taught in your request. Mahalo!

4. Create a graph of the change in pH or CO2 concentration (depending on which data you collected) over time using the grid below. Label your axes, and include units. Time (in minutes) will be on the x-axis.
5. What does your graph show? Did the CO2 concentration increase or decrease? What about the pH?
6. What is the relationship between CO2 and pH? Explain.
Email [email protected] to request a completed teacher answer key. Please include name, school and grade(s) taught in your request. Mahalo!

7. The following graphs show changes in the levels of atmospheric and oceanic carbon dioxide over the past 20 years, as well as a corresponding change in ocean pH. The x-axis measures time in years, from October 1988 until December 2007. The y-axis of the top graph measures CO2 concentration. This top graph shows how the CO2 concentration in both the atmosphere (red line) and ocean (blue line) change with time. The actual data collected are shown with dots, and each line is the "best fit" to the data. The y-axis of the bottom graph measures pH of the ocean. Use the graphs to answer the following questions.
a. How much carbon dioxide was in the atmosphere in 1988? ________ 2007? __________
b. How much carbon dioxide was in the ocean in 1988? _________ 2007? ___________
c. What was the pH of the ocean in 1988? _________ 2007? ___________
Data from the Hawai‘i Ocean Time Series (HOT) and the Mauna Loa Observatory.
8. How do the data in these graphs compare to the data you collected?
8. According to these data and the data you collected, how will increasing atmospheric CO2 affect marine organisms?
Email [email protected] to request a completed teacher answer key. Please include name, school and grade(s) taught in your request. Mahalo!

GLOSSARY
acid Any substance that has a pH less than 7. Examples: vinegar, lemon juice and carbonic acid. Acids react with bases to produce water and salts.
alkaline Having a pH greater than 7 (see base). basalt A dark gray or black lava rock. base Any substance that has a pH greater than 7. Examples: baking soda, soapy water and bleach.
Bases react with acids to produce water and salts.
calcify To harden by adding calcium. calcium An element (chemical symbol: Ca) that is a major component of bones, teeth, stony corals and
seashells. calcium carbonate A compound (chemical symbol: CaCO3) composed of a calcium ion (Ca2+) and a carbonate ion
(CO32-). Calcium carbonate is the main component in the hard parts of some marine organisms
such as seashells and coral skeletons. carbon dioxide A compound (chemical symbol: CO2) made of one carbon atom (C) and two oxygen atoms (O2).
Carbon dioxide is a colorless gas that is formed during respiration by living things and absorbed by plants during photosynthesis. Carbon dioxide (CO2) dissolves in water to form carbonic acid (H2CO3).
carbonic acid An acidic compound (chemical symbol: H2CO3) formed when carbon dioxide (CO2) dissolves in
water (H2O). Carbonic acid normally has a pH of about 6. compound A distinct substance formed by the chemical combination of two or more elements. concentration The relative amount of a substance in a solution. corrosive Having the ability to wear away another substance by chemical action. Example: an acid is
corrosive because it dissolves calcium carbonate sand. equilibrate To bring into or keep in equilibrium, balance. fossil fuel A fuel formed in the earth from plant or animal remains. Examples: coal, oil, or natural gas. hypothesis A prediction that can be tested. ion An atom or group of atoms that carries a positive (+) or negative (-) electric charge. LabQuest An electronic data recorder.
neutral Being neither an acid nor a base. Neutral substances have a pH of 7. Example: pure water. ocean acidification The ongoing decrease in the pH of the Earth's oceans, caused by the ocean's uptake of carbon
dioxide from the atmosphere.
organism A living thing. pH scale A scale from 0 to 14 that measures how acidic or basic a substance is. The pH scale is
logarithmic: a difference of one pH unit is equal to a ten-fold change in acidity.
plankton Organisms that drift in water and cannot swim against major currents. Plankton are found in both marine and fresh water environments.
ppm An abbreviation that means "parts per million" and represents the ratio where the denominator
is 1,000,000. Just as "per cent" means out of a hundred, "parts per million (ppm)" means out of a million. Example: If someone says that you are one in a million, this would be the same as 1 ppm.
probe A scientific instrument used to take measurements. In this experiment, we use probes to
measure pH and carbon dioxide (CO2).
yeast Microscopic organisms that release carbon dioxide (CO2) as a waste product as they respire and get energy from their food.

TEACHER EVALUATION http://www.surveymonkey.com/s/CMORE-kit-evaluation
1. Please circle the C-MORE science kit used:
2. I borrowed this science kit from___________________________________.
3. Please rate how strongly you agree or disagree with each of the following statements. Strongly Strongly Disagree Disagree Neutral Agree Agree
Online kit reservation was easy. 1 2 3 4 5
Picking up this science kit was difficult. 1 2 3 4 5
This science kit was easy to use. 1 2 3 4 5
The Teacher Guide was difficult to follow. 1 2 3 4 5
My students enjoyed using this science kit. 1 2 3 4 5
I would not borrow this science kit in the future. 1 2 3 4 5
I will borrow other C-MORE science kits. 1 2 3 4 5
Comments: 4. Are the time estimates given for each lesson reasonable? If not, please explain. 5. How did you use this science kit? (Example: in a 6th grade public school classroom to introduce a unit on…) 6. Did you use the entire science kit? If you omitted any lessons or activities, please list which ones and explain why
you skipped them. 7. Were your students involved and interested in the science kit activities?
Marine Debris
Marine Mystery
Nautical Knots and Maritime Careers
Ocean Acidification
Ocean Conveyor Belt
Plankton
Random Sampling

8. Please suggest two things that could be improved. 9. Any other comments? 10. Please tell us about your students. As we are committed to serving underrepresented populations, please estimate
the number of your students in the following categories:
School (optional): _________________________ Grade(s) kit was used with:_______________
___ Total number of students ___ African American ___ Filipino ___ Hispanic ___ Native American ___ Native Hawaiian or Pacific Islander
___ Learning disabled ___ Eligible for free or reduced lunch ___ Neither parent attended college ___ Physically disabled
___ Other (please specify) 11. Please fill out the following information if you would like to be notified of other C-MORE programs (workshops,
GEMS grants, teachers aboard research ships, etc). Name_____________________________
City/Town__________________________
State______________________________
Zip_______
Email Address_______________________
Thank you for your feedback.
SUPPLY CHECKLIST Ocean Acidification
Use the boxes to check off each item as you reassemble this kit.
Note: This checklist is two pages. Contents of Binder:
1. Front Pocket � CD (contains narrated PowerPoint and electronic versions of binder materials) � DVD (contains PowerPoint lecture by C-MORE scientist Dr. Scott Doney) � C-MORE Key Concepts in Microbial Oceanography brochure � C-MORE Microbial Oceanography: Resources for Teachers brochure � Current: The Journal of Marine Education (Special Issue on Ocean Acidification)
2. Front Material � OCEAN ACIDIFICATION (provides a general overview & standards addressed)
3. Lesson 1 Tab � TEACHER GUIDE – Lesson 1: Introduction to Ocean Acidification � OCEAN ACIDIFICATION SURVEY � TEACHER ANSWER KEY to OCEAN ACIDIFICATION SURVEY � POWERPOINT SCRIPT � HONOLULU DECLARATION article � STUDENT WORKSHEET – Lesson 1a: Honolulu Declaration � TEACHER ANSWER KEY – Lesson 1a: Honolulu Declaration � THE DANGERS OF OCEAN ACIDIFICATION article � STUDENT WORKSHEET – Lesson 1b: The Dangers of Ocean Acidification � TEACHER ANSWER KEY – Lesson 1b: The Dangers of Ocean Acidification
4. Lesson 2 Tab � TEACHER GUIDE – Lesson 2: Yeast Experiment � MATERIALS PHOTO GUIDE – Lesson 2: Yeast Experiment � ZIPLOC CONTENTS CHECKLIST – Lesson 2: Yeast Experiment � STUDENT INSTRUCTIONS (pH group) – Lesson 2: Yeast Experiment (5 copies) � STUDENT INSTRUCTIONS (CO2 group) – Lesson 2: Yeast Experiment (5 copies) � STUDENT WORKSHEET – Lesson 2: Yeast Experiment � TEACHER ANSWER KEY – Lesson 2: Yeast Experiment
5. Glossary Tab � GLOSSARY
6. Teacher Evaluation Tab � Completed TEACHER EVALUATION
7. Supply Checklist Tab � Completed SUPPLY CHECKLIST
8. Back Pocket � Manuals for electric kettle, pH probe, and CO2 probe
Lesson 1 Supplies:
� Speakers � Ziploc bag containing:
� 5 bottles of vinegar � 5 bags of coral (white) sand � 5 bags of basalt (black) sand � 5 Petri dishes (with lids) � 5 plastic droppers

Lesson 2 Supplies:
� 5 Vernier LabQuest data recorders � Electric kettle � 5 large Ziploc bags, each containing:
� 1 pH probe, stored in solution � 1 CO2 probe � 2 round 500 ml bottles � 1 square 125 ml bottle � 1 BioChamber (bottle with hole in the side) � 1 funnel � 1 timer � 1 piece of rubber tubing connected with straight connectors to a small, black stopper (#6) at one end
and a large, white stopper at the other (#8) � 1 piece of rubber tubing connected with a straight connector at one end to a large, white stopper (#8)
� Bag of sugar and yeast packets � Scissors � Extra pH storage solution