occupational injuries and illnesses: a pilot study of job
TRANSCRIPT

U.S. BUREAU OF LABOR STATISTICS
A P R I L 2 0 1 4 R E P O R T 1 0 4 9
BLS Reports │ April 2014 • www.bls.gov 1
Occupational Injuries and Illnesses: a pilot study of job-transfer or work-restriction cases, 2012
The Bureau of Labor Statistics (BLS) conducted a pilot study to learn more about the case circumstances and worker characteristics for
occupational injury and illness cases that resulted in days of job transfer or work restriction for workers in six private industry subsectors in 2012. This is the second year for which these data are available. Rather than design and conduct an entirely separate survey, BLS integrated the pilot study with the existing BLS Survey of Occupational Injuries and Illnesses (SOII), an annual survey of over 250,000 establishments.
In the normal Survey of Occupational Injuries and Illnesses, establishments are asked to provide detailed
information about injuries and illnesses that led to days away from work. For the pilot study, establishments in the six selected private industry subsectors (according to the North American Industry Classification System, 2007) were asked to provide details for injuries and illnesses that led only to job transfer or restricted work in addition to the normally collected information on days-away-from-work cases. This information includes details about the type of event or exposure leading to the injury or illness, the type of injury or illness, the part of body affected, and the type of equipment or substance related to the event or exposure and various characteristics of the injured or ill worker.
This report presents data highlights and statistical tables on injuries and illnesses that led to employees being transferred to another job or restricted from their normal duties. Three types of cases are discussed in this report to
CONTENTSHighlights . . . . . . . . . . . . . . . . . . . . . . . . . . . . . . . . . . . . . . 2Specialty trade contractors . . . . . . . . . . . . . . . . . . . . . . . . . 3Food manufacturing . . . . . . . . . . . . . . . . . . . . . . . . . . . . . . 4Building material and garden equipment and supplies dealers . . . . . . . . . . . . . . . . . . . . . . . . . . . . . . 5Air transportation . . . . . . . . . . . . . . . . . . . . . . . . . . . . . . . . 6Warehousing storage . . . . . . . . . . . . . . . . . . . . . . . . . . . . . . 7Nursing and residential care facilities . . . . . . . . . . . . . . . . . 8Statistical Tables . . . . . . . . . . . . . . . . . . . . . . . . . . . . . . . . 10Technical Notes . . . . . . . . . . . . . . . . . . . . . . . . . . . . . . . . . 35
(Note: Because of data processing errors, incorrect U.S. national estimates of nonfatal occupational injuries and illnesses were published in the Days of Job Transfer or Restriction reports for reference years 2011 and 2012. Corrections will not be made to this report. Data in this report should not be relied upon. For corrected data and additional information, please see https://www.bls.gov/bls/errata/iif_errata_1014.htm.)

2 BLS Reports │ April 2014 • www.bls.gov
J O B - T R A N S F E R O R W O R K - R E S T R I C T I O N C A S E S , 2 0 1 2
0
500
1,000
1,500
2,000
2,500
3,000
3,500
1992 1994 1996 1998 2000 2002 2004 2006 2008 2010 2012
Thousand of cases
Recordkeeping change
Source: U.S. Bureau of Labor Statistics.
Case counts of nonfatal occupational injuries and illnesses, by type of private industry, 1992–2012
Days away from workDays of job transfer or restriction
give context to the magnitudes and rates of occupational injuries and illnesses:
1. DART – Days away from work, days of restricted work activity or job transfer
2. DJTR – Days of job transfer or restriction (only)
3. DAFW – Days away from work (with or without days of job transfer or restriction)
DJTR and DAFW cases are the two components of DART cases. That is, DART = DJTR + DAFW.
The following subsectors were selected for the pilot study:
• Specialty trade contractors
• Food manufacturing
• Building material and garden equipment and supplies dealers
• Air transportation
• Warehousing and storage
• Nursing and residential care facilities
For a detailed description of the source of data and an explanation of the concepts and definitions used, see the accompanying technical notes section.
Highlights In 2012, 42 percent of the private industry cases that required days away from work, work restriction or job transfer were cases involving days of job transfer and restriction only—with the remaining being days-away-from-work cases. (See chart 1.) This is a similar proportion found in most recent years where the proportion of days of job transfer and restriction cases ranged from 43 percent of days away from work, restriction, or transfer cases in 2007 to 41 percent in 2011.
The number of cases and the incidence rates for all cases of days of job transfers and restrictions in each of the six pilot industries remained statistically unchanged in 2012, compared with those in 2011. (See table 1.) That type of metric was already available without this pilot study. With this pilot study, data about the case circumstance leading to days of job transfer or restriction are now available. For example, the category of musculoskeletal disorders (MSDs) are now available for cases involving days of job transfer or restriction. This is an important and unique category to study because it includes several types of injuries or disorders resulting from several types of events or exposures. In general, injuries include sprains, strains, tears, pain, soreness, carpal tunnel syndrome, and
Chart 1
Source: U.S. Bureau of Labor Statistics.

BLS Reports │ April 2014 • www.bls.gov 3
J O B - T R A N S F E R O R W O R K - R E S T R I C T I O N C A S E S , 2 0 1 2
0
50
100
150
200
250
Specialty trade contractors
Food manufacturing Building material and garden
equipment supplies dealers
Air transportation Warehousing and storage
Nursing and residential care
facilities
2011 DJTR 2012 DJTR 2011 DAFW 2012 DAFW
Incidence of musculoskeletal disorders resulting in days of job transfer or restriction and days away from work, 2011–2012
Rate per 10,000 full-time workers
Note: DJTR = Days of job transfer or work restriction. DAFW = Days away from work.Source: U.S. Bureau of Labor Statistics.
hernia. Events or exposures include overexertion, bodily motion, and repetitive motion. For a complete list of event or exposure and injury (nature) categories that make up musculoskeletal disorders, please visit www.bls.gov/iif.
In 2012, the number of days-of-job-transfer-or-restriction (DJTR) cases resulting from musculoskeletal disorders was greater than or equal to the number of days-away-from-work (DAFW) cases for musculoskeletal disorders in food manufacturing, building material and garden equipment supplies dealers, warehousing and storage, and nursing and residential care facilities. (See chart 2.) In the food manufacturing industry the 2012 incidence rate for musculoskeletal disorders for job-transfer-or-restriction cases increased to 103.9 cases (from 97.4 in 2011) per 10,000 full-time workers. The musculoskeletal disorder rate for job-transfer-or-restriction cases remained statistically unchanged in 2012 for the other five pilot industries.
This pilot study is an effort to better understand the details of the case circumstances and worker characteristics of job transfer and worker restriction cases. Over the long term, the proportion of transfer and restriction cases has
risen. These new data provide insight into how injuries and illnesses lead to days of job transfer or restriction rather than days away from work.
Specialty trade contractorsThere were 19,710 injury and illness cases with days of job transfer or restriction (DJTR) in the specialty trade contractors industry in 2012, with a rate of 64.1 injuries and illnesses per 10,000 full-time workers. (See chart 3.) The case count and incidence rate for job transfer or restriction cases in this industry were statistically unchanged from the previous year. The median days of job transfer or restriction for specialty trade contractors was 10 days, the same as in 2011. (See tables 1 and 4.) Days-of-job-transfer-or-restriction cases (DJTR) made up 30 percent of the 66,730 days away from work, restriction or transfer (DART) cases; the remaining 70 percent were days-away-from-work cases (DAFW).
Workers in construction and extraction occupations in the specialty trade contractors industry made up three-quarters of all days of job transfer or restriction cases
Chart 2
Note: DJTR = Days of job transfer or work restriction. DAFW = Days away from work.
Source: U.S. Bureau of Labor Statistics.

4 BLS Reports │ April 2014 • www.bls.gov
J O B - T R A N S F E R O R W O R K - R E S T R I C T I O N C A S E S , 2 0 1 2
Overexertion and bodily reaction
Struck by object or equipment
Cuts and lacerations
Sprains, strains, and tears
Installation, maintenance, and repair occupations
Construction and extraction occupations
Total
Event:
20,000 15,000 10,000 5,000 0 5 10 15
Source: U.S. Bureau of Labor Statistics.
Nature:
Occupation:
Case counts and median days of job transfer or restriction, specialty trade contractors, 2012
Case counts Median days of job transfer or restriction
(14,710 cases) in 2012 and required a median of 10 days of job transfer or restriction before returning to their normal work duties—the same as in 2011. (See table 2 and chart 3.) Installation, maintenance, and repair occupations accounted for another 15 percent of cases (3,030 cases) and required a median of 7 days of job transfer or restriction—two fewer days than in 2011. (See chart 3.)
Overexertion and bodily reaction was the most frequent type of event or exposure that resulted in days of job transfer or restriction, with 6,320 cases in 2012—statistically unchanged from 2011. (See table 1 and chart 3.) Being struck by object or equipment accounted for another 5,610 job transfer or restriction cases—up 24 percent from 2011. Workers who sustained injuries and illnesses from overexertion and bodily reaction required twice as many days (median of 14 days) in job transfer or work restriction as those who were injured by being struck by objects. (See chart 3.)
The total number of days of job transfer or restriction due to sprains and strains were statistically unchanged at 7,760 cases (39 percent of the total). Workers who experienced sprains and strains required a median of 14 days of job transfer or restriction. Cuts and lacerations accounted for
another 4,120 job transfer or restriction cases (21 percent), also unchanged from 2011. Workers who sustained sprains and strains required more than twice the number days in job transfer or work restriction as those who sustained cuts and lacerations. (See chart 3.)
Musculoskeletal disorders made up 6,070 cases, 31 percent of all days-of-job-transfer-or-restriction cases, with a rate of 19.7 per 10,000 full-time workers. (See table 3.) The median number of days of job transfer or restriction for musculoskeletal disorders cases was 13—one more than the median in 2011.
Male workers accounted for nearly all (19,330) days-of-job-transfer-or-restriction cases in this industry, with female workers only accounting for 2 percent of cases. (See tables 2 and 4.) In cases where race was reported, 63 percent of the cases occurred to White workers and 32 percent occurred to Hispanic or Latino workers. Race and ethnicity were not reported in 27 percent of cases.
Food manufacturingThere were 31,290 cases with days of job transfer or restriction in food manufacturing in 2012 with a rate of 216.1 cases per 10,000 full-time workers. The median days
Chart 3
Source: U.S. Bureau of Labor Statistics.

BLS Reports │ April 2014 • www.bls.gov 5
J O B - T R A N S F E R O R W O R K - R E S T R I C T I O N C A S E S , 2 0 1 2
0
10
20
30
40
50
60
70
80
Sprains, strains, and tears Soreness and pain Cuts, lacerations, and punctures
Rate per 10,000 full-time workers 2011 DJTR 2012 DJTR 2011 DAFW 2012 DAFW
Incidence of injuries and illnesses for selected natures of the injury or illness, by cases of days of job transfer or work restriction and cases of days away from work in food manufacturing, 2011–2012
Note: DJTR = Days of job transfer or work restriction. DAFW = Days away from work.Source: U.S. Bureau of Labor Statistics.
of job transfer or restriction for this industry was 15 (the same as for 2011). (See tables 1 and 3 and chart 4.) The days of job transfer or restriction case count and incidence rate in this industry were statistically unchanged from the previous year.
The job transfer or restriction (DJTR) rate for sprains, strains, or tears (74.4 cases per 10,000 full-time workers) was more than 1–1/2 times greater than the rate for sprains, strains, and tears for days-away-from-work (DAFW) cases in 2012. Sprains, strains, and tears was the leading nature of injury or illness for both job transfer or restriction (DJTR) and days-away-from-work (DAFW) cases in food manufacturing in 2012. (See chart 4 and table 3.) While the sprains, strains, or tears job transfer or restriction rate remained unchanged in 2012, the days away from work rate decreased significantly to 39.9 cases per 10,000 full-time workers for these types of injuries. (See chart 4.)
Twenty-five percent of the 49,910 days away from work, restriction or transfer cases in food manufacturing were the result of injuries or illnesses to the hand in 2012.
(See table 1.) Sixty-eight percent of these cases resulted in a job transfer or restriction (DJTR) case instead of a days-away-from-work (DAFW) case. The rate for job transfer or restriction cases involving the hand was 58.1 cases per 10,000 full-time worker, which was essentially the same as in 2011. (See table 3.) The incidence rate for job transfer or restriction cases involving the knee was 11.2 cases per 10,000 full-time workers, which was an increase from a rate of 8.4 in 2011. While the job transfer or restriction rate for injuries and illnesses to the knee increased, the corresponding days away from work rate remained statistically unchanged.
Building material and garden equipment and supplies dealersThere were 17,190 cases with days of job transfer or restriction in the building materials and supplies dealers industry in 2012, with a rate of 168.7 cases per 10,000 full-time workers—both measures were statistically unchanged from 2011. (See table 3.) The median number of days of job transfer or restriction for this industry was 13 days; 1 day fewer than the median in 2011.
Chart 4
Note: DJTR = Days of job transfer or work restriction. DAFW = Days away from work.
Source: U.S. Bureau of Labor Statistics.
6 BLS Reports │ April 2014 • www.bls.gov
J O B - T R A N S F E R O R W O R K - R E S T R I C T I O N C A S E S , 2 0 1 2
2011 2012 2011 2012 2011 2012 2011 2012
Sales and related Transporation and material moving Office and administrative
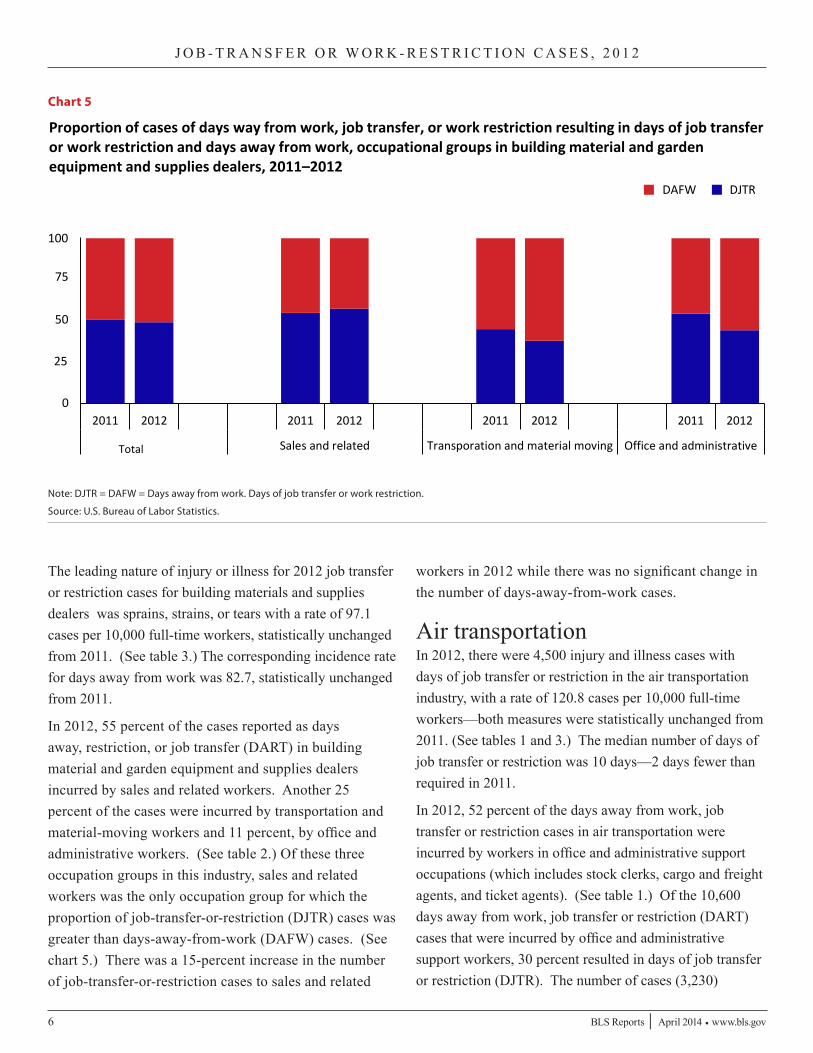
Proportion of cases of days way from work, job transfer, or work restriction resulting in days of job transfer or work restriction and days away from work, occupational groups in building material and garden equipment and supplies dealers, 2011–2012
Note: DJTR = DAFW = Days away from work. Days of job transfer or work restriction. Source: U.S. Bureau of Labor Statistics.
25
0
50
75
100
Total
DAFW DJTR
The leading nature of injury or illness for 2012 job transfer or restriction cases for building materials and supplies dealers was sprains, strains, or tears with a rate of 97.1 cases per 10,000 full-time workers, statistically unchanged from 2011. (See table 3.) The corresponding incidence rate for days away from work was 82.7, statistically unchanged from 2011.
In 2012, 55 percent of the cases reported as days away, restriction, or job transfer (DART) in building material and garden equipment and supplies dealers incurred by sales and related workers. Another 25 percent of the cases were incurred by transportation and material-moving workers and 11 percent, by office and administrative workers. (See table 2.) Of these three occupation groups in this industry, sales and related workers was the only occupation group for which the proportion of job-transfer-or-restriction (DJTR) cases was greater than days-away-from-work (DAFW) cases. (See chart 5.) There was a 15-percent increase in the number of job-transfer-or-restriction cases to sales and related
workers in 2012 while there was no significant change in the number of days-away-from-work cases.
Air transportationIn 2012, there were 4,500 injury and illness cases with days of job transfer or restriction in the air transportation industry, with a rate of 120.8 cases per 10,000 full-time workers—both measures were statistically unchanged from 2011. (See tables 1 and 3.) The median number of days of job transfer or restriction was 10 days—2 days fewer than required in 2011.
In 2012, 52 percent of the days away from work, job transfer or restriction cases in air transportation were incurred by workers in office and administrative support occupations (which includes stock clerks, cargo and freight agents, and ticket agents). (See table 1.) Of the 10,600 days away from work, job transfer or restriction (DART) cases that were incurred by office and administrative support workers, 30 percent resulted in days of job transfer or restriction (DJTR). The number of cases (3,230)
Chart 5
Note: DJTR = DAFW = Days away from work. Days of job transfer or work restriction.
Source: U.S. Bureau of Labor Statistics.

BLS Reports │ April 2014 • www.bls.gov 7
J O B - T R A N S F E R O R W O R K - R E S T R I C T I O N C A S E S , 2 0 1 2
0
2,500
5,000
7,500
10,000
12,500
2011 2012 2011 2012 2011 2012 2011 2012
Sprains, strains, and tears Cuts, lacerations, andpunctures
Bruises and contusions Soreness, and pain
Number of cases
Case counts of nonfatal occupational injuries and illnesses, by cases of days away from work and cases of days of job transfer or work restriction and by selected nature of injury, warehousing and storage, 2011–2012
Note: DAFW = Days away from work. DJTR = Days of job transfer or work restriction. Source: U.S. Bureau of Labor Statistics.
DAFW DJTR
reported for 2012 for this occupation group was not statistically different from the number of cases reported in 2011. The 3,230 days-of-job-transfer-or-restriction cases in this occupation group accounted for 72 percent of the total days-of-job-transfer-or-restriction cases in air transportation. Of the 7,700 days away from work, job transfer or restriction cases that were incurred by transportation and material movers, 91 percent resulted in days away from work (DAFW) rather than days of job transfer or restriction (DJTR).
Two-thirds of the days-of-job-transfer-or-restriction cases in the air transportation industry involved injuries or illnesses to upper extremities (primarily the shoulder, arm, or hand) and the trunk (primarily the back). (See table 1.) Of the days away from work, job transfer or restriction (DART) cases to upper extremities, 26 percent resulted in cases of job transfer or restriction (as opposed to days away from work). Of the total days away from work, job transfer or restriction (DART) cases to the trunk, 25 percent resulted in job-transfer-or-restriction cases (DJTR). Twenty-five percent (5,040 cases) of the
days away from work, job transfer or restriction cases in air transportation were the result of injuries and illnesses to lower extremities (knee, ankle, foot). Fifteen percent of the days away from work, job transfer or restriction cases involving lower extremities resulted in cases managed as days of job transfer or restriction.
Warehousing and storageThere were 12,720 cases involving days of job transfer or restriction in the warehousing and storage industry in 2012. Days-of-job-transfer-or-restriction cases accounted for 53 percent of days away from work, job transfer or restriction cases and occurred at a rate of 208.4 cases per 10,000 full-time workers. (See tables 1 and 3.) The median number of days of job transfer or restriction for this industry was 13 days, the same as in 2011. (See tables 1 and 4.) The case count and incidence rate for job transfer or restriction cases in this industry were statistically unchanged from the previous year.
Almost all of the increase in days away from work, restrictions or transfer (DART) resulting from sprains,
Chart 6
Note: DAFW = Days away from work. DJTR = Days of job transfer or work restriction.
Source: U.S. Bureau of Labor Statistics.

8 BLS Reports │ April 2014 • www.bls.gov
J O B - T R A N S F E R O R W O R K - R E S T R I C T I O N C A S E S , 2 0 1 2
strains, and tears in warehousing and storage for 2012 was due to a rise in the number of days-of-job-transfer-or-restriction (DJTR) cases of this type. As in 2011, the most common nature of injury or illness in 2012 for days away from work, restrictions or transfer (DART) cases was sprains, strains, and tears, for which 59 percent (7,120) were reported as days-of-job-transfer-or-restriction (DJTR) cases. (See table 1.) Although the overall incidence rate for all days-of-job-transfer-or-restriction cases in this industry was little changed, the rate for those cases involving sprains, strains, and tears rose 16 percent (from 101 to 117 cases per 10,000 full-time workers) in 2012. (See table 3.)
The leading event or exposure for days-of-job-transfer-or-restriction cases in this industry was overexertion and bodily reaction with 7,150 cases, which was more than the 4,900 days-away-from-work cases for the same type of event. The second leading event or exposure for job-transfer-or-restriction cases was contact with objects or equipment. For contact with objects or equipment and falls, slips, and trips cases, the number of job-transfer-or-restriction cases were statistically the same as days-away-from-work cases. (See table 1.)
Nursing and residential care facilitiesThere were 55,650 cases involving days of job transfer or restriction in the nursing and residential care facilities industry in 2012. These cases accounted for 49 percent
of days away from work, restriction, or job transfer cases and occurred at a rate of 229.6 cases per 10,000 full-time workers. (See table 3.) The case count and incidence rate for days-of-job-transfer-or-restriction cases in this industry were statistically unchanged from the previous year. The median days of job transfer or restriction for this industry was 12 days—the same as the previous year. (See tables 1 and 4.)
Seventy-six percent of the 113,020 days away from work, restriction or transfer (DART) cases in the nursing and residential care industry were incurred by workers in service occupations (primarily health support occupations). The cases were distributed proportionately among job-transfer-or-restriction cases (43,110) and days-away-from-work cases (42,870). (See table 2.) The overall number of days away from work, restriction or transfer (DART) cases for this occupation remained statistically unchanged in 2012, despite a 5-percent decrease in the number of days away from work cases. There was no statistical change in the number of job transfer or restriction cases for service occupation workers. Healthcare practitioners and technical workers accounted for 12 percent of the days away, restriction or transfer (DART) cases in this industry. Despite an increase of 8 percent in job transfer or restriction (DJTR) cases in 2012, the number of days away, restriction or transfer (DART) cases did not statistically change from 2011.

BLS Reports │ April 2014 • www.bls.gov 9
J O B - T R A N S F E R O R W O R K - R E S T R I C T I O N C A S E S , 2 0 1 2
Statistical Tables

10 BLS Reports │ April 2014 • www.bls.gov
J O B - T R A N S F E R O R W O R K - R E S T R I C T I O N C A S E S , 2 0 1 2
Table 1. Number of nonfatal occupational injuries and illnesses involving days away from work, restricted work activity, or jobtransfer (DART), days away from work (DAFW)1, and restricted work activity, or job transfer (DJTR)2 by selected industry3 and casecharacteristics, private industry, 2012
Case characteristic
Specialtytrade
contractors
Foodmanufacturing
Total4
Caseswith days
awayfromwork
Caseswith jobtransfer
orrestriction
Total4
Caseswith days
awayfromwork
Caseswith jobtransfer
orrestriction
Total ............................................................................................... 66,730 47,020 19,710 49,910 18,620 31,290
Musculoskeletal disorders5 ........................................................................ 20,780 14,710 6,070 21,140 6,090 15,050
Nature of injury or illness:Fractures ................................................................................................... 5,890 4,630 1,260 3,160 1,780 1,380Sprains, strains, tears ................................................................................ 23,780 16,020 7,760 16,550 5,780 10,770Amputations ............................................................................................... 290 260 40 530 410 120Cuts, lacerations, punctures ...................................................................... 11,080 6,430 4,650 5,820 2,000 3,820
Cuts, lacerations .................................................................................... 9,580 5,460 4,120 5,310 1,780 3,530Punctures (except gunshot wounds) ..................................................... 1,500 970 530 520 220 290
Bruises, contusions ................................................................................... 3,940 2,460 1,480 5,180 1,780 3,400Chemical burns and corrosions ................................................................. 210 160 50 360 200 150Heat (thermal) burns .................................................................................. 730 590 140 840 510 330Multiple traumatic injuries .......................................................................... 1,480 1,070 410 1,380 650 730
With sprains and other injuries .............................................................. 530 370 160 680 310 370With fractures and other injuries ............................................................ 440 300 130 210 120 80
Soreness, pain ........................................................................................... 8,670 6,880 1,780 7,900 2,060 5,840Carpal tunnel syndrome ............................................................................ 70 60 20 790 350 440Tendonitis .................................................................................................. 70 50 20 900 90 810All other natures ........................................................................................ 10,530 8,430 2,100 6,520 3,020 3,500
Event or exposure leading to injury or illness:Violence and other injuries by persons or animal ...................................... 560 340 210 300 110 200Intentional injury by other person ............................................................ 30 – – 50 20 30Injury by person unintentional or intent unknown .................................... 20 – – 80 40 40Animal and insect related incidents ......................................................... 510 310 200 170 40 130
Transportation incidents ............................................................................ 1,990 1,500 490 830 460 370Roadway incidents involving motorized land vehicles ............................. 1,460 1,070 390 160 110 50
Fires and explosions .................................................................................. 170 160 – – – –Falls, slips, trips ......................................................................................... 15,580 11,890 3,680 9,280 4,280 5,000Slips, trips without fall .............................................................................. 3,310 2,200 1,100 1,630 770 870Fall on same level .................................................................................... 5,090 3,980 1,110 5,890 2,700 3,190Fall to lower level ..................................................................................... 6,670 5,350 1,320 1,560 740 820
Exposure to harmful substances or enviroments ...................................... 2,180 1,830 350 2,020 1,220 800Contact with object, equipment ................................................................. 23,390 15,000 8,400 15,430 6,010 9,420Struck by object or equipment ................................................................. 14,320 8,710 5,610 7,310 2,660 4,650Struck against object or equipment ......................................................... 4,840 3,380 1,460 3,180 1,190 1,990Caught in or compressed by object or equipment ................................... 2,530 1,520 1,010 4,260 1,960 2,290
Overexertion and bodily reaction ............................................................... 22,220 15,910 6,320 21,690 6,360 15,330Overexertion in lifting or lowering ............................................................ 7,230 5,180 2,050 5,210 1,760 3,450
Repetitive motion involving microtasks ...................................................... 610 310 300 6,430 1,300 5,130All other events or exposures .................................................................... 640 390 250 360 190 170
Part of body affected by the injury or illness:Head .......................................................................................................... 4,900 4,120 780 2,030 1,360 660
Eye(s) .................................................................................................... 2,470 2,180 290 700 450 250Neck .......................................................................................................... 600 430 180 340 110 230Trunk ......................................................................................................... 16,120 11,970 4,150 10,170 3,910 6,260
Back ....................................................................................................... 11,640 8,190 3,450 7,740 2,840 4,890Upper extremities ...................................................................................... 24,350 15,010 9,340 25,960 7,890 18,070
Shoulder ................................................................................................ 5,400 3,950 1,450 4,340 1,520 2,820Arm ........................................................................................................ 3,370 2,030 1,340 3,270 1,030 2,250Wrist ...................................................................................................... 2,080 1,330 750 3,800 1,020 2,780Hand ...................................................................................................... 12,750 7,330 5,430 12,350 3,940 8,410
Lower extremities ...................................................................................... 14,770 10,640 4,130 7,700 3,550 4,150Knee ...................................................................................................... 6,120 4,700 1,430 2,960 1,330 1,630Ankle ...................................................................................................... 3,260 2,370 890 1,410 600 800Foot ....................................................................................................... 2,700 1,620 1,080 1,900 930 970
Body systems ............................................................................................ 730 630 110 350 280 70Multiple ...................................................................................................... 4,810 3,870 940 3,030 1,330 1,700All other parts of body ................................................................................ 440 350 90 330 180 150
See footnotes at end of table.

BLS Reports │ April 2014 • www.bls.gov 11
J O B - T R A N S F E R O R W O R K - R E S T R I C T I O N C A S E S , 2 0 1 2
Table 1. Number of nonfatal occupational injuries and illnesses involving days away from work, restricted work activity, or jobtransfer (DART), days away from work (DAFW)1, and restricted work activity, or job transfer (DJTR)2 by selected industry3 and casecharacteristics, private industry, 2012 — Continued
Case characteristic
Building material andgarden equipment supplies
dealers
Airtransportation
Total4
Caseswith days
awayfromwork
Caseswith jobtransfer
orrestriction
Total4
Caseswith days
awayfromwork
Caseswith jobtransfer
orrestriction
Total ............................................................................................... 34,890 17,700 17,190 20,450 15,950 4,500
Musculoskeletal disorders5 ........................................................................ 16,800 8,000 8,800 10,620 8,150 2,470
Nature of injury or illness:Fractures ................................................................................................... 1,690 1,170 520 560 510 50Sprains, strains, tears ................................................................................ 18,330 8,430 9,900 11,870 9,230 2,640Amputations ............................................................................................... 30 30 – – – –Cuts, lacerations, punctures ...................................................................... 4,220 1,760 2,460 780 460 320
Cuts, lacerations .................................................................................... 3,600 1,540 2,060 750 440 310Punctures (except gunshot wounds) ..................................................... 620 210 400 30 – –
Bruises, contusions ................................................................................... 4,700 2,100 2,600 2,070 1,660 420Chemical burns and corrosions ................................................................. 60 50 – 80 80 –Heat (thermal) burns .................................................................................. 20 – 20 40 40 –Multiple traumatic injuries .......................................................................... 360 200 160 460 370 90
With sprains and other injuries .............................................................. 140 50 90 100 90 –With fractures and other injuries ............................................................ 60 60 – – – –
Soreness, pain ........................................................................................... 1,860 1,390 470 1,770 1,170 600Carpal tunnel syndrome ............................................................................ 80 70 – 30 20 –Tendonitis .................................................................................................. 30 – – 30 30 –All other natures ........................................................................................ 3,520 2,480 1,030 2,770 2,380 380
Event or exposure leading to injury or illness:Violence and other injuries by persons or animal ...................................... 330 190 140 220 190 30Intentional injury by other person ............................................................ 60 40 20 – – –Injury by person unintentional or intent unknown .................................... 80 30 50 90 70 30Animal and insect related incidents ......................................................... 180 110 70 120 120 –
Transportation incidents ............................................................................ 730 620 120 1,110 1,070 40Roadway incidents involving motorized land vehicles ............................. 420 390 30 100 90 –
Fires and explosions .................................................................................. – – – – – –Falls, slips, trips ......................................................................................... 4,440 2,690 1,750 3,070 2,290 780Slips, trips without fall .............................................................................. 820 630 190 770 530 240Fall on same level .................................................................................... 2,340 1,260 1,080 1,770 1,300 460Fall to lower level ..................................................................................... 1,160 710 450 390 340 60
Exposure to harmful substances or enviroments ...................................... 320 250 80 650 590 50Contact with object, equipment ................................................................. 11,750 5,610 6,140 4,430 3,310 1,110Struck by object or equipment ................................................................. 7,970 3,850 4,130 2,130 1,690 440Struck against object or equipment ......................................................... 2,170 1,020 1,150 1,410 970 430Caught in or compressed by object or equipment ................................... 1,200 510 690 630 460 170
Overexertion and bodily reaction ............................................................... 17,220 8,270 8,960 10,890 8,420 2,480Overexertion in lifting or lowering ............................................................ 9,820 4,720 5,100 4,130 3,090 1,030
Repetitive motion involving microtasks ...................................................... 340 170 160 300 250 60All other events or exposures .................................................................... 80 70 20 80 70 –
Part of body affected by the injury or illness:Head .......................................................................................................... 1,960 1,330 640 1,560 1,120 440
Eye(s) .................................................................................................... 440 320 110 360 300 60Neck .......................................................................................................... 490 230 260 490 420 70Trunk ......................................................................................................... 11,580 6,020 5,570 5,440 4,100 1,350
Back ....................................................................................................... 9,200 4,420 4,780 4,380 3,320 1,060Upper extremities ...................................................................................... 11,850 4,850 7,000 6,460 4,810 1,650
Shoulder ................................................................................................ 3,030 1,370 1,660 2,360 1,870 490Arm ........................................................................................................ 1,920 800 1,120 1,280 840 450Wrist ...................................................................................................... 1,450 470 980 570 460 110Hand ...................................................................................................... 5,220 2,100 3,120 2,030 1,460 570
Lower extremities ...................................................................................... 7,880 4,450 3,440 5,040 4,280 770Knee ...................................................................................................... 2,470 1,250 1,220 2,330 1,890 440Ankle ...................................................................................................... 1,470 920 560 920 780 140Foot ....................................................................................................... 2,640 1,400 1,240 1,090 990 100
Body systems ............................................................................................ 230 230 – 330 310 –Multiple ...................................................................................................... 850 560 290 1,050 850 200All other parts of body ................................................................................ 30 30 – 80 70 –
See footnotes at end of table.

12 BLS Reports │ April 2014 • www.bls.gov
J O B - T R A N S F E R O R W O R K - R E S T R I C T I O N C A S E S , 2 0 1 2
Table 1. Number of nonfatal occupational injuries and illnesses involving days away from work, restricted work activity, or jobtransfer (DART), days away from work (DAFW)1, and restricted work activity, or job transfer (DJTR)2 by selected industry3 and casecharacteristics, private industry, 2012 — Continued
Case characteristic
Warehousingand
storage
Nursing andresidential care
facilities
Total4
Caseswith days
awayfromwork
Caseswith jobtransfer
orrestriction
Total4
Caseswith days
awayfromwork
Caseswith jobtransfer
orrestriction
Total ............................................................................................... 23,900 11,170 12,720 113,020 57,370 55,650
Musculoskeletal disorders5 ........................................................................ 11,820 4,770 7,050 52,790 23,660 29,130
Nature of injury or illness:Fractures ................................................................................................... 980 730 250 3,300 2,540 750Sprains, strains, tears ................................................................................ 12,000 4,890 7,120 60,010 26,590 33,410Amputations ............................................................................................... 50 40 – 40 30 –Cuts, lacerations, punctures ...................................................................... 1,510 720 790 3,870 2,110 1,760
Cuts, lacerations .................................................................................... 1,260 590 670 3,020 1,560 1,470Punctures (except gunshot wounds) ..................................................... 250 140 110 850 550 300
Bruises, contusions ................................................................................... 2,710 1,320 1,390 10,500 5,310 5,190Chemical burns and corrosions ................................................................. – – – 140 110 30Heat (thermal) burns .................................................................................. – – – 1,190 730 460Multiple traumatic injuries .......................................................................... 540 360 180 3,100 1,680 1,430
With sprains and other injuries .............................................................. 260 140 110 2,100 1,000 1,100With fractures and other injuries ............................................................ 60 40 20 300 200 100
Soreness, pain ........................................................................................... 3,130 1,390 1,740 20,240 11,230 9,000Carpal tunnel syndrome ............................................................................ 90 60 30 120 80 50Tendonitis .................................................................................................. 230 100 130 290 100 190All other natures ........................................................................................ 2,630 1,540 1,080 10,230 6,860 3,370
Event or exposure leading to injury or illness:Violence and other injuries by persons or animal ...................................... 70 50 20 17,220 8,990 8,220Intentional injury by other person ............................................................ – – – 8,100 4,350 3,750Injury by person unintentional or intent unknown .................................... – – – 8,320 3,980 4,340Animal and insect related incidents ......................................................... 50 40 20 580 510 70
Transportation incidents ............................................................................ 1,340 810 540 1,090 810 290Roadway incidents involving motorized land vehicles ............................. 350 270 80 950 720 230
Fires and explosions .................................................................................. – – – 20 20 –Falls, slips, trips ......................................................................................... 3,510 1,840 1,670 23,520 13,340 10,180Slips, trips without fall .............................................................................. 750 370 380 3,810 1,890 1,910Fall on same level .................................................................................... 2,020 1,090 930 18,280 10,400 7,880Fall to lower level ..................................................................................... 600 330 270 1,190 850 340
Exposure to harmful substances or enviroments ...................................... 360 270 80 2,700 2,000 700Contact with object, equipment ................................................................. 6,290 3,140 3,140 13,030 6,960 6,070Struck by object or equipment ................................................................. 3,360 1,670 1,690 7,370 3,840 3,530Struck against object or equipment ......................................................... 1,490 760 730 3,750 2,180 1,570Caught in or compressed by object or equipment ................................... 1,190 620 570 1,260 580 670
Overexertion and bodily reaction ............................................................... 12,060 4,900 7,150 54,380 24,730 29,640Overexertion in lifting or lowering ............................................................ 5,450 2,340 3,110 12,820 5,980 6,840
Repetitive motion involving microtasks ...................................................... 800 280 520 860 400 460All other events or exposures .................................................................... 260 150 110 1,060 520 530
Part of body affected by the injury or illness:Head .......................................................................................................... 1,130 800 320 4,260 3,270 990
Eye(s) .................................................................................................... 440 320 120 920 700 220Neck .......................................................................................................... 330 110 220 2,080 1,070 1,010Trunk ......................................................................................................... 7,420 3,170 4,250 39,660 19,300 20,360
Back ....................................................................................................... 5,790 2,190 3,590 33,730 16,180 17,560Upper extremities ...................................................................................... 8,030 3,390 4,640 33,270 14,500 18,760
Shoulder ................................................................................................ 2,550 1,190 1,360 9,930 4,590 5,350Arm ........................................................................................................ 1,440 650 780 4,650 2,190 2,460Wrist ...................................................................................................... 1,290 520 770 6,550 2,490 4,060Hand ...................................................................................................... 2,380 910 1,470 8,830 3,900 4,920
Lower extremities ...................................................................................... 4,960 2,490 2,480 19,270 10,850 8,410Knee ...................................................................................................... 1,450 830 620 8,720 4,780 3,940Ankle ...................................................................................................... 1,360 610 750 4,070 2,440 1,630Foot ....................................................................................................... 1,340 650 690 3,290 1,800 1,490
Body systems ............................................................................................ 190 150 40 780 740 40Multiple ...................................................................................................... 1,740 990 750 12,840 7,140 5,700All other parts of body ................................................................................ 100 80 20 880 490 380
See footnotes at end of table.

BLS Reports │ April 2014 • www.bls.gov 13
J O B - T R A N S F E R O R W O R K - R E S T R I C T I O N C A S E S , 2 0 1 2
Table 1. Number of nonfatal occupational injuries and illnesses involving days away from work, restricted work activity, or jobtransfer (DART), days away from work (DAFW)1, and restricted work activity, or job transfer (DJTR)2 by selected industry3 and casecharacteristics, private industry, 2012 — Continued
Case characteristic
Specialtytrade
contractors
Foodmanufacturing
Total4
Caseswith days
awayfromwork
Caseswith jobtransfer
orrestriction
Total4
Caseswith days
awayfromwork
Caseswith jobtransfer
orrestriction
Source of injury or illness:Chemicals and chemical products ............................................................. 660 540 120 780 450 330Containers ................................................................................................. 3,360 2,400 960 8,510 3,010 5,510Furniture and fixtures ................................................................................. 1,600 1,010 590 1,200 590 610Machinery .................................................................................................. 4,430 3,260 1,170 5,880 2,610 3,270Parts and materials .................................................................................... 14,500 9,590 4,910 3,180 1,340 1,840Person, injured or ill worker ....................................................................... 10,240 7,330 2,910 11,250 3,080 8,170Worker motion or position ........................................................................ 9,970 7,080 2,880 11,120 3,020 8,100
Person, other than injured or ill worker ...................................................... 40 20 20 140 70 60Floors, walkways, ground surfaces ........................................................... 5,840 4,410 1,430 6,390 2,910 3,470Handtools .................................................................................................. 7,400 4,380 3,020 3,600 960 2,640Ladder ....................................................................................................... 4,820 3,950 870 670 330 340Vehicles ..................................................................................................... 3,880 2,890 990 2,940 1,320 1,630Trucks ...................................................................................................... 1,200 980 230 520 230 290Cart, dolly, hand truck nonpowered ......................................................... 350 230 130 650 280 360
All other sources ........................................................................................ 9,950 7,240 2,710 5,360 1,950 3,410
See footnotes at end of table.

14 BLS Reports │ April 2014 • www.bls.gov
J O B - T R A N S F E R O R W O R K - R E S T R I C T I O N C A S E S , 2 0 1 2
Table 1. Number of nonfatal occupational injuries and illnesses involving days away from work, restricted work activity, or jobtransfer (DART), days away from work (DAFW)1, and restricted work activity, or job transfer (DJTR)2 by selected industry3 and casecharacteristics, private industry, 2012 — Continued
Case characteristic
Building material andgarden equipment supplies
dealers
Airtransportation
Total4
Caseswith days
awayfromwork
Caseswith jobtransfer
orrestriction
Total4
Caseswith days
awayfromwork
Caseswith jobtransfer
orrestriction
Source of injury or illness:Chemicals and chemical products ............................................................. 150 120 30 140 140 –Containers ................................................................................................. 7,400 3,480 3,910 6,990 5,110 1,870Furniture and fixtures ................................................................................. 2,310 1,080 1,220 340 300 50Machinery .................................................................................................. 2,850 1,310 1,540 560 400 160Parts and materials .................................................................................... 7,100 3,590 3,510 1,220 980 240Person, injured or ill worker ....................................................................... 3,310 1,800 1,520 2,970 2,380 580Worker motion or position ........................................................................ 3,150 1,660 1,490 2,860 2,280 580
Person, other than injured or ill worker ...................................................... 120 70 50 240 170 60Floors, walkways, ground surfaces ........................................................... 2,350 1,320 1,030 1,970 1,450 520Handtools .................................................................................................. 1,810 740 1,060 100 60 40Ladder ....................................................................................................... 760 420 350 90 60 20Vehicles ..................................................................................................... 3,130 1,840 1,290 4,070 3,450 620Trucks ...................................................................................................... 630 460 170 180 130 50Cart, dolly, hand truck nonpowered ......................................................... 750 350 400 1,300 1,120 180
All other sources ........................................................................................ 3,600 1,940 1,670 1,760 1,440 320
See footnotes at end of table.

BLS Reports │ April 2014 • www.bls.gov 15
J O B - T R A N S F E R O R W O R K - R E S T R I C T I O N C A S E S , 2 0 1 2
Table 1. Number of nonfatal occupational injuries and illnesses involving days away from work, restricted work activity, or jobtransfer (DART), days away from work (DAFW)1, and restricted work activity, or job transfer (DJTR)2 by selected industry3 and casecharacteristics, private industry, 2012 — Continued
Case characteristic
Warehousingand
storage
Nursing andresidential care
facilities
Total4
Caseswith days
awayfromwork
Caseswith jobtransfer
orrestriction
Total4
Caseswith days
awayfromwork
Caseswith jobtransfer
orrestriction
Source of injury or illness:Chemicals and chemical products ............................................................. 140 120 20 550 420 130Containers ................................................................................................. 8,500 3,490 5,010 4,530 1,950 2,580Furniture and fixtures ................................................................................. 950 400 550 5,030 2,420 2,610Machinery .................................................................................................. 830 460 370 1,700 860 840Parts and materials .................................................................................... 1,850 950 900 1,180 630 550Person, injured or ill worker ....................................................................... 3,740 1,510 2,230 10,760 5,490 5,270Worker motion or position ........................................................................ 3,680 1,480 2,210 10,440 5,230 5,200
Person, other than injured or ill worker ...................................................... 30 20 – 54,720 25,590 29,130Floors, walkways, ground surfaces ........................................................... 2,160 1,170 990 17,920 10,470 7,460Handtools .................................................................................................. 610 280 330 1,540 690 860Ladder ....................................................................................................... 130 80 50 320 190 130Vehicles ..................................................................................................... 3,330 1,870 1,460 2,630 1,660 970Trucks ...................................................................................................... 470 360 110 40 30 –Cart, dolly, hand truck nonpowered ......................................................... 380 150 230 1,180 620 560
All other sources ........................................................................................ 1,630 840 790 12,150 7,010 5,140
1 Days-away-from-work cases include those that resulted in days away from work, some of which also included job transfer or restriction.2 Includes only cases involving days of job transfer or restriction.3 Days of job transfer or restriction pilot study. In January of 2012, the BLS Survey of Occupational Injuries and Illnesses (SOII) began to collect information on
case circumstances and worker characteristics for days-of-job-transfer-or-restriction (DJTR) cases. This supplemental information was part of a pilot study on daysof job transfer or restriction. The pilot included six three-digit industries including: Specialty trade contractors; Food manufacturing; Building material and gardenequipment supplies dealers; Air transportation; Warehousing and storage; and Nursing and residential care facilities.
4 Days away from work, restricted work activity, or job transfer (DART) totals are the sum of cases involving days away from work (DAFW), and cases withrestricted work activity, or job transfer (DJTR).
5 Musculoskeletal disorders (MSDs) include cases where the nature of the injury or illness is pinched nerve; herniated disc; meniscus tear; sprains, strains,tears; hernia (traumatic and nontraumatic); pain, swelling, and numbness; carpal or tarsal tunnel syndrome; Raynaud’s syndrome or phenomenon; musculoskeletalsystem and connective tissue diseases and disorders, when the event or exposure leading to the injury or illness is overexertion and bodily reaction, unspecified;overexertion involving outside sources; repetitive motion involving microtasks; other and multiple exertions or bodily reactions; and rubbed, abraded, or jarred byvibration.
Note: Dash indicates data do not meet publication guidelines. Because of rounding and data exclusion of nonclassifiable responses, data may not sum to thetotals.
Source: Bureau of Labor Statistics, U.S. Department of Labor, Survey of Occupational Injuries and Illnesses in cooperation with participating State agencies.

16 BLS Reports │ April 2014 • www.bls.gov
J O B - T R A N S F E R O R W O R K - R E S T R I C T I O N C A S E S , 2 0 1 2
Table 2. Number of nonfatal occupational injuries and illnesses involving days away from work, restricted work activity, or jobtransfer (DART), days away from work (DAFW)1, and restricted work activity, or job transfer (DJTR)2 by selected industry3 andworker characteristics, private industry, 2012
Worker characteristic
Specialtytrade
contractors
Foodmanufacturing
Total4
Caseswith days
awayfromwork
Caseswith jobtransfer
orrestriction
Total4
Caseswith days
awayfromwork
Caseswith jobtransfer
orrestriction
Total ............................................................................................... 66,730 47,020 19,710 49,910 18,620 31,290
Gender:Male ........................................................................................................... 65,570 46,240 19,330 33,280 13,150 20,130Female ....................................................................................................... 1,070 720 350 16,550 5,440 11,100Not reported ............................................................................................... 90 – 30 80 30 50
Age:5
16 - 19 ....................................................................................................... 740 420 310 870 220 65020 - 24 ....................................................................................................... 6,520 4,270 2,250 5,340 1,700 3,64025 - 34 ....................................................................................................... 18,290 13,250 5,040 11,740 3,740 8,00035 - 44 ....................................................................................................... 17,000 11,720 5,280 11,480 4,060 7,42045 - 54 ....................................................................................................... 16,770 12,160 4,600 12,440 5,120 7,32055 - 64 ....................................................................................................... 5,990 4,140 1,850 6,450 3,080 3,36065 and over ................................................................................................ 400 340 60 920 430 490Not reported ............................................................................................... 1,020 700 320 670 260 410
Race or ethnic origin:6
White only .................................................................................................. 35,450 26,300 9,150 15,030 6,270 8,760Hispanic or Latino only .............................................................................. 12,430 7,760 4,670 14,540 5,070 9,470Black only .................................................................................................. 2,310 1,840 470 5,190 1,680 3,500Asian only .................................................................................................. 330 300 40 1,540 500 1,050American Indian or Alaskan Native only .................................................... 620 550 70 150 80 70Native Hawaiian or Pacific Islander only ................................................... 140 120 20 310 50 250Multi-race ................................................................................................... 20 – – 40 – 40Hispanic or Latino and other race .............................................................. 30 – – 60 20 40
See footnotes at end of table.

BLS Reports │ April 2014 • www.bls.gov 17
J O B - T R A N S F E R O R W O R K - R E S T R I C T I O N C A S E S , 2 0 1 2
Table 2. Number of nonfatal occupational injuries and illnesses involving days away from work, restricted work activity, or jobtransfer (DART), days away from work (DAFW)1, and restricted work activity, or job transfer (DJTR)2 by selected industry3 andworker characteristics, private industry, 2012 — Continued
Worker characteristic
Building material andgarden equipment supplies
dealers
Airtransportation
Total4
Caseswith days
awayfromwork
Caseswith jobtransfer
orrestriction
Total4
Caseswith days
awayfromwork
Caseswith jobtransfer
orrestriction
Total ............................................................................................... 34,890 17,700 17,190 20,450 15,950 4,500
Gender:Male ........................................................................................................... 25,940 13,710 12,220 13,190 9,950 3,230Female ....................................................................................................... 8,950 3,980 4,970 7,250 5,990 1,260Not reported ............................................................................................... – – – – – –
Age:5
16 - 19 ....................................................................................................... 1,270 790 480 – – –20 - 24 ....................................................................................................... 5,090 2,280 2,810 1,180 840 34025 - 34 ....................................................................................................... 7,810 3,850 3,960 3,950 3,070 88035 - 44 ....................................................................................................... 6,810 3,600 3,210 4,710 3,520 1,19045 - 54 ....................................................................................................... 7,650 3,830 3,820 5,780 4,510 1,27055 - 64 ....................................................................................................... 5,040 2,710 2,330 3,700 3,020 68065 and over ................................................................................................ 1,190 620 570 530 460 70Not reported ............................................................................................... 40 20 20 580 520 50
Race or ethnic origin:6
White only .................................................................................................. 6,830 4,670 2,160 860 620 230Hispanic or Latino only .............................................................................. 1,250 660 590 100 70 30Black only .................................................................................................. 620 430 200 120 90 30Asian only .................................................................................................. 90 70 20 150 130 20American Indian or Alaskan Native only .................................................... 20 – 20 – – –Native Hawaiian or Pacific Islander only ................................................... 20 – – 100 100 –Multi-race ................................................................................................... – – – – – –Hispanic or Latino and other race .............................................................. – – – – – –
See footnotes at end of table.

18 BLS Reports │ April 2014 • www.bls.gov
J O B - T R A N S F E R O R W O R K - R E S T R I C T I O N C A S E S , 2 0 1 2
Table 2. Number of nonfatal occupational injuries and illnesses involving days away from work, restricted work activity, or jobtransfer (DART), days away from work (DAFW)1, and restricted work activity, or job transfer (DJTR)2 by selected industry3 andworker characteristics, private industry, 2012 — Continued
Worker characteristic
Warehousingand
storage
Nursing andresidential care
facilities
Total4
Caseswith days
awayfromwork
Caseswith jobtransfer
orrestriction
Total4
Caseswith days
awayfromwork
Caseswith jobtransfer
orrestriction
Total ............................................................................................... 23,900 11,170 12,720 113,020 57,370 55,650
Gender:Male ........................................................................................................... 17,500 8,290 9,210 15,070 8,040 7,030Female ....................................................................................................... 6,390 2,880 3,510 97,850 49,270 48,570Not reported ............................................................................................... – – – 110 50 50
Age:5
16 - 19 ....................................................................................................... 440 140 300 3,340 1,590 1,75020 - 24 ....................................................................................................... 3,230 1,340 1,890 15,600 6,790 8,81025 - 34 ....................................................................................................... 6,460 2,840 3,610 27,860 13,600 14,26035 - 44 ....................................................................................................... 5,310 2,290 3,020 23,630 12,270 11,36045 - 54 ....................................................................................................... 5,070 2,640 2,430 23,870 12,530 11,34055 - 64 ....................................................................................................... 2,630 1,490 1,140 14,200 7,940 6,26065 and over ................................................................................................ 360 250 100 2,720 1,820 900Not reported ............................................................................................... 400 170 230 1,790 820 970
Race or ethnic origin:6
White only .................................................................................................. 7,450 3,710 3,750 48,590 24,720 23,870Hispanic or Latino only .............................................................................. 3,090 1,520 1,570 9,060 4,570 4,490Black only .................................................................................................. 1,990 840 1,150 21,030 10,910 10,120Asian only .................................................................................................. 260 190 70 2,000 1,040 960American Indian or Alaskan Native only .................................................... 30 – 20 430 220 210Native Hawaiian or Pacific Islander only ................................................... 30 – 30 530 250 280Multi-race ................................................................................................... – – – 100 60 40Hispanic or Latino and other race .............................................................. – – – 30 – 20
See footnotes at end of table.

BLS Reports │ April 2014 • www.bls.gov 19
J O B - T R A N S F E R O R W O R K - R E S T R I C T I O N C A S E S , 2 0 1 2
Table 2. Number of nonfatal occupational injuries and illnesses involving days away from work, restricted work activity, or jobtransfer (DART), days away from work (DAFW)1, and restricted work activity, or job transfer (DJTR)2 by selected industry3 andworker characteristics, private industry, 2012 — Continued
Worker characteristic
Specialtytrade
contractors
Foodmanufacturing
Total4
Caseswith days
awayfromwork
Caseswith jobtransfer
orrestriction
Total4
Caseswith days
awayfromwork
Caseswith jobtransfer
orrestriction
Race or ethnic origin:6
Not reported ............................................................................................... 15,400 10,120 5,270 13,050 4,940 8,110
Length of service with employer:Less than 3 months ................................................................................... 10,160 7,200 2,960 6,150 2,060 4,0803 - 11 months ............................................................................................. 14,580 10,630 3,960 9,730 3,460 6,2801 - 5 years .................................................................................................. 20,910 14,470 6,440 16,110 5,870 10,240More than 5 years ...................................................................................... 20,560 14,380 6,190 17,280 6,980 10,300Not reported ............................................................................................... 520 350 170 640 250 390
Summary occupational groups:7
Management, business, and financial occupations ................................... 1,090 790 290 370 170 200Computer, engineering, and science occupations ..................................... 220 80 140 180 90 90Education, legal, community service, arts, and media occupations .......... – – – – – –Healthcare practitioners and technical occupations .................................. – – – – – –Service occupations .................................................................................. 370 240 130 2,610 1,290 1,320Sales and related occupations .................................................................. 250 180 70 210 90 120Office and administrative support occupations .......................................... 330 200 130 930 410 520Farming, fishing, and forestry occupations ................................................ – – – 400 160 240Construction and extraction occupations ................................................... 48,120 33,420 14,710 200 60 140Installation, maintenance, and repair occupations .................................... 11,840 8,810 3,030 3,950 1,630 2,320Production occupations ............................................................................. 1,940 1,410 530 28,380 9,820 18,560Transportation and material moving occupations ...................................... 2,460 1,800 660 12,600 4,860 7,740
See footnotes at end of table.

20 BLS Reports │ April 2014 • www.bls.gov
J O B - T R A N S F E R O R W O R K - R E S T R I C T I O N C A S E S , 2 0 1 2
Table 2. Number of nonfatal occupational injuries and illnesses involving days away from work, restricted work activity, or jobtransfer (DART), days away from work (DAFW)1, and restricted work activity, or job transfer (DJTR)2 by selected industry3 andworker characteristics, private industry, 2012 — Continued
Worker characteristic
Building material andgarden equipment supplies
dealers
Airtransportation
Total4
Caseswith days
awayfromwork
Caseswith jobtransfer
orrestriction
Total4
Caseswith days
awayfromwork
Caseswith jobtransfer
orrestriction
Race or ethnic origin:6
Not reported ............................................................................................... 26,050 11,850 14,200 19,110 14,930 4,180
Length of service with employer:Less than 3 months ................................................................................... 3,520 2,110 1,420 350 230 1203 - 11 months ............................................................................................. 6,470 3,220 3,250 1,440 1,150 3001 - 5 years .................................................................................................. 11,790 5,980 5,810 3,820 2,760 1,070More than 5 years ...................................................................................... 13,030 6,360 6,670 14,600 11,650 2,940Not reported ............................................................................................... 80 30 50 240 160 70
Summary occupational groups:7
Management, business, and financial occupations ................................... 290 170 120 180 100 90Computer, engineering, and science occupations ..................................... 60 60 – – – –Education, legal, community service, arts, and media occupations .......... 110 40 70 – – –Healthcare practitioners and technical occupations .................................. – – – – – –Service occupations .................................................................................. 780 550 230 140 110 40Sales and related occupations .................................................................. 19,140 8,120 11,020 30 – –Office and administrative support occupations .......................................... 3,690 2,050 1,640 10,600 7,380 3,230Farming, fishing, and forestry occupations ................................................ 200 130 60 – – –Construction and extraction occupations ................................................... 420 280 140 – – –Installation, maintenance, and repair occupations .................................... 740 470 260 1,710 1,260 460Production occupations ............................................................................. 730 420 320 30 30 –Transportation and material moving occupations ...................................... 8,720 5,390 3,330 7,700 7,030 670
See footnotes at end of table.

BLS Reports │ April 2014 • www.bls.gov 21
J O B - T R A N S F E R O R W O R K - R E S T R I C T I O N C A S E S , 2 0 1 2
Table 2. Number of nonfatal occupational injuries and illnesses involving days away from work, restricted work activity, or jobtransfer (DART), days away from work (DAFW)1, and restricted work activity, or job transfer (DJTR)2 by selected industry3 andworker characteristics, private industry, 2012 — Continued
Worker characteristic
Warehousingand
storage
Nursing andresidential care
facilities
Total4
Caseswith days
awayfromwork
Caseswith jobtransfer
orrestriction
Total4
Caseswith days
awayfromwork
Caseswith jobtransfer
orrestriction
Race or ethnic origin:6
Not reported ............................................................................................... 11,030 4,890 6,140 31,250 15,590 15,660
Length of service with employer:Less than 3 months ................................................................................... 3,050 1,410 1,640 11,350 5,960 5,4003 - 11 months ............................................................................................. 4,460 2,140 2,320 28,260 13,940 14,3201 - 5 years .................................................................................................. 6,960 3,130 3,830 44,090 22,100 21,990More than 5 years ...................................................................................... 8,940 4,290 4,640 27,980 14,760 13,220Not reported ............................................................................................... 490 190 290 1,350 610 740
Summary occupational groups:7
Management, business, and financial occupations ................................... 140 60 90 3,450 1,810 1,640Computer, engineering, and science occupations ..................................... – – – 20 20 –Education, legal, community service, arts, and media occupations .......... – – – 5,240 3,100 2,140Healthcare practitioners and technical occupations .................................. – – – 13,750 7,220 6,520Service occupations .................................................................................. 260 130 130 85,980 42,870 43,110Sales and related occupations .................................................................. 250 90 160 20 – –Office and administrative support occupations .......................................... 5,490 2,560 2,930 1,020 490 530Farming, fishing, and forestry occupations ................................................ 20 – – – – –Construction and extraction occupations ................................................... 50 50 – 60 30 30Installation, maintenance, and repair occupations .................................... 650 330 320 1,780 940 840Production occupations ............................................................................. 860 430 430 1,100 520 590Transportation and material moving occupations ...................................... 16,110 7,490 8,620 470 280 190
1 Days-away-from-work cases include those that resulted in days away from work, some of which also included job transfer or restriction.2 Includes only cases involving days of job transfer or restriction.3 Days of job transfer or restriction pilot study. In January of 2012, the BLS Survey of Occupational Injuries and Illnesses (SOII) began to collect information on
case circumstances and worker characteristics for days-of-job-transfer-or-restriction (DJTR) cases. This supplemental information was part of a pilot study on daysof job transfer or restriction. The pilot included six three-digit industries including: Specialty trade contractors; Food manufacturing; Building material and gardenequipment supplies dealers; Air transportation; Warehousing and storage; and Nursing and residential care facilities.
4 Days away from work, restricted work activity, or job transfer (DART) totals are the sum of cases involving days away from work (DAFW), and cases withrestricted work activity, or job transfer (DJTR).
5 Information is not shown separately for injured workers under age 14; they accounted for fewer than 50 cases.6 Race and ethnicity data do not add to total. Some cases may be counted as both Multi-race and Hispanic and other race.7 Standard Occupational Classification Manual, 2010, Office of Management and Budget.
Note: Dash indicates data do not meet publication guidelines. Because of rounding and data exclusion of nonclassifiable responses, data may not sum to thetotals.
Source: Bureau of Labor Statistics, U.S. Department of Labor, Survey of Occupational Injuries and Illnesses in cooperation with participating State agencies.

22 BLS Reports │ April 2014 • www.bls.gov
J O B - T R A N S F E R O R W O R K - R E S T R I C T I O N C A S E S , 2 0 1 2
Table 3. Number, incidence rates1, and median days2 of nonfatal occupational injuries and illnesses involving days of job transfer orrestriction (DJTR)3 by selected industry4 and case characteristics of injury or illness, private industry, 2012
Case characteristic
Specialtytrade
contractors
Foodmanufacturing
Number Incidencerate
Mediandays of
jobtransfer
orrestriction
Number Incidencerate
Mediandays of
jobtransfer
orrestriction
Total ............................................................................................... 19,710 64.1 10 31,290 216.1 15
Musculoskeletal disorders5 ........................................................................ 6,070 19.7 13 15,050 103.9 19
Nature of injury or illness:Fractures ................................................................................................... 1,260 4.1 29 1,380 9.5 39Sprains, strains, tears ................................................................................ 7,760 25.3 14 10,770 74.4 16Amputations ............................................................................................... 40 .1 15 120 .8 35Cuts, lacerations, punctures ...................................................................... 4,650 15.1 5 3,820 26.4 10
Cuts, lacerations .................................................................................... 4,120 13.4 6 3,530 24.4 10Punctures (except gunshot wounds) ..................................................... 530 1.7 2 290 2.0 7
Bruises, contusions ................................................................................... 1,480 4.8 7 3,400 23.5 11Chemical burns and corrosions ................................................................. 50 .2 22 150 1.1 8Heat (thermal) burns .................................................................................. 140 .4 10 330 2.3 10Multiple traumatic injuries .......................................................................... 410 1.3 10 730 5.0 14
With sprains and other injuries .............................................................. 160 .5 8 370 2.6 21With fractures and other injuries ............................................................ 130 .4 25 80 .6 40
Soreness, pain ........................................................................................... 1,780 5.8 15 5,840 40.3 17Carpal tunnel syndrome ............................................................................ 20 .1 54 440 3.0 45Tendonitis .................................................................................................. 20 .1 36 810 5.6 31All other natures ........................................................................................ 2,100 6.8 12 3,500 24.2 17
Event or exposure leading to injury or illness:Violence and other injuries by persons or animal ...................................... 210 .7 1 200 1.3 17Intentional injury by other person ............................................................ – – – 30 .2 12Injury by person unintentional or intent unknown .................................... – – – 40 .3 13Animal and insect related incidents ......................................................... 200 .6 1 130 .9 17
Transportation incidents ............................................................................ 490 1.6 8 370 2.6 15Roadway incidents involving motorized land vehicles ............................. 390 1.3 10 50 .4 6
Falls, slips, trips ......................................................................................... 3,680 12.0 15 5,000 34.5 17Slips, trips without fall .............................................................................. 1,100 3.6 15 870 6.0 17Fall on same level .................................................................................... 1,110 3.6 14 3,190 22.0 18Fall to lower level ..................................................................................... 1,320 4.3 16 820 5.6 14
Exposure to harmful substances or enviroments ...................................... 350 1.1 6 800 5.5 8Contact with object, equipment ................................................................. 8,400 27.3 8 9,420 65.1 11Struck by object or equipment ................................................................. 5,610 18.2 7 4,650 32.1 11Struck against object or equipment ......................................................... 1,460 4.7 9 1,990 13.7 11Caught in or compressed by object or equipment ................................... 1,010 3.3 7 2,290 15.8 14
Overexertion and bodily reaction ............................................................... 6,320 20.6 14 15,330 105.9 19Overexertion in lifting or lowering ............................................................ 2,050 6.7 10 3,450 23.8 15
Repetitive motion involving microtasks ...................................................... 300 1.0 20 5,130 35.5 28All other events or exposures .................................................................... 250 .8 21 170 1.2 14
See footnotes at end of table.

BLS Reports │ April 2014 • www.bls.gov 23
J O B - T R A N S F E R O R W O R K - R E S T R I C T I O N C A S E S , 2 0 1 2
Table 3. Number, incidence rates1, and median days2 of nonfatal occupational injuries and illnesses involving days of job transfer orrestriction (DJTR)3 by selected industry4 and case characteristics of injury or illness, private industry, 2012 — Continued
Case characteristic
Building material andgarden equipment supplies
dealers
Airtransportation
Number Incidencerate
Mediandays of
jobtransfer
orrestriction
Number Incidencerate
Mediandays of
jobtransfer
orrestriction
Total ............................................................................................... 17,190 168.7 13 4,500 120.8 10
Musculoskeletal disorders5 ........................................................................ 8,800 86.3 17 2,470 66.3 13
Nature of injury or illness:Fractures ................................................................................................... 520 5.1 39 50 1.3 180Sprains, strains, tears ................................................................................ 9,900 97.1 17 2,640 70.9 13Amputations ............................................................................................... – – – – – –Cuts, lacerations, punctures ...................................................................... 2,460 24.1 8 320 8.6 7
Cuts, lacerations .................................................................................... 2,060 20.2 8 310 8.3 7Punctures (except gunshot wounds) ..................................................... 400 3.9 4 – – –
Bruises, contusions ................................................................................... 2,600 25.5 12 420 11.2 8Chemical burns and corrosions ................................................................. – – – – – –Heat (thermal) burns .................................................................................. 20 .2 7 – – –Multiple traumatic injuries .......................................................................... 160 1.6 11 90 2.5 6
With sprains and other injuries .............................................................. 90 .9 8 – – –With fractures and other injuries ............................................................ – – – – – –
Soreness, pain ........................................................................................... 470 4.6 6 600 16.1 13Carpal tunnel syndrome ............................................................................ – – – – – –Tendonitis .................................................................................................. – – – – – –All other natures ........................................................................................ 1,030 10.1 8 380 10.2 8
Event or exposure leading to injury or illness:Violence and other injuries by persons or animal ...................................... 140 1.4 5 30 .8 21Intentional injury by other person ............................................................ 20 .2 4 – – –Injury by person unintentional or intent unknown .................................... 50 .5 9 30 .7 21Animal and insect related incidents ......................................................... 70 .7 3 – – –
Transportation incidents ............................................................................ 120 1.1 20 40 1.0 24Roadway incidents involving motorized land vehicles ............................. 30 .3 17 – – –
Falls, slips, trips ......................................................................................... 1,750 17.1 21 780 20.9 8Slips, trips without fall .............................................................................. 190 1.8 22 240 6.5 67Fall on same level .................................................................................... 1,080 10.6 21 460 12.5 8Fall to lower level ..................................................................................... 450 4.4 20 60 1.5 180
Exposure to harmful substances or enviroments ...................................... 80 .7 7 50 1.5 120Contact with object, equipment ................................................................. 6,140 60.3 9 1,110 29.9 7Struck by object or equipment ................................................................. 4,130 40.5 9 440 11.9 11Struck against object or equipment ......................................................... 1,150 11.3 9 430 11.6 6Caught in or compressed by object or equipment ................................... 690 6.7 8 170 4.6 3
Overexertion and bodily reaction ............................................................... 8,960 87.9 17 2,480 66.5 13Overexertion in lifting or lowering ............................................................ 5,100 50.1 15 1,030 27.7 14
Repetitive motion involving microtasks ...................................................... 160 1.6 51 60 1.5 7All other events or exposures .................................................................... 20 .2 23 – – –
See footnotes at end of table.

24 BLS Reports │ April 2014 • www.bls.gov
J O B - T R A N S F E R O R W O R K - R E S T R I C T I O N C A S E S , 2 0 1 2
Table 3. Number, incidence rates1, and median days2 of nonfatal occupational injuries and illnesses involving days of job transfer orrestriction (DJTR)3 by selected industry4 and case characteristics of injury or illness, private industry, 2012 — Continued
Case characteristic
Warehousingand
storage
Nursing andresidential care
facilities
Number Incidencerate
Mediandays of
jobtransfer
orrestriction
Number Incidencerate
Mediandays of
jobtransfer
orrestriction
Total ............................................................................................... 12,720 208.4 13 55,650 229.6 12
Musculoskeletal disorders5 ........................................................................ 7,050 115.5 14 29,130 120.2 14
Nature of injury or illness:Fractures ................................................................................................... 250 4.1 43 750 3.1 30Sprains, strains, tears ................................................................................ 7,120 116.6 14 33,410 137.9 13Amputations ............................................................................................... – – – – – –Cuts, lacerations, punctures ...................................................................... 790 12.9 9 1,760 7.3 7
Cuts, lacerations .................................................................................... 670 11.0 10 1,470 6.1 7Punctures (except gunshot wounds) ..................................................... 110 1.9 4 300 1.2 5
Bruises, contusions ................................................................................... 1,390 22.8 11 5,190 21.4 8Chemical burns and corrosions ................................................................. – – – 30 .1 2Heat (thermal) burns .................................................................................. – – – 460 1.9 6Multiple traumatic injuries .......................................................................... 180 2.9 12 1,430 5.9 14
With sprains and other injuries .............................................................. 110 1.9 16 1,100 4.5 14With fractures and other injuries ............................................................ 20 .3 30 100 .4 25
Soreness, pain ........................................................................................... 1,740 28.5 13 9,000 37.2 12Carpal tunnel syndrome ............................................................................ 30 .4 45 50 .2 81Tendonitis .................................................................................................. 130 2.2 14 190 .8 35All other natures ........................................................................................ 1,080 17.8 8 3,370 13.9 12
Event or exposure leading to injury or illness:Violence and other injuries by persons or animal ...................................... 20 .4 7 8,220 33.9 11Intentional injury by other person ............................................................ – – – 3,750 15.5 9Injury by person unintentional or intent unknown .................................... – – – 4,340 17.9 14Animal and insect related incidents ......................................................... 20 .3 7 70 .3 4
Transportation incidents ............................................................................ 540 8.8 12 290 1.2 9Roadway incidents involving motorized land vehicles ............................. 80 1.4 2 230 1.0 11
Falls, slips, trips ......................................................................................... 1,670 27.3 16 10,180 42.0 12Slips, trips without fall .............................................................................. 380 6.2 29 1,910 7.9 13Fall on same level .................................................................................... 930 15.2 13 7,880 32.5 12Fall to lower level ..................................................................................... 270 4.4 16 340 1.4 13
Exposure to harmful substances or enviroments ...................................... 80 1.4 5 700 2.9 7Contact with object, equipment ................................................................. 3,140 51.5 10 6,070 25.1 9Struck by object or equipment ................................................................. 1,690 27.7 10 3,530 14.6 9Struck against object or equipment ......................................................... 730 12.0 10 1,570 6.5 9Caught in or compressed by object or equipment ................................... 570 9.4 10 670 2.8 10
Overexertion and bodily reaction ............................................................... 7,150 117.2 14 29,640 122.3 14Overexertion in lifting or lowering ............................................................ 3,110 51.0 14 6,840 28.2 14
Repetitive motion involving microtasks ...................................................... 520 8.5 16 460 1.9 16All other events or exposures .................................................................... 110 1.8 10 530 2.2 12
See footnotes at end of table.

BLS Reports │ April 2014 • www.bls.gov 25
J O B - T R A N S F E R O R W O R K - R E S T R I C T I O N C A S E S , 2 0 1 2
Table 3. Number, incidence rates1, and median days2 of nonfatal occupational injuries and illnesses involving days of job transfer orrestriction (DJTR)3 by selected industry4 and case characteristics of injury or illness, private industry, 2012 — Continued
Case characteristic
Specialtytrade
contractors
Foodmanufacturing
Number Incidencerate
Mediandays of
jobtransfer
orrestriction
Number Incidencerate
Mediandays of
jobtransfer
orrestriction
Part of body affected by the injury or illness:Head .......................................................................................................... 780 2.5 4 660 4.6 5
Eye(s) .................................................................................................... 290 .9 2 250 1.7 3Neck .......................................................................................................... 180 .6 8 230 1.6 14Trunk ......................................................................................................... 4,150 13.5 11 6,260 43.2 14
Back ....................................................................................................... 3,450 11.2 10 4,890 33.8 14Upper extremities ...................................................................................... 9,340 30.4 9 18,070 124.8 16
Shoulder ................................................................................................ 1,450 4.7 20 2,820 19.5 24Arm ........................................................................................................ 1,340 4.3 7 2,250 15.5 15Wrist ...................................................................................................... 750 2.4 12 2,780 19.2 21Hand ...................................................................................................... 5,430 17.7 7 8,410 58.1 13
Lower extremities ...................................................................................... 4,130 13.4 14 4,150 28.7 14Knee ...................................................................................................... 1,430 4.6 15 1,630 11.2 16Ankle ...................................................................................................... 890 2.9 8 800 5.5 10Foot ....................................................................................................... 1,080 3.5 14 970 6.7 12
Body systems ............................................................................................ 110 .3 3 70 .5 7Multiple ...................................................................................................... 940 3.1 15 1,700 11.7 17All other parts of body ................................................................................ 90 .3 11 150 1.0 13
See footnotes at end of table.

26 BLS Reports │ April 2014 • www.bls.gov
J O B - T R A N S F E R O R W O R K - R E S T R I C T I O N C A S E S , 2 0 1 2
Table 3. Number, incidence rates1, and median days2 of nonfatal occupational injuries and illnesses involving days of job transfer orrestriction (DJTR)3 by selected industry4 and case characteristics of injury or illness, private industry, 2012 — Continued
Case characteristic
Building material andgarden equipment supplies
dealers
Airtransportation
Number Incidencerate
Mediandays of
jobtransfer
orrestriction
Number Incidencerate
Mediandays of
jobtransfer
orrestriction
Part of body affected by the injury or illness:Head .......................................................................................................... 640 6.2 5 440 11.9 6
Eye(s) .................................................................................................... 110 1.1 2 60 1.6 2Neck .......................................................................................................... 260 2.5 18 70 1.8 13Trunk ......................................................................................................... 5,570 54.6 14 1,350 36.2 10
Back ....................................................................................................... 4,780 46.9 14 1,060 28.5 13Upper extremities ...................................................................................... 7,000 68.7 13 1,650 44.3 15
Shoulder ................................................................................................ 1,660 16.3 28 490 13.1 15Arm ........................................................................................................ 1,120 11.0 18 450 12.0 41Wrist ...................................................................................................... 980 9.6 16 110 2.9 90Hand ...................................................................................................... 3,120 30.6 9 570 15.3 9
Lower extremities ...................................................................................... 3,440 33.7 14 770 20.6 10Knee ...................................................................................................... 1,220 12.0 26 440 11.8 9Ankle ...................................................................................................... 560 5.4 12 140 3.7 13Foot ....................................................................................................... 1,240 12.2 11 100 2.8 11
Body systems ............................................................................................ – – – – – –Multiple ...................................................................................................... 290 2.8 21 200 5.4 17All other parts of body ................................................................................ – – – – – –
See footnotes at end of table.

BLS Reports │ April 2014 • www.bls.gov 27
J O B - T R A N S F E R O R W O R K - R E S T R I C T I O N C A S E S , 2 0 1 2
Table 3. Number, incidence rates1, and median days2 of nonfatal occupational injuries and illnesses involving days of job transfer orrestriction (DJTR)3 by selected industry4 and case characteristics of injury or illness, private industry, 2012 — Continued
Case characteristic
Warehousingand
storage
Nursing andresidential care
facilities
Number Incidencerate
Mediandays of
jobtransfer
orrestriction
Number Incidencerate
Mediandays of
jobtransfer
orrestriction
Part of body affected by the injury or illness:Head .......................................................................................................... 320 5.3 7 990 4.1 5
Eye(s) .................................................................................................... 120 2.0 2 220 .9 5Neck .......................................................................................................... 220 3.6 8 1,010 4.2 10Trunk ......................................................................................................... 4,250 69.7 13 20,360 84.0 12
Back ....................................................................................................... 3,590 58.9 13 17,560 72.4 13Upper extremities ...................................................................................... 4,640 76.0 14 18,760 77.4 12
Shoulder ................................................................................................ 1,360 22.2 16 5,350 22.1 15Arm ........................................................................................................ 780 12.8 14 2,460 10.1 13Wrist ...................................................................................................... 770 12.7 16 4,060 16.7 13Hand ...................................................................................................... 1,470 24.1 10 4,920 20.3 9
Lower extremities ...................................................................................... 2,480 40.5 14 8,410 34.7 12Knee ...................................................................................................... 620 10.2 14 3,940 16.3 13Ankle ...................................................................................................... 750 12.3 28 1,630 6.7 11Foot ....................................................................................................... 690 11.2 14 1,490 6.1 8
Body systems ............................................................................................ 40 .6 2 40 .2 5Multiple ...................................................................................................... 750 12.4 12 5,700 23.5 14All other parts of body ................................................................................ 20 .4 60 380 1.6 18
See footnotes at end of table.

28 BLS Reports │ April 2014 • www.bls.gov
J O B - T R A N S F E R O R W O R K - R E S T R I C T I O N C A S E S , 2 0 1 2
Table 3. Number, incidence rates1, and median days2 of nonfatal occupational injuries and illnesses involving days of job transfer orrestriction (DJTR)3 by selected industry4 and case characteristics of injury or illness, private industry, 2012 — Continued
Case characteristic
Specialtytrade
contractors
Foodmanufacturing
Number Incidencerate
Mediandays of
jobtransfer
orrestriction
Number Incidencerate
Mediandays of
jobtransfer
orrestriction
Source of injury or illness:Chemicals and chemical products ............................................................. 120 0.4 14 330 2.3 11Containers ................................................................................................. 960 3.1 8 5,510 38.0 14Furniture and fixtures ................................................................................. 590 1.9 7 610 4.2 13Machinery .................................................................................................. 1,170 3.8 7 3,270 22.6 14Parts and materials .................................................................................... 4,910 16.0 10 1,840 12.7 13Person, injured or ill worker ....................................................................... 2,910 9.5 15 8,170 56.4 21Worker motion or position ........................................................................ 2,880 9.4 14 8,100 55.9 21
Person, other than injured or ill worker ...................................................... 20 .1 5 60 .4 13Floors, walkways, ground surfaces ........................................................... 1,430 4.7 15 3,470 24.0 18Handtools .................................................................................................. 3,020 9.8 7 2,640 18.2 10Ladder ....................................................................................................... 870 2.8 12 340 2.3 12Vehicles ..................................................................................................... 990 3.2 14 1,630 11.3 14Trucks ...................................................................................................... 230 .7 21 290 2.0 33Cart, dolly, hand truck nonpowered ......................................................... 130 .4 7 360 2.5 10
All other sources ........................................................................................ 2,710 8.8 8 3,410 23.5 16
See footnotes at end of table.

BLS Reports │ April 2014 • www.bls.gov 29
J O B - T R A N S F E R O R W O R K - R E S T R I C T I O N C A S E S , 2 0 1 2
Table 3. Number, incidence rates1, and median days2 of nonfatal occupational injuries and illnesses involving days of job transfer orrestriction (DJTR)3 by selected industry4 and case characteristics of injury or illness, private industry, 2012 — Continued
Case characteristic
Building material andgarden equipment supplies
dealers
Airtransportation
Number Incidencerate
Mediandays of
jobtransfer
orrestriction
Number Incidencerate
Mediandays of
jobtransfer
orrestriction
Source of injury or illness:Chemicals and chemical products ............................................................. 30 0.3 42 – – –Containers ................................................................................................. 3,910 38.4 19 1,870 50.4 10Furniture and fixtures ................................................................................. 1,220 12.0 18 50 1.2 15Machinery .................................................................................................. 1,540 15.2 18 160 4.3 30Parts and materials .................................................................................... 3,510 34.4 9 240 6.4 24Person, injured or ill worker ....................................................................... 1,520 14.9 19 580 15.6 15Worker motion or position ........................................................................ 1,490 14.7 20 580 15.6 15
Person, other than injured or ill worker ...................................................... 50 .5 14 60 1.7 25Floors, walkways, ground surfaces ........................................................... 1,030 10.1 16 520 14.0 8Handtools .................................................................................................. 1,060 10.4 8 40 1.1 1Ladder ....................................................................................................... 350 3.4 21 20 .6 8Vehicles ..................................................................................................... 1,290 12.7 13 620 16.8 5Trucks ...................................................................................................... 170 1.7 18 50 1.3 9Cart, dolly, hand truck nonpowered ......................................................... 400 3.9 10 180 4.8 11
All other sources ........................................................................................ 1,670 16.4 10 320 8.5 20
See footnotes at end of table.

30 BLS Reports │ April 2014 • www.bls.gov
J O B - T R A N S F E R O R W O R K - R E S T R I C T I O N C A S E S , 2 0 1 2
Table 3. Number, incidence rates1, and median days2 of nonfatal occupational injuries and illnesses involving days of job transfer orrestriction (DJTR)3 by selected industry4 and case characteristics of injury or illness, private industry, 2012 — Continued
Case characteristic
Warehousingand
storage
Nursing andresidential care
facilities
Number Incidencerate
Mediandays of
jobtransfer
orrestriction
Number Incidencerate
Mediandays of
jobtransfer
orrestriction
Source of injury or illness:Chemicals and chemical products ............................................................. 20 0.4 1 130 0.5 10Containers ................................................................................................. 5,010 82.1 14 2,580 10.6 13Furniture and fixtures ................................................................................. 550 9.0 10 2,610 10.8 12Machinery .................................................................................................. 370 6.1 14 840 3.4 11Parts and materials .................................................................................... 900 14.7 12 550 2.3 11Person, injured or ill worker ....................................................................... 2,230 36.5 18 5,270 21.7 13Worker motion or position ........................................................................ 2,210 36.2 18 5,200 21.5 13
Person, other than injured or ill worker ...................................................... – – – 29,130 120.2 13Floors, walkways, ground surfaces ........................................................... 990 16.3 14 7,460 30.8 12Handtools .................................................................................................. 330 5.4 9 860 3.5 8Ladder ....................................................................................................... 50 .8 24 130 .5 14Vehicles ..................................................................................................... 1,460 24.0 9 970 4.0 12Trucks ...................................................................................................... 110 1.9 10 – – –Cart, dolly, hand truck nonpowered ......................................................... 230 3.8 7 560 2.3 14
All other sources ........................................................................................ 790 13.0 13 5,140 21.2 10
1 Incidence rates represent the number of injuries and illnesses per 10,000 full-time workers and were calculated as: (N/EH) x 20,000,000 where
N = number of injuries and illnesses EH = total hours worked by all employees
during the calendar year
20,000,000 = base for 10,000 equivalent full-time workers (working 40 hours per week, 50 weeks per year)
2 Median days of job transfer or restriction is the measure used to summarize the varying lengths of job transfer or restriction from work among the cases withdays of job transfer or restriction. Half the cases involved more days and half involved less days than a specified median. Median days of job transfer or restrictionare represented in actual values.
3 Includes only cases involving days of job transfer or restriction.4 Days of job transfer or restriction pilot study. In January of 2012, the BLS Survey of Occupational Injuries and Illnesses (SOII) began to collect information on
case circumstances and worker characteristics for days-of-job-transfer-or-restriction (DJTR) cases. This supplemental information was part of a pilot study on daysof job transfer or restriction. The pilot included six three-digit industries including: Specialty trade contractors; Food manufacturing; Building material and gardenequipment supplies dealers; Air transportation; Warehousing and storage; and Nursing and residential care facilities.
5 Musculoskeletal disorders (MSDs) include cases where the nature of the injury or illness is pinched nerve; herniated disc; meniscus tear; sprains, strains,tears; hernia (traumatic and nontraumatic); pain, swelling, and numbness; carpal or tarsal tunnel syndrome; Raynaud’s syndrome or phenomenon; musculoskeletalsystem and connective tissue diseases and disorders, when the event or exposure leading to the injury or illness is overexertion and bodily reaction, unspecified;overexertion involving outside sources; repetitive motion involving microtasks; other and multiple exertions or bodily reactions; and rubbed, abraded, or jarred byvibration.
Note: Dash indicates data do not meet publication guidelines. Because of rounding and data exclusion of nonclassifiable responses, data may not sum to thetotals.
Source: Bureau of Labor Statistics, U.S. Department of Labor, Survey of Occupational Injuries and Illnesses in cooperation with participating State agencies.
N = number of injuries and illnessesEH = total hours worked by all employees during the calendar year
20,000,000 = base for 10,000 equivalent full-time workers (working 40 hours per week, 50 weeks per year)

BLS Reports │ April 2014 • www.bls.gov 31
J O B - T R A N S F E R O R W O R K - R E S T R I C T I O N C A S E S , 2 0 1 2
Table 4. Number and median days1 of nonfatal occupational injuries and illnesses involving days of job transfer orrestriction (DJTR)2 by selected industry3 and worker characteristics, private industry, 2012
Worker characteristic
Specialtytrade
contractors
Foodmanufacturing
Building material andgarden equipmentsupplies dealers
Number
Mediandays of
jobtransfer
orrestriction
Number
Mediandays of
jobtransfer
orrestriction
Number
Mediandays of
jobtransfer
orrestriction
Total ............................................................................ 19,710 10 31,290 15 17,190 13
Gender:Male ........................................................................................ 19,330 10 20,130 14 12,220 11Female .................................................................................... 350 14 11,100 19 4,970 21Not reported ............................................................................ 30 22 50 1 – –
Age:4
16 - 19 .................................................................................... 310 10 650 9 480 1020 - 24 .................................................................................... 2,250 7 3,640 12 2,810 925 - 34 .................................................................................... 5,040 10 8,000 13 3,960 1335 - 44 .................................................................................... 5,280 12 7,420 16 3,210 1545 - 54 .................................................................................... 4,600 14 7,320 18 3,820 1455 - 64 .................................................................................... 1,850 9 3,360 20 2,330 2065 and over ............................................................................. 60 6 490 17 570 20Not reported ............................................................................ 320 12 410 20 20 10
Race or ethnic origin:5
White only ............................................................................... 9,150 10 8,760 14 2,160 7Hispanic or Latino only ........................................................... 4,670 11 9,470 14 590 8Black only ............................................................................... 470 7 3,500 15 200 10Asian only ............................................................................... 40 4 1,050 18 20 7American Indian or Alaskan Native only ................................. 70 36 70 18 20 18Native Hawaiian or Pacific Islander only ................................ 20 10 250 26 – –Multi-race ................................................................................ – – 40 8 – –Hispanic or Latino and other race ........................................... – – 40 14 – –Not reported ............................................................................ 5,270 10 8,110 16 14,200 16
See footnotes at end of table.

32 BLS Reports │ April 2014 • www.bls.gov
J O B - T R A N S F E R O R W O R K - R E S T R I C T I O N C A S E S , 2 0 1 2
Table 4. Number and median days1 of nonfatal occupational injuries and illnesses involving days of job transfer orrestriction (DJTR)2 by selected industry3 and worker characteristics, private industry, 2012 — Continued
Worker characteristic
Airtransportation
Warehousingand
storage
Nursing andresidential care
facilities
Number
Mediandays of
jobtransfer
orrestriction
Number
Mediandays of
jobtransfer
orrestriction
Number
Mediandays of
jobtransfer
orrestriction
Total ............................................................................ 4,500 10 12,720 13 55,650 12
Gender:Male ........................................................................................ 3,230 10 9,210 13 7,030 12Female .................................................................................... 1,260 9 3,510 12 48,570 12Not reported ............................................................................ – – – – 50 29
Age:4
16 - 19 .................................................................................... – – 300 11 1,750 1020 - 24 .................................................................................... 340 11 1,890 10 8,810 1125 - 34 .................................................................................... 880 9 3,610 12 14,260 1235 - 44 .................................................................................... 1,190 7 3,020 14 11,360 1245 - 54 .................................................................................... 1,270 9 2,430 12 11,340 1355 - 64 .................................................................................... 680 20 1,140 20 6,260 1465 and over ............................................................................. 70 20 100 16 900 15Not reported ............................................................................ 50 27 230 27 970 12
Race or ethnic origin:5
White only ............................................................................... 230 7 3,750 12 23,870 12Hispanic or Latino only ........................................................... 30 5 1,570 12 4,490 14Black only ............................................................................... 30 24 1,150 11 10,120 10Asian only ............................................................................... 20 92 70 13 960 10American Indian or Alaskan Native only ................................. – – 20 10 210 16Native Hawaiian or Pacific Islander only ................................ – – 30 24 280 17Multi-race ................................................................................ – – – – 40 13Hispanic or Latino and other race ........................................... – – – – 20 17Not reported ............................................................................ 4,180 10 6,140 14 15,660 13
See footnotes at end of table.

BLS Reports │ April 2014 • www.bls.gov 33
J O B - T R A N S F E R O R W O R K - R E S T R I C T I O N C A S E S , 2 0 1 2
Table 4. Number and median days1 of nonfatal occupational injuries and illnesses involving days of job transfer orrestriction (DJTR)2 by selected industry3 and worker characteristics, private industry, 2012 — Continued
Worker characteristic
Specialtytrade
contractors
Foodmanufacturing
Building material andgarden equipmentsupplies dealers
Number
Mediandays of
jobtransfer
orrestriction
Number
Mediandays of
jobtransfer
orrestriction
Number
Mediandays of
jobtransfer
orrestriction
Length of service with employer:Less than 3 months ................................................................ 2,960 10 4,080 10 1,420 123 - 11 months .......................................................................... 3,960 11 6,280 14 3,250 121 - 5 years ............................................................................... 6,440 9 10,240 16 5,810 13More than 5 years ................................................................... 6,190 10 10,300 17 6,670 14Not reported ............................................................................ 170 14 390 20 50 8
Summary occupational groups:6
Management, business, and financial occupations ................ 290 30 200 15 120 37Computer, engineering, and science occupations .................. 140 4 90 15 – –Education, legal, community service, arts, and mediaoccupations .......................................................................... – – – – 70 16
Healthcare practitioners and technical occupations ............... – – – – – –Service occupations ............................................................... 130 4 1,320 14 230 7Sales and related occupations ............................................... 70 12 120 8 11,020 15Office and administrative support occupations ....................... 130 11 520 16 1,640 14Farming, fishing, and forestry occupations ............................. – – 240 15 60 38Construction and extraction occupations ................................ 14,710 10 140 12 140 10Installation, maintenance, and repair occupations ................. 3,030 7 2,320 16 260 4Production occupations .......................................................... 530 7 18,560 16 320 4Transportation and material moving occupations ................... 660 15 7,740 14 3,330 10
See footnotes at end of table.

34 BLS Reports │ April 2014 • www.bls.gov
J O B - T R A N S F E R O R W O R K - R E S T R I C T I O N C A S E S , 2 0 1 2
Table 4. Number and median days1 of nonfatal occupational injuries and illnesses involving days of job transfer orrestriction (DJTR)2 by selected industry3 and worker characteristics, private industry, 2012 — Continued
Worker characteristic
Airtransportation
Warehousingand
storage
Nursing andresidential care
facilities
Number
Mediandays of
jobtransfer
orrestriction
Number
Mediandays of
jobtransfer
orrestriction
Number
Mediandays of
jobtransfer
orrestriction
Length of service with employer:Less than 3 months ................................................................ 120 21 1,640 10 5,400 103 - 11 months .......................................................................... 300 11 2,320 13 14,320 121 - 5 years ............................................................................... 1,070 9 3,830 13 21,990 12More than 5 years ................................................................... 2,940 10 4,640 14 13,220 13Not reported ............................................................................ 70 6 290 15 740 15
Summary occupational groups:6
Management, business, and financial occupations ................ 90 13 90 8 1,640 14Computer, engineering, and science occupations .................. – – – – – –Education, legal, community service, arts, and mediaoccupations .......................................................................... – – – – 2,140 11
Healthcare practitioners and technical occupations ............... – – – – 6,520 12Service occupations ............................................................... 40 7 130 13 43,110 12Sales and related occupations ............................................... – – 160 55 – –Office and administrative support occupations ....................... 3,230 10 2,930 13 530 10Farming, fishing, and forestry occupations ............................. – – – – – –Construction and extraction occupations ................................ – – – – 30 20Installation, maintenance, and repair occupations ................. 460 12 320 14 840 12Production occupations .......................................................... – – 430 12 590 14Transportation and material moving occupations ................... 670 8 8,620 13 190 10
1 Median days of job transfer or restriction is the measure used to summarize the varying lengths of job transfer or restriction from work amongthe cases with days of job transfer or restriction. Half the cases involved more days and half involved less days than a specified median. Median daysof job transfer or restriction are represented in actual values.
2 Includes only cases involving days of job transfer or restriction.3 Days of job transfer or restriction pilot study. In January of 2012, the BLS Survey of Occupational Injuries and Illnesses (SOII) began to collect
information on case circumstances and worker characteristics for days-of-job-transfer-or-restriction (DJTR) cases. This supplemental information waspart of a pilot study on days of job transfer or restriction. The pilot included six three-digit industries including: Specialty trade contractors; Foodmanufacturing; Building material and garden equipment supplies dealers; Air transportation; Warehousing and storage; and Nursing and residentialcare facilities.
4 Information is not shown separately for injured workers under age 14; they accounted for fewer than 50 cases.5 Race and ethnicity data do not add to total. Some cases may be counted as both Multi-race and Hispanic and other race.6 Standard Occupational Classification Manual, 2010, Office of Management and Budget.
Note: Dash indicates data do not meet publication guidelines. Because of rounding and data exclusion of nonclassifiable responses, data may notsum to the totals.
Source: Bureau of Labor Statistics, U.S. Department of Labor, Survey of Occupational Injuries and Illnesses in cooperation with participating Stateagencies.

Technical NotesJ O B - T R A N S F E R O R W O R K - R E S T R I C T I O N C A S E S , 2 0 1 2
BLS Reports │ April2014 • www.bls.gov 35
Statistics of work-related injuries and illnesses are an important aspect of occupational safety and health. These statistics provide the detailed information needed to make workplaces safer for the nation’s workers. Government agencies, and industry, insurance, academic, public health, labor union, and private researchers analyze trends in these data. They also study the detailed circumstances of the injuries and illnesses to assess the overall occupational safety and health of workers and to identify ways to reduce injuries and illnesses, including potential changes in safety and health regulations or programs. Individual establishments compare their rates to those of their industry to benchmark their worker safety and health performance. Other researchers analyze the data to identify particular risks by occupation or event.
The estimates in this report were obtained from the Survey of Occupational Injuries and Illnesses (SOII), a national
annual survey of over 250,000 private sector establishments that provide a wide range of information on the labor force and occupational injuries and illnesses. National occupational safety and health statistics are a basic measure of the risks the nation’s workers and establishments take in producing goods and providing services.
The SOII provides information by industry, worker characteristics, and the circumstances of the injury or illness. The survey estimates injury and illness counts and incidence rates by nature of injury or illness, event or exposure, industry, occupation, gender, and age for the nation and participating states, among other categories. These estimates cover private industry workers.
Six industry sub-sectors were selected for this pilot study. Industry subsectors were selected based on their days of job transfer or restriction incidence rate (and to some degree the number of cases) in years before the pilot study. Some industries were selected if the days of job transfer or restriction incidence rate was greater than
Occupational injuries and illnesses incidence rates per 100 full-time workers in selected industry subsectors, by days away from work (DAFW) and days of job transfer or restriction (DJTR) case types, 2003–2008
Industry subsector NAICS Case type 2003 2004 2005 2006 2007 2008
Specialty trade contractors 238DAFW 2.8 2.6 2.6 2.4 2.1 1.9
DJTR 1.1 1 1.1 1.1 0.9 0.8
Food manufacturing 311DAFW 1.9 1.9 1.6 1.6 1.5 1.4
DJTR 3.7 3.4 3.4 3.2 2.8 2.6
Building material and garden equipment and supplies dealers 444
DAFW 2 2.3 2.1 2 1.7 1.5
DJTR 1.4 2 1.8 2.3 2.2 2.1
Air transportation 481DAFW 5.8 5.3 5.3 5.4 5.2 4.7
DJTR 2.2 2.5 2.2 2.2 2.1 2.1
Warehousing and storage 493DAFW 3 2.8 2.2 2.2 2.1 2
DJTR 4.4 3 3.2 3.4 3.3 2.9
Nursing and residential care facilities 623
DAFW 3.2 2.9 2.9 2.6 2.6 2.5
DJTR 3.1 2.8 2.8 2.7 2.6 2.5
Source: U.S. Bureau of Labor Statistics.
Table A

36 BLS Reports │ April 2014 • www.bls.gov
J O B - T R A N S F E R O R W O R K - R E S T R I C T I O N C A S E S , 2 0 1 2
or equal to the days away from work incidence rate in the respective industry. (See table A.) For example, the 2008 rate for cases of days of job transfer or restriction was greater or equal to the rate for days-away-from-work cases in food manufacturing, building material and garden equipment and supplies dealers, warehousing and storage, and residential care and nursing facilities. Specialty trade contractors and air transportation were selected to provide contrast in the data for which the rates for job transfer or restriction cases were lower than the rates for days-away-from-work cases.
Concepts and definitions The principal concepts and definitions used in connection with BLS occupational safety and health data in this report are described briefly below. In fact, many of the concepts originate from the Department of Labor Occupational Safety and Health Administration (OSHA) and are used for the BLS Survey of Occupational Injuries and Illnesses (SOII). OSHA requires high-risk industries to record injuries and illnesses each year according to OSHA recordkeeping guidelines http://www.osha.gov/recordkeeping/index.html. Employers in other industries are required to record injuries and illnesses when the Department of Labor notifies them to do so. BLS collects data from a sample that includes employers from both to provide estimates on occupational injuries and illnesses in the workplace.
Recordable case. Nonfatal recordable workplace injuries and illnesses are those that result in any one or more of the following:
• Loss of consciousness
• Days away from work
• Restricted work activity or job transfer
• Medical treatment beyond first aid
In addition to these four criteria, employers must also record any significant work-related injuries or illnesses that are diagnosed by a physician or other licensed health care professional or other instances that meet
additional criteria discussed below. Significant work-related injuries or illnesses include cancers, chronic irreversible diseases, fractured or cracked bones (including teeth), or punctured eardrums. Additional cases that must be recorded as workplace injuries or illnesses include the following:
• Any needlestick injury or cut from a sharp object that is contaminated with another person’s blood or other potentially infectious material
• Any case requiring an employee to be medically removed under the requirements of an OSHA health standard
• Tuberculosis infection as evidenced by a positive skin test or diagnosis by a physician or other licensed health care professional after exposure to a known case of active tuberculosis
• An employee’s hearing test (audiogram) reveals that the employee has experienced a Standard Threshold Shift (STS) in hearing in one or both ears (averaged at 2kHz, 3kHz, and 4kHz) and 2) the employee’s total hearing level is 25 decibels (dB) or more above audiometric zero (also averaged at 2kHz, 3kHz, and 4kHz) in the same ear(s) as the STS.
Additional details regarding recordability of nonfatal work-related injuries and illnesses can be found in the OSHA Recordkeeping Handbook.
Occupational injury is any injury, such as a cut, fracture, sprain, or amputation that results from a work-related incident or from a single instantaneous exposure in the work environment.
Occupational illness is any abnormal condition or disorder caused by exposure to factors associated with employment, other than those resulting from an instantaneous event or exposure. It includes acute and chronic illnesses or diseases that may be caused by inhalation, absorption, ingestion, or direct contact.
Days away from work (DAFW). Cases for which employees used days away from work (beyond the day of injury

BLS Reports │ April 2014 • www.bls.gov 37
J O B - T R A N S F E R O R W O R K - R E S T R I C T I O N C A S E S , 2 0 1 2
or onset of illness) to recover from an occupational injury or illness. The number of days away from work is determined by the number of calendar days, after the date of the injury or illness, before an employee returns to work. These cases may also include days of job transfer or restricted work activity in addition to days away from work. For example, an employee suffers a work-related injury resulting in 5 days away from work and upon returning to work, the employee is unable to perform normal duties associated with the job for an additional 3 days (i.e., the employee was on restricted work activity). This case would be recorded as a days-away-from work case with 5 days away from work and 3 days of restricted work activity.
Days of job transfer or restriction (DJTR). Days-of-job-transfer-or-restriction cases are those which result only in job transfer or restricted work activity. This occurs when, as the result of a work-related injury or illness, an employer keeps or health care professional recommends keeping an employee from doing the routine functions of his or her job or from working the full workday that the employee would have been scheduled to work before the injury or illness occurred. This may include the following instances:
• An employee is assigned to another job on a temporary basis
• An employee works at a permanent job less than full time
• An employee works at a permanently assigned job but is unable to perform all duties normally connected with it
Days-away-from-work, restriction, job transfer (DART). These are cases that involve days away from work (beyond the day of injury or onset of illness), or days of job transfer or restricted work activity, or both.
Case circumstances. Employers record narrative descriptions about the detailed circumstances of nonfatal occupational injuries and illnesses cases involving days away from work on OSHA case forms. This information
is then recorded on the SOII. The narrative descriptions are then coded using definitions and rules of selection stipulated in the BLS Occupational Injury and Illness Classification System (OIICS) manual (http://www.bls.gov/iif/oshoiics.htm). The following case circumstances describe these injuries and illnesses from different perspectives.
Nature of injury or illness names the principal physical characteristic of a disabling condition, such as sprain/strain, cut/laceration, or carpal tunnel syndrome.
Part of body affected is directly linked to the nature of injury or illness cited, for example, back sprain, finger cut, or wrist and carpal tunnel syndrome.
Source and secondary source of injury or illness identify the objects, substances, equipment, and other factors that were responsible for the injury or illness incurred by the worker or that precipitated the event or exposure. Examples are a heavy box, a toxic substance, fire/flame, and bodily motion of injured or ill worker.
Event or exposure signifies the manner in which the injury or illness was produced or inflicted, for example, overexertion while lifting or fall from ladder.
Musculoskeletal disorders (MSDs) include cases for which the nature of the injury or illness is pinched nerve; herniated disc; meniscus tear; sprains, strains, tears; hernia (traumatic and non-traumatic); pain, swelling, and numbness; carpal or tarsal tunnel syndrome; Raynaud’s syndrome or phenomenon; musculoskeletal system and connective tissue diseases and disorders, when the event or exposure leading to the injury or illness is overexertion and bodily reaction, unspecified; overexertion involving outside sources; repetitive motion involving microtasks; other and multiple exertions or bodily reactions; and rubbed, abraded, or jarred by vibration.
Other circumstances include
• Day of the week the incident occurred
• Time of day the incident occurred
• Hours of work before the incident occurred

38 BLS Reports │ April 2014 • www.bls.gov
J O B - T R A N S F E R O R W O R K - R E S T R I C T I O N C A S E S , 2 0 1 2
Median days away from work is the measure used to summarize the varying lengths of absences from work among the cases with days away from work. Half the cases involved more days and half involved less days than a specified median.
Median days of job transfer or restriction is the measure used to summarize the varying number of days in job transfer or restriction. Half the cases involved more days and half involved less days than a specified median.
OSHA recordkeeping change. Effective January 1, 2002, OSHA revised its requirements for recording occupational injuries and illnesses. Details about the revised requirements, including a summary of the revisions and a comparison between the old and new requirements, are available at http://www.osha.gov/recordkeeping/index.html or from OSHA’s Office of Public Affairs at 202-693-1999.
Duration of this study. This pilot study will continue with data collection and dissemination for 2013. Additional details about the survey methodology can be found in the Occupational Safety and Health Statistics chapter of the BLS Handbook of Methods: www.bls.gov/opub/hom/homch9.htm.
This report does not present all the publishable estimates and rates for days-of-job-transfer-or-restriction cases. Additional detailed data and charts are available from BLS staff at (202) 691-6170, [email protected], and the BLS Internet site: www.bls.gov/iif/oshcdnew.htm.
Material in this report is in the public domain and, with appropriate credit, may be reproduced without permission. This information is available to sensory-impaired individuals upon request. Voice phone: (202) 691-5200; Federal Relay Service: (800) 877-8339.