table 1. incidence rates of nonfatal occupational injuries ...table 1. incidence rates1 of nonfatal...
TRANSCRIPT

See footnotes at end of table.
TABLE 1. Incidence rates1 of nonfatal occupational injuries and illnesses by industry and case types, Texas, 2015
NAICS Total
Cases with days away from work, job transfer, or restriction Other
Industry2 code3 recordable cases
Total
Cases with days away from
work4
Cases with job
transfer or restriction
recordable cases
All industries including state and local government5 .................................................................................. 2.6 1.3 0.6 0.7 1.3
Private industry5 ............................................................................................................................................. 2.3 1.2 0.6 0.7 1.0
Goods-producing5 ............................................................................................................................................... 2.2 1.3 0.6 0.7 0.9
Agriculture, forestry, fishing and hunting5 .................................................................................................................. 11 4.4 2.8 1.1 1.7 1.6
Crop production5 ................................................................................................................................................................... 111 4.3 2.5 0.7 1.8 1.8
Greenhouse, nursery, and floriculture production5 .............................................................................................................. 1114 4.0 2.3 0.8 1.5 1.7
Animal production and aquaculture5 ...................................................................................................................................... 112 6.2 4.4 1.9 2.5 1.8
Support activities for agriculture and forestry .......................................................................................................................... 115 2.3 0.9 0.6 0.3 1.4
Support activities for crop production ................................................................................................................................... 1151 2.4 0.9 0.6 0.3 1.5
Support activities for crop production ................................................................................................................................ 11511 2.4 0.9 0.6 0.3 1.5
Crop harvesting, primarily by machine ........................................................................................................................... 115113 - - - - -
Postharvest crop activities (except cotton ginning) ........................................................................................................ 115114 3.6 2.8 1.8 1.0 -
Farm labor contractors and crew leaders....................................................................................................................... 115115 - - - - -
Natural resources and mining5,6 .............................................................................................................................. - - - - -
Mining, quarrying, and oil and gas extraction6 ............................................................................................................ 21 - - - - -
Mining (except oil and gas)6 .................................................................................................................................................. 212 1.4 1.0 0.5 0.5 0.4
Construction ............................................................................................................................................................... 2.0 1.1 0.6 0.6 0.9
Construction .................................................................................................................................................................... 23 2.0 1.1 0.6 0.6 0.9
Construction of buildings ........................................................................................................................................................ 236 0.8 0.4 0.2 0.2 0.4
Residential building construction ......................................................................................................................................... 2361 0.6 0.3 - - 0.3
Nonresidential building construction .................................................................................................................................... 2362 0.9 0.4 0.2 0.2 0.5
Heavy and civil engineering construction ................................................................................................................................ 237 2.0 1.3 0.5 0.9 0.7
Utility system construction ................................................................................................................................................... 2371 1.7 1.1 0.3 - 0.6
Oil and gas pipeline and related structures construction ................................................................................................... 23712 0.4 0.2 0.2 0.1 0.2

See footnotes at end of table.
TABLE 1. Incidence rates1 of nonfatal occupational injuries and illnesses by industry and case types, Texas, 2015 -- Continued
NAICS Total
Cases with days away from work, job transfer, or restriction Other
Industry2 code3 recordable cases
Total
Cases with days away from
work4
Cases with job
transfer or restriction
recordable cases
Power and communication line and related structures construction .................................................................................. 23713 1.0 0.5 0.2 0.2 0.6
Highway, street, and bridge construction ............................................................................................................................. 2373 3.6 2.3 0.8 1.5 1.3
Specialty trade contractors ..................................................................................................................................................... 238 2.6 1.3 0.7 0.6 1.2
Foundation, structure, and building exterior contractors ....................................................................................................... 2381 3.7 2.1 1.3 0.9 1.6
Framing contractors ......................................................................................................................................................... 23813 6.8 3.3 3.2 - -
Masonry contractors ......................................................................................................................................................... 23814 3.6 3.3 2.9 - -
Glass and glazing contractors .......................................................................................................................................... 23815 4.2 3.0 1.1 1.9 -
Roofing contractors .......................................................................................................................................................... 23816 2.6 1.8 1.2 0.6 0.8
Building equipment contractors ........................................................................................................................................... 2382 3.1 1.5 0.8 0.7 1.6
Electrical contractors and other wiring installation contractors .......................................................................................... 23821 2.0 1.2 0.5 0.7 0.8
Plumbing, heating, and air-conditioning contractors .......................................................................................................... 23822 3.7 2.0 1.2 0.8 1.7
Building finishing contractors ............................................................................................................................................... 2383 1.2 0.7 0.3 0.4 0.5
Drywall and insulation contractors .................................................................................................................................... 23831 2.0 1.4 0.4 1.1 0.6
Painting and wall covering contractors ............................................................................................................................. 23832 0.6 0.2 - - -
Other specialty trade contractors ......................................................................................................................................... 2389 1.1 0.6 0.3 0.2 0.5
Site preparation contractors ............................................................................................................................................. 23891 0.9 0.7 0.5 0.2 0.3
All other specialty trade contractors .................................................................................................................................. 23899 1.2 0.5 0.2 0.3 0.7
Manufacturing ............................................................................................................................................................ 2.8 1.8 0.7 1.0 1.1
Manufacturing ................................................................................................................................................................. 31-33 2.8 1.8 0.7 1.0 1.1
Food manufacturing ................................................................................................................................................................ 311 4.3 2.9 0.9 2.0 1.4
Animal food manufacturing .................................................................................................................................................. 3111 5.4 4.0 - 2.0 1.3
Grain and oilseed milling ..................................................................................................................................................... 3112 3.0 2.8 0.5 2.3 -

See footnotes at end of table.
TABLE 1. Incidence rates1 of nonfatal occupational injuries and illnesses by industry and case types, Texas, 2015 -- Continued
NAICS Total
Cases with days away from work, job transfer, or restriction Other
Industry2 code3 recordable cases
Total
Cases with days away from
work4
Cases with job
transfer or restriction
recordable cases
Sugar and confectionery product manufacturing .................................................................................................................. 3113 5.5 4.4 1.6 2.8 1.1
Fruit and vegetable preserving and specialty food manufacturing ........................................................................................ 3114 3.4 2.2 0.5 1.7 1.2
Dairy product manufacturing ................................................................................................................................................ 3115 5.9 3.5 0.7 2.7 2.4
Animal slaughtering and processing .................................................................................................................................... 3116 4.4 2.6 0.7 1.9 1.8
Animal slaughtering and processing ................................................................................................................................. 31161 4.4 2.6 0.7 1.9 1.8
Animal (except poultry) slaughtering ............................................................................................................................. 311611 5.7 3.4 0.6 2.9 2.3
Meat processed from carcasses .................................................................................................................................... 311612 2.7 1.3 0.4 0.9 1.4
Rendering and meat byproduct processing ................................................................................................................... 311613 5.8 4.6 - 2.6 -
Poultry processing ......................................................................................................................................................... 311615 4.1 2.5 0.8 1.7 1.6
Bakeries and tortilla manufacturing ...................................................................................................................................... 3118 3.6 3.0 0.8 2.2 0.6
Bread and bakery product manufacturing ......................................................................................................................... 31181 3.6 2.9 0.6 2.4 0.7
Cookie, cracker, and pasta manufacturing ........................................................................................................................ 31182 5.4 4.7 - 4.1 -
Other food manufacturing .................................................................................................................................................... 3119 4.1 2.9 2.6 0.2 1.2
Beverage and tobacco product manufacturing ........................................................................................................................ 312 4.6 3.4 0.7 2.7 1.2
Beverage manufacturing ..................................................................................................................................................... 3121 4.6 3.4 0.7 2.7 1.2
Soft drink and ice manufacturing ...................................................................................................................................... 31211 5.3 4.4 0.7 3.7 0.9
Soft drink manufacturing ............................................................................................................................................... 312111 6.7 5.5 0.9 4.7 1.2
Breweries ......................................................................................................................................................................... 31212 2.5 0.7 - - 1.8
Textile product mills ................................................................................................................................................................ 314 2.6 2.5 1.2 1.2 -
Leather and allied product manufacturing ............................................................................................................................... 316 2.0 0.9 0.5 - 1.1
Leather and hide tanning and finishing ................................................................................................................................ 3161 - - - - -
Footwear manufacturing ...................................................................................................................................................... 3162 2.2 1.2 0.8 - 0.9

See footnotes at end of table.
TABLE 1. Incidence rates1 of nonfatal occupational injuries and illnesses by industry and case types, Texas, 2015 -- Continued
NAICS Total
Cases with days away from work, job transfer, or restriction Other
Industry2 code3 recordable cases
Total
Cases with days away from
work4
Cases with job
transfer or restriction
recordable cases
Wood product manufacturing .................................................................................................................................................. 321 5.4 3.8 2.4 1.5 1.6
Sawmills and wood preservation ......................................................................................................................................... 3211 4.5 3.4 - 0.8 1.1
Veneer, plywood, and engineered wood product manufacturing .......................................................................................... 3212 3.3 2.2 0.9 1.3 1.1
Other wood product manufacturing ...................................................................................................................................... 3219 6.5 4.5 2.9 1.7 1.9
Millwork ............................................................................................................................................................................ 32191 5.7 4.5 4.1 - 1.1
Wood container and pallet manufacturing ......................................................................................................................... 32192 5.1 4.0 2.4 1.6 1.0
All other wood product manufacturing .............................................................................................................................. 32199 8.2 5.0 2.2 2.7 3.3
Paper manufacturing .............................................................................................................................................................. 322 2.9 1.9 0.7 1.2 1.0
Converted paper product manufacturing .............................................................................................................................. 3222 3.1 2.1 0.7 1.4 1.1
Paperboard container manufacturing ................................................................................................................................ 32221 3.9 2.5 1.1 1.5 -
Printing and related support activities ..................................................................................................................................... 323 2.1 1.2 0.6 0.6 0.9
Printing and related support activities .................................................................................................................................. 3231 2.1 1.2 0.6 0.6 0.9
Printing ............................................................................................................................................................................. 32311 2.1 1.1 0.6 0.5 0.9
Support activities for printing ............................................................................................................................................ 32312 4.2 3.5 - 3.1 -
Petroleum and coal products manufacturing ........................................................................................................................... 324 0.8 0.7 0.4 0.3 0.2
Petroleum and coal products manufacturing ........................................................................................................................ 3241 0.8 0.7 0.4 0.3 0.2
Petroleum refineries ......................................................................................................................................................... 32411 0.7 0.5 0.2 0.3 0.2
Chemical manufacturing ......................................................................................................................................................... 325 0.9 0.6 0.3 0.3 0.3
Basic chemical manufacturing ............................................................................................................................................. 3251 0.3 0.2 0.1 0.1 0.1
Resin, synthetic rubber, and artificial synthetic fibers and filaments manufacturing .............................................................. 3252 0.3 0.2 0.2 - -
Pharmaceutical and medicine manufacturing ...................................................................................................................... 3254 2.5 1.9 0.6 1.3 0.6
Other chemical product and preparation manufacturing ....................................................................................................... 3259 1.7 1.0 - 0.5 0.7

See footnotes at end of table.
TABLE 1. Incidence rates1 of nonfatal occupational injuries and illnesses by industry and case types, Texas, 2015 -- Continued
NAICS Total
Cases with days away from work, job transfer, or restriction Other
Industry2 code3 recordable cases
Total
Cases with days away from
work4
Cases with job
transfer or restriction
recordable cases
Plastics and rubber products manufacturing ........................................................................................................................... 326 3.6 2.4 0.8 1.6 1.1
Plastics product manufacturing ............................................................................................................................................ 3261 3.6 2.5 0.9 1.6 1.1
Nonmetallic mineral product manufacturing ............................................................................................................................ 327 4.8 3.5 1.3 2.1 1.4
Clay product and refractory manufacturing .......................................................................................................................... 3271 4.6 2.8 0.6 2.3 1.7
Glass and glass product manufacturing ............................................................................................................................... 3272 4.9 3.9 0.9 3.0 1.0
Cement and concrete product manufacturing ...................................................................................................................... 3273 4.6 3.6 1.8 1.8 1.0
Lime and gypsum product manufacturing ............................................................................................................................ 3274 6.4 1.6 1.6 - 4.8
Other nonmetallic mineral product manufacturing ................................................................................................................ 3279 5.5 3.7 0.7 3.0 1.9
Primary metal manufacturing .................................................................................................................................................. 331 3.1 2.2 1.0 1.2 0.9
Iron and steel mills and ferroalloy manufacturing ................................................................................................................. 3311 3.0 2.7 1.2 1.4 0.3
Steel product manufacturing from purchased steel .............................................................................................................. 3312 1.5 0.8 0.3 0.5 0.8
Alumina and aluminum production and processing .............................................................................................................. 3313 4.6 3.3 1.8 1.5 1.2
Nonferrous metal (except aluminum) production and processing ......................................................................................... 3314 2.9 1.9 0.7 1.3 0.9
Foundries ............................................................................................................................................................................ 3315 3.9 2.4 1.0 1.4 1.5
Fabricated metal product manufacturing ................................................................................................................................. 332 3.5 1.9 0.9 1.0 1.6
Forging and stamping .......................................................................................................................................................... 3321 4.4 3.9 0.9 3.0 0.5
Architectural and structural metals manufacturing ............................................................................................................... 3323 3.9 2.2 1.0 1.3 1.7
Boiler, tank, and shipping container manufacturing .............................................................................................................. 3324 4.4 1.9 1.1 0.8 2.5
Machine shops; turned product; and screw, nut, and bolt manufacturing ............................................................................. 3327 4.2 1.6 0.8 0.7 2.6
Coating, engraving, heat treating, and allied activities ......................................................................................................... 3328 3.0 2.4 1.4 1.0 0.5
Other fabricated metal product manufacturing ..................................................................................................................... 3329 2.0 1.3 0.5 0.9 0.6
Machinery manufacturing ....................................................................................................................................................... 333 2.6 1.4 0.6 0.8 1.2

See footnotes at end of table.
TABLE 1. Incidence rates1 of nonfatal occupational injuries and illnesses by industry and case types, Texas, 2015 -- Continued
NAICS Total
Cases with days away from work, job transfer, or restriction Other
Industry2 code3 recordable cases
Total
Cases with days away from
work4
Cases with job
transfer or restriction
recordable cases
Agriculture, construction, and mining machinery manufacturing ........................................................................................... 3331 - - - - -
Agricultural implement manufacturing ............................................................................................................................... 33311 4.4 2.3 - 1.9 2.1
Construction machinery manufacturing ............................................................................................................................ 33312 2.9 2.7 - 1.8 -
Ventilation, heating, air-conditioning, and commercial refrigeration equipment manufacturing ................................................................................................................................................................ 3334 7.5 2.9 0.5 2.4 4.6
Engine, turbine, and power transmission equipment manufacturing .................................................................................... 3336 2.7 1.7 0.6 1.1 1.0
Other general purpose machinery manufacturing ................................................................................................................ 3339 3.0 1.8 1.3 0.5 1.2
Computer and electronic product manufacturing ..................................................................................................................... 334 0.7 0.4 0.2 0.2 0.3
Computer and peripheral equipment manufacturing ............................................................................................................ 3341 0.6 0.5 0.4 - -
Communications equipment manufacturing ......................................................................................................................... 3342 0.3 - - - 0.3
Semiconductor and other electronic component manufacturing ........................................................................................... 3344 0.8 0.5 0.2 0.2 0.4
Navigational, measuring, electromedical, and control instruments manufacturing ................................................................ 3345 0.9 0.4 0.2 0.2 0.5
Electrical equipment, appliance, and component manufacturing ............................................................................................. 335 1.3 0.6 0.1 0.5 0.7
Electric lighting equipment manufacturing ........................................................................................................................... 3351 1.5 - - - 0.9
Household appliance manufacturing .................................................................................................................................... 3352 3.1 - - - 3.0
Electrical equipment manufacturing ..................................................................................................................................... 3353 0.9 0.5 - 0.5 0.4
Other electrical equipment and component manufacturing .................................................................................................. 3359 1.3 0.7 - 0.5 -
Transportation equipment manufacturing ................................................................................................................................ 336 3.3 2.2 0.7 1.5 1.2
Motor vehicle body and trailer manufacturing ...................................................................................................................... 3362 3.5 1.9 0.7 1.2 1.6
Motor vehicle parts manufacturing ....................................................................................................................................... 3363 4.9 3.3 0.5 2.8 1.6
Aerospace product and parts manufacturing ....................................................................................................................... 3364 1.9 0.9 0.4 0.5 1.0
Furniture and related product manufacturing .......................................................................................................................... 337 2.9 1.7 0.6 1.2 1.2
Household and institutional furniture and kitchen cabinet manufacturing ............................................................................. 3371 2.5 1.7 0.7 1.0 0.8
Office furniture (including fixtures) manufacturing ................................................................................................................ 3372 5.1 2.3 0.5 1.8 2.7
See footnotes at end of table.
TABLE 1. Incidence rates1 of nonfatal occupational injuries and illnesses by industry and case types, Texas, 2015 -- Continued
NAICS Total
Cases with days away from work, job transfer, or restriction Other
Industry2 code3 recordable cases
Total
Cases with days away from
work4
Cases with job
transfer or restriction
recordable cases
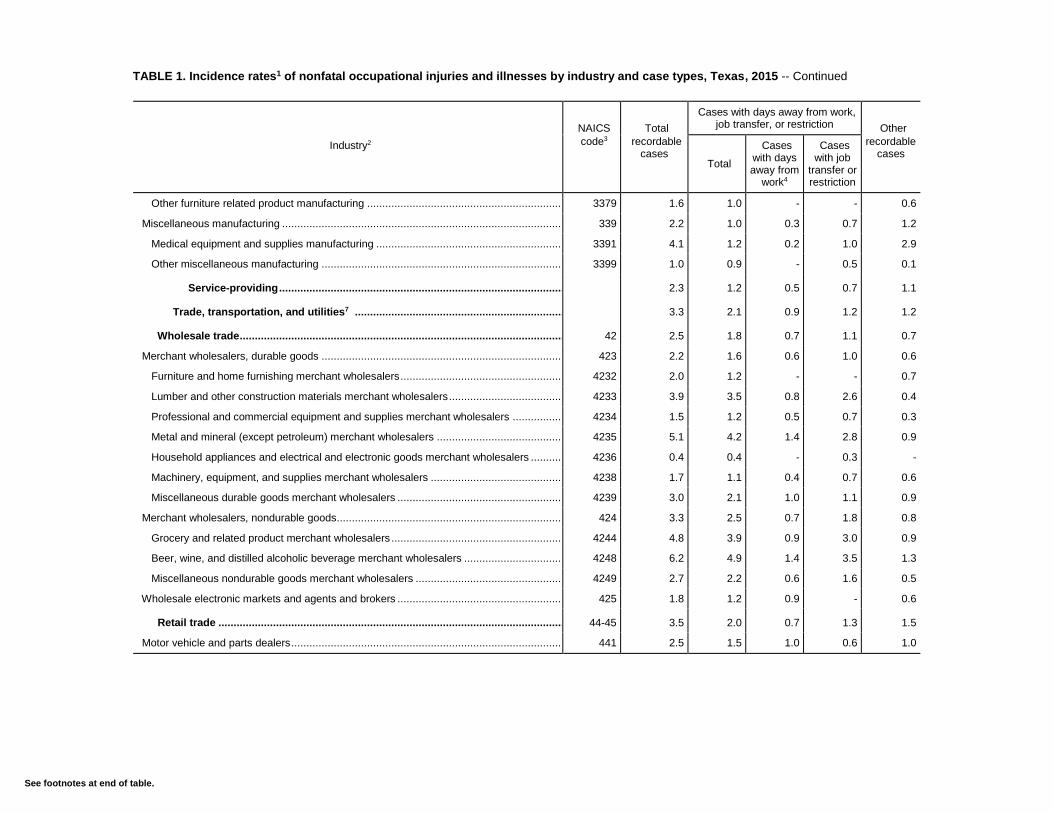
Other furniture related product manufacturing ..................................................................................................................... 3379 1.6 1.0 - - 0.6
Miscellaneous manufacturing ................................................................................................................................................. 339 2.2 1.0 0.3 0.7 1.2
Medical equipment and supplies manufacturing .................................................................................................................. 3391 4.1 1.2 0.2 1.0 2.9
Other miscellaneous manufacturing .................................................................................................................................... 3399 1.0 0.9 - 0.5 0.1
Service-providing .................................................................................................................................................. 2.3 1.2 0.5 0.7 1.1
Trade, transportation, and utilities7 ......................................................................................................................... 3.3 2.1 0.9 1.2 1.2
Wholesale trade ............................................................................................................................................................... 42 2.5 1.8 0.7 1.1 0.7
Merchant wholesalers, durable goods .................................................................................................................................... 423 2.2 1.6 0.6 1.0 0.6
Furniture and home furnishing merchant wholesalers .......................................................................................................... 4232 2.0 1.2 - - 0.7
Lumber and other construction materials merchant wholesalers .......................................................................................... 4233 3.9 3.5 0.8 2.6 0.4
Professional and commercial equipment and supplies merchant wholesalers ..................................................................... 4234 1.5 1.2 0.5 0.7 0.3
Metal and mineral (except petroleum) merchant wholesalers .............................................................................................. 4235 5.1 4.2 1.4 2.8 0.9
Household appliances and electrical and electronic goods merchant wholesalers ............................................................... 4236 0.4 0.4 - 0.3 -
Machinery, equipment, and supplies merchant wholesalers ................................................................................................ 4238 1.7 1.1 0.4 0.7 0.6
Miscellaneous durable goods merchant wholesalers ........................................................................................................... 4239 3.0 2.1 1.0 1.1 0.9
Merchant wholesalers, nondurable goods ............................................................................................................................... 424 3.3 2.5 0.7 1.8 0.8
Grocery and related product merchant wholesalers ............................................................................................................. 4244 4.8 3.9 0.9 3.0 0.9
Beer, wine, and distilled alcoholic beverage merchant wholesalers ..................................................................................... 4248 6.2 4.9 1.4 3.5 1.3
Miscellaneous nondurable goods merchant wholesalers ..................................................................................................... 4249 2.7 2.2 0.6 1.6 0.5
Wholesale electronic markets and agents and brokers ........................................................................................................... 425 1.8 1.2 0.9 - 0.6
Retail trade ...................................................................................................................................................................... 44-45 3.5 2.0 0.7 1.3 1.5
Motor vehicle and parts dealers .............................................................................................................................................. 441 2.5 1.5 1.0 0.6 1.0

See footnotes at end of table.
TABLE 1. Incidence rates1 of nonfatal occupational injuries and illnesses by industry and case types, Texas, 2015 -- Continued
NAICS Total
Cases with days away from work, job transfer, or restriction Other
Industry2 code3 recordable cases
Total
Cases with days away from
work4
Cases with job
transfer or restriction
recordable cases
Automobile dealers .............................................................................................................................................................. 4411 2.8 1.3 0.7 0.6 1.5
Automotive parts, accessories, and tire stores ..................................................................................................................... 4413 2.4 2.2 1.5 0.7 0.1
Furniture and home furnishings stores .................................................................................................................................... 442 4.2 2.7 1.8 0.9 1.5
Electronics and appliance stores ............................................................................................................................................ 443 1.1 0.6 0.4 - 0.5
Building material and garden equipment and supplies dealers ................................................................................................ 444 4.4 3.2 1.1 2.1 1.2
Food and beverage stores ...................................................................................................................................................... 445 4.2 3.2 0.9 2.4 0.9
Grocery stores ..................................................................................................................................................................... 4451 4.5 3.5 0.9 2.6 1.0
Supermarkets and other grocery (except convenience) stores ......................................................................................... 44511 4.8 3.8 0.9 2.9 1.1
Convenience stores .......................................................................................................................................................... 44512 1.3 0.9 0.4 - 0.3
Health and personal care stores ............................................................................................................................................. 446 1.3 0.5 0.5 - 0.8
Gasoline stations .................................................................................................................................................................... 447 0.9 0.6 0.3 0.2 0.3
Clothing and clothing accessories stores ................................................................................................................................ 448 2.5 0.7 - 0.1 1.8
Sporting goods, hobby, book, and music stores ...................................................................................................................... 451 1.9 0.5 0.3 0.2 1.4
General merchandise stores ................................................................................................................................................... 452 5.6 2.4 0.6 1.8 3.2
Department stores ............................................................................................................................................................... 4521 4.4 1.7 0.5 1.2 2.7
Other general merchandise stores ....................................................................................................................................... 4529 6.3 2.8 0.7 2.1 3.5
Miscellaneous store retailers .................................................................................................................................................. 453 3.8 2.4 0.3 2.1 1.4
Nonstore retailers ................................................................................................................................................................... 454 2.1 0.9 - 0.7 -
Transportation and warehousing7 ................................................................................................................................ 48-49 4.0 2.8 1.6 1.2 1.2
Air transportation .................................................................................................................................................................... 481 5.8 4.9 3.4 1.5 0.9
Rail transportation7 ................................................................................................................................................................ 482 1.1 0.7 0.6 0.1 0.3
Water transportation ............................................................................................................................................................... 483 1.5 1.4 - 1.4 -

See footnotes at end of table.
TABLE 1. Incidence rates1 of nonfatal occupational injuries and illnesses by industry and case types, Texas, 2015 -- Continued
NAICS Total
Cases with days away from work, job transfer, or restriction Other
Industry2 code3 recordable cases
Total
Cases with days away from
work4
Cases with job
transfer or restriction
recordable cases
Truck transportation ................................................................................................................................................................ 484 3.9 2.6 1.9 0.8 1.3
General freight trucking ....................................................................................................................................................... 4841 3.6 2.6 1.6 1.0 0.9
General freight trucking, local ........................................................................................................................................... 48411 3.3 2.4 1.3 1.1 1.0
General freight trucking, long-distance ............................................................................................................................. 48412 3.7 2.7 1.7 1.0 0.9
Specialized freight trucking .................................................................................................................................................. 4842 4.7 2.7 2.5 0.2 2.1
Used household and office goods moving ........................................................................................................................ 48421 3.1 0.7 0.2 0.5 2.4
Specialized freight (except used goods) trucking, local ..................................................................................................... 48422 2.5 0.8 0.7 - 1.7
Transit and ground passenger transportation.......................................................................................................................... 485 5.3 3.7 2.4 1.3 1.6
Support activities for transportation......................................................................................................................................... 488 2.5 1.5 0.9 0.6 1.0
Support activities for air transportation ................................................................................................................................. 4881 2.4 1.2 0.5 0.7 1.3
Support activities for water transportation ............................................................................................................................ 4883 7.7 5.6 2.8 2.8 2.2
Support activities for road transportation ............................................................................................................................. 4884 0.5 0.4 0.4 - -
Couriers and messengers ....................................................................................................................................................... 492 7.8 6.0 2.5 3.5 1.8
Warehousing and storage ....................................................................................................................................................... 493 3.9 3.0 0.9 2.1 0.9
Warehousing and storage ................................................................................................................................................... 4931 3.9 3.0 0.9 2.1 0.9
General warehousing and storage .................................................................................................................................... 49311 4.0 3.1 1.0 2.1 0.9
Utilities ............................................................................................................................................................................. 22 - - - - -
Utilities ................................................................................................................................................................................... 221 - - - - -
Electric power generation, transmission and distribution ...................................................................................................... 2211 1.3 0.7 0.4 0.3 0.6
Information ................................................................................................................................................................. 1.5 0.7 0.5 0.3 0.7
Information ...................................................................................................................................................................... 51 1.5 0.7 0.5 0.3 0.7
Publishing industries (except internet) .................................................................................................................................... 511 0.6 0.3 0.2 0.1 0.3
Newspaper, periodical, book, and directory publishers ........................................................................................................ 5111 1.1 0.5 0.3 0.2 0.6
Software publishers ............................................................................................................................................................. 5112 - - - - -

See footnotes at end of table.
TABLE 1. Incidence rates1 of nonfatal occupational injuries and illnesses by industry and case types, Texas, 2015 -- Continued
NAICS Total
Cases with days away from work, job transfer, or restriction Other
Industry2 code3 recordable cases
Total
Cases with days away from
work4
Cases with job
transfer or restriction
recordable cases
Motion picture and sound recording industries ........................................................................................................................ 512 5.9 1.3 1.0 0.3 4.6
Broadcasting (except internet) ................................................................................................................................................ 515 1.1 0.8 0.3 0.4 0.3
Telecommunications ............................................................................................................................................................... 517 1.8 1.2 0.8 0.4 0.6
Data processing, hosting, and related services ....................................................................................................................... 518 0.1 - - - -
Finance, insurance, and real estate .......................................................................................................................... 0.7 0.4 0.2 0.2 0.4
Finance and insurance .................................................................................................................................................... 52 0.4 0.2 0.1 ( 8 ) 0.2
Monetary authorities-central bank ........................................................................................................................................... 521 - - - - -
Credit intermediation and related activities ............................................................................................................................. 522 0.5 0.2 0.2 ( 8 ) 0.3
Insurance carriers and related activities .................................................................................................................................. 524 0.3 0.2 0.1 0.1 0.1
Funds, trusts, and other financial vehicles .............................................................................................................................. 525 - - - - -
Real estate and rental and leasing ................................................................................................................................. 53 1.6 0.9 0.3 0.6 0.7
Real estate ............................................................................................................................................................................. 531 1.6 0.7 0.3 0.4 1.0
Rental and leasing services .................................................................................................................................................... 532 1.6 1.3 0.3 1.0 0.3
Lessors of nonfinancial intangible assets (except copyrighted works) ..................................................................................... 533 - - - - -
Professional and business services ......................................................................................................................... 1.0 0.5 0.3 0.2 0.6
Professional, scientific, and technical services ............................................................................................................ 54 0.5 0.3 0.2 0.1 0.3
Professional, scientific, and technical services ........................................................................................................................ 541 0.5 0.3 0.2 0.1 0.3
Management, scientific, and technical consulting services................................................................................................... 5416 0.2 0.1 0.1 ( 8 ) 0.1
Other professional, scientific, and technical services ........................................................................................................... 5419 3.7 1.7 1.2 0.5 2.0
Management of companies and enterprises ................................................................................................................. 55 0.4 0.3 0.1 0.2 0.2
Administrative and support and waste management and remediation services ........................................................ 56 1.9 0.8 0.4 0.4 1.1
Administrative and support services ....................................................................................................................................... 561 1.9 0.8 0.4 0.4 1.1

See footnotes at end of table.
TABLE 1. Incidence rates1 of nonfatal occupational injuries and illnesses by industry and case types, Texas, 2015 -- Continued
NAICS Total
Cases with days away from work, job transfer, or restriction Other
Industry2 code3 recordable cases
Total
Cases with days away from
work4
Cases with job
transfer or restriction
recordable cases
Office administrative services .............................................................................................................................................. 5611 2.2 0.3 - 0.2 1.9
Facilities support services ................................................................................................................................................... 5612 4.5 2.3 1.7 0.5 2.2
Business support services ................................................................................................................................................... 5614 - 0.2 0.1 0.1 -
Travel arrangement and reservation services ...................................................................................................................... 5615 - - - - -
Investigation and security services ...................................................................................................................................... 5616 2.0 0.7 0.3 0.4 -
Services to buildings and dwellings ..................................................................................................................................... 5617 2.5 1.6 0.8 0.8 0.9
Exterminating and pest control services ........................................................................................................................... 56171 3.9 3.0 1.6 1.3 1.0
Janitorial services ............................................................................................................................................................. 56172 1.8 1.1 0.6 0.5 0.7
Landscaping services ....................................................................................................................................................... 56173 3.7 2.3 1.0 1.3 1.4
Carpet and upholstery cleaning services .......................................................................................................................... 56174 - - - - -
Other support services ........................................................................................................................................................ 5619 2.0 0.6 0.5 - 1.3
Waste management and remediation services ....................................................................................................................... 562 2.4 1.1 0.5 0.6 1.3
Waste collection .................................................................................................................................................................. 5621 2.5 1.6 0.7 0.9 0.9
Waste collection ............................................................................................................................................................... 56211 2.5 1.6 0.7 0.9 0.9
Solid waste collection .................................................................................................................................................... 562111 2.3 1.5 0.7 0.9 -
Educational and health services ............................................................................................................................... 2.6 1.1 0.6 0.6 1.5
Educational services ....................................................................................................................................................... 61 1.3 0.4 0.3 0.1 0.9
Health care and social assistance .................................................................................................................................. 62 2.8 1.2 0.6 0.6 1.5
Ambulatory health care services ............................................................................................................................................. 621 1.3 0.5 0.3 0.2 0.8
Outpatient care centers ....................................................................................................................................................... 6214 0.7 0.1 0.1 - 0.5
Other outpatient care centers ........................................................................................................................................... 62149 0.7 0.1 0.1 - 0.6
Home health care services .................................................................................................................................................. 6216 1.4 0.6 0.4 0.2 0.8
See footnotes at end of table.
TABLE 1. Incidence rates1 of nonfatal occupational injuries and illnesses by industry and case types, Texas, 2015 -- Continued
NAICS Total
Cases with days away from work, job transfer, or restriction Other
Industry2 code3 recordable cases
Total
Cases with days away from
work4
Cases with job
transfer or restriction
recordable cases
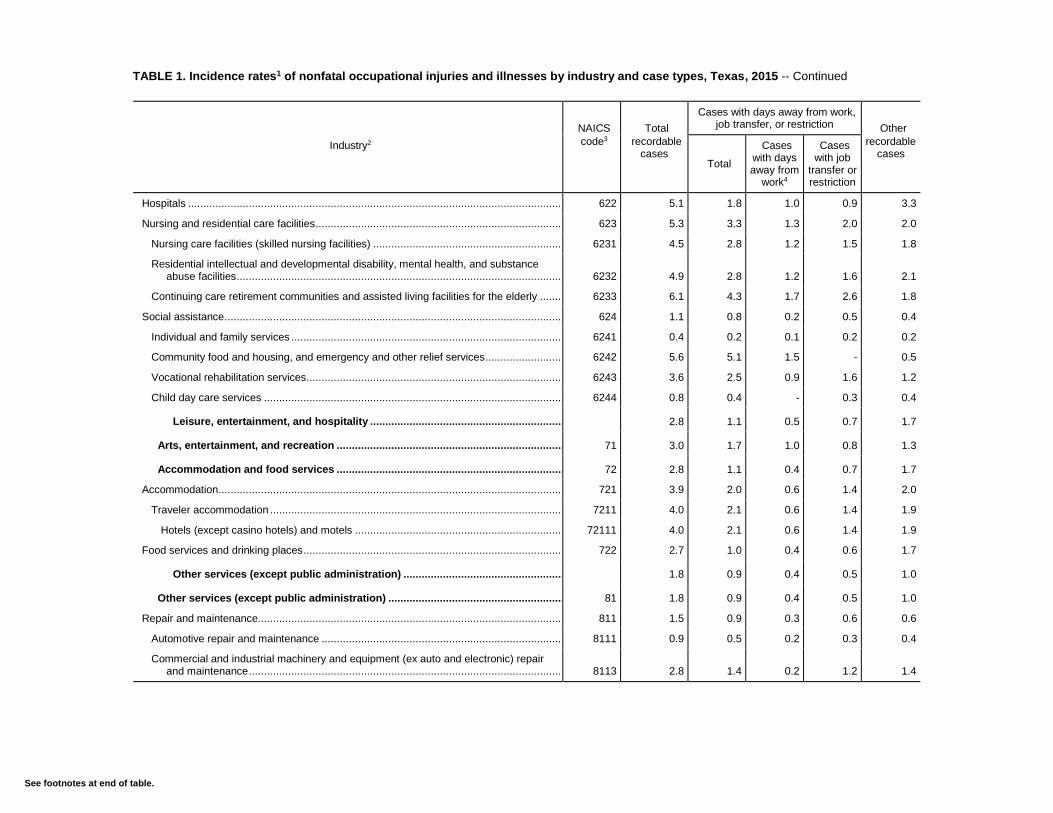
Hospitals ................................................................................................................................................................................ 622 5.1 1.8 1.0 0.9 3.3
Nursing and residential care facilities ...................................................................................................................................... 623 5.3 3.3 1.3 2.0 2.0
Nursing care facilities (skilled nursing facilities) ................................................................................................................... 6231 4.5 2.8 1.2 1.5 1.8
Residential intellectual and developmental disability, mental health, and substance abuse facilities ................................................................................................................................................................ 6232 4.9 2.8 1.2 1.6 2.1
Continuing care retirement communities and assisted living facilities for the elderly ............................................................ 6233 6.1 4.3 1.7 2.6 1.8
Social assistance .................................................................................................................................................................... 624 1.1 0.8 0.2 0.5 0.4
Individual and family services .............................................................................................................................................. 6241 0.4 0.2 0.1 0.2 0.2
Community food and housing, and emergency and other relief services .............................................................................. 6242 5.6 5.1 1.5 - 0.5
Vocational rehabilitation services ......................................................................................................................................... 6243 3.6 2.5 0.9 1.6 1.2
Child day care services ....................................................................................................................................................... 6244 0.8 0.4 - 0.3 0.4
Leisure, entertainment, and hospitality .................................................................................................................... 2.8 1.1 0.5 0.7 1.7
Arts, entertainment, and recreation ............................................................................................................................... 71 3.0 1.7 1.0 0.8 1.3
Accommodation and food services ............................................................................................................................... 72 2.8 1.1 0.4 0.7 1.7
Accommodation ...................................................................................................................................................................... 721 3.9 2.0 0.6 1.4 2.0
Traveler accommodation ..................................................................................................................................................... 7211 4.0 2.1 0.6 1.4 1.9
Hotels (except casino hotels) and motels ......................................................................................................................... 72111 4.0 2.1 0.6 1.4 1.9
Food services and drinking places .......................................................................................................................................... 722 2.7 1.0 0.4 0.6 1.7
Other services (except public administration) ......................................................................................................... 1.8 0.9 0.4 0.5 1.0
Other services (except public administration) .............................................................................................................. 81 1.8 0.9 0.4 0.5 1.0
Repair and maintenance......................................................................................................................................................... 811 1.5 0.9 0.3 0.6 0.6
Automotive repair and maintenance .................................................................................................................................... 8111 0.9 0.5 0.2 0.3 0.4
Commercial and industrial machinery and equipment (ex auto and electronic) repair and maintenance ............................................................................................................................................................ 8113 2.8 1.4 0.2 1.2 1.4

See footnotes at end of table.
TABLE 1. Incidence rates1 of nonfatal occupational injuries and illnesses by industry and case types, Texas, 2015 -- Continued
NAICS Total
Cases with days away from work, job transfer, or restriction Other
Industry2 code3 recordable cases
Total
Cases with days away from
work4
Cases with job
transfer or restriction
recordable cases
Personal and laundry services ................................................................................................................................................ 812 1.9 0.8 0.5 0.3 1.1
Drycleaning and laundry services ........................................................................................................................................ 8123 3.2 2.1 1.1 1.0 1.0
Religious, grantmaking, civic, professional, and similar organizations ..................................................................................... 813 2.6 1.0 0.4 0.6 1.6
Social advocacy organizations ............................................................................................................................................ 8133 9.2 1.4 0.5 - 7.8
Civic and social organizations ............................................................................................................................................. 8134 3.8 2.4 0.8 1.6 1.4
State and local government5 ........................................................................................................................... - - - - -
State government5 ............................................................................................................................................ - - - - -
Local government5 ........................................................................................................................................... - - - - -
Goods-producing5 ................................................................................................................................................. - 3.7 2.7 0.9 -
Construction ............................................................................................................................................................... - 3.7 2.7 0.9 -
Construction .................................................................................................................................................................... 23 - 3.7 2.7 0.9 -
Heavy and civil engineering construction ................................................................................................................................ 237 - 3.4 2.7 - -
Utilities ............................................................................................................................................................................. 22 10.5 6.3 5.4 0.9 -
Utilities ................................................................................................................................................................................... 221 10.5 6.3 5.4 0.9 -
Water, sewage and other systems ....................................................................................................................................... 2213 13.5 7.3 6.0 1.3 -
Health care and social assistance .................................................................................................................................. 62 2.0 0.6 0.5 0.2 1.4
Hospitals ................................................................................................................................................................................ 622 2.2 0.7 0.5 0.2 1.5
Public administration ................................................................................................................................................. 6.4 2.1 1.8 0.4 4.3
Public administration ...................................................................................................................................................... 92 6.4 2.1 1.8 0.4 4.3
Justice, public order, and safety activities ............................................................................................................................... 922 11.0 3.7 3.0 0.6 7.4

TABLE 1. Incidence rates1 of nonfatal occupational injuries and illnesses by industry and case types, Texas, 2015 -- Continued
NAICS Total
Cases with days away from work, job transfer, or restriction Other
Industry2 code3 recordable cases
Total
Cases with days away from
work4
Cases with job
transfer or restriction
recordable cases
Justice, public order, and safety activities ............................................................................................................................ 9221 11.0 3.7 3.0 0.6 7.4
Police protection ............................................................................................................................................................... 92212 15.2 4.1 3.3 0.7 11.1
Fire protection .................................................................................................................................................................. 92216 - 1.8 1.1 0.7 2.1
1 The incidence rates represent the number of injuries and illnesses per 100 full-time workers and were calculated as: (N/EH) x 200,000, where N = number of injuries and illnesses EH = total hours worked by all employees during the calendar year 200,000 = base for 100 equivalent full-time workers (working 40 hours per week, 50 weeks per year) 2 Totals include data for industries not shown separately. 3 North American Industry Classification System -- United States, 2012 4 Days-away-from-work cases include those that result in days away from work with or without job transfer or restriction. 5 Excludes farms with fewer than 11 employees. 6 Data for mining operators in this industry are provided to BLS by the Mine Safety and Health Administration, U.S. Department of Labor. Independent mining contractors are excluded. These data do not reflect the changes the Occupational Safety and Health Administration made to its recordkeeping requirements effective January 1, 2002; therefore, estimates for these industries are not comparable to estimates in other industries. 7 Data for employers in railroad transportation are provided to BLS by the Federal Railroad Administration, U.S. Department of Transportation. 8 Data too small to be displayed. NOTE: Because of rounding, components may not add to totals. Dash indicates data do not meet publication guidelines. SOURCE: U.S. Bureau of Labor Statistics, U.S. Department of Labor