table 1. number of nonfatal occupational injuries and ... of nonfatal occupational injuries and...
TRANSCRIPT
Total goods producing
Natural resources and
mining2,3Construction Manufacturing
Total service providing
Trade, transportation and utilities4
InformationFinancial activities
Professional and business
services
Education and health services
Leisure and hospitality
Other servicesPublic
Administration
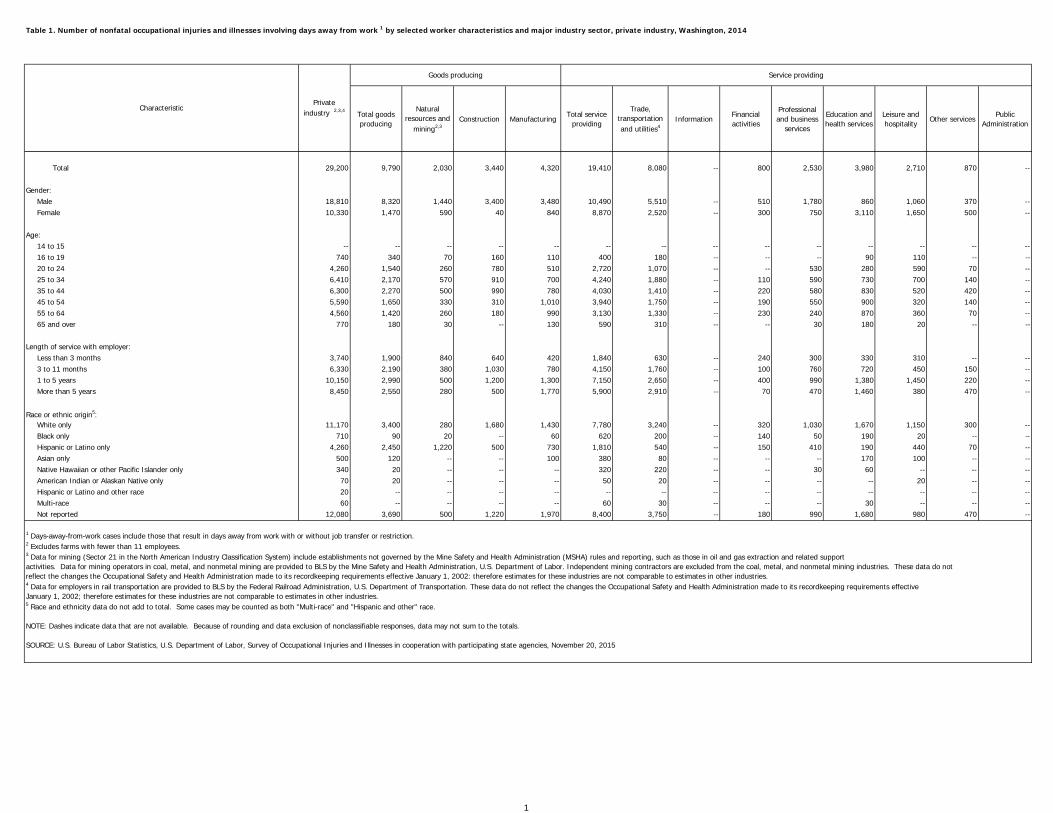
Total 29,200 9,790 2,030 3,440 4,320 19,410 8,080 -- 800 2,530 3,980 2,710 870 -- Gender: Male 18,810 8,320 1,440 3,400 3,480 10,490 5,510 -- 510 1,780 860 1,060 370 -- Female 10,330 1,470 590 40 840 8,870 2,520 -- 300 750 3,110 1,650 500 -- Age: 14 to 15 -- -- -- -- -- -- -- -- -- -- -- -- -- -- 16 to 19 740 340 70 160 110 400 180 -- -- -- 90 110 -- -- 20 to 24 4,260 1,540 260 780 510 2,720 1,070 -- -- 530 280 590 70 -- 25 to 34 6,410 2,170 570 910 700 4,240 1,880 -- 110 590 730 700 140 -- 35 to 44 6,300 2,270 500 990 780 4,030 1,410 -- 220 580 830 520 420 -- 45 to 54 5,590 1,650 330 310 1,010 3,940 1,750 -- 190 550 900 320 140 -- 55 to 64 4,560 1,420 260 180 990 3,130 1,330 -- 230 240 870 360 70 -- 65 and over 770 180 30 -- 130 590 310 -- -- 30 180 20 -- -- Length of service with employer: Less than 3 months 3,740 1,900 840 640 420 1,840 630 -- 240 300 330 310 -- -- 3 to 11 months 6,330 2,190 380 1,030 780 4,150 1,760 -- 100 760 720 450 150 -- 1 to 5 years 10,150 2,990 500 1,200 1,300 7,150 2,650 -- 400 990 1,380 1,450 220 -- More than 5 years 8,450 2,550 280 500 1,770 5,900 2,910 -- 70 470 1,460 380 470 --
Race or ethnic origin5: White only 11,170 3,400 280 1,680 1,430 7,780 3,240 -- 320 1,030 1,670 1,150 300 -- Black only 710 90 20 -- 60 620 200 -- 140 50 190 20 -- -- Hispanic or Latino only 4,260 2,450 1,220 500 730 1,810 540 -- 150 410 190 440 70 -- Asian only 500 120 -- -- 100 380 80 -- -- -- 170 100 -- -- Native Hawaiian or other Pacific Islander only 340 20 -- -- -- 320 220 -- -- 30 60 -- -- -- American Indian or Alaskan Native only 70 20 -- -- -- 50 20 -- -- -- -- 20 -- -- Hispanic or Latino and other race 20 -- -- -- -- -- -- -- -- -- -- -- -- -- Multi-race 60 -- -- -- -- 60 30 -- -- -- 30 -- -- -- Not reported 12,080 3,690 500 1,220 1,970 8,400 3,750 -- 180 990 1,680 980 470 --
Table 1. Number of nonfatal occupational injuries and illnesses involving days away from work 1 by selected worker characteristics and major industry sector, private industry, Washington, 2014
CharacteristicPrivate
industry 2,3,4
Goods producing Service providing
1 Days-away-from-work cases include those that result in days away from work with or without job transfer or restriction.2 Excludes farms with fewer than 11 employees.3 Data for mining (Sector 21 in the North American Industry Classification System) include establishments not governed by the Mine Safety and Health Administration (MSHA) rules and reporting, such as those in oil and gas extraction and related support activities. Data for mining operators in coal, metal, and nonmetal mining are provided to BLS by the Mine Safety and Health Administration, U.S. Department of Labor. Independent mining contractors are excluded from the coal, metal, and nonmetal mining industries. These data do not reflect the changes the Occupational Safety and Health Administration made to its recordkeeping requirements effective January 1, 2002: therefore estimates for these industries are not comparable to estimates in other industries.4 Data for employers in rail transportation are provided to BLS by the Federal Railroad Administration, U.S. Department of Transportation. These data do not reflect the changes the Occupational Safety and Health Administration made to its recordkeeping requirements effective January 1, 2002; therefore estimates for these industries are not comparable to estimates in other industries.5 Race and ethnicity data do not add to total. Some cases may be counted as both "Multi-race" and "Hispanic and other" race.
NOTE: Dashes indicate data that are not available. Because of rounding and data exclusion of nonclassifiable responses, data may not sum to the totals.
SOURCE: U.S. Bureau of Labor Statistics, U.S. Department of Labor, Survey of Occupational Injuries and Illnesses in cooperation with participating state agencies, November 20, 2015
1
Total goods producing
Natural resources and
mining2,3Construction Manufacturing
Total service providing
Trade, transportation and utilities4
InformationFinancial activities
Professional and business
services
Education and health
services
Leisure and hospitality
Other servicesPublic
Administration
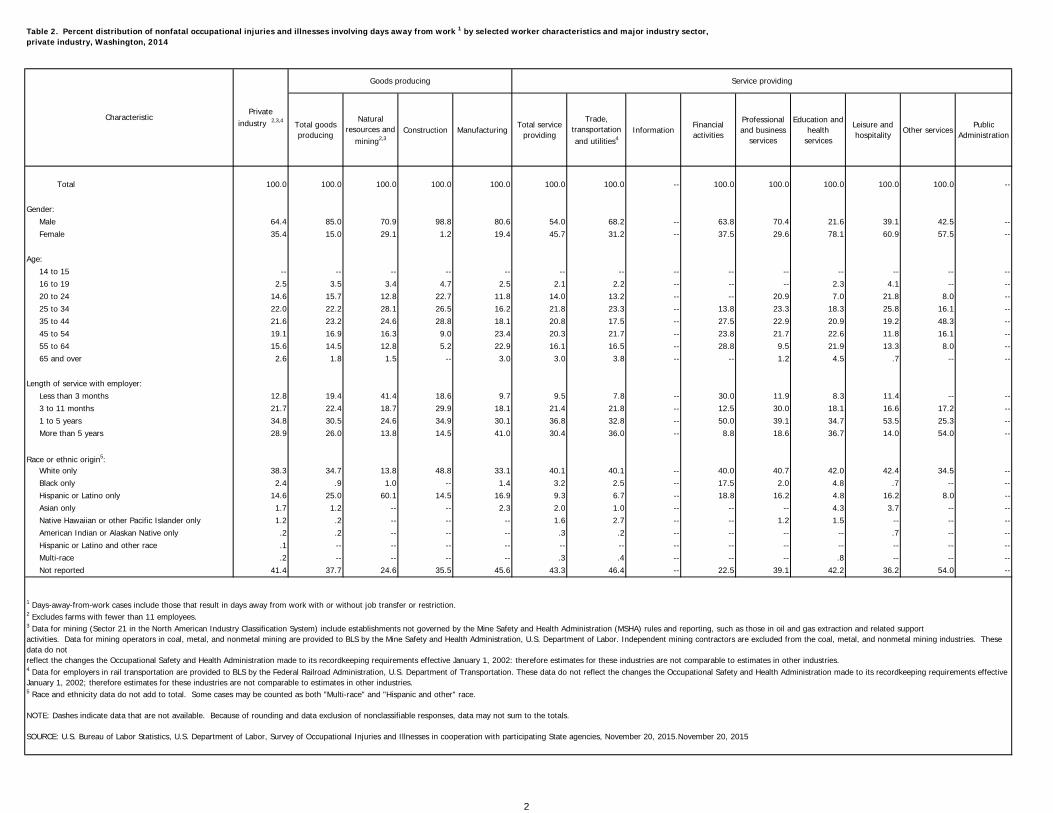
Total 100.0 100.0 100.0 100.0 100.0 100.0 100.0 -- 100.0 100.0 100.0 100.0 100.0 -- Gender: Male 64.4 85.0 70.9 98.8 80.6 54.0 68.2 -- 63.8 70.4 21.6 39.1 42.5 -- Female 35.4 15.0 29.1 1.2 19.4 45.7 31.2 -- 37.5 29.6 78.1 60.9 57.5 -- Age: 14 to 15 -- -- -- -- -- -- -- -- -- -- -- -- -- -- 16 to 19 2.5 3.5 3.4 4.7 2.5 2.1 2.2 -- -- -- 2.3 4.1 -- -- 20 to 24 14.6 15.7 12.8 22.7 11.8 14.0 13.2 -- -- 20.9 7.0 21.8 8.0 -- 25 to 34 22.0 22.2 28.1 26.5 16.2 21.8 23.3 -- 13.8 23.3 18.3 25.8 16.1 -- 35 to 44 21.6 23.2 24.6 28.8 18.1 20.8 17.5 -- 27.5 22.9 20.9 19.2 48.3 -- 45 to 54 19.1 16.9 16.3 9.0 23.4 20.3 21.7 -- 23.8 21.7 22.6 11.8 16.1 -- 55 to 64 15.6 14.5 12.8 5.2 22.9 16.1 16.5 -- 28.8 9.5 21.9 13.3 8.0 -- 65 and over 2.6 1.8 1.5 -- 3.0 3.0 3.8 -- -- 1.2 4.5 .7 -- -- Length of service with employer: Less than 3 months 12.8 19.4 41.4 18.6 9.7 9.5 7.8 -- 30.0 11.9 8.3 11.4 -- -- 3 to 11 months 21.7 22.4 18.7 29.9 18.1 21.4 21.8 -- 12.5 30.0 18.1 16.6 17.2 -- 1 to 5 years 34.8 30.5 24.6 34.9 30.1 36.8 32.8 -- 50.0 39.1 34.7 53.5 25.3 -- More than 5 years 28.9 26.0 13.8 14.5 41.0 30.4 36.0 -- 8.8 18.6 36.7 14.0 54.0 --
Race or ethnic origin5: White only 38.3 34.7 13.8 48.8 33.1 40.1 40.1 -- 40.0 40.7 42.0 42.4 34.5 -- Black only 2.4 .9 1.0 -- 1.4 3.2 2.5 -- 17.5 2.0 4.8 .7 -- -- Hispanic or Latino only 14.6 25.0 60.1 14.5 16.9 9.3 6.7 -- 18.8 16.2 4.8 16.2 8.0 -- Asian only 1.7 1.2 -- -- 2.3 2.0 1.0 -- -- -- 4.3 3.7 -- -- Native Hawaiian or other Pacific Islander only 1.2 .2 -- -- -- 1.6 2.7 -- -- 1.2 1.5 -- -- -- American Indian or Alaskan Native only .2 .2 -- -- -- .3 .2 -- -- -- -- .7 -- -- Hispanic or Latino and other race .1 -- -- -- -- -- -- -- -- -- -- -- -- -- Multi-race .2 -- -- -- -- .3 .4 -- -- -- .8 -- -- -- Not reported 41.4 37.7 24.6 35.5 45.6 43.3 46.4 -- 22.5 39.1 42.2 36.2 54.0 --
Table 2. Percent distribution of nonfatal occupational injuries and illnesses involving days away from work 1 by selected worker characteristics and major industry sector, private industry, Washington, 2014
CharacteristicPrivate
industry 2,3,4
Goods producing Service providing
1 Days-away-from-work cases include those that result in days away from work with or without job transfer or restriction.2 Excludes farms with fewer than 11 employees.3 Data for mining (Sector 21 in the North American Industry Classification System) include establishments not governed by the Mine Safety and Health Administration (MSHA) rules and reporting, such as those in oil and gas extraction and related support activities. Data for mining operators in coal, metal, and nonmetal mining are provided to BLS by the Mine Safety and Health Administration, U.S. Department of Labor. Independent mining contractors are excluded from the coal, metal, and nonmetal mining industries. These data do not reflect the changes the Occupational Safety and Health Administration made to its recordkeeping requirements effective January 1, 2002: therefore estimates for these industries are not comparable to estimates in other industries.4 Data for employers in rail transportation are provided to BLS by the Federal Railroad Administration, U.S. Department of Transportation. These data do not reflect the changes the Occupational Safety and Health Administration made to its recordkeeping requirements effective January 1, 2002; therefore estimates for these industries are not comparable to estimates in other industries.5 Race and ethnicity data do not add to total. Some cases may be counted as both "Multi-race" and "Hispanic and other" race.
NOTE: Dashes indicate data that are not available. Because of rounding and data exclusion of nonclassifiable responses, data may not sum to the totals.
SOURCE: U.S. Bureau of Labor Statistics, U.S. Department of Labor, Survey of Occupational Injuries and Illnesses in cooperation with participating State agencies, November 20, 2015.November 20, 2015
2
Total goods producing
Natural resources and
mining2,3Construction Manufacturing
Total service providing
Trade, transportation and utilities4
InformationFinancial activities
Professional and business
services
Education and health services
Leisure and hospitality
Other servicesPublic
Administration
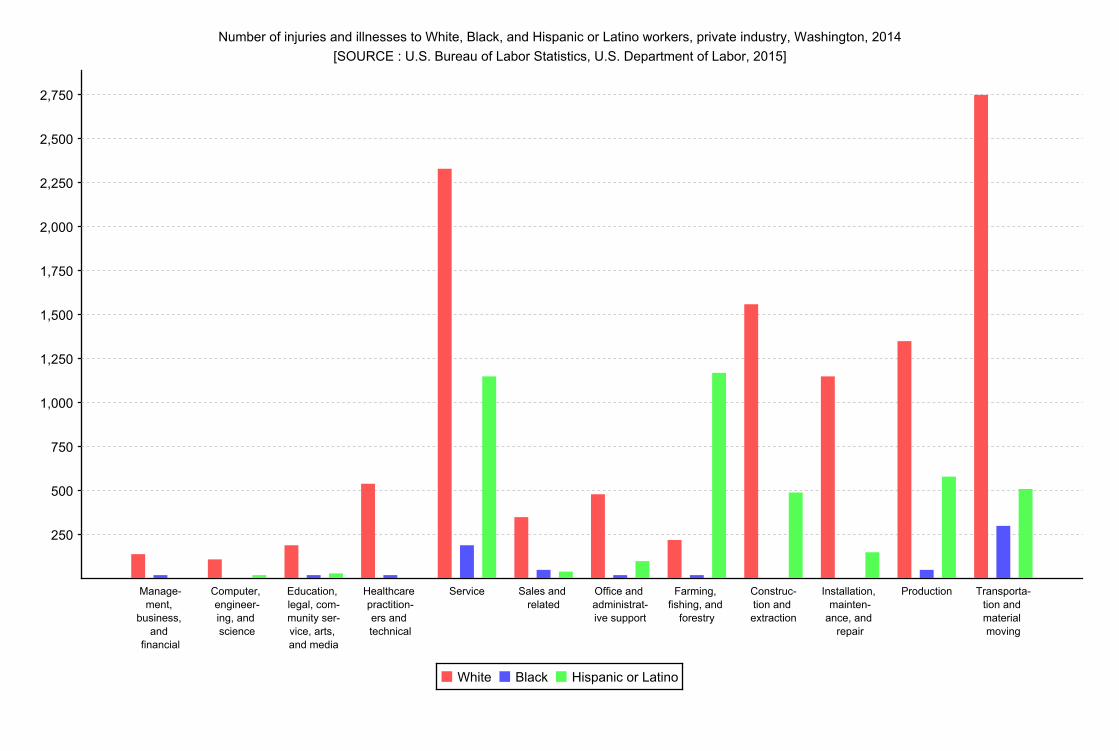
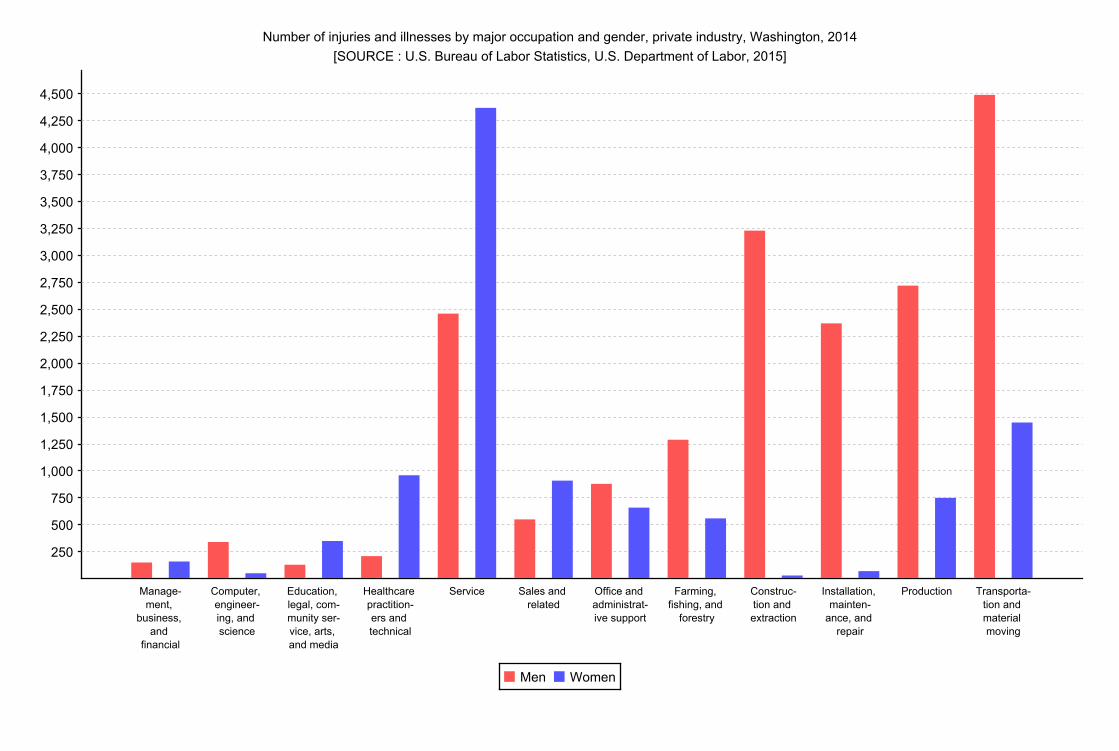
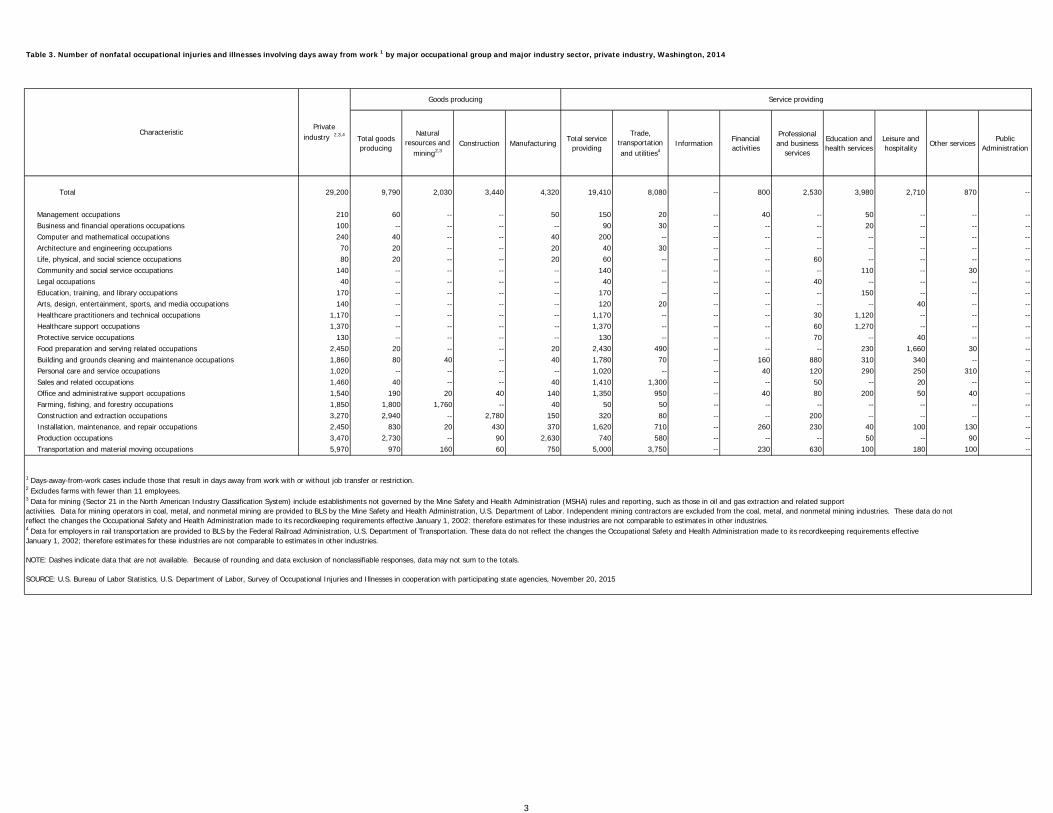
Total 29,200 9,790 2,030 3,440 4,320 19,410 8,080 -- 800 2,530 3,980 2,710 870 -- Management occupations 210 60 -- -- 50 150 20 -- 40 -- 50 -- -- -- Business and financial operations occupations 100 -- -- -- -- 90 30 -- -- -- 20 -- -- -- Computer and mathematical occupations 240 40 -- -- 40 200 -- -- -- -- -- -- -- -- Architecture and engineering occupations 70 20 -- -- 20 40 30 -- -- -- -- -- -- -- Life, physical, and social science occupations 80 20 -- -- 20 60 -- -- -- 60 -- -- -- -- Community and social service occupations 140 -- -- -- -- 140 -- -- -- -- 110 -- 30 -- Legal occupations 40 -- -- -- -- 40 -- -- -- 40 -- -- -- -- Education, training, and library occupations 170 -- -- -- -- 170 -- -- -- -- 150 -- -- -- Arts, design, entertainment, sports, and media occupations 140 -- -- -- -- 120 20 -- -- -- -- 40 -- -- Healthcare practitioners and technical occupations 1,170 -- -- -- -- 1,170 -- -- -- 30 1,120 -- -- -- Healthcare support occupations 1,370 -- -- -- -- 1,370 -- -- -- 60 1,270 -- -- -- Protective service occupations 130 -- -- -- -- 130 -- -- -- 70 -- 40 -- -- Food preparation and serving related occupations 2,450 20 -- -- 20 2,430 490 -- -- -- 230 1,660 30 -- Building and grounds cleaning and maintenance occupations 1,860 80 40 -- 40 1,780 70 -- 160 880 310 340 -- -- Personal care and service occupations 1,020 -- -- -- -- 1,020 -- -- 40 120 290 250 310 -- Sales and related occupations 1,460 40 -- -- 40 1,410 1,300 -- -- 50 -- 20 -- -- Office and administrative support occupations 1,540 190 20 40 140 1,350 950 -- 40 80 200 50 40 -- Farming, fishing, and forestry occupations 1,850 1,800 1,760 -- 40 50 50 -- -- -- -- -- -- -- Construction and extraction occupations 3,270 2,940 -- 2,780 150 320 80 -- -- 200 -- -- -- -- Installation, maintenance, and repair occupations 2,450 830 20 430 370 1,620 710 -- 260 230 40 100 130 -- Production occupations 3,470 2,730 -- 90 2,630 740 580 -- -- -- 50 -- 90 -- Transportation and material moving occupations 5,970 970 160 60 750 5,000 3,750 -- 230 630 100 180 100 --
Table 3. Number of nonfatal occupational injuries and illnesses involving days away from work 1 by major occupational group and major industry sector, private industry, Washington, 2014
CharacteristicPrivate
industry 2,3,4
Goods producing Service providing
1 Days-away-from-work cases include those that result in days away from work with or without job transfer or restriction.2 Excludes farms with fewer than 11 employees.3 Data for mining (Sector 21 in the North American Industry Classification System) include establishments not governed by the Mine Safety and Health Administration (MSHA) rules and reporting, such as those in oil and gas extraction and related support activities. Data for mining operators in coal, metal, and nonmetal mining are provided to BLS by the Mine Safety and Health Administration, U.S. Department of Labor. Independent mining contractors are excluded from the coal, metal, and nonmetal mining industries. These data do not reflect the changes the Occupational Safety and Health Administration made to its recordkeeping requirements effective January 1, 2002: therefore estimates for these industries are not comparable to estimates in other industries.4 Data for employers in rail transportation are provided to BLS by the Federal Railroad Administration, U.S. Department of Transportation. These data do not reflect the changes the Occupational Safety and Health Administration made to its recordkeeping requirements effective January 1, 2002; therefore estimates for these industries are not comparable to estimates in other industries.
NOTE: Dashes indicate data that are not available. Because of rounding and data exclusion of nonclassifiable responses, data may not sum to the totals.
SOURCE: U.S. Bureau of Labor Statistics, U.S. Department of Labor, Survey of Occupational Injuries and Illnesses in cooperation with participating state agencies, November 20, 2015
3
Total goods producing
Natural resources and
mining2,3Construction Manufacturing
Total service providing
Trade, transportation and utilities4
InformationFinancial activities
Professional and business
services
Education and health services
Leisure and hospitality
Other servicesPublic
Administration
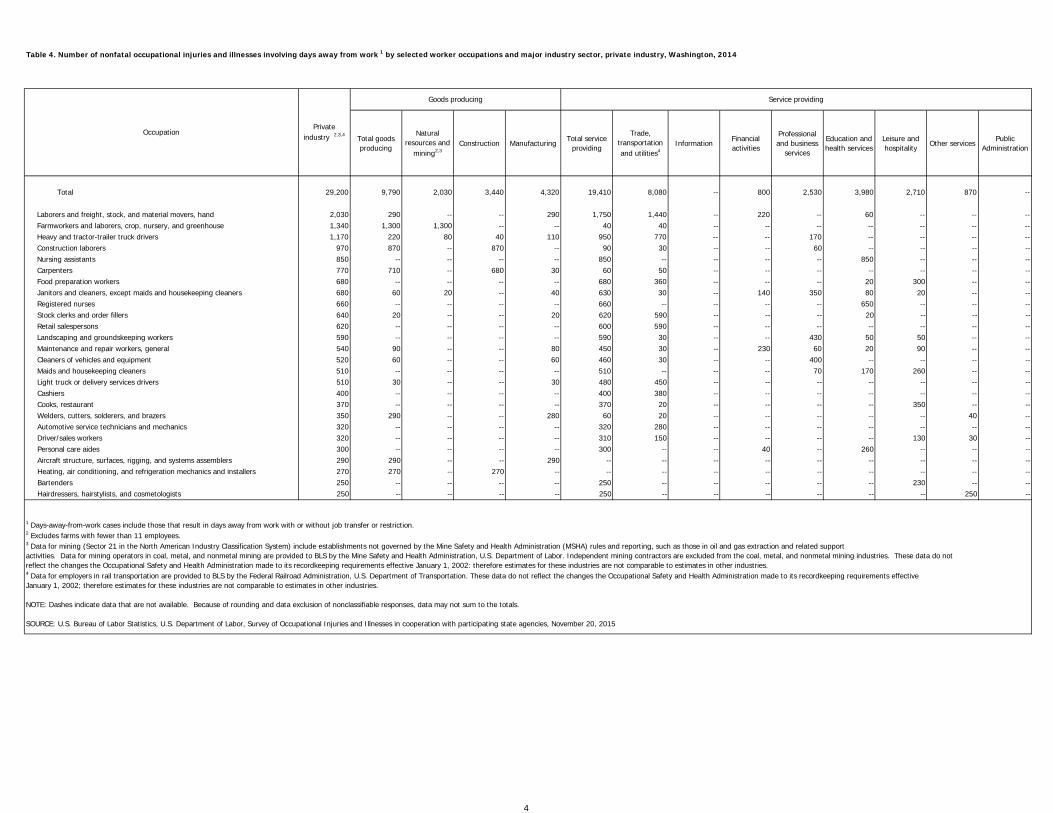
Total 29,200 9,790 2,030 3,440 4,320 19,410 8,080 -- 800 2,530 3,980 2,710 870 -- Laborers and freight, stock, and material movers, hand 2,030 290 -- -- 290 1,750 1,440 -- 220 -- 60 -- -- -- Farmworkers and laborers, crop, nursery, and greenhouse 1,340 1,300 1,300 -- -- 40 40 -- -- -- -- -- -- -- Heavy and tractor-trailer truck drivers 1,170 220 80 40 110 950 770 -- -- 170 -- -- -- -- Construction laborers 970 870 -- 870 -- 90 30 -- -- 60 -- -- -- -- Nursing assistants 850 -- -- -- -- 850 -- -- -- -- 850 -- -- -- Carpenters 770 710 -- 680 30 60 50 -- -- -- -- -- -- -- Food preparation workers 680 -- -- -- -- 680 360 -- -- -- 20 300 -- -- Janitors and cleaners, except maids and housekeeping cleaners 680 60 20 -- 40 630 30 -- 140 350 80 20 -- -- Registered nurses 660 -- -- -- -- 660 -- -- -- -- 650 -- -- -- Stock clerks and order fillers 640 20 -- -- 20 620 590 -- -- -- 20 -- -- -- Retail salespersons 620 -- -- -- -- 600 590 -- -- -- -- -- -- -- Landscaping and groundskeeping workers 590 -- -- -- -- 590 30 -- -- 430 50 50 -- -- Maintenance and repair workers, general 540 90 -- -- 80 450 30 -- 230 60 20 90 -- -- Cleaners of vehicles and equipment 520 60 -- -- 60 460 30 -- -- 400 -- -- -- -- Maids and housekeeping cleaners 510 -- -- -- -- 510 -- -- -- 70 170 260 -- -- Light truck or delivery services drivers 510 30 -- -- 30 480 450 -- -- -- -- -- -- -- Cashiers 400 -- -- -- -- 400 380 -- -- -- -- -- -- -- Cooks, restaurant 370 -- -- -- -- 370 20 -- -- -- -- 350 -- -- Welders, cutters, solderers, and brazers 350 290 -- -- 280 60 20 -- -- -- -- -- 40 -- Automotive service technicians and mechanics 320 -- -- -- -- 320 280 -- -- -- -- -- -- -- Driver/sales workers 320 -- -- -- -- 310 150 -- -- -- -- 130 30 -- Personal care aides 300 -- -- -- -- 300 -- -- 40 -- 260 -- -- -- Aircraft structure, surfaces, rigging, and systems assemblers 290 290 -- -- 290 -- -- -- -- -- -- -- -- -- Heating, air conditioning, and refrigeration mechanics and installers 270 270 -- 270 -- -- -- -- -- -- -- -- -- -- Bartenders 250 -- -- -- -- 250 -- -- -- -- -- 230 -- -- Hairdressers, hairstylists, and cosmetologists 250 -- -- -- -- 250 -- -- -- -- -- -- 250 --
Table 4. Number of nonfatal occupational injuries and illnesses involving days away from work 1 by selected worker occupations and major industry sector, private industry, Washington, 2014
OccupationPrivate
industry 2,3,4
Goods producing Service providing
1 Days-away-from-work cases include those that result in days away from work with or without job transfer or restriction.2 Excludes farms with fewer than 11 employees.3 Data for mining (Sector 21 in the North American Industry Classification System) include establishments not governed by the Mine Safety and Health Administration (MSHA) rules and reporting, such as those in oil and gas extraction and related support activities. Data for mining operators in coal, metal, and nonmetal mining are provided to BLS by the Mine Safety and Health Administration, U.S. Department of Labor. Independent mining contractors are excluded from the coal, metal, and nonmetal mining industries. These data do not reflect the changes the Occupational Safety and Health Administration made to its recordkeeping requirements effective January 1, 2002: therefore estimates for these industries are not comparable to estimates in other industries.4 Data for employers in rail transportation are provided to BLS by the Federal Railroad Administration, U.S. Department of Transportation. These data do not reflect the changes the Occupational Safety and Health Administration made to its recordkeeping requirements effective January 1, 2002; therefore estimates for these industries are not comparable to estimates in other industries.
NOTE: Dashes indicate data that are not available. Because of rounding and data exclusion of nonclassifiable responses, data may not sum to the totals.
SOURCE: U.S. Bureau of Labor Statistics, U.S. Department of Labor, Survey of Occupational Injuries and Illnesses in cooperation with participating state agencies, November 20, 2015
4
Total goods producing
Natural resources and
mining2,3Construction Manufacturing
Total service providing
Trade, transportation and utilities4
InformationFinancial activities
Professional and business
services
Education and health services
Leisure and hospitality
Other servicesPublic
Administration
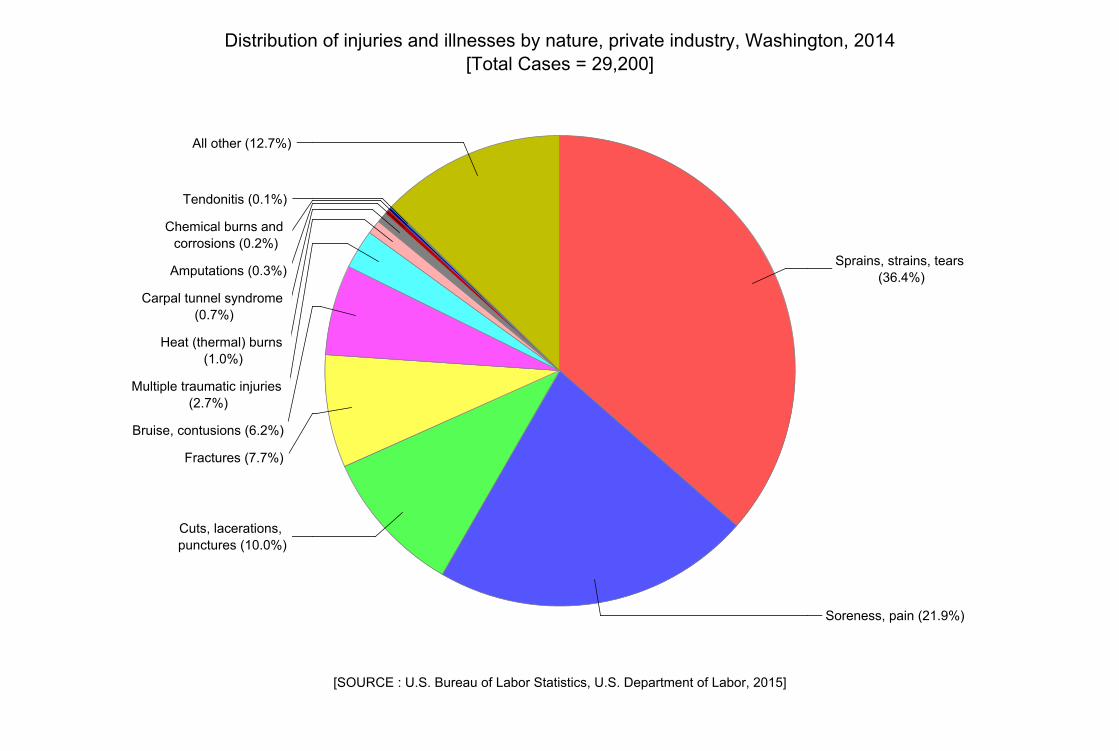
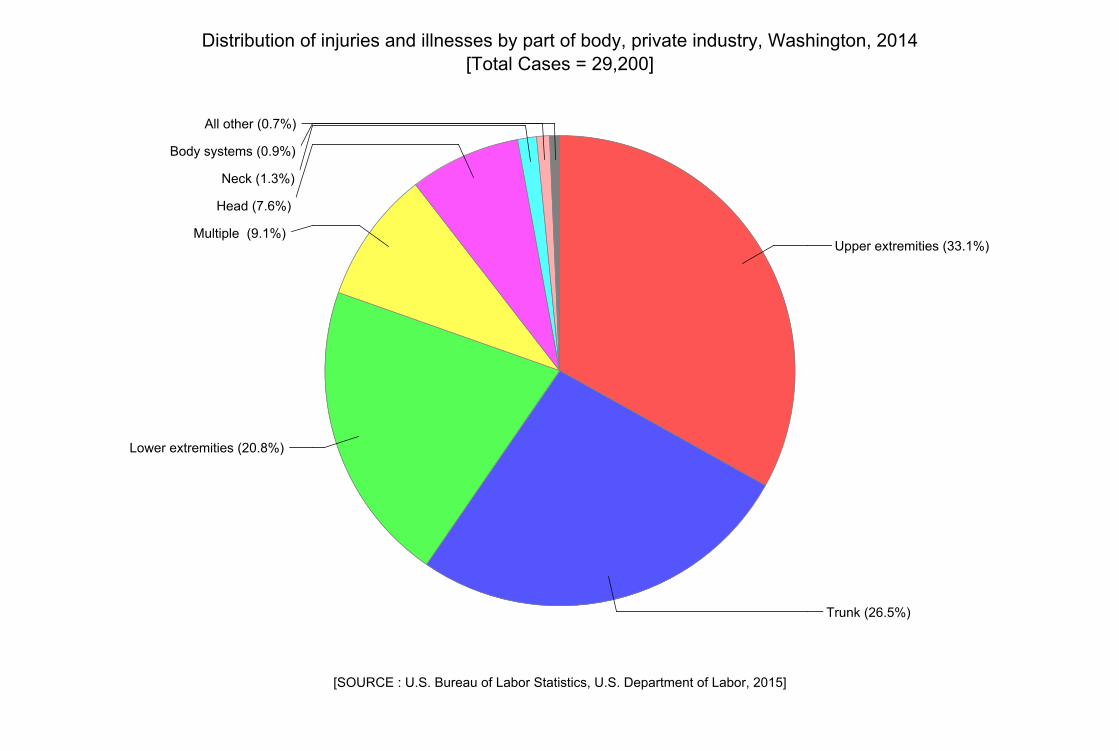
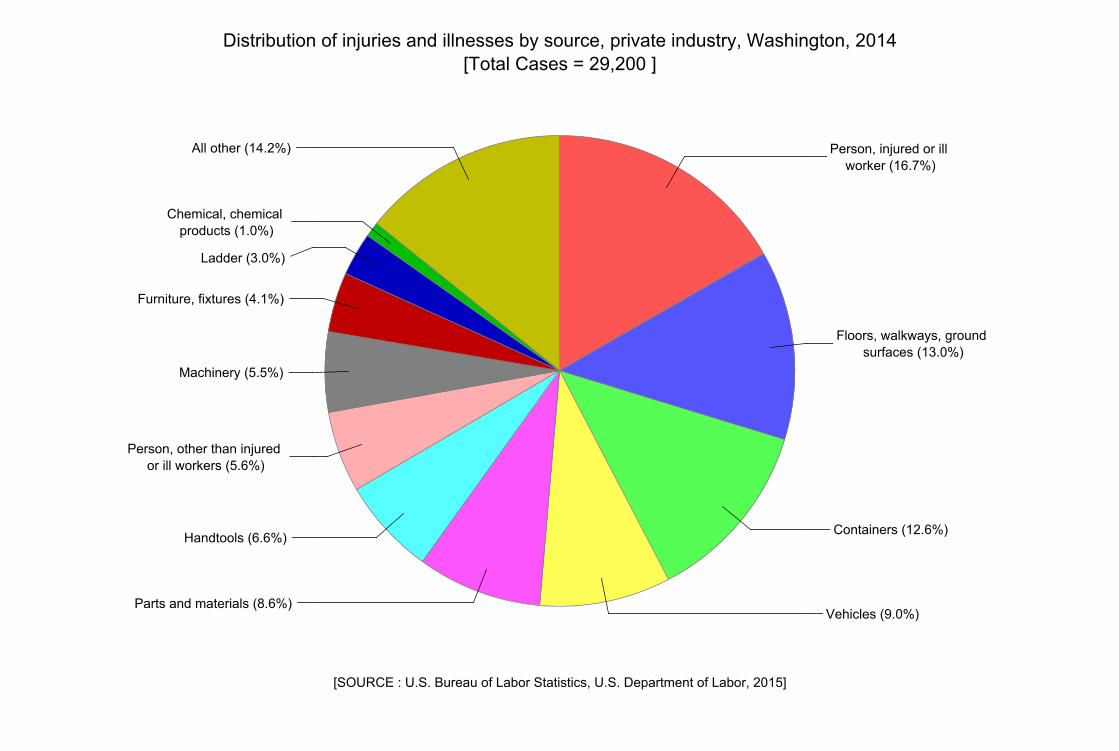
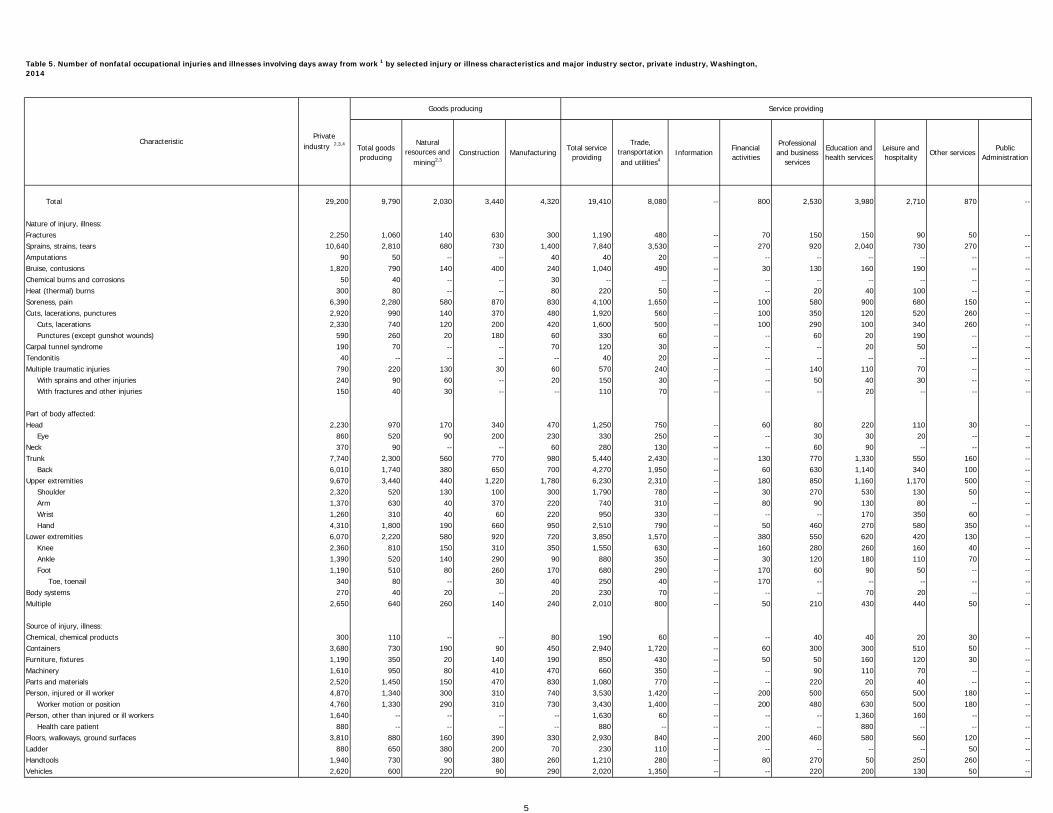
Total 29,200 9,790 2,030 3,440 4,320 19,410 8,080 -- 800 2,530 3,980 2,710 870 -- Nature of injury, illness: Fractures 2,250 1,060 140 630 300 1,190 480 -- 70 150 150 90 50 --Sprains, strains, tears 10,640 2,810 680 730 1,400 7,840 3,530 -- 270 920 2,040 730 270 --Amputations 90 50 -- -- 40 40 20 -- -- -- -- -- -- --Bruise, contusions 1,820 790 140 400 240 1,040 490 -- 30 130 160 190 -- --Chemical burns and corrosions 50 40 -- -- 30 -- -- -- -- -- -- -- -- --Heat (thermal) burns 300 80 -- -- 80 220 50 -- -- 20 40 100 -- --Soreness, pain 6,390 2,280 580 870 830 4,100 1,650 -- 100 580 900 680 150 --Cuts, lacerations, punctures 2,920 990 140 370 480 1,920 560 -- 100 350 120 520 260 -- Cuts, lacerations 2,330 740 120 200 420 1,600 500 -- 100 290 100 340 260 -- Punctures (except gunshot wounds) 590 260 20 180 60 330 60 -- -- 60 20 190 -- --Carpal tunnel syndrome 190 70 -- -- 70 120 30 -- -- -- 20 50 -- --Tendonitis 40 -- -- -- -- 40 20 -- -- -- -- -- -- --Multiple traumatic injuries 790 220 130 30 60 570 240 -- -- 140 110 70 -- -- With sprains and other injuries 240 90 60 -- 20 150 30 -- -- 50 40 30 -- -- With fractures and other injuries 150 40 30 -- -- 110 70 -- -- -- 20 -- -- -- Part of body affected: Head 2,230 970 170 340 470 1,250 750 -- 60 80 220 110 30 -- Eye 860 520 90 200 230 330 250 -- -- 30 30 20 -- --Neck 370 90 -- -- 60 280 130 -- -- 60 90 -- -- --Trunk 7,740 2,300 560 770 980 5,440 2,430 -- 130 770 1,330 550 160 -- Back 6,010 1,740 380 650 700 4,270 1,950 -- 60 630 1,140 340 100 --Upper extremities 9,670 3,440 440 1,220 1,780 6,230 2,310 -- 180 850 1,160 1,170 500 -- Shoulder 2,320 520 130 100 300 1,790 780 -- 30 270 530 130 50 -- Arm 1,370 630 40 370 220 740 310 -- 80 90 130 80 -- -- Wrist 1,260 310 40 60 220 950 330 -- -- -- 170 350 60 -- Hand 4,310 1,800 190 660 950 2,510 790 -- 50 460 270 580 350 --Lower extremities 6,070 2,220 580 920 720 3,850 1,570 -- 380 550 620 420 130 -- Knee 2,360 810 150 310 350 1,550 630 -- 160 280 260 160 40 -- Ankle 1,390 520 140 290 90 880 350 -- 30 120 180 110 70 -- Foot 1,190 510 80 260 170 680 290 -- 170 60 90 50 -- -- Toe, toenail 340 80 -- 30 40 250 40 -- 170 -- -- -- -- --Body systems 270 40 20 -- 20 230 70 -- -- -- 70 20 -- --Multiple 2,650 640 260 140 240 2,010 800 -- 50 210 430 440 50 -- Source of injury, illness: Chemical, chemical products 300 110 -- -- 80 190 60 -- -- 40 40 20 30 --Containers 3,680 730 190 90 450 2,940 1,720 -- 60 300 300 510 50 --Furniture, fixtures 1,190 350 20 140 190 850 430 -- 50 50 160 120 30 --Machinery 1,610 950 80 410 470 660 350 -- -- 90 110 70 -- --Parts and materials 2,520 1,450 150 470 830 1,080 770 -- -- 220 20 40 -- --Person, injured or ill worker 4,870 1,340 300 310 740 3,530 1,420 -- 200 500 650 500 180 -- Worker motion or position 4,760 1,330 290 310 730 3,430 1,400 -- 200 480 630 500 180 --Person, other than injured or ill workers 1,640 -- -- -- -- 1,630 60 -- -- -- 1,360 160 -- -- Health care patient 880 -- -- -- -- 880 -- -- -- -- 880 -- -- --Floors, walkways, ground surfaces 3,810 880 160 390 330 2,930 840 -- 200 460 580 560 120 --Ladder 880 650 380 200 70 230 110 -- -- -- -- -- 50 --Handtools 1,940 730 90 380 260 1,210 280 -- 80 270 50 250 260 --Vehicles 2,620 600 220 90 290 2,020 1,350 -- -- 220 200 130 50 --
Table 5. Number of nonfatal occupational injuries and illnesses involving days away from work 1 by selected injury or illness characteristics and major industry sector, private industry, Washington, 2014
CharacteristicPrivate
industry 2,3,4
Goods producing Service providing
5
Total goods producing
Natural resources and
mining2,3Construction Manufacturing
Total service providing
Trade, transportation and utilities4
InformationFinancial activities
Professional and business
services
Education and health services
Leisure and hospitality
Other servicesPublic
Administration
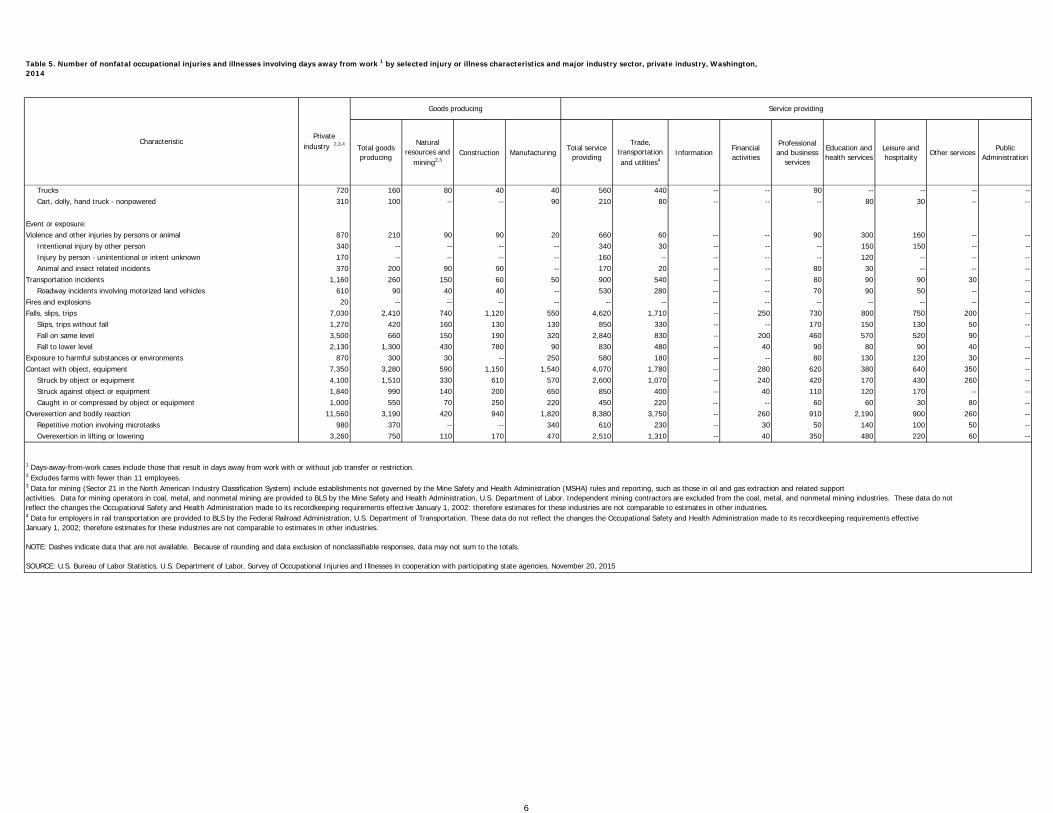
Table 5. Number of nonfatal occupational injuries and illnesses involving days away from work 1 by selected injury or illness characteristics and major industry sector, private industry, Washington, 2014
CharacteristicPrivate
industry 2,3,4
Goods producing Service providing
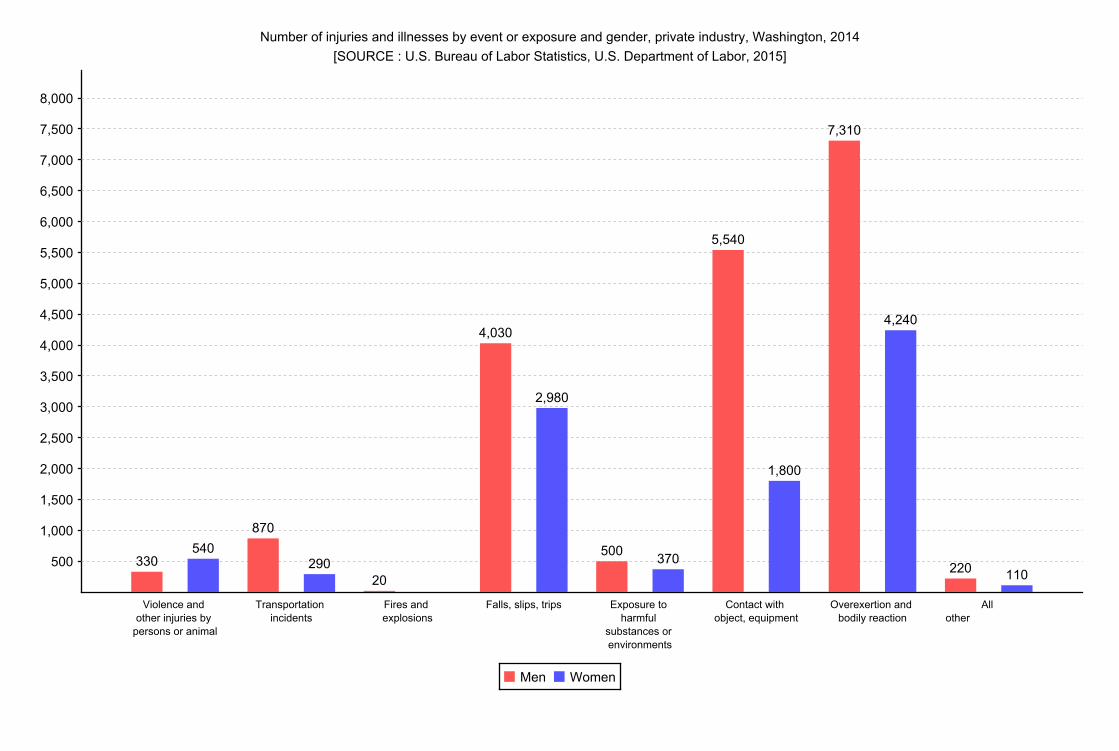
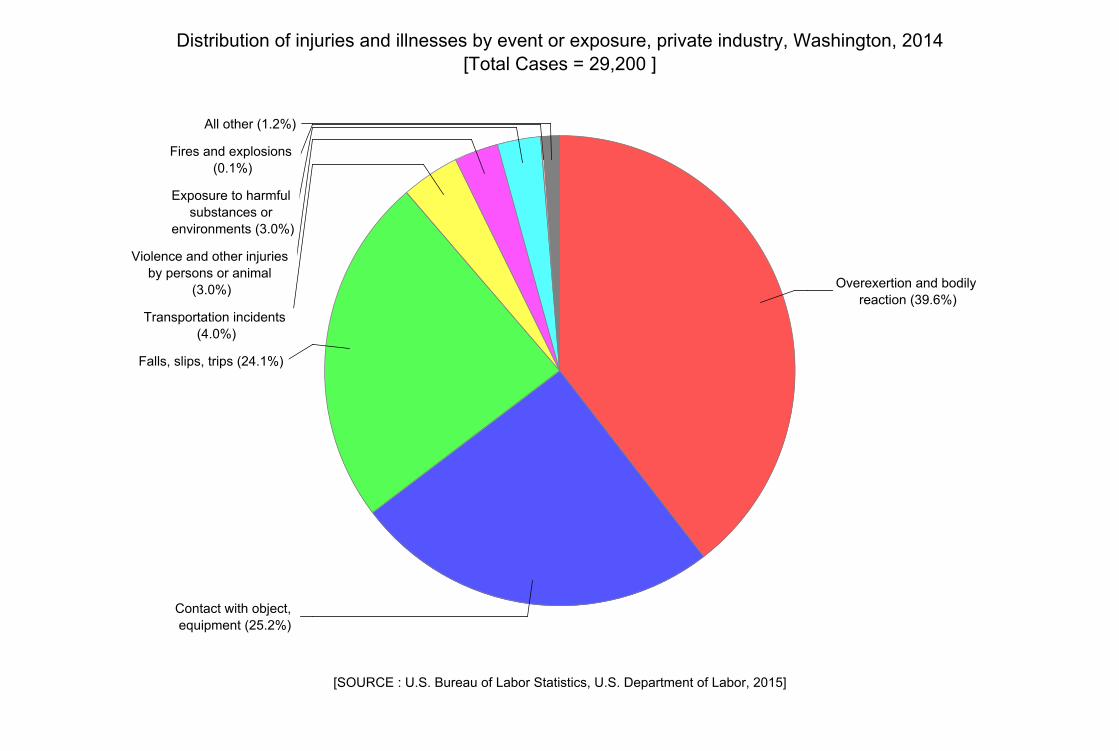
Trucks 720 160 80 40 40 560 440 -- -- 90 -- -- -- -- Cart, dolly, hand truck - nonpowered 310 100 -- -- 90 210 80 -- -- -- 80 30 -- -- Event or exposure: Violence and other injuries by persons or animal 870 210 90 90 20 660 60 -- -- 90 300 160 -- -- Intentional injury by other person 340 -- -- -- -- 340 30 -- -- -- 150 150 -- -- Injury by person - unintentional or intent unknown 170 -- -- -- -- 160 -- -- -- -- 120 -- -- -- Animal and insect related incidents 370 200 90 90 -- 170 20 -- -- 80 30 -- -- --Transportation incidents 1,160 260 150 60 50 900 540 -- -- 80 90 90 30 -- Roadway incidents involving motorized land vehicles 610 90 40 40 -- 530 280 -- -- 70 90 50 -- --Fires and explosions 20 -- -- -- -- -- -- -- -- -- -- -- -- --Falls, slips, trips 7,030 2,410 740 1,120 550 4,620 1,710 -- 250 730 800 750 200 -- Slips, trips without fall 1,270 420 160 130 130 850 330 -- -- 170 150 130 50 -- Fall on same level 3,500 660 150 190 320 2,840 830 -- 200 460 570 520 90 -- Fall to lower level 2,130 1,300 430 780 90 830 480 -- 40 90 80 90 40 --Exposure to harmful substances or environments 870 300 30 -- 250 580 180 -- -- 80 130 120 30 --Contact with object, equipment 7,350 3,280 590 1,150 1,540 4,070 1,780 -- 280 620 380 640 350 -- Struck by object or equipment 4,100 1,510 330 610 570 2,600 1,070 -- 240 420 170 430 260 -- Struck against object or equipment 1,840 990 140 200 650 850 400 -- 40 110 120 170 -- -- Caught in or compressed by object or equipment 1,000 550 70 250 220 450 220 -- -- 60 60 30 80 --Overexertion and bodily reaction 11,560 3,190 420 940 1,820 8,380 3,750 -- 260 910 2,190 900 260 -- Repetitive motion involving microtasks 980 370 -- -- 340 610 230 -- 30 50 140 100 50 -- Overexertion in lifting or lowering 3,260 750 110 170 470 2,510 1,310 -- 40 350 480 220 60 --
1 Days-away-from-work cases include those that result in days away from work with or without job transfer or restriction.2 Excludes farms with fewer than 11 employees.3 Data for mining (Sector 21 in the North American Industry Classification System) include establishments not governed by the Mine Safety and Health Administration (MSHA) rules and reporting, such as those in oil and gas extraction and related support activities. Data for mining operators in coal, metal, and nonmetal mining are provided to BLS by the Mine Safety and Health Administration, U.S. Department of Labor. Independent mining contractors are excluded from the coal, metal, and nonmetal mining industries. These data do not reflect the changes the Occupational Safety and Health Administration made to its recordkeeping requirements effective January 1, 2002: therefore estimates for these industries are not comparable to estimates in other industries.4 Data for employers in rail transportation are provided to BLS by the Federal Railroad Administration, U.S. Department of Transportation. These data do not reflect the changes the Occupational Safety and Health Administration made to its recordkeeping requirements effective January 1, 2002; therefore estimates for these industries are not comparable to estimates in other industries.
NOTE: Dashes indicate data that are not available. Because of rounding and data exclusion of nonclassifiable responses, data may not sum to the totals.
SOURCE: U.S. Bureau of Labor Statistics, U.S. Department of Labor, Survey of Occupational Injuries and Illnesses in cooperation with participating state agencies, November 20, 2015
6
Total goods producing
Natural resources and
mining2,3Construction Manufacturing
Total service providing
Trade, transportation and utilities4
InformationFinancial activities
Professional and business
services
Education and health services
Leisure and hospitality
Other servicesPublic
Administration
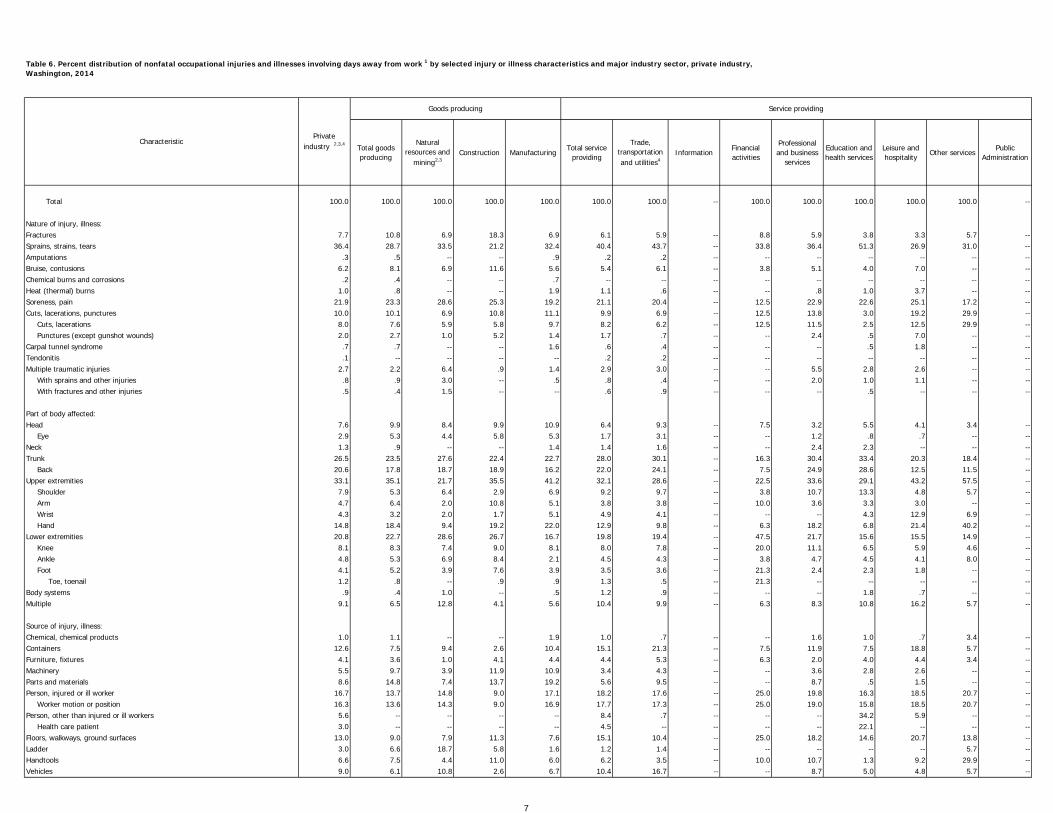
Total 100.0 100.0 100.0 100.0 100.0 100.0 100.0 -- 100.0 100.0 100.0 100.0 100.0 -- Nature of injury, illness: Fractures 7.7 10.8 6.9 18.3 6.9 6.1 5.9 -- 8.8 5.9 3.8 3.3 5.7 --Sprains, strains, tears 36.4 28.7 33.5 21.2 32.4 40.4 43.7 -- 33.8 36.4 51.3 26.9 31.0 --Amputations .3 .5 -- -- .9 .2 .2 -- -- -- -- -- -- --Bruise, contusions 6.2 8.1 6.9 11.6 5.6 5.4 6.1 -- 3.8 5.1 4.0 7.0 -- --Chemical burns and corrosions .2 .4 -- -- .7 -- -- -- -- -- -- -- -- --Heat (thermal) burns 1.0 .8 -- -- 1.9 1.1 .6 -- -- .8 1.0 3.7 -- --Soreness, pain 21.9 23.3 28.6 25.3 19.2 21.1 20.4 -- 12.5 22.9 22.6 25.1 17.2 --Cuts, lacerations, punctures 10.0 10.1 6.9 10.8 11.1 9.9 6.9 -- 12.5 13.8 3.0 19.2 29.9 -- Cuts, lacerations 8.0 7.6 5.9 5.8 9.7 8.2 6.2 -- 12.5 11.5 2.5 12.5 29.9 -- Punctures (except gunshot wounds) 2.0 2.7 1.0 5.2 1.4 1.7 .7 -- -- 2.4 .5 7.0 -- --Carpal tunnel syndrome .7 .7 -- -- 1.6 .6 .4 -- -- -- .5 1.8 -- --Tendonitis .1 -- -- -- -- .2 .2 -- -- -- -- -- -- --Multiple traumatic injuries 2.7 2.2 6.4 .9 1.4 2.9 3.0 -- -- 5.5 2.8 2.6 -- -- With sprains and other injuries .8 .9 3.0 -- .5 .8 .4 -- -- 2.0 1.0 1.1 -- -- With fractures and other injuries .5 .4 1.5 -- -- .6 .9 -- -- -- .5 -- -- -- Part of body affected: Head 7.6 9.9 8.4 9.9 10.9 6.4 9.3 -- 7.5 3.2 5.5 4.1 3.4 -- Eye 2.9 5.3 4.4 5.8 5.3 1.7 3.1 -- -- 1.2 .8 .7 -- --Neck 1.3 .9 -- -- 1.4 1.4 1.6 -- -- 2.4 2.3 -- -- --Trunk 26.5 23.5 27.6 22.4 22.7 28.0 30.1 -- 16.3 30.4 33.4 20.3 18.4 -- Back 20.6 17.8 18.7 18.9 16.2 22.0 24.1 -- 7.5 24.9 28.6 12.5 11.5 --Upper extremities 33.1 35.1 21.7 35.5 41.2 32.1 28.6 -- 22.5 33.6 29.1 43.2 57.5 -- Shoulder 7.9 5.3 6.4 2.9 6.9 9.2 9.7 -- 3.8 10.7 13.3 4.8 5.7 -- Arm 4.7 6.4 2.0 10.8 5.1 3.8 3.8 -- 10.0 3.6 3.3 3.0 -- -- Wrist 4.3 3.2 2.0 1.7 5.1 4.9 4.1 -- -- -- 4.3 12.9 6.9 -- Hand 14.8 18.4 9.4 19.2 22.0 12.9 9.8 -- 6.3 18.2 6.8 21.4 40.2 --Lower extremities 20.8 22.7 28.6 26.7 16.7 19.8 19.4 -- 47.5 21.7 15.6 15.5 14.9 -- Knee 8.1 8.3 7.4 9.0 8.1 8.0 7.8 -- 20.0 11.1 6.5 5.9 4.6 -- Ankle 4.8 5.3 6.9 8.4 2.1 4.5 4.3 -- 3.8 4.7 4.5 4.1 8.0 -- Foot 4.1 5.2 3.9 7.6 3.9 3.5 3.6 -- 21.3 2.4 2.3 1.8 -- -- Toe, toenail 1.2 .8 -- .9 .9 1.3 .5 -- 21.3 -- -- -- -- --Body systems .9 .4 1.0 -- .5 1.2 .9 -- -- -- 1.8 .7 -- --Multiple 9.1 6.5 12.8 4.1 5.6 10.4 9.9 -- 6.3 8.3 10.8 16.2 5.7 -- Source of injury, illness: Chemical, chemical products 1.0 1.1 -- -- 1.9 1.0 .7 -- -- 1.6 1.0 .7 3.4 --Containers 12.6 7.5 9.4 2.6 10.4 15.1 21.3 -- 7.5 11.9 7.5 18.8 5.7 --Furniture, fixtures 4.1 3.6 1.0 4.1 4.4 4.4 5.3 -- 6.3 2.0 4.0 4.4 3.4 --Machinery 5.5 9.7 3.9 11.9 10.9 3.4 4.3 -- -- 3.6 2.8 2.6 -- --Parts and materials 8.6 14.8 7.4 13.7 19.2 5.6 9.5 -- -- 8.7 .5 1.5 -- --Person, injured or ill worker 16.7 13.7 14.8 9.0 17.1 18.2 17.6 -- 25.0 19.8 16.3 18.5 20.7 -- Worker motion or position 16.3 13.6 14.3 9.0 16.9 17.7 17.3 -- 25.0 19.0 15.8 18.5 20.7 --Person, other than injured or ill workers 5.6 -- -- -- -- 8.4 .7 -- -- -- 34.2 5.9 -- -- Health care patient 3.0 -- -- -- -- 4.5 -- -- -- -- 22.1 -- -- --Floors, walkways, ground surfaces 13.0 9.0 7.9 11.3 7.6 15.1 10.4 -- 25.0 18.2 14.6 20.7 13.8 --Ladder 3.0 6.6 18.7 5.8 1.6 1.2 1.4 -- -- -- -- -- 5.7 --Handtools 6.6 7.5 4.4 11.0 6.0 6.2 3.5 -- 10.0 10.7 1.3 9.2 29.9 --Vehicles 9.0 6.1 10.8 2.6 6.7 10.4 16.7 -- -- 8.7 5.0 4.8 5.7 --
Table 6. Percent distribution of nonfatal occupational injuries and illnesses involving days away from work 1 by selected injury or illness characteristics and major industry sector, private industry, Washington, 2014
CharacteristicPrivate
industry 2,3,4
Goods producing Service providing
7
Total goods producing
Natural resources and
mining2,3Construction Manufacturing
Total service providing
Trade, transportation and utilities4
InformationFinancial activities
Professional and business
services
Education and health services
Leisure and hospitality
Other servicesPublic
Administration
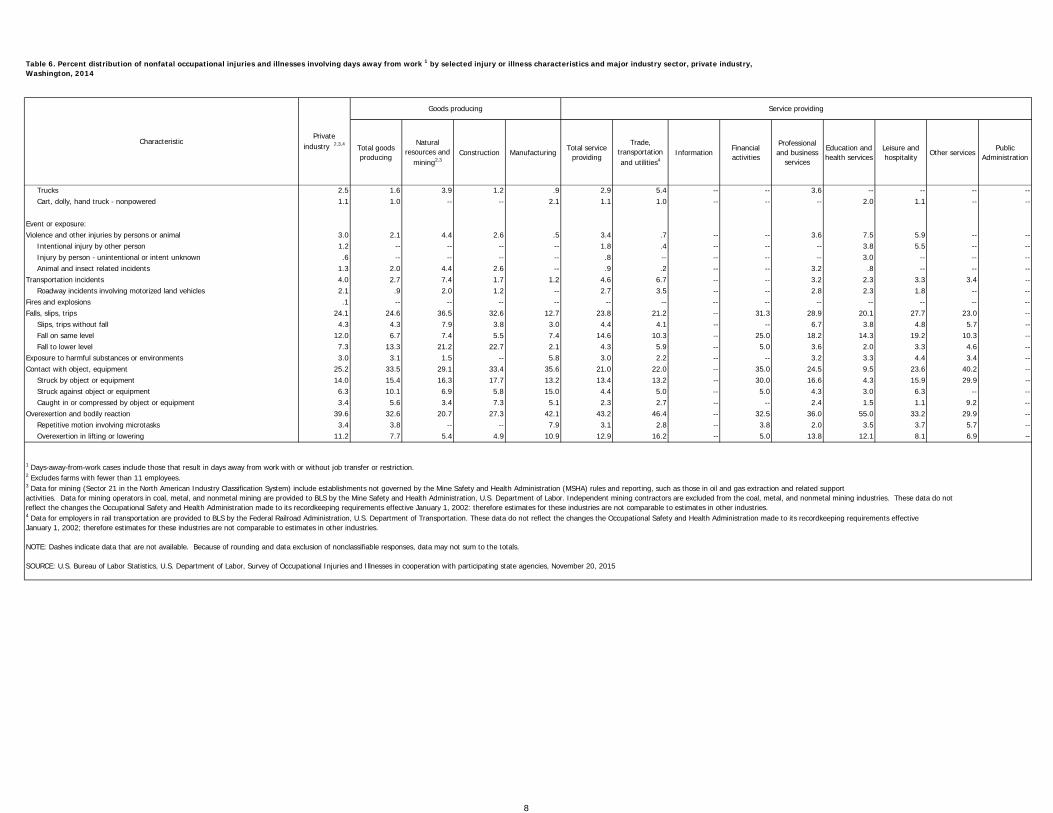
Table 6. Percent distribution of nonfatal occupational injuries and illnesses involving days away from work 1 by selected injury or illness characteristics and major industry sector, private industry, Washington, 2014
CharacteristicPrivate
industry 2,3,4
Goods producing Service providing
Trucks 2.5 1.6 3.9 1.2 .9 2.9 5.4 -- -- 3.6 -- -- -- -- Cart, dolly, hand truck - nonpowered 1.1 1.0 -- -- 2.1 1.1 1.0 -- -- -- 2.0 1.1 -- -- Event or exposure: Violence and other injuries by persons or animal 3.0 2.1 4.4 2.6 .5 3.4 .7 -- -- 3.6 7.5 5.9 -- -- Intentional injury by other person 1.2 -- -- -- -- 1.8 .4 -- -- -- 3.8 5.5 -- -- Injury by person - unintentional or intent unknown .6 -- -- -- -- .8 -- -- -- -- 3.0 -- -- -- Animal and insect related incidents 1.3 2.0 4.4 2.6 -- .9 .2 -- -- 3.2 .8 -- -- --Transportation incidents 4.0 2.7 7.4 1.7 1.2 4.6 6.7 -- -- 3.2 2.3 3.3 3.4 -- Roadway incidents involving motorized land vehicles 2.1 .9 2.0 1.2 -- 2.7 3.5 -- -- 2.8 2.3 1.8 -- --Fires and explosions .1 -- -- -- -- -- -- -- -- -- -- -- -- --Falls, slips, trips 24.1 24.6 36.5 32.6 12.7 23.8 21.2 -- 31.3 28.9 20.1 27.7 23.0 -- Slips, trips without fall 4.3 4.3 7.9 3.8 3.0 4.4 4.1 -- -- 6.7 3.8 4.8 5.7 -- Fall on same level 12.0 6.7 7.4 5.5 7.4 14.6 10.3 -- 25.0 18.2 14.3 19.2 10.3 -- Fall to lower level 7.3 13.3 21.2 22.7 2.1 4.3 5.9 -- 5.0 3.6 2.0 3.3 4.6 --Exposure to harmful substances or environments 3.0 3.1 1.5 -- 5.8 3.0 2.2 -- -- 3.2 3.3 4.4 3.4 --Contact with object, equipment 25.2 33.5 29.1 33.4 35.6 21.0 22.0 -- 35.0 24.5 9.5 23.6 40.2 -- Struck by object or equipment 14.0 15.4 16.3 17.7 13.2 13.4 13.2 -- 30.0 16.6 4.3 15.9 29.9 -- Struck against object or equipment 6.3 10.1 6.9 5.8 15.0 4.4 5.0 -- 5.0 4.3 3.0 6.3 -- -- Caught in or compressed by object or equipment 3.4 5.6 3.4 7.3 5.1 2.3 2.7 -- -- 2.4 1.5 1.1 9.2 --Overexertion and bodily reaction 39.6 32.6 20.7 27.3 42.1 43.2 46.4 -- 32.5 36.0 55.0 33.2 29.9 -- Repetitive motion involving microtasks 3.4 3.8 -- -- 7.9 3.1 2.8 -- 3.8 2.0 3.5 3.7 5.7 -- Overexertion in lifting or lowering 11.2 7.7 5.4 4.9 10.9 12.9 16.2 -- 5.0 13.8 12.1 8.1 6.9 --
1 Days-away-from-work cases include those that result in days away from work with or without job transfer or restriction.2 Excludes farms with fewer than 11 employees.3 Data for mining (Sector 21 in the North American Industry Classification System) include establishments not governed by the Mine Safety and Health Administration (MSHA) rules and reporting, such as those in oil and gas extraction and related support activities. Data for mining operators in coal, metal, and nonmetal mining are provided to BLS by the Mine Safety and Health Administration, U.S. Department of Labor. Independent mining contractors are excluded from the coal, metal, and nonmetal mining industries. These data do not reflect the changes the Occupational Safety and Health Administration made to its recordkeeping requirements effective January 1, 2002: therefore estimates for these industries are not comparable to estimates in other industries.4 Data for employers in rail transportation are provided to BLS by the Federal Railroad Administration, U.S. Department of Transportation. These data do not reflect the changes the Occupational Safety and Health Administration made to its recordkeeping requirements effective January 1, 2002; therefore estimates for these industries are not comparable to estimates in other industries.
NOTE: Dashes indicate data that are not available. Because of rounding and data exclusion of nonclassifiable responses, data may not sum to the totals.
SOURCE: U.S. Bureau of Labor Statistics, U.S. Department of Labor, Survey of Occupational Injuries and Illnesses in cooperation with participating state agencies, November 20, 2015
8

Total goods producing
Natural resources and
mining2,3Construction Manufacturing
Total service providing
Trade, transportation and utilities4
InformationFinancial activities
Professional and business
services
Education and health services
Leisure and hospitality
Other servicesPublic
Administration
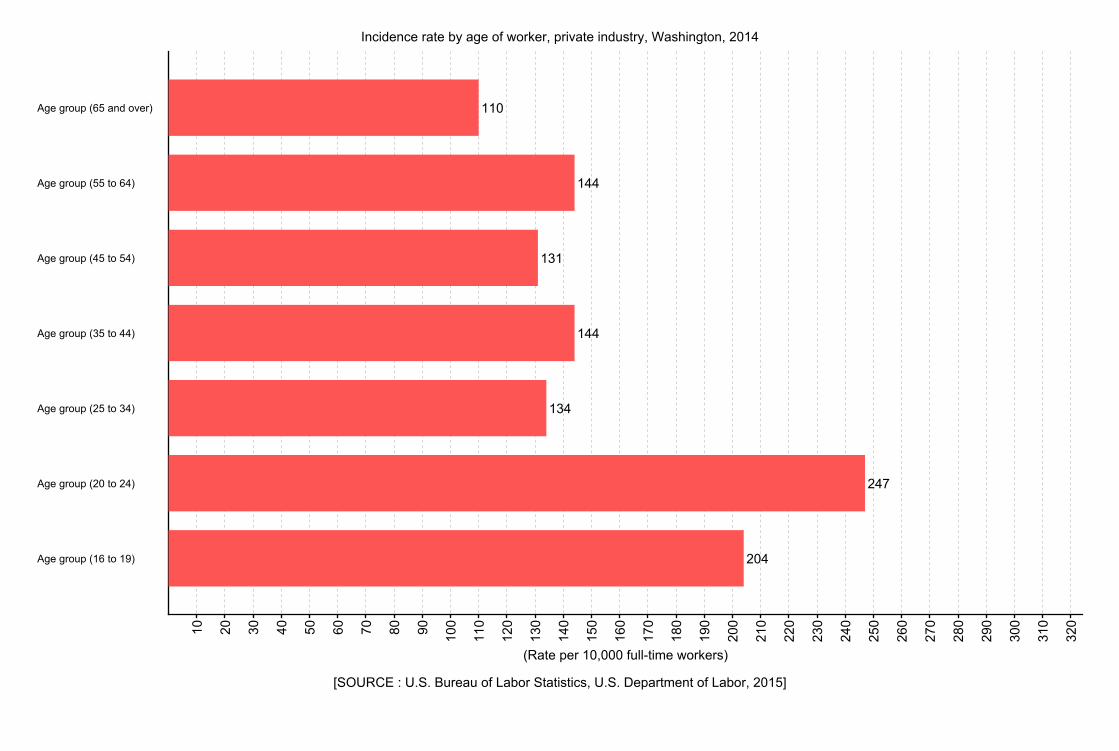
Total 147.7 207.1 317.6 268.5 153.8 129.1 181.3 -- 64.7 83.7 141.1 144.9 144.4 -- Nature of injury, illness: Fractures 11.4 22.4 21.4 49.1 10.5 7.9 10.8 -- 5.3 5.0 5.4 5.0 9.1 --Sprains, strains, tears 53.8 59.4 106.3 57.0 49.7 52.1 79.1 -- 21.4 30.5 72.3 38.7 43.9 --Amputations .5 1.1 -- -- 1.5 .3 .5 -- -- -- -- -- -- --Bruise, contusions 9.2 16.6 21.9 31.6 8.6 6.9 10.9 -- 2.5 4.4 5.6 10.2 -- --Chemical burns and corrosions .3 .9 -- -- 1.0 -- -- -- -- -- -- -- -- --Heat (thermal) burns 1.5 1.7 -- -- 2.7 1.4 1.2 -- -- .7 1.3 5.3 -- --Soreness, pain 32.3 48.3 90.2 68.2 29.6 27.3 37.1 -- 8.0 19.2 31.9 36.4 24.2 --Cuts, lacerations, punctures 14.8 21.0 22.2 29.2 17.1 12.8 12.5 -- 8.2 11.7 4.4 28.0 42.6 -- Cuts, lacerations 11.8 15.6 18.6 15.4 15.0 10.6 11.2 -- 7.9 9.7 3.7 17.9 42.6 -- Punctures (except gunshot wounds) 3.0 5.4 3.7 13.7 2.0 2.2 1.3 -- -- 2.0 .7 10.1 -- --Carpal tunnel syndrome 1.0 1.5 -- -- 2.4 .8 .8 -- -- -- .6 2.9 -- --Tendonitis .2 -- -- -- -- .2 .4 -- -- -- -- -- -- --Multiple traumatic injuries 4.0 4.6 19.7 2.5 2.1 3.8 5.3 -- -- 4.5 4.0 3.5 -- -- With sprains and other injuries 1.2 2.0 9.5 -- .6 1.0 .6 -- -- 1.5 1.5 1.8 -- -- With fractures and other injuries .7 .8 4.1 -- -- .7 1.5 -- -- -- .8 -- -- -- Part of body affected: Head 11.3 20.6 25.9 26.5 16.7 8.3 16.7 -- 5.1 2.6 7.8 5.9 4.3 -- Eye 4.3 11.1 13.8 15.9 8.3 2.2 5.6 -- -- 1.0 1.2 .9 -- --Neck 1.9 1.9 -- -- 2.3 1.9 2.8 -- -- 2.0 3.2 -- -- --Trunk 39.2 48.7 87.0 59.9 34.8 36.2 54.6 -- 10.3 25.5 47.0 29.3 27.0 -- Back 30.4 36.8 59.8 51.2 24.9 28.4 43.7 -- 4.8 20.9 40.5 18.1 15.9 --Upper extremities 48.9 72.8 69.3 95.3 63.3 41.4 51.8 -- 14.4 28.0 41.1 62.5 83.1 -- Shoulder 11.7 11.1 19.6 7.7 10.7 11.9 17.6 -- 2.3 8.8 18.6 7.1 7.8 -- Arm 6.9 13.4 5.9 28.9 8.0 4.9 7.0 -- 6.1 3.0 4.4 4.2 -- -- Wrist 6.4 6.6 5.9 4.6 7.7 6.3 7.4 -- -- -- 6.1 18.6 9.6 -- Hand 21.8 38.1 30.0 51.7 33.7 16.7 17.6 -- 4.4 15.2 9.5 31.1 57.9 --Lower extremities 30.7 47.0 90.9 72.1 25.6 25.6 35.3 -- 30.6 18.2 21.9 22.2 21.3 -- Knee 12.0 17.2 23.8 24.0 12.6 10.3 14.1 -- 13.3 9.3 9.1 8.8 7.3 -- Ankle 7.0 10.9 22.1 22.3 3.2 5.8 7.9 -- 2.6 4.0 6.4 6.0 11.5 -- Foot 6.0 10.7 12.4 20.5 5.9 4.5 6.4 -- 14.0 2.1 3.0 2.9 -- -- Toe, toenail 1.7 1.8 -- 2.3 1.5 1.7 1.0 -- 14.0 -- -- -- -- --Body systems 1.4 .8 2.7 -- .8 1.5 1.5 -- -- -- 2.6 1.1 -- --Multiple 13.4 13.4 40.6 10.6 8.5 13.4 18.0 -- 3.9 6.8 15.1 23.6 8.4 -- Source of injury, illness: Chemical, chemical products 1.5 2.2 -- -- 2.7 1.3 1.4 -- -- 1.4 1.5 .8 4.8 --Containers 18.6 15.5 30.2 7.0 16.0 19.6 38.5 -- 5.0 9.9 10.5 27.3 8.6 --Furniture, fixtures 6.0 7.3 3.3 10.6 6.8 5.6 9.6 -- 4.0 1.6 5.8 6.4 5.6 --Machinery 8.2 20.1 12.3 31.8 16.6 4.4 7.9 -- -- 3.0 3.9 3.6 -- --Parts and materials 12.8 30.6 23.8 36.4 29.5 7.2 17.3 -- -- 7.1 .7 2.1 -- --Person, injured or ill worker 24.6 28.4 46.2 24.4 26.2 23.4 31.9 -- 16.2 16.5 23.1 27.0 29.5 -- Worker motion or position 24.1 28.1 45.6 24.2 26.0 22.8 31.5 -- 16.0 15.9 22.3 26.5 29.5 --Person, other than injured or ill workers 8.3 -- -- -- -- 10.8 1.3 -- -- -- 48.2 8.7 -- -- Health care patient 4.5 -- -- -- -- 5.9 -- -- -- -- 31.2 -- -- --Floors, walkways, ground surfaces 19.3 18.6 24.8 30.8 11.7 19.5 18.8 -- 16.2 15.2 20.6 29.8 19.4 --Ladder 4.5 13.7 59.7 15.3 2.4 1.6 2.4 -- -- -- -- -- 7.7 --Handtools 9.8 15.4 14.5 29.7 9.1 8.0 6.2 -- 6.3 9.1 1.9 13.1 42.7 --Vehicles 13.3 12.6 34.7 7.0 10.2 13.5 30.3 -- -- 7.3 7.2 6.9 8.5 --
Table 7. Incidence rates1 nonfatal occupational injuries and illnesses involving days away from work2 per 10,000 full-time workers for selected characteristics and major industry sector, private industry, Washington, 2014
CharacteristicPrivate
industry 2,3,4
Goods producing Service providing
9
Total goods producing
Natural resources and
mining2,3Construction Manufacturing
Total service providing
Trade, transportation and utilities4
InformationFinancial activities
Professional and business
services
Education and health services
Leisure and hospitality
Other servicesPublic
Administration
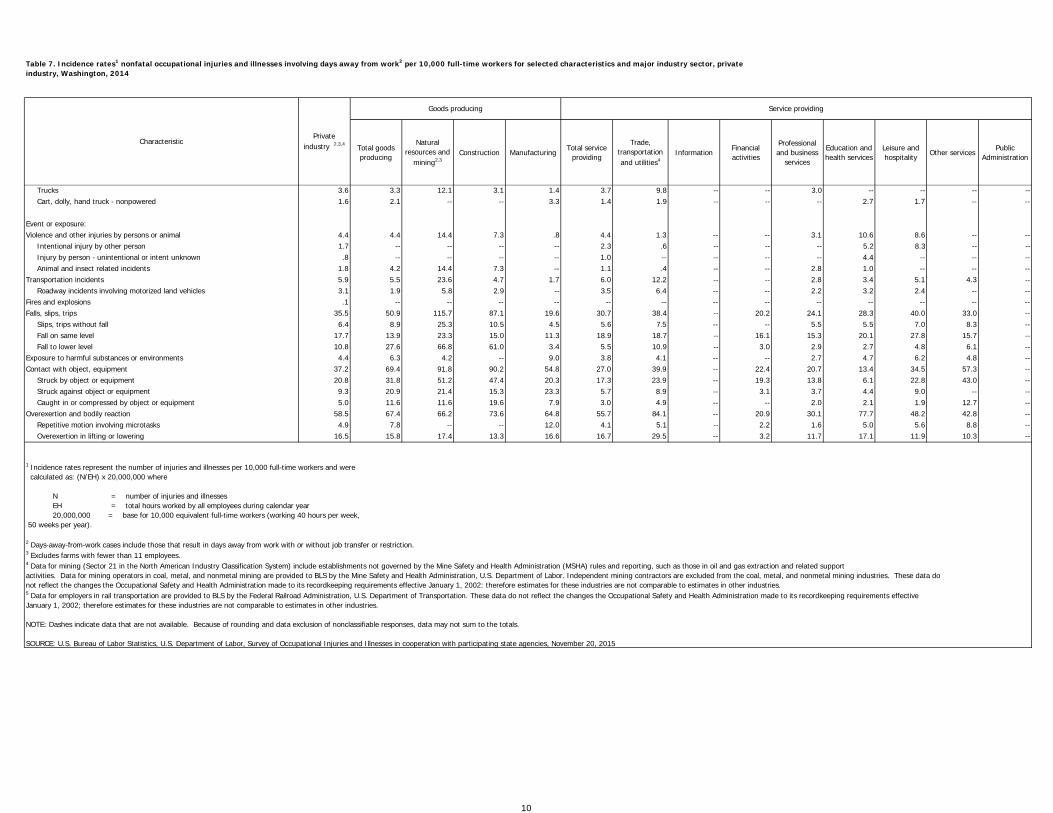
Table 7. Incidence rates1 nonfatal occupational injuries and illnesses involving days away from work2 per 10,000 full-time workers for selected characteristics and major industry sector, private industry, Washington, 2014
CharacteristicPrivate
industry 2,3,4
Goods producing Service providing
Trucks 3.6 3.3 12.1 3.1 1.4 3.7 9.8 -- -- 3.0 -- -- -- -- Cart, dolly, hand truck - nonpowered 1.6 2.1 -- -- 3.3 1.4 1.9 -- -- -- 2.7 1.7 -- -- Event or exposure: Violence and other injuries by persons or animal 4.4 4.4 14.4 7.3 .8 4.4 1.3 -- -- 3.1 10.6 8.6 -- -- Intentional injury by other person 1.7 -- -- -- -- 2.3 .6 -- -- -- 5.2 8.3 -- -- Injury by person - unintentional or intent unknown .8 -- -- -- -- 1.0 -- -- -- -- 4.4 -- -- -- Animal and insect related incidents 1.8 4.2 14.4 7.3 -- 1.1 .4 -- -- 2.8 1.0 -- -- --Transportation incidents 5.9 5.5 23.6 4.7 1.7 6.0 12.2 -- -- 2.8 3.4 5.1 4.3 -- Roadway incidents involving motorized land vehicles 3.1 1.9 5.8 2.9 -- 3.5 6.4 -- -- 2.2 3.2 2.4 -- --Fires and explosions .1 -- -- -- -- -- -- -- -- -- -- -- -- --Falls, slips, trips 35.5 50.9 115.7 87.1 19.6 30.7 38.4 -- 20.2 24.1 28.3 40.0 33.0 -- Slips, trips without fall 6.4 8.9 25.3 10.5 4.5 5.6 7.5 -- -- 5.5 5.5 7.0 8.3 -- Fall on same level 17.7 13.9 23.3 15.0 11.3 18.9 18.7 -- 16.1 15.3 20.1 27.8 15.7 -- Fall to lower level 10.8 27.6 66.8 61.0 3.4 5.5 10.9 -- 3.0 2.9 2.7 4.8 6.1 --Exposure to harmful substances or environments 4.4 6.3 4.2 -- 9.0 3.8 4.1 -- -- 2.7 4.7 6.2 4.8 --Contact with object, equipment 37.2 69.4 91.8 90.2 54.8 27.0 39.9 -- 22.4 20.7 13.4 34.5 57.3 -- Struck by object or equipment 20.8 31.8 51.2 47.4 20.3 17.3 23.9 -- 19.3 13.8 6.1 22.8 43.0 -- Struck against object or equipment 9.3 20.9 21.4 15.3 23.3 5.7 8.9 -- 3.1 3.7 4.4 9.0 -- -- Caught in or compressed by object or equipment 5.0 11.6 11.6 19.6 7.9 3.0 4.9 -- -- 2.0 2.1 1.9 12.7 --Overexertion and bodily reaction 58.5 67.4 66.2 73.6 64.8 55.7 84.1 -- 20.9 30.1 77.7 48.2 42.8 -- Repetitive motion involving microtasks 4.9 7.8 -- -- 12.0 4.1 5.1 -- 2.2 1.6 5.0 5.6 8.8 -- Overexertion in lifting or lowering 16.5 15.8 17.4 13.3 16.6 16.7 29.5 -- 3.2 11.7 17.1 11.9 10.3 --
1 Incidence rates represent the number of injuries and illnesses per 10,000 full-time workers and were calculated as: (N/EH) x 20,000,000 where
N = number of injuries and illnesses EH = total hours worked by all employees during calendar year 20,000,000 = base for 10,000 equivalent full-time workers (working 40 hours per week, 50 weeks per year).
2 Days-away-from-work cases include those that result in days away from work with or without job transfer or restriction.3 Excludes farms with fewer than 11 employees.4 Data for mining (Sector 21 in the North American Industry Classification System) include establishments not governed by the Mine Safety and Health Administration (MSHA) rules and reporting, such as those in oil and gas extraction and related support activities. Data for mining operators in coal, metal, and nonmetal mining are provided to BLS by the Mine Safety and Health Administration, U.S. Department of Labor. Independent mining contractors are excluded from the coal, metal, and nonmetal mining industries. These data do not reflect the changes the Occupational Safety and Health Administration made to its recordkeeping requirements effective January 1, 2002: therefore estimates for these industries are not comparable to estimates in other industries.5 Data for employers in rail transportation are provided to BLS by the Federal Railroad Administration, U.S. Department of Transportation. These data do not reflect the changes the Occupational Safety and Health Administration made to its recordkeeping requirements effective January 1, 2002; therefore estimates for these industries are not comparable to estimates in other industries.
NOTE: Dashes indicate data that are not available. Because of rounding and data exclusion of nonclassifiable responses, data may not sum to the totals.
SOURCE: U.S. Bureau of Labor Statistics, U.S. Department of Labor, Survey of Occupational Injuries and Illnesses in cooperation with participating state agencies, November 20, 2015
10
Totalcases
1 day 2 days3 to 5days
6 to 10days
11 to 20days
21 to 30days
31 daysor more
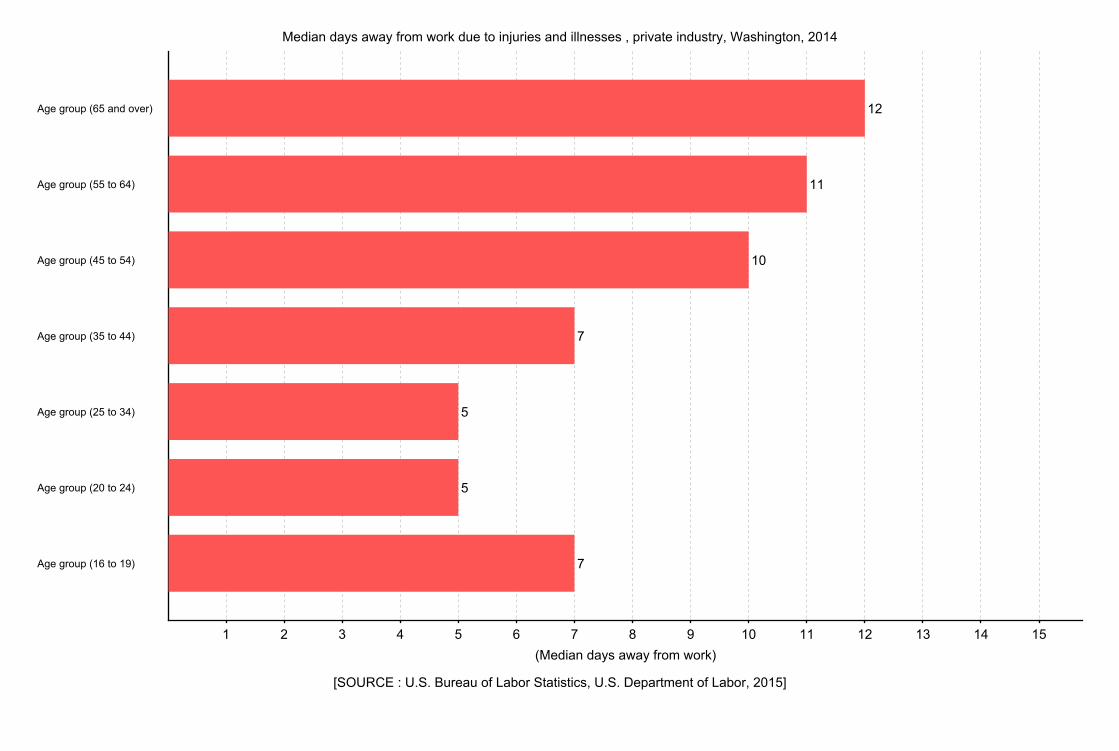
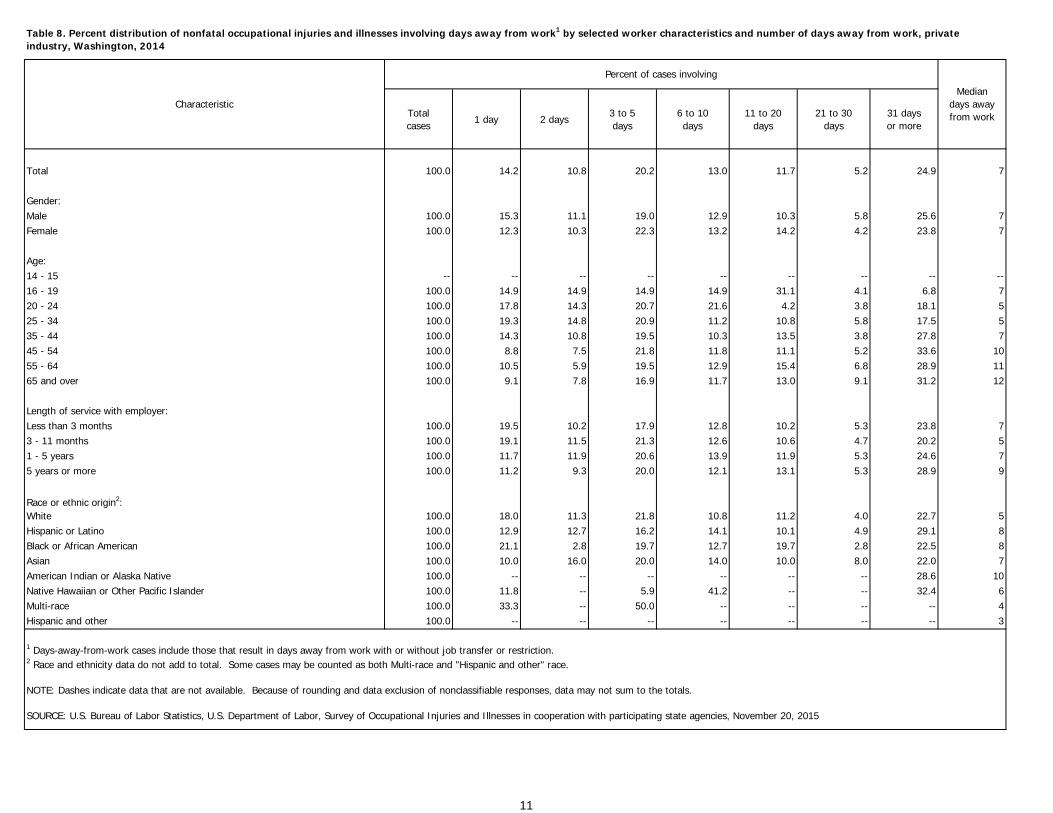
Total 100.0 14.2 10.8 20.2 13.0 11.7 5.2 24.9 7 Gender: Male 100.0 15.3 11.1 19.0 12.9 10.3 5.8 25.6 7Female 100.0 12.3 10.3 22.3 13.2 14.2 4.2 23.8 7 Age: 14 - 15 -- -- -- -- -- -- -- -- --16 - 19 100.0 14.9 14.9 14.9 14.9 31.1 4.1 6.8 720 - 24 100.0 17.8 14.3 20.7 21.6 4.2 3.8 18.1 525 - 34 100.0 19.3 14.8 20.9 11.2 10.8 5.8 17.5 535 - 44 100.0 14.3 10.8 19.5 10.3 13.5 3.8 27.8 745 - 54 100.0 8.8 7.5 21.8 11.8 11.1 5.2 33.6 1055 - 64 100.0 10.5 5.9 19.5 12.9 15.4 6.8 28.9 1165 and over 100.0 9.1 7.8 16.9 11.7 13.0 9.1 31.2 12 Length of service with employer: Less than 3 months 100.0 19.5 10.2 17.9 12.8 10.2 5.3 23.8 73 - 11 months 100.0 19.1 11.5 21.3 12.6 10.6 4.7 20.2 51 - 5 years 100.0 11.7 11.9 20.6 13.9 11.9 5.3 24.6 75 years or more 100.0 11.2 9.3 20.0 12.1 13.1 5.3 28.9 9
Race or ethnic origin2: White 100.0 18.0 11.3 21.8 10.8 11.2 4.0 22.7 5Hispanic or Latino 100.0 12.9 12.7 16.2 14.1 10.1 4.9 29.1 8Black or African American 100.0 21.1 2.8 19.7 12.7 19.7 2.8 22.5 8Asian 100.0 10.0 16.0 20.0 14.0 10.0 8.0 22.0 7American Indian or Alaska Native 100.0 -- -- -- -- -- -- 28.6 10Native Hawaiian or Other Pacific Islander 100.0 11.8 -- 5.9 41.2 -- -- 32.4 6Multi-race 100.0 33.3 -- 50.0 -- -- -- -- 4Hispanic and other 100.0 -- -- -- -- -- -- -- 3
Table 8. Percent distribution of nonfatal occupational injuries and illnesses involving days away from work1 by selected worker characteristics and number of days away from work, private industry, Washington, 2014
Characteristic
Percent of cases involving
Mediandays awayfrom work
1 Days-away-from-work cases include those that result in days away from work with or without job transfer or restriction.2 Race and ethnicity data do not add to total. Some cases may be counted as both Multi-race and "Hispanic and other" race.
NOTE: Dashes indicate data that are not available. Because of rounding and data exclusion of nonclassifiable responses, data may not sum to the totals.
SOURCE: U.S. Bureau of Labor Statistics, U.S. Department of Labor, Survey of Occupational Injuries and Illnesses in cooperation with participating state agencies, November 20, 2015
11
Totalcases
1 day 2 days3 to 5days
6 to 10days
11 to 20days
21 to 30days
31 daysor more
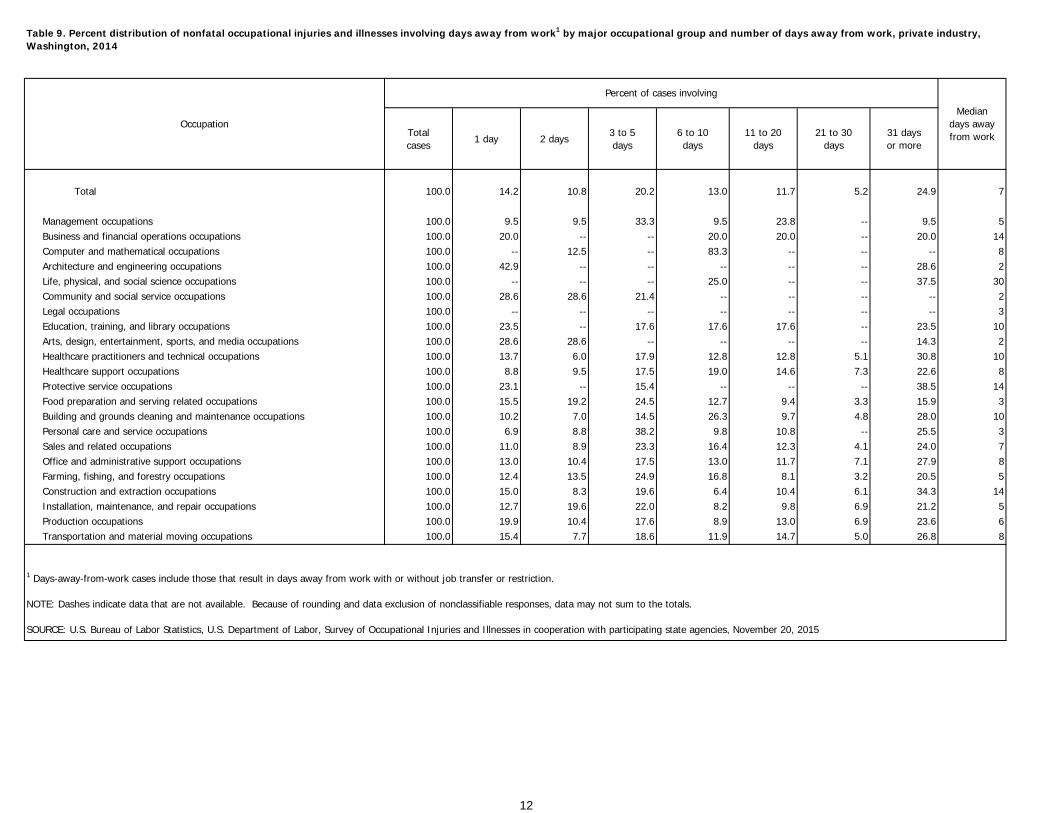
Total 100.0 14.2 10.8 20.2 13.0 11.7 5.2 24.9 7 Management occupations 100.0 9.5 9.5 33.3 9.5 23.8 -- 9.5 5 Business and financial operations occupations 100.0 20.0 -- -- 20.0 20.0 -- 20.0 14 Computer and mathematical occupations 100.0 -- 12.5 -- 83.3 -- -- -- 8 Architecture and engineering occupations 100.0 42.9 -- -- -- -- -- 28.6 2 Life, physical, and social science occupations 100.0 -- -- -- 25.0 -- -- 37.5 30 Community and social service occupations 100.0 28.6 28.6 21.4 -- -- -- -- 2 Legal occupations 100.0 -- -- -- -- -- -- -- 3 Education, training, and library occupations 100.0 23.5 -- 17.6 17.6 17.6 -- 23.5 10 Arts, design, entertainment, sports, and media occupations 100.0 28.6 28.6 -- -- -- -- 14.3 2 Healthcare practitioners and technical occupations 100.0 13.7 6.0 17.9 12.8 12.8 5.1 30.8 10 Healthcare support occupations 100.0 8.8 9.5 17.5 19.0 14.6 7.3 22.6 8 Protective service occupations 100.0 23.1 -- 15.4 -- -- -- 38.5 14 Food preparation and serving related occupations 100.0 15.5 19.2 24.5 12.7 9.4 3.3 15.9 3 Building and grounds cleaning and maintenance occupations 100.0 10.2 7.0 14.5 26.3 9.7 4.8 28.0 10 Personal care and service occupations 100.0 6.9 8.8 38.2 9.8 10.8 -- 25.5 3 Sales and related occupations 100.0 11.0 8.9 23.3 16.4 12.3 4.1 24.0 7 Office and administrative support occupations 100.0 13.0 10.4 17.5 13.0 11.7 7.1 27.9 8 Farming, fishing, and forestry occupations 100.0 12.4 13.5 24.9 16.8 8.1 3.2 20.5 5 Construction and extraction occupations 100.0 15.0 8.3 19.6 6.4 10.4 6.1 34.3 14 Installation, maintenance, and repair occupations 100.0 12.7 19.6 22.0 8.2 9.8 6.9 21.2 5 Production occupations 100.0 19.9 10.4 17.6 8.9 13.0 6.9 23.6 6 Transportation and material moving occupations 100.0 15.4 7.7 18.6 11.9 14.7 5.0 26.8 8
Table 9. Percent distribution of nonfatal occupational injuries and illnesses involving days away from work1 by major occupational group and number of days away from work, private industry, Washington, 2014
Occupation
Percent of cases involving
Mediandays awayfrom work
1 Days-away-from-work cases include those that result in days away from work with or without job transfer or restriction.
NOTE: Dashes indicate data that are not available. Because of rounding and data exclusion of nonclassifiable responses, data may not sum to the totals.
SOURCE: U.S. Bureau of Labor Statistics, U.S. Department of Labor, Survey of Occupational Injuries and Illnesses in cooperation with participating state agencies, November 20, 2015
12
Totalcases
1 day 2 days3 to 5days
6 to 10days
11 to 20days
21 to 30days
31 daysor more
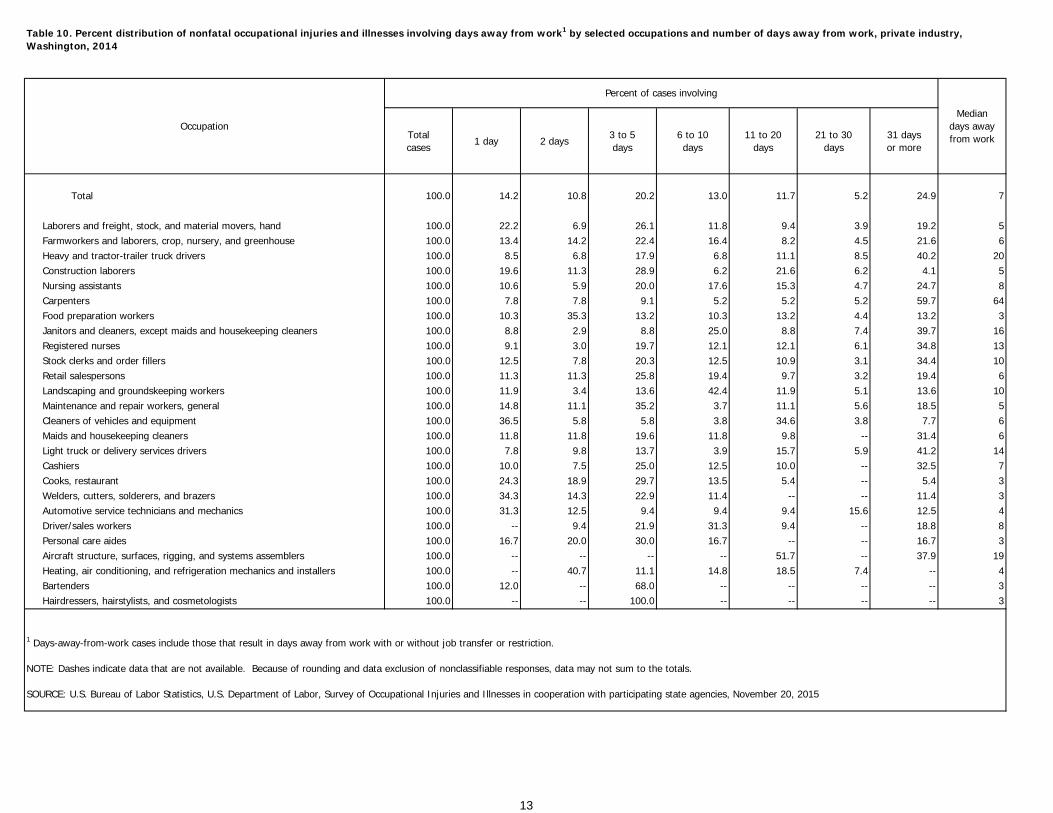
Total 100.0 14.2 10.8 20.2 13.0 11.7 5.2 24.9 7 Laborers and freight, stock, and material movers, hand 100.0 22.2 6.9 26.1 11.8 9.4 3.9 19.2 5 Farmworkers and laborers, crop, nursery, and greenhouse 100.0 13.4 14.2 22.4 16.4 8.2 4.5 21.6 6 Heavy and tractor-trailer truck drivers 100.0 8.5 6.8 17.9 6.8 11.1 8.5 40.2 20 Construction laborers 100.0 19.6 11.3 28.9 6.2 21.6 6.2 4.1 5 Nursing assistants 100.0 10.6 5.9 20.0 17.6 15.3 4.7 24.7 8 Carpenters 100.0 7.8 7.8 9.1 5.2 5.2 5.2 59.7 64 Food preparation workers 100.0 10.3 35.3 13.2 10.3 13.2 4.4 13.2 3 Janitors and cleaners, except maids and housekeeping cleaners 100.0 8.8 2.9 8.8 25.0 8.8 7.4 39.7 16 Registered nurses 100.0 9.1 3.0 19.7 12.1 12.1 6.1 34.8 13 Stock clerks and order fillers 100.0 12.5 7.8 20.3 12.5 10.9 3.1 34.4 10 Retail salespersons 100.0 11.3 11.3 25.8 19.4 9.7 3.2 19.4 6 Landscaping and groundskeeping workers 100.0 11.9 3.4 13.6 42.4 11.9 5.1 13.6 10 Maintenance and repair workers, general 100.0 14.8 11.1 35.2 3.7 11.1 5.6 18.5 5 Cleaners of vehicles and equipment 100.0 36.5 5.8 5.8 3.8 34.6 3.8 7.7 6 Maids and housekeeping cleaners 100.0 11.8 11.8 19.6 11.8 9.8 -- 31.4 6 Light truck or delivery services drivers 100.0 7.8 9.8 13.7 3.9 15.7 5.9 41.2 14 Cashiers 100.0 10.0 7.5 25.0 12.5 10.0 -- 32.5 7 Cooks, restaurant 100.0 24.3 18.9 29.7 13.5 5.4 -- 5.4 3 Welders, cutters, solderers, and brazers 100.0 34.3 14.3 22.9 11.4 -- -- 11.4 3 Automotive service technicians and mechanics 100.0 31.3 12.5 9.4 9.4 9.4 15.6 12.5 4 Driver/sales workers 100.0 -- 9.4 21.9 31.3 9.4 -- 18.8 8 Personal care aides 100.0 16.7 20.0 30.0 16.7 -- -- 16.7 3 Aircraft structure, surfaces, rigging, and systems assemblers 100.0 -- -- -- -- 51.7 -- 37.9 19 Heating, air conditioning, and refrigeration mechanics and installers 100.0 -- 40.7 11.1 14.8 18.5 7.4 -- 4 Bartenders 100.0 12.0 -- 68.0 -- -- -- -- 3 Hairdressers, hairstylists, and cosmetologists 100.0 -- -- 100.0 -- -- -- -- 3
Table 10. Percent distribution of nonfatal occupational injuries and illnesses involving days away from work1 by selected occupations and number of days away from work, private industry, Washington, 2014
Occupation
Percent of cases involving
Mediandays awayfrom work
1 Days-away-from-work cases include those that result in days away from work with or without job transfer or restriction.
NOTE: Dashes indicate data that are not available. Because of rounding and data exclusion of nonclassifiable responses, data may not sum to the totals.
SOURCE: U.S. Bureau of Labor Statistics, U.S. Department of Labor, Survey of Occupational Injuries and Illnesses in cooperation with participating state agencies, November 20, 2015
13
Totalcases
1 day 2 days3 to 5days
6 to 10days
11 to 20days
21 to 30days
31 daysor more
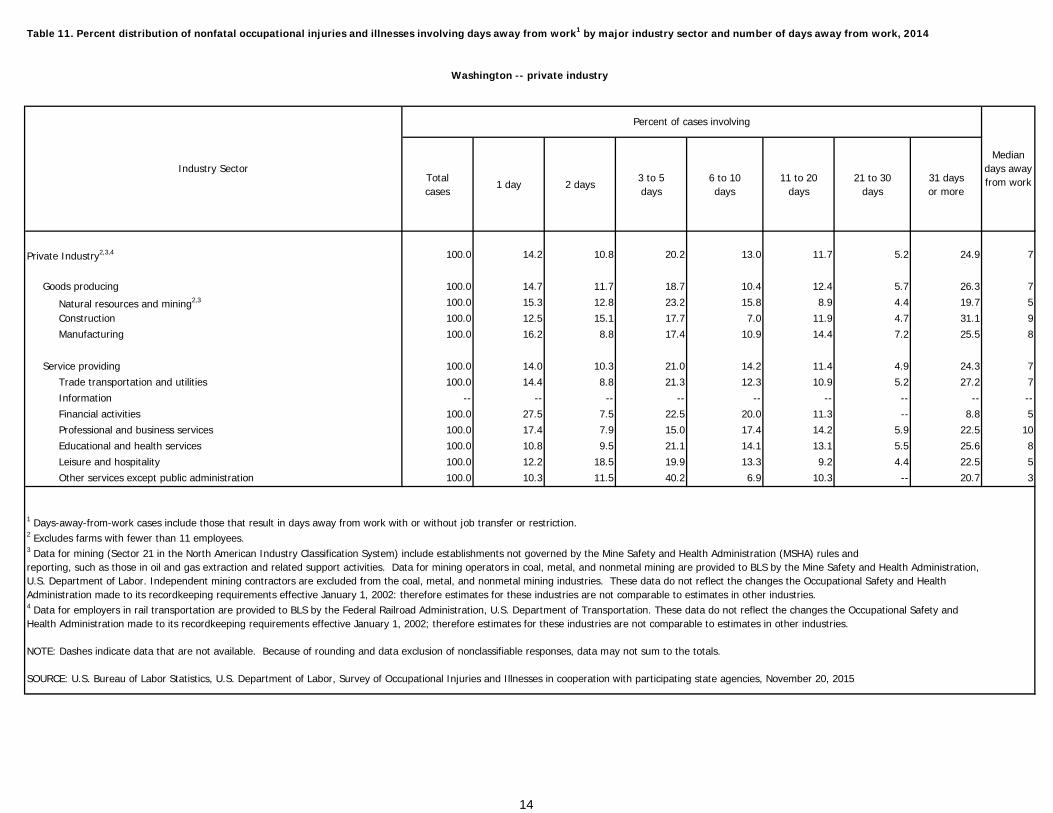
Private Industry2,3,4 100.0 14.2 10.8 20.2 13.0 11.7 5.2 24.9 7 Goods producing 100.0 14.7 11.7 18.7 10.4 12.4 5.7 26.3 7
Natural resources and mining2,3 100.0 15.3 12.8 23.2 15.8 8.9 4.4 19.7 5 Construction 100.0 12.5 15.1 17.7 7.0 11.9 4.7 31.1 9 Manufacturing 100.0 16.2 8.8 17.4 10.9 14.4 7.2 25.5 8 Service providing 100.0 14.0 10.3 21.0 14.2 11.4 4.9 24.3 7 Trade transportation and utilities 100.0 14.4 8.8 21.3 12.3 10.9 5.2 27.2 7 Information -- -- -- -- -- -- -- -- -- Financial activities 100.0 27.5 7.5 22.5 20.0 11.3 -- 8.8 5 Professional and business services 100.0 17.4 7.9 15.0 17.4 14.2 5.9 22.5 10 Educational and health services 100.0 10.8 9.5 21.1 14.1 13.1 5.5 25.6 8 Leisure and hospitality 100.0 12.2 18.5 19.9 13.3 9.2 4.4 22.5 5 Other services except public administration 100.0 10.3 11.5 40.2 6.9 10.3 -- 20.7 3
Table 11. Percent distribution of nonfatal occupational injuries and illnesses involving days away from work1 by major industry sector and number of days away from work, 2014
Washington -- private industry
Industry Sector
Percent of cases involving
Mediandays awayfrom work
1 Days-away-from-work cases include those that result in days away from work with or without job transfer or restriction.2 Excludes farms with fewer than 11 employees.3 Data for mining (Sector 21 in the North American Industry Classification System) include establishments not governed by the Mine Safety and Health Administration (MSHA) rules and reporting, such as those in oil and gas extraction and related support activities. Data for mining operators in coal, metal, and nonmetal mining are provided to BLS by the Mine Safety and Health Administration, U.S. Department of Labor. Independent mining contractors are excluded from the coal, metal, and nonmetal mining industries. These data do not reflect the changes the Occupational Safety and Health Administration made to its recordkeeping requirements effective January 1, 2002: therefore estimates for these industries are not comparable to estimates in other industries.4 Data for employers in rail transportation are provided to BLS by the Federal Railroad Administration, U.S. Department of Transportation. These data do not reflect the changes the Occupational Safety and Health Administration made to its recordkeeping requirements effective January 1, 2002; therefore estimates for these industries are not comparable to estimates in other industries.
NOTE: Dashes indicate data that are not available. Because of rounding and data exclusion of nonclassifiable responses, data may not sum to the totals.
SOURCE: U.S. Bureau of Labor Statistics, U.S. Department of Labor, Survey of Occupational Injuries and Illnesses in cooperation with participating state agencies, November 20, 2015
14
Total goods producing
Natural resources and
mining2,3Construction Manufacturing
Total service providing
Trade, transportation and utilities4
InformationFinancial activities
Professional and business
services
Education and health services
Leisure and hospitality
Other servicesPublic
Administratioin
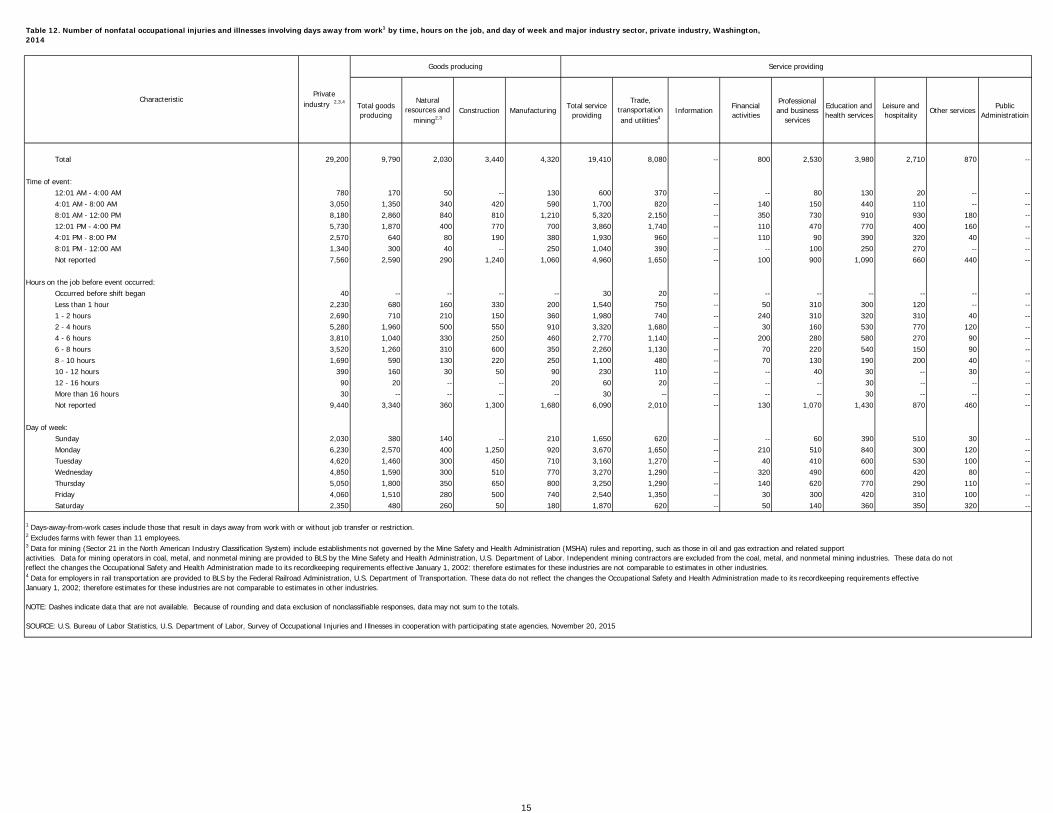
Total 29,200 9,790 2,030 3,440 4,320 19,410 8,080 -- 800 2,530 3,980 2,710 870 -- Time of event: 12:01 AM - 4:00 AM 780 170 50 -- 130 600 370 -- -- 80 130 20 -- -- 4:01 AM - 8:00 AM 3,050 1,350 340 420 590 1,700 820 -- 140 150 440 110 -- -- 8:01 AM - 12:00 PM 8,180 2,860 840 810 1,210 5,320 2,150 -- 350 730 910 930 180 -- 12:01 PM - 4:00 PM 5,730 1,870 400 770 700 3,860 1,740 -- 110 470 770 400 160 -- 4:01 PM - 8:00 PM 2,570 640 80 190 380 1,930 960 -- 110 90 390 320 40 -- 8:01 PM - 12:00 AM 1,340 300 40 -- 250 1,040 390 -- -- 100 250 270 -- -- Not reported 7,560 2,590 290 1,240 1,060 4,960 1,650 -- 100 900 1,090 660 440 -- Hours on the job before event occurred: Occurred before shift began 40 -- -- -- -- 30 20 -- -- -- -- -- -- -- Less than 1 hour 2,230 680 160 330 200 1,540 750 -- 50 310 300 120 -- -- 1 - 2 hours 2,690 710 210 150 360 1,980 740 -- 240 310 320 310 40 -- 2 - 4 hours 5,280 1,960 500 550 910 3,320 1,680 -- 30 160 530 770 120 -- 4 - 6 hours 3,810 1,040 330 250 460 2,770 1,140 -- 200 280 580 270 90 -- 6 - 8 hours 3,520 1,260 310 600 350 2,260 1,130 -- 70 220 540 150 90 -- 8 - 10 hours 1,690 590 130 220 250 1,100 480 -- 70 130 190 200 40 -- 10 - 12 hours 390 160 30 50 90 230 110 -- -- 40 30 -- 30 -- 12 - 16 hours 90 20 -- -- 20 60 20 -- -- -- 30 -- -- -- More than 16 hours 30 -- -- -- -- 30 -- -- -- -- 30 -- -- -- Not reported 9,440 3,340 360 1,300 1,680 6,090 2,010 -- 130 1,070 1,430 870 460 -- Day of week: Sunday 2,030 380 140 -- 210 1,650 620 -- -- 60 390 510 30 -- Monday 6,230 2,570 400 1,250 920 3,670 1,650 -- 210 510 840 300 120 -- Tuesday 4,620 1,460 300 450 710 3,160 1,270 -- 40 410 600 530 100 -- Wednesday 4,850 1,590 300 510 770 3,270 1,290 -- 320 490 600 420 80 -- Thursday 5,050 1,800 350 650 800 3,250 1,290 -- 140 620 770 290 110 -- Friday 4,060 1,510 280 500 740 2,540 1,350 -- 30 300 420 310 100 -- Saturday 2,350 480 260 50 180 1,870 620 -- 50 140 360 350 320 --
Table 12. Number of nonfatal occupational injuries and illnesses involving days away from work1 by time, hours on the job, and day of week and major industry sector, private industry, Washington, 2014
CharacteristicPrivate
industry 2,3,4
Goods producing Service providing
1 Days-away-from-work cases include those that result in days away from work with or without job transfer or restriction.2 Excludes farms with fewer than 11 employees.3 Data for mining (Sector 21 in the North American Industry Classification System) include establishments not governed by the Mine Safety and Health Administration (MSHA) rules and reporting, such as those in oil and gas extraction and related support activities. Data for mining operators in coal, metal, and nonmetal mining are provided to BLS by the Mine Safety and Health Administration, U.S. Department of Labor. Independent mining contractors are excluded from the coal, metal, and nonmetal mining industries. These data do not reflect the changes the Occupational Safety and Health Administration made to its recordkeeping requirements effective January 1, 2002: therefore estimates for these industries are not comparable to estimates in other industries.4 Data for employers in rail transportation are provided to BLS by the Federal Railroad Administration, U.S. Department of Transportation. These data do not reflect the changes the Occupational Safety and Health Administration made to its recordkeeping requirements effective January 1, 2002; therefore estimates for these industries are not comparable to estimates in other industries.
NOTE: Dashes indicate data that are not available. Because of rounding and data exclusion of nonclassifiable responses, data may not sum to the totals.
SOURCE: U.S. Bureau of Labor Statistics, U.S. Department of Labor, Survey of Occupational Injuries and Illnesses in cooperation with participating state agencies, November 20, 2015
15
Total goods producing
Natural resources and
mining2,3Construction Manufacturing
Total service providing
Trade, transportation and utilities4
InformationFinancial activities
Professional and business
services
Education and health services
Leisure and hospitality
Other servicesPublic
Administration
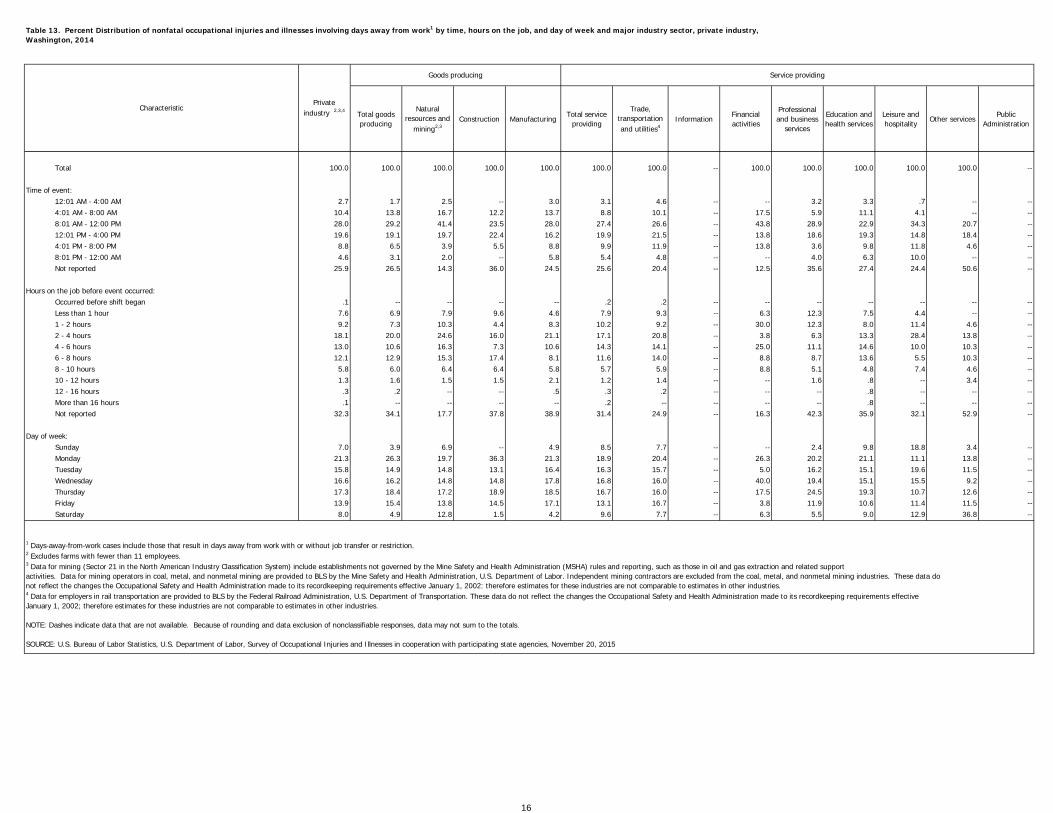
Total 100.0 100.0 100.0 100.0 100.0 100.0 100.0 -- 100.0 100.0 100.0 100.0 100.0 -- Time of event: 12:01 AM - 4:00 AM 2.7 1.7 2.5 -- 3.0 3.1 4.6 -- -- 3.2 3.3 .7 -- -- 4:01 AM - 8:00 AM 10.4 13.8 16.7 12.2 13.7 8.8 10.1 -- 17.5 5.9 11.1 4.1 -- -- 8:01 AM - 12:00 PM 28.0 29.2 41.4 23.5 28.0 27.4 26.6 -- 43.8 28.9 22.9 34.3 20.7 -- 12:01 PM - 4:00 PM 19.6 19.1 19.7 22.4 16.2 19.9 21.5 -- 13.8 18.6 19.3 14.8 18.4 -- 4:01 PM - 8:00 PM 8.8 6.5 3.9 5.5 8.8 9.9 11.9 -- 13.8 3.6 9.8 11.8 4.6 -- 8:01 PM - 12:00 AM 4.6 3.1 2.0 -- 5.8 5.4 4.8 -- -- 4.0 6.3 10.0 -- -- Not reported 25.9 26.5 14.3 36.0 24.5 25.6 20.4 -- 12.5 35.6 27.4 24.4 50.6 -- Hours on the job before event occurred: Occurred before shift began .1 -- -- -- -- .2 .2 -- -- -- -- -- -- -- Less than 1 hour 7.6 6.9 7.9 9.6 4.6 7.9 9.3 -- 6.3 12.3 7.5 4.4 -- -- 1 - 2 hours 9.2 7.3 10.3 4.4 8.3 10.2 9.2 -- 30.0 12.3 8.0 11.4 4.6 -- 2 - 4 hours 18.1 20.0 24.6 16.0 21.1 17.1 20.8 -- 3.8 6.3 13.3 28.4 13.8 -- 4 - 6 hours 13.0 10.6 16.3 7.3 10.6 14.3 14.1 -- 25.0 11.1 14.6 10.0 10.3 -- 6 - 8 hours 12.1 12.9 15.3 17.4 8.1 11.6 14.0 -- 8.8 8.7 13.6 5.5 10.3 -- 8 - 10 hours 5.8 6.0 6.4 6.4 5.8 5.7 5.9 -- 8.8 5.1 4.8 7.4 4.6 -- 10 - 12 hours 1.3 1.6 1.5 1.5 2.1 1.2 1.4 -- -- 1.6 .8 -- 3.4 -- 12 - 16 hours .3 .2 -- -- .5 .3 .2 -- -- -- .8 -- -- -- More than 16 hours .1 -- -- -- -- .2 -- -- -- -- .8 -- -- -- Not reported 32.3 34.1 17.7 37.8 38.9 31.4 24.9 -- 16.3 42.3 35.9 32.1 52.9 -- Day of week: Sunday 7.0 3.9 6.9 -- 4.9 8.5 7.7 -- -- 2.4 9.8 18.8 3.4 -- Monday 21.3 26.3 19.7 36.3 21.3 18.9 20.4 -- 26.3 20.2 21.1 11.1 13.8 -- Tuesday 15.8 14.9 14.8 13.1 16.4 16.3 15.7 -- 5.0 16.2 15.1 19.6 11.5 -- Wednesday 16.6 16.2 14.8 14.8 17.8 16.8 16.0 -- 40.0 19.4 15.1 15.5 9.2 -- Thursday 17.3 18.4 17.2 18.9 18.5 16.7 16.0 -- 17.5 24.5 19.3 10.7 12.6 -- Friday 13.9 15.4 13.8 14.5 17.1 13.1 16.7 -- 3.8 11.9 10.6 11.4 11.5 -- Saturday 8.0 4.9 12.8 1.5 4.2 9.6 7.7 -- 6.3 5.5 9.0 12.9 36.8 --
Table 13. Percent Distribution of nonfatal occupational injuries and illnesses involving days away from work1 by time, hours on the job, and day of week and major industry sector, private industry, Washington, 2014
CharacteristicPrivate
industry 2,3,4
Goods producing Service providing
1 Days-away-from-work cases include those that result in days away from work with or without job transfer or restriction.2 Excludes farms with fewer than 11 employees.3 Data for mining (Sector 21 in the North American Industry Classification System) include establishments not governed by the Mine Safety and Health Administration (MSHA) rules and reporting, such as those in oil and gas extraction and related support activities. Data for mining operators in coal, metal, and nonmetal mining are provided to BLS by the Mine Safety and Health Administration, U.S. Department of Labor. Independent mining contractors are excluded from the coal, metal, and nonmetal mining industries. These data do not reflect the changes the Occupational Safety and Health Administration made to its recordkeeping requirements effective January 1, 2002: therefore estimates for these industries are not comparable to estimates in other industries.4 Data for employers in rail transportation are provided to BLS by the Federal Railroad Administration, U.S. Department of Transportation. These data do not reflect the changes the Occupational Safety and Health Administration made to its recordkeeping requirements effective January 1, 2002; therefore estimates for these industries are not comparable to estimates in other industries.
NOTE: Dashes indicate data that are not available. Because of rounding and data exclusion of nonclassifiable responses, data may not sum to the totals.
SOURCE: U.S. Bureau of Labor Statistics, U.S. Department of Labor, Survey of Occupational Injuries and Illnesses in cooperation with participating state agencies, November 20, 2015
16
Totalcases
1 day 2 days3 to 5days
6 to 10days
11 to 20days
21 to 30days
31 daysor more
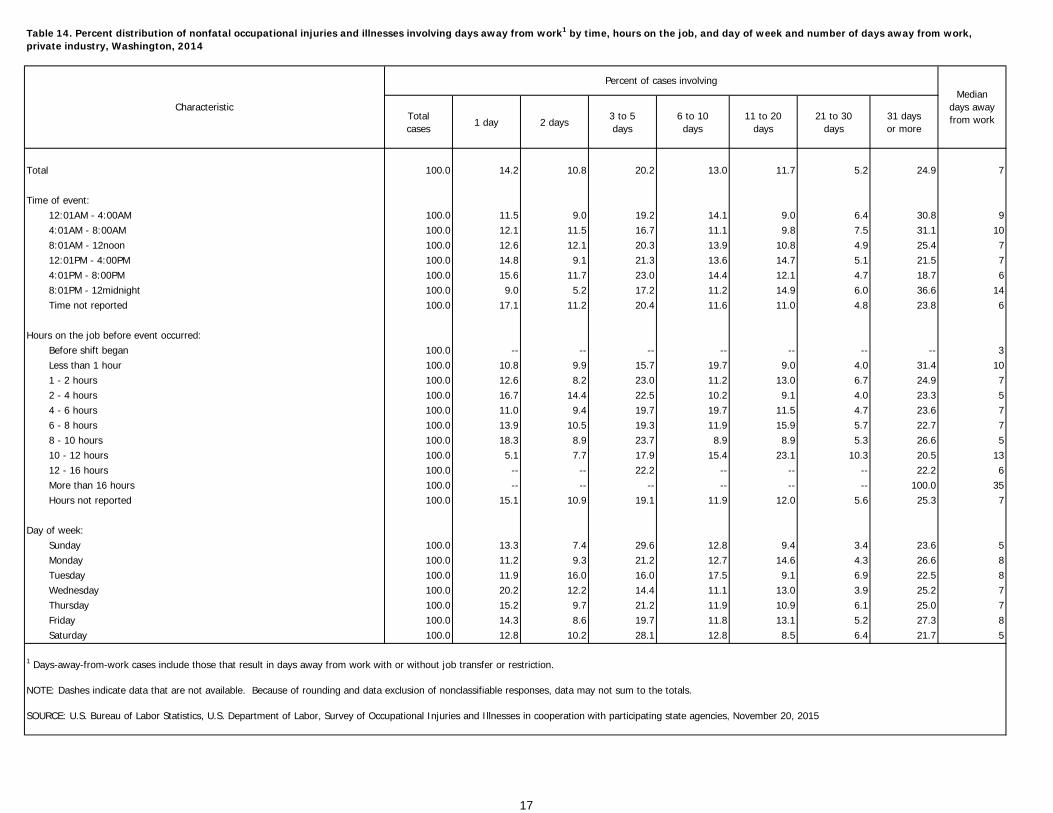
Total 100.0 14.2 10.8 20.2 13.0 11.7 5.2 24.9 7 Time of event: 12:01AM - 4:00AM 100.0 11.5 9.0 19.2 14.1 9.0 6.4 30.8 9 4:01AM - 8:00AM 100.0 12.1 11.5 16.7 11.1 9.8 7.5 31.1 10 8:01AM - 12noon 100.0 12.6 12.1 20.3 13.9 10.8 4.9 25.4 7 12:01PM - 4:00PM 100.0 14.8 9.1 21.3 13.6 14.7 5.1 21.5 7 4:01PM - 8:00PM 100.0 15.6 11.7 23.0 14.4 12.1 4.7 18.7 6 8:01PM - 12midnight 100.0 9.0 5.2 17.2 11.2 14.9 6.0 36.6 14 Time not reported 100.0 17.1 11.2 20.4 11.6 11.0 4.8 23.8 6 Hours on the job before event occurred: Before shift began 100.0 -- -- -- -- -- -- -- 3 Less than 1 hour 100.0 10.8 9.9 15.7 19.7 9.0 4.0 31.4 10 1 - 2 hours 100.0 12.6 8.2 23.0 11.2 13.0 6.7 24.9 7 2 - 4 hours 100.0 16.7 14.4 22.5 10.2 9.1 4.0 23.3 5 4 - 6 hours 100.0 11.0 9.4 19.7 19.7 11.5 4.7 23.6 7 6 - 8 hours 100.0 13.9 10.5 19.3 11.9 15.9 5.7 22.7 7 8 - 10 hours 100.0 18.3 8.9 23.7 8.9 8.9 5.3 26.6 5 10 - 12 hours 100.0 5.1 7.7 17.9 15.4 23.1 10.3 20.5 13 12 - 16 hours 100.0 -- -- 22.2 -- -- -- 22.2 6 More than 16 hours 100.0 -- -- -- -- -- -- 100.0 35 Hours not reported 100.0 15.1 10.9 19.1 11.9 12.0 5.6 25.3 7 Day of week: Sunday 100.0 13.3 7.4 29.6 12.8 9.4 3.4 23.6 5 Monday 100.0 11.2 9.3 21.2 12.7 14.6 4.3 26.6 8 Tuesday 100.0 11.9 16.0 16.0 17.5 9.1 6.9 22.5 8 Wednesday 100.0 20.2 12.2 14.4 11.1 13.0 3.9 25.2 7 Thursday 100.0 15.2 9.7 21.2 11.9 10.9 6.1 25.0 7 Friday 100.0 14.3 8.6 19.7 11.8 13.1 5.2 27.3 8 Saturday 100.0 12.8 10.2 28.1 12.8 8.5 6.4 21.7 5
Table 14. Percent distribution of nonfatal occupational injuries and illnesses involving days away from work1 by time, hours on the job, and day of week and number of days away from work, private industry, Washington, 2014
Characteristic
Percent of cases involvingMedian
days awayfrom work
1 Days-away-from-work cases include those that result in days away from work with or without job transfer or restriction.
NOTE: Dashes indicate data that are not available. Because of rounding and data exclusion of nonclassifiable responses, data may not sum to the totals.
SOURCE: U.S. Bureau of Labor Statistics, U.S. Department of Labor, Survey of Occupational Injuries and Illnesses in cooperation with participating state agencies, November 20, 2015
17
Total Eyes Total Back Total Shoulder Arm Hand Wrist Total Knee Ankle Foot
Total 147.7 11.3 4.3 1.9 39.2 48.9 11.7 6.9 21.8 6.4 7.0 6.0 1.4 13.4 1.0
Gender:
Male 161.4 14.7 6.8 1.8 44.9 50.5 9.8 8.1 25.7 5.0 7.7 7.0 1.2 10.9 .9
Female 128.0 6.4 .8 2.0 31.0 46.7 14.5 5.3 16.2 8.4 7.6 6.1 4.5 1.6 17.0 1.0
Age:
14 - 15 -- -- -- -- -- -- -- -- -- -- -- -- -- -- -- -- -- --
16 - 19 204.0 10.1 -- -- 24.6 125.7 18.5 46.9 45.4 8.3 5.5 -- 10.1 --
20 - 24 247.4 27.6 4.2 45.0 103.0 7.1 8.0 66.1 8.6 1.1 12.4 --
25 - 34 134.4 11.6 6.3 1.4 36.8 42.3 9.0 6.8 20.2 5.2 8.7 8.3 8.3 1.4 10.8 .5
35 - 44 143.5 11.8 2.5 1.0 45.1 44.3 15.5 5.7 18.9 2.6 9.3 4.0 .6 12.1 1.0
45 - 54 130.8 7.7 3.0 2.2 42.3 36.2 10.4 6.5 11.9 4.7 3.1 4.0 2.3 12.0 .5
55 - 64 143.9 6.2 1.1 2.4 33.4 49.0 15.3 5.4 19.2 6.6 3.3 8.0 1.1 19.1 .5
65 and over 109.7 10.7 -- -- 20.4 5.3 33.6 6.5 3.8 8.3 4.1 2.3 -- -- 26.9 --
Major occupational group:
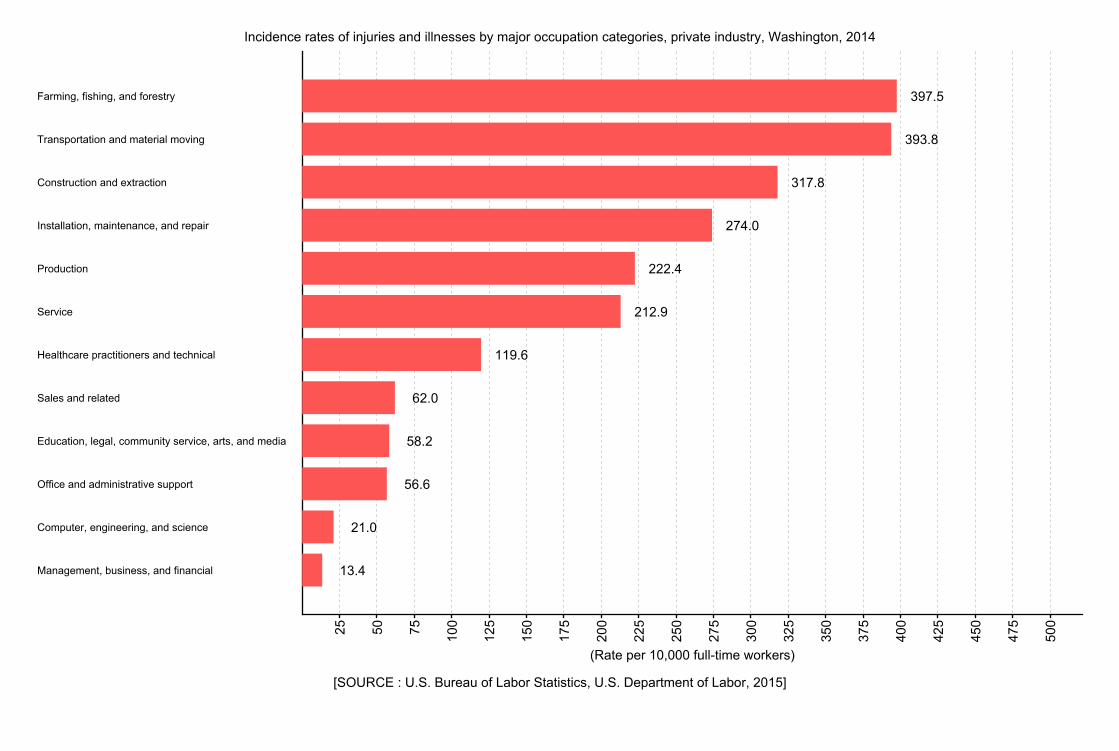
Management occupations 19.2 -- -- -- 3.9 2.3 6.2 -- -- 4.9 -- 5.4 2.1 2.7 -- -- 2.7 --
Business and financial operations occupations 8.2 -- -- -- 2.2 2.2 1.5 -- -- -- -- 2.6 -- -- -- -- -- --
Computer and mathematical occupations 21.3 -- -- -- -- -- 3.8 3.6 -- -- -- -- -- -- -- -- --
Architecture and engineering occupations 11.2 -- -- -- -- -- 8.3 -- -- 6.2 -- -- -- -- -- -- -- --
Life, physical, and social science occupations 60.5 -- -- -- 20.2 25.4 -- -- 17.4 -- -- -- -- -- -- --
Community and social service occupations 60.2 19.7 -- -- 9.9 9.9 14.1 -- -- -- -- -- -- -- -- -- 7.4 --
Legal occupations 28.8 -- -- -- -- -- -- -- -- -- -- -- -- -- -- -- 26.2 --
Education, training, and library occupations 73.9 -- -- -- 16.7 19.5 -- -- 15.6 -- -- -- -- -- --
Arts, design, entertainment, sports, and media occupations 58.1 -- -- -- 9.9 6.6 20.2 -- 16.0 -- -- -- -- -- -- -- --
Healthcare practitioners and technical occupations 119.6 3.8 -- 3.4 46.5 36.7 22.4 2.9 6.0 3.0 7.7 3.3 1.7 1.8 10.2 --
Healthcare support occupations 283.2 13.4 3.8 -- 103.5 93.1 34.1 10.9 20.6 9.6 4.7 4.9 31.2 --
Protective service occupations 85.5 -- -- -- -- -- 14.8 -- -- -- -- -- -- -- 13.9 --
Food preparation and serving related occupations 159.2 6.9 -- 1.2 23.4 85.5 8.8 8.2 47.5 7.9 3.0 4.2 -- 21.6 --
Building and grounds cleaning and maintenance occupations 381.1 15.2 5.3 -- 135.5 120.9 16.3 11.9 64.1 31.5 -- 20.1 --
Personal care and service occupations 186.6 9.1 -- -- 43.2 68.8 6.4 4.5 51.1 2.9 9.5 6.5 -- 21.1 9.4
Sales and related occupations 62.0 3.7 -- .9 21.4 14.7 4.3 3.8 2.8 3.1 5.2 3.2 2.4 1.1 6.0 .9
Office and administrative support occupations 56.6 5.6 1.2 -- 15.7 17.6 6.3 2.9 3.9 3.7 6.0 2.1 1.9 .6 5.0 --
Farming, fishing, and forestry occupations 397.5 32.0 -- 120.8 78.5 23.0 5.6 32.8 7.0 14.3 3.6 48.5 --
Construction and extraction occupations 317.8 36.1 4.1 73.2 112.6 7.9 26.5 71.7 3.5 23.4 -- 10.2 1.7
Installation, maintenance, and repair occupations 274.0 16.7 5.5 4.1 83.1 80.8 23.4 22.2 27.2 5.7 7.5 3.8 15.2 2.1
Production occupations 222.4 27.4 3.8 47.6 91.9 16.0 8.2 48.6 4.9 8.6 -- 15.7 1.9
Transportation and material moving occupations 393.8 31.3 6.6 7.1 105.3 112.6 45.2 15.1 37.9 15.0 2.1 47.8 1.4
Multiple partsAll other body
parts
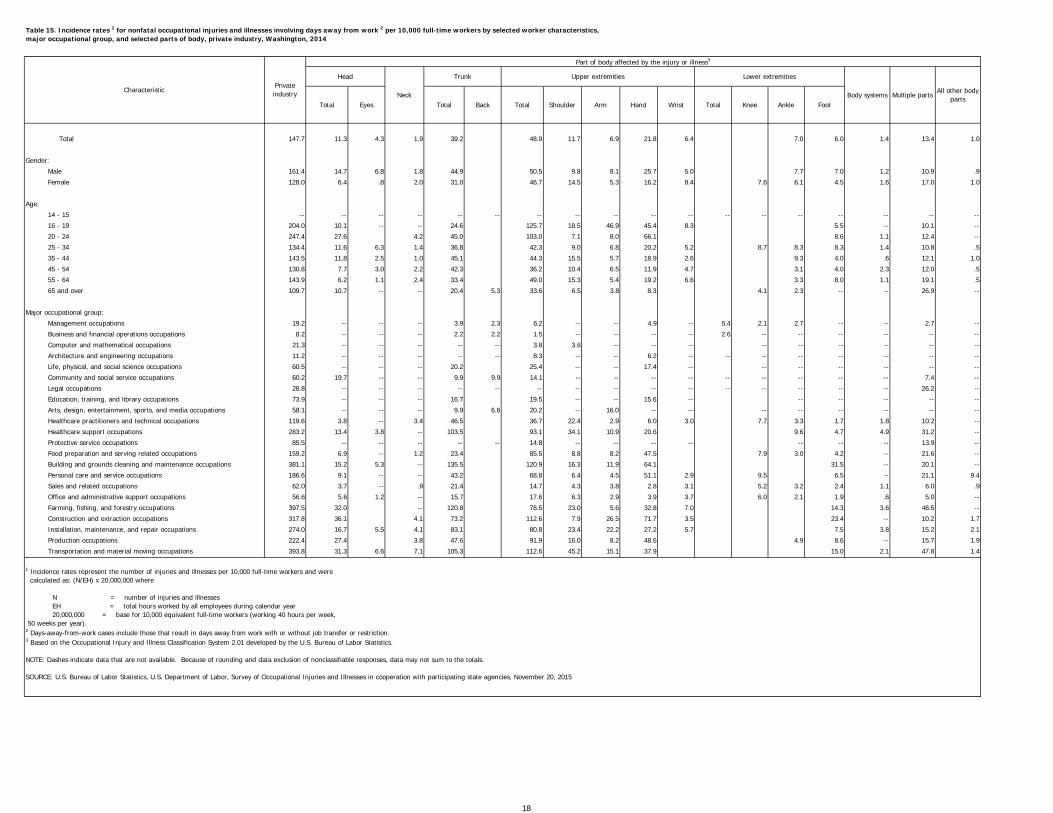
1 Incidence rates represent the number of injuries and illnesses per 10,000 full-time workers and were calculated as: (N/EH) x 20,000,000 where
N = number of injuries and illnesses EH = total hours worked by all employees during calendar year 20,000,000 = base for 10,000 equivalent full-time workers (working 40 hours per week, 50 weeks per year). 2 Days-away-from-work cases include those that result in days away from work with or without job transfer or restriction.3 Based on the Occupational Injury and Illness Classification System 2.01 developed by the U.S. Bureau of Labor Statistics.
NOTE: Dashes indicate data that are not available. Because of rounding and data exclusion of nonclassifiable responses, data may not sum to the totals.
SOURCE: U.S. Bureau of Labor Statistics, U.S. Department of Labor, Survey of Occupational Injuries and Illnesses in cooperation with participating state agencies, November 20, 2015
Table 15. Incidence rates 1 for nonfatal occupational injuries and illnesses involving days away from work 2 per 10,000 full-time workers by selected worker characteristics, major occupational group, and selected parts of body, private industry, Washington, 2014
CharacteristicPrivate industry
Part of body affected by the injury or illness3
Head
Neck
Trunk Upper extremities Lower extremities
Body systems
18
Total Cuts, lacerations
Punctures Total with fractures with sprains
Total 147.7 53.8 11.4 14.8 11.8 3.0 9.2 1.5 .3 .5 1.0 .2 4.0 .7 1.2 32.3 18.8
Gender:
Male 161.4 53.9 14.8 17.3 14.7 2.6 9.5 1.1 .4 .8 .6 .2 3.8 .8 .9 35.4 23.7
Female 128.0 53.8 6.5 11.0 7.7 3.3 8.8 2.1 -- -- 1.4 .2 4.3 .6 1.8 28.1 11.8
Age:
14 - 15 -- -- -- -- -- -- -- -- -- -- -- -- -- -- -- -- --
16 - 19 204.0 45.8 5.8 23.5 18.4 5.1 16.5 5.0 -- -- -- -- 7.8 -- -- 80.2 19.4
20 - 24 247.4 70.1 43.7 33.3 31.8 1.5 14.0 4.4 -- -- -- -- 3.6 -- 1.8 46.3 30.9
25 - 34 134.4 49.0 7.7 15.7 11.0 4.6 10.7 1.4 .3 .9 .8 -- 1.9 -- .7 26.5 19.5
35 - 44 143.5 56.2 6.7 18.3 13.5 4.9 7.6 .9 -- .4 -- -- 2.8 -- .8 34.1 16.1
45 - 54 130.8 56.7 8.0 6.5 5.6 .9 8.2 .9 -- .5 .6 -- 4.9 1.0 1.9 26.1 17.9
55 - 64 143.9 52.7 10.2 10.5 9.2 1.3 6.6 .9 -- -- 3.5 -- 7.0 1.4 1.9 34.7 17.0
65 and over 109.7 25.8 18.9 7.5 7.5 -- 13.8 -- -- -- -- -- 7.4 3.9 -- 26.5 8.0
Major occupational group:
Management occupations 19.2 7.2 -- -- -- -- -- -- -- -- -- -- -- -- -- 6.0 --
Business and financial operations occupations 8.2 4.8 -- -- -- -- -- -- -- -- -- -- -- -- -- 1.2 --
Computer and mathematical occupations 21.3 1.4 14.0 -- -- -- -- -- -- -- -- -- -- -- -- -- 5.5
Architecture and engineering occupations 11.2 2.8 -- 3.6 3.6 -- -- -- -- -- -- -- -- -- -- -- --
Life, physical, and social science occupations 60.5 28.4 -- -- -- -- -- -- -- -- -- -- -- -- -- -- --
Community and social service occupations 60.2 11.8 -- -- -- -- -- -- -- -- -- -- -- -- -- 14.8 19.8
Legal occupations 28.8 -- -- -- -- -- -- -- -- -- -- -- -- -- -- -- --
Education, training, and library occupations 73.9 12.6 7.0 -- -- -- -- -- -- -- -- -- -- -- -- 21.8 25.3
Arts, design, entertainment, sports, and media occupations 58.1 21.1 13.1 -- -- -- -- -- -- -- -- -- -- -- -- 12.1 8.9
Healthcare practitioners and technical occupations 119.6 75.9 4.4 -- -- -- 8.7 1.8 -- -- -- -- 1.9 -- -- 16.6 7.9
Healthcare support occupations 283.2 149.8 8.8 8.4 -- -- 5.8 -- -- -- -- -- 7.0 -- 4.7 76.5 24.4
Protective service occupations 85.5 40.2 -- -- -- -- -- -- -- -- -- -- -- -- -- -- 15.9
Food preparation and serving related occupations 159.2 43.3 4.3 31.6 30.5 1.0 15.4 10.7 -- -- -- -- 3.5 -- 1.7 34.8 14.1
Building and grounds cleaning and maintenance occupations 381.1 118.5 14.9 51.4 42.1 9.2 20.1 -- -- -- 9.2 -- 7.4 3.8 -- 101.3 56.7
Personal care and service occupations 186.6 44.6 6.2 78.5 45.4 33.2 -- -- -- -- -- -- 8.4 -- -- 20.7 25.4
Sales and related occupations 62.0 32.9 3.0 2.1 2.1 -- 5.3 1.2 -- -- -- -- 1.7 -- 1.3 8.1 7.0
Office and administrative support occupations 56.6 27.8 4.5 3.0 2.0 1.1 4.8 -- -- -- -- -- 1.6 1.0 -- 7.7 6.6
Farming, fishing, and forestry occupations 397.5 136.5 24.8 28.8 24.1 4.7 28.6 -- -- -- -- -- 24.9 5.0 12.3 112.6 39.9
Construction and extraction occupations 317.8 59.1 57.6 31.7 24.0 7.6 36.6 -- 1.5 1.7 -- -- 4.9 -- -- 84.0 39.9
Installation, maintenance, and repair occupations 274.0 123.7 14.2 31.6 17.5 14.1 11.2 -- -- 2.9 -- -- 2.9 -- -- 49.3 35.7
Production occupations 222.4 71.3 13.8 32.8 30.1 2.7 10.7 3.0 1.1 1.2 4.5 -- 3.2 -- 1.0 37.5 43.0
Transportation and material moving occupations 393.8 152.8 32.9 15.5 14.5 1.0 18.9 -- -- -- -- -- 15.7 2.7 1.9 108.1 47.1
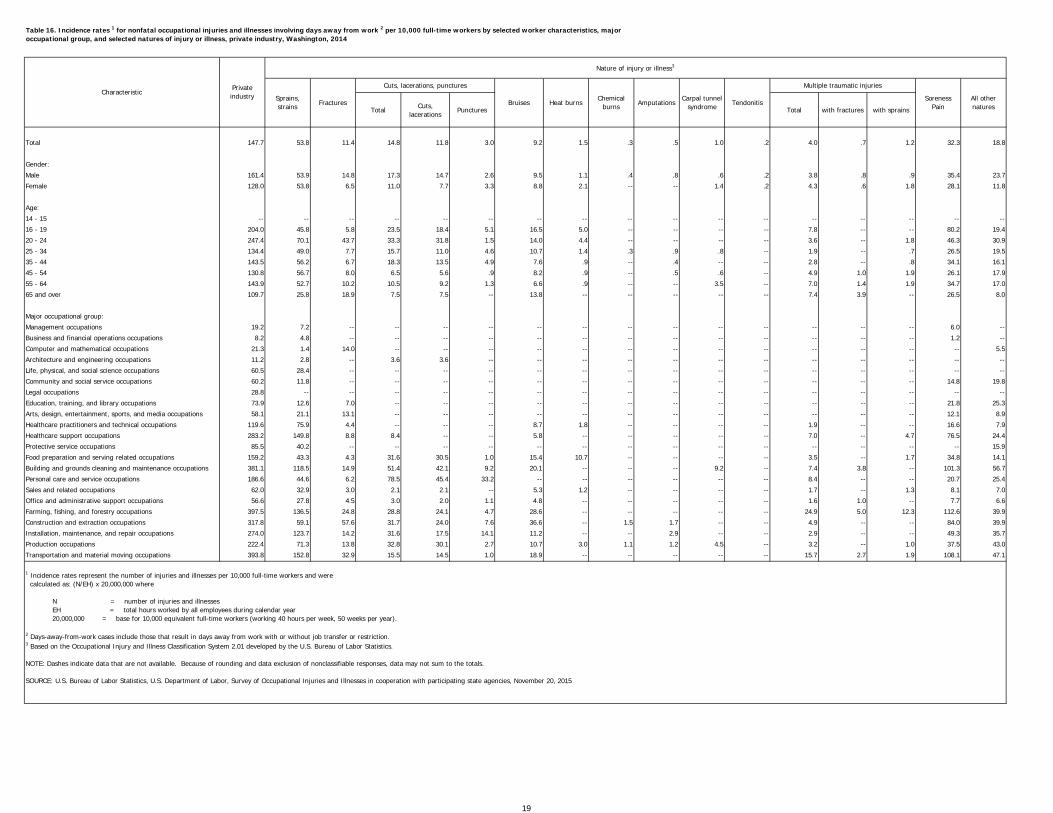
1 Incidence rates represent the number of injuries and illnesses per 10,000 full-time workers and were calculated as: (N/EH) x 20,000,000 where
N = number of injuries and illnesses EH = total hours worked by all employees during calendar year 20,000,000 = base for 10,000 equivalent full-time workers (working 40 hours per week, 50 weeks per year).
2 Days-away-from-work cases include those that result in days away from work with or without job transfer or restriction.3 Based on the Occupational Injury and Illness Classification System 2.01 developed by the U.S. Bureau of Labor Statistics.
NOTE: Dashes indicate data that are not available. Because of rounding and data exclusion of nonclassifiable responses, data may not sum to the totals.
SOURCE: U.S. Bureau of Labor Statistics, U.S. Department of Labor, Survey of Occupational Injuries and Illnesses in cooperation with participating state agencies, November 20, 2015
AmputationsCarpal tunnel
syndrome Tendonitis
Multiple traumatic injuries
Soreness Pain
All other natures
Table 16. Incidence rates 1 for nonfatal occupational injuries and illnesses involving days away from work 2 per 10,000 full-time workers by selected worker characteristics, major occupational group, and selected natures of injury or illness, private industry, Washington, 2014
CharacteristicPrivate industry
Nature of injury or illness3
Sprains, strains Fractures
Cuts, lacerations, punctures
Bruises Heat burnsChemical
burns
19
Chemicals and chemical products
ContainersFurniture and
fixturesMachinery
Parts and materials
Person, other than worker
Health care patient
Person, injured or ill
worker
Worker motion or position
Floors, walkways, or
ground surfaces
Handtools Vehicles All other sources
Total 147.7 1.5 18.6 6.0 8.2 12.8 8.3 4.5 24.6 24.1 19.3 9.8 13.3 20.9
Gender:
Male 161.4 1.3 19.0 7.3 11.5 19.6 2.2 1.2 24.8 24.2 14.9 11.8 17.0 26.2
Female 128.0 1.8 18.1 4.2 3.4 3.0 17.1 9.2 24.4 23.9 25.6 6.9 7.9 13.0
Age:
14 - 15 -- -- -- -- -- -- -- -- -- -- -- -- -- --
16 - 19 204.0 -- 21.2 -- 16.9 23.3 11.4 4.4 22.0 22.0 9.4 52.5 16.3 22.3
20 - 24 247.4 2.2 32.0 13.1 15.3 15.1 8.7 3.1 32.8 31.9 37.7 26.4 26.4 34.1
25 - 34 134.4 2.2 16.7 4.9 10.7 11.6 7.6 4.3 22.4 22.3 9.1 8.3 10.4 23.8
35 - 44 143.5 1.6 14.5 4.4 5.5 13.7 11.2 5.2 22.0 21.6 19.8 12.9 9.5 22.7
45 - 54 130.8 .8 22.3 5.2 5.1 11.6 7.4 5.1 23.6 22.4 17.2 4.8 14.7 15.0
55 - 64 143.9 .7 16.5 9.0 8.2 13.2 7.3 4.4 31.2 30.6 22.6 3.6 14.1 15.3
65 and over 109.7 -- 7.5 -- 6.6 7.5 2.5 -- 11.3 11.0 45.8 -- 14.8 8.8
Major occupational group:
Management occupations 19.2 -- 1.7 -- -- -- 1.4 -- 5.8 5.5 5.1 -- 1.5 --
Business and financial operations occupations 8.2 -- -- -- -- -- -- -- 2.5 2.4 1.5 -- -- --
Computer and mathematical occupations 21.3 -- -- -- -- -- -- -- 4.1 4.0 14.3 -- -- --
Architecture and engineering occupations 11.2 -- -- -- 2.6 3.6 -- -- 2.8 2.8 -- -- -- --
Life, physical, and social science occupations 60.5 -- 11.1 -- -- -- -- -- -- -- 20.9 -- -- --
Community and social service occupations 60.2 -- -- -- -- -- 13.9 -- -- -- -- -- 23.5 --
Legal occupations 28.8 -- -- -- -- -- -- -- 23.2 23.2 -- -- -- --
Education, training, and library occupations 73.9 -- -- -- -- -- 16.6 -- 24.9 24.9 15.2 -- -- 13.8
Arts, design, entertainment, sports, and media occupations 58.1 -- -- -- -- -- -- -- 20.9 19.2 -- -- 18.9 --
Healthcare practitioners and technical occupations 119.6 -- 6.0 6.1 2.3 -- 44.0 40.9 22.0 20.2 18.1 -- 3.3 16.4
Healthcare support occupations 283.2 9.2 4.9 6.5 6.8 -- 154.2 95.2 37.4 36.8 35.8 -- -- 24.4
Protective service occupations 85.5 -- -- -- -- -- 10.9 -- 23.8 17.7 22.4 -- -- --
Food preparation and serving related occupations 159.2 -- 38.3 8.3 6.7 1.8 -- -- 24.0 23.7 35.0 20.3 2.3 21.2
Building and grounds cleaning and maintenance occupations 381.1 -- 68.9 11.6 14.6 19.5 -- -- 53.5 52.5 38.7 59.5 17.2 85.0
Personal care and service occupations 186.6 -- -- -- -- -- 46.7 -- 35.0 34.9 19.3 45.4 -- 33.2
Sales and related occupations 62.0 1.0 17.3 4.7 1.9 2.3 -- -- 13.4 13.1 7.6 .9 7.1 4.9
Office and administrative support occupations 56.6 -- 17.8 2.2 2.1 .9 .8 -- 10.8 10.6 11.4 .8 5.5 3.4
Farming, fishing, and forestry occupations 397.5 -- 40.0 4.4 16.0 26.6 -- -- 58.1 57.3 32.0 15.5 32.9 83.9
Construction and extraction occupations 317.8 2.2 10.5 15.1 36.5 53.7 -- -- 23.5 23.5 36.8 40.7 7.5 73.7
Installation, maintenance, and repair occupations 274.0 -- 8.3 6.3 15.6 44.1 -- -- 69.1 66.0 19.5 21.7 18.1 51.9
Production occupations 222.4 3.2 20.2 9.4 28.7 43.8 -- -- 31.5 31.0 24.7 13.6 10.3 35.1
Transportation and material moving occupations 393.8 2.9 68.0 22.0 13.5 33.8 2.3 -- 70.7 70.0 45.2 8.0 94.3 31.2
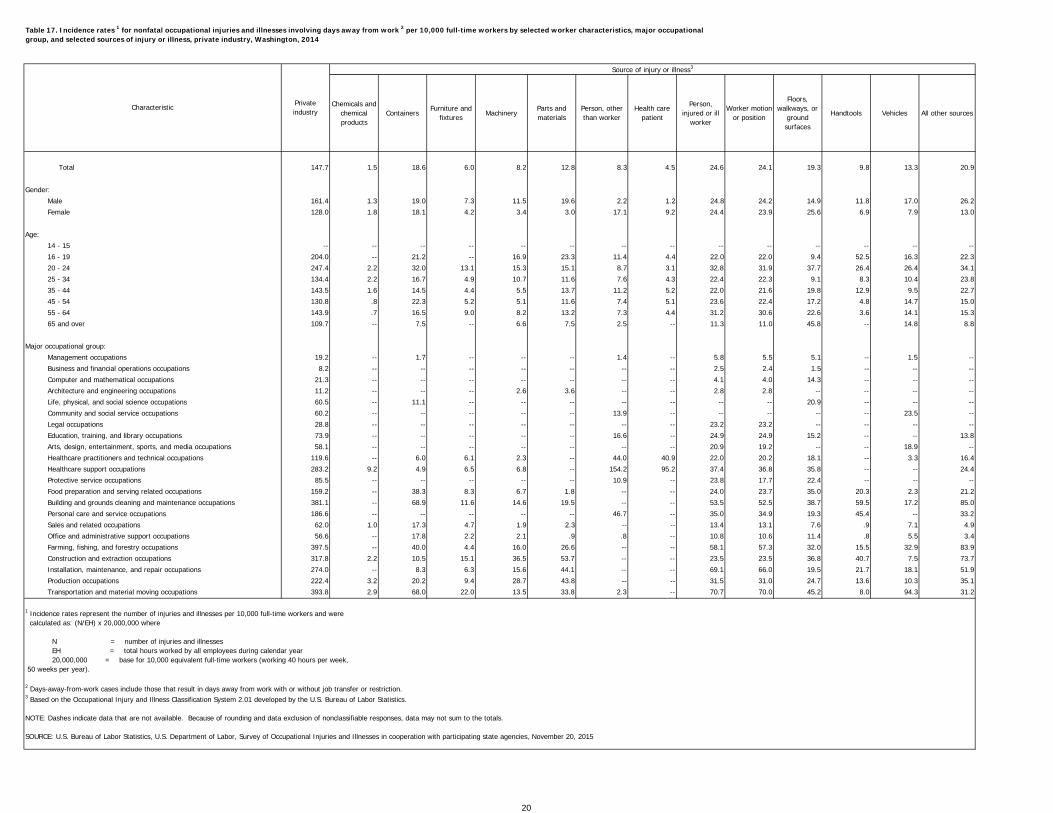
Table 17. Incidence rates 1 for nonfatal occupational injuries and illnesses involving days away from work 2 per 10,000 full-time workers by selected worker characteristics, major occupational group, and selected sources of injury or illness, private industry, Washington, 2014
CharacteristicPrivate industry
Source of injury or illness3
1 Incidence rates represent the number of injuries and illnesses per 10,000 full-time workers and were calculated as: (N/EH) x 20,000,000 where
N = number of injuries and illnesses EH = total hours worked by all employees during calendar year 20,000,000 = base for 10,000 equivalent full-time workers (working 40 hours per week, 50 weeks per year).
2 Days-away-from-work cases include those that result in days away from work with or without job transfer or restriction.3 Based on the Occupational Injury and Illness Classification System 2.01 developed by the U.S. Bureau of Labor Statistics.
NOTE: Dashes indicate data that are not available. Because of rounding and data exclusion of nonclassifiable responses, data may not sum to the totals.
SOURCE: U.S. Bureau of Labor Statistics, U.S. Department of Labor, Survey of Occupational Injuries and Illnesses in cooperation with participating state agencies, November 20, 2015
20
TotalStruck by
objectStruck against
object
Caught in or compressed or
crushedTotal
Fall to lower level
Fall on same level
Slips or trips without fall
Total In lifting TotalRoadway accidents
TotalIntentional injury by
other person
Injury by person—unint
entional or intent
unknown
Animal and insect related
incidents
Total 147.7 37.2 20.8 9.3 5.0 35.5 10.8 17.7 6.4 58.5 4.9 4.4 5.9 3.1 .1 1.7 .8 1.8 1.7 Gender: Male 161.4 47.5 25.1 12.1 7.2 34.6 14.8 13.2 5.7 62.7 3.6 4.3 7.5 3.8 .1 .5 .3 2.0 1.9Female 128.0 22.3 14.5 5.3 1.9 36.9 5.0 24.3 7.6 52.5 6.9 4.6 3.6 2.1 -- 3.5 1.6 1.7 1.4 Age: 14 - 15 -- -- -- -- -- -- -- -- -- -- -- -- -- -- -- -- -- -- -- -- --16 - 19 204.0 65.8 37.2 11.9 14.4 14.3 4.5 6.6 -- 102.4 -- 10.4 5.0 -- -- -- -- -- --20 - 24 247.4 82.7 46.6 19.6 12.9 61.0 30.7 25.0 4.6 73.8 6.1 11.4 12.0 3.5 -- 1.5 -- 3.8 --25 - 34 134.4 38.7 24.3 5.7 5.8 25.0 8.4 8.8 7.0 52.4 4.3 4.7 6.0 3.1 -- .8 1.7 3.3 1.735 - 44 143.5 35.9 22.5 7.8 3.6 37.3 10.5 19.3 7.2 56.1 3.4 3.3 4.1 2.7 -- 4.0 .6 1.1 1.145 - 54 130.8 24.3 11.1 7.6 4.0 30.5 8.1 16.0 5.3 62.1 4.3 3.8 5.1 2.7 -- .7 .9 1.8 1.355 - 64 143.9 31.5 15.1 11.8 3.3 40.7 9.1 23.0 8.2 61.7 9.9 1.9 5.5 3.5 -- .9 -- -- 1.665 and over 109.7 17.8 -- 15.3 -- 56.3 9.3 45.0 -- 21.8 -- 2.5 9.6 8.4 -- -- -- -- -- -- Major occupational group: Management occupations 19.2 2.6 -- -- -- 5.7 -- 4.3 -- 9.1 3.8 -- -- -- -- -- -- -- -- --Business and financial operations occupations 8.2 -- -- -- -- 3.4 -- -- 1.5 3.4 -- -- -- -- -- -- -- -- -- --Computer and mathematical occupations 21.3 -- -- -- -- 14.3 -- 13.9 -- 4.4 -- 3.8 -- -- -- -- -- -- -- -- --Architecture and engineering occupations 11.2 3.9 -- 3.7 -- -- -- -- -- 5.5 -- -- -- -- -- -- -- -- -- -- --Life, physical, and social science occupations 60.5 12.0 12.0 -- -- 32.7 -- 20.9 -- 13.5 -- -- -- -- -- -- -- -- -- --Community and social service occupations 60.2 10.7 -- 9.9 -- 7.1 -- -- -- 9.5 -- -- -- 12.4 12.4 -- 6.8 -- -- --Legal occupations 28.8 -- -- -- -- -- -- -- -- 23.2 -- 23.2 -- -- -- -- -- -- -- -- --Education, training, and library occupations 73.9 -- -- -- -- 18.3 -- 14.8 -- 25.0 -- -- -- -- -- -- -- 12.9 -- --Arts, design, entertainment, sports, and media occupations 58.1 -- -- -- -- 10.7 -- -- -- 18.9 -- -- -- 18.9 -- -- -- -- -- -- --Healthcare practitioners and technical occupations 119.6 8.6 4.2 3.0 -- 21.0 2.7 16.6 1.7 76.1 6.4 3.1 -- -- -- 2.6 5.6 -- --Healthcare support occupations 283.2 12.4 7.7 3.4 -- 41.9 3.8 33.2 4.9 183.9 16.3 14.9 -- -- -- 15.4 6.2 6.3 --Protective service occupations 85.5 -- -- -- -- 33.5 -- 12.4 11.1 20.5 -- -- -- -- -- -- -- -- -- --Food preparation and serving related occupations 159.2 53.2 35.6 14.5 2.8 45.5 1.6 35.4 8.5 46.2 6.2 11.3 -- -- -- -- -- -- -- 1.6Building and grounds cleaning and maintenance occupations 381.1 98.7 13.2 7.0 67.6 8.8 39.3 18.8 165.8 12.0 5.0 7.3 5.0 -- -- -- 3.1 10.5Personal care and service occupations 186.6 52.7 50.4 -- -- 38.7 -- 18.9 18.5 37.1 -- 5.1 -- -- -- 30.4 -- 11.0 9.4Sales and related occupations 62.0 10.8 7.6 2.7 -- 10.2 1.2 7.7 1.3 33.9 2.7 2.6 3.5 2.5 -- -- -- -- -- --Office and administrative support occupations 56.6 10.6 4.8 3.8 .9 16.8 2.6 10.6 3.6 26.5 2.6 .9 .9 -- -- -- -- -- --Farming, fishing, and forestry occupations 397.5 61.3 26.5 11.7 149.8 86.4 29.7 33.3 85.9 -- 6.8 23.3 5.9 -- -- -- 19.6 --Construction and extraction occupations 317.8 65.7 23.5 25.7 87.7 61.0 15.8 9.8 94.3 -- 2.6 4.7 2.6 -- -- -- -- -- 2.5Installation, maintenance, and repair occupations 274.0 58.9 29.6 17.5 7.9 58.6 29.2 16.2 12.4 129.5 2.9 6.0 2.5 1.8 -- -- -- 11.2 6.2Production occupations 222.4 81.4 33.2 25.8 17.6 33.5 7.1 20.2 4.9 90.7 13.7 11.9 -- -- -- -- -- -- 2.4Transportation and material moving occupations 393.8 80.5 39.9 22.7 12.5 104.1 30.9 52.1 17.1 152.5 8.5 5.8 45.2 24.2 -- 1.6 -- -- 3.2
Fires and explosions
Violence and other injuries by persons or animal
All other events
1 Incidence rates represent the number of injuries and illnesses per 10,000 full-time workers and were calculated as: (N/EH) x 20,000,000 where
N = number of injuries and illnesses EH = total hours worked by all employees during calendar year 20,000,000 = base for 10,000 equivalent full-time workers (working 40 hours per week, 50 weeks per year).
2 Days-away-from-work cases include those that result in days away from work with or without job transfer or restriction.3 Based on the Occupational Injury and Illness Classification System 2.01 developed by the U.S. Bureau of Labor Statistics.
NOTE: Dashes indicate data that are not available. Because of rounding and data exclusion of nonclassifiable responses, data may not sum to the totals.
SOURCE: U.S. Bureau of Labor Statistics, U.S. Department of Labor, Survey of Occupational Injuries and Illnesses in cooperation with participating state agencies, November 20, 2015
Table 18. Incidence rates 1 for nonfatal occupational injuries and illnesses involving days away from work 2 per 10,000 full-time workers by selected worker characteristics, major occupational group, and selected events or exposures leading to injury or illness, private industry, Washington, 2014
CharacteristicPrivate industry
Event or exposure leading to injury or illness3
Contact with objects Falls, slips, trips Overexertion
Repetitive motion
involving microtasks
Exposure to harmful
substance or environment
Transportation accidents
21
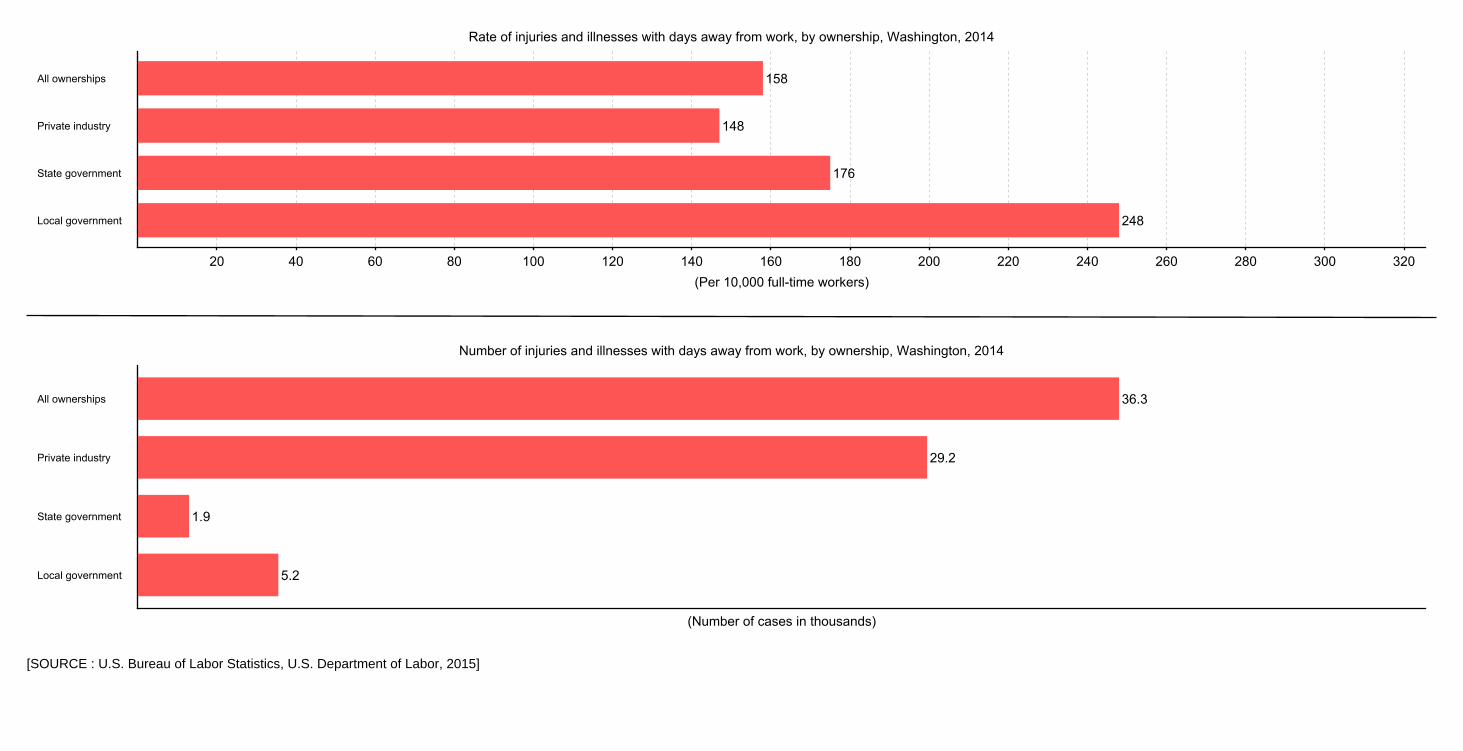
[SOURCE : U.S. Bureau of Labor Statistics, U.S. Department of Labor, 2015]