findings from the survey of occupational injuries and ... · pdf filefindings from the survey...
TRANSCRIPT

Findings from the Survey of Occupational Injuries and Illnesses (SOII), California, 2014
Department of Industrial Relations Office of the Director—Research Unit
November 2015

Findings from the Survey of Occupational Injuries and Illnesses (SOII), California, 2014
Overview Over 460,000 nonfatal workplace injuries and illnesses were reported by private-sector and public-sector employers in California in 2014, occurring at a rate of 3.8 cases per 100 equivalent full-time workers, according to estimates from the Survey of Occupational Injuries and Illnesses (SOII) conducted by the U.S. Bureau of Labor Statistics (BLS) and the California Department of Industrial Relations (DIR).1 The incidence rate reported for 2014 continues a pattern of declines over the previous 12 years. (See Chart 1.) CHART 1
1 The estimates are based on injuries and illnesses reported by a sample of 16,000 employers in California. See Appendix 2, Technical Note.
6.0 5.9 5.4
5.1 4.8 4.7
4.4 4.2 4.2 4.0 4.0 4.0 3.8
3.5 3.3 3.1 2.8 2.7 2.6 2.4 2.3 2.3 2.2 2.3 2.2 2.2 2.0 1.9 1.7 1.5 1.3 1.3 1.3 1.2 1.2 1.2 1.2 1.2 1.2
2002 2003 2004 2005 2006 2007 2008 2009 2010 2011 2012 2013 2014
All Cases Lost-Worktime Cases Days-Away-from-Work CasesData Source: U.S. Bureau of Labor Statistics, Survey of Occupational Injury and Illness, in cooperation with the California Department of Industrial Relations.
Incidence of Nonfatal Occupational Injury and Illness per 100 Full-Time Workers in California, 2002-2014, All Industry Sectors

Of the 460,000 recordable cases of occupational injury and illness estimated for California in 2014, 265,000 were lost-time cases,2 and nearly 143,000 cases with days away from work. (See Chart 2.) Nearly 354,000 private-sector workers reported injuries in 2014, along with 21,000 state government and 85,000 local government workers. Overall, these figures show a slight decrease in the number of nonfatal injuries and illnesses in all recordable cases from 2013 to 2014. CHART 2
The number of lost work-time cases is very close to that in 2013, and there is a small decrease in the number of days-away-from-work cases. Total case counts in private industry and local government are also slightly lower, while state government cases have risen slightly. In 2014, incidence rates dropped very slightly for private, state, and local government workers. By industry, incidence rates have fallen across most sectors (private
2 In this brief, the term “lost work-time cases” is used synonymously with what the U.S. Bureau of Labor Statistics describes as “cases involving days away from work, job transfer, or restriction” (or DART cases). Job transfer or restriction cases occur when, as a result of a work-related injury or illness, an employer or health-care professional keeps or recommends keeping an employee from performing the routine functions of his or her job or from working the full workday that the employee would have been scheduled to work before the injury or illness occurred. Cases involving days away from work are those that require at least one day away from work with or without days of job transfer or restriction.
694.1 684.7 645.1 629.9 603.0 594.4
541.8 491.9 464.1 440.9 451.5 468.4 460.7
404.1 387.0 367.3 344.1 340.4 328.6 298.4
269.3 257.1 243.6 257.1 265.0 265.1 231.8 223.5 201.4 179.4 171.0 168.2 158.9 142.3 137.4 134.2 140.1 146.8 142.8
2002 2003 2004 2005 2006 2007 2008 2009 2010 2011 2012 2013 2014
All Recordable Cases Lost-Worktime Cases Days-Away-from-Work Cases
Nonfatal Occupational Injuries and Illnesses, California, 2002-2014 (1,000s)
Data Source: U.S. Bureau of Labor Statistics, Survey of Occupational Injury and Illness, in cooperation with the California Department of Industrial Relations.

industry in total, agriculture, and wholesale and retail trade), while they remained flat in manufacturing and grew in construction.
Injuries and Illnesses Involving Days Away from Work The Survey of Occupational Injuries and Illnesses includes detailed findings for cases involving days away from work (DAFW) cases. The charts in this report refer to those cases.
Over 77 percent of reported DAFW injuries and illnesses occurred in private-sector employment; state government accounted for 5 percent of the total, and local government 18 percent. (See Chart 3.)
CHART 3
Reported DAFW incidence rates (injuries and illnesses per 10,000 workers) differ substantially between private-sector and government workers, whether state or local. In 2014, the reported rate of DAFW injury or illness among government workers was approximately twice that of private-sector employers. (See Chart 4.)
0
20
40
60
80
100
120
140
160
All ownershiptypes
Privateindustry
Stategovernment
Localgovernment
Days Away from Work (DAFW) Cases, Injury and Illness,
California, 2014 (1,000s)

CHART 4
Compared to 2013, the incidence rate for all ownership types dropped from 1.1 to 1.0 case per 100 workers, equaling the national rate. Nearly 83,000 DAFW injuries, or 76 percent of those in private industry, occurred in service-sector industries. The remaining 26,000 injuries, or 24 percent, occurred in goods-producing industries.
Racial and Ethnic Origin Racial or ethnic origin was reported for approximately 60 percent of surveyed lost-time cases in California’s 2014 SOII. Prior DIR analyses estimated that approximately 47 percent of the private-sector
0
50
100
150
200
250
All ownershiptypes
Private industry State government Local government
Incidence of DAFW Injury and Illness per 10,000 employees,
California, 2014

California workforce in goods-producing and service industries are Hispanic or Latino.3 Of reported DAFW injury and illness cases in SOII, Hispanic workers make up 59 percent of the private-sector lost-time total, while whites account for 27 percent and Asian and black workers 7 percent and 6 percent, respectively. (See Chart 5.) In goods-producing industries (construction, manufacturing, mining, and natural resources), Hispanic workers comprise approximately 48 percent of the workforce but 75 percent of the total injuries, while in service-sector industries (trade, transportation, utilities, information services, financial activities, etc.). Hispanics account for 46 percent of the workforce and 52 percent of reported injuries. Compared to 2013, in 2014 a higher number and share of nonfatal injuries and illnesses with days away from work were incurred by persons of Hispanic or Latino origin, by Asian workers, and by black workers. Only white workers experienced a smaller number and share of these injuries and illnesses in 2014.
CHART 5
3 http://www.dir.ca.gov/DOSH/CFOI/fatalities-hispanic-latino-workers-in-california-2009-2013.pdf. See table 2 for FTE estimates for relevant industries.
White only 27%
Black only 6%
Hispanic or Latino only 59%
Asian only 7%
Other 1%
Racial and Ethnic Origin of Reported DAFW Work Injuries and Illnesses, California, 2014
Data Source: U.S. Bureau of Labor Statistics, Survey of Occupational Injury and Illness, in cooperation with California Department of Industrial Relations. Note: Racial/Ethnic Origin not reported in 40% of cases.

Length of Service with Employer Overall, 26 percent of reported DAFW work injuries in private industry in California occurred among workers with less than a year of tenure. (See Chart 6.) At goods-producing firms in the private sector, nearly a third of DAFW injuries and illnesses occurred within a year of hire; in the natural resources and mining sector in California, 46 percent of those injuries occurred within a year of hire with almost one-quarter during the first three months of work.
CHART 6
Less than 3 months
10% 3 to 11 months
18%
1 to 5 years 34%
More than 5 years
38%
Length of Service with Employer Before Reported DAFW Injury or Illness, California, 2014
Data Source: U.S. Bureau of Labor Statistics, Survey of Occupational Injury and Illness, in cooperation with California Department of Industrial Relations.
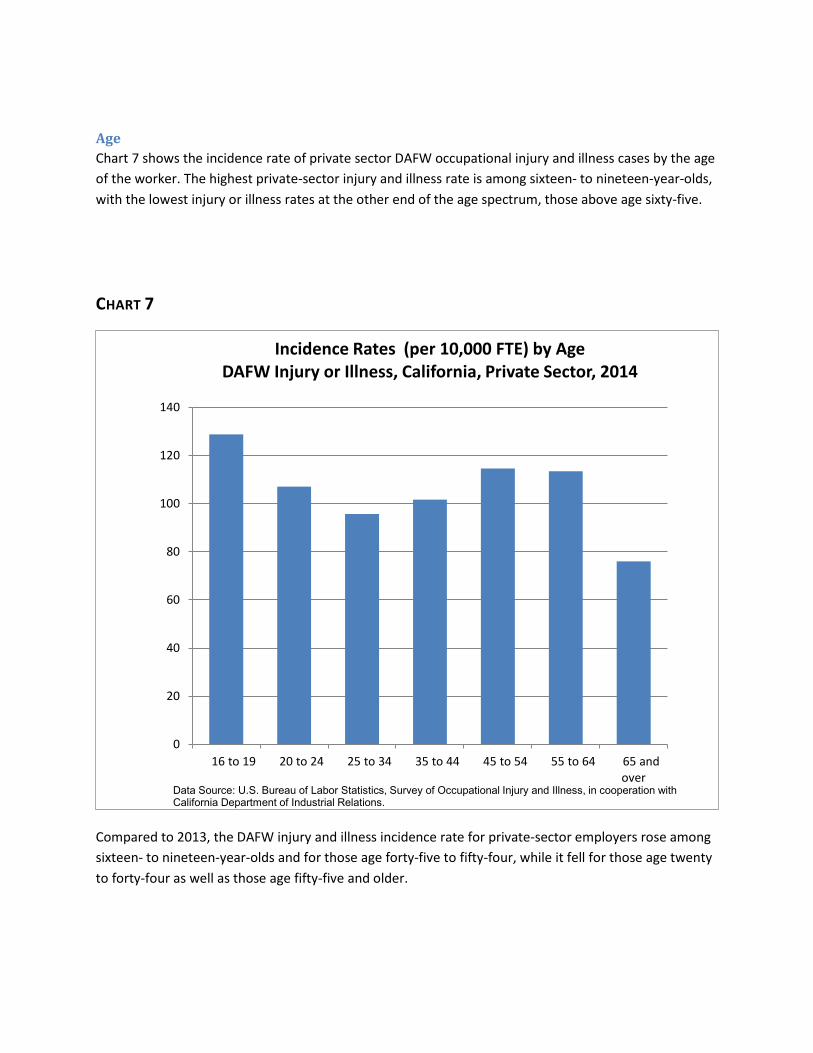
Age Chart 7 shows the incidence rate of private sector DAFW occupational injury and illness cases by the age of the worker. The highest private-sector injury and illness rate is among sixteen- to nineteen-year-olds, with the lowest injury or illness rates at the other end of the age spectrum, those above age sixty-five.
CHART 7
Compared to 2013, the DAFW injury and illness incidence rate for private-sector employers rose among sixteen- to nineteen-year-olds and for those age forty-five to fifty-four, while it fell for those age twenty to forty-four as well as those age fifty-five and older.
0
20
40
60
80
100
120
140
16 to 19 20 to 24 25 to 34 35 to 44 45 to 54 55 to 64 65 andover
Incidence Rates (per 10,000 FTE) by Age DAFW Injury or Illness, California, Private Sector, 2014
Data Source: U.S. Bureau of Labor Statistics, Survey of Occupational Injury and Illness, in cooperation with California Department of Industrial Relations.
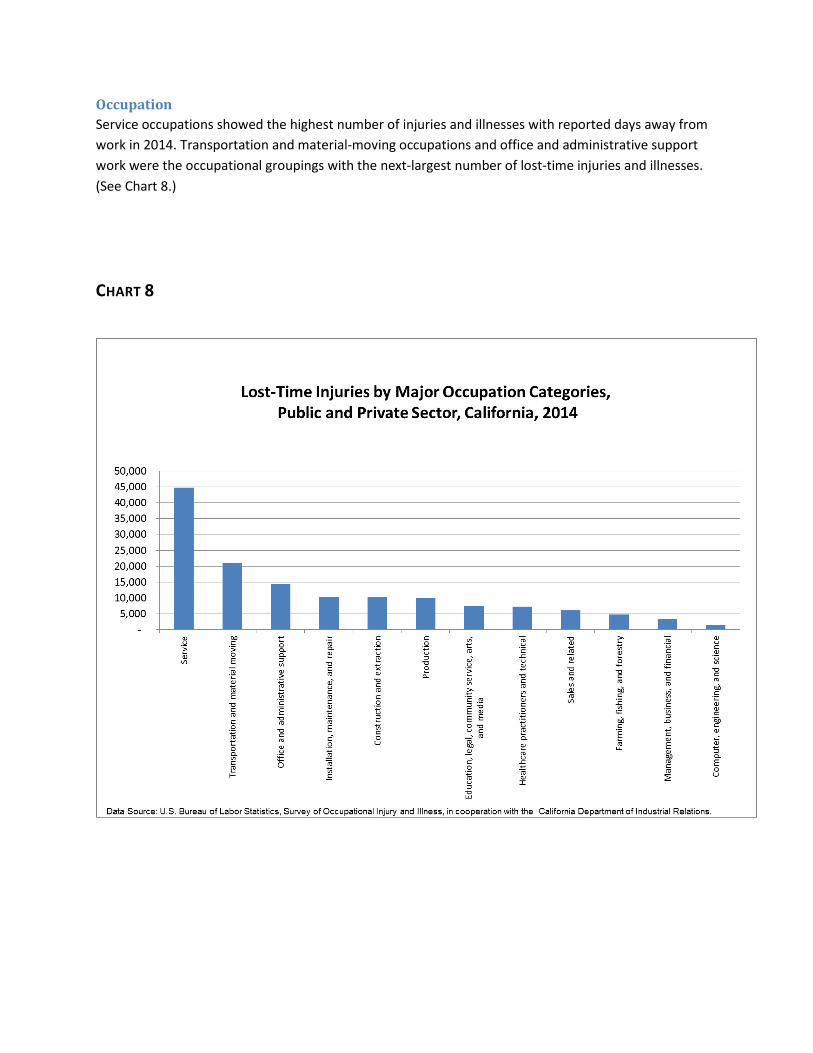
Occupation Service occupations showed the highest number of injuries and illnesses with reported days away from work in 2014. Transportation and material-moving occupations and office and administrative support work were the occupational groupings with the next-largest number of lost-time injuries and illnesses. (See Chart 8.)
CHART 8

Cause of Injury and Illness Among private-sector workers, the highest number of lost-time injuries were caused by overexertion and bodily reaction, by contact with an object or piece of equipment, and by falls, trips, and slips. Other major causes of lost-time injuries and illness included exposure to harmful substances or environments, transportation incidents and workplace violence. (See Chart 9.)
CHART 9

Nature of Injury and Illness The largest number of injuries and illnesses involving days away from work in the private sector were sprains, strains, and tears, followed by soreness and pain. (See Chart 10.)
CHART 10

Part of Body Injured In 2014, the upper extremities, trunk, and lower extremities were the body parts with the highest number of injuries and illnesses involving days away from work in private-sector firms. (See Chart 11.)
CHART 11
Conclusion This brief summarizes reported occupational injury and illness data from the Survey of Occupational Injuries and Illnesses (SOII) program for California for 2014. The annual survey is jointly administered by the U.S. Department of Labor, Bureau of Labor Statistics, and the California Department of Industrial Relations, Office of Policy, Research and Legislation. It is compiled from surveys completed by 16,000 statistically represented California employers and based upon data required to be collected under the Occupational Safety and Health Act. Data for California for 2014 are available at http://www.dir.ca.gov/oprl/nonfatal.htm and include detailed summary tables as well as case and demographic data for private-sector and public-sector employers.
The number and incidence rates of reported occupational injury and illness in 2014 remain at levels markedly lower than those of a decade earlier. For cases involving days away from work, the highest number and incidence of workplace injuries are among Hispanic workers: 59 percent of all reported cases. In construction, manufacturing, mining, and natural resources, three out of four workers injured
Upperextremities
Trunk Lowerextremities
Multiple Head Bodysystems
Neck All other0
5,00010,00015,00020,00025,00030,00035,00040,000
DAFW Injury or Illness by Part of Body Injured, California, 2014, Private-Sector Firms
Data Source: U.S. Bureau of Labor Statistics, Survey of Occupational Injury and Illness, in cooperation with the California Department of Industrial Relations.

on the job and losing work days are Hispanics. In the service sector, one of every two workers so injured is Hispanic.
One of every four workers whose injury or illness at work involved days away from work in private industry are new hires (tenure of less than a year).
Young workers (age sixteen to nineteen) suffered the highest incidence of DAFW injury or illness of all age groups in private-sector employment.
Service occupations had the highest number of DAFW occupational injuries or illnesses in 2014, followed by transportation, material-moving occupations, and office and administrative work.
Sprains, strains, and tears are the largest category of DAFW cases by nature of injury. The most prevalent injuries in California’s private sector are upper-extremity disorders. Among private-sector workers, the highest number of injuries or illnesses resulting in days away from work were caused by overexertion and bodily reaction, by contact with an object or piece of equipment, and by falls, trips, and slips.
Appendices
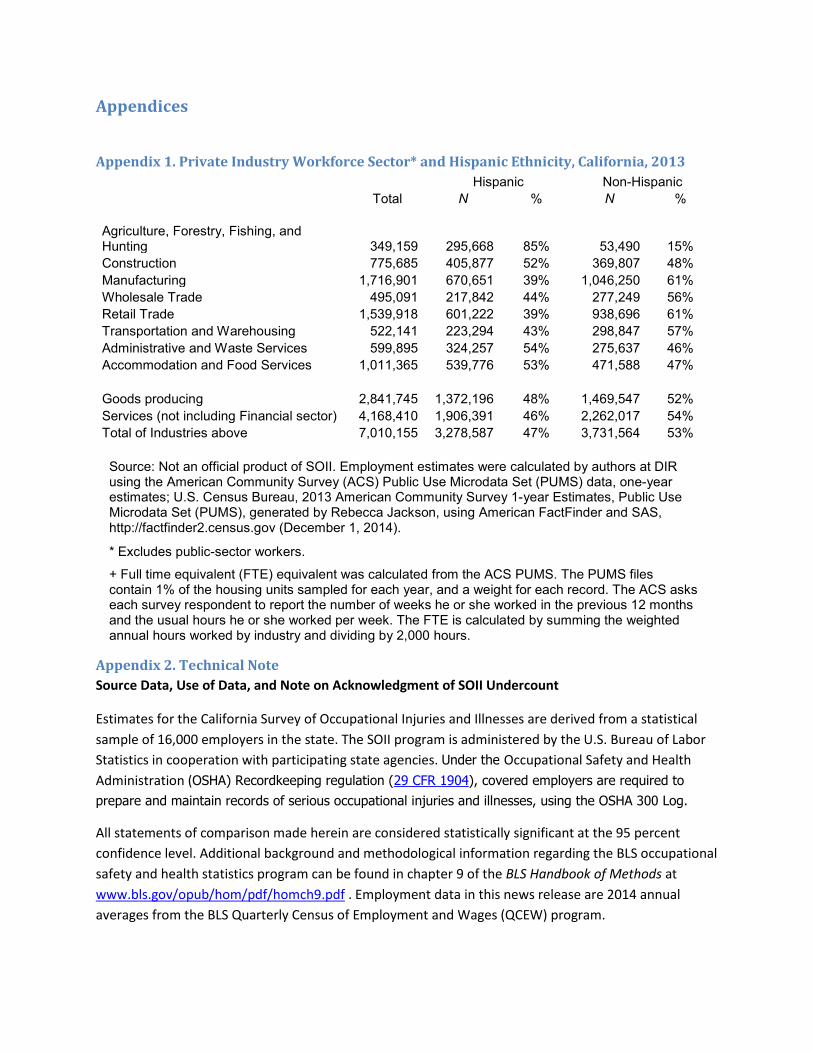
Appendix 1. Private Industry Workforce Sector* and Hispanic Ethnicity, California, 2013 Hispanic Non-Hispanic
Total N % N %
Agriculture, Forestry, Fishing, and Hunting 349,159 295,668 85% 53,490 15% Construction 775,685 405,877 52% 369,807 48% Manufacturing 1,716,901 670,651 39% 1,046,250 61% Wholesale Trade 495,091 217,842 44% 277,249 56% Retail Trade 1,539,918 601,222 39% 938,696 61% Transportation and Warehousing 522,141 223,294 43% 298,847 57% Administrative and Waste Services 599,895 324,257 54% 275,637 46% Accommodation and Food Services 1,011,365 539,776 53% 471,588 47%
Goods producing 2,841,745 1,372,196 48% 1,469,547 52% Services (not including Financial sector) 4,168,410 1,906,391 46% 2,262,017 54% Total of Industries above 7,010,155 3,278,587 47% 3,731,564 53% Source: Not an official product of SOII. Employment estimates were calculated by authors at DIR using the American Community Survey (ACS) Public Use Microdata Set (PUMS) data, one-year estimates; U.S. Census Bureau, 2013 American Community Survey 1-year Estimates, Public Use Microdata Set (PUMS), generated by Rebecca Jackson, using American FactFinder and SAS, http://factfinder2.census.gov (December 1, 2014).
* Excludes public-sector workers.
+ Full time equivalent (FTE) equivalent was calculated from the ACS PUMS. The PUMS files contain 1% of the housing units sampled for each year, and a weight for each record. The ACS asks each survey respondent to report the number of weeks he or she worked in the previous 12 months and the usual hours he or she worked per week. The FTE is calculated by summing the weighted annual hours worked by industry and dividing by 2,000 hours.
Appendix 2. Technical Note Source Data, Use of Data, and Note on Acknowledgment of SOII Undercount
Estimates for the California Survey of Occupational Injuries and Illnesses are derived from a statistical sample of 16,000 employers in the state. The SOII program is administered by the U.S. Bureau of Labor Statistics in cooperation with participating state agencies. Under the Occupational Safety and Health Administration (OSHA) Recordkeeping regulation (29 CFR 1904), covered employers are required to prepare and maintain records of serious occupational injuries and illnesses, using the OSHA 300 Log.
All statements of comparison made herein are considered statistically significant at the 95 percent confidence level. Additional background and methodological information regarding the BLS occupational safety and health statistics program can be found in chapter 9 of the BLS Handbook of Methods at www.bls.gov/opub/hom/pdf/homch9.pdf . Employment data in this news release are 2014 annual averages from the BLS Quarterly Census of Employment and Wages (QCEW) program.
According to the BLS, the data are used to identify and correct hazards in the workplace. National and state policy makers use the survey as an indicator of the occupational safety and health conditions across industries and kinds of workers. OSHA uses the statistics to help determine where additional measures are needed to improve safety programs and to gauge the effectiveness of the 1970 act in reducing work-related injuries and illnesses. Both labor and management use the estimates to design and evaluate safety programs. Other users include insurance carriers involved in workers’ compensation, industrial hygienists, manufacturers of safety equipment, researchers, and others concerned with job safety and health. The BLS has long acknowledged that some conditions that often are difficult for employers to relate to the workplace are not adequately recognized and reported during a calendar year (for example, long-term latent illnesses) and are believed to be understated in SOII illness measures. Following several studies in the mid-2000s questioning the completeness of SOII injury and illness counts, the BLS began internal research in 2007 and, at the request of Congress, established an ongoing research program. Initial research conducted between 2009 and 2012 found that the SOII failed to capture some cases but could not determine the magnitude or leading cause of an undercount. Researchers determined that the ability to match injury and illness data across different data sources was affected by various factors, such as establishment type, the time of case filing, and the type of injury. The BLS initiated additional research from 2012 to 2014 that included interviews with employers in four states to learn more about their injury and illness recordkeeping practices and a multiyear match of SOII data to workers’ compensation records to analyze matching trends over time. The BLS is currently funding a nationwide retrospective survey with SOII respondents to learn more about their recordkeeping practices and timing issues that may negatively affect injury and illness reporting to the SOII. The BLS also continues to conduct exploratory research on the collection of occupational injury and illness data directly from employees. For more information on undercount research, please see www.bls.gov/iif/undercount.htm.