observation system simulation experiments (osse) · pdf filefeb 14 2012 emc seminar wind lidar...
TRANSCRIPT

ECMWF Lars Isaksen, ECMWF 28th Nordic Meteorologists´ Meeting , June 2012 1
Observation System Simulation Experiments (OSSE) What is the experience of the meteorological NWP
community?
Lars Isaksen
Head of Data Assimilation Section at ECMWF [email protected]
Acknowledgements to a large number of OSSE scientists will be given on the slides

2
Internationally Collaborative Joint
OSSEs Progress At NOAA
Michiko Masutani[1,2,#], Lars Peter Riishojgaard [2,$], Zaizhong Ma[2,$],
Jack S. Woollen[1,+], Dave Emmitt[5], Sid Wood[5], Steve Greco[5],
Tong Zhu[3,@], Yuanfu Xie[4]
[1]NOAA/National Centers for Environmental Prediction (NCEP)
[2]Joint Center for Satellite and Data Assimilation (JCSDA)
[3]NOAA/ NESDIS/STAR,
[4]NOAA/Earth System Research Laboratory (ESRL)
[5]Simpson Weather Associates
# Wyle Information Systems, McLean, VA,
+IM Systems Group)IMSG), MD
$Earth System Science Interdisciplinary Center, Univ. of Maryland, College Park,,
@Cooperative Institute for Research in the Atmosphere (CIRA)/CSU, CO
OSSE:Observing Systems Simulation Experiments
http://www.emc.ncep.noaa.gov/research/JointOSSEs/
Acknowledgement. This presentation is based on material from:

Feb 14 2012 EMC Seminar Wind Lidar OSSEs at JCSDA
Observing System Simulation Experiments in the Joint Center for Satellite Data Assimilation
3
Lars Peter Riishojgaard1,2, Zaizhong Ma1,2,
Michiko Masutani3, Jack Woollen3,
Dave Emmitt4, Sid Wood4, Steve Greco4
1Joint Center for Satellite Data Assimilation 2University of Maryland College Park 3NCEP Environmental Modeling Center 4Simpson Weather Associates
Acknowledgement. This presentation is based on material from:

ECMWF The 5th WMO Symposium on Data Assimilation, Melbourne Oct 2009
Reference Result Verification NWP-System Observations
Reference Result Verification NWP-System Observations
Observing System Experiment (OSE)
OSSE
Real atmosphere
Assimilation/ forecast
Assimilation/ forecast
Compare to reference
Compare to reference
Impact assessment
Nature run
Assimilation/ forecast
Assimilation/ forecast
Compare to reference
Compare to reference
Assimilation/ forecast Compare to reference
Calibrate
Impact assessment
Ack: Werner Wergen (DWD)

Feb 14 2012 EMC Seminar Wind Lidar OSSEs at JCSDA
Data assimilation system(s) NCEP/EMC Global Forecast System (T-382) coupled with GSI
Nature run ECMWF T-511, commissioned for Joint OSSE
13 month period (May 2005-June 2006)
Validated extensively through Joint OSSE collaboration
Simulated observations Reference observations, including satellite radiance data (all observation)
Perturbation (“candidate”) observations
GWOS observations simulated by Simpson Weather Associates
Diagnostics capability NCEP operational verification system
5
Observing System Simulation Experiments

Data impact on analysis and forecast will be evaluated.
A Full OSSE can provide detailed quantitative evaluations of
the configuration of observing systems.
A Full OSSE can use an existing operational system and help
the development of an operational system
Advantages
Existing Data assimilation system
and verification method are used for
Full OSSEs. This will help
development of DAS and verification
tools.
OSSE Calibration
A Nature Run (NR, proxy true atmosphere) is produced from a
free forecast run using the highest resolution operational model
which is significantly different from the NWP model used in Data
Assimilation Systems.
Calibrations is performed to provide quantitative data impact
assessment.
Without calibration quantitative evaluation of data impact is not
possible.
Full OSSEs
There are many types of simulation experiments. Sometimes, we have to call
our OSSE a ‘Full OSSE’ to avoid confusion.
• Full OSSEs are expensive – Sharing one Nature Run and simulated observation saves costs – Sharing diverse resources
• OSSE-based decisions have international stakeholders – Decisions on major space systems have important scientific, technical, financial and political ramifications – Community ownership and oversight of OSSE capability is important for maintaining credibility
• Independent but related data assimilation systems allow us to test the robustness of answers
International Joint OSSE capability
Calibration of OSSEs verifies the simulated data impact by comparing it to real data impact. In order to conduct an OSSE calibration, the data impact of existing instruments has to be compared to their impact in the OSSE.
6

Feb 14 2012 EMC Seminar Wind Lidar OSSEs at JCSDA
Role of a National OSSE Capability
Impact assessment for future missions Future operational observing systems (NOAA)
Decadal Survey and other science and/or technology demonstration missions (NASA)
Other agencies (e.g. DoD/DWSS)
Objective way of establishing scientifically sound and technically realistic user requirements
Tool for assessing performance impact of engineering decisions made throughout the development phases of a space program or system
Preparation/early learning pre-launch tool for assimilation users of data from new sensors
7

Feb 14 2012 EMC Seminar Wind Lidar OSSEs at JCSDA
Joint OSSE history
NASA/NOAA collaboration started in 2007, involving NASA/GSFC, NOAA/NESDIS, NOAA/NWS, NOAA/OAR
Centered around common use of Nature Run provided free of charge by ECMWF
Coordinated through JCSDA
Informal, loosely structured nature, lack of common funding stream has presented challenges
Successful joint validation of ECMWF Nature Run
Some collaboration on simulation and calibration of observations
ADM experiments (GMAO)
GWOS experiments (JCSDA)
UAS experiments (OAR)
8

ECMWF Lars Isaksen, ECMWF 28th Nordic Meteorologists´ Meeting , June 2012 9
The realism of the forecast model is a very important for the quality of the Nature Run
Physical processes in the ECMWF model

ECMWF Lars Isaksen, ECMWF 28th Nordic Meteorologists´ Meeting , June 2012 10
The resolution of the forecast model is a very
important for the quality of the Nature Run

Feb 14 2012 EMC Seminar Wind Lidar OSSEs at JCSDA
Checking the realism of the Nature Run is vital. Atlantic Hurricane in the nature run for the analysis period of 25 Sep to 10 Oct 2005
11
Based on figure produced by Joe Terry

Fig.1Average 500-hPa geopotential height anomaly correlation as a function of forecast range for the Northern (a) and Southern (b) Hemisphere. Tropical wind vector RMS errors (m/s) at 200 hPa (c) and 850 hPa (d) as a function of forecast range. CTRL shown in black, NOUV in red. All observations used were real. Lower plot of each panel shows difference between NOUV and CRTL with, error bars indicating differences that are significant at the 95% confidence level.
Fig. 2: As Figure 1, except that all observations were simulated based on T511NR.
Calibration experiments and DWL OSSE at JCSDA
Calibration and initial evaluation of DWL impact were conducted for the period 1st Jyly-15 August. Calibration experiments showed reasonable agreement in data impact of RAOB wind in real and simulated impact. (Fig.1 and Fig.2)
12
Feb 14 2012 EMC Seminar Wind Lidar OSSEs at JCSDA
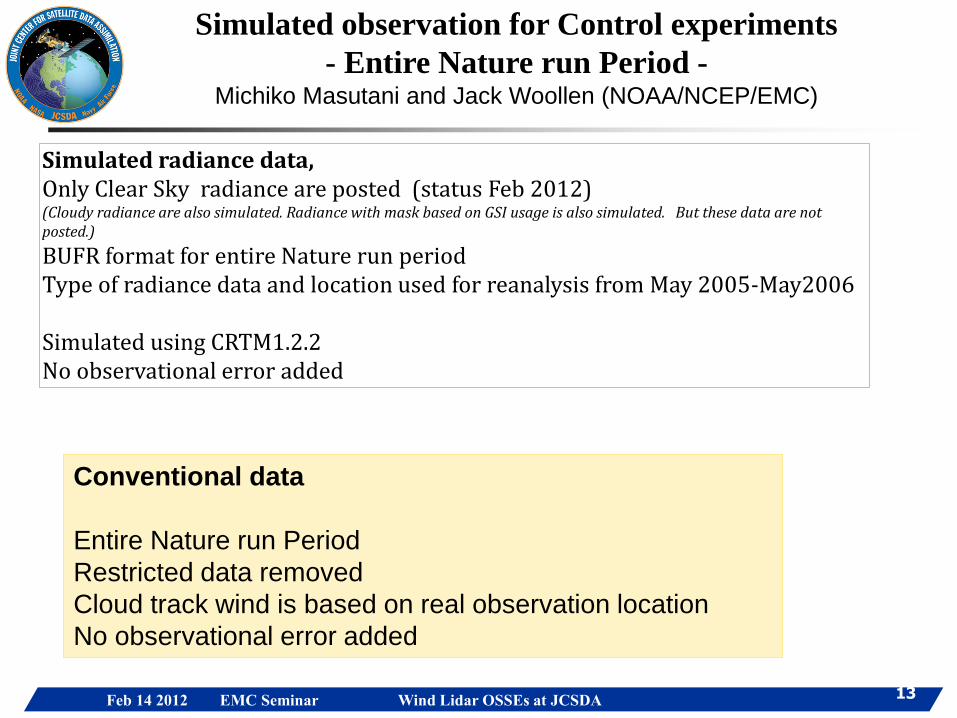
Simulated observation for Control experiments
- Entire Nature run Period - Michiko Masutani and Jack Woollen (NOAA/NCEP/EMC)
Simulated radiance data, Only Clear Sky radiance are posted (status Feb 2012) (Cloudy radiance are also simulated. Radiance with mask based on GSI usage is also simulated. But these data are not posted.)
BUFR format for entire Nature run period Type of radiance data and location used for reanalysis from May 2005-May2006 Simulated using CRTM1.2.2 No observational error added
Conventional data
Entire Nature run Period
Restricted data removed
Cloud track wind is based on real observation location
No observational error added
13

Feb 14 2012 EMC Seminar Wind Lidar OSSEs at JCSDA
Simulation of radiance data at NOAA
Jack Woollen and Michiko Masutani
GOES and SBUV are simulated as they are missing from the GMAO
dataset.
PrepBUFR is simulated based on CDAS distribution and quality
controls.
Radiance data for instruments used in 2005-2006 are generated at
the foot print used by the NCEP reanalysis.
Simulation was conducted using CRTM 1.2.2.
Some calibration and validation will be conducted by NCEP and NESDIS.
Step 1. Thinning of radiance data based on real use
14
Step 2. Simulation of radiance data using cloudy radiance

Feb 14 2012 EMC Seminar Wind Lidar OSSEs at JCSDA
Nature Run (grib1 reduced Gaussian) 91 level 3-D data (12 Variables) 2-D data (71 Variables) Climatological data
Observation template Geometry Location Mask
Decoding grib1 Horizontal Interpolation
DBL91
Running Simulation program (RTM)
Post Processing (Add mask for channel, Packing to BUFR)
Simulated Radiance Data
Need lots of cpu’s Need Radiation Experts
Need complete NR (3.5TB) Random access to grib1 data
Need Data Experts
Need Data Experts but this will be a small program
15

Feb 14 2012 EMC Seminar Wind Lidar OSSEs at JCSDA
Th
Fig. 1 NOAA -15 AMSU-A Channel 1 brightness temperature at GSI analysis time 0000 UTC May 2, 2005, time window 6 hours from (left) observation, (right)) CRTM simulation with NR atmospheric profiles.
16
Evaluation of simulated GOES and AMSUA
at the 1st step (12hr fcst) of the Nature Run
simulated with 2005 template
Tong Zhu (NESDIS)
Observation and simulation of GOES-12
Sounder 18 IR channels at over North
Atlantic region at 1200 UTC October 1,
2005.
Tong Zhu (NESDIS)
Ob
se
rve
d
Sim
ula
ted
Ob
se
rve
d
Sim
ula
ted
These
figure
s do n
ot h
ave to
be sa
me
as w
eath
ers a
re d
iffere
nt , b
ut
simila
rities a
re o
bse
rved.
These
figure
s are
expecte
d to
be v
ery
simila
r.
Slide 17
Estimating the Optimal Number of GNSS
Radio Occultation Measurements for
Numerical Weather Prediction
Florian Harnisch, Sean Healy, Peter Bauer
Both studies funded by ESA (European Space Agency)
Use of an Ensemble of Data
Assimilations to estimate benefit of
Aeolus Doppler Wind Lidar data
David Tan, Erik Andersson, Mike Fisher, Lars Isaksen
Acknowledgement. The next part of my presentation is based on results from two scientific studies:

ECMWF Lars Isaksen, ECMWF, Oct 2012 Use and interpretation of ECMWF Products 18
Ensemble of Data Assimilations (EDA)
Run an ensemble of analyses with perturbed observations, model physics and Sea Surface Temperature fields.
10 EDA members plus a control at lower resolution.
Form differences between pairs of analyses (and short-range forecast) fields.
These differences will have the statistical characteristics of analysis (and short-range forecast) error.
L
40°N 40°N
50°N50°N
60°N 60°N
20°W
20°W 0°
0°
Model Level 58 **Temperature - Ensemble member number 1 of 11
Thursday 21 September 2006 06UTC ECMWF EPS Perturbed Forecast t+3 VT: Thursday 21 September 2006 09UTC
0.5
0.6
0.7
0.8
0.9
1
1.1
1.2
1.3
1.4
1.5
1.6
Yellow shading where the
short-range forecast is
uncertain: give observations
more weight in these regions.

Slide 19
EDA method (1)
• Cycle of N (=10) 4D-Vars in parallel using
- perturbed observations
- perturbed model physics (SPPT scheme)
- assuming that
→ ensemble estimate of the error statistics of the analysis
and short-range forecast
Slide 19
xan (tk) xb
n (tk+1)
Analysis
system
Forecast
xbn (tk)
ζmn (SPPT)
ζmn (SPPT)
y (tk) + ηn
SST’n

Slide 20
EDA method (2)
• Computed ensemble spread s (variance) for EDA experiments
→ estimates the analysis and forecast uncertainty (variance)
per for each time d
for a period D (Expectation)
• Investigate how the EDA spread s is changing when additional
Aeolus data or GNSS RO data are used → observation impact
Slide 20

ECMWF The 5th WMO Symposium on Data Assimilation, Melbourne Oct 2009
Reference Result An & Fc Diagnostics
NWP-System Ensemble Observations
Assimilation Ensemble
Ref. run
Assimilation/ forecast
Assimilation/ forecast
Ensemble spread
Ensemble spread
Assimilation/ forecast Ensemble spread
Calibrate
Impact assessment
Reference Result Verification NWP-System Observations
OSSE
Nature run
Assimilation/ forecast
Assimilation/ forecast
Compare to reference
Compare to reference
Assimilation/ forecast Compare to reference
Calibrate
Impact assessment

ECMWF The 5th WMO Symposium on Data Assimilation, Melbourne Oct 2009 22
S.Hem
0.0 0.5 1.0 1.5
1000
100
Profiles of 12 hour forecast impact, Southern Hemisphere
Spread in zonal wind (U, m/s)
Scaling factor ~ 2 for wind error
Tropics, N. & S. Hem all similar
Simulated DWL adds value at all altitudes and in longer-range forecasts (T+48,T+120)
Differences significant (T-test)
Supported by information content diagnostics
Tan et al 2007, QJRMS 133:381–390
ADM-Aeolus
NoSondes
Pre
ssure
(hP
a)
Zonal wind (m/s)
p<0.001

Slide 23
Simulation of GNSS RO data
Slide 23
interpolate
2D
bending angle
operator
randomly distributed
observation time and location
Operational ECMWF analysis
→ proxy for the “truth”
realistic
observation
errors
simulated GNSS RO
bending angle
profiles

Slide 24
Daily EDA spread
• No initial background
perturbation
• Short-term ensemble forecasts
provide the next background
• Cycling produces background
perturbations
• Less than 7 days to reach
stable state
• Only minor fluctuations →
estimate of FC uncertainty
(stdev) not individual FC error!
Slide 24
+12 h forecast of temperature at 100 hPa
period

Slide 25
Averaged EDA spread - Analysis
Slide 25
T (K) at 100 hPa: Analysis ensemble spread for June 8 - 27, 0 / 12 UTC
EDA_2
EDA_16 EDA_64
EDA_8
Slide 26
Summary
• Full OSSEs are expensive
• Sharing one Nature Run and simulated observation saves costs
• Generation of observations and calibration is a major exercise
• OSSE-based decisions have international stakeholders and
OSSEs should be developed as joint global projects
• Community ownership and oversight of OSSE capability is also
important for maintaining credibility
• Independent but related data assimilation systems allow us to
test the robustness of answers
• The EDA is an independent and simpler OSSE method that has
been shown to be valuable, but it does not make OSSEs obsolete
Slide 26