object bank: an object-level image representation for …vision.stanford.edu/pdf/li_ijcv2013.pdf ·...
TRANSCRIPT
Int J Comput VisDOI 10.1007/s11263-013-0660-x
Object Bank: An Object-Level Image Representationfor High-Level Visual Recognition
Li-Jia Li · Hao Su · Yongwhan Lim · Li Fei-Fei
Received: 2 January 2012 / Accepted: 11 September 2013© Springer Science+Business Media New York 2013
Abstract It is a remarkable fact that images are related toobjects constituting them. In this paper, we propose to rep-resent images by using objects appearing in them. We intro-duce the novel concept of object bank (OB), a high-levelimage representation encoding object appearance and spa-tial location information in images. OB represents an imagebased on its response to a large number of pre-trained objectdetectors, or ‘object filters’, blind to the testing dataset andvisual recognition task. Our OB representation demonstratespromising potential in high level image recognition tasks.It significantly outperforms traditional low level image rep-resentations in image classification on various benchmarkimage datasets by using simple, off-the-shelf classificationalgorithms such as linear SVM and logistic regression. In thispaper, we analyze OB in detail, explaining our design choiceof OB for achieving its best potential on different types ofdatasets. We demonstrate that object bank is a high levelrepresentation, from which we can easily discover semanticinformation of unknown images. We provide guidelines foreffectively applying OB to high level image recognition taskswhere it could be easily compressed for efficient computationin practice and is very robust to various classifiers.
L.-J. Li (B)Yahoo! Research, 701 First Avenue, Sunnyvale, CA 94089, USAe-mail: [email protected]
H. Su · Y. Lim · L. Fei-FeiComputer Science Department, Stanford University,353 Serra Mall St., Stanford, CA 94305, USAe-mail: [email protected]
Y. Lime-mail: [email protected]
L. Fei-Feie-mail: [email protected]
Keywords Scene classification · Image representation ·Object recognition · Image classification · Image feature
1 Introduction
High-level image recognition is one of the the most chal-lenging domains in the field of computer vision. Any high-level image recognition task using computer vision algo-rithms starts with image representation, the process of turningpixels into a vector of numbers for further computation andinference. Of all the modules for a robust high-level imageunderstanding system, the design of robust image represen-tation is of fundamental importance and has been attractingmany vision researchers. Compared to other data modalities,visual data is particularly challenging because of the extremerichness and diversity of the contents being captured in realworld, and the large variability in photometric and geometricchanges the real world could map onto the 2D pixel world.Pixels, unlike other information carriers such as words, carryvery little meaning themselves, and are extremely volatile tonoise. In the past decade, a great amount of research hasbeen conducted on developing robust image representation.Among the image representations widely adopted so far,most of them are low level image representations focusingon describing images by using some variant of image gra-dients, textures and/or colors [e.g. SIFT (Lowe 1999), filter-banks (Freeman and Adelson 1991; Perona and Malik 1990),GIST (Oliva and Torralba 2001), etc.]. However, there existsa large discrepancy between these low level image represen-tations and the ultimate high level image recognition goals,which is the so called ‘Semantic gap’. One way to bridgethe semantic gap is by deploying increasingly sophisticatedmodels, such as the probabilistic grammar model (Zhu et al.2007), compositional random fields (Jin and Geman 2006),
123
Int J Comput Vis
and probabilistic models (Fei-Fei and Perona 2005; Sudderthet al. 2005). While these approaches are based on rigorousstatistical formulation, good learning and inference are stillextremely difficult. Most of the papers have shown promisingresults only on small scale datasets. It still remains a verychallenging task for the models to bridge the low level rep-resentations and the high level visual recognition tasks.
One notable development in image representation isthe recent work that explores to build image representa-tions using intermediate ‘attributes’ (Ferrari and Zisserman2007; Lampert et al. 2009; Farhadi et al. 2010; Torresaniet al. 2010). Its success in recognition is largely accred-ited to the introduction of ‘attribute’, a high-level semanti-cally meaningful representation effectively summarizing thelow-level image properties. In attribute-based methods forobject recognition, an object is represented by using visualattributes. For example, a polar bear can be described aswhite, fluffy object with paws. Such visual attributes summa-rize the low-level features into object parts and other proper-ties, and then are used as the building blocks for recognizingobjects in test images. In the work of Ferrari and Zisserman(2007), the authors developed a topic model to learn the map-ping of low-level image properties to predefined color andshape attributes. Similarly, Lampert et al. (2009) and (2010)propose to detect and describe objects in unknown imagesbased on their correlation with a set of human-specified high-level descriptions of the target objects. Attribute-based meth-ods have demonstrated great potential in image classificationas well. For example, in Torresani et al. (2010), the authorsbuild a high-level image representation from a collection ofclassifier results and achieved promising results.
On the other hand, using global/local structure informa-tion has proved to be useful to increase the descriptive powerof a representation. For example, by applying spatial pyramidstructure to bag of words (BoW) representation, Lazebniket al. (2006) proposed the Spatial Pyramid Model that givessuperior performance compared to the original BoW features.
Image representations based on either attribute and spatiallocation have demonstrated potential in visual recognitiontasks, which reminds us how human interprets an image.What will pop up in your mind when imagining a sailingscene? We often think of sailboat, ocean and blue sky, eachat some specific location. Objects are essential componentsto interpret an image. As human, we start to learn numerousobjects from our childhood and memorize the appearance oflearned objects. Their appearance are then used to effectivelydescribe our visual world.
Therefore, we hypothesize that object appearance andtheir spatial locations could be very useful for representingand recognizing images. In this paper, we introduce objectbank (OB), a novel high level image feature to representcomplex real-world image by collecting the responses ofmany object detectors at different spatial locations in the
image. Drawing an analogy to low-level image representa-tion, instead of using image filters to represent local texture,we introduce object filters to characterize local image prop-erties related to the presence/absence of objects. By usinga large number of such object filters, our object filter bankrepresentation of the image can provide rich information ofthe image that captures much of the high-level meaning. OBis a compact structure to encode our knowledge of objectsfor challenging high level visual tasks in real world problemssuch as image classification. OB is a high level image rep-resentation that provides probability of objects appearing inimages and their spatial locations as the signature of images.
As a proof of concept, we apply OB to high level imageclassification tasks by using simple, off-the-shelf classifiers.It delivers promising image recognition results on variousbenchmark datasets and outperforms significantly over allexisting traditional low level features. In this paper, we pro-vide in-depth analysis of each component in OB and sim-ple guidelines on effectively applying OB representation toimage classification task. We show that, by encoding seman-tic and spatial information of objects within an image, OB cannot only achieve state-of-the-art performance in high levelvisual recognition tasks but also discover meaningful aspectsof objects in an image. To explore its potential in practice,we analyze the robustness and efficiency of object bank. Weshow that OB is robust to different off-the-shelf classifiers.For large scale computation, OB can be easily compressedto compact representation while preserving its robustness.
2 Related Work
A considerable body of research has been focusing on usingtraditional low level image features for image classification,such as filter banks (Leung and Malik June 2001; Peronaand Malik 1990; Freeman and Adelson 1991), GIST (Olivaand Torralba 2001), and BoW of local features (Bosch et al.2006; Fei-Fei and Perona 2005). Instead of using gradientsor colors in an image to represent it, OB characterizes localimage properties by using object filters related to the pres-ence/absence of objects, adding more high level informationinto the representation to bridge the semantic gap.
Object detection and recognition also entail a large bodyof literature (Fei-Fei et al. 2007; Bourdev and Malik 2009).Promising object detectors have been introduced by Felzen-szwalb et al. (2007), as well as the geometric context classi-fiers (‘stuff’ detectors) of Hoiem et al. (2006). These objectrecognition approaches accelerate the advancement of newstate-of-the-art object detection and classification algorithmssuch as Desai et al. (2009) and Song et al. (2011).
Visual attributes based research for image recognition(Farhadi et al. 2010; Ferrari and Zisserman 2007; Lampertet al. 2009; Torresani et al. 2010) has achieved substantial
123
Int J Comput Vis
progress recently. These approaches focus on single objectclassification based on visual attributes. The pre-defined con-cepts used in Lampert et al. (2009), Farhadi et al. (2010) andTorresani et al. (2010) are not necessarily directly related tovisual pattern in the images, e.g. ‘eats fish’ in Lampert et al.(2009), ‘carnival’ in Farhadi et al. (2010) and ‘able-minded’in Torresani et al. (2010). Different than these approaches,OB representation encodes semantic and spatial informationof objects universally applicable for high level visual recog-nition tasks. Among these approaches, the closest to objectbank is proposed by Torresani et al. (2010), where a compactdescriptor is learned from a set of pre-trained concept clas-sifiers. While the classmes representation proposed by Tor-resani et al. (2010) underscores the compactness of a featurerepresentation for large scale visual tasks, we advocate a richimage representation encoding semantic and spatial informa-tion for inferring semantic and structural relationship from.
The idea of using object detectors as the basic representa-tion of images is related to work in multimedia by applyinga large number of ‘semantic concepts’ to video and imageannotation (Hauptmann et al. 2007). However, in Hauptmannet al. (2007), each semantic concept is trained by using theentire images or frames of video. Understanding clutteredimages composed of many objects will be challenging sincethere is no localization of object concepts in images in thisapproach.
In Vogel and Schiele (2004), a handful number of conceptsare learned for describing an image. For each location, onlythe most probable concept is used to form the representationbased on binary classification result. Significant amount ofinformation is lost during their feature extraction process.Our approach, on the other hand, encodes the probabilities ofall objects candidates appearing in all locations in the imageresulting in much richer image representation.
Recently, feature learning approaches have made greatprogress in image classification by building advancedmachine learning models to learn from low level feature rep-resentation (Dixit et al. 2011; Gao et al. 2010, 2011). Mostof these approaches learn useful feature representations fromlow level image features such as visual code word of SIFT(Lowe 1999). By encoding rich content of semantic and spa-tial information, OB can serve as a potential complimen-tary feature pool for these algorithms to learn more sophisticimage representation from.
3 The OB Representation of Images
In this section, we introduce the concept of high-level OBrepresentation (Li et al. 2010a,b). The ultimate goal of OBrepresentation is to capture as much objects information con-tained in the images including their semantic meaning, spatiallocations, sizes and view points etc. as possible. We achieve
this by constructing OB, a collection of object filters trainedon multiple objects with different view points.
3.1 Construction of the OB
So what are the “objects” to use for constructing the OB?And how many? An obvious answer to this question is to useall objects. As the detectors become more robust, especiallywith the emergence of large-scale datasets such as LabelMe(Russell et al. 2005) and ImageNet (Deng et al. 2009), thisgoal becomes more reachable.
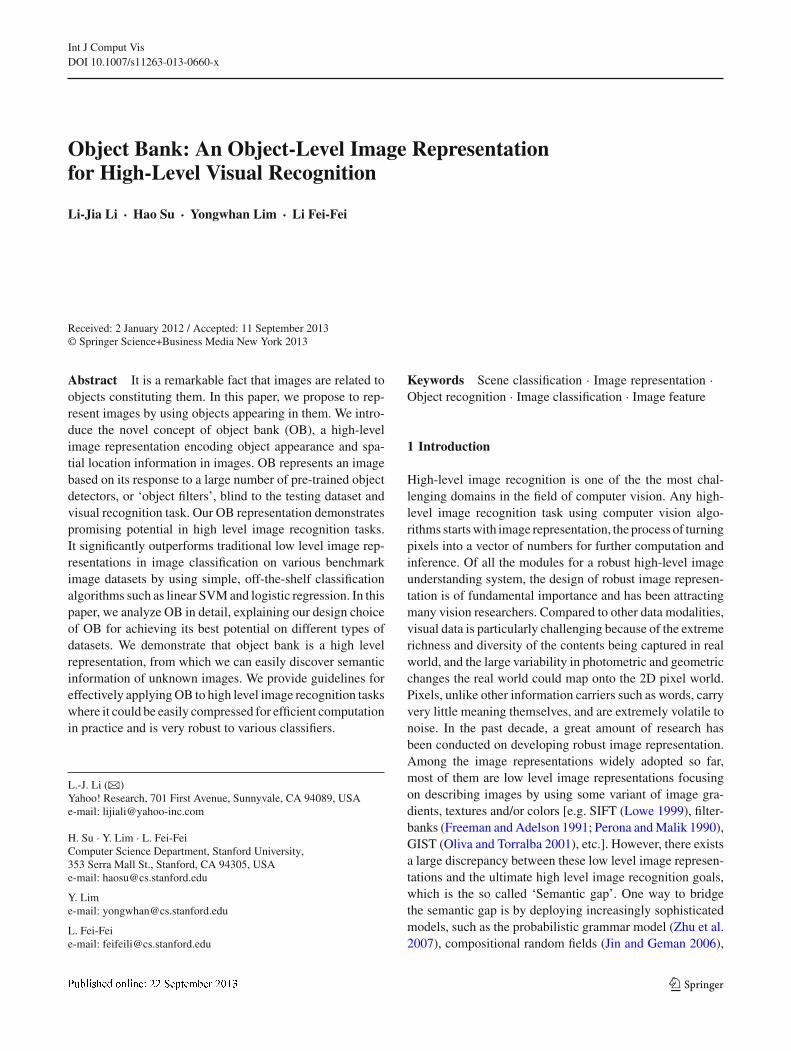
But time is not fully ripe yet to consider using all objectsin, say, the ImageNet dataset. Not enough research has yetgone into building robust object detector for tens of thousandsof generic objects. As we increase the number of objects, theissue of semantic hierarchy becomes more prominent. Notmuch is understood about what it means to detect a mam-mal and a dog simultaneously. And even more importantly,not all objects are of equal importance and prominence innatural images. As Fig. 1 shows, the distribution of objectsfollows Zipf’s Law, which implies that a small proportion ofobject classes account for the majority of object instances.Hauptmann and colleagues have postulated that using 3,000–4,000 concepts should suffice to annotate most of the videodata (Hauptmann et al. 2007).
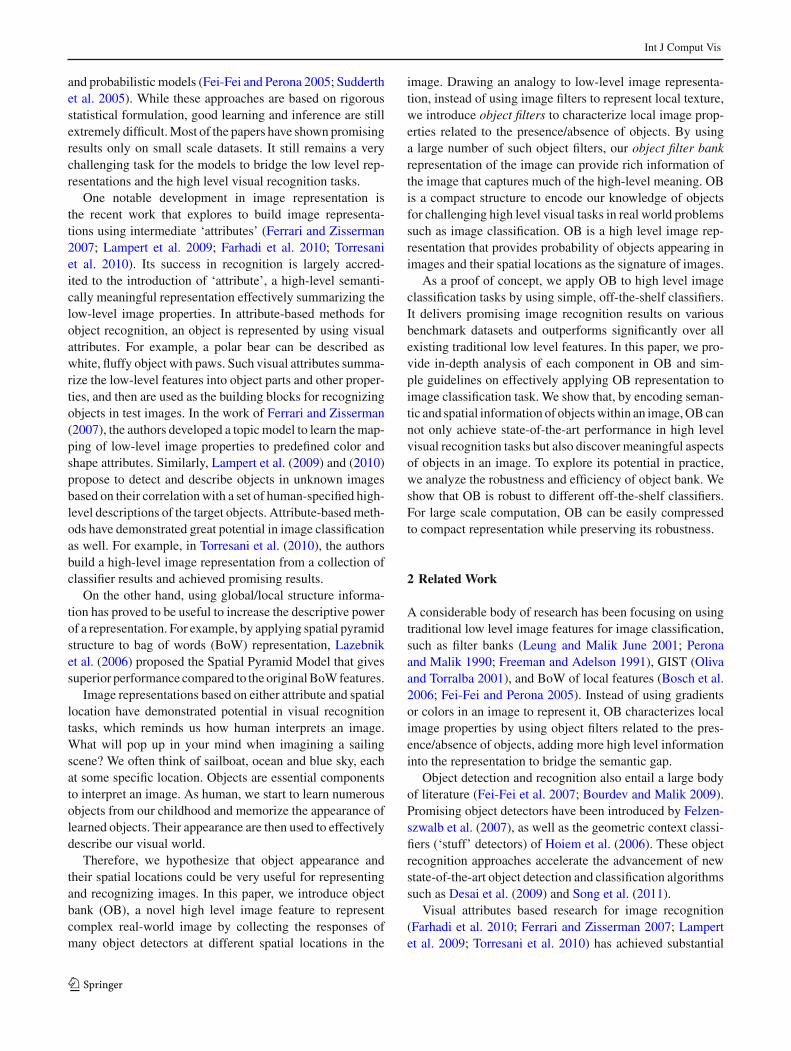
In this paper, we choose a few hundred most useful (orpopular) objects in images.1 An important practical consid-eration for our study is to ensure the availability of enoughtraining images for each object detectors. We therefore focusour attention on obtaining the objects from popular imagedatasets such as ESP (Ahn 2006), LabelMe (Russell et al.2005), ImageNet (Deng et al. 2009) and the Flickr! onlinephoto sharing community. After ranking the objects accord-ing to their frequencies in each of these datasets, we take theintersection set of the most frequent 1,000 objects, resultingin 177 objects, where the identities and semantic relationsof some of them are illustrated in Fig. 2. To train each ofthe 177 object detectors, we use 100∼200 images and theirobject bounding box information from the ImageNet (Denget al. 2009) datasets.
To our knowledge, no previous work has applied more thana handful of object detectors in scene recognition tasks (Desaiet al. 2009). But our initial object filter bank of 177 objectdetectors is still of modest size. We show in Sect. 4 that evenwith this relatively small number of objects we can achievepromising recognition results (e.g., Fig. 5).
1 This criterion prevents us from using the Caltech101/256 datasets totrain our object detectors (Fei-Fei et al. 2006; Griffin et al. 2007) wherethe objects are chosen without any particular considerations of theirrelevance to daily life pictures.
123
Int J Comput Vis
0.2
0.4
0.6
0.8
1
1.2
1.4
1.6x 10⁶
2.6x 10⁷
#1 Human
#10 Mountain
#50 water
#103 Bowl #200 Fruit
Num
ber
of im
ages
ret
urne
d by
sea
rch
engi
nes
#20 Cellphone
Object index (sorted by y-values)1 2000
Fig. 1 (Best viewed in colors and magnification) The frequency (orpopularity) of objects in the world follows Zipf‘s law trend: a smallproportion of objects occurs much more frequently than the majority.While there are many ways of measuring this, e.g., by ranking objectnames in popular corpora such as the American National Corpora (2001)and British National Corpus Edition and Sampler, we have taken aweb-based approach by counting the number of downloadable imagescorresponding to object classes in WordNet on popular search enginessuch as Google, Ask.com and Bing. We show here the distribution ofthe top 2,000 objects
3.2 The OB Representation
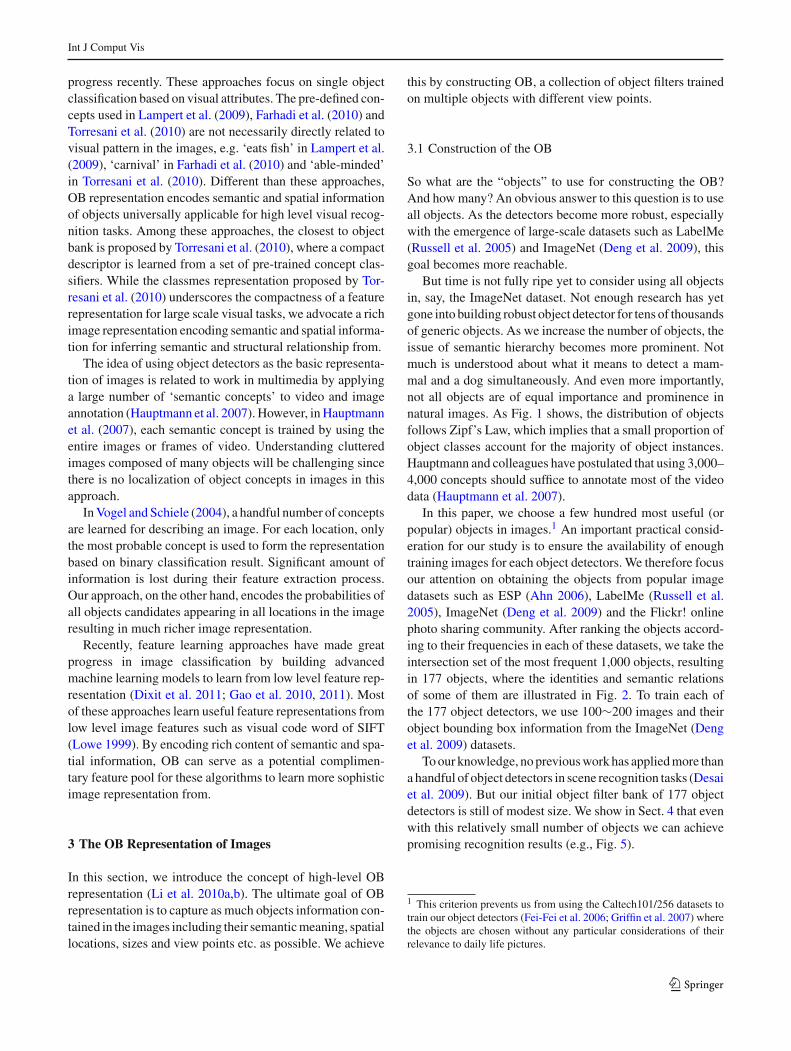
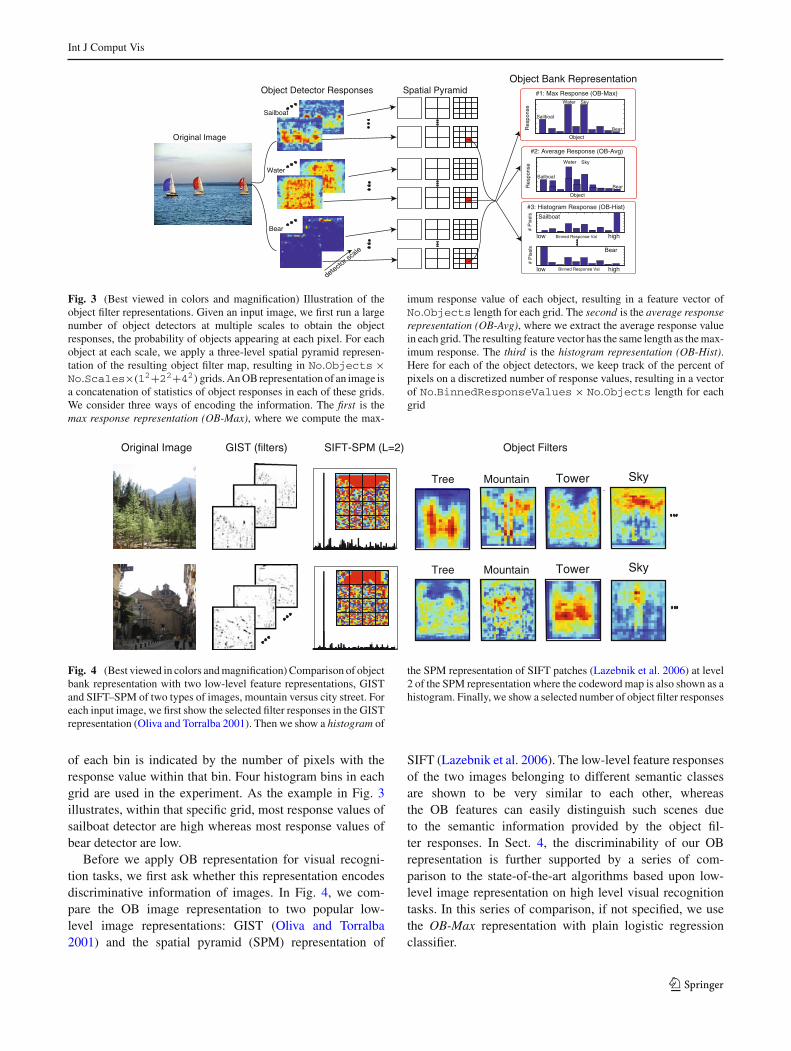
Figure 3 illustrates our OB representation constructionprocess. Given an image, an object filter response can beviewed as the response of a ‘generalized object convolution.’We obtain object responses by running a bunch of object fil-ters across an image at various locations and scales by usingthe sliding window approach. Each filter is an object detec-tor trained from images with similar view point. If not speci-
fied, we apply the deformable part based model from Felzen-szwalb et al. (2007) as our object detector where six parts areused. For each scale and each detector, we obtain an initialresponse map, whose value at each location indicates the pos-sibility of the occurrence of that object. To capture the spatiallocation property of objects, we build a spatial pyramid for theresponse map. At each layer of the spatial pyramid structure,we extract the signal from all grids. Finally, we build the OBrepresentation by concatenating all the extracted responses.
Max Response Representation (OB-Max, Fig. 3). Asshown in Fig. 3, OB-Max encodes the strongest object filterresponse at each grid and each level of the spatial pyramidand detector scale. In our case, we have 177 objects, 12 scales(six scales from each of the two components) and 21 spatialpyramid grid (L = 2), which is in 44,604 dimension in total.In the example image shown in Fig. 3, given the OB-Maxrepresentation, the possibility of sailboat and water appear-ing in that specific grid is higher than other objects. If notspecified, OB-Max is the default OB pooling method in ourfollowing experiments.
Average Response Representation (OB-Avg in Fig. 3). OB-Avg encodes the average object filter response at each gridand each level of the spatial pyramid and detector scale. Fromthe responses to different object filters, we form the OB fea-ture by representing the (scene/event) image as a vector ofaverage values from each spatial pyramid grid.
Histogram Response Representation (OB-Hist, Fig. 3).OB-Hist captures more detailed information of the objectfilters than OB-Max. Instead of using maximum responsevalue of each object detector in each grid of the spatial pyra-mid representation of each of the response map, we constructa histogram of the responses in each grid. The histogramhas a vector length of the number of objects, and the value
Fig. 2 (Best viewed in colorsand magnification) Roughgrouping of the chosen objectfilters based loosely on theWordNet hierarchy (Miller1995). The size of eachunshaded node corresponds tothe number of images returnedby the search. The list of objectsused in object bank is availableat http://vision.stanford.edu/projects/objectbank/objectlist.txt
box
1144K
bag bowl
container
...bed
bench
desk
furniture
...
hat
shoe suit...
covering
vehicle
wheeled-vehicle craft
bus
1144K
train ship
airplane
674K... ...
light
lamp
device
key455K
controller
candle button switch
faucet
...
horse
744K
dog
561Kcow
animal
...
Objects
plant
treegrass
appliance
microwave
stove
dishwasher
construction
window door...
476K
water
place cloud sky sun
mountain
752K
garage
seashorecourtkitchen
public-toilet
...
... ...
123
Int J Comput Vis
Bear
Water
Sailboat
Original Image
Sailboat
Water Sky
Object
BearRes
pons
e
Sailboat
Bear
# P
ixel
s#
Pix
els
low
low
high
high
#1: Max Response (OB-Max)
#3: Histogram Response (OB-Hist)
Spatial PyramidObject Bank Representation
Object Detector Responses
detector s
cale
Binned Response Val
Binned Response Val
Object
Res
pons
e
#2: Average Response (OB-Avg)
Sailboat
Water Sky
Bear
Fig. 3 (Best viewed in colors and magnification) Illustration of theobject filter representations. Given an input image, we first run a largenumber of object detectors at multiple scales to obtain the objectresponses, the probability of objects appearing at each pixel. For eachobject at each scale, we apply a three-level spatial pyramid represen-tation of the resulting object filter map, resulting in No.Objects ×No.Scales×(12+22+42)grids. An OB representation of an image isa concatenation of statistics of object responses in each of these grids.We consider three ways of encoding the information. The first is themax response representation (OB-Max), where we compute the max-
imum response value of each object, resulting in a feature vector ofNo.Objects length for each grid. The second is the average responserepresentation (OB-Avg), where we extract the average response valuein each grid. The resulting feature vector has the same length as the max-imum response. The third is the histogram representation (OB-Hist).Here for each of the object detectors, we keep track of the percent ofpixels on a discretized number of response values, resulting in a vectorof No.BinnedResponseValues × No.Objects length for eachgrid
Tower Sky
Object Filters
MountainTree
SIFT-SPM (L=2)Original Image GIST (filters)
Tower SkyMountainTree
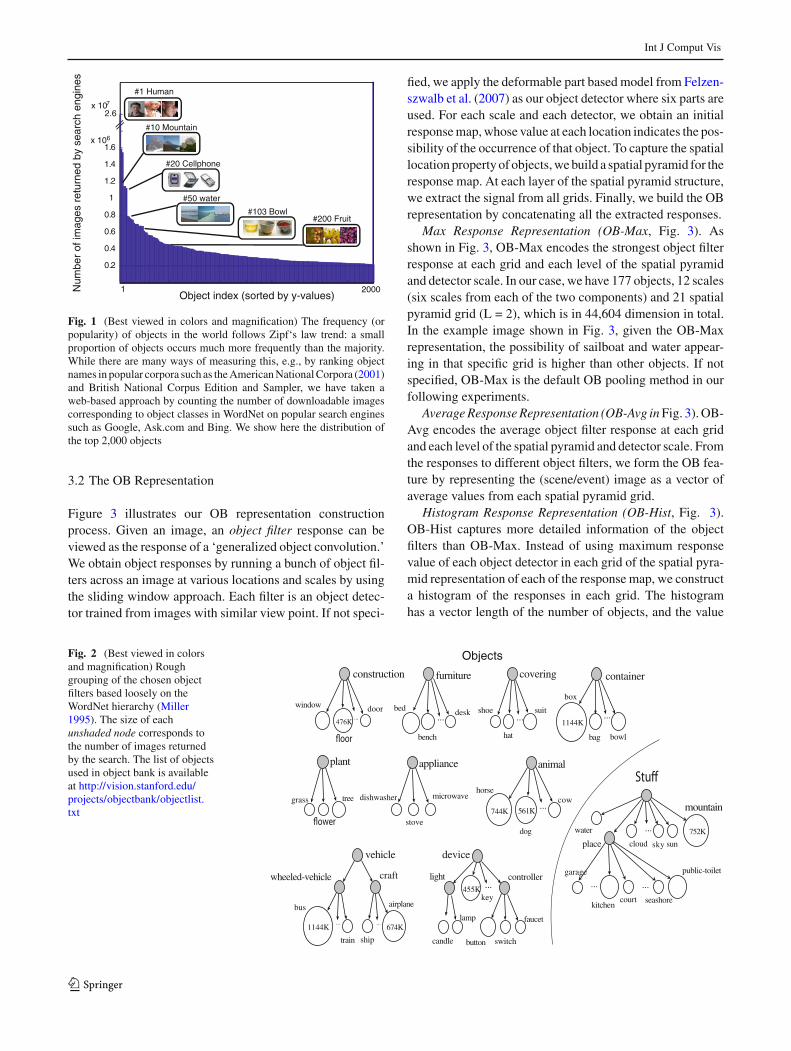
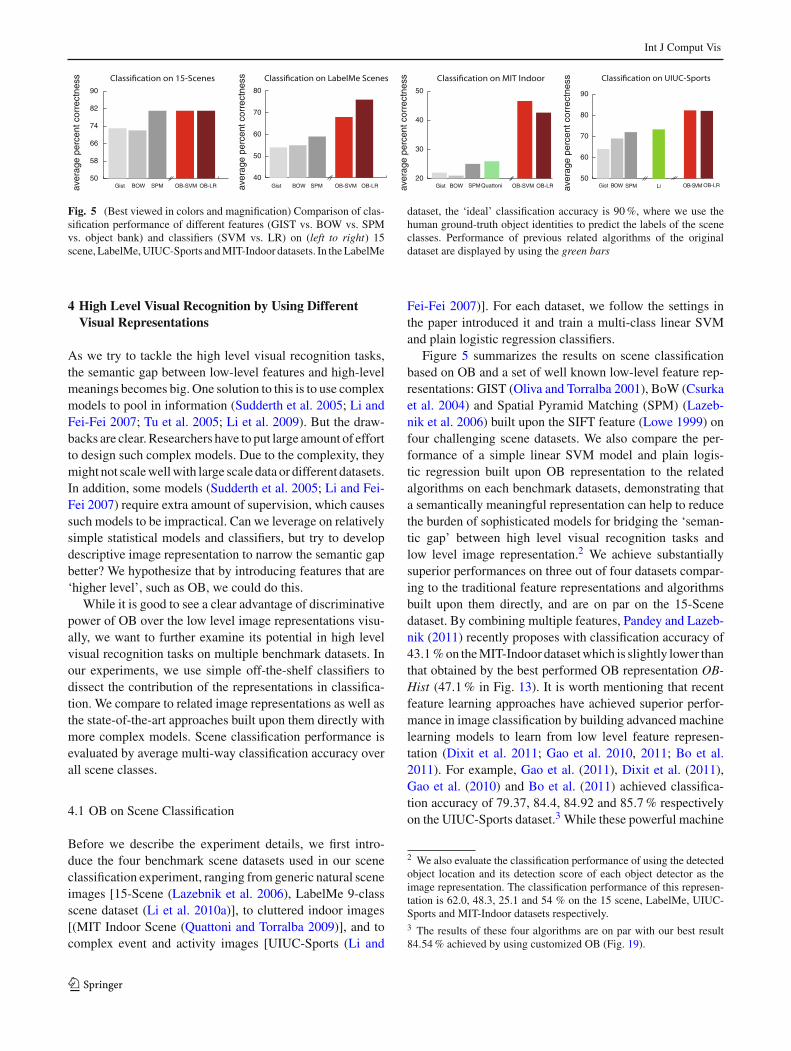
Fig. 4 (Best viewed in colors and magnification) Comparison of objectbank representation with two low-level feature representations, GISTand SIFT–SPM of two types of images, mountain versus city street. Foreach input image, we first show the selected filter responses in the GISTrepresentation (Oliva and Torralba 2001). Then we show a histogram of
the SPM representation of SIFT patches (Lazebnik et al. 2006) at level2 of the SPM representation where the codeword map is also shown as ahistogram. Finally, we show a selected number of object filter responses
of each bin is indicated by the number of pixels with theresponse value within that bin. Four histogram bins in eachgrid are used in the experiment. As the example in Fig. 3illustrates, within that specific grid, most response values ofsailboat detector are high whereas most response values ofbear detector are low.
Before we apply OB representation for visual recogni-tion tasks, we first ask whether this representation encodesdiscriminative information of images. In Fig. 4, we com-pare the OB image representation to two popular low-level image representations: GIST (Oliva and Torralba2001) and the spatial pyramid (SPM) representation of
SIFT (Lazebnik et al. 2006). The low-level feature responsesof the two images belonging to different semantic classesare shown to be very similar to each other, whereasthe OB features can easily distinguish such scenes dueto the semantic information provided by the object fil-ter responses. In Sect. 4, the discriminability of our OBrepresentation is further supported by a series of com-parison to the state-of-the-art algorithms based upon low-level image representation on high level visual recognitiontasks. In this series of comparison, if not specified, we usethe OB-Max representation with plain logistic regressionclassifier.
123
Int J Comput Vis
50
58
66
74
82
90
Gist SPMBOW OB-SVM OB-LRaver
age
perc
ent c
orre
ctne
ss
40
50
60
70
80
Gist SPMBOW OB-SVM OB-LRaver
age
perc
ent c
orre
ctne
ss
20
30
40
50
Gist SPMBOW OB-SVM OB-LRaver
age
perc
ent c
orre
ctne
ss
Quattoni50
60
70
80
90
Gist SPM MVS-BOWOB OB-LRaver
age
perc
ent c
orre
ctne
ss
Li
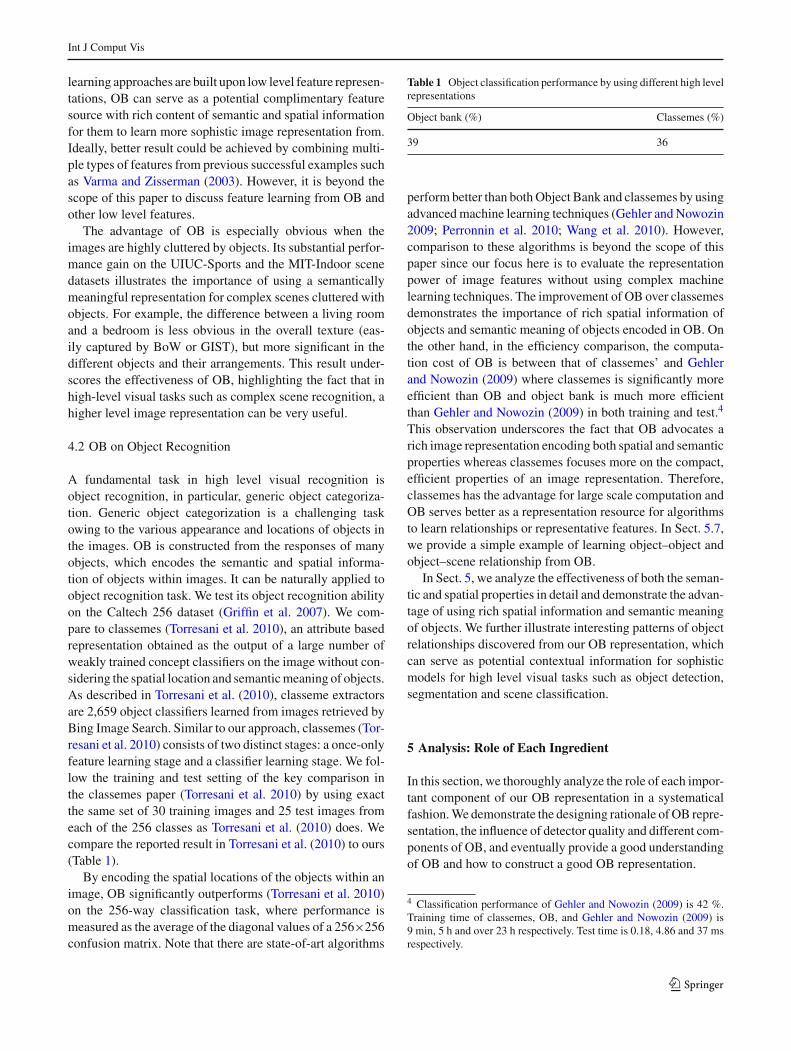
Fig. 5 (Best viewed in colors and magnification) Comparison of clas-sification performance of different features (GIST vs. BOW vs. SPMvs. object bank) and classifiers (SVM vs. LR) on (left to right) 15scene, LabelMe, UIUC-Sports and MIT-Indoor datasets. In the LabelMe
dataset, the ‘ideal’ classification accuracy is 90 %, where we use thehuman ground-truth object identities to predict the labels of the sceneclasses. Performance of previous related algorithms of the originaldataset are displayed by using the green bars
4 High Level Visual Recognition by Using DifferentVisual Representations
As we try to tackle the high level visual recognition tasks,the semantic gap between low-level features and high-levelmeanings becomes big. One solution to this is to use complexmodels to pool in information (Sudderth et al. 2005; Li andFei-Fei 2007; Tu et al. 2005; Li et al. 2009). But the draw-backs are clear. Researchers have to put large amount of effortto design such complex models. Due to the complexity, theymight not scale well with large scale data or different datasets.In addition, some models (Sudderth et al. 2005; Li and Fei-Fei 2007) require extra amount of supervision, which causessuch models to be impractical. Can we leverage on relativelysimple statistical models and classifiers, but try to developdescriptive image representation to narrow the semantic gapbetter? We hypothesize that by introducing features that are‘higher level’, such as OB, we could do this.
While it is good to see a clear advantage of discriminativepower of OB over the low level image representations visu-ally, we want to further examine its potential in high levelvisual recognition tasks on multiple benchmark datasets. Inour experiments, we use simple off-the-shelf classifiers todissect the contribution of the representations in classifica-tion. We compare to related image representations as well asthe state-of-the-art approaches built upon them directly withmore complex models. Scene classification performance isevaluated by average multi-way classification accuracy overall scene classes.
4.1 OB on Scene Classification
Before we describe the experiment details, we first intro-duce the four benchmark scene datasets used in our sceneclassification experiment, ranging from generic natural sceneimages [15-Scene (Lazebnik et al. 2006), LabelMe 9-classscene dataset (Li et al. 2010a)], to cluttered indoor images[(MIT Indoor Scene (Quattoni and Torralba 2009)], and tocomplex event and activity images [UIUC-Sports (Li and
Fei-Fei 2007)]. For each dataset, we follow the settings inthe paper introduced it and train a multi-class linear SVMand plain logistic regression classifiers.
Figure 5 summarizes the results on scene classificationbased on OB and a set of well known low-level feature rep-resentations: GIST (Oliva and Torralba 2001), BoW (Csurkaet al. 2004) and Spatial Pyramid Matching (SPM) (Lazeb-nik et al. 2006) built upon the SIFT feature (Lowe 1999) onfour challenging scene datasets. We also compare the per-formance of a simple linear SVM model and plain logis-tic regression built upon OB representation to the relatedalgorithms on each benchmark datasets, demonstrating thata semantically meaningful representation can help to reducethe burden of sophisticated models for bridging the ‘seman-tic gap’ between high level visual recognition tasks andlow level image representation.2 We achieve substantiallysuperior performances on three out of four datasets compar-ing to the traditional feature representations and algorithmsbuilt upon them directly, and are on par on the 15-Scenedataset. By combining multiple features, Pandey and Lazeb-nik (2011) recently proposes with classification accuracy of43.1 % on the MIT-Indoor dataset which is slightly lower thanthat obtained by the best performed OB representation OB-Hist (47.1 % in Fig. 13). It is worth mentioning that recentfeature learning approaches have achieved superior perfor-mance in image classification by building advanced machinelearning models to learn from low level feature represen-tation (Dixit et al. 2011; Gao et al. 2010, 2011; Bo et al.2011). For example, Gao et al. (2011), Dixit et al. (2011),Gao et al. (2010) and Bo et al. (2011) achieved classifica-tion accuracy of 79.37, 84.4, 84.92 and 85.7 % respectivelyon the UIUC-Sports dataset.3 While these powerful machine
2 We also evaluate the classification performance of using the detectedobject location and its detection score of each object detector as theimage representation. The classification performance of this represen-tation is 62.0, 48.3, 25.1 and 54 % on the 15 scene, LabelMe, UIUC-Sports and MIT-Indoor datasets respectively.3 The results of these four algorithms are on par with our best result84.54 % achieved by using customized OB (Fig. 19).
123
Int J Comput Vis
learning approaches are built upon low level feature represen-tations, OB can serve as a potential complimentary featuresource with rich content of semantic and spatial informationfor them to learn more sophistic image representation from.Ideally, better result could be achieved by combining multi-ple types of features from previous successful examples suchas Varma and Zisserman (2003). However, it is beyond thescope of this paper to discuss feature learning from OB andother low level features.
The advantage of OB is especially obvious when theimages are highly cluttered by objects. Its substantial perfor-mance gain on the UIUC-Sports and the MIT-Indoor scenedatasets illustrates the importance of using a semanticallymeaningful representation for complex scenes cluttered withobjects. For example, the difference between a living roomand a bedroom is less obvious in the overall texture (eas-ily captured by BoW or GIST), but more significant in thedifferent objects and their arrangements. This result under-scores the effectiveness of OB, highlighting the fact that inhigh-level visual tasks such as complex scene recognition, ahigher level image representation can be very useful.
4.2 OB on Object Recognition
A fundamental task in high level visual recognition isobject recognition, in particular, generic object categoriza-tion. Generic object categorization is a challenging taskowing to the various appearance and locations of objects inthe images. OB is constructed from the responses of manyobjects, which encodes the semantic and spatial informa-tion of objects within images. It can be naturally applied toobject recognition task. We test its object recognition abilityon the Caltech 256 dataset (Griffin et al. 2007). We com-pare to classemes (Torresani et al. 2010), an attribute basedrepresentation obtained as the output of a large number ofweakly trained concept classifiers on the image without con-sidering the spatial location and semantic meaning of objects.As described in Torresani et al. (2010), classeme extractorsare 2,659 object classifiers learned from images retrieved byBing Image Search. Similar to our approach, classemes (Tor-resani et al. 2010) consists of two distinct stages: a once-onlyfeature learning stage and a classifier learning stage. We fol-low the training and test setting of the key comparison inthe classemes paper (Torresani et al. 2010) by using exactthe same set of 30 training images and 25 test images fromeach of the 256 classes as Torresani et al. (2010) does. Wecompare the reported result in Torresani et al. (2010) to ours(Table 1).
By encoding the spatial locations of the objects within animage, OB significantly outperforms (Torresani et al. 2010)on the 256-way classification task, where performance ismeasured as the average of the diagonal values of a 256×256confusion matrix. Note that there are state-of-art algorithms
Table 1 Object classification performance by using different high levelrepresentations
Object bank (%) Classemes (%)
39 36
perform better than both Object Bank and classemes by usingadvanced machine learning techniques (Gehler and Nowozin2009; Perronnin et al. 2010; Wang et al. 2010). However,comparison to these algorithms is beyond the scope of thispaper since our focus here is to evaluate the representationpower of image features without using complex machinelearning techniques. The improvement of OB over classemesdemonstrates the importance of rich spatial information ofobjects and semantic meaning of objects encoded in OB. Onthe other hand, in the efficiency comparison, the computa-tion cost of OB is between that of classemes’ and Gehlerand Nowozin (2009) where classemes is significantly moreefficient than OB and object bank is much more efficientthan Gehler and Nowozin (2009) in both training and test.4
This observation underscores the fact that OB advocates arich image representation encoding both spatial and semanticproperties whereas classemes focuses more on the compact,efficient properties of an image representation. Therefore,classemes has the advantage for large scale computation andOB serves better as a representation resource for algorithmsto learn relationships or representative features. In Sect. 5.7,we provide a simple example of learning object–object andobject–scene relationship from OB.
In Sect. 5, we analyze the effectiveness of both the seman-tic and spatial properties in detail and demonstrate the advan-tage of using rich spatial information and semantic meaningof objects. We further illustrate interesting patterns of objectrelationships discovered from our OB representation, whichcan serve as potential contextual information for sophisticmodels for high level visual tasks such as object detection,segmentation and scene classification.
5 Analysis: Role of Each Ingredient
In this section, we thoroughly analyze the role of each impor-tant component of our OB representation in a systematicalfashion. We demonstrate the designing rationale of OB repre-sentation, the influence of detector quality and different com-ponents of OB, and eventually provide a good understandingof OB and how to construct a good OB representation.
4 Classification performance of Gehler and Nowozin (2009) is 42 %.Training time of classemes, OB, and Gehler and Nowozin (2009) is9 min, 5 h and over 23 h respectively. Test time is 0.18, 4.86 and 37 msrespectively.
123
Int J Comput Vis
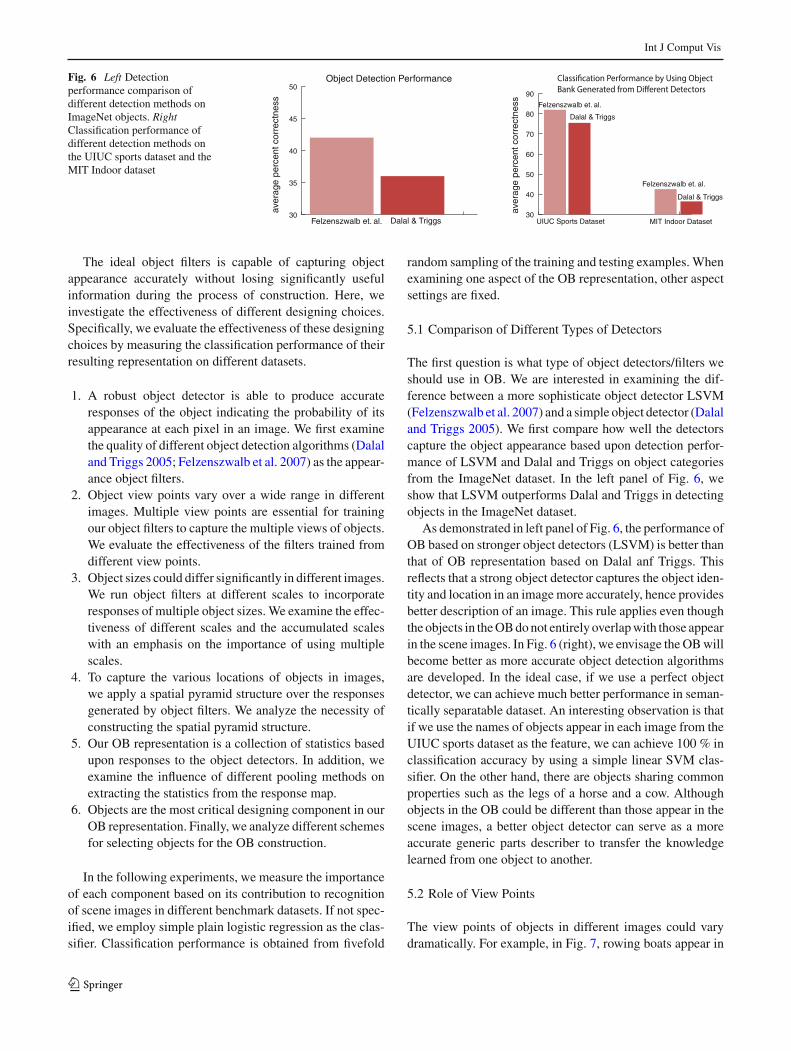
Fig. 6 Left Detectionperformance comparison ofdifferent detection methods onImageNet objects. RightClassification performance ofdifferent detection methods onthe UIUC sports dataset and theMIT Indoor dataset
30
35
40
45
50
Dalal & TriggsFelzenszwalb et. al.
Object Detection Performance
aver
age
perc
ent c
orre
ctne
ss
30
40
50
60
70
80
90
Dalal & Triggs
Felzenszwalb et. al.
aver
age
perc
ent c
orre
ctne
ss
Dalal & Triggs
Felzenszwalb et. al.
MIT Indoor DatasetUIUC Sports Dataset
The ideal object filters is capable of capturing objectappearance accurately without losing significantly usefulinformation during the process of construction. Here, weinvestigate the effectiveness of different designing choices.Specifically, we evaluate the effectiveness of these designingchoices by measuring the classification performance of theirresulting representation on different datasets.
1. A robust object detector is able to produce accurateresponses of the object indicating the probability of itsappearance at each pixel in an image. We first examinethe quality of different object detection algorithms (Dalaland Triggs 2005; Felzenszwalb et al. 2007) as the appear-ance object filters.
2. Object view points vary over a wide range in differentimages. Multiple view points are essential for trainingour object filters to capture the multiple views of objects.We evaluate the effectiveness of the filters trained fromdifferent view points.
3. Object sizes could differ significantly in different images.We run object filters at different scales to incorporateresponses of multiple object sizes. We examine the effec-tiveness of different scales and the accumulated scaleswith an emphasis on the importance of using multiplescales.
4. To capture the various locations of objects in images,we apply a spatial pyramid structure over the responsesgenerated by object filters. We analyze the necessity ofconstructing the spatial pyramid structure.
5. Our OB representation is a collection of statistics basedupon responses to the object detectors. In addition, weexamine the influence of different pooling methods onextracting the statistics from the response map.
6. Objects are the most critical designing component in ourOB representation. Finally, we analyze different schemesfor selecting objects for the OB construction.
In the following experiments, we measure the importanceof each component based on its contribution to recognitionof scene images in different benchmark datasets. If not spec-ified, we employ simple plain logistic regression as the clas-sifier. Classification performance is obtained from fivefold
random sampling of the training and testing examples. Whenexamining one aspect of the OB representation, other aspectsettings are fixed.
5.1 Comparison of Different Types of Detectors
The first question is what type of object detectors/filters weshould use in OB. We are interested in examining the dif-ference between a more sophisticate object detector LSVM(Felzenszwalb et al. 2007) and a simple object detector (Dalaland Triggs 2005). We first compare how well the detectorscapture the object appearance based upon detection perfor-mance of LSVM and Dalal and Triggs on object categoriesfrom the ImageNet dataset. In the left panel of Fig. 6, weshow that LSVM outperforms Dalal and Triggs in detectingobjects in the ImageNet dataset.
As demonstrated in left panel of Fig. 6, the performance ofOB based on stronger object detectors (LSVM) is better thanthat of OB representation based on Dalal anf Triggs. Thisreflects that a strong object detector captures the object iden-tity and location in an image more accurately, hence providesbetter description of an image. This rule applies even thoughthe objects in the OB do not entirely overlap with those appearin the scene images. In Fig. 6 (right), we envisage the OB willbecome better as more accurate object detection algorithmsare developed. In the ideal case, if we use a perfect objectdetector, we can achieve much better performance in seman-tically separatable dataset. An interesting observation is thatif we use the names of objects appear in each image from theUIUC sports dataset as the feature, we can achieve 100 % inclassification accuracy by using a simple linear SVM clas-sifier. On the other hand, there are objects sharing commonproperties such as the legs of a horse and a cow. Althoughobjects in the OB could be different than those appear in thescene images, a better object detector can serve as a moreaccurate generic parts describer to transfer the knowledgelearned from one object to another.
5.2 Role of View Points
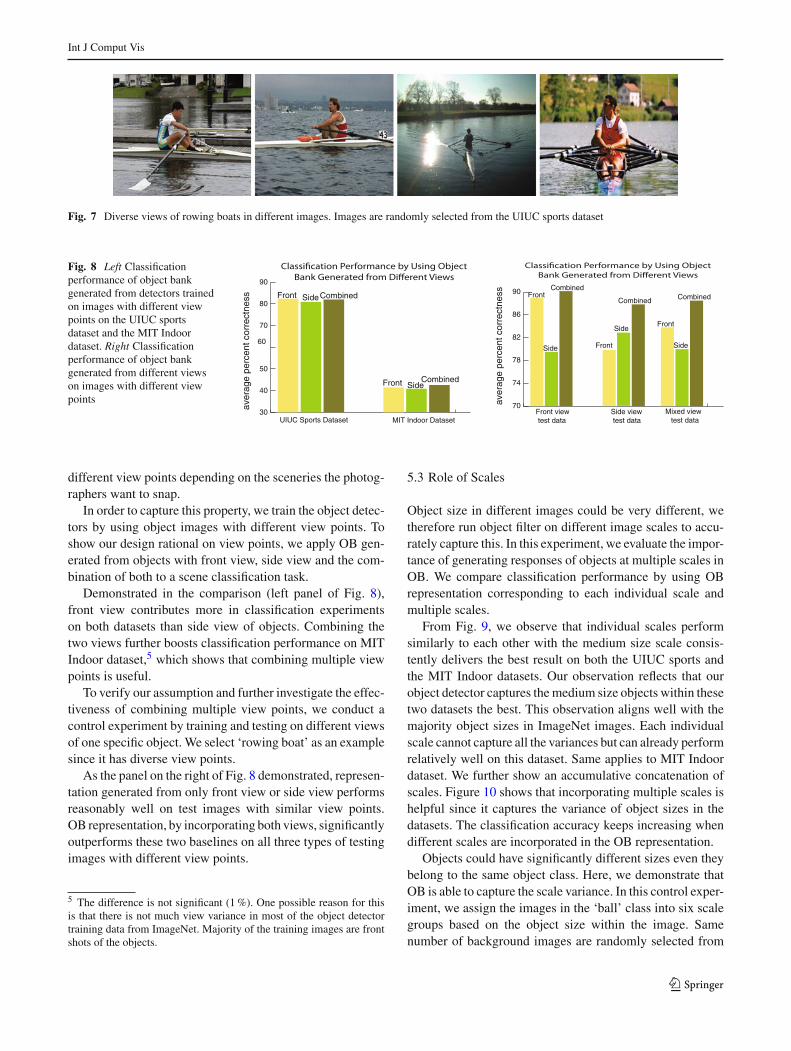
The view points of objects in different images could varydramatically. For example, in Fig. 7, rowing boats appear in
123
Int J Comput Vis
Fig. 7 Diverse views of rowing boats in different images. Images are randomly selected from the UIUC sports dataset
Fig. 8 Left Classificationperformance of object bankgenerated from detectors trainedon images with different viewpoints on the UIUC sportsdataset and the MIT Indoordataset. Right Classificationperformance of object bankgenerated from different viewson images with different viewpoints
30
40
50
60
70
80
90
SideFront
aver
age
perc
ent c
orre
ctne
ss
CombinedFront
MIT Indoor DatasetUIUC Sports Dataset
Combined
Side
70
74
78
82
86
90
Side
Front
aver
age
perc
ent c
orre
ctne
ss
Combined
Front
Front view test data
Combined
Side
Side view test data
Mixed view test data
Combined
Front
Side
different view points depending on the sceneries the photog-raphers want to snap.
In order to capture this property, we train the object detec-tors by using object images with different view points. Toshow our design rational on view points, we apply OB gen-erated from objects with front view, side view and the com-bination of both to a scene classification task.
Demonstrated in the comparison (left panel of Fig. 8),front view contributes more in classification experimentson both datasets than side view of objects. Combining thetwo views further boosts classification performance on MITIndoor dataset,5 which shows that combining multiple viewpoints is useful.
To verify our assumption and further investigate the effec-tiveness of combining multiple view points, we conduct acontrol experiment by training and testing on different viewsof one specific object. We select ‘rowing boat’ as an examplesince it has diverse view points.
As the panel on the right of Fig. 8 demonstrated, represen-tation generated from only front view or side view performsreasonably well on test images with similar view points.OB representation, by incorporating both views, significantlyoutperforms these two baselines on all three types of testingimages with different view points.
5 The difference is not significant (1 %). One possible reason for thisis that there is not much view variance in most of the object detectortraining data from ImageNet. Majority of the training images are frontshots of the objects.
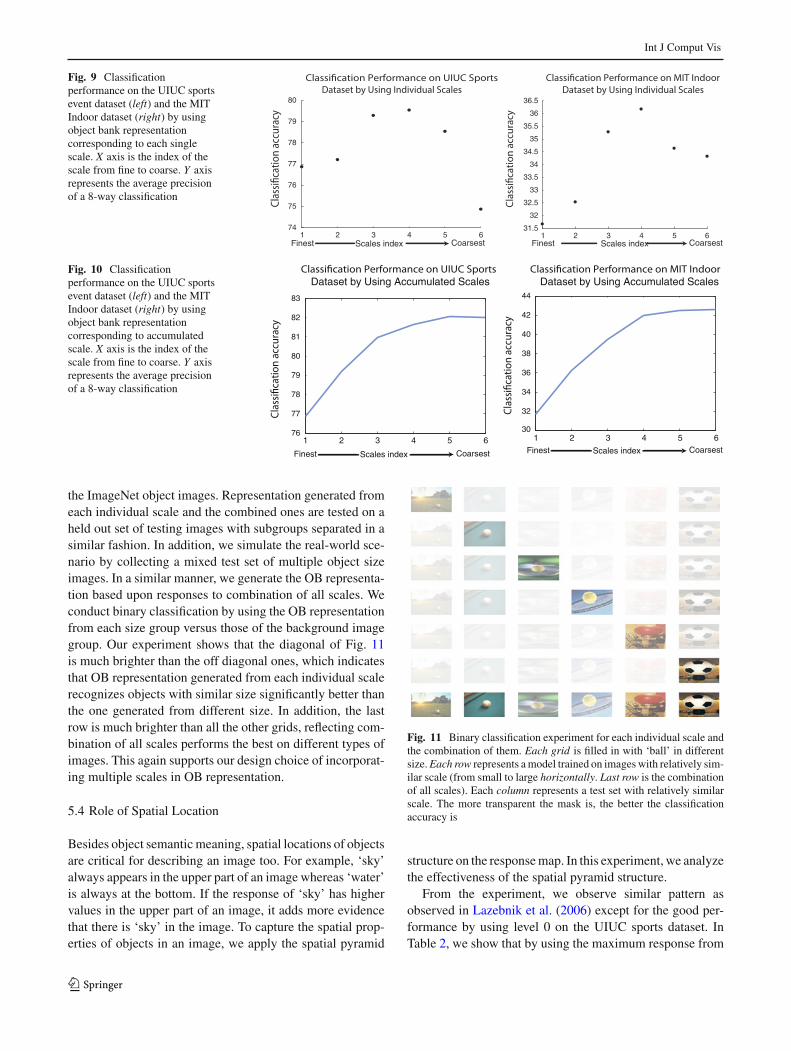
5.3 Role of Scales
Object size in different images could be very different, wetherefore run object filter on different image scales to accu-rately capture this. In this experiment, we evaluate the impor-tance of generating responses of objects at multiple scales inOB. We compare classification performance by using OBrepresentation corresponding to each individual scale andmultiple scales.
From Fig. 9, we observe that individual scales performsimilarly to each other with the medium size scale consis-tently delivers the best result on both the UIUC sports andthe MIT Indoor datasets. Our observation reflects that ourobject detector captures the medium size objects within thesetwo datasets the best. This observation aligns well with themajority object sizes in ImageNet images. Each individualscale cannot capture all the variances but can already performrelatively well on this dataset. Same applies to MIT Indoordataset. We further show an accumulative concatenation ofscales. Figure 10 shows that incorporating multiple scales ishelpful since it captures the variance of object sizes in thedatasets. The classification accuracy keeps increasing whendifferent scales are incorporated in the OB representation.
Objects could have significantly different sizes even theybelong to the same object class. Here, we demonstrate thatOB is able to capture the scale variance. In this control exper-iment, we assign the images in the ‘ball’ class into six scalegroups based on the object size within the image. Samenumber of background images are randomly selected from
123
Int J Comput Vis
Fig. 9 Classificationperformance on the UIUC sportsevent dataset (left) and the MITIndoor dataset (right) by usingobject bank representationcorresponding to each singlescale. X axis is the index of thescale from fine to coarse. Y axisrepresents the average precisionof a 8-way classification
1 2 3 4 5 674
75
76
77
78
79
80
Scales indexFinest Coarsest1 2 3 4 5 6
31.5
32
32.5
33
33.5
34
34.5
35
35.5
36
36.5
Scales indexFinest Coarsest
Fig. 10 Classificationperformance on the UIUC sportsevent dataset (left) and the MITIndoor dataset (right) by usingobject bank representationcorresponding to accumulatedscale. X axis is the index of thescale from fine to coarse. Y axisrepresents the average precisionof a 8-way classification
1 2 3 4 5 676
77
78
79
80
81
82
83
Dataset by Using Accumulated Scales
Scales indexFinest Coarsest
1 2 3 4 5 630
32
34
36
38
40
42
44
Dataset by Using Accumulated Scales
Scales indexFinest Coarsest
the ImageNet object images. Representation generated fromeach individual scale and the combined ones are tested on aheld out set of testing images with subgroups separated in asimilar fashion. In addition, we simulate the real-world sce-nario by collecting a mixed test set of multiple object sizeimages. In a similar manner, we generate the OB representa-tion based upon responses to combination of all scales. Weconduct binary classification by using the OB representationfrom each size group versus those of the background imagegroup. Our experiment shows that the diagonal of Fig. 11is much brighter than the off diagonal ones, which indicatesthat OB representation generated from each individual scalerecognizes objects with similar size significantly better thanthe one generated from different size. In addition, the lastrow is much brighter than all the other grids, reflecting com-bination of all scales performs the best on different types ofimages. This again supports our design choice of incorporat-ing multiple scales in OB representation.
5.4 Role of Spatial Location
Besides object semantic meaning, spatial locations of objectsare critical for describing an image too. For example, ‘sky’always appears in the upper part of an image whereas ‘water’is always at the bottom. If the response of ‘sky’ has highervalues in the upper part of an image, it adds more evidencethat there is ‘sky’ in the image. To capture the spatial prop-erties of objects in an image, we apply the spatial pyramid
Fig. 11 Binary classification experiment for each individual scale andthe combination of them. Each grid is filled in with ‘ball’ in differentsize. Each row represents a model trained on images with relatively sim-ilar scale (from small to large horizontally. Last row is the combinationof all scales). Each column represents a test set with relatively similarscale. The more transparent the mask is, the better the classificationaccuracy is
structure on the response map. In this experiment, we analyzethe effectiveness of the spatial pyramid structure.
From the experiment, we observe similar pattern asobserved in Lazebnik et al. (2006) except for the good per-formance by using level 0 on the UIUC sports dataset. InTable 2, we show that by using the maximum response from
123
Int J Comput Vis
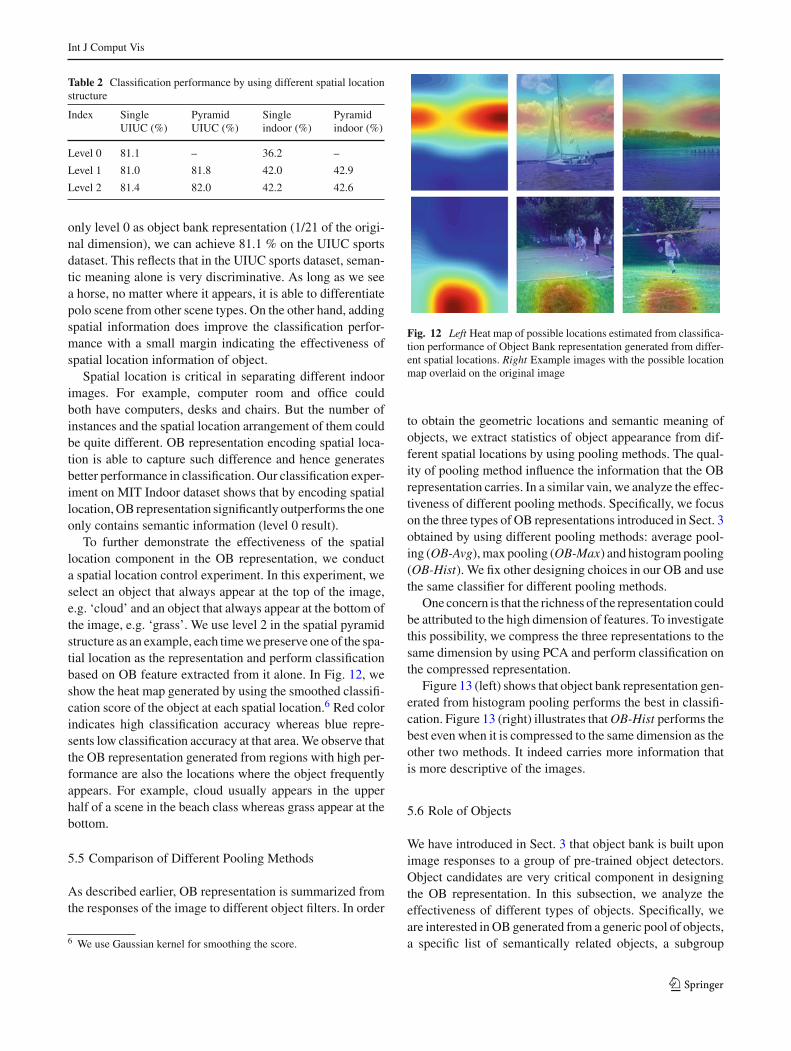
Table 2 Classification performance by using different spatial locationstructure
Index SingleUIUC (%)
PyramidUIUC (%)
Singleindoor (%)
Pyramidindoor (%)
Level 0 81.1 – 36.2 –
Level 1 81.0 81.8 42.0 42.9
Level 2 81.4 82.0 42.2 42.6
only level 0 as object bank representation (1/21 of the origi-nal dimension), we can achieve 81.1 % on the UIUC sportsdataset. This reflects that in the UIUC sports dataset, seman-tic meaning alone is very discriminative. As long as we seea horse, no matter where it appears, it is able to differentiatepolo scene from other scene types. On the other hand, addingspatial information does improve the classification perfor-mance with a small margin indicating the effectiveness ofspatial location information of object.
Spatial location is critical in separating different indoorimages. For example, computer room and office couldboth have computers, desks and chairs. But the number ofinstances and the spatial location arrangement of them couldbe quite different. OB representation encoding spatial loca-tion is able to capture such difference and hence generatesbetter performance in classification. Our classification exper-iment on MIT Indoor dataset shows that by encoding spatiallocation, OB representation significantly outperforms the oneonly contains semantic information (level 0 result).
To further demonstrate the effectiveness of the spatiallocation component in the OB representation, we conducta spatial location control experiment. In this experiment, weselect an object that always appear at the top of the image,e.g. ‘cloud’ and an object that always appear at the bottom ofthe image, e.g. ‘grass’. We use level 2 in the spatial pyramidstructure as an example, each time we preserve one of the spa-tial location as the representation and perform classificationbased on OB feature extracted from it alone. In Fig. 12, weshow the heat map generated by using the smoothed classifi-cation score of the object at each spatial location.6 Red colorindicates high classification accuracy whereas blue repre-sents low classification accuracy at that area. We observe thatthe OB representation generated from regions with high per-formance are also the locations where the object frequentlyappears. For example, cloud usually appears in the upperhalf of a scene in the beach class whereas grass appear at thebottom.
5.5 Comparison of Different Pooling Methods
As described earlier, OB representation is summarized fromthe responses of the image to different object filters. In order
6 We use Gaussian kernel for smoothing the score.
Fig. 12 Left Heat map of possible locations estimated from classifica-tion performance of Object Bank representation generated from differ-ent spatial locations. Right Example images with the possible locationmap overlaid on the original image
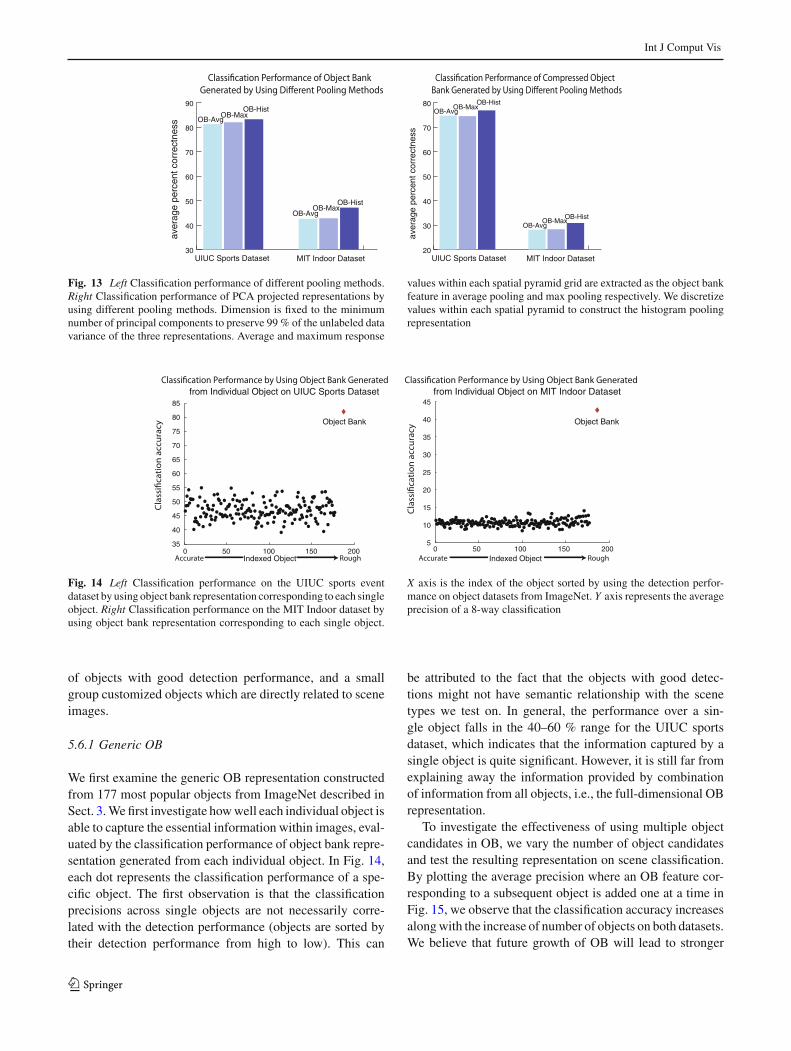
to obtain the geometric locations and semantic meaning ofobjects, we extract statistics of object appearance from dif-ferent spatial locations by using pooling methods. The qual-ity of pooling method influence the information that the OBrepresentation carries. In a similar vain, we analyze the effec-tiveness of different pooling methods. Specifically, we focuson the three types of OB representations introduced in Sect. 3obtained by using different pooling methods: average pool-ing (OB-Avg), max pooling (OB-Max) and histogram pooling(OB-Hist). We fix other designing choices in our OB and usethe same classifier for different pooling methods.
One concern is that the richness of the representation couldbe attributed to the high dimension of features. To investigatethis possibility, we compress the three representations to thesame dimension by using PCA and perform classification onthe compressed representation.
Figure 13 (left) shows that object bank representation gen-erated from histogram pooling performs the best in classifi-cation. Figure 13 (right) illustrates that OB-Hist performs thebest even when it is compressed to the same dimension as theother two methods. It indeed carries more information thatis more descriptive of the images.
5.6 Role of Objects
We have introduced in Sect. 3 that object bank is built uponimage responses to a group of pre-trained object detectors.Object candidates are very critical component in designingthe OB representation. In this subsection, we analyze theeffectiveness of different types of objects. Specifically, weare interested in OB generated from a generic pool of objects,a specific list of semantically related objects, a subgroup
123
Int J Comput Vis
30
40
50
60
70
80
90
OB-Avg
aver
age
perc
ent c
orre
ctne
ss
MIT Indoor DatasetUIUC Sports Dataset
OB-HistOB-Max
OB-Avg
OB-HistOB-Max
20
30
40
50
60
70
80OB-Avg
aver
age
perc
ent c
orre
ctne
ss
MIT Indoor DatasetUIUC Sports Dataset
OB-HistOB-Max
OB-AvgOB-Hist
OB-Max
Fig. 13 Left Classification performance of different pooling methods.Right Classification performance of PCA projected representations byusing different pooling methods. Dimension is fixed to the minimumnumber of principal components to preserve 99 % of the unlabeled datavariance of the three representations. Average and maximum response
values within each spatial pyramid grid are extracted as the object bankfeature in average pooling and max pooling respectively. We discretizevalues within each spatial pyramid to construct the histogram poolingrepresentation
0 50 100 150 20035
40
45
50
55
60
65
70
75
80
85
Indexed Object
from Individual Object on UIUC Sports Dataset
Object Bank
RoughAccurate0 50 100 150 200
5
10
15
20
25
30
35
40
45
Indexed Object
from Individual Object on MIT Indoor Dataset
Object Bank
RoughAccurate
Fig. 14 Left Classification performance on the UIUC sports eventdataset by using object bank representation corresponding to each singleobject. Right Classification performance on the MIT Indoor dataset byusing object bank representation corresponding to each single object.
X axis is the index of the object sorted by using the detection perfor-mance on object datasets from ImageNet. Y axis represents the averageprecision of a 8-way classification
of objects with good detection performance, and a smallgroup customized objects which are directly related to sceneimages.
5.6.1 Generic OB
We first examine the generic OB representation constructedfrom 177 most popular objects from ImageNet described inSect. 3. We first investigate how well each individual object isable to capture the essential information within images, eval-uated by the classification performance of object bank repre-sentation generated from each individual object. In Fig. 14,each dot represents the classification performance of a spe-cific object. The first observation is that the classificationprecisions across single objects are not necessarily corre-lated with the detection performance (objects are sorted bytheir detection performance from high to low). This can
be attributed to the fact that the objects with good detec-tions might not have semantic relationship with the scenetypes we test on. In general, the performance over a sin-gle object falls in the 40–60 % range for the UIUC sportsdataset, which indicates that the information captured by asingle object is quite significant. However, it is still far fromexplaining away the information provided by combinationof information from all objects, i.e., the full-dimensional OBrepresentation.
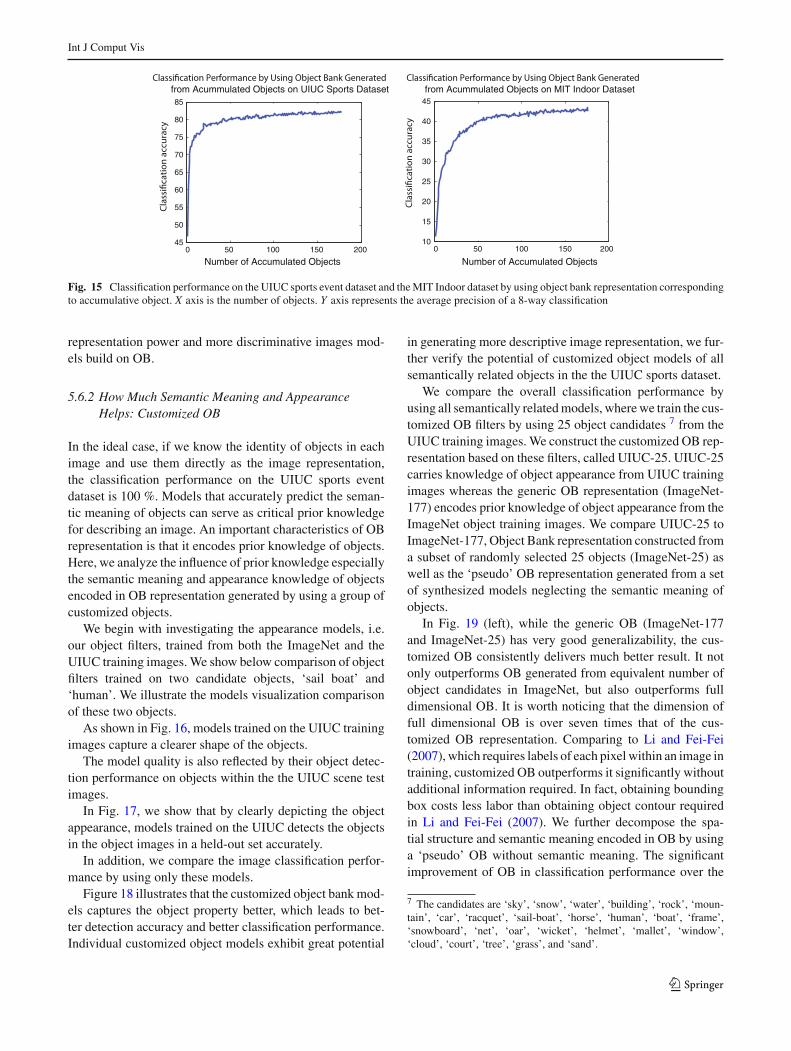
To investigate the effectiveness of using multiple objectcandidates in OB, we vary the number of object candidatesand test the resulting representation on scene classification.By plotting the average precision where an OB feature cor-responding to a subsequent object is added one at a time inFig. 15, we observe that the classification accuracy increasesalong with the increase of number of objects on both datasets.We believe that future growth of OB will lead to stronger
123
Int J Comput Vis
0 50 100 150 20045
50
55
60
65
70
75
80
85
Number of Accumulated Objects
from Acummulated Objects on UIUC Sports Dataset
0 50 100 150 20010
15
20
25
30
35
40
45
Number of Accumulated Objects
from Acummulated Objects on MIT Indoor Dataset
Fig. 15 Classification performance on the UIUC sports event dataset and the MIT Indoor dataset by using object bank representation correspondingto accumulative object. X axis is the number of objects. Y axis represents the average precision of a 8-way classification
representation power and more discriminative images mod-els build on OB.
5.6.2 How Much Semantic Meaning and AppearanceHelps: Customized OB
In the ideal case, if we know the identity of objects in eachimage and use them directly as the image representation,the classification performance on the UIUC sports eventdataset is 100 %. Models that accurately predict the seman-tic meaning of objects can serve as critical prior knowledgefor describing an image. An important characteristics of OBrepresentation is that it encodes prior knowledge of objects.Here, we analyze the influence of prior knowledge especiallythe semantic meaning and appearance knowledge of objectsencoded in OB representation generated by using a group ofcustomized objects.
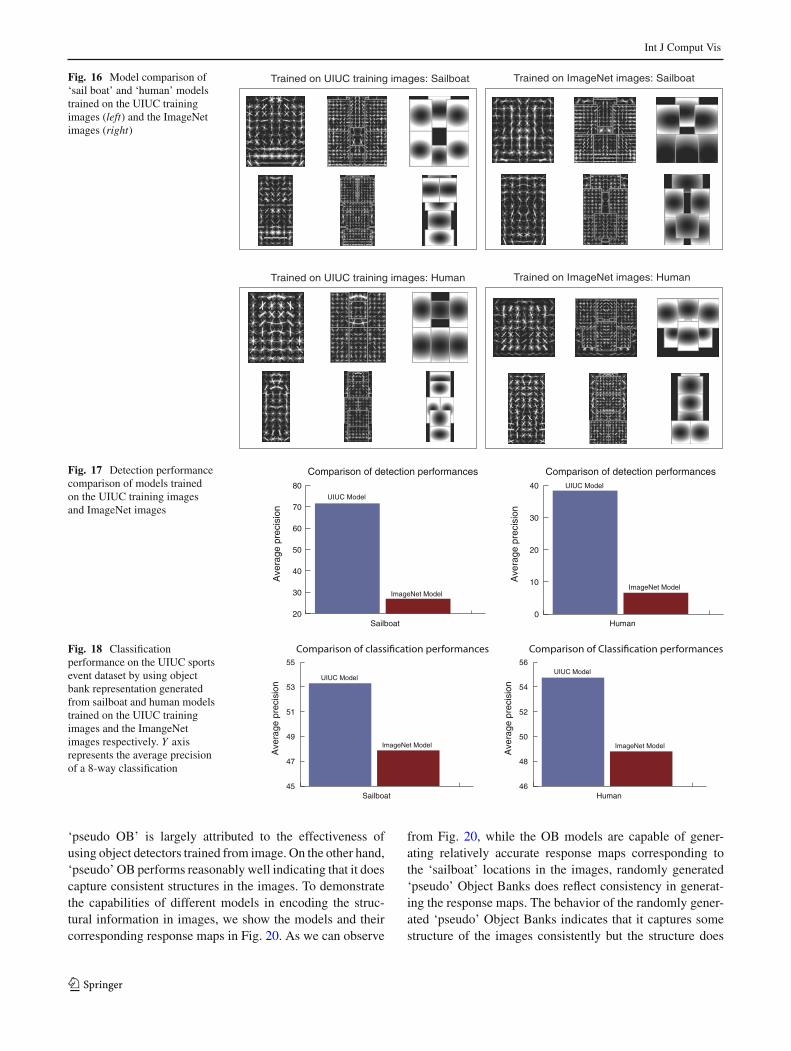
We begin with investigating the appearance models, i.e.our object filters, trained from both the ImageNet and theUIUC training images. We show below comparison of objectfilters trained on two candidate objects, ‘sail boat’ and‘human’. We illustrate the models visualization comparisonof these two objects.
As shown in Fig. 16, models trained on the UIUC trainingimages capture a clearer shape of the objects.
The model quality is also reflected by their object detec-tion performance on objects within the the UIUC scene testimages.
In Fig. 17, we show that by clearly depicting the objectappearance, models trained on the UIUC detects the objectsin the object images in a held-out set accurately.
In addition, we compare the image classification perfor-mance by using only these models.
Figure 18 illustrates that the customized object bank mod-els captures the object property better, which leads to bet-ter detection accuracy and better classification performance.Individual customized object models exhibit great potential
in generating more descriptive image representation, we fur-ther verify the potential of customized object models of allsemantically related objects in the the UIUC sports dataset.
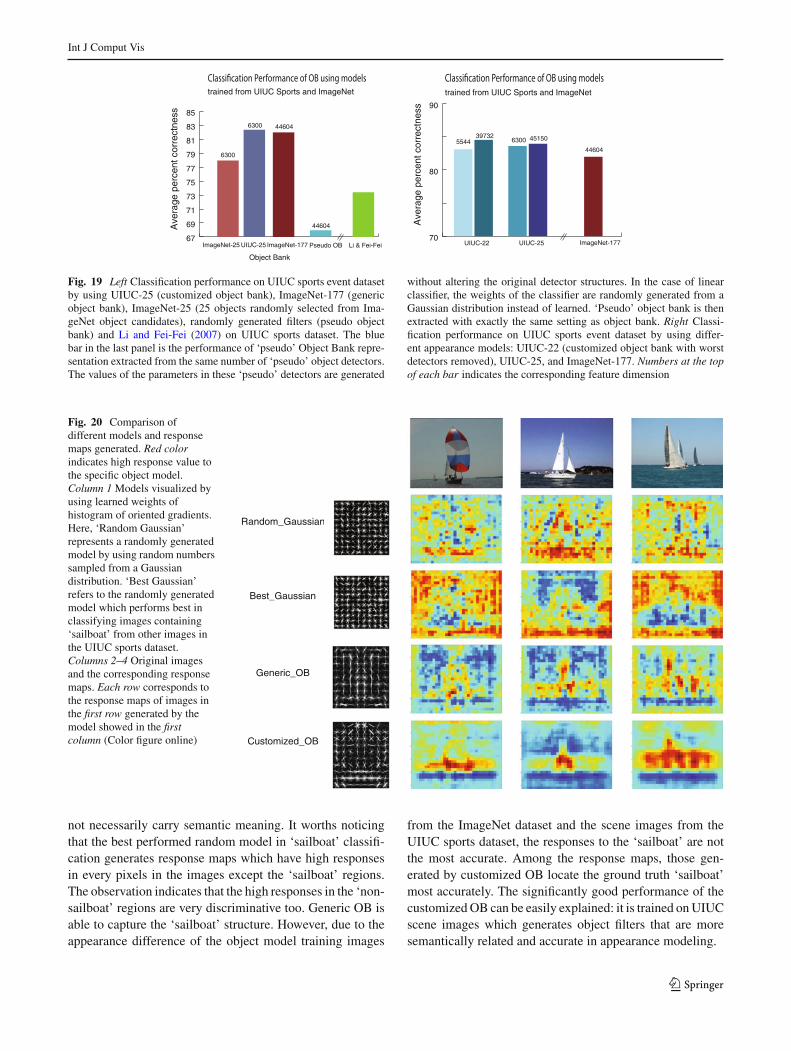
We compare the overall classification performance byusing all semantically related models, where we train the cus-tomized OB filters by using 25 object candidates 7 from theUIUC training images. We construct the customized OB rep-resentation based on these filters, called UIUC-25. UIUC-25carries knowledge of object appearance from UIUC trainingimages whereas the generic OB representation (ImageNet-177) encodes prior knowledge of object appearance from theImageNet object training images. We compare UIUC-25 toImageNet-177, Object Bank representation constructed froma subset of randomly selected 25 objects (ImageNet-25) aswell as the ‘pseudo’ OB representation generated from a setof synthesized models neglecting the semantic meaning ofobjects.
In Fig. 19 (left), while the generic OB (ImageNet-177and ImageNet-25) has very good generalizability, the cus-tomized OB consistently delivers much better result. It notonly outperforms OB generated from equivalent number ofobject candidates in ImageNet, but also outperforms fulldimensional OB. It is worth noticing that the dimension offull dimensional OB is over seven times that of the cus-tomized OB representation. Comparing to Li and Fei-Fei(2007), which requires labels of each pixel within an image intraining, customized OB outperforms it significantly withoutadditional information required. In fact, obtaining boundingbox costs less labor than obtaining object contour requiredin Li and Fei-Fei (2007). We further decompose the spa-tial structure and semantic meaning encoded in OB by usinga ‘pseudo’ OB without semantic meaning. The significantimprovement of OB in classification performance over the
7 The candidates are ‘sky’, ‘snow’, ‘water’, ‘building’, ‘rock’, ‘moun-tain’, ‘car’, ‘racquet’, ‘sail-boat’, ‘horse’, ‘human’, ‘boat’, ‘frame’,‘snowboard’, ‘net’, ‘oar’, ‘wicket’, ‘helmet’, ‘mallet’, ‘window’,‘cloud’, ‘court’, ‘tree’, ‘grass’, and ‘sand’.
123
Int J Comput Vis
Fig. 16 Model comparison of‘sail boat’ and ‘human’ modelstrained on the UIUC trainingimages (left) and the ImageNetimages (right)
Trained on UIUC training images: Sailboat Trained on ImageNet images: Sailboat
Trained on UIUC training images: Human Trained on ImageNet images: Human
Fig. 17 Detection performancecomparison of models trainedon the UIUC training imagesand ImageNet images
20
30
40
50
60
70
80UIUC Model
ImageNet Model
Comparison of detection performances
Ave
rage
pre
cisi
on
Sailboat0
10
20
30
40 UIUC Model
ImageNet Model
Comparison of detection performances
Ave
rage
pre
cisi
on
Human
Fig. 18 Classificationperformance on the UIUC sportsevent dataset by using objectbank representation generatedfrom sailboat and human modelstrained on the UIUC trainingimages and the ImangeNetimages respectively. Y axisrepresents the average precisionof a 8-way classification
45
47
49
51
53
55
UIUC Model
ImageNet Model
Ave
rage
pre
cisi
on
Sailboat46
48
50
52
54
56UIUC Model
ImageNet Model
Ave
rage
pre
cisi
on
Human
‘pseudo OB’ is largely attributed to the effectiveness ofusing object detectors trained from image. On the other hand,‘pseudo’ OB performs reasonably well indicating that it doescapture consistent structures in the images. To demonstratethe capabilities of different models in encoding the struc-tural information in images, we show the models and theircorresponding response maps in Fig. 20. As we can observe
from Fig. 20, while the OB models are capable of gener-ating relatively accurate response maps corresponding tothe ‘sailboat’ locations in the images, randomly generated‘pseudo’ Object Banks does reflect consistency in generat-ing the response maps. The behavior of the randomly gener-ated ‘pseudo’ Object Banks indicates that it captures somestructure of the images consistently but the structure does
123
Int J Comput Vis
trained from UIUC Sports and ImageNet
Ave
rage
per
cent
cor
rect
ness
67
69
71
73
75
77
79
81
83
85
Object Bank
ImageNet-25 UIUC-25 ImageNet-177 Li & Fei-Fei
6300
6300 44604
Pseudo OB
44604
trained from UIUC Sports and ImageNet
Ave
rage
per
cent
cor
rect
ness
70
80
90
ImageNet-177UIUC-22 UIUC-25
6300 451505544 39732
44604
Fig. 19 Left Classification performance on UIUC sports event datasetby using UIUC-25 (customized object bank), ImageNet-177 (genericobject bank), ImageNet-25 (25 objects randomly selected from Ima-geNet object candidates), randomly generated filters (pseudo objectbank) and Li and Fei-Fei (2007) on UIUC sports dataset. The bluebar in the last panel is the performance of ‘pseudo’ Object Bank repre-sentation extracted from the same number of ‘pseudo’ object detectors.The values of the parameters in these ‘pseudo’ detectors are generated
without altering the original detector structures. In the case of linearclassifier, the weights of the classifier are randomly generated from aGaussian distribution instead of learned. ‘Pseudo’ object bank is thenextracted with exactly the same setting as object bank. Right Classi-fication performance on UIUC sports event dataset by using differ-ent appearance models: UIUC-22 (customized object bank with worstdetectors removed), UIUC-25, and ImageNet-177. Numbers at the topof each bar indicates the corresponding feature dimension
Fig. 20 Comparison ofdifferent models and responsemaps generated. Red colorindicates high response value tothe specific object model.Column 1 Models visualized byusing learned weights ofhistogram of oriented gradients.Here, ‘Random Gaussian’represents a randomly generatedmodel by using random numberssampled from a Gaussiandistribution. ‘Best Gaussian’refers to the randomly generatedmodel which performs best inclassifying images containing‘sailboat’ from other images inthe UIUC sports dataset.Columns 2–4 Original imagesand the corresponding responsemaps. Each row corresponds tothe response maps of images inthe first row generated by themodel showed in the firstcolumn (Color figure online)
Random_Gaussian
Best_Gaussian
Generic_OB
Customized_OB
not necessarily carry semantic meaning. It worths noticingthat the best performed random model in ‘sailboat’ classifi-cation generates response maps which have high responsesin every pixels in the images except the ‘sailboat’ regions.The observation indicates that the high responses in the ‘non-sailboat’ regions are very discriminative too. Generic OB isable to capture the ‘sailboat’ structure. However, due to theappearance difference of the object model training images
from the ImageNet dataset and the scene images from theUIUC sports dataset, the responses to the ‘sailboat’ are notthe most accurate. Among the response maps, those gen-erated by customized OB locate the ground truth ‘sailboat’most accurately. The significantly good performance of thecustomized OB can be easily explained: it is trained on UIUCscene images which generates object filters that are moresemantically related and accurate in appearance modeling.
123
Int J Comput Vis
Fig. 21 Most related scenetype for each object. Rows areobjects and column representscene types. Classificationscores of individual objects areused as the measurement ofrelationship between objects andscene types. Transparent levelincreases with the classificationaccuracy
Most Related Scene Classes for Sampled Objects
An important question is that given the objects are seman-tically related, would better appearance models improve thequality of OB representation? In Fig. 19 (right), we investi-gate two possibilities for improving appearance models. Afew object candidates in the UIUC sports dataset has only acouple of training images, which leads to deteriorated detec-tion ability. Our first option to improve the appearance mod-els is to evaluate the detection performance of object can-didates and filter out three models8 with low detection per-formance. We call the representation generated UIUC-22.We can further improve our appearance models by increas-ing the number of scales, i.e., the possibility of accuratelycapturing more object sizes. Specifically, we increase thenumber of scales for UIUC-22 and UIUC-25 from 6 to 43,which makes the final dimension of both enriched represen-tations approximately the same as the original OB repre-sentation. We explore these two aspects as an example casestudy.
With a small number of semantically related modelstrained from the UIUC training images, the classification
8 racquet, helmet, window
is more accurate than that of all 177 object candidates inthe original OB representation. In addition, increasing thenumber of scales leads to richer appearance model whichgenerates even better representation for classification.
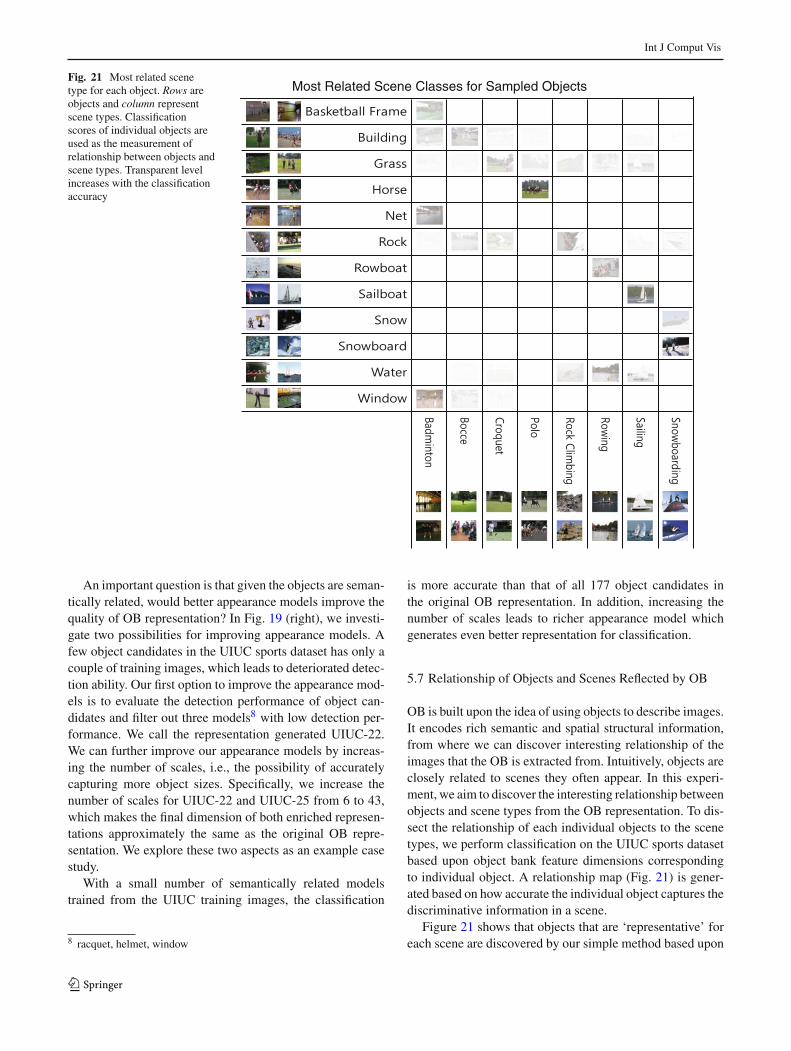
5.7 Relationship of Objects and Scenes Reflected by OB
OB is built upon the idea of using objects to describe images.It encodes rich semantic and spatial structural information,from where we can discover interesting relationship of theimages that the OB is extracted from. Intuitively, objects areclosely related to scenes they often appear. In this experi-ment, we aim to discover the interesting relationship betweenobjects and scene types from the OB representation. To dis-sect the relationship of each individual objects to the scenetypes, we perform classification on the UIUC sports datasetbased upon object bank feature dimensions correspondingto individual object. A relationship map (Fig. 21) is gener-ated based on how accurate the individual object captures thediscriminative information in a scene.
Figure 21 shows that objects that are ‘representative’ foreach scene are discovered by our simple method based upon
123
Int J Comput Vis
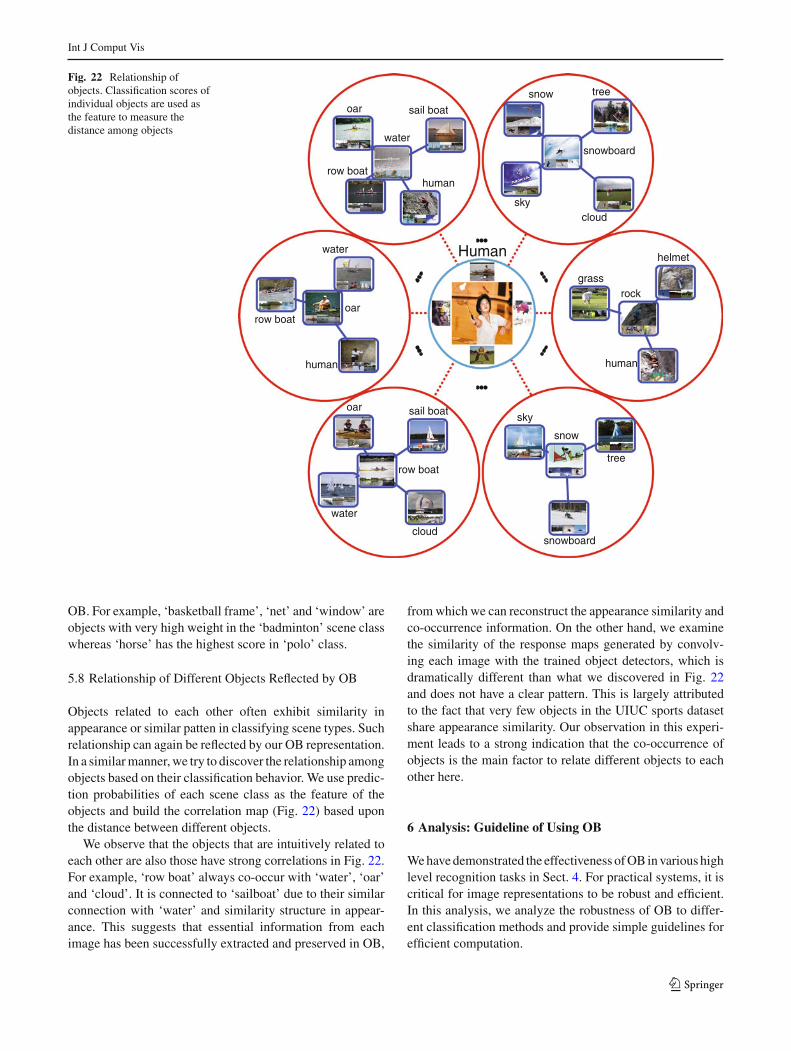
Fig. 22 Relationship ofobjects. Classification scores ofindividual objects are used asthe feature to measure thedistance among objects
Human
snowboard
sky
snow tree
cloud
row boat
water
oar sail boat
cloud
snow
sky
tree
snowboard
rockgrass
helmet
human
row boatoar
water
human
water
row boat
oar
human
sail boat
OB. For example, ‘basketball frame’, ‘net’ and ‘window’ areobjects with very high weight in the ‘badminton’ scene classwhereas ‘horse’ has the highest score in ‘polo’ class.
5.8 Relationship of Different Objects Reflected by OB
Objects related to each other often exhibit similarity inappearance or similar patten in classifying scene types. Suchrelationship can again be reflected by our OB representation.In a similar manner, we try to discover the relationship amongobjects based on their classification behavior. We use predic-tion probabilities of each scene class as the feature of theobjects and build the correlation map (Fig. 22) based uponthe distance between different objects.
We observe that the objects that are intuitively related toeach other are also those have strong correlations in Fig. 22.For example, ‘row boat’ always co-occur with ‘water’, ‘oar’and ‘cloud’. It is connected to ‘sailboat’ due to their similarconnection with ‘water’ and similarity structure in appear-ance. This suggests that essential information from eachimage has been successfully extracted and preserved in OB,
from which we can reconstruct the appearance similarity andco-occurrence information. On the other hand, we examinethe similarity of the response maps generated by convolv-ing each image with the trained object detectors, which isdramatically different than what we discovered in Fig. 22and does not have a clear pattern. This is largely attributedto the fact that very few objects in the UIUC sports datasetshare appearance similarity. Our observation in this experi-ment leads to a strong indication that the co-occurrence ofobjects is the main factor to relate different objects to eachother here.
6 Analysis: Guideline of Using OB
We have demonstrated the effectiveness of OB in various highlevel recognition tasks in Sect. 4. For practical systems, it iscritical for image representations to be robust and efficient.In this analysis, we analyze the robustness of OB to differ-ent classification methods and provide simple guidelines forefficient computation.
123
Int J Comput Vis
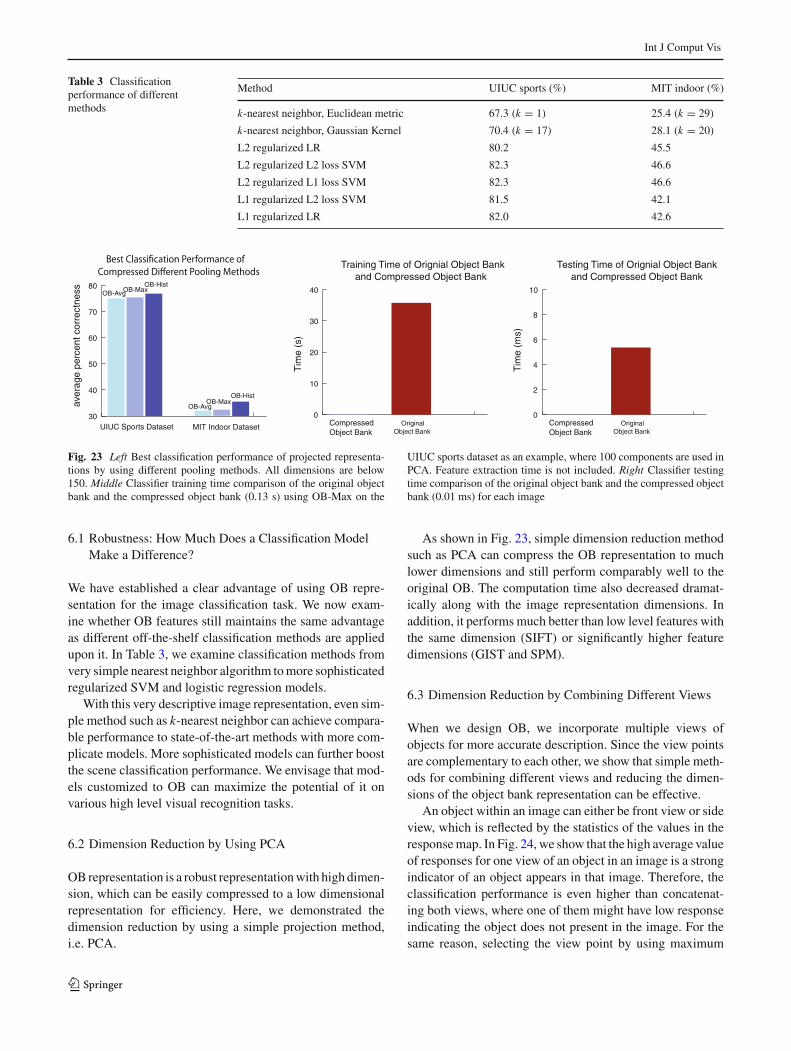
Table 3 Classificationperformance of differentmethods
Method UIUC sports (%) MIT indoor (%)
k-nearest neighbor, Euclidean metric 67.3 (k = 1) 25.4 (k = 29)
k-nearest neighbor, Gaussian Kernel 70.4 (k = 17) 28.1 (k = 20)
L2 regularized LR 80.2 45.5
L2 regularized L2 loss SVM 82.3 46.6
L2 regularized L1 loss SVM 82.3 46.6
L1 regularized L2 loss SVM 81.5 42.1
L1 regularized LR 82.0 42.6
30
40
50
60
70
80OB-Avg
aver
age
perc
ent c
orre
ctne
ss
MIT Indoor DatasetUIUC Sports Dataset
OB-HistOB-Max
OB-Avg
OB-HistOB-Max
0
10
20
30
40
Training Time of Orignial Object Bank and Compressed Object Bank
Tim
e (s
)
Compressed Object Bank
Original Object Bank
0
2
4
6
8
10
Testing Time of Orignial Object Bank and Compressed Object Bank
Tim
e (m
s)
Compressed Object Bank
Original Object Bank
Fig. 23 Left Best classification performance of projected representa-tions by using different pooling methods. All dimensions are below150. Middle Classifier training time comparison of the original objectbank and the compressed object bank (0.13 s) using OB-Max on the
UIUC sports dataset as an example, where 100 components are used inPCA. Feature extraction time is not included. Right Classifier testingtime comparison of the original object bank and the compressed objectbank (0.01 ms) for each image
6.1 Robustness: How Much Does a Classification ModelMake a Difference?
We have established a clear advantage of using OB repre-sentation for the image classification task. We now exam-ine whether OB features still maintains the same advantageas different off-the-shelf classification methods are appliedupon it. In Table 3, we examine classification methods fromvery simple nearest neighbor algorithm to more sophisticatedregularized SVM and logistic regression models.
With this very descriptive image representation, even sim-ple method such as k-nearest neighbor can achieve compara-ble performance to state-of-the-art methods with more com-plicate models. More sophisticated models can further boostthe scene classification performance. We envisage that mod-els customized to OB can maximize the potential of it onvarious high level visual recognition tasks.
6.2 Dimension Reduction by Using PCA
OB representation is a robust representation with high dimen-sion, which can be easily compressed to a low dimensionalrepresentation for efficiency. Here, we demonstrated thedimension reduction by using a simple projection method,i.e. PCA.
As shown in Fig. 23, simple dimension reduction methodsuch as PCA can compress the OB representation to muchlower dimensions and still perform comparably well to theoriginal OB. The computation time also decreased dramat-ically along with the image representation dimensions. Inaddition, it performs much better than low level features withthe same dimension (SIFT) or significantly higher featuredimensions (GIST and SPM).
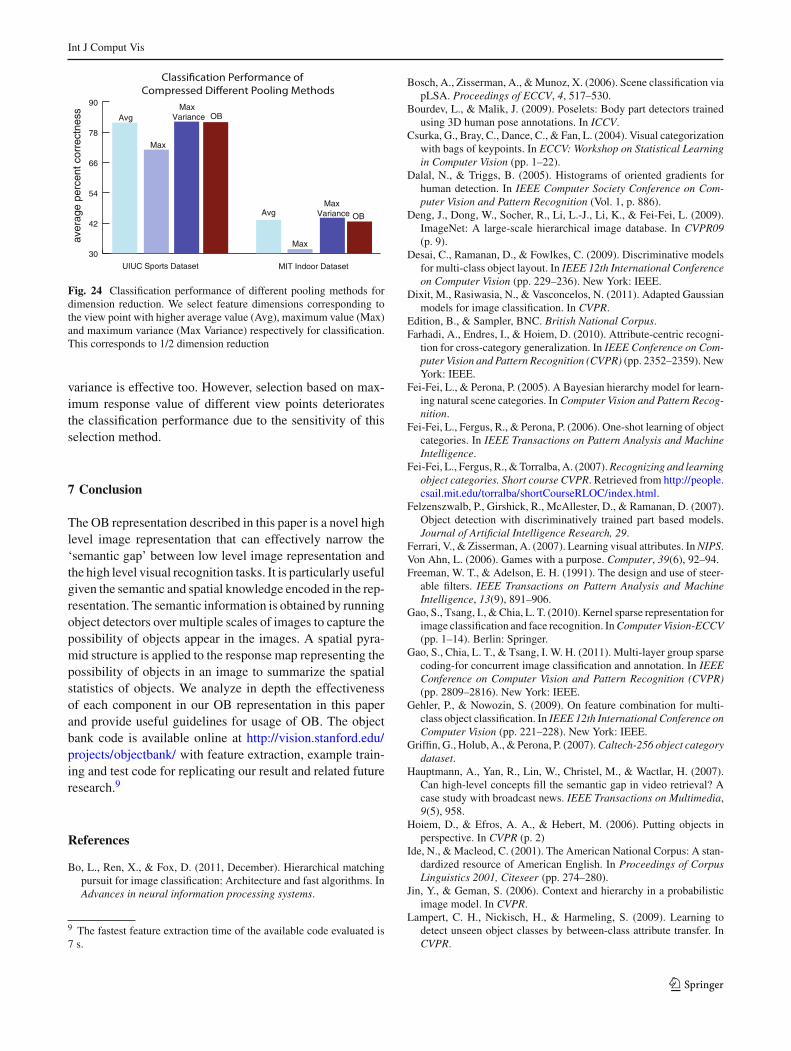
6.3 Dimension Reduction by Combining Different Views
When we design OB, we incorporate multiple views ofobjects for more accurate description. Since the view pointsare complementary to each other, we show that simple meth-ods for combining different views and reducing the dimen-sions of the object bank representation can be effective.
An object within an image can either be front view or sideview, which is reflected by the statistics of the values in theresponse map. In Fig. 24, we show that the high average valueof responses for one view of an object in an image is a strongindicator of an object appears in that image. Therefore, theclassification performance is even higher than concatenat-ing both views, where one of them might have low responseindicating the object does not present in the image. For thesame reason, selecting the view point by using maximum
123
Int J Comput Vis
30
42
54
66
78
90
Max
aver
age
perc
ent c
orre
ctne
ss
MIT Indoor DatasetUIUC Sports Dataset
MaxVariance Avg
Max
MaxVariance Avg
OB
OB
Fig. 24 Classification performance of different pooling methods fordimension reduction. We select feature dimensions corresponding tothe view point with higher average value (Avg), maximum value (Max)and maximum variance (Max Variance) respectively for classification.This corresponds to 1/2 dimension reduction
variance is effective too. However, selection based on max-imum response value of different view points deterioratesthe classification performance due to the sensitivity of thisselection method.
7 Conclusion
The OB representation described in this paper is a novel highlevel image representation that can effectively narrow the‘semantic gap’ between low level image representation andthe high level visual recognition tasks. It is particularly usefulgiven the semantic and spatial knowledge encoded in the rep-resentation. The semantic information is obtained by runningobject detectors over multiple scales of images to capture thepossibility of objects appear in the images. A spatial pyra-mid structure is applied to the response map representing thepossibility of objects in an image to summarize the spatialstatistics of objects. We analyze in depth the effectivenessof each component in our OB representation in this paperand provide useful guidelines for usage of OB. The objectbank code is available online at http://vision.stanford.edu/projects/objectbank/ with feature extraction, example train-ing and test code for replicating our result and related futureresearch.9
References
Bo, L., Ren, X., & Fox, D. (2011, December). Hierarchical matchingpursuit for image classification: Architecture and fast algorithms. InAdvances in neural information processing systems.
9 The fastest feature extraction time of the available code evaluated is7 s.
Bosch, A., Zisserman, A., & Munoz, X. (2006). Scene classification viapLSA. Proceedings of ECCV, 4, 517–530.
Bourdev, L., & Malik, J. (2009). Poselets: Body part detectors trainedusing 3D human pose annotations. In ICCV.
Csurka, G., Bray, C., Dance, C., & Fan, L. (2004). Visual categorizationwith bags of keypoints. In ECCV: Workshop on Statistical Learningin Computer Vision (pp. 1–22).
Dalal, N., & Triggs, B. (2005). Histograms of oriented gradients forhuman detection. In IEEE Computer Society Conference on Com-puter Vision and Pattern Recognition (Vol. 1, p. 886).
Deng, J., Dong, W., Socher, R., Li, L.-J., Li, K., & Fei-Fei, L. (2009).ImageNet: A large-scale hierarchical image database. In CVPR09(p. 9).
Desai, C., Ramanan, D., & Fowlkes, C. (2009). Discriminative modelsfor multi-class object layout. In IEEE 12th International Conferenceon Computer Vision (pp. 229–236). New York: IEEE.
Dixit, M., Rasiwasia, N., & Vasconcelos, N. (2011). Adapted Gaussianmodels for image classification. In CVPR.
Edition, B., & Sampler, BNC. British National Corpus.Farhadi, A., Endres, I., & Hoiem, D. (2010). Attribute-centric recogni-
tion for cross-category generalization. In IEEE Conference on Com-puter Vision and Pattern Recognition (CVPR) (pp. 2352–2359). NewYork: IEEE.
Fei-Fei, L., & Perona, P. (2005). A Bayesian hierarchy model for learn-ing natural scene categories. In Computer Vision and Pattern Recog-nition.
Fei-Fei, L., Fergus, R., & Perona, P. (2006). One-shot learning of objectcategories. In IEEE Transactions on Pattern Analysis and MachineIntelligence.
Fei-Fei, L., Fergus, R., & Torralba, A. (2007). Recognizing and learningobject categories. Short course CVPR. Retrieved from http://people.csail.mit.edu/torralba/shortCourseRLOC/index.html.
Felzenszwalb, P., Girshick, R., McAllester, D., & Ramanan, D. (2007).Object detection with discriminatively trained part based models.Journal of Artificial Intelligence Research, 29.
Ferrari, V., & Zisserman, A. (2007). Learning visual attributes. In NIPS.Von Ahn, L. (2006). Games with a purpose. Computer, 39(6), 92–94.Freeman, W. T., & Adelson, E. H. (1991). The design and use of steer-
able filters. IEEE Transactions on Pattern Analysis and MachineIntelligence, 13(9), 891–906.
Gao, S., Tsang, I., & Chia, L. T. (2010). Kernel sparse representation forimage classification and face recognition. In Computer Vision-ECCV(pp. 1–14). Berlin: Springer.
Gao, S., Chia, L. T., & Tsang, I. W. H. (2011). Multi-layer group sparsecoding-for concurrent image classification and annotation. In IEEEConference on Computer Vision and Pattern Recognition (CVPR)(pp. 2809–2816). New York: IEEE.
Gehler, P., & Nowozin, S. (2009). On feature combination for multi-class object classification. In IEEE 12th International Conference onComputer Vision (pp. 221–228). New York: IEEE.
Griffin, G., Holub, A., & Perona, P. (2007). Caltech-256 object categorydataset.
Hauptmann, A., Yan, R., Lin, W., Christel, M., & Wactlar, H. (2007).Can high-level concepts fill the semantic gap in video retrieval? Acase study with broadcast news. IEEE Transactions on Multimedia,9(5), 958.
Hoiem, D., & Efros, A. A., & Hebert, M. (2006). Putting objects inperspective. In CVPR (p. 2)
Ide, N., & Macleod, C. (2001). The American National Corpus: A stan-dardized resource of American English. In Proceedings of CorpusLinguistics 2001, Citeseer (pp. 274–280).
Jin, Y., & Geman, S. (2006). Context and hierarchy in a probabilisticimage model. In CVPR.
Lampert, C. H., Nickisch, H., & Harmeling, S. (2009). Learning todetect unseen object classes by between-class attribute transfer. InCVPR.
123
Int J Comput Vis
Lazebnik, S., Schmid, C., & Ponce, J. (2006). Beyond bags of features:Spatial pyramid matching for recognizing natural scene categories.Urbana: Beckman Institute.
Leung, T., & Malik, J. (2001, June). Representing and recognizingthe visual appearance of materials using three-dimensional textons.IJCV, 43(1), 29–44.
Li, L.-J., & Fei-Fei, L. (20007). What, where and who? Classifyingevents by scene and object recognition. In ICCV.
Li, L.-J., Socher, R., & Fei-Fei, L. (2009). Towards total scene under-standing: Classification, annotation and segmentation in an auto-matic framework. In CVPR.
Li, L.-J., Su, H., Lim, Y., & Fei-Fei, L. (2010). Objects as attributes forscene classification. In (ECCV), Workshop on PaA.
Li, L.-J., Su, H., Xing, E., & Fei-Fei, L. (2010). Object bank: A high-level image representation for scene classification & semantic featuresparsification. In NIPS.
Lowe, D. (1999). Object recognition from local scale-invariant features.In ICCV.
Miller, G. A. (1995). WordNet: A lexical database for English. In Com-munications of the ACM.
Oliva, A., & Torralba, A. (2001). Modeling the shape of the scene: Aholistic representation of the spatial envelope. In IJCV.
Pandey, M., & Lazebnik, S. (2011). Scene recognition and weaklysupervised object localization with deformable part-based models.In IEEE International Conference on Computer Vision (ICCV) (pp.1307–1314). New York: IEEE.
Perona, P., & Malik, J. (1990). Scale-space and edge detection usinganisotropic diffusion. PAMI, 12(7), 629–639.
Perronnin, F., Sánchez, J., & Mensink, T. (2010). Improving the fisherkernel for large-scale image classification. Computer Vision-ECCV,2010, 143–156.
Quattoni, A., & Torralba, A. (2009). Recognizing indoor scenes. InCVPR.
Russell, B. C., Torralba, A., Murphy, K. P., & Freeman, W. T. (2005).Labelme: A database and web-based tool for image, annotation.
Song, Z., Chen, Q., Huang, Z., Hua, Y., & Yan, S. (2011). Contextu-alizing object detection and classification. In IEEE Conference onComputer Vision and Pattern Recognition (CVPR).
Sudderth, E., Torralba, A., Freeman, W. T., & Willsky, A. (2005). Learn-ing hierarchical models of scenes, objects, and parts. In Proceedingsof International Conference on Computer Vision.
Torresani, L., Szummer, M., & Fitzgibbon, A. (2010). Efficient objectcategory recognition using classemes. In ECCV.
Tu, Z., Chen, X., Yuille, A. L., & Zhu, S. C. (2005). Image parsing: Uni-fying segmentation, detection, and recognition. International Jour-nal of Computer Vision, 63(2), 113–140.
Varma, M., & Zisserman, A. (2003). Texture classification: Are filterbanks necessary? In CVPR03 (Vol. II, pp. 691–698).
Vogel, J., & Schiele, B. (2004). A semantic typicality measure for nat-ural scene categorization. In DAGM’04 Annual Pattern RecognitionSymposium, Tuebingen, Germany.
Wang, J., Yang, J., Yu, K., Lv, F., Huang, T., & Gong, Y. (2010). Locality-constrained linear coding for image classification. In IEEE Con-ference on Computer Vision and Pattern Recognition (CVPR) (pp.3360–3367). New York: IEEE.
Zhu, L., Chen, Y., & Yuille, A. (2007). Unsupervised learning of aprobabilistic grammar for object detection and parsing. Advances inneural information processing systems, 19, 1617.
123