oakville market and economic feasibility study
TRANSCRIPT

Oakville Market and Economic Feasibility Study
Prepared for the Town of Watertown
Prepared by AdvanceCT
August 2020

Page | 2
AdvanceCT is a nonprofit organization that works to engage, retain and recruit businesses and advance overall economic competitiveness in Connecticut. In collaboration with the Connecticut Department of Economic and Community Development (DECD), AdvanceCT strives to build a place where business, government, higher education, and nonprofits come together to implement high impact and inclusive economic development solutions for the state.
Primary Contact:
Rachel Gretencord Director of Research (860) 571-6209 [email protected]
Author's Note:
This report was prepared prior to the COVID-19 public health emergency. It is important to note that economic data trends have changed and will continue to evolve as a result of the pandemic that is currently affecting every community. However, the structural findings included in this report will continue to be valuable input and serve as a baseline for strategic economic development planning initiatives.
Page | 3
Executive Summary The Town of Watertown contracted with Advance CT (the Connecticut Economic Resource Center) to conduct a market and economic feasibility analysis for 25 Hillside Avenue, a 16-acre site in Watertown’s Oakville section that was the location of a former Sealy plant (upper parcel) and the former Winchester Electronics facility (lower parcel), both subsequently demolished (the two legal parcels are referred to as the “Oakville Site”). This analysis, to include examination of demographics, housing, retail, industry and economic trends relevant to Watertown and the Oakville Site, was to support the creation of redevelopment scenarios with the best market potential for the site. More broadly, the analysis was also to suggest opportunities for Watertown to consider as part of its more comprehensive economic development strategy.
It should be noted that the Oakville Site was subject to certain past environmental contamination, which was remediated in compliance with the State of Connecticut Remediation Standard Regulations. As allowed under these regulations, deed restrictions were recorded that prohibit the use of the Oakville site for residential purposes and restrict disturbance of certain areas. As the Connecticut Department of Energy and Environmental Protection has indicated that these restrictions could be lifted if additional remediation were completed by a subsequent owner, this analysis has taken a broad view in terms of assessing the market potential for such uses, with the understanding that a developer would need to consider additional remediation as part of the planning process if the proposed redevelopment did not conform to existing site restrictions. The specific requirements for any potential remediation which would allow for more flexibility in the future re-use of the Oakville Site is beyond the scope of this analysis. However, given that additional remediation would allow for more varied re-uses, the study team has included the market potential for such uses.
The data in this report and the companion Housing report point to a number of opportunities that Watertown should consider for the Oakville Site. While all have significant limitations, certain of these uses have considerable potential. Successful redevelopment of the site will take planning and vision from a capable development team.
Housing
While the key housing findings of the analysis are included in this executive summary for reference, additional detail on the current and future demand for housing is contained in a separate report delivered to the Town.
Demand for housing is often included when considering redevelopment scenarios and it typically reflects the demographic profile. Watertown is projected to see a net decrease in the total number of working-age households totaling approximately 780 and a marked increase in the number of older residents and retirees. While shifts in the existing population indicate the number of housing units needed may decline slightly over the next several years, Watertown has a relative lack of smaller (0-2 bedroom) units and rental housing available, which may be constraining its growth.

Page | 4
Examining headship rates, or the portion of the population by age that is head of household, Watertown’s rates tend to be higher for homeownership units and lower for rental units than at the state or national level. In other words, if you wish to live in Watertown, purchasing a home may be the more likely option. If headship rates in Watertown were more similar to those at the state level, Watertown would be expected to have approximately 930 fewer homeowner households and 1075 more renter households.
Providing more diverse housing options can enable young people and new workers moving to the region to rent in the community, creating a pipeline of potential home purchasers and new residents. Similarly, this can provide a way for retirees and empty nesters who may wish to downsize or move to a more low-maintenance lifestyle to remain in the community. Furthermore, including housing on the Oakville Site could contribute to the density needed to support additional businesses in the area. Careful planning and investigation would be required, however, as the site is not currently approved for residential use. Additional environmental remediation would be required, the scope and cost of which is currently unknown.
In addition to linking to natural population shifts, the demand for housing can be impacted by external factors, such as economic conditions, natural disasters, changes related to major employers, and other drivers. While not all of these changes are predictable, supplementing basic housing data through discussions with large employers and key institutions regarding their growth plans and the housing needs of their constituents often helps indicate where housing options may need to be expanded.
Among the industries projected to see employment growth across the region, the top 5 account for 85% of the overall projected employment growth. These industries, the average annual wage by industry in New Haven and Litchfield counties, and the monthly housing costs that would be affordable for a typical worker in that industry, are shown below in Figure A on the following page. This chart also illustrates the need for housing at diverse price points. Among workers in lower-wage industries, such as accommodation and food services, and other services excluding public administration, a household with a single worker could not afford the median rent in Watertown. In higher-wage industries, households with a single worker could afford the median rent, but only those in educational services could afford the median monthly housing costs for owner-occupied homes. In two of the five top-growing industries, even a two-worker household could not afford the median homeownership costs without being cost-burdened.1
1 The affordability analysis is based on U.S. Census Bureau definitions, in which cost-burdened refers to a household spending more than 30% of its income on housing costs.

Page | 5
Figure A: Housing Affordability by Industry Source: Emsi, 2020; State of Connecticut Department of Labor, 2018; calculations by Advance CT
Industry
Estimated Change in
Employment in New Haven and
Litchfield Counties, 2018-
2028
Average Annual
Wage (New Haven and Litchfield Counties,
2018)
Monthly Housing
Affordability, Household
with 1 Worker2
Monthly Housing
Affordability, Household
with 2 Workers3
Health Care and Social Assistance 10,556 $50,189 $1,255 $2,509 Educational Services 6,301 $80,765 $2,019 $4,038
Accommodation and Food Services 4,032 $20,524 $513 $1,026 Other Services (except Public
Administration) 2,876 $30,374 $759 $1,519
Administrative and Support and Waste Management and
Remediation Services 2,792 $43,319 $1,083 $2,166
Retail
In addition to examining current and future demand for housing, consideration of redevelopment scenarios typically also includes an analysis of the area’s current retail landscape. This analysis finds that the area within a one-mile radius of the Oakville Site is the domain of convenience retail. These are goods and services for which customers are not willing to travel very far. Shops such as convenience stores, pharmacies, small grocery, coffee shops, and the like tend to be smaller and rely on local traffic to support their enterprise. In Watertown, the area’s retail gap (amount of unmet demand) for most convenience-oriented segments is fairly small, and some segments have a retail surplus, meaning sales are higher than expected and shoppers from outside the immediate area are being attracted.
Those retail segments that do have a larger gap (including clothing stores, department stores, and furniture stores) are not in the category of convenience retail but rather tend to be larger stores and have a much larger trade area, as noted below. Notably, however, restaurants and other eating places have a sizable gap, indicating that a small café or eatery may be a good fit for the site, particularly if paired with housing or commercial development that would help support such an establishment.
The area within a three-mile radius of the Oakville Site is primarily neighborhood retail, which generally includes neighborhood shopping centers. These centers might host, for example, a grocery store with some surrounding shops such as a café, bakery, bank, pharmacy, dry cleaner or laundromat,
2 Among households where at least one person is in the workforce, approximately 49% have 1 worker and 51% have two or more workers.
3 While actual households will likely have greater diversity, for illustrative purposes it is assumed here that in households with more than one worker, both work in the same industry.

Page | 6
real estate offices, florists, personal care stores, and similar types of businesses. Within 3 miles of the Oakville Site area, neighborhood retail such as personal care stores ($16M surplus) and grocery stores ($24M surplus) already have a surplus (meaning sales are higher than expected given the population), while industries such as florists and restaurants are more or less in balance. Retail segments with a sales gap that might represent potential opportunities include:
• clothing stores ($21M) • building material, garden equipment, and supply stores ($14M) • sporting goods, hobby, and musical instrument stores ($13M) • jewelry, luggage, and leather goods ($7M) • home furnishing stores ($5M)
The largest trade area examined (6 miles) represents community or anchor retail, which often includes larger grocery and drug stores, discount stores, and general merchandise, apparel, electronics, home goods, and sporting goods stores. These would typically be supported by several smaller stores including banks, bakeries, cafes, dry cleaners, specialty food markets, pharmacies, family restaurants, hardware or electronics stores, gift shops, home furnishings, ice cream, jewelry, or liquor stores. Data suggest that there is potential opportunity for additional community retail in Watertown. Segments with a retail gap that could potentially be captured by a new entrant include:
• other motor vehicle stores ($23M) • furniture stores ($23M) • sporting goods, hobby, book and music stores ($15M) • jewelry, luggage & leather goods stores ($9M), • Building material, garden equipment and supply stores ($7M).
However, within these categories, consideration should be given to whether there is an anchor destination in the immediate vicinity to draw traffic to the area, and whether the site is suitable for larger-scale retail.
Overall, while there appears to be limited need for additional large-scale retail, certain sectors show some potential, including smaller neighborhood clothing; building material, garden equipment, and supplies; sporting goods, hobby, and musical instrument stores; jewelry, luggage, and leather goods; and home furnishings stores. Retail segments with the greatest potential for success are likely smaller shops with goods and services that cater to the unique demographics of the population living in the immediate vicinity, retailers with a niche clientele, a unique product or service, or those that capitalize on the particular scale and character of the Oakville neighborhood.
It should be noted that retail generally is in transition, and the growth in online shopping and other factors have made this a tough segment. Regionally, retail leasing has been very slow in recent months, and developments that have been successful incorporate an entertainment factor or other unique elements to draw people to the area. Combining retail with other commercial or housing use could help provide support for any new businesses that locate here.

Page | 7
Office/Commercial
Redevelopment analyses often include consideration of other types of commercial uses, in addition to retail. In the Oakville Site region, similar to retail, office leasing generally has been slow. Growing industries that have the greatest need for space have been industrial and warehouse users. However, there are certain industries growing regionally that could be users of office or commercial space and would provide potential tenants for a new development. These include information services, data processing and hosting, ambulatory healthcare, administrative and support services, and eating and drinking places. Particularly in the office/commercial sector, the long-term impacts of COVID-19 are unknown. For example, the growth of work-from-home arrangements could significantly decrease the demand for office space long-term, while the desire for companies to relocate to less-dense suburban locations could open up new opportunities.
Site-Specific Opportunities
In any redevelopment, the unique characteristics of the site and the surrounding area must be considered. For the Oakville Site, the location adjacent to the Oakville Town Green and Pinshop Pond represents an opportunity to capitalize on existing outdoor space that could create a distinctive amenity linked to the site. Other creative ideas, such as considering allowing for maker spaces connected to storefront uses may also create a unique draw. Several of the retail categories with a “gap,” including hobby stores, jewelry and leather goods, and home furnishings may lend themselves to such an experiential arrangement.
In addition, the industry analysis of the Watertown region highlighted types of businesses that could be successful in Watertown and on the Oakville Site. Examples include ambulatory healthcare, data processing and hosting, administrative/support services, and eating and drinking establishments, which may be permitted in the Oakville Site zoning District B-C under the general, medical and professional offices; telecommunications facilities; and sit-down restaurants categories.
These industry areas are further defined as:
• NAICS 519 Other Information Services: Industries in this sector include establishments supplying information, storing and providing access to information, searching and retrieving information, operating Web sites that use search engines to allow for searching information on the Internet, or publishing and/or broadcasting content exclusively on the Internet. Example establishments in Watertown include Proconversions Corporation, Oakville Public Library, and New Life Computers.
• NAICS 533 Lessors of Nonfinancial Intangible Assets (except Copyrighted Works):
Industries in this sector include establishments that are primarily engaged in assigning rights to assets, such as patents, trademarks, brand names, and/or franchise agreements for which a royalty payment or licensing fee is paid to the asset holder. R & K Spero Inc. is an example establishment in the region.
Page | 8
• NAICS 518 Data Processing, Hosting, and Related Services: Industries in this sector include establishments that provide the infrastructure for hosting and/or data processing services. Example establishments in the region include ADP, Fiserv, and Spot on Networks.
• NAICS 621 Ambulatory Health Care Services: Industries in this sector provide health
care services directly or indirectly to ambulatory patients and do not usually provide inpatient services. Health practitioners in this subsector provide outpatient services, with the facilities and equipment not usually being the most significant part of the production process. Example establishments in the region include Restoring Your Wellness, Rise up Behavioral Health Service, and Neck & Back Pain Specialist.
The defining features of these four industries are that they met four of the seven criteria in the industry analysis, that employment is projected to grow significantly in the industry over the next five years4, and that the industry conforms to zoning requirements on the Oakville Site. What’s more, each industry has seen its local wage growth exceed the average local wage growth since 2014 and each average annual industry wage is greater than the state annual average of $66,2505. Additionally, employment in each selected industry is projected to significantly grow in the region. Specifically, each industry is projected to grow at least 12% from 2019 to 2024, with other information services projected to grow up to 20% in the region, the highest percentage of all the recommended industries.3
Key Data Findings
Demographic Trends
• The population of Watertown is aging with a relatively large proportion of residents aged 65+ and is less racially and ethnically diverse than New Haven and Litchfield Counties or the state.
• Watertown has mostly middle-income and married-couple family households. • Watertown has a relatively large percentage of people with associate’s and post-bachelor’s
degrees, while a relatively smaller percentage of people with bachelor’s degrees.
Transit and Commuting Patterns
• Watertown has significant ties with other areas of the state; most Watertown workers live in other municipalities and the majority of Watertown residents commute outside of the municipality for work in western Connecticut counties.
4 Source: Emsi projections, 2024, calculations by Advance CT
5 Source: Emsi, calculations by Advance CT

Page | 9
• The Oakville Site is within easy commuting distance of many of the state’s population and employment centers.
• Route 73 just south of the Oakville Site has an annual average daily traffic (AADT) of 15,000 vehicles per day.
Environmental Conditions and Zoning
• The Oakville Site was remediated in compliance with the State of Connecticut Remediation Standard Regulations. As allowed under these regulations, deed restrictions were recorded that prohibit the use of the Oakville site for residential purposes and restrict disturbance of certain areas. One area of the site, approximately 15,469 square feet, requires no soil disturbance. Another area, approximately 4,576 square feet, can have no building constructed on it. Additionally, the entire site is subject to the restriction of no residential use.
• The Department of Energy and Environmental Protection (DEEP) indicated that these restrictions could potentially be lifted if additional remediation were completed.
• The site has been rezoned as part of the Oakville Business District, for retail and office uses up to 7,500 square feet with site plan permit; retail and commercial uses up to 20,000 square feet; housing; and other limited uses are possible by special permit.
Housing Analysis
• Watertown’s housing stock contains mostly larger homes and contains few rental options. There is evidence that lack of housing diversity may be constraining the town’s growth.
• Household formation driven by endogenous population is projected to contract slightly over the coming years, so the most significant growth opportunities will originate primarily from new workforce moving to the region, which may require more diverse housing options.
• The age demographic in Watertown is expected to skew toward the 65 and over age group, which may require smaller, lower maintenance housing options.
• Among the top-growing industries regionally, four of the five industries have average wages that would not support the median homeownership costs in Watertown on a single income.
Retail Analysis
• Convenience retail analysis shows additional need for restaurants/eateries in the immediate area. There is little need for additional convenience-oriented retail, but new development (such as retail or office use) that increases activity at the site could increase demand.
• Due to the proximity to Waterbury, there is little need for large-scale retail, though some smaller neighborhood stores could potentially be supported.
• Neighborhood retail sectors that show potential include: clothing; building material, garden equipment, and supplies; sporting goods, hobby, and musical instrument stores; jewelry, luggage, and leather goods; or home furnishings.
• Retail segments with the greatest potential for success are likely smaller shops with goods and services that cater to the unique demographics of the population living in the immediate

Page | 10
vicinity, retailers with a niche clientele, a unique product or service, or those that capitalize on the particular scale and character of the Oakville neighborhood.
Regional Industry Analysis
• Metrics based on industry and wage growth (both nationally and regionally) as well as industry concentration and competitiveness were used to identify industries that are strong or emerging in the region, which may be good candidates for the site. Many of the industries identified were in in the manufacturing and transportation sectors, which may not be suitable for the Oakville Site.
• Strong or growing industries which may be suitable for the Oakville Site include: o NAICS 519 Other Information Services o NAICS 533 Lessors of Nonfinancial Intangible Assets (except Copyrighted Works) o NAICS 518 Data Processing, Hosting, and Related Services o NAICS 621 Ambulatory Health Care Services
• Two other industries did not score as highly in all areas of the analysis, but should also be considered due to anticipated regional job growth, and the potential to create retail and business-type storefronts such as those desired by the town for the Oakville Business District. These industries are:
o NAICS 561 Administrative with Support Services o NAICS 722 Food Services and Drinking Places
Regional Economic Trends
• The number of businesses in the region has steadily increased over the last 5 years; similarly, the average annual employment in Watertown has grown, albeit at a slower pace.
• Watertown has a higher relative concentration of employment in the educational services, and health care and social assistance sector and the manufacturing sector than the surrounding areas do. These are also Watertown’s two largest employment sectors.
• In recent years, the unemployment rate has been lower in Watertown than in the U.S. and Connecticut.
• The region’s highest wages are in Construction; Wholesale Trade; Professional, Scientific and Technical Services; and Manufacturing.
• Local and regional commercial real estate activity has focused on industrial and warehouse properties, while office and retail leasing has been relatively slow. However, Watertown currently does not have large notable office or retail vacancies.
• The real estate industry has been heavily impacted by COVID-19. Recent, comprehensive economic data is not yet available and it is too early to predict the long-term economic impacts of the pandemic, which has delayed many business decisions., An increase in remote work may have a dampening effect on the demand for office and retail space. Conversely, there is some evidence that the demand for space in suburban areas away from dense city centers where it is

Page | 11
difficult for employees to socially distance is increasing. The net impact of these contrasting influences is yet to be determined.
Page | 12
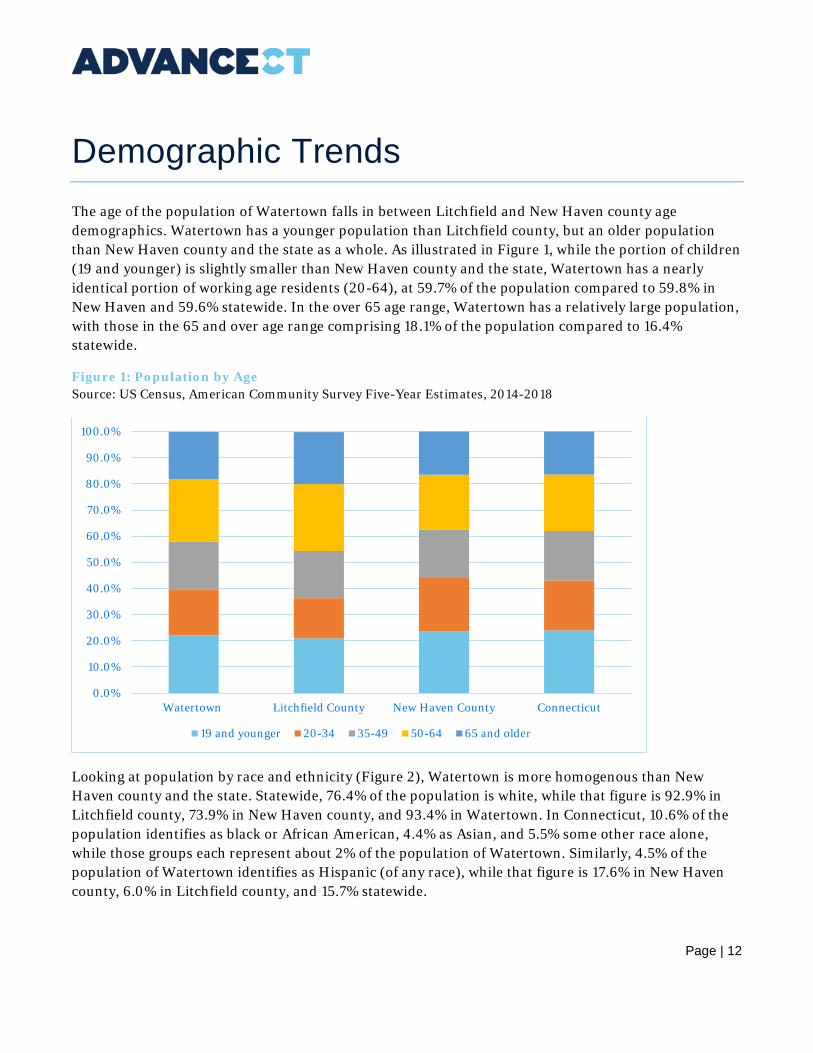
Demographic Trends The age of the population of Watertown falls in between Litchfield and New Haven county age demographics. Watertown has a younger population than Litchfield county, but an older population than New Haven county and the state as a whole. As illustrated in Figure 1, while the portion of children (19 and younger) is slightly smaller than New Haven county and the state, Watertown has a nearly identical portion of working age residents (20-64), at 59.7% of the population compared to 59.8% in New Haven and 59.6% statewide. In the over 65 age range, Watertown has a relatively large population, with those in the 65 and over age range comprising 18.1% of the population compared to 16.4% statewide.
Figure 1: Population by Age Source: US Census, American Community Survey Five-Year Estimates, 2014-2018
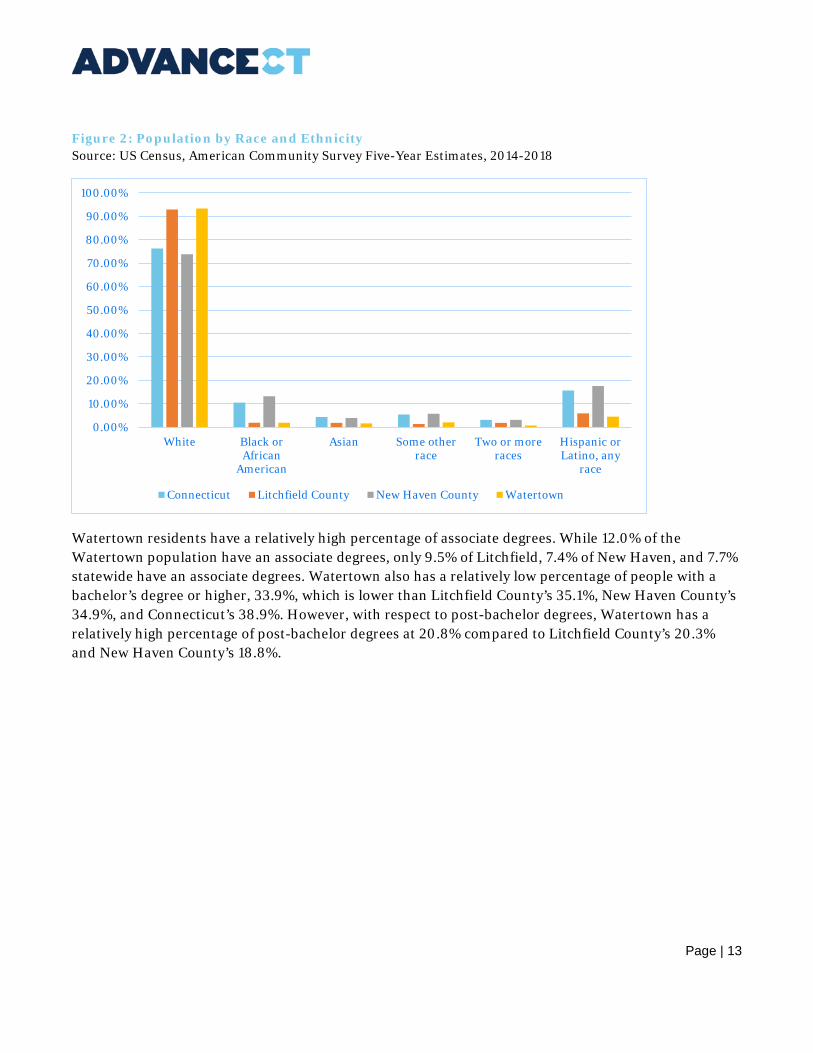
Looking at population by race and ethnicity (Figure 2), Watertown is more homogenous than New Haven county and the state. Statewide, 76.4% of the population is white, while that figure is 92.9% in Litchfield county, 73.9% in New Haven county, and 93.4% in Watertown. In Connecticut, 10.6% of the population identifies as black or African American, 4.4% as Asian, and 5.5% some other race alone, while those groups each represent about 2% of the population of Watertown. Similarly, 4.5% of the population of Watertown identifies as Hispanic (of any race), while that figure is 17.6% in New Haven county, 6.0% in Litchfield county, and 15.7% statewide.
0.0%
10.0%
20.0%
30.0%
40.0%
50.0%
60.0%
70.0%
80.0%
90.0%
100.0%
Watertown Litchfield County New Haven County Connecticut
19 and younger 20-34 35-49 50-64 65 and older
Page | 13
Figure 2: Population by Race and Ethnicity Source: US Census, American Community Survey Five-Year Estimates, 2014-2018
Watertown residents have a relatively high percentage of associate degrees. While 12.0% of the Watertown population have an associate degrees, only 9.5% of Litchfield, 7.4% of New Haven, and 7.7% statewide have an associate degrees. Watertown also has a relatively low percentage of people with a bachelor’s degree or higher, 33.9%, which is lower than Litchfield County’s 35.1%, New Haven County’s 34.9%, and Connecticut’s 38.9%. However, with respect to post-bachelor degrees, Watertown has a relatively high percentage of post-bachelor degrees at 20.8% compared to Litchfield County’s 20.3% and New Haven County’s 18.8%.
0.00%
10.00%
20.00%
30.00%
40.00%
50.00%
60.00%
70.00%
80.00%
90.00%
100.00%
White Black orAfrican
American
Asian Some otherrace
Two or moreraces
Hispanic orLatino, any
race
Connecticut Litchfield County New Haven County Watertown

Page | 14
Figure 3: Population by Educational Attainment for 25+ population Source: US Census, American Community Survey Five-Year Estimates, 2014-2018
Watertown is also slightly different from the surrounding counties and Connecticut in terms of household family status, as seen in Figure 4. Watertown has a larger portion of married-couple families, and a smaller portion of single-parent families and nonfamily households, than the other geographies. In Watertown, 55.2% of households are married-couple families, compared to 52.7% in Litchfield County, 43.8% in New Haven County, and 48.3% in Connecticut.
0%
10%
20%
30%
40%
50%
60%
70%
80%
90%
100%
Watertown Litchfield County New Haven County Connecticut
Less than High School High School Graduate or Equivalent
Some College Associate's degree
Bachelor's Degree or Higher

Page | 15
Figure 4: Households by Family Status Source: US Census, American Community Survey Five-Year Estimates, 2014-2018
As may be expected given the higher rate of associate and bachelor degrees and larger portion of married-couple families (which would be more likely to have two incomes than single-parent families), Watertown also has a higher percentage of middle-income households than the surrounding geographies (Figure 5). In Watertown, 31.7% of households earn $50,000 to less than $100,000 per year, compared to 30.9% in Litchfield County, 28.8% in New Haven County, and 28.0% in Connecticut. Households earning $100,000 to less than $200,000 per year comprise 28.0% of households in Watertown, compared to 29.0% of households in Litchfield County, 24.6% of households in New Haven County, and 26.3% of households in the state.
0% 20% 40% 60% 80% 100%
Watertown town
Litchfield County
New Haven County
Connecticut
Married-couple family Single-parent family Nonfamily households

Page | 16
Figure 5: Household Income Source: US Census, American Community Survey Five-Year Estimates, 2014-2018
0%
10%
20%
30%
40%
50%
60%
70%
80%
90%
100%
Watertown town Litchfield County New Haven County Connecticut
Under $50K $50K to less than $100K $100K to less than $200K $200K or more

Page | 17
Transit and Commuting Patterns To understand the Oakville Site’s potential, it is important to understand the economic ties of the Watertown region. One way to do this is by examining commuter data to understand where people who live in the Town commute for work, and where employees who work in the Town live. As shown in the following charts, Watertown has significant ties to Waterbury, as well as to the two surrounding counties, Litchfield County and New Haven County. As seen in Figure 6, Watertown residents work primarily in the four western counties of Connecticut, including 39% in New Haven County, 25% in Litchfield County, 17% in Hartford County, and 10% in Fairfield County. Looking at individual municipalities, the greatest proportion of residents, 20%, commute to Waterbury for work, with 15% working in Watertown, and all other towns have shares less than 5%.
Figure 6: Where Watertown residents work Source: U.S. Census, On the Map, 2017
In looking at who commutes to Watertown for work, the patterns are similarly diverse (Figure 7). Forty one percent of Watertown workers hail from New Haven County, including 22% who commute to Watertown from Waterbury. Another 36% are from Litchfield County, 9% are from Hartford County, and 6% commute to Watertown from Fairfield County. Other than Waterbury and Watertown, no other municipality is home to more than 5% of Watertown workers. This illustrates the diversity of the geographic region to which Watertown has ties.
Waterbury, 20%
Rest of New Haven County (excluding Waterbury), 19%
Watertown, 15%
Rest of Litchfield
County (excluding
W t t )
Hartford County, 17%
Fairfield County, 10%
All Other Locations, 9%

Page | 18
Figure 7: Where employees who work in Watertown live Source: U.S. Census, On the Map, 2017
In terms of commute times, the average travel time to work for Watertown residents is 24.7 minutes, slightly lower than the state (26.3 minutes) or national (26.6 minutes) averages.6 The Oakville site is within easy commuter distance of a number of the state’s population and employment centers, as seen in Figure 8. This should make it easy for potential residents or employees on the site to commute to work. The site is 2.4 miles from Route 8 and 3.5 miles from I-84.
6 U.S. Census Bureau, American Community Survey, 2018 5-year estimates.
Waterbury, 22%
Rest of New Haven County (excluding Waterbury), 19%
Watertown, 20%
Rest of Litchfield
County (excluding
Watertown), 16%
Hartford County, 9%
Fairfield County, 6%
All Other Locations, 8%

Page | 19
Figure 8: Commuting times and distances from the Oakville Site Source: Google Maps, 2020
Destination Distance (miles) Drive Time (minutes) Waterbury 3.5 8 New Haven 25.8 38
Hartford 34.0 36 Wallingford 27.4 31 Middletown 26.9 31
Shelton 21.9 24 Farmington 27.6 29 Stamford 55.2 55
Bridgeport 33.0 33 Danbury 31.1 35
From a location perspective, the Oakville Site is uniquely situated near the crossroads of multiple thoroughfares, resulting in notably higher traffic on the small section of Route 73 at the southern tip of the site (between Davis Street and Hillside Avenue) than on any of the connecting roads individually. That section of Route 73 sees an average of 15,000 vehicles per day, while areas farther east or west on Route 73 see 9,800 and 9,600 annual average daily traffic (AADT), respectively. Davis Street south of the site has an AADT of 7,900, while Buckingham Street east of the site has 6,100 vehicles per day, just north of the intersection with Hillside Avenue.

Page | 20
Figure 9: Annual average daily traffic (AADT) near the Oakville Site Source: Connecticut Department of Transportation, On the Map, 2017

Page | 21
Environmental Conditions and Zoning Environmental Conditions On December 1, 2011, the Connecticut Department of Environmental Protection (now DEEP) entered a “Declaration of Environmental Land Use Restriction and Grant of Easement” (2011 ELUR; Appendix A) with respect to the property owned by Sealy Mattress of Albany, Inc. at 25 Hillside Avenue in Watertown. This followed a prior ELUR entered on February 22, 2006 (Land Records Volume 1456, Page 155) (2006 ELUR; Appendix B). Both ELURs were filed with the Town land records and are currently in effect. They impose certain restrictions binding the current property owner and any successors, ELURs are allowed under the State of Connecticut Remediation Standard Regulations as a method of remediation. As allowed under these regulations, deed restrictions were recorded that prohibit the use of the Oakville site for residential purposes and restricting disturbance of certain areas.7 In a Final Approval letter from Jan Michael Czeczotka, Director of the Remediation Division of the Bureau of Water Protection and Land Reuse at DEEP, to Gary Ford, Vice President of Global Product Engineering at Sealy Mattress Company of Albany, dated May 13, 2020, DEEP approved the investigation and remediation reports submitted by the company.
According to the 2011 ELUR, the property consists of two parcels: Map 124, Block 180, Lot 1 (approximately 163,194 square feet); and Map 124, Block 180, Lot 1A (approximately 244,817 square feet); and contains two remediation areas, designated Subject Area A and Subject Area. Subject Area A is approximately 4,576 square feet located in the southwest portion of the property, entirely within Lot 1. Subject Area, approximately 15,469 square feet, straddles Lots 1 and 1A (see survey map; Appendix C).
7 As described on the DEEP website, “The purpose of an ELUR is to minimize the risk of human exposure to pollutants and hazards to the environment by preventing specific uses or activities at a property or a portion of a property. An ELUR is a tool that permits the remedial goals for a property to be dependent on the exposure risk associated with its use.” Because individuals may spend much more time at their residence over a longer period of time than they typically would at a commercial or industrial property, an individual’s potential exposure at a residential use is higher than industrial or commercial use, and therefore the regulations are more stringent. For contaminants in soil, state regulations establish “direct exposure criteria” to protect individuals from exposure to contaminants. DEEP indicates, “Polluted soil must be remediated to a concentration that is consistent with the Residential Direct Exposure Criteria, unless the site is used exclusively for industrial or commercial purposes. In such a case, the less stringent Industrial/Commercial Direct Exposure Criteria may be used, provided an Environmental Land Use Restriction is recorded to ensure that the site is not used for residential purposes in the future.” State of Connecticut Department of Energy and Environmental Protection, https://portal.ct.gov/DEEP/Remediation--Site-Clean-Up/Environmental-Use-Restrictions/Environmental-Land-Use-Restrictions and https://portal.ct.gov/DEEP/Remediation--Site-Clean-Up/Remediation-Standard-Regulations/Remediation-Standard-Regulations-Fact-Sheet. Accessed 8/18/20.

Page | 22
The 2006 ELUR restrictions prohibit residential activities on the entire site (see Appendix B). In addition, no disturbance of inaccessible soil can occur in the Subject Area (unless additional remediation is undertaken). The 2011 ELUR restrictions stipulate that no building can be constructed on Subject Area A (unless additional remediation is undertaken). No disturbance of any engineering controls can occur on the property, and an easement is granted so that DEEP may enter to inspect or remediate conditions. As noted above, these restrictions “run with the land” and bind any successor property owner.
According to DEEP, a property owner could get relief from the restrictions of either ELUR if the contamination was remediated or a vapor mitigation system were installed (in the case of Subject Area A). The owner would need to submit plans to DEEP for approval, and then demonstrate that it met DEEP requirements. The process for getting relief from the no residential use restriction is also possible, but would “be more difficult” (email from Sheila Gleason, DEEP to Rachel Gretencord, AdvanceCT dated July 2, 2020).
The specific requirements for any potential remediation which would allow for more flexibility in the future re-use of the Oakville Site is beyond the scope of this analysis. However, given that additional remediation would allow for more varied re-uses, the study team has included the market potential for such uses, with the understanding that a developer would need to consider the additional remediation as part of the planning process if the proposed redevelopment did not conform to existing deed restrictions.
Zoning The site is in the zoned Oakville Central Business District (map code B-C). Under the Watertown Zoning Regulations adopted on December 2, 2015, effective December 25, 2015, there are various uses permitted by Site Plan Approval and uses permitted by Special Permit and Site Plan Approval. Additionally, the site may be entitled to certain additional development rights in accordance with its prior historic use and historic building dimensions in accordance with Section 5 of Watertown Zoning Regulations. This section, providing for nonconforming uses, allows uses by Special Permit to be considered as conforming uses (Section 5.9).
Section 15.1 B-C indicates the district purpose is “to encourage the orderly development of a shopping area… and business uses…” Pursuant to Section 15.2, (1) all uses shall be within a building (except parking, loading and permitted signage); (2) principal uses permitted by site plan approval shall not exceed 7,500 square feet; and (3) principal uses permitted by special permit approval shall not exceed 20,000 square feet. Permitted uses include:
Uses Permitted in B-C District by Site Plan Approval (Section 15.3.1):
• retail • personal service businesses • dry cleaner/laundry

Page | 23
• sit down restaurants (no drive thru) • banks (no drive thru) • general, medical and professional offices above first level • indoor theaters or auditoriums • public or semi public uses • health or fitness clubs, gyms, racquet clubs above first level • printing/graphic arts occupying no more than 2,000 square feet • dance, photography, graphic design, printing or other artistic studios above first level
Uses Permitted in B-C District by Special Permit and Site Plan Approval (Section 15.3.2):
• all permitted site plan uses exceeding 7,500 square feet and up to 20,000 square feet • multi-family dwelling units not at street or first floor level • fast food restaurants (no drive thru) • telecommunications facilities • used auto sales and service within an enclosed building, with no outside storage or sales of
wrecked vehicles

Page | 24
Retail Analysis A retail sales analysis utilizes consumer expenditure data to determine whether an area is over- or under-served by different categories of retail establishments. A retail sales surplus, where retail sales are higher than what would be anticipated given the local population, indicates that the area is attracting a consumer base beyond residents. A surplus essentially represents a draw of individuals living outside the respective geography to the location because of an existing retail advantage. Developing complementary industries to those with a consumer surplus can be a good economic development strategy for a municipality.
On the other hand, a sales leakage means demand for goods and services is not being met locally and so residents are shopping for goods and services elsewhere. There can be a number of reasons for sales leakage; for example, it could mean that there is a very strong competitor in a nearby area. However, areas of sales leakage often represent retail industries where there is opportunity to capture consumer expenditure that is leaving the area and to capitalize on a mismatch of demand and supply.
Once retail opportunities are identified, an area can target retailers to determine if their site selection criteria match the demographics of the community and identify where those retailers could locate if there is a match. The following data provides a retail market profile for areas within a certain radius of the Oakville Site.
Given the changing nature of retail nationally due to online shopping, the suburban feel of Watertown, and the presence of larger shopping centers in accessible, larger communities such as Waterbury, the retail segments with the greatest potential for success in the Oakville Site area are likely smaller shops with goods and services that cater to the unique demographics of the population living in the immediate vicinity, retailers with a niche clientele, or those that capitalize on the particular scale and character of the Oakville neighborhood. The analysis below identifies retail opportunities as the market currently exists; development of additional housing or commercial space (such as office space) that would provide additional traffic to the immediate vicinity would increase the retail potential of any specific site.
Convenience Retail (1-mile trade area) The area within a one-mile radius of a shopping center is the domain of convenience retail. These are goods and services for which customers are not willing to travel very far. Shops such as convenience stores, pharmacies, small grocery, coffee shops, and the like tend to be smaller and rely on local traffic to support their enterprise.

Page | 25
Figure 10: Oakville Site; areas within a 1, 3, and 6-mile radius
The area within a one-mile radius of the Oakville Site encompasses a population of 11,024 or 4,223 households. The median disposable household income was $49,215 as of 2019, and per capita income was $29,235.8
As can be seen in Figure 23, within a one-mile radius of the Oakville Site area, the retail gap (amount of unmet demand) for most convenience-oriented segments is fairly small, and some segments have a retail surplus, meaning sales are higher than expected and shoppers from outside the immediate area are being attracted. Additionally, those retail segments that do have a larger gap (including clothing stores, department stores, and furniture stores) tend to be larger stores and have a much larger trade area and are not suited to convenience retail. Notably, however, restaurants and other eating places has a sizable gap, indicating that a small café or eatery may be a good fit for the site, particularly if paired with additional housing or commercial development that would help support such an establishment. While there is very little unmet demand in the convenience-oriented market, additional retail could be supported if shoppers are drawn from outside the immediate area. In addition, new development in the vicinity (such as office space or housing) that would attract additional shoppers to the immediate area
8 ESRI 2019 Retail MarketPlace Profile for 25 Hillside Ave, Watertown, CT.

Page | 26
could increase demand for convenience-oriented retail, which might allow additional establishments to be supported.
Figure 11: Oakville Site Retail Profile; 1-mile radius Source: ESRI, 2019
Surplus refers to sales higher than expected within the trade area (one-mile radius); meaning consumers are attracted from outside the immediate area. Gap means sales lower than expected, and consumers are making purchases outside of the trade area.
-$20 -$10 $0 $10
Restaurants/Other Eating Places
Gasoline Stations
Furniture Stores
Other Motor Vehicle Dealers
Electronic Shopping & Mail-Order Houses
Shoe Store
Direct Selling Establishments
Specialty Food Stores
Book, Periodical & Music Stores
Florists
Vending Machine Operators
Health & Personal Care Stores
Drinking Places - Alcoholic Beverages
Grocery Stores
Millions1 Mile Radius Retail Revenue Gap
Surplus Gap

Page | 27
Neighborhood Retail (3-mile trade area) This geography, encompassing a 3-mile trade area around the Oakville Site, includes a population of 53,184 comprising 20,063 households, with a median disposable household income of $47,425 and a per capita income of $30,609.9 Retail that typically has a trade area in this geographic range includes neighborhood shopping centers which might host, for example, a grocery store with some surrounding shops such as a café, bakery, bank, pharmacy, dry cleaner or laundromat, real estate offices, florists, personal care stores, and similar types of businesses.
Within 3 miles of the Oakville Site area, neighborhood retail such as personal care stores (-$16M) and grocery stores (-$24M) already have a surplus (meaning sales are higher than expected given the population), while industries such as florists and restaurants are more or less in balance. Retail segments with a sales gap that might represent a potential opportunity include:
• clothing stores ($21M) • building material, garden equipment, and supply stores ($14M) • sporting goods, hobby, and musical instrument stores ($13M) • jewelry, luggage, and leather goods ($7M) • home furnishing stores ($5M)
It should be noted, many of these segments may typically have a larger trade area than what neighborhood retail can accommodate. Attention should be paid to the size and scale of the retail shop and its intended clientele.
9 ESRI 2019 Retail MarketPlace Profile for 25 Hillside Ave, Watertown, CT.

Page | 28
Figure 12: Oakville Site Retail Profile; 3-mile radius Source: ESRI, 2019
Surplus refers to sales higher than expected within the trade area (three mile radius); meaning consumers are attracted from outside the immediate area. Gap means sales lower than expected, and consumers are making purchases outside of the trade area.
Surplus Gap
-$200 -$100 $0
Clothing StoresBldg Material, Garden Equip. & Supply…
Sporting Goods/Hobby/Musical Instr StoresFurniture Stores
Other Motor Vehicle DealersJewelry, Luggage & Leather Good Stores
Other Miscellaneous Store RetailersHome Furnishing Stores
Shoe StoreDirect Selling Establishments
Book, Periodical & Music StoresBeer, Wine & Liquor Stores
Used Merchandise StoresSpecial Food Services
Restaurants/Other Eating PlacesLawn & Garden Equip & Supply Stores
FloristsVending Machine Operators
Drinking Places - Alcoholic BeveragesOffice Supplies, Stationery & Gift Stores
Specialty Food StoresGasoline Stations
Auto Parts, Accessories & Tire StoresElectronic Shopping & Mail-Order HousesDepartment Stores Excluding Leased Dept.
Health & Personal Care StoresGrocery Stores
Automobile Dealers
Millions3 Mile Radius Retail Revenue Gap

Page | 29
Community Retail (6-mile trade area) The largest trade area examined (6 miles) encompasses a population of 153,122, or 58,360 households, with a 2019 median disposable household income of $43,099 and a per capita income of $28,751.10 Anchor retail that typically has a trade area in this “community retail” range includes larger grocery and drug stores, discount stores, and general merchandise, apparel, electronics, home goods, and sporting goods stores. These would be supported by several smaller stores including banks, bakeries, cafes, dry cleaners, specialty food markets, pharmacies, family restaurants, hardware or electronics stores, gift shops, home furnishings, ice cream, jewelry, or liquor stores.
In this larger trade area there are varying retail gaps in a number of categories. While a retail gap can sometimes represent an opportunity for large, well-anchored destination shopping, the trade area encompassed here includes Waterbury, which is may be more feasible for large scale retail. Furthermore, retail segments including automobile dealers (-$174M), department stores (-$114M), and grocery stores (-$111M) have a sizable surplus already, indicating customers are being attracted from outside the area. Additional retailers in Watertown (particularly in those categories where there are existing large retailers, such as grocery) would be unlikely to capture a large portion of the market. As such, many of these retail offerings would be unsuitable for Watertown.
Data suggest that there is potential opportunity for additional community retail in Watertown. Segments with a retail gap that could potentially be captured by a new entrant include:
• other motor vehicle stores ($23M) • furniture stores ($23M) • sporting goods, hobby, book and music stores ($15M) • jewelry, luggage & leather goods stores ($9M), • Building material, garden equipment and supply stores ($7M).
However, within these categories, consideration should still be given to whether there is enough of an anchor in the immediate vicinity to draw traffic to the area, and whether the site is suitable for larger-scale retail. Current zoning allows for retail footprints of up to 20,000 square feet, which would allow for more modestly-sized establishments. Many of these categories with a sales gap are the same as in the 3-mile “neighborhood retail” category; establishments with a niche market or that appeal to the nature and scale of Oakville’s character would be the best fit.
10 ESRI 2019 Retail MarketPlace Profile for 25 Hillside Ave, Watertown, CT.

Page | 30
Figure 13: Oakville Site Retail Profile; 6-mile radius Source: ESRI, 2019
Surplus refers to sales higher than expected within the trade area (six mile radius); meaning consumers are attracted from outside the immediate area. Gap means sales lower than expected, and consumers are making purchases outside of the trade area.
Surplus Gap
-$250 -$150 -$50 $50
Other Motor Vehicle DealersFurniture Stores
Sporting Goods/Hobby/Musical Instr StoresJewelry, Luggage & Leather Good Stores
Bldg Material, Garden Equip. & Supply…Shoe Store
Beer, Wine & Liquor StoresLawn & Garden Equip & Supply Stores
Direct Selling EstablishmentsBook, Periodical & Music Stores
Clothing StoresSpecial Food Services
FloristsAuto Parts, Accessories & Tire Stores
Other Miscellaneous Store RetailersDrinking Places - Alcoholic Beverages
Specialty Food StoresVending Machine Operators
Home Furnishing StoresRestaurants/Other Eating Places
Used Merchandise StoresOffice Supplies, Stationery & Gift Stores
Gasoline StationsElectronic Shopping & Mail-Order Houses
Health & Personal Care StoresGrocery Stores
Department Stores Excluding Leased Dept.Automobile Dealers
Millions6 Mile Radius Retail Revenue…

Page | 31
Summary Based on the current population and existing supply and demand in the local trade area, there is some limited opportunity for additional retail. Convenience-oriented restaurants or eating establishments may be needed, particularly if additional development on the site included residential, retail, or work spaces that increased activity in the immediate vicinity. Due to the proximity to Waterbury, there is little need for large-scale retail, though some smaller neighborhood stores could potentially be supported, particularly in the areas of: clothing; building material, garden equipment, and supplies; sporting goods, hobby, and musical instrument stores; jewelry, luggage, and leather goods; or home furnishings. Retail segments with the greatest potential for success in the Oakville Site area are likely smaller shops with goods and services that cater to the unique demographics of the population living in the immediate vicinity, retailers with a niche clientele, a unique product or service, or those that capitalize on the particular scale and character of the Oakville neighborhood.

Page | 32
Regional Industry Analysis An industry analysis can help a local government identify industries to target in economic development planning. Such an analysis uses a multi-stage data-driven process to identify industries (by three-digit NAICS code)11 that have large concentrations, strong national growth, higher regional wages than average, and/or create more additional jobs or earnings for each new job or dollar earned in that industry. The purpose of an industry analysis is to identify industries that have the greatest growth potential and whose growth will have the greatest impact within the region and, thus, which industries town officials may consider targeting as potential focuses for the Oakville Site.
Methodology
The first step in this industry analysis was to define the Watertown “region,” since this is the level at which economic activity takes place. For this analysis, the region was defined based on commuting data in Litchfield and New Haven Counties, since 64% of employed Watertown residents work in these two counties and 77% of workers in Watertown reside in one of the two counties.12
Once the region was identified, an industry analysis matrix was created to capture a comprehensive examination of the health of the economy from local and regional perspectives. The analysis centered on recent regional employment and wage growth, national employment growth, projected regional growth, employment concentration (location quotient), industry wages compared to the average state wage, and industry competitiveness. This process resulted in the identification of potential priority industries, but a majority of these were in the manufacturing and transportation space and as such were not suitable for the Oakville Site. However, through this process, four industries were identified as strong potential fits for the vacant site. Two additional industries will also be examined due to their potential as office and commercial space users.
Top Rated Industries
The complete industry analysis matrix in Appendix D provides an illustration of the highest scoring industries’ performance, but specific site constraints informed this recommendation. As such, the Town of Watertown should pay specific attention to the following industries while planning how to redevelop the Oakville Site:
11 The North American Industry Classification System (NAICS) is the standard used by Federal statistical agencies in classifying business establishments for the purpose of collecting, analyzing, and publishing statistical data related to the U.S. business economy.
12 Source: LEHD On the Map, U.S. Census Bureau. https://onthemap.ces.census.gov/

Page | 33
• NAICS 519 Other Information Services: Industries in this sector include establishments supplying information, storing and providing access to information, searching and retrieving information, operating Web sites that use search engines to allow for searching information on the Internet, or publishing and/or broadcasting content exclusively on the Internet. Example establishments in Watertown include Proconversions Corporation, Oakville Public Library, and New Life Computers.
• NAICS 533 Lessors of Nonfinancial Intangible Assets (except Copyrighted Works):
Industries in this sector include establishments that are primarily engaged in assigning rights to assets, such as patents, trademarks, brand names, and/or franchise agreements for which a royalty payment or licensing fee is paid to the asset holder. R & K Spero Inc. is an example establishment in the region.
• NAICS 518 Data Processing, Hosting, and Related Services: Industries in this sector
include establishments that provide the infrastructure for hosting and/or data processing services. Example establishments in the region include ADP, Fiserv, and Spot on Networks.
• NAICS 621 Ambulatory Health Care Services: Industries in this sector provide health
care services directly or indirectly to ambulatory patients and do not usually provide inpatient services. Health practitioners in this subsector provide outpatient services, with the facilities and equipment not usually being the most significant part of the production process. Example establishments in the region include Restoring Your Wellness, Rise up Behavioral Health Service, and Neck & Back Pain Specialist.
The defining features of these four industries are that they met four of the seven criteria in the industry analysis, employment is projected to grow significantly over the next five years13, and would be in accordance with zoning requirements on the Oakville Site. What’s more, each industry has seen their local wage growth exceed the average local wage growth since 2014 and each average annual industry wage is greater than the state annual average of $66,25014. Additionally, employment in each selected industry is projected to significantly grow in the region. Specifically, each industry is projected to grow at least 12% from 2019 to 2024, with Other Information Services projected to grow up to 20% in the region, the highest percentage of all the recommended industries.3
Additional Industries to Consider
Since the Oakville site is in an area designated by zoning as a business district, the two following industries may also be a good fit considering their service orientation:
13 Source: Emsi projections, 2024, calculations by Advance CT
14 Source: Emsi, calculations by Advance CT

Page | 34
• NAICS 561 Administrative with Support Services: Industries in this sector include establishments engaged in activities that support the day-to-day operations of other organizations. Example establishments in Watertown include Eagle Eye Security, Plant & Flower Depot LLC, and Access Appraisal LLC.
• NAICS 722 Food Services and Drinking Places: Industries in this sector prepare meals,
snacks, and beverages to customer order for immediate on-premises and off-premises consumption. Example establishments in Watertown include Burger King, Krispy Krunchy Chicken, and Roscello's Deli.
These industries inclusion on the site could result in retail-type storefronts that could provide the site a village-center feel as desired by the town as businesses in these industries, such as restaurants, cafes, and business support services, often provide amenities for office or commercial space users and nearby businesses. Additionally, while these industries did not score particularly well in all sections of the industry analysis matrix, employment in both industries is projected to grow significantly over the next five years. In fact, each industry is projected to add over 1700 jobs, making them two of the top five largest projected growing industries in the region.4
Additional Considerations
Since these results are regional, Watertown will still need to determine whether these industries fit into the local landscape and the Oakville Site. For example, many industries related to manufacturing and transportation scored very highly in the analysis, but they were not included as target sectors due to feasibility constraints at the Oakville Site. Additionally, the Town may wish to examine which industry sub-categories are appropriate for the Oakville Site, as well as the scale of such operations, the level of external impacts that are acceptable, and other considerations.

Page | 35
Regional Economic Trends To understand what development might suit the Oakville Site and Watertown generally, it is helpful to understand the existing regional economic trends.
In Watertown the largest portion of employment is in the sector of Educational Services, Healthcare, and Social Assistance, at 32%, followed by Manufacturing, at 15% of the workforce. Employment in the Education, Healthcare and Social Assistance sector is more concentrated in Watertown than in Litchfield County, New Haven County, or the state, the latter three geographies having 26%, 31%, and 26% of employment in that sector, respectively. Similarly, Watertown has a notably higher portion of employment in Manufacturing at 15%, compared to 13% in Litchfield County and 11% both in New Haven County and statewide. While the portion of employment in retail is similar in Watertown as compared to New Haven County and the state, it is lower than in Litchfield County. The remainder of the sectors have similar or lower employment in Watertown as compared to the surrounding counties and the state. Thus, Watertown has a higher relative concentration of employment in both the Educational Services, Healthcare, and Social Assistance sector and the Manufacturing sector, as compared to the surrounding counties and the state.
Figure 14: Employment by Industry Source: US Census, American Community Survey Five-Year Estimates, 2014-2018
0%
5%
10%
15%
20%
25%
30%
35%
Educationalservices, and
health care andsocial assistance
Manufacturing Retail trade Finance andinsurance, andreal estate and
rental andleasing
Arts,entertainment,and recreation,
andaccommodation
and foodservices
Professional,scientific, andmanagement,
andadministrative
and wastemanagement
services
Other services,except public
administration
Connecticut Litchfield County, Connecticut New Haven County, Connecticut Watertown

Page | 36
Annual wages for different sectors vary widely in Watertown. The highest-paid employees include those in Construction and in Wholesale Trade, with average salaries over $90,000 per year. The lowest-paid industries include Accommodation and Food Services and Arts, Entertainment and Recreation, both sectors with average salaries below $20,000 per year.
Figure 15: Average Annual Wage by Industry15, Watertown (town) Source: U.S. Bureau of Labor Statistics: Quarterly Census of Employment and Wages (QCEW), 2018
Over the last 5 years, Watertown’s unemployment rate has been consistently lower than the rate in the state of Connecticut and, after 2015, lower than in the United States as a whole. Unemployment in all three geographies has trended downward over the same time frame. Watertown’s 2019 average annual unemployment rate was 3.4%, lower than both Connecticut and the US, each at 3.7%.
15 Figures for Agriculture, Forestry, Fishing & Hunting; Utilities; Transportation & Warehousing; Information; Management of Companies & Enterprises; and Unclassified Establishment sectors were unavailable.
$19,054
$19,242
$23,581
$33,420
$37,589
$37,663
$38,880
$50,056
$52,057
$64,724
$65,629
$68,734
$90,304
$98,013
$0 $20,000 $40,000 $60,000 $80,000$100,000$120,000
Accommodation & Food Services
Arts, Entertainment, & Recreation
Other Services (except Public Administration)
Admin. & Support & Waste Mgmt. & Remed.…
Retail Trade
Health Care & Social Assistance
Real Estate and Rental & Leasing
Total - All Industries
Educational Services
Finance & Insurance
Manufacturing
Professional, Scientific, & Technical Services
Wholesale Trade
Construction

Page | 37
Figure 16: Average Annual Unemployment Rate Source: Local Area Unemployment Statistics (LAUS), 2015-2019
Consistent with the decreasing unemployment, the number of business establishments in the Watertown region (New Haven and Litchfield counties) has increased over the last 5 years, from 27,885 in 2014 to 29,885 in 2018.
3.0%
3.5%
4.0%
4.5%
5.0%
5.5%
6.0%
2015 2016 2017 2018 2019
US Connecticut Watertown

Page | 38
Figure 17: Number of Business Establishments in Litchfield and New Haven Counties Source: U.S. Bureau of Labor Statistics: Quarterly Census of Employment and Wages (QCEW), 2014-2018
Although the number of businesses has steadily increased, the average annual employment in Watertown has grown at a slower pace. Regional business establishment growth remained strong throughout the five years ending 2018, reaching its peak of 2.6% in that final year. However, annual employment growth for the town reached its 5-year peak in 2018 at 1.5% and then went down to 0.2% in 2019.
26,500
27,000
27,500
28,000
28,500
29,000
29,500
30,000
30,500
2014 2015 2016 2017 2018

Page | 39
Figure 18: Average Annual Employment, Watertown (town) Source: Local Area Unemployment Statistics (LAUS), 2015-2019
Local and regional real estate trends have been reported through interviews with real estate brokers in the area. In recent months, the majority of commercial real estate activity has focused on industrial and warehouse properties, consistent with the industry analysis findings of regional growth in manufacturing and transportation/distribution-related industries. Overall, office and retail leasing has been relatively slow. It was noted, however, that a former K-mart property in Watertown has been subdivided into smaller spaces and re-leased, and that the town does not currently have large notable commercial vacancies.16
Furthermore, the real estate industry has been heavily impacted by COVID-19. Data collection for this report occurred prior to the pandemic, and more recent data is not yet available. Furthermore, it may be too early to predict the long-term economic impacts of this event, and some of the outcomes may depend on the length and severity of the pandemic, federal government decisions, and other factors which are still unknown. In the short term, the impact has been to delay many business decisions, and there is evidence that remote work and other pandemic-related adjustments may last for several
16 A Loopnet search on 7/22/20 listed 11 office and retail properties with space available for lease, with only 4 having more than 4,500 square feet of contiguous space available, and one with more than 10,000 square feet (although it appeared to be subdivided into smaller units).
12,150
12,200
12,250
12,300
12,350
12,400
12,450
12,500
12,550
12,600
12,650
2015 2016 2017 2018 2019

Page | 40
months, at least.17 How these shifts will impact the long-term demand for real estate is yet to be determined, but it may have a dampening effect on the demand for office and retail space, at least in the short term. Conversely, there is some evidence of the demand for space to potentially increase in suburban areas away from dense city centers where it is difficult for employees to socially distance. This trend has been seen at least anecdotally; but how widespread or long-lasting it becomes, and the net impact of these contrasting influences is yet to be determined.
17 AdvanceCT Business Survey, April 2020 (63% of businesses who responded had postponed investment decisions as a result of COVID-19); Berliner, Uri, “Get a Comfortable Chair: Permanent Work from Home is Coming,” NPR, June 22, 2020; https://www.npr.org/2020/06/22/870029658/get-a-comfortable-chair-permanent-work-from-home-is-coming; Thomas, Lauren, “After flocking downtown to woo millennials, offices may be moving back to the suburbs,” CNBC, 5/31/2020; https://www.cnbc.com/2020/05/31/after-flocking-downtown-to-woo-millennials-offices-might-move-back-to-the-burbs.html.

Page | 41
Opportunities The data in this report and the companion Watertown Housing Analysis point to a number of opportunities that Watertown should consider for the Oakville Site. While all have significant limitations, certain of these uses have considerable potential. Successful redevelopment of the site will take planning and vision from a capable development team.
Housing
While shifts in the existing population indicate the number of housing units needed may decline slightly over the next several years, Watertown has a relative lack of smaller (0-2 bedroom) units and rental housing available, which may be constraining its growth. Providing more diverse housing options can open up the opportunity for young people and new workers moving to the region to rent in the community, creating a pipeline of potential home purchasers and new residents. Similarly, this can provide a way for retirees and empty nesters who may wish to downsize or move to a more low-maintenance lifestyle to remain in the community. Furthermore, housing on the Oakville Site can help provide the density needed to support additional businesses in the area. Careful planning and investigation would be required, however, as the site is not currently approved for residential use. Additional environmental remediation would be required by the developer, the scope and cost of which is currently unknown.
Retail
While there appears to be little need for additional large-scale retail, certain sectors show some potential, including smaller neighborhood clothing; building material, garden equipment, and supplies; sporting goods, hobby, and musical instrument stores; jewelry, luggage, and leather goods; or home furnishings stores. Retail segments with the greatest potential for success are likely smaller shops with goods and services that cater to the unique demographics of the population living in the immediate vicinity, retailers with a niche clientele, a unique product or service, or those that capitalize on the particular scale and character of the Oakville neighborhood. It should be noted that retail generally is in transition, and the growth in online shopping and other factors have made this a tough segment. Regionally, retail leasing has been very slow in recent months, and developments that have been successful incorporate an entertainment factor or other unique elements to draw people to the area. Combining retail with other commercial or housing use could help provide support for any new businesses that locate here.
Office/Commercial
Similar to retail, office leasing generally has been slow in the region. Growing industries that have the greatest need for space have been industrial and warehouse users. However, there are certain industries growing regionally that could be users of office or commercial space and would provide potential

Page | 42
tenants for a new development. These include information services, data processing and hosting, ambulatory healthcare, administrative and support services, and eating and drinking places. Particularly in the office/commercial sector, the long-term impacts of COVID-19 are unknown. The growth of work-from-home arrangements could significantly decrease the demand for office space long-term, while the desire for companies to relocate to less-dense suburban locations could open up new opportunities.
Site-Specific Opportunities
In any redevelopment, the unique characteristics of the site and the surrounding area should be considered. For the Oakville Site, the location adjacent to the Oakville Town Green and Pinshop Pond represent an opportunity to capitalize on existing outdoor space to create a distinctive amenity. Other creative ideas, such as considering allowing for maker spaces connected to storefront uses may also create a unique draw. Several of the retail categories with a “gap,” including hobby stores, jewelry and leather goods, and home furnishings may lend themselves to adding an experiential component.
In addition, the industry analysis of the Watertown region highlighted types of businesses that could be successful in Watertown and on the Oakville Site. Examples include ambulatory healthcare, data processing and hosting, administrative/support services, and eating and drinking establishments, which may be permitted in the Oakville Site zoning District B-C under the general, medical and professional offices; telecommunications facilities; and sit down restaurants categories, for example.

Page | 43
Appendix A: 2011 ELUR

Page | 44
Appendix B: 2006 ELUR

Page | 45
Appendix C: Oakville Site Survey Map

Page | 46
Appendix D: Industry Analysis Results
NA
ICS
Des
crip
tion
LQ
>1.
1 (2
019
)
Em
plo
ymen
t G
row
th >
U.S
A
vg.
Wag
e G
row
th >
Avg
. Loc
al
Wag
e G
row
th
Gai
nin
g C
omp
etit
ive
Sh
are
Rec
ent
U.S
. In
d. G
row
th >
U
.S. A
vg.
U.S
. Sh
are
Incr
ease
20
09
-20
17
Ind
ust
ry W
age
> S
tate
Avg
.
SU
M
331 Primary Metal Manufacturing 1 1 1 1 0 1 1 6
518 Data Processing, Hosting, and Related Services 0 1 1 1 1 1 1 6
533 Lessors of Nonfinancial Intangible Assets (except Copyrighted Works)
1 1 1 1 0 1 1 6
712 Museums, Historical Sites, and Similar Institutions 1 1 1 1 1 1 0 6
812 Personal and Laundry Services 1 1 1 1 1 1 0 6
212 Mining (except Oil and Gas) 0 1 1 1 0 1 1 5
311 Food Manufacturing 0 1 1 1 1 1 0 5
482 Rail Transportation 1 1 0 1 0 1 1 5
483 Water Transportation 1 1 0 1 0 1 1 5
484 Truck Transportation 0 1 1 1 0 1 1 5
519 Other Information Services 0 1 1 1 1 0 1 5
611 Educational Services 1 1 0 1 1 0 1 5
814 Private Households 1 1 1 1 0 1 0 5
901 Federal Government 0 1 1 1 0 1 1 5
999 Unclassified Industry 0 1 1 1 0 1 1 5
112 Animal Production and Aquaculture 0 1 1 1 0 1 0 4
113 Forestry and Logging 0 1 1 1 0 1 0 4
114 Fishing, Hunting and Trapping 0 1 0 1 0 1 1 4
312 Beverage and Tobacco Product Manufacturing 0 1 0 1 1 1 0 4
313 Textile Mills 0 1 1 1 0 1 0 4
322 Paper Manufacturing 0 1 1 1 0 0 1 4
323 Printing and Related Support Activities 1 1 0 1 0 1 0 4
324 Petroleum and Coal Products Manufacturing 0 1 0 1 0 1 1 4
325 Chemical Manufacturing 0 1 1 1 0 0 1 4
425 Wholesale Electronic Markets and Agents and Brokers 0 1 1 1 0 0 1 4
486 Pipeline Transportation 0 1 0 1 1 0 1 4

Page | 47
512 Motion Picture and Sound Recording Industries 0 1 0 1 1 1 0 4
515 Broadcasting (except Internet) 0 1 0 1 0 1 1 4
532 Rental and Leasing Services 0 0 1 0 1 1 1 4
562 Waste Management and Remediation Services 1 0 1 0 1 0 1 4
621 Ambulatory Health Care Services 1 0 1 0 1 0 1 4
111 Crop Production 0 1 1 1 0 0 0 3
236 Construction of Buildings 0 0 1 0 1 0 1 3
237 Heavy and Civil Engineering Construction 0 0 1 0 1 0 1 3
238 Specialty Trade Contractors 0 0 1 0 1 0 1 3
314 Textile Product Mills 1 1 0 1 0 0 0 3
315 Apparel Manufacturing 0 1 0 1 0 1 0 3
316 Leather and Allied Product Manufacturing 0 1 0 1 0 1 0 3
326 Plastics and Rubber Products Manufacturing 0 0 1 0 1 0 1 3
327 Nonmetallic Mineral Product Manufacturing 0 0 1 0 1 0 1 3
332 Fabricated Metal Product Manufacturing 1 0 1 0 0 0 1 3
334 Computer and Electronic Product Manufacturing 1 0 1 0 0 0 1 3
335 Electrical Equipment, Appliance, and Component Manufacturing
1 0 1 0 0 0 1 3
336 Transportation Equipment Manufacturing 0 0 0 0 1 1 1 3
339 Miscellaneous Manufacturing 1 0 1 0 0 0 1 3
423 Merchant Wholesalers, Durable Goods 0 0 1 0 1 0 1 3
447 Gasoline Stations 0 1 1 1 0 0 0 3
481 Air Transportation 0 0 1 0 1 0 1 3
485 Transit and Ground Passenger Transportation 1 0 1 0 1 0 0 3
487 Scenic and Sightseeing Transportation 0 1 0 0 1 1 0 3
488 Support Activities for Transportation 0 0 1 0 1 0 1 3
493 Warehousing and Storage 0 1 0 1 1 0 0 3
523 Securities, Commodity Contracts, and Other Financial Investments and Related Activities
0 0 1 0 1 0 1 3
524 Insurance Carriers and Related Activities 0 0 1 0 1 0 1 3
561 Administrative and Support Services 0 1 1 1 0 0 0 3
813 Religious, Grantmaking, Civic, Professional, and Similar Organizations
0 1 1 1 0 0 0 3
115 Support Activities for Agriculture and Forestry 0 0 1 0 1 0 0 2
221 Utilities 0 0 1 0 0 0 1 2
424 Merchant Wholesalers, Nondurable Goods 0 0 1 0 0 0 1 2
441 Motor Vehicle and Parts Dealers 0 0 1 0 1 0 0 2
444 Building Material and Garden Equipment and Supplies Dealers
1 0 1 0 0 0 0 2
446 Health and Personal Care Stores 1 0 1 0 0 0 0 2
452 General Merchandise Stores 0 1 0 1 0 0 0 2

Page | 48
453 Miscellaneous Store Retailers 0 1 0 1 0 0 0 2
454 Nonstore Retailers 1 0 0 0 1 0 0 2
491 Postal Service 0 1 0 0 1 0 0 2
492 Couriers and Messengers 0 0 1 0 1 0 0 2
511 Publishing Industries (except Internet) 0 0 1 0 0 0 1 2
517 Telecommunications 0 0 1 0 0 0 1 2
522 Credit Intermediation and Related Activities 0 0 1 0 0 0 1 2
525 Funds, Trusts, and Other Financial Vehicles 0 1 0 0 1 0 0 2
531 Real Estate 0 0 1 0 1 0 0 2
541 Professional, Scientific, and Technical Services 0 0 0 0 1 0 1 2
551 Management of Companies and Enterprises 0 0 0 0 1 0 1 2
622 Hospitals 1 0 0 0 0 0 1 2
624 Social Assistance 1 0 0 0 1 0 0 2
713 Amusement, Gambling, and Recreation Industries 0 0 1 0 1 0 0 2
721 Accommodation 0 0 1 0 1 0 0 2
722 Food Services and Drinking Places 0 0 1 0 1 0 0 2
903 Local Government 0 0 1 0 0 0 1 2
211 Oil and Gas Extraction 0 1 0 0 0 0 0 1
213 Support Activities for Mining 0 1 0 0 0 0 0 1
321 Wood Product Manufacturing 0 0 0 0 1 0 0 1
333 Machinery Manufacturing 0 0 0 0 0 0 1 1
337 Furniture and Related Product Manufacturing 0 0 1 0 0 0 0 1
442 Furniture and Home Furnishings Stores 0 0 1 0 0 0 0 1
443 Electronics and Appliance Stores 0 0 1 0 0 0 0 1
445 Food and Beverage Stores 1 0 0 0 0 0 0 1
451 Sporting Goods, Hobby, Musical Instrument, and Book Stores
0 0 1 0 0 0 0 1
521 Monetary Authorities-Central Bank 0 0 0 0 1 0 0 1
623 Nursing and Residential Care Facilities 1 0 0 0 0 0 0 1
711 Performing Arts, Spectator Sports, and Related Industries 0 0 0 0 1 0 0 1
811 Repair and Maintenance 0 0 1 0 0 0 0 1
902 State Government 0 0 0 0 0 0 1 1
448 Clothing and Clothing Accessories Stores 0 0 0 0 0 0 0 0


