nuisance aquatic species - savage river state forest
TRANSCRIPT
M. Vuolo, R. Bonifetto, S. Dulla, K. Heinola, I. Lengar, P. Ravetto,L. Savoldi Richard, R. Villari, A. Widdowson, R. Zanino
and JET EFDA contributors
EFDA–JET–CP(13)05/09
Evaluation of the Neutron Activation of JET In-vessel Components
Following DT Irradiation
Evaluation of the Neutron Activation of JET In-vessel Components
Following DT Irradiation
M. Vuolo1, R. Bonifetto1, S. Dulla1, K. Heinola2,3, I. Lengar4, P. Ravetto1,L. Savoldi Richard1, R. Villari5, A. Widdowson2, R. Zanino1
and JET EFDA contributors*
1Dipartimento Energia, Politecnico di Torino, I-10129 Torino, Italy2EURATOM-CCFE Fusion Association, Culham Science Centre, OX14 3DB, Abingdon, OXON, UK
3Association EURATOM-TEKES, University of Helsinki, PO Box 64, 00560 Helsinki, Finland4Association EURATOM-MESCS, Reactor physics division, Jožef Stefan Institute, Ljubljana, Slovenia
5Associazione EURATOM-ENEA sulla Fusione, Via Enrico Fermi 45, 00044 Frascati, Rome, Italy* See annex of F. Romanelli et al, “Overview of JET Results”,
(24th IAEA Fusion Energy Conference, San Diego, USA (2012)).
Preprint of Paper to be submitted for publication in Proceedings of the 11th International Symposium on Fusion Nuclear Technology, Barcelona, Spain
16th September 2013 - 20th September 2013
JET-EFDA, Culham Science Centre, OX14 3DB, Abingdon, UK

“This document is intended for publication in the open literature. It is made available on the understanding that it may not be further circulated and extracts or references may not be published prior to publication of the original when applicable, or without the consent of the Publications Officer, EFDA, Culham Science Centre, Abingdon, Oxon, OX14 3DB, UK.”
“Enquiries about Copyright and reproduction should be addressed to the Publications Officer, EFDA, Culham Science Centre, Abingdon, Oxon, OX14 3DB, UK.”
The contents of this preprint and all other JET EFDA Preprints and Conference Papers are available to view online free at www.iop.org/Jet. This site has full search facilities and e-mail alert options. The diagrams contained within the PDFs on this site are hyperlinked from the year 1996 onwards.

.

1
AbstrActThe forthcoming Deuterium-Tritium (DT) campaign at the Joint European Torus (JET) will induce a significant activation of the system components. In the present work we evaluate the temporal evolution of the radioactive species in the main in-vessel components after the end of the future DT campaign, assuming different levels of neutron irradiation. The neutron flux in the selected components is calculated by the MCNP5 code using the emission source by a typical DT plasma. The resulting neutron spectra are then input to the FISPACT code that computes the evolution of the radioactive species generated by the neutron activation process. For each irradiation scenario, the time behavior of the contact dose rate is determined.
1. IntroductIonA novel Deuterium-Tritium (DT) experimental campaign is in preparation at the Joint European Torus (JET) fusion facility for 2017 [1]. During the experiment, the in-vessel components will be exposed to an intense high-energy neutron flux and the neutron transmutation will thus generate a non-negligible activation of the machine components. The activation will inhibit the manual operations performed with the components, such as repair, replacement and scientific analysis. The induced radioactivity and the decay after shutdown of the components depend on the material composition (including impurities), position and irradiation conditions. Still today the JET components exhibit residual activation due to the past DT campaigns of the ‘90s. The scope of the present work is to evaluate the time evolution of the activation of the main in-vessel components at the end of the forthcoming DT campaign, based on the available data for the material composition of the analyzed components and to finally assess the minimum time limitation for launching the manual operations. Furthermore this activity is preparatory to more detailed analyses that will provide comparisons with the actual experimental data after the DT campaign. To carry out the activation analysis it is necessary to calculate the neutron flux spectra in the selected components. This calculation is performed by the Monte Carlo MCNP5 code [2]. The neutron spectra are then used as input for the FISPACT 2010 activation code [3]. Different possible irradiation scenarios are considered in our investigation. In particular, two different performance campaigns are studied. In this work some typical materials compositions of JET in-vessel components with main impurities are analyzed and more detailed analyses are progressing. The computed contact dose rates and specific activities for important nuclides may constitute the basis for the definition of the waste management strategy of the main activated in-vessel components following the DT experiment.
2. JEt confIgurAtIon AdoptEd for thE AnAlysIsThe JET design allows the machine to follow the advancements in fusion research. Recently, the JET inner wall was modified to adopt the same material combination as in ITER, with Be on the main chamber and W in the divertor (ITER-like wall). The activation of this wall components due to DT operation is assessed in the present work. After the DT campaign a dedicated shutdown will
2
take place during which samples of the plasma-facing components will be taken off for examination and for scientific analyses. It is therefore important to understand the activation level in order to define the handling strategy during the post-DT operations. The components of interest comprise of parts in the main chamber (dump plates, inner wall guard limiters, outer poloidal limiters) and the divertor (wedge) (see Fig.1). All these components consist of a protective tile made out of Be or W, of a carrier on which the tile is attached to and of mounting components. In the present work, only the carriers and the mounting components are being examined in the calculations. The Be and W tiles will be activated during DT, but their activation level is considered to be negligible compared to the highly activating materials used in the carriers and mounting components. The localization of the components analyzed in the present work is shown in Fig.1. The corresponding material composition assumed for the calculations is preliminary and reported in Table 1. The materials listed are standard materials and their compositions are reported in Table 2.
3. nEutron flux cAlculAtIonFollowing the procedure already adopted in [7], the neutron flux calculations have been performed using the Monte Carlo code MCNP5 with ENDF/B-VII nuclear data library. The neutron flux in the components of interest are calculated following the neutron emission in a typical DT plasma discharge using a three-dimensional model of the JET machine, upgraded with ITER-like wall on the basis of the original model for horizontal neutron camera calculations [8]. The Monte Carlo approach allows a detailed treatment of the geometrical configuration and the neutron flux is calculated in cells made of homogeneous materials. The calculated neutron spectra have been used as input for the FISPACT 2010 activation code [3]. The neutron flux has been evaluated in the four components identified in Table 1, with volume tallies on the component bulk. The calculated neutron spectra are shown in Fig.2. As it can be seen, the spectrum (values are normalized to single source neutron) is peaked at 14MeV energy of source neutrons. The energy structure adopted is the VITAMIN-J 175 energy groups format [3], as requested for the FISPACT input.
4. ActIvAtIon cAlculAtIonsIn order to evaluate the dose rates for materials, calculations have been performed using the 2010 version of the FISPACT code [3] and EAF-2010 data library [9]. Two different possible DT irradiation scenarios are studied in the present work (see Fig.3):
• Scenario I: 1.7×10²¹ neutrons (n) emitted in 17 weeks, corresponding to an average irradiation of 2×10¹⁹ n/day;
• Scenario II: 1.7×10²¹ n emitted in 17 weeks, with an irradiation varying as follows:a. 1/6 of the neutron budget in the first 6 weeks (8.44×10¹⁸ n/day);b. 1/3 of the neutron budget in the second 5 weeks (2.27×10¹⁹ n/day);c. 1/2 of the neutron budget in the last 6 weeks (high performance irradiation of 2.83×10¹⁹
n/days).Both first and second scenarios assume a total neutron yield of 1.7x10²¹ n (current option for
3
DT campaign), but scenario II has higher flux in the last period of operations. A fixed budget has been considered as we can expect that at long times after irradiation (> 0.5y) the dose rates would approximately scale with the total neutron yield.
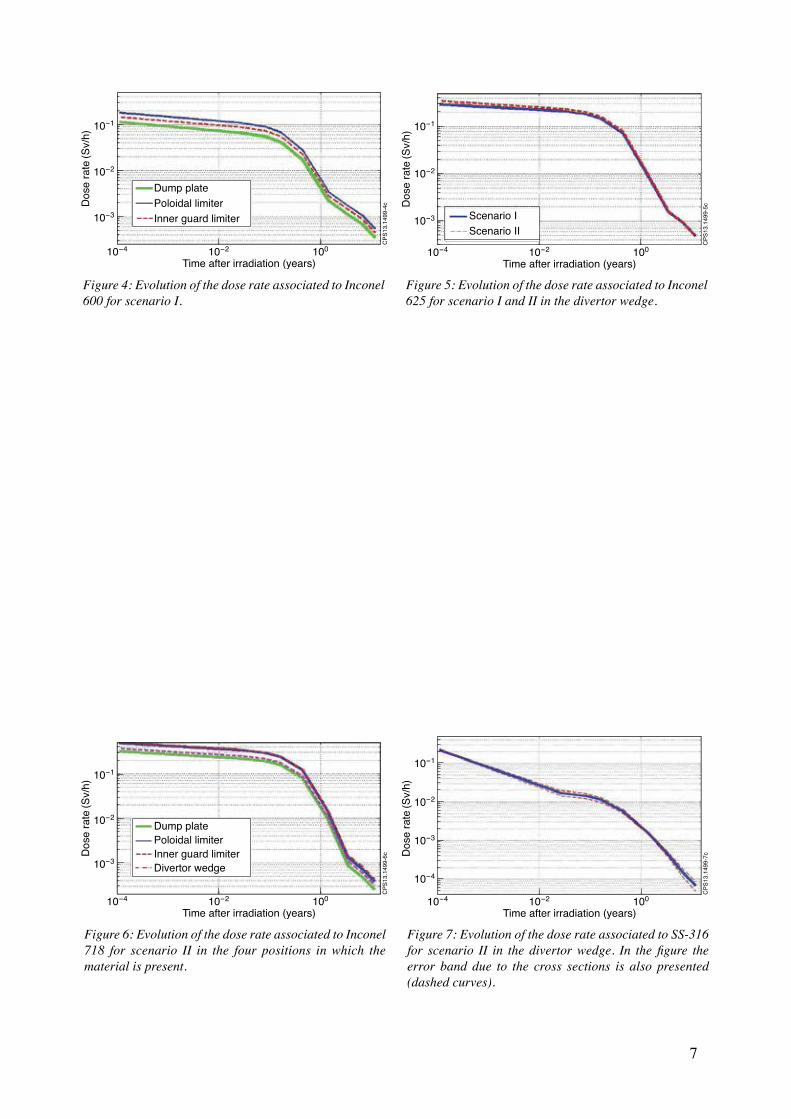
5. rEsults5.1 Evaluation of contact dosE ratEFor each of the two scenarios specified in the previous section we analyzed 22 materials in the four positions chosen in Section 2, see Fig. 1. In the present paper the results for the main materials are presented to give a general picture of the time behavior of the contact dose following the irradiation. The activation is calculated in the materials of each subcomponent using the chemical compositions in table II. Figure 4 shows the evolution of the dose rate associated to Inconel 600 for scenario I in all the positions in which the material is present. Comparing the results at the end of scenario I with scenario II, the differences are observed only at short cooling times. At shut-down the nominal difference is 55.04mSv/h (15.7% of total). One year after shut-down approximately the same results are obtained with both scenarios, as shown in Fig.5. Inconel 718 is present in each of the four position studied and the evolution of the dose rate for scenario II are reported in Fig.6. Higher dose rate are observed in the poloidal limiter and the divertor wedge. Since the FISPACT code allows evaluating the uncertainties associated with the adopted cross section database EAF-2010 [9], Figure 7 contains a thick line bracketed by two thinner evolutions, indicating the error bar related to the cross sections uncertainty. Similar graphs can be obtained for all the materials in the chosen components. Figure 8 presents the dose rates values for different classes of materials from Table 1, evaluated for scenario I in each of the four positions analyzed. Inconel 718 shows the higher activation because of the higher Ta content (3.125%wt). At the shut-down Ta-182 brings a contribute of 55.84% on the total contact dose rate (429.51mSv/h). Inconel 625 contains initial Ta content of 1.65%. At the shut-down it shows a total dose rate of 295.33 mSv/h and the 42.94% is due to Ta-182. Inconel 600 shows the lowest dose rate (195.31 mSv/h) as it does not contain Ta in the initial composition. At very short cooling times the dose rate is dominated by Ta-182, Mn-56, Co-58 and Ni-57, while at medium cooling times the dominant nuclides are the isotopes of cobalt: Co-58 and Co-60. One year after shutdown the contact dose rate for these compositions is generally lower than 20 mSv/h for all materials. It can be noted that the compositions for Inconel and Steel, assumed in this paragraph, do not contain trace impurities such as cobalt. The cobalt content is very important for the medium-cooling time activation.
5.2 impact of co contEnt on carriEr contact dosE ratEThe dose rates presented in the previous paragraphs are obtained assuming the initial chemical compositions without considering trace impurities such as Cobalt. The goal of this section is to

4
provide a parametric analysis of the cobalt content on the carrier dose rate in order to forecast the activation of materials in presence of these impurities. The chemical analysis on JET materials of the vacuum vessel and bellows gives a cobalt content for Inconel 600 and Inconel 625 of 0.05wt% and 0.09 wt% respectively [10], while for the carriers this amount is unknown. The analysis is performed considering different initial content of Co (%wt) and the material studied are Inconel 600 and Inconel 625 in scenarios I and II. Figure 9 shows the results obtained for Inconel 600 in scenario II. The three curves are related respectively to 0%, 0.05% and 0.2% of Co. Figure 10 instead shows the results for Inconel 625 in scenario II. The three curves are related respectively to 0%, 0.09% and 0.2% of Co.The presence of 0.2% of Co causes an increase of +28% of the dose rate after 1.4 year, while at 14 year the Co contribution amounts to +55.8%. The results shown in Figures 9-10 underline that the activation due to Co content becomes important after a medium-cooling time activation (after 1 year), because of the production of Co-60 (half-life 5.27 years) from Co-59 (n,gamma) Co-60 reaction.
6. conclusIons And pErspEctIvEsThe evolution of the dose rates of the main in-vessel components at the end of the forthcoming DT experimental campaign in JET has been predicted using the MCNP5 and FISPACT codes, assuming in input the materials composition specified by the provider including only the main impurities. The analysis shows that at one and ten years after shutdown the contact dose rates are generally lower than 20 mSv/h and 1 mSv/h, respectively, for all the examined materials. At short cooling times the dominant contributors are Ta-182, Mn-56, Co-58 and Ni-57. At medium cooling times, the impact of Cobalt impurities on Inconel activation is such that this impurity is important. In perspective, further analyses will be performed with more accurate chemical materials compositions, including also trace impurities. The final results could then be validated against experimental data, when they will be collected and made available.
rEfErEncEs[1]. P. Batistoni, J. Likonen, N. Bekris, S. Brezinsek, P. Coad et al., The JET technology program
in support of ITER, this Symposyum.[2]. MCNP – A general Monte Carlo n-particle transport code, Version 5, LA-UR-03-1987, Los
Alamos National Laboratory, Los Alamos (2003, revised 2005).[3]. J.-C. C. Sublet, J.W. Eastwood, J.G. Morgan, The FISPACT user manual, CCFE-R(11) Issue
3, Culham Science Centre (2012).[4]. www.specialmetals.com, accessed August 28, 2013.[5]. www.nealloys.com, accessed August 28, 2013.[6]. www.aksteel.com, accessed August 28, 2013.[7]. M.J. Loughlin, R.A. Forrest, J.E.G. Edwards, Neutron Activation Studies on JET, EFDA–
JET–CP(00)01/12, Culham (2012).[8]. Lengar, I., Verification of the JET MCNP Model and Transport Calculations, Estimation of
5
Wall Activation, JW10-FT-5.34. Reports to EFDA-ITER Fusion Technology Programme (2010).
[9]. J.-Ch. Sublet, L.W. Packer, J. Kopecky, R.A. Forrest, A. J. Koning, D.A. Rochman, The European activation file: EAF-2010 neutron-induced cross section library, EASY Documentation Series, CCFE-R(10)05, Culham (2010).
[10]. J.Ch Sublet, Activation considerations relevant to the decommissioning of Fusion Reactors, PhD thesis (1989).
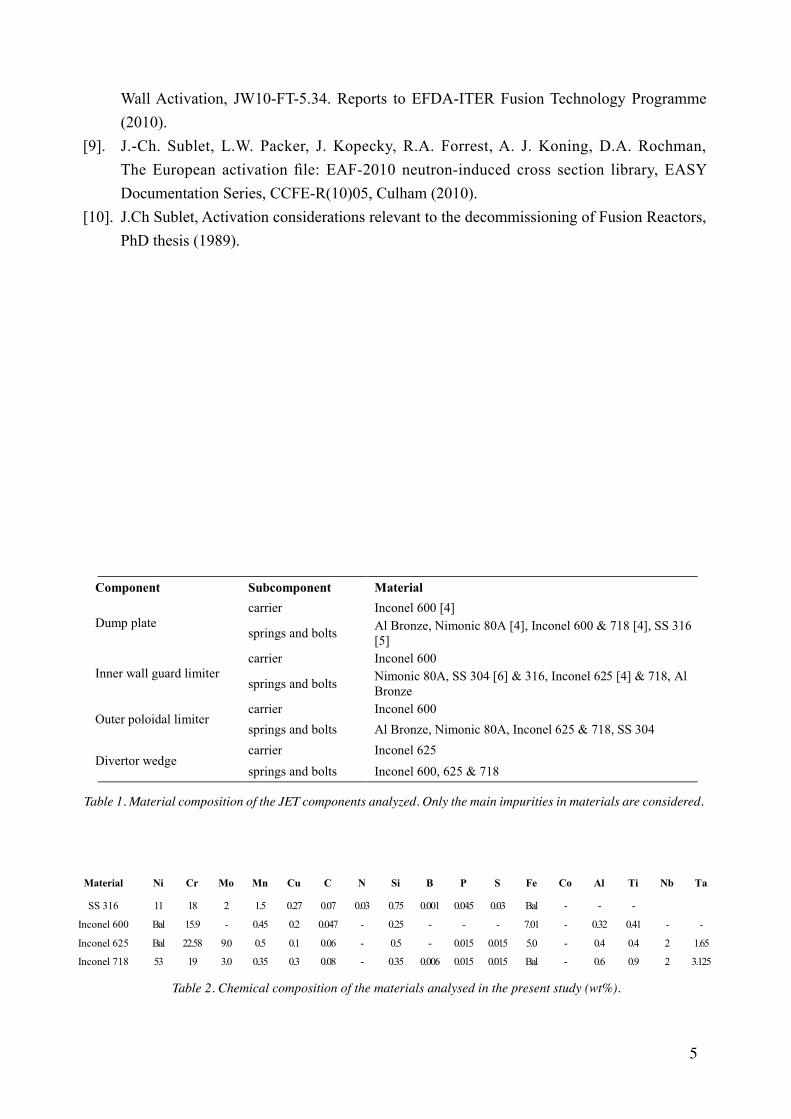
Table 1. Material composition of the JET components analyzed. Only the main impurities in materials are considered.
Table 2. Chemical composition of the materials analysed in the present study (wt%).
Component Subcomponent Material
Dump plate carrier Inconel 600 [4]
springs and bolts Al Bronze, Nimonic 80A [4], Inconel 600 & 718 [4], SS 316 [5]
Inner wall guard limiter carrier Inconel 600
springs and bolts Nimonic 80A, SS 304 [6] & 316, Inconel 625 [4] & 718, Al Bronze
Outer poloidal limiter carrier Inconel 600 springs and bolts Al Bronze, Nimonic 80A, Inconel 625 & 718, SS 304
Divertor wedge carrier Inconel 625 springs and bolts Inconel 600, 625 & 718
Material Ni Cr Mo Mn Cu C N Si B P S Fe Co Al Ti Nb Ta
SS 316 11 18 2 1.5 0.27 0.07 0.03 0.75 0.001 0.045 0.03 Bal - - -
Inconel 600 Bal 15.9 - 0.45 0.2 0.047 - 0.25 - - - 7.01 - 0.32 0.41 - -
Inconel 625 Bal 22.58 9.0 0.5 0.1 0.06 - 0.5 - 0.015 0.015 5.0 - 0.4 0.4 2 1.65
Inconel 718 53 19 3.0 0.35 0.3 0.08 - 0.35 0.006 0.015 0.015 Bal - 0.6 0.9 2 3.125

6
Figure 1: Sketch of the JET geometry and localization of the components considered in the present analysis.
Figure 3: Graphical representation of different scenarios and comparison of different amount of neutrons produced during the 17 weeks campaign. The inset shows the pulsed operation of the last day.
Figure 2: Neutron energy spectrum evaluated with MCNP5 in the outer poloidal limiter. The results in the full volume are compared to the spectra obtained on two sub-domains 2cm thick. Values are normalized to a single source neutron.
1
4
Dump plateSaddle coilprotection
Inner wallguard limiter
Outerpoloidallimiter
Divertor
Bulk Bew or w-coating
2
3
CPS13.1499-1c
10-7
10-5
10-6
10-5 100
Rel
ativ
e ne
utro
n sp
ectru
m
Neutron Energy (MeV)
Divertor wedgeInner guard limiterUpper protectionPoloidal limiter
CPS
13.1
499-
2c
2.5
3.0
2.0
1.5
1.0
1
0
2
3
4
0.5
0100
10 328060
Time (days)
40200 120
Neu
trons
/ da
y (×
1018
)
Neu
trons
/ da
y (×
1019
)
Time (s) (× 104)
Pulse operation of the last day
CPS
13.1
499-
3cScenario I
Scenario II
7
Figure 4: Evolution of the dose rate associated to Inconel 600 for scenario I.
Figure 5: Evolution of the dose rate associated to Inconel 625 for scenario I and II in the divertor wedge.
Figure 6: Evolution of the dose rate associated to Inconel 718 for scenario II in the four positions in which the material is present.
Figure 7: Evolution of the dose rate associated to SS-316 for scenario II in the divertor wedge. In the figure the error band due to the cross sections is also presented (dashed curves).
10-1
10-2
10-3
10-210-4 100
Dos
e ra
te (S
v/h)
Time after irradiation (years)
CPS
13.1
499-
4c
Dump platePoloidal limiterInner guard limiter
10-1
10-2
10-3
10-210-4 100
Dos
e ra
te (S
v/h)
Time after irradiation (years)
CPS
13.1
499-
5c
Scenario IScenario II
10-1
10-2
10-3
10-210-4 100
Dos
e ra
te (S
v/h)
Time after irradiation (years)
CPS
13.1
499-
6c
Dump platePoloidal limiterInner guard limiterDivertor wedge
10-3
10-2
10-1
10-4
10-210-4 100
Dos
e ra
te (S
v/h)
Time after irradiation (years)
CPS
13.1
499-
7c

8
Figure 8: Dose rates for the different JET components in each position for the reference scenario I.
Figure 9: Parametric analysis for Inconel 600; the cobalt content in the initial composition is varied from 0% to 0.2%. Values are shown for the divertor wedge in scenario I.
Figure 10: Parametric analysis for Inconel 625; cobalt content in the initial composition is varied from 0% to 0.2%. Values are shown for the divertor wedge in scenario I.
10-1
10-2
10-3
10-3
10-210-4 100
101
Dos
e ra
te (S
v/h)
Time after irradiation (years)
CPS
13.1
499-
10c
% Co 0% Co 0.09% Co 0.20
10-2
10-1
10-3
10-410-210-4 100
Dos
e ra
te (S
v/h)
Time after irradiation (years)
Inconel 600 Inconel 625 Inconel 718 SS316
CPS
13.1
499-
8c
10-2
10-1
10-3
10-210-4 100
Dos
e ra
te (S
v/h)
10-2
10-1
10-3
10-410-210-4 100
Dos
e ra
te (S
v/h)
10-2
10-1
10-3
10-210-4 100
Dose
rate
(Sv/
h)
Poloidal limiter
Divertor wedge
Inner guard limiter
Dump plate
10-1
10-2
10-3
10-3
10-210-4 100
100
Dos
e ra
te (S
v/h)
Time after irradiation (years)
CPS
13.1
499-
9c
% Co 0% Co 0.05% Co 0.20