north carolina census snapshot: 2010 - williams...
TRANSCRIPT

North Carolina Census Snapshot: 2010
Same-sex couples 18,309 Same-sex couples per 1,000
households 4.9
Husband/wife 3,224 Same-sex “husband/wife” couples per
1,000 “husband/wife” couples 1.8
Unmarried partner 15,085 Same-sex “unmarried partner” couples
per 1,000 “unmarried partner” couples 71.6
Same-sex couples per 1,000 households by Census tract (adjusted)

2
Same-sex female couples per 1,000 households by county (adjusted)
Same-sex male couples per 1,000 households by county (adjusted)
Male8,037 44%
Female10,272 56%
All Same-sex Couples
Male1,576 49%
Female1,648 51%
Same-sex couples
who identify as spouses
Male6,461 43%
Female8,624 57%
Same-sex couples
who identify as unmarried partners

3
Percent of same-sex couples raising “own” children* by county (adjusted)
Raising "own"
children3,380 18%
Not raising "own"
children14,929 82%
All Same-sex Couples
Raising "own"
children1,061 33%
Not raising "own"
children2,163 67%
Same-sex couples
who identify as spouses
Raising "own"
children2,319 15%
Not raising "own"
children12,766 85%
Same-sex couples
who identify as unmarried partners
Data and methodology Data are compiled using the US Census Bureau’s state-level preferred estimates for same-sex couples found here. Same-sex couples are identified in households where Person 1 describes his or her relationship with another adult of the same sex as either a “husband/wife” or “unmarried partner”. The Census Bureau preferred estimates adjust original Census tabulations reported in the Census 2010 SF-1, PCT15 to account for the likelihood that a small portion of different-sex couples miscode the sex of a spouse or partner and are incorrectly counted as a same-sex couple.
Adjusted data
The Census Bureau only released preferred estimates for states. County, city, and tract data used in this report are adjusted by the authors and do not represent official Census Bureau tabulations. Like the Census Bureau preferred estimates, the adjustment procedure accounts for the likelihood that a small portion of different-sex couples miscode the sex of a spouse or partner and are incorrectly counted as a same-sex couple.
Undercount
The adjusted figures do not take into account the possibility that some same-sex couples may not be counted in Census tabulations due to concerns about confidentiality or because neither partner was Person 1 in the household.
Go here for a complete description of the adjustment procedure.
*“Own” children are never-married children under 18 who are sons or daughters of one partner or spouse (Person 1) by birth, marriage (stepchild), or adoption.

4
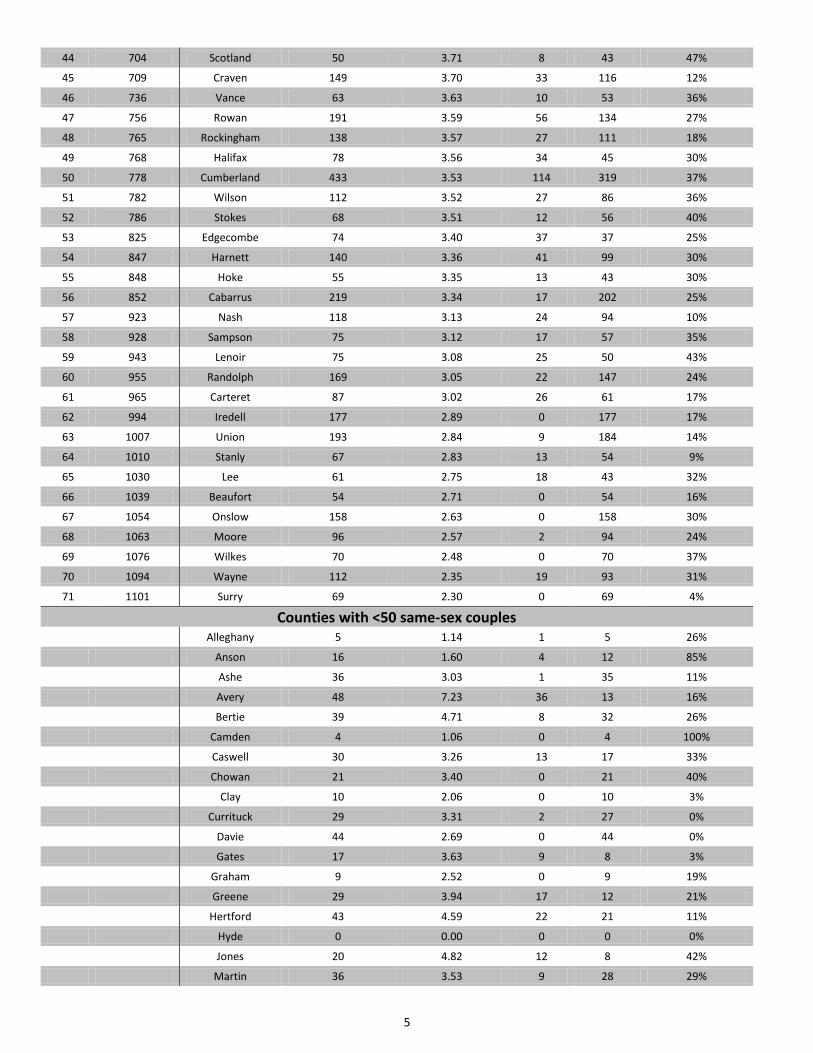
Counties with 50+ same-sex couples ranked by same-sex couples per 1,000 households
State rank
US rank among 1,142 counties with 50+ same-sex
couples County Same-sex couples
(adjusted)
Same-sex couples per 1,000
households (adjusted)
Same-sex male
couples (adjusted)
Same-sex female couples
(adjusted)
% Raising “own” children among
same-sex couples (adjusted)
1 20 Buncombe 1200 11.95 603 597 17%
2 42 Durham 1059 9.69 558 501 17%
3 93 Orange 399 7.76 125 275 18%
4 135 Mecklenburg 2426 6.70 1506 920 16%
5 143 Transylvania 94 6.52 40 54 15%
6 146 Haywood 166 6.48 89 77 20%
7 158 Dare 91 6.34 38 53 25%
8 159 Madison 54 6.33 30 24 15%
9 174 Watauga 127 6.24 56 71 4%
10 184 Macon 90 6.18 44 46 9%
11 196 New Hanover 521 6.06 288 233 12%
12 212 Henderson 268 5.90 124 144 16%
13 217 Polk 53 5.86 38 15 19%
14 222 Jackson 96 5.83 55 41 18%
15 240 Chatham 148 5.71 57 90 9%
16 246 Guilford 1116 5.68 582 535 19%
17 251 Forsyth 792 5.61 337 454 17%
18 290 Columbus 120 5.35 54 66 31%
19 295 Franklin 122 5.31 57 66 8%
20 316 Wake 1788 5.17 983 806 9%
21 319 Duplin 116 5.16 55 61 25%
22 326 Person 81 5.13 35 46 23%
23 345 Granville 103 5.02 31 72 15%
24 394 Gaston 381 4.78 149 233 18%
25 426 Alamance 278 4.63 99 178 20%
26 445 Robeson 218 4.53 104 113 32%
27 446 Pender 92 4.53 35 57 4%
28 464 Lincoln 136 4.48 53 83 26%
29 470 Cherokee 52 4.47 23 30 21%
30 472 Brunswick 206 4.45 61 146 14%
31 475 Bladen 64 4.45 26 38 14%
32 483 Yadkin 69 4.43 28 41 16%
33 525 Catawba 260 4.27 62 198 25%
34 548 Davidson 268 4.16 97 171 11%
35 555 Burke 148 4.14 65 83 21%
36 566 Pitt 278 4.11 105 173 16%
37 638 Alexander 56 3.90 12 45 36%
38 644 Richmond 72 3.88 38 33 36%
39 659 McDowell 68 3.82 10 58 26%
40 664 Rutherford 104 3.80 16 88 18%
41 679 Caldwell 126 3.76 38 88 21%
42 686 Cleveland 145 3.75 25 119 21%
43 688 Johnston 232 3.75 31 201 25%
5
44 704 Scotland 50 3.71 8 43 47%
45 709 Craven 149 3.70 33 116 12%
46 736 Vance 63 3.63 10 53 36%
47 756 Rowan 191 3.59 56 134 27%
48 765 Rockingham 138 3.57 27 111 18%
49 768 Halifax 78 3.56 34 45 30%
50 778 Cumberland 433 3.53 114 319 37%
51 782 Wilson 112 3.52 27 86 36%
52 786 Stokes 68 3.51 12 56 40%
53 825 Edgecombe 74 3.40 37 37 25%
54 847 Harnett 140 3.36 41 99 30%
55 848 Hoke 55 3.35 13 43 30%
56 852 Cabarrus 219 3.34 17 202 25%
57 923 Nash 118 3.13 24 94 10%
58 928 Sampson 75 3.12 17 57 35%
59 943 Lenoir 75 3.08 25 50 43%
60 955 Randolph 169 3.05 22 147 24%
61 965 Carteret 87 3.02 26 61 17%
62 994 Iredell 177 2.89 0 177 17%
63 1007 Union 193 2.84 9 184 14%
64 1010 Stanly 67 2.83 13 54 9%
65 1030 Lee 61 2.75 18 43 32%
66 1039 Beaufort 54 2.71 0 54 16%
67 1054 Onslow 158 2.63 0 158 30%
68 1063 Moore 96 2.57 2 94 24%
69 1076 Wilkes 70 2.48 0 70 37%
70 1094 Wayne 112 2.35 19 93 31%
71 1101 Surry 69 2.30 0 69 4%
Counties with <50 same-sex couples
Alleghany 5 1.14 1 5 26%
Anson 16 1.60 4 12 85%
Ashe 36 3.03 1 35 11%
Avery 48 7.23 36 13 16%
Bertie 39 4.71 8 32 26%
Camden 4 1.06 0 4 100%
Caswell 30 3.26 13 17 33%
Chowan 21 3.40 0 21 40%
Clay 10 2.06 0 10 3%
Currituck 29 3.31 2 27 0%
Davie 44 2.69 0 44 0%
Gates 17 3.63 9 8 3%
Graham 9 2.52 0 9 19%
Greene 29 3.94 17 12 21%
Hertford 43 4.59 22 21 11%
Hyde 0 0.00 0 0 0%
Jones 20 4.82 12 8 42%
Martin 36 3.53 9 28 29%

6
Mitchell 30 4.55 19 11 9%
Montgomery 23 2.18 5 18 17%
Northampton 33 3.64 16 17 26%
Pamlico 22 4.03 12 10 36%
Pasquotank 20 1.33 0 20 0%
Perquimans 12 2.08 0 12 9%
Swain 23 4.12 10 13 15%
Tyrrell 1 0.53 0 1 100%
Warren 23 2.81 10 14 21%
Washington 19 3.35 7 12 0%
Yancey 29 3.85 15 14 4%

7
Cities with 50+ same-sex couples ranked by same-sex couples per 1,000 households
State rank
US rank among 1,415
cities with 50+ same-sex
couples City Same-sex couples
(adjusted)
Same-sex couples per 1,000
households (adjusted)
1 68 Asheville 592 15.83
2 187 Durham 951 10.17
3 212 Carrboro 83 9.65
4 363 Garner 78 7.68
5 460 Charlotte 2053 7.08
6 525 Winston-Salem 618 6.69
7 529 Greensboro 746 6.68
8 599 Raleigh 1028 6.31
9 605 Hickory 104 6.27
10 692 Wilmington 278 5.91
11 730 Cornelius 62 5.74
12 742 Chapel Hill 117 5.71
13 752 Gastonia 158 5.68
14 819 High Point 219 5.35
15 842 Burlington 107 5.20
16 854 Thomasville 54 5.14
17 1083 Salisbury 54 4.30
18 1086 Huntersville 75 4.30
19 1113 New Bern 54 4.22
20 1193 Greenville 142 3.93
21 1240 Rocky Mount 86 3.71
22 1246 Kannapolis 60 3.68
23 1261 Cary 186 3.59
24 1275 Concord 102 3.52
25 1289 Wilson 68 3.47
26 1308 Jacksonville 68 3.39
27 1322 Fayetteville 259 3.31
About the authors Gary J. Gates, PhD is the Williams Distinguished Scholar at the Williams Institute, UCLA School of Law.
Abigail M. Cooke is a PhD candidate in the Department of Geography at UCLA and is affiliated with the California Center for Population Research.
Acknowledgments The authors thank Williams Institute Fellows Angeliki Kastanis, Laura Durso, and Christy Mallory for assistance with the Snapshots.
For more information The Williams Institute, UCLA School of Law, (310) 267-4382 http://williamsinstitute.law.ucla.edu/