ngnp and hydrogen production preconceptual design … documents/westinghouse...ngnp and hydrogen...
TRANSCRIPT

NGNP-20-RPT-002 January 2007 Revision 0
NGNP and Hydrogen Production Preconceptual
Design Report
SPECIAL STUDY 20.2: PROTOTYPE POWER LEVEL
Revision 0
APPROVALS
Function Printed Name and Signature Date
Author Eben Mulder M-Tech-Industrial (Pty) Ltd 29 January 2007
Reviewer Jan van Ravenswaay M-Tech Industrial (Pty) Ltd 29 January 2007
Approval Michael Correia Pebble Bed Modular Reactor (Proprietary) Ltd 30 January 2007
Westinghouse Electric Company LLC
Nuclear Power Plants Post Office Box 355
Pittsburgh, PA 15230-0355
2007 Westinghouse Electric Company LLC All Rights Reserved

NGNP and Hydrogen Production Preconceptual Design Report NGNP-20-RPT-002 Special Study 20.2 – Prototype Power Level Study
20.2 Prototype Power Level Study January 26, 2007 2 of 65
LIST OF CONTRIBUTORS
Name and Company Date
Kobus van der Merwe
M-Tech Industrial (Pty) Ltd
January 2007
Fred Silady
Technology Insights
January 2007
Dan Mears
Technology Insights
January 2007
Andrew Kadak
KADAK & Associates
January 2007
BACKGROUND INTELLECTUAL PROPERTY
Section Title Description
None None

NGNP and Hydrogen Production Preconceptual Design Report NGNP-20-RPT-002 Special Study 20.2 – Prototype Power Level Study
20.2 Prototype Power Level Study January 26, 2007 3 of 65
REVISION HISTORY
RECORD OF CHANGES
Revision No. Revision Made by Description Date
0 Eben Mulder
M-Tech-Industrial (Pty) Ltd
Initial issue January 30, 2007
DOCUMENT TRACEABILITY
Created to Support the Following
Document(s)
Document Number Revision
NGNP and Hydrogen Production Preconceptual Design Report
NGNP-01-RPT-001 0

NGNP and Hydrogen Production Preconceptual Design Report NGNP-20-RPT-002 Special Study 20.2 – Prototype Power Level Study
20.2 Prototype Power Level Study January 26, 2007 4 of 65
LIST OF TABLES
Table 20.2.1: Overview of PBMR-DPP Reference and Performance Data ............................... 35 Table 20.2.2: PBMR-DPP Fuel Data.......................................................................................... 38 Table 20.2.3: Cases - Power Level Configuration...................................................................... 42 Table 20.2.4: VSOP-A and Tinte Steady-State Results.............................................................. 45 Table 20.2.5: VSOP-A and Tinte DLOFC Results..................................................................... 45 Table 20.2.6: Discriminating Criteria ......................................................................................... 46 Table 20.2.7: Neutronics Performance Parameters..................................................................... 48 Table 20.2.8: Thermal-hydraulics Performance Parameters....................................................... 49 Table 20.2.9: Volume versus Temperature Analysis during Normal Operation ........................ 50 Table 20.2.10: Thermal-Hydraulics Performance during a PLOFC (9.0 MPa).......................... 52 Table 20.2.11: Thermal-Hydraulics Performance during a DLOFC .......................................... 54 Table 20.2.12: Volume versus Temperature Analysis during DLOFC ...................................... 55 Table 20.2.13: Overview of Maximum Temperatures Achieved during a DLOFC................... 56

NGNP and Hydrogen Production Preconceptual Design Report NGNP-20-RPT-002 Special Study 20.2 – Prototype Power Level Study
20.2 Prototype Power Level Study January 26, 2007 5 of 65
LIST OF FIGURES
Figure 20.2.1: The AVR in Jülich............................................................................................... 22 Figure 20.2.2: The THTR-300 Reactor in Hamm-Uentrop ........................................................ 23 Figure 20.2.3: Schematic of the HTR-MODUL Design Layout ................................................ 25 Figure 20.2.4: TRISO Coated Fuel Particle................................................................................ 28 Figure 20.2.5: HTR Pebble Fuel Layout..................................................................................... 29 Figure 20.2.6: PBMR-DPP Design............................................................................................. 32Figure 20.2.7: Description of the PBMR-DPP Internals ............................................................ 33 Figure 20.2.8: Side Reflector Regions of the PBMR-DPP......................................................... 34 Figure 20.2.9: Layout of the FCR............................................................................................... 35 Figure 20.2.10: Axial Power Profile in the PBMR-DPP Fuel Channel #1................................. 36 Figure 20.2.11: PBMR Fuel Design ........................................................................................... 37

NGNP and Hydrogen Production Preconceptual Design Report NGNP-20-RPT-002 Special Study 20.2 – Prototype Power Level Study
20.2 Prototype Power Level Study January 26, 2007 6 of 65
ACRONYMS
ASME American Society of Mechanical Engineers
AVR Arbeitsgemeinschaft Versuchsreaktor (German for Jointly-operated
Experimental Reactor)
BIRGIT VSOP preprocessor
2-D Two dimensional
3-D Three dimensional
CB Core Barrel
DLOFC Depressurized Loss of Forced Cooling
DPP Demonstration Power Plant
FCR Fixed Central Reflector
H/D Height/Diameter
HTR High Temperature Reactor
HTR-MODUL High-temperature Reactor – Modul (by Interatom/Siemens)
ILTI Inner Low Temperature Isotropic Layer Thickness
Keff Effective multiplication factor
LEU Low Enriched Uranium
LWR Light Water Reactor
MAGNOX Magnesium Non-Oxidising Reactor
MEDUL MEhrfachDUrchLauf (German for multi-pass)
MWd/tHM Megawatt days per ton heavy metal
NGNP Next Generation Nuclear Plant
NILE 1 Nile = 1% keff
OLTI Outer Low Temperature Isotropic Layer Thickness
PBMR Pebble Bed Modular Reactor
PCU Power Conversion Unit
PHP Process Heat Plant
PLOFC Pressurized Loss of Forced Cooling
R&D Research and Development
RBMK reactor Reaktor Bolshoy Moshchnosti Kanalniy (Russian for "reactor
(of) high power (of the) channel (type)")
RCCS Reactor Cavity Cooling System

NGNP and Hydrogen Production Preconceptual Design Report NGNP-20-RPT-002 Special Study 20.2 – Prototype Power Level Study
20.2 Prototype Power Level Study January 26, 2007 7 of 65
RCS Reactivity Control System
RIT Reactor Inlet Temperature
ROT Reactor Outlet Temperature
RPV Reactor Pressure Vessel
RSS Reserve Shutdown System
THERMIX A Computer Code for the Instationary Two-Dimensional Simulation of
Thermal-Hydraulic Transients, e.g. in the Primary Circuit of Gas-Cooled
Nuclear Reactors
THTR Thorium High-temperature Reactor
TINTE Time dependent Neutronics and Temperatures code
TRISO Triple Coated Isotropic Particle
VSOP-A Very Superior Old Programs – Augmented

NGNP and Hydrogen Production Preconceptual Design Report NGNP-20-RPT-002 Special Study 20.2 – Prototype Power Level Study
20.2 Prototype Power Level Study January 26, 2007 8 of 65
TABLE OF CONTENTS
LIST OF TABLES........................................................................................................................ 4
LIST OF FIGURES...................................................................................................................... 5
ACRONYMS ................................................................................................................................ 6
20.2 PROTOTYPE POWER LEVEL................................................................................... 10
SUMMARY AND CONCLUSIONS ......................................................................................... 10
Conclusion ....................................................................................................................... 13
INTRODUCTION....................................................................................................................... 15
Background ..................................................................................................................... 15
Scope of the Evaluation .................................................................................................. 17
20.2.1 PEBBLE BED REACTOR DESIGN REQUIREMENTS AND SELECTIONS ...... 20
20.2.1.1 Technology Basis.......................................................................................... 20
20.2.1.2 Safety Characteristics.................................................................................. 30
20.2.2 PBMR-DPP DESIGN APPROACH AND SELECTIONS ......................................... 31
20.2.2.1 PBMR-DPP Reactor.................................................................................... 31
20.2.2.2 PBMR-DPP Fuel .......................................................................................... 37
20.2.3 APPROACH TO NGNP POWER LEVEL .................................................................. 39
20.2.3.1 Overview of Design Approach.................................................................... 39
20.2.3.2 Design Selections That Influence Core Power .......................................... 39
20.2.3.3 Evaluation Scope.......................................................................................... 41
20.2.4 SIMULATION TOOLS AND INPUT DATA .............................................................. 43
20.2.4.1 VSOP-A Description.................................................................................... 43
20.2.4.2 Steady State Comparison between VSOP-A and TINTE ........................ 44
20.2.4.3 DLOFC Data Comparison between VSOP-A and TINTE ...................... 45
20.2.5 DISCRIMINATING CRITERIA .................................................................................. 46
20.2.6 EVALUATION, RESULTS AND COMPARISON..................................................... 47
20.2.6.1 Normal Operation........................................................................................ 47
20.2.6.1.1 Evaluation of Normal Operation Performance........................................ 51 20.2.6.2 Investment Protection ................................................................................. 51
20.2.6.2.1 Evaluation of Performance during a PLOFC (Investment Protection) ... 53 20.2.6.3 Safety Performance (DLOFC).................................................................... 53
20.2.6.3.1 Evaluation of Performance during a DLOFC (Safety Consideration) .... 56
20.2.7 SUMMARY AND RECOMMENDATION.................................................................. 57
REFERENCES............................................................................................................................ 59

NGNP and Hydrogen Production Preconceptual Design Report NGNP-20-RPT-002 Special Study 20.2 – Prototype Power Level Study
20.2 Prototype Power Level Study January 26, 2007 9 of 65
BIBLIOGRAPHY....................................................................................................................... 60
DEFINITIONS ............................................................................................................................ 61
REQUIREMENTS...................................................................................................................... 62
LIST OF ASSUMPTIONS......................................................................................................... 63
TECHNOLOGY DEVELOPMENT ......................................................................................... 64
APPENDICES............................................................................................................................. 65
APPENDIX 20.2.1 PRESENTATION TO BEA, "20.2 POWER LEVEL
SPECIAL STUDY," DECEMBER 6, 2006................................ 65
NGNP and Hydrogen Production Preconceptual Design Report NGNP-20-RPT-002 Special Study 20.2 – Prototype Power Level Study
20.2 Prototype Power Level Study January 26, 2007 10 of 65
20.2 PROTOTYPE POWER LEVEL
SUMMARY AND CONCLUSIONS
The NGNP Project vision and mission is to assist in the launch of commercial deployment of a worthy hydrogen and electricity production facility using high temperature gas reactors. The NGNP scope of work states that the optimal size and design temperature for the reactor type shall be determined for a “commercial scale prototype reactor” for electrical power generation, optimal hydrogen production efficiencies and other industry applications of high temperature process heat. To achieve this mission, the Project must demonstrate key licensing, performance, economic and industrial infrastructure development objectives using a sound technology reference as base.
Given the advanced state of the PBMR in South Africa in terms of design, technology, licensing, project and infrastructure development, the strong recommendation of this power level study for a pebble bed-based NGNP is to build upon the PBMR 400 MWth core design as the most appropriate baseline for the NGNP design. The PBMR project in South Africa will demonstrate an advanced Brayton cycle for all electric applications. The PBMR-based NGNP will demonstrate the Process Heat Plant (PHP) design referenced on the PBMR core design, but with a 950 ºC reactor outlet temperature (ROT) targeted to support hydrogen production applications. Hence, the objective of this special study is to establish the appropriate power level for a commercial-scale PBMR-PHP for the NGNP in terms of whether it should be larger or smaller than the reference 400 MWth.
The major design parameter difference between the proposed NGNP and PBMR demonstration plant is the difference between the reactor inlet temperature (RIT) and the reactor outlet temperature (ROT), i.e., 350 °C/950 °C for NGNP versus 500 °C/900 °C for the PBMR DPP. The full range of energy of the reactor is utilized by process heat applications on the top end and by power generation applications on the lower end respectively. It is important to note that in the approach to determine the NGNP power level the German fuel envelope of burnup-fluence-temperature and the limitation of having the maximum fuel temperature lower than 1250 °C during normal operation are still assumed. The aim is to perform no or limited R&D and design development for the NGNP to minimize impact on schedule.
In this special study eight different power level options were evaluated using the VSOP-A suite of codes to optimize the reactor power level via a parametric investigation following the variation of the RIT/ROT. The VSOP-A codes system provides a coupled neutronics and thermal hydraulic analysis and has been employed to perform the conceptual design of the PBMR-DPP, as well as the HTR-10 plant operated in China. During this phase of the preconceptual considerations only 2-D models of the various design scenarios were developed to provide an indication of the effect of the RIT/ROT variation under consideration.

NGNP and Hydrogen Production Preconceptual Design Report NGNP-20-RPT-002 Special Study 20.2 – Prototype Power Level Study
20.2 Prototype Power Level Study January 26, 2007 11 of 65
Most of the critical parameters required to make design decisions are derived from the neutronics, such as neutron leakage, ensuring a stable core due to the xenon characteristics, burnup versus enrichment, maximum power in the fuel, etc. Closely coupled to the neutronics are the thermal-hydraulic parameters, such as the maximum and average fuel temperatures during normal operation and DLOFC conditions. Included in the analysis are the maximum and average RPV and CB temperatures achieved, especially during a DLOFC event. Also reported are the volumes of fuel to be expected at different temperatures.
During the conceptual design phase a number of interfaces are to be considered within the reactor in more detail for the selected power level. These would include the fixed central reflector with RSS borings, cooling design and housing, the annular fuel region, inner side reflector region with RCS borings, cooling design and housing, the outer side reflector region with cooling borings, CB, gaps, RPV, external air gap, RCCS, etc. These interfaces have all been addressed in the PBMR-DPP design and are considered in the preconceptual calculations performed for this special study. For purposes of this investigation a comparison among results of the eight cases considered is provided based on the DPP reference case.
The assumed reactivity shutdown margins are effectively based on the calculated capabilities and requirements of the PBMR-DPP. Temperature coefficients of reactivity and typical neutronics parameters are also assessed to provide the means of comparison between the selected cases investigated. During the conceptual phase the shutdown margins should be calculated specific for the selected power level. The insertion depth of the RCS during normal operation will depend upon a number of parameters, based on the normal operating conditions and load-following conditions to be decided between the client and the design team at the time.
The different options were evaluated according to the discriminating criteria shown in the table below to determine the most suitable option. Readiness, Performance during off design conditions and Capital Cost carried the most weight in the evaluation.
Criteria Relative weight
Readiness Technology enabling R&D (including fuel) High Design development and schedule High
Performance Normal operation Medium Investment protection (PLOFC) Medium Safety consideration (DLOFC) High
Cost Capital cost (reactor, etc.) High Operating cost (including fuel cycle costs) Medium

NGNP and Hydrogen Production Preconceptual Design Report NGNP-20-RPT-002 Special Study 20.2 – Prototype Power Level Study
20.2 Prototype Power Level Study January 26, 2007 12 of 65
The following options under consideration in this study are firstly based directly on the PBMR geometry with no changes:
DPP Case: 400 MWth; RIT/ROT = 500/900 °C; m = 179 kg/s;
Case 1: 400 MWth; RIT/ROT = 350/950 °C; m = 119 kg/s;
Case 2: 450 MWth; RIT/ROT = 350/950 °C; m = 134 kg/s;
Case 3: 450 MWth; RIT/ROT = 500/950 °C; m = 179 kg/s;
Case 4: 500 MWth; RIT/ROT = 450/950 °C; m = 179 kg/s;
Case 5: 500 MWth; RIT/ROT = 350/950 °C; m = 149 kg/s;
Case 8: 600 MWth; RIT/ROT = 350/950 °C; m = 179 kg/s.
Two cases were investigated with a single change in geometry, i.e., where the diameter of the fixed central reflector (FCR) is increased from 2.0 m to 2.4 m to lower the maximum fuel temperature during a DLOFC event:
Case 6: 500 MWth; RIT/ROT = 350/950 °C; FCR = 2.4 m;
Case 7: 600 MWth; RIT/ROT = 350/950 °C; FCR = 2.4 m.
Differentiation is provided in terms of normal operation, investment protection (PLOFC analysis), and safety consideration (DLOFC analysis). The results of the eight design cases analyzed were listed in terms of these three categories.
During normal operation all the cases were within the acceptable burnup limit while Case 7 exceeded the energy per fuel sphere limitation. Cases 1, 2 and 5 had a bigger margin for the maximum fuel temperature limitation than the other cases while Case 8 exceeded the maximum fuel temperature limitation. Case 7 has a smaller flow path area due to the increased fixed centre column and subsequently the pressure drop across the reactor for this case was higher which would result in a larger helium circulator.
For the investment protection (PLOFC) analyses all the cases except Case 8 were within the required set limitations.
The DLOFC analyses showed that during such an event the maximum fuel temperature for Cases 1 and 2 are below 1600 °C while Cases 5 and 7 have some of the core volume (less than 10 percent) at temperatures above 1600 °C and Case 8 had maximum fuel temperatures in excess of 1800 °C.

NGNP and Hydrogen Production Preconceptual Design Report NGNP-20-RPT-002 Special Study 20.2 – Prototype Power Level Study
20.2 Prototype Power Level Study January 26, 2007 13 of 65
Conclusion
Based on the analyzed cases, Case 5 with a power level of 500 MWth with RIT/ROT of 350/950 °C is proposed for the conceptual design of the NGNP. The required R&D anticipated is limited to the qualification of the fuel performance for DLOFC operation up to 1700 °C by the time of plant construction. Further it is suggested to keep the geometry similar to the PBMR-DPP after careful consideration of the following motivating factors:
The PBMR-DPP reactor can be immediately used as the basis for NGNP design - within the operational envelope of the PBMR- DPP.
The NGNP schedule will be met - minimal R&D required.
No or minimal design development required.
A 25 percent higher power output is achievable for the NGNP reactor, without increasing the capital cost for the reactor and auxiliary systems and building from the base PBMR design.
In conclusion, a 500 MWth reactor with a core inlet temperature of 350 ºC and a core outlet temperature of 950 ºC utilizing the PBMR-DPP geometry is recommended for the NGNP design and the follow-on commercial application.
While not addressed in the technical aspects of the power size selection summarized above, which is based on the reference PMBR-DPP design, the short-comings of achieving this mission with a small-scale (approximately 25-50 MWth) NGNP test reactor are addressed below.
Achieving the performance demonstration objectives of the NGNP is critical for commercial acceptance and requires a commercial-scale or scaleable reactor. Whereas fuel performance can be effectively demonstrated in capsule irradiation and post-irradiation tests with controlled temperature and environmental conditions, an integrated annular core performance demonstration requires a commercial-scale reactor. Anything less than full-scale makes little sense for the NGNP, especially if the basic full-scale design and technology development programs exist to support the NGNP for pebble bed reactors.
Additionally, the proposed Licensing Strategy of the PBMR-based NGNP seeks to apply Part 52 rules to demonstrate the one-step licensing process. This strategy builds upon the PBMR-DPP reactor design, licensing and deployment experience. There is also high value added from PMBR efforts for early design certification of follow-on commercial projects. A small-scale NGNP test reactor project would do little to advance these objectives. For example, licensing a small-scale test reactor that does not demonstrate the annular core and does not confirm the basic neutronics and thermal hydraulics design codes for the commercial design which is based on an annular core is not of value. Alternatively, demonstrating a reduced-scale PBMR with an annular core is a step backwards since a full scale licensing of the technology is possible.

NGNP and Hydrogen Production Preconceptual Design Report NGNP-20-RPT-002 Special Study 20.2 – Prototype Power Level Study
20.2 Prototype Power Level Study January 26, 2007 14 of 65
Economic objectives for NGNP include minimizing the front-end development costs and risks as well as the product costs, particularly for follow-on commercial plants. For the PBMR, a small-scale NGNP test reactor would forego the benefits of building on the PBMR-DPP development investment in exchange for expected lower capital costs of the plant. Most important, the one-of-a-kind design development costs for a small-scale NGNP test reactor would have limited transfer value to any commercial design. Higher net costs are expected with building a small-scale NGNP test reactor when considered in the context of industry adoption of the technology. Unit capital, component and O&M costs for such a NGNP will all increase dramatically, compared to a full size NGNP, and the offsets to the first-of-a-kind costs for the commercial plant will be minimal. A small scale reactor will also not be able to demonstrate hydrogen production components and reliability sufficiently for commercial acceptance, and will not allow adequate testing of critical systems, structures and components.
Broad industry and government efforts are underway to form a utility and end-user-based NGNP Alliance as the private partner in a public/private partnership with DOE for deploying a commercial-scale NGNP. Such efforts are incompatible with a small-scale NGNP test reactor. With regard to industrial infrastructure development objectives, a small-scale NGNP test reactor would be a resource distraction. Thus, a small-scale NGNP test reactor has little value for advancing the overall objectives of the NGNP.

NGNP and Hydrogen Production Preconceptual Design Report NGNP-20-RPT-002 Special Study 20.2 – Prototype Power Level Study
20.2 Prototype Power Level Study January 26, 2007 15 of 65
INTRODUCTION
Background
Results of an investigation are provided in this document of the recommended power level for the NGNP plant with a pebble bed high-temperature reactor. The decision to use a pebble bed reactor came from a special study performed as part of the NGNP preconceptual investigations to establish the best choice of reactor for near term deployment (Special Study 20.1).
The NGNP Project vision and mission is to launch commercial deployment of a worthy HTGR product(s). “The optimal size and design temperature for the reactor type shall be
determined for a “commercial scale prototype reactor” for electrical power generation, optimal
hydrogen production efficiencies and other industry applications of high temperature process
heat.” 1.
A Public/Private partnership has stated: “The NGNP Project will result in a full scale
prototype that demonstrates the commercialization potential of the HTGR.” 2.
To achieve this mission, the Project must demonstrate key licensing, performance, economic and industrial infrastructure development objectives using a mature technology reference as the base. The Westinghouse team has selected the PBMR-DPP 400 MWth design as the reference for this special study in order to capitalize on as much as possible of the PBMR-DPP first-of-a-kind development experience. The short-comings of achieving this mission with a small-scale NGNP test reactor (approximately 25-50 MWth) are addressed below.
The proposed Licensing Strategy of the PBMR-based NGNP seeks to apply Part 52 rules to demonstrate the one-step licensing process. This strategy builds upon the PBMR-DPP reactor design, licensing and deployment experience, plus it seeks the value for demonstrating such in support of early design certification for follow-on commercial projects. A small-scale NGNP test reactor would do little to advance these objectives. For example, licensing a small-scale test reactor that does not demonstrate the annular core and does not confirm the basic neutronics and thermal hydraulics design codes for the commercial design which is based on an annular core is not of value. Alternatively, demonstrating a reduced-scale PBMR with an annular core is a step backwards for the PBMR concept because of the predecessor PBMR-DPP experience.
Likewise, achieving the performance demonstration objectives of the NGNP is critical for commercial acceptance and requires a commercial-scale or scaleable reactor. Whereas fuel performance can be effectively demonstrated in capsule irradiation and post-irradiation tests with controlled temperature and environmental conditions, an integrated annular core performance demonstration requires a commercial-scale reactor.
Economic objectives include minimizing the front-end development costs and risks as well as the product costs for the NGNP and particularly for the follow-on commercial plants. For the PBMR, a small-scale NGNP test reactor would forego the benefits of building on the PBMR-

NGNP and Hydrogen Production Preconceptual Design Report NGNP-20-RPT-002 Special Study 20.2 – Prototype Power Level Study
20.2 Prototype Power Level Study January 26, 2007 16 of 65
DPP development investment in exchange for the expected lower capital costs of the plant. Worse yet, the one-of-a-kind design development costs for a small-scale NGNP test reactor would have limited transfer value to any commercial design. Higher net costs are expected with building a small-scale NGNP test reactor when considered in the context of industry adoption of the technology. Unit capital, component and O&M costs for such a small scale NGNP test reactor will all increase dramatically and the offsets to the first-of-a-kind costs for the commercial plant will be minimal. Furthermore, four small reactors of block and pebble fuel types have been built in the past. The foundation of basic performance, safety and operational issues derived from small reactors is well proven. The issue is the application of these technologies in a new way that will directly demonstrate commercial scale capability of both the reactor and the coupled process heat applications.
With regard to industrial infrastructure development objectives, a small-scale NGNP test reactor would be a resource distraction. Infrastructure development within the utility and end-user sectors is being advanced by PBMR-specific commercial-based project development studies in concert with the NGNP Project. In addition, broad industry and government efforts are underway to form a utility and end-user-based NGNP Alliance as the private partner in a public/private partnership with DOE for deploying a commercial-scale NGNP. Such efforts are incompatible with a small-scale NGNP test reactor.
A small-scale (25-50 MWth) NGNP test reactor has little value for advancing the objectives of the NGNP, particularly for the PBMR-based NGNP. Therefore the Westinghouse team recommends a power level of 500 MWth, as selected in this study.
The major difference between the proposed NGNP and PBMR-DPP exists in the differences between the reactor inlet temperature (RIT) and the reactor outlet temperature (ROT) (i.e., 350 °C/950 °C versus 500 °C/900 °C). In addition, the reactor providing process heat will be operating at a fixed pressure as compared to the PBMR-DPP which operates at variable pressure.
The reactor design is characterized by passive safety, cost competitiveness, and by readiness for deployment. The passive safety utilizes the inherent characteristics of the HTGR fuel, coolant, and moderator by configuring the core geometry and selecting the power density to maintain radionuclide release within the fuel and core.
A set of discriminating criteria is defined to guide the selection of the plant size and geometry to be investigated in more detail. The criteria for the power level selection are grouped into performance during normal plant operation, investment protection of the plant, and overall safety of the facility.
In order to facilitate the process of decision making a description is provided of the PBMR-DPP, together with its calculated characteristics. This serves the purpose of providing a basis for comparison with other alternative power levels and configurations. The alternatives are grouped into those requiring no additional R&D, minimum incremental R&D, and modest additional R&D to that underway for the DPP. The latter group also could require additional design development.

NGNP and Hydrogen Production Preconceptual Design Report NGNP-20-RPT-002 Special Study 20.2 – Prototype Power Level Study
20.2 Prototype Power Level Study January 26, 2007 17 of 65
Scope of the Evaluation
Firstly a description of Pebble Bed Modular Reactor (PBMR) overall design requirements and the technological basis and characteristics of the design are provided. Next a description is provided of the PBMR-DPP design approach that includes the reactor and the fuel of the PBMR-DPP.
Following this the approach to the NGNP power level is described including the different cases under consideration. This is followed by an overview of the simulation tools and models used to perform the design calculations.
A set of discriminating criteria, with weighting factors, is then defined in order to assist in the selection of the NGNP power level. Following this the results for the different cases under consideration are presented and a selection is made of the NGNP power level.
Based on the outcome of the investigations it became apparent that a functional classification could be performed in terms of varying degrees of research and development (R&D) required for NGNP:
No R&D required – Here it is assumed that the PBMR-DPP is adequately proven by planned tests. The PBMR-DPP reactor is assumed as is. The NGNP PCU will have to be adapted for operation at constant pressure with an intermediate heat exchanger, while some characteristic adjustments are anticipated to optimize the power operation.
Minimal level of R&D – Re-evaluation of existing data, such as the fuel experimental data might be necessary. Should the test envelope of individual components in the equation be stretched, such as the maximum fuel temperature achieved, or the maximum time achievable at specified temperatures, additional calculations might be required to support or validate the attained conditions.
Modest R&D – Minor deviations from the PBMR-DPP geometry, such as the thickness of the fixed central reflector column are foreseen. Due to the anticipated impact on interfacing systems, such as the discharge chutes, careful consideration should be exercised when opting for such changes.
During this preliminary phase the investigation into the power level for the NGNP power plant is performed for the power conversion unit (PCU) mass flow conditions at 97 percent of the mass flow required for the selected power rating with a ROT of 950 °C and a RIT of 350 °C. An optimized pressure for the PBMR-DPP design has been selected as 9.0 MPa. For purposes of providing a decision matrix the equilibrium cycle calculations have been performed for the PBMR-DPP geometry:
DPP Case: 400 MWth; RIT/ROT = 500/900 °C; m = 179 kg/s;

NGNP and Hydrogen Production Preconceptual Design Report NGNP-20-RPT-002 Special Study 20.2 – Prototype Power Level Study
20.2 Prototype Power Level Study January 26, 2007 18 of 65
The following three cases assume a PCU with helium mass flow of 179 kg/s and fixed ROT of 950 °C:
Case 3: 450 MWth; RIT/ROT = 500/950 °C; m = 179 kg/s;
Case 4: 500 MWth; RIT/ROT = 450/950 °C; m = 179 kg/s;
Case 8: 600 MWth; RIT/ROT = 350/950 °C; m = 179 kg/s.
The following three cases assume a fixed RIT/ROT of 350/950 °C:
Case 1: 400 MWth; RIT/ROT = 350/950 °C; m = 119 kg/s;
Case 2: 450 MWth; RIT/ROT = 350/950 °C; m = 134 kg/s;
Case 5: 500 MWth; RIT/ROT = 350/950 °C; m = 149 kg/s.
Two cases were investigated with a single change in geometry, i.e. where the diameter of the fixed central reflector (FCR) is increased from 2.0 m to 2.4 m:
Case 6: 500 MWth; RIT/ROT = 350/950 °C; FCR = 2.4 m;
Case 7: 600 MWth; RIT/ROT = 350/950 °C; FCR = 2.4 m.
The reactivity control and shutdown characteristics in terms of requirements and capability will be somewhat different for the various designs but will only be considered in more detail as the power level and reactor design selection become fixed.
Furthermore, characteristics of the procedure for loading to first criticality, starting up the reactor and run-in will be topics of basic or even detailed design and will not be further discussed in this document. Experience suggests, however, that an equilibrium design will be the prerequisite for a first core layout.
The most important parameters of the coupled neutronics and thermal-hydraulics characteristics were evaluated of the selected spectrum of reactor designs. Originally the cases were selected based on the following criteria:
Maintaining a helium mass flow similar to the PBMR-DPP to ensure minimal change to the PCU.
A RIT/ROT of 350/950°C was assumed to provide a suitable range for the process heat applications and hydrogen production.

NGNP and Hydrogen Production Preconceptual Design Report NGNP-20-RPT-002 Special Study 20.2 – Prototype Power Level Study
20.2 Prototype Power Level Study January 26, 2007 19 of 65
Assume a small change in the fixed central reflector diameter, but with accompanying reduction of the fuel annulus from 0.85 m to 0.65 m. This is easily achievable in a pebble bed reactor with its associated benefits and penalties to be considered.

NGNP and Hydrogen Production Preconceptual Design Report NGNP-20-RPT-002 Special Study 20.2 – Prototype Power Level Study
20.2 Prototype Power Level Study January 26, 2007 20 of 65
20.2.1 PEBBLE BED REACTOR DESIGN REQUIREMENTS AND SELECTIONS
As part of the design of a Pebble Bed Reactor a number of design requirements are important to ensure safe operation and controllability during normal and off normal conditions. Off-normal operating conditions imply the uninhibited release of decay heat. Under these conditions the maximum fuel temperature should not achieve temperatures that would lead to fuel damage.
For normal operation these design requirements include:
Operation within the German LEU fuel test envelope.
Operation to ensure that the maximum fuel temperature is lower than 1250 °C 6.
Maintain inlet temperature to avoid Wigner energy buildup.
Limit velocity through graphite orifices in the reactor core structures to less than 100 m/s.
Ensure that the Core Barrel (CB) and Reactor Pressure Vessel (RPV) material temperature constraints are met.
Utilize Fixed Central Reflector (FCR) to provide RSS insertion location.
Provide control and shutdown in side reflector.
Utilize steel RPV for passive decay heat removal.
During off normal operation the reactor is designed to achieve passive heat removal during Pressurized and Depressurized Loss of Forced Cooling Events (PLOFC and DLOFC) and to ensure that during these off normal operating conditions that the reactor metallic components such as the RPV and CB are maintained within acceptable temperatures. A primary design consideration is the fuel temperature and the aim is to limit the fuel temperatures to acceptable values.
20.2.1.1 Technology Basis
Gas cooled, graphite moderated reactor plants have been developed and constructed during the past 65 years leading to initial commercial deployment of 18 Magnox Plants with a total of 37 reactor units in the UK, France, Japan, Italy and Spain and 8 Advanced Gas Cooled Reactor Plants with a total of 15 reactor units in the UK.
Three developmental High Temperature Gas Reactor (HTGR) plants were constructed and operated in the initial round of deployments during the 1960s. These HTGR plants all used ceramic coated fuel particles with graphite as moderator and helium cooling. These reactors are listed in the table below.

NGNP and Hydrogen Production Preconceptual Design Report NGNP-20-RPT-002 Special Study 20.2 – Prototype Power Level Study
20.2 Prototype Power Level Study January 26, 2007 21 of 65
Reactor Country Power LevelCore
type
Core
outlet
temp [°C]
Date
Critical
Dragon Reactor
ExperimentUK/OECD 20 MWth Prismatic 750 1965
Peach Bottom No.1 U.S.A 115 MWth Prismatic 725 1966
AVR Germany 46 MWth Pebble 850/950 1967
The NGNP design is to be primarily based on the PBMR-DPP technology developed over the past eight years in South Africa. This technology is, however, based on the High Temperature Reactor technology developed over a period of two to three decades in Germany, especially at the Research Centre in Jülich.
In Figure 20.2.1 a depiction is presented of a German experimental reactor, the AVR (ArbeitsgemeinschaftsVersuchsReaktor) in Jülich, that came on-line in December 1967 4, 5. Amongst others, this reactor served as a test bench for a large number of fuel variations (22 in total). During the time of its initial operation the variations in level of enrichment, burnup, heavy metal loading, etc., would lead to relative uncertainty of primary parameters, such as criticality. Motivated by the inter-related parameters of cost, thermal and nuclear loading, a flat radial temperature profile had to be achieved by diluting the fissile packing density from the central area to the outside. This would be achievable by introducing depleted fuel spheres into the centre column area.
Apart from the flat axial power profile achievable under the MEDUL (MEhrfachDUrchLauf = German for multi-pass) fuelling scheme the possibility would be offered of simple correction by adding fuel spheres in the event of sub-criticality and/or de-fuelling in the event of super-criticality, while feeding depleted fuel into the centre fuelling tube would enhance the radial temperature flattening effect.

NGNP and Hydrogen Production Preconceptual Design Report NGNP-20-RPT-002 Special Study 20.2 – Prototype Power Level Study
20.2 Prototype Power Level Study January 26, 2007 22 of 65
Figure 20.2.1: The AVR in Jülich
Two demonstration HTGR plants listed in the table below featuring a pre-stressed concrete reactor vessel and a HEU-Th fuel cycle were also constructed and operated during the 1970s and 1980s.
Reactor Country Power LevelCore
type
Core
outlet
temp [°C]
Date
Critical
Fort St. Vrain U.S.A. 842 MWth Prismatic 775 1976
THTR-300 Germany 750 MWth Pebble 750 1985

NGNP and Hydrogen Production Preconceptual Design Report NGNP-20-RPT-002 Special Study 20.2 – Prototype Power Level Study
20.2 Prototype Power Level Study January 26, 2007 23 of 65
The German prototype reactor, the THTR-300, depicted in Figure 20.2.2, was constructed between the period 1972 to 1984. It achieved its layout power output of 300 MWe towards the end of 1985. A unique feature deployed in the THTR had been the use of in-core control rods for neutronic control and reactor shut down. This characteristic, however, bore the uncertainty of thermal-hydraulic and neutronic behavior, associated with the phenomenon of pebble bed (675,000 fuel elements) compaction following the insertion activity of the in-core rods. Once again, the choice of MEDUL fuelling offered a welcome solution in providing a pebble bed which would be effectively rearranged in accordance with the multiple passage of fuel through the core. Furthermore, the same radial temperature flattening arguments used in the case of the AVR were employed in the safety philosophy of the THTR. The MEDUL scheme would thus be equally effective in achieving this goal.
Figure 20.2.2: The THTR-300 Reactor in Hamm-Uentrop

NGNP and Hydrogen Production Preconceptual Design Report NGNP-20-RPT-002 Special Study 20.2 – Prototype Power Level Study
20.2 Prototype Power Level Study January 26, 2007 24 of 65
HTGR development in Germany and the USA throughout the 1970s was focused on large HTGR steam cycle plant designs. In the USA, there were five twin plant orders for such HTGR units, which ranged from 770 MWe to 1160 MWe. Licensing with the NRC had advanced to the issuance of a Limited Work Authorization for one of the contracts. However, three of the contracts were canceled by the utility due to an economic recession and the remaining two contracts were then terminated by the vendor as the outlook for commercial deployment had faded.
In the early 1980s, the Germans introduced the Modular HTGR concept as an alternative approach to optimizing HTGRs based on inherent safety characteristics of the fuel, graphite and helium plus passive design features derived from a reduced core power level such that a passive cooling system will preclude fuel damage for the limiting licensing basis events. As a result, a paradigm shift for HTGR development has evolved whereby competitiveness relies on capitalizing on the enhanced safety features to reduce the safety and regulatory demands on capital and O&M costs plus capitalize on the economies of simplicity and incremental, modular deployment and close-in siting – all which are best suited for the small-to-medium power and process heat markets.
In the 1980s, Germany, Russia and the USA developed designs of the steam cycle Modular HTGR. These all featured steel reactor vessels which were embedded or partially embedded below grade. Leading designs are noted in the table below, but none were constructed. However, the HTR-Module achieved a concept license from the German regulator.
Reactor Country Power Level Core type
HTR-MODUL Germany 200 MWth Pebble
MHTGR USAInitially 250 MWth, upgraded to 350 MWth and then to 450 MWth
Prismatic
VGM Russian 200 MWth Pebble
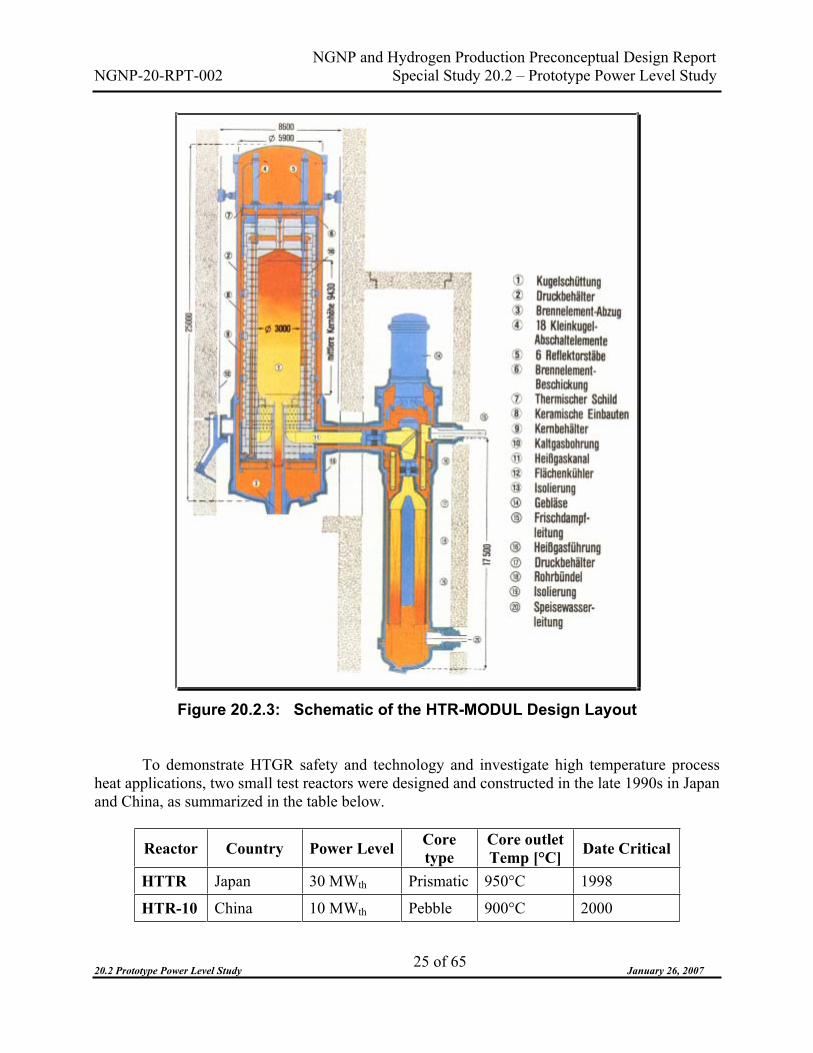
In Figure 20.2.3 the HTR-MODUL steam cycle conceptual design is schematically depicted. Though not constructed this concept was licensed by Siemens in 1987 7. Based on the premise that the thermal evacuation capability of the pressure vessel should exceed the decay heat production of the core in the post event condition, Lohnert and Reutler in 8 proposed a cylindrical core layout with height: diameter ratio of 3:1. In this layout it is of prime importance to achieve a relatively flat axial core power distribution. At the time of its inception the only known fuelling scheme that would guarantee such a power profile was the MEDUL fuelling regime.
NGNP and Hydrogen Production Preconceptual Design Report NGNP-20-RPT-002 Special Study 20.2 – Prototype Power Level Study
20.2 Prototype Power Level Study January 26, 2007 25 of 65
Figure 20.2.3: Schematic of the HTR-MODUL Design Layout
To demonstrate HTGR safety and technology and investigate high temperature process heat applications, two small test reactors were designed and constructed in the late 1990s in Japan and China, as summarized in the table below.
Reactor Country Power LevelCore
type
Core outlet
Temp [°C] Date Critical
HTTR Japan 30 MWth Prismatic 950°C 1998
HTR-10 China 10 MWth Pebble 900°C 2000

NGNP and Hydrogen Production Preconceptual Design Report NGNP-20-RPT-002 Special Study 20.2 – Prototype Power Level Study
20.2 Prototype Power Level Study January 26, 2007 26 of 65
During the 1990s and up to now, HTGR designs and technology development have continued to advance in the RSA, USA, Russia, France, Japan, China and elsewhere with predominate focus on commercial-scale deployment. Interests in further small-scale HTGR deployment are limited to universities and institutes seeking a mission in technology development, testing and training. Albeit of the long-term value, such interests can distract the focus of limited government resources in support of near-term, commercial-scale deployment. In addition, there are budget-driven considerations of being able to achieve commercial scale deployment objectives with a reduced scale, but scaleable, demonstration project. The PBMR position on such follows.
PBMR-DPP Technology Development Path
The initial conceptual design of the PBMR reactor was for a core power of 200 MWth,which was the chosen power level for the German HTR-Modul reactor designed by the HTR GmbH consortium. The HTR-Modul had a core diameter of 3.0 m with a core height of 9.4 m, and a steam generating secondary cycle. The PBMR chose a direct-cycle gas turbine plant with higher core inlet and outlet temperatures (RIT/ROT = 500/900 °C) than the HTR-Modul (RIT/ROT = 250/700 °C) plant. The core geometry of the HTR-Modul with its adapted thermal hydraulic flow path would allow a power level of only 170 MWth when coupled directly to a gas turbine power generating system as described above. After introducing an adapted core fueling strategy to achieve a 2-zone core layout the power level was increased to 190 MWth. In order to increase the thermal power output of the reactor, the core volume had to be increased. Without increasing the core height and power density, it implied that the diameter of the core had to be increased.
It was also a design objective that the control elements would only be located in the reflector. To ensure sufficient reactivity coupling with the active core, an increase in the diameter of the core to 3.5 m necessitated the use of the so-called reflector noses (similar to the AVR core design). These noses were protrusions of the reflector into the active core with the control elements operating in borings close to the front part of the noses as per the German AVR design. This concept permitted an increase in power to 220 MWth.
In February 1998 it was decided that an annular core geometry would be pursued. A core geometry consisting of a dynamic central reflector with a nominal diameter of 1.75 m of graphite spheres moving as part of the core was chosen. The core outer diameter was fixed at 3.5 m and the effective core height was set at 9.0 m. This design yielded a power level of 268 MWth. In the 268 MWth reference design, the reactor pressure vessel was approximately 6.2 m in diameter, approximately 20.5 m high. The core cavity had a diameter of 3.5 m and an effective height of 8.5 m.
From the initial cost estimates obtained from the suppliers of main components, it was clear that the capital cost of the nth plant exceeded the initial targets. A Value Engineering Investigation was initiated to determine the extent to which the power could be upgraded within the general physical envelope of the 268 MWth reference design. It was found that the core

NGNP and Hydrogen Production Preconceptual Design Report NGNP-20-RPT-002 Special Study 20.2 – Prototype Power Level Study
20.2 Prototype Power Level Study January 26, 2007 27 of 65
thermal power could be increased to 302 MWth within the same reactor pressure vessel inside diameter by increasing the core effective height from 8.5 m to 9.04 m. The thickness of the outer reflector and thermal shield was reduced to a total thickness from 1.0 m to 0.9 m, since the optimum reflector capabilities from a neutronics design perspective would be acceptable.
Following this investigation, further in-depth nuclear source term analyses showed that the core coolant bypassing the active core through the core structures and the graphite dynamic central reflector was on the order of 48 percent. Of this value, the leakage through the dynamic central reflector amounted to 28 percent. This bypass resulted in an increase of approximately 150 °C in the maximum operating fuel temperature. Since the diffusion coefficient of the fission products silver and cesium through intact coatings surrounding the fuel kernel is strongly dependent on the temperature, this increase in operating fuel temperature resulted in an increase of such releases during normal operation by two to three orders of magnitude compared to the 268 MWth reference design. Further investigations confirmed that the increased silver and cesium releases would result in contamination that would necessitate the use of remote handling equipment during maintenance operations on PCU components.
As stated before, the initial decision to implement the dynamic central reflector design was based on limited knowledge of the behavior of the graphite core structures under irradiation. At this stage, more insight into the graphite behavior were becoming available, and it was clear that the core structures design had to provide for a mid-life replacement of the outer reflector part adjacent to the active core.
An opportunity was then provided for considering a core with a fixed central reflector of a design that provides for mid-life replacement of the part adjacent to the active core. The outcome of this investigation was a core with the following characteristics:
Core outer diameter of 3.7 m, a fixed central reflector with a diameter of 2.0 m and an effective nominal height of 11 m. A core thermal power of 400 MWth.
An additional core physics benefit gained from the use of a solid central reflector was the possibility to include reactivity control elements in the central reflector. It was then decided to redesign the placement of these elements with the objective of matching or improving on the shutdown capability of the previous 268 MWth reference design.
Hence, 400 MWth is the power level for the PBMR-DPP and is the baseline case for the Process Heat Plant power level study, leading to the selected NGNP power level of 500 MWth.
PBMR-DPP Technology Growth Path
The PBMR technology path has substantial potential beyond the initial PBMR-DPP capabilities to be applied in early deployments for process heat and electrical generation. The technology growth path is a direct application of the PBMR-DPP from a physical building,

NGNP and Hydrogen Production Preconceptual Design Report NGNP-20-RPT-002 Special Study 20.2 – Prototype Power Level Study
20.2 Prototype Power Level Study January 26, 2007 28 of 65
support systems and equipment layout perspective, and a logical development in high-temperature materials, turbo-machinery evolution and advanced fuels within the same physical boundaries.
Beyond the near-term PBMR-PH deployment, the eventual design goal is to increase the reactor outlet temperature (ROT) to 1000 °C and beyond plus increase the reactor power level to ~600 MWth with design development and additional R&D. To accommodate the higher reactor power level and the increased ROT, ceramic based materials will have to be investigated to be used for a number of components such as the hot duct liners of the hot pipes and the control rods.
Basic to the design development, bounded by the points mentioned above, were the development of a fuel concept with enriched uranium and the selection of a favorable coolant, such as helium.
Figure 20.2.4: TRISO Coated Fuel Particle
The main characteristic of the HTR fuel development is the many small fuel particles, each of which is surrounded by a porous buffer layer and two pyrolytic carbon layers. In Figure 20.2.5 the fuel particles embedded within a graphite matrix are seen. The latest development, the so-called TRISO coated particle (depicted in Figure 20.2.4), denotes the inclusion of a highly refractory silicon carbide layer positioned between two pyrolytically deposited carbon layers. The

NGNP and Hydrogen Production Preconceptual Design Report NGNP-20-RPT-002 Special Study 20.2 – Prototype Power Level Study
20.2 Prototype Power Level Study January 26, 2007 29 of 65
layers form a strong barrier against the release of fission products from within the coated particle. During heat-up experiments performed at the Research Center, Jülich during the fuel development program throughout the sixties, seventies, and eighties, emphasis was placed on maintaining intact fuel particles up to 1600 ºC. In addition limited tests were run in the range of 1600 ºC to 2000 ºC with generally favorable results.
After burnup of the fuel the pebble configuration provides an excellent packaging of the radio-active waste material (see Figure 20.2.5).
HTR PEBBLE CROSS-SECTION CUT-AWAY COATED PARTICLE
Figure 20.2.5: HTR Pebble Fuel Layout
NGNP and Hydrogen Production Preconceptual Design Report NGNP-20-RPT-002 Special Study 20.2 – Prototype Power Level Study
20.2 Prototype Power Level Study January 26, 2007 30 of 65
20.2.1.2 Safety Characteristics
Five special features characterize the reactor neutron physics and thermal hydraulics layout of the PBMR-DPP:
The temperature coefficient comprises the temperature-dependent resonance absorption of U-238, the moderator, and the reflector regions, which includes the fixed central reflector. This coefficient is strongly negative, despite the slight positive reactivity contribution of the reflector due to the decreased absorption cross-section of graphite with increased temperature.
In normal operation, this effect stabilizes the chain reaction. If the fuel is heated, during normal operation or in an upset event, the enhanced neutron absorption causes the chain reaction to decay. This inherent property of control is independent of the physical operation of reactor equipment, because it is solely based on the inherent characteristics embedded in the specific reactor physics.
The core is annular with a graphite reflector on the outside and a graphite reflector on the inside.
The reactivity control and reserve shutdown elements used in this design are located in the side reflector and fixed central reflector regions, respectively (See Figure 20.2.9).
In the PBMR-DPP Brayton cycle design, a limited amount of cooling water provides heat removal at pressures lower than the main operating system pressure at all times during operation. A reactivity excursion resulting from accidental water ingress into the core region is therefore limited due to the design.
Residual heat can be removed solely by thermal conduction, thermal radiation and natural convection to a Reactor Cavity Cooling System (RCCS) outside the Reactor Pressure Vessel (RPV) in all operating and upset conditions. The fuel temperature is limited by suitable core design to remain at all times below the maximum allowable fuel temperature.
In the reactor, the central reflector comprises of graphite only. In this way the thermal flux is forced towards the side reflector, with the following two associated advantages:
It increases the efficiency of the Reactivity Control and Shutdown System (RCSS), which is located in the side reflector.
The maximum fuel temperature is lower in the event of a DLOFC. This is due to the fact that the decay heat travels a shorter distance from the fuel through the reflector to the outside, via passive transport mechanisms (conduction and radiation).
For reasons of safety, the fuel temperature must under all postulated events, be kept below a predefined temperature limit.

NGNP and Hydrogen Production Preconceptual Design Report NGNP-20-RPT-002 Special Study 20.2 – Prototype Power Level Study
20.2 Prototype Power Level Study January 26, 2007 31 of 65
20.2.2 PBMR-DPP DESIGN APPROACH AND SELECTIONS
20.2.2.1 PBMR-DPP Reactor
The PBRM-DPP reactor has a power level of 400 MWth with a reactor inlet temperature (RIT) of 500 °C and a reactor outlet temperature (ROT) of 900 °C. The average power density of the PBMR-DPP is 4.77 MW/m3. Given the RPV size the highest power level was selected for a direct cycle gas turbine with a RIT/ROT of 500/900 C. The maximum fuel temperature during a DLOFC would determine the maximum power level at which the reactor would operate long term.
The PBMR-DPP (as shown in Figure 20.2.6) design approach was to consider the largest available RPV at the time that could be manufactured by more than one company to reduce the risk of single supply. An inner diameter of 6.2 m for a RPV designed to operate under a pressure of 9.0 MPa would require a wall thickness of 0.18m. This specification determined the size of the construction crane to be available.
The Core Barrel has an inner diameter of 5.8m with a wall thickness of 0.05 m and is manufactured using 316 stainless steel to ensure core stability.

NGNP and Hydrogen Production Preconceptual Design Report NGNP-20-RPT-002 Special Study 20.2 – Prototype Power Level Study
20.2 Prototype Power Level Study January 26, 2007 32 of 65
Figure 20.2.6: PBMR-DPP Design
Figure 20.2.7 shows a layout of the PBMR-DPP internals. The reactor internals consist of a side reflector, shown in more detail in Figure 20.2.8, that comprise an inner block of thickness 0.4m and an outer block of thickness 0.5 m. The inner blocks house 24 RCS channels and the outer blocks 36 riser channels feeding helium into the core cavity. The replacement limit of the inner reflector is equivalent to a fast neutron fluence of 2.2x10²² at 800 °C. The 0.90 m thickness of the side reflector (0.775 m solid thickness) is the optimal thickness with regards to neutron economy and capital cost. The reflector blocks are kept in position by the core barrel.

NGNP and Hydrogen Production Preconceptual Design Report NGNP-20-RPT-002 Special Study 20.2 – Prototype Power Level Study
20.2 Prototype Power Level Study January 26, 2007 33 of 65
6
89
7
4
10
11
3
1
2
233
08
5
Figure 20.2.7: Description of the PBMR-DPP Internals
No. Component
1 Core support structure – Engineered for support of the fixed central reflector
2 Expansion compensator – compensate for thermal expansion of the bottom plate
3 Bottom reflector – designed to house the hot gas chamber and slots for exiting helium
4 Fuel discharge cone – min. angle of 23 °C to prevent pebble blockage 5 Core barrel sides – for fixing the CB and to hold in position 6 Side reflector (inner and outer) 7 Centre reflector 8 Top reflector – designed for helium inlet flow, shielding of the top metallic components
9 Core barrel top plate helps to maintain structural integrity 10 Main inlet plenum – helium into riser channel in side reflector (due to high
temperatures in direct cycle) 11 Main outlet plenum – hot helium outlet

NGNP and Hydrogen Production Preconceptual Design Report NGNP-20-RPT-002 Special Study 20.2 – Prototype Power Level Study
20.2 Prototype Power Level Study January 26, 2007 34 of 65
The annular core cavity has a thickness of 0.85 m and is charged from the top reflector region through three loading points. The annular core thickness ensures that there are no azimuthal Xenon swings in the reactor and that reactivity control is possible from the side reflector. The bottom reflector region houses three discharge tubes.
Outer side reflector sealing
keys
Inner reflector
Outer reflector
Inner reflector dowel
Riser channel
Seismic restraint location
Inner reflector keys
Control rod boring
Control rod sleeve
Inner to outer
reflector lock
Figure 20.2.8: Side Reflector Regions of the PBMR-DPP
Figure 20.2.9 shows the layout of the fixed centre column. The FCR has a diameter of 2.0 m and its design is optimized for coupled Thermal-Hydraulics and Neutronic performance as well as Safety. The FCR houses the Reactivity Shutdown System channels.

NGNP and Hydrogen Production Preconceptual Design Report NGNP-20-RPT-002 Special Study 20.2 – Prototype Power Level Study
20.2 Prototype Power Level Study January 26, 2007 35 of 65
Figure 20.2.9: Layout of the FCR
The PBMR-DPP has an effective core height of 11.0 m, with the height/diameter (H/D) ratio of 2.97. Table 20.2.1 provides an overview of the PBMR-DPP reference and calculated performance data.
Table 20.2.1: Overview of PBMR-DPP Reference and Performance Data
Description Units PBMR-DPP
Design Parameters:
Thermal power rating MW 400 Core diameter m 3.7 Average core height m 11.0 Uranium content per fuel sphere g/FS 9 Average burn-up MWd/t U 94 800 Fuelling regime Multiple passage (6x) Average residence time in- core d 954 Assumed cold by-pass flow % 7* Number of fuelling zones 1 Moderation ratio (avg. in core) NC/NU 428 Avg. packing fraction in the pebble bed % 61 Number of fuel spheres 451 562 Fuel spheres:
Pebble radius cm 3.0
RSS channel
Grade NGB18block
NBG18 block
Surfacecoolant flow
slots
NBG18 block
Centre coolantchannel
InterlockingkeysDowels
NBG18 block
Inspectionchannels
Centre coolantchannel gas
entry

NGNP and Hydrogen Production Preconceptual Design Report NGNP-20-RPT-002 Special Study 20.2 – Prototype Power Level Study
20.2 Prototype Power Level Study January 26, 2007 36 of 65
Description Units PBMR-DPP
Design Parameters:
Thickness of fuel free zone cm 0.5 Density of graphite in matrix / fuel free zone g/cm3 1.75 Enrichment of uranium (NU5/NU) % 9.6 Coated particles:
Particle diameter m 500CP Density g/cm3 10.4 Coating material C / C / SiC / C Layer thickness m 95 / 40 / 35 / 40 Layer densities g/cm3 1.05 / 1.90 / 3.18 / 1.90
Note: *The cold by-pass flow is comprised of 3 percent core barrel annulus leakage of the main inlet flow and 4 percent of the main flow directly leaking from the inlet to the outlet chamber.
The six-fold recycling of each fuel sphere through the core results in a variation in average burn-up from top to bottom of the core of approximately 15,833 MWd/t U, and therefore maintains the maximum power density to within design limits. The power is also limited in the upper region of the core by the 24 control rods that are partially inserted into the side reflector during full-load operation. The power density distribution is provided as a power profile in a typical position as modeled in VSOP-A. This profile is expressed as the power produced in a layer divided by the average power produced in the core [see Figure 20.2.10].
0
0.5
1
1.5
2
2.5
0 200 400 600 800 1000 1200
Axial Position [cm]
Po
we
r [L
ay
er/
Av
g]
Figure 20.2.10: Axial Power Profile in the PBMR-DPP Fuel Channel #1

NGNP and Hydrogen Production Preconceptual Design Report NGNP-20-RPT-002 Special Study 20.2 – Prototype Power Level Study
20.2 Prototype Power Level Study January 26, 2007 37 of 65
20.2.2.2 PBMR-DPP Fuel
The spherical PBMR fuel element is cold pressed from matrix graphite, which is a mixture of natural graphite, electrographite, and a phenolic resin that acts as binder. It consists of an inner region that contains fuel in the form of spherical coated particles embedded in the matrix graphite. A shell of matrix graphite that does not contain any fuel surrounds the inner region.
A coated particle consists of a spherical uranium dioxide kernel surrounded by four concentric coating layers. The first layer surrounding the kernel is a porous pyrocarbon layer, known as the buffer layer. An inner high-density pyrocarbon layer, a silicon carbide layer, and an outer high-density pyrocarbon layer follow this layer. The layers are deposited sequentially by dissociation of gaseous chemical compounds in a continuous process in a fluidized bed.
Figure 20.2.11 shows the design of the PBMR fuel sphere. Nominal characteristics for a PBMR fuel sphere are shown in Table 20.2.2.
Figure 20.2.11: PBMR Fuel Design

NGNP and Hydrogen Production Preconceptual Design Report NGNP-20-RPT-002 Special Study 20.2 – Prototype Power Level Study
20.2 Prototype Power Level Study January 26, 2007 38 of 65
Table 20.2.2: PBMR-DPP Fuel Data
Characteristic Unit Nominal Value
Fuel Sphere:
Geometry - Spherical Fuel sphere diameter mm 60 Fuel region diameter mm 50 Fuel-free region thickness mm 5 Heavy metal loading g/FS 9
Uranium enrichment % U-235 9.6 (equilibrium core)
Coated Particle:
Kernel diameter m 500Buffer layer thickness m 95Inner Low Temperature Isotropic (ILTI) layer thickness m 40SiC layer thickness m 35Outer Low Temperature Isotropic (OLTI) layer thickness
m 40

NGNP and Hydrogen Production Preconceptual Design Report NGNP-20-RPT-002 Special Study 20.2 – Prototype Power Level Study
20.2 Prototype Power Level Study January 26, 2007 39 of 65
20.2.3 APPROACH TO NGNP POWER LEVEL
20.2.3.1 Overview of Design Approach
An early decision taken is to employ the knowledge and understanding gained from the PBMR-DPP reactor and fuel design as far as possible. Due to the fact that for purposes of the process heat application the RIT/ROT temperature regime will be changed from 500/900 °C to 350/950 °C the opportunity is created to employ the full energy range. This implies using the top end of the energy range for process heat [about 750 – 950 °C], whilst the lower end can be used for generating power/electricity [about 350 – 750 °C].
Regarding the use of pebble fuel it was decided to assume the German LEU fuel test envelope during normal operation. This implies that during normal operation the design should be within the fluence-temperature dependent burn-up envelope and that the maximum fuel temperature should be maintained below1250 °C.
Any deviations from the PBMR-DPP reactor or fuel design would result in additional R&D or design development. In order to address the R&D and design development the requirements were classified according to the following criteria: No R&D or design development, Minimal R&D and design development and Modest R&D and design development.
For the reactor power output the discriminating decision is to use the largest reactor power without any additional R&D or design development beyond the PBMR-DPP design. This implies that the current PBMR-DPP reactor geometry is used as is with varying RIT/ROT while maintaining the maximum fuel temperature below 1600 °C during DLOFC conditions.
For the cases with Minimal R&D and design development (i.e., some fuel qualification), the PBMR–DPP geometry was adopted as is and the maximum fuel temperature during a DLOFC event was kept below 1700 °C for a limited time during the DLOFC event. This would result in some fuel qualification for temperatures below 1700 °C.
For the cases with Modest R&D and design development the maximum fuel temperatures were maintained below 1700 °C for limited times during DLOFC and the outer reactor diameters were maintained while increasing the FCR thickness from 2.0 to 2.4m to lower the maximum fuel temperatures during DLOFC conditions. This change in FCR diameter will impact the design for the fuel chutes and possibly other reactor components.
20.2.3.2 Design Selections That Influence Core Power
The core power level is directly proportional to the product of the mass flow rate, specific heat capacity of the working medium, and the rise in temperature over the core. Of prime consideration in the design of the reactor are the maximum and average temperatures achievable by the fuel as well as the metallic components. Since the reactor structural components are of ceramic materials much higher temperatures are tolerable than for the metallic components.

NGNP and Hydrogen Production Preconceptual Design Report NGNP-20-RPT-002 Special Study 20.2 – Prototype Power Level Study
20.2 Prototype Power Level Study January 26, 2007 40 of 65
The design selection parameters influencing the core power level are classified as follows:
During normal operation the following parameters are of importance:
Mass flow rate – This parameter determines the amount of heat that will be transported from the heat source. In a pebble bed reactor the pressure drop over the core will determine the blower power that will in turn be supplied from the grid.
Core temperature rise – The mass flow rate and temperature rise or heat-up over the core are directly proportional to each other, since the specific heat capacity of helium almost remains constant over the specific temperature regime. If the heat-up over the core becomes smaller, for example, the mass flow rate will increase for the same power level.
Maximum and average fuel temperatures – As the mass flow rate changes over the core the maximum and average fuel temperature in the core will change accordingly. A certain minimum mass flow rate needs to be maintained to ensure that the correct fuel temperatures can be derived in the pebble bed core, since fuel temperatures are only induced.
During a PLOFC event, natural circulation will be induced due to the pressure
within the reactor. In a direct cycle the pressure will reduce to a level of equalization, but in
the case of the NGNP the pressure is anticipated to remain constant as it is foreseen that the
NGNP will be an indirect coupled plant. In this event the following parameters are of
importance:
Metallic reactor internals time-at-temperature – The core barrel, RPV, and control rod cladding are the metallic components that need to be carefully considered from a design perspective. According to the ASME rules certain limits are applicable for specific stresses. These rules need to be observed, in particular during off-normal operational conditions due to thermal or mechanical loads. Other rules are also applicable for special designs, such as the hot pipes exiting the reactor.
Reactor vessel time-at-temperature – The RPV is designed according to ASME III rules as a usual reactor pressure vessel. During normal operation the temperatures are maintained within limits known by experience as a function of the fast fluence.
During a DLOFC event the pressure is reduced to ambient conditions. In the design
of the reactor the decay heat is considered to be released without the credit of a decay heat
removal system. Here the balance between the heat removal capacity of the reactor
internals, RPV, and the reactivity core cooling system (RCCS) is calculated. The design of
the reactor is performed to minimize the loss of heat during normal operation but to
maximize the loss of heat during a DLOFC in order to protect the integrity of the fuel. In
the complex series of calculations the following parameters are considered:
Maximum fuel time-at-temperature which is influenced by

NGNP and Hydrogen Production Preconceptual Design Report NGNP-20-RPT-002 Special Study 20.2 – Prototype Power Level Study
20.2 Prototype Power Level Study January 26, 2007 41 of 65
o Effective outer core diameter determined by:
Vessel diameter, shipping weight, and supplier infrastructure.
o Emissivities of the graphite and metallic components influencing the heat radiation.
o Effective core height determines:
Core pressure drop.
Axial neutronic stability.
Center reflector structural design.
o Annular active core thickness.
Control rod effectiveness.
o Thermal conductivity of the fuel and reflector graphite as a function of fast fluence and temperature.
o Power density.
o Normal operation average fuel temperatures.
Metallic reactor internals time-at-temperature – Similarly to the PLOFC case the ASME rules need to be observed, but for DLOFC pressure and temperature conditions applied.
Reactor vessel time-at-temperature – The ASME rules apply for temperatures achieved at ambient pressure.
20.2.3.3 Evaluation Scope
Table 20.2.3 provides a listing of the power level cases under consideration for this study according to the above mentioned classification of:
No R&D;
Minimal R&D, and
Modest R&D.
The mass flow rates shown in the table are based on 93 percent of the total mass flow in the system which makes provision for leak flows through the core structures that bypass the actual pebble bed core.

N
GN
P a
nd H
ydro
gen
Pro
duct
ion
Pre
conc
eptu
al D
esig
n R
epor
t N
GN
P-2
0-R
PT
-002
S
peci
al S
tudy
20.
2 –
Pro
toty
pe P
ower
Lev
el S
tudy
20
.2 P
roto
typ
e P
ow
er L
evel
Stu
dy
Ja
nu
ary
26
, 2
007
42 o
f 65
Ta
ble
20
.2.3
: C
ase
s -
Po
wer
Lev
el C
on
fig
ura
tio
n
No R
&D
M
inim
al
R&
D
Mod
est
R&
D
Pa
ram
eter
(lim
it)
Un
its
PB
MR
-
DP
P
Case
1C
ase
2C
ase
3
Case
4C
ase
5C
ase
6C
ase
7C
ase
8
Pow
er l
evel
M
Wth
400
400
450
450
500
500
500
600
600
FC
R
m
2.0
2.0
2.0
2.0
2.0
2.0
2.4
2.4
2.0
RIT
/RO
T
°C
500/
900
350/
950
350/
950
500/
950
450/
950
350/
950
350/
950
350/
950
350/
950
Mas
s fl
ow
kg/s
17
9 11
9 13
4 17
9 17
9 14
9 14
9 17
9 17
9

NGNP and Hydrogen Production Preconceptual Design Report NGNP-20-RPT-002 Special Study 20.2 – Prototype Power Level Study
20.2 Prototype Power Level Study January 26, 2007 43 of 65
20.2.4 SIMULATION TOOLS AND INPUT DATA
20.2.4.1 VSOP-A Description
VSOP-A is a computer code system for the comprehensive numerical simulation of the physical processes of thermal reactors 1. It implies setting up the reactor and its fuel elements, processing of the relevant cross-sections, evaluating the neutron spectrum, and performing the neutron diffusion calculation in two or three dimensions, while fuel burnup, fuel shuffling, reactor control, thermal hydraulics and fuel cycle costs are continuously performed as per input definition. The thermal hydraulics part (steady state and time-dependent) is restricted to HTRs and in two spatial dimensions. The code can simulate all phases of reactor operation from the initial towards the equilibrium phases.
In VSOP-A the mass, momentum and energy are conserved and the balance of the gradient of pressure, the hydrostatic force of gravity, and the frictional force are calculated per unit volume. Thermal and effective conductivities are calculated as functions of temperature and fluence. Radiation is accounted for via emissivity of graphite, CB and RPV.
VSOP-A enables the designer/analyst to simulate and analyze the reactor life from the initial core loading, start-up, run-in, and towards the equilibrium core conditions. Repeated calculation of the different physics and coupled thermal-hydraulic features ensures consistency in their feedback during the proceeding burn-up, the simulation of the fuel shuffling, and variations in the core power rating. Transients can be simulated in a quasi-static nuclear approximation by repeated criticality evaluation. Characteristics of the life history of the fuel elements are used to calculate the decay power distribution.
An evaluation of fuel cycle costs over the reactor life is done using the present worth method. Reprocessing and closure of the fuel cycle can be simulated by consistent control of the fuel inventory, while including the isotopic decay during periods of intermediate storage.
The status of the reactor at the end of each calculation can be saved and used as input to new investigations, whilst calculated reactor data may be used subsequently for the purpose of joint evaluations, i.e. with third party codes beyond the capability of VSOP-A.
Even though VSOP-A has been used to analyze all operating thermal reactors to date it has been applied most widely in the area of graphite moderated, high temperature reactors, with both pebble and prismatic fuel types. For these reactor types extensive test data exists.
The burn-up calculations in VSOP-A include the essential nuclides for both the U-Pu and the Th-U fuel cycles. Validation studies for the AVR, THTR, and the Fort St. Vrain reactors have been performed for the thorium cycle, while studies on the HTR-MODUL, LWR, RBMK, and MAGNOX reactors describe the burn-up characteristics of the uranium cycle. The VSOP-A system of codes has proven to be a suitable tool for analyzing these operating reactors, albeit for different fuel cycles.

NGNP and Hydrogen Production Preconceptual Design Report NGNP-20-RPT-002 Special Study 20.2 – Prototype Power Level Study
20.2 Prototype Power Level Study January 26, 2007 44 of 65
The VSOP system of codes has been subjected to validation throughout an extended period of decades 12. Validation has been done against critical experiments, such as:
The CESAR-II experiment at CEN Cadarache, France for cold, equilibrium neutronics;The KAHTER critical experiment at FZJ, Jülich, Germany for cold, equilibrium neutronics;The PROTEUS critical experiment at PSI, Villingen, Switzerland for cold, equilibrium neutronics; The IAEA CRP-1 for small pebble bed facilities for cold, equilibrium neutronics; The IAEA CRP-1 for small pebble prismatic block-type facilities for cold and hot, equilibrium neutronics and temperature coefficients; The IAEA CRP-5 initial core calculations of the Japanese HTTR prismatic block-type reactor for cold, equilibrium neutronics; The IAEA CRP-5 initial core calculations of the Chinese HTR-10 pebble bed reactor for cold, equilibrium neutronics and hot transient analysis.
The VSOP system of codes has also been validated in Germany in a licensing process for: The 200 MWth Siemens MODUL pebble bed reactor for neutronics, coupled thermal-hydraulics, and burn-up.
Furthermore, the VSOP system of codes has been compared in code-to-code validation against the SIEMENS ZIRKUS system of codes. The TÜV in Hannover, Germany has also used the VSOP system of codes to check the validity of the ZIRKUS system of codes.
The VSOP system of codes is also accepted by SIEMENS as one of the code systems to calculate the LWRs in Germany.
20.2.4.2 Steady State Comparison between VSOP-A and TINTE
In Table 20.2.4 results are tabulated between the TINTE code used to simulate transient operations and the VSOP-A code used for the quasi steady-state operation of PBMR-DPP. Values correspond mostly within 5 percent of each other, which is excellent except for a larger variation for the maximum RPV temperature.
Whereas VSOP-A is the system of codes used to perform the coupled neutronics and thermal-hydraulics design of pebble bed reactors, TINTE is an independent code which uses the isotopic distribution and the calculated fluences of VSOP to calculate time and spatially dependent transients using the transferred data as the initial condition. The comparison of calculated fuel temperatures between VSOP and TINTE provides a level of confidence in the results produced.

NGNP and Hydrogen Production Preconceptual Design Report NGNP-20-RPT-002 Special Study 20.2 – Prototype Power Level Study
20.2 Prototype Power Level Study January 26, 2007 45 of 65
Table 20.2.4: VSOP-A and Tinte Steady-State Results
TINTE VSOP-A
Tmax Fuel °C 1083 1073
Tavg Fuel °C 869 830
ROT °C 897 927 Tmax CB °C 397 414
Tmax RPV °C 271 310
P core kPa 209 218
20.2.4.3 DLOFC Data Comparison between VSOP-A and TINTE
Due to the complexities involved in the design of a pebble bed reactor it is important to build a level of confidence in the results produced by the system of design codes. During the times that the VSOP system of codes was developed at the Research Centre, Jülich it became necessary to develop a code to perform short term transients specifically for pebble bed reactors. In the approach followed by VSOP it is important to consider the decay and build up of isotopes (burnup), while these are of no consequence in a transient calculation. The difference in approach between the VSOP and TINTE solutions warranted two, different numerical approaches.
Even though VSOP-A is mainly used for the design of the PBMR-DPP neutronics and the decision within PBMR was taken to deploy the TINTE results for purposes of the SAR of the PBMR-DPP, VSOP-A can equally well predict the DLOFC and PLOFC temperatures of pebble bed reactors, since the THERMIX thermal-hydraulics code is integrated in the quasi-steady state codes system. The transients stretch over a prolonged period and can thus be predicted with a large level of confidence (see Table 20.2.5).
Table 20.2.5: VSOP-A and Tinte DLOFC Results
TINTE VSOP-A
Tmax Fuel °C 1567 (46h) 1499 (45h)
Tmax CB °C 588 (56h) 579 (48h)
Tmax RPV °C 430 (59h) 419 (56h)

NGNP and Hydrogen Production Preconceptual Design Report NGNP-20-RPT-002 Special Study 20.2 – Prototype Power Level Study
20.2 Prototype Power Level Study January 26, 2007 46 of 65
20.2.5 DISCRIMINATING CRITERIA
A specific requirement of the preliminary design of the NGNP has been the possible deployment in the near term. This implies that the design development of plant components, fuel enhancement or re-evaluation of existing data, and the schedule for necessary R&D should be basic to the immediate deployment of the NGNP. Furthermore, the reactor has to adhere to all the safety considerations of GEN IV reactors, in particular that of the PBMR-DPP reactor. In addition the overall cost must be competitive with other supply side options. Particular consideration should however, be given to the enhanced safety offered by this type of nuclear plant, its deployment wherever the need exists, i.e. by omitting large overland transmission considerations, and finally the short construction period offered, thus allowing for deployment whenever the need for it arose.
Table 20.2.6 provides a listing of the criteria for selecting a suitable power level for the NGNP reactor. Every parameter has been weighted according to the perceived level of importance it has on the decision making process.
Table 20.2.6: Discriminating Criteria
Criteria Relative weight
Readiness Technology enabling R&D (including fuel) High Design development and schedule High
Performance Normal operation Medium Investment protection (PLOFC) Medium Safety consideration (DLOFC) High
Cost Capital cost (reactor, etc.) High Operating cost (including fuel cycle costs) Medium
A high relative weight is given in the table of discriminating criteria to distinguish the level of importance awarded to the ability to immediately deploy the technology. In the design safety considerations and cost are of paramount importance, yet the operating cost is deemed to be only of medium importance.

NGNP and Hydrogen Production Preconceptual Design Report NGNP-20-RPT-002 Special Study 20.2 – Prototype Power Level Study
20.2 Prototype Power Level Study January 26, 2007 47 of 65
20.2.6 EVALUATION, RESULTS AND COMPARISON
In this section the results of the VSOP-A coupled thermal hydraulic and neutronic simulations are presented for the Normal operation, Investment protection (PLOFC) and Safety (DLOFC) cases under investigation.
20.2.6.1 Normal Operation
A listing is provided in Table 20.2.7 to Table 20.2.9 of the most important calculated design parameters of the eight cases during normal operation. In Table 20.2.7 the neutronics parameters are provided of the various cases. Table 20.2.8 contains the calculated thermal-hydraulic parameters, while a temperature versus volume analysis is performed in Table 20.2.9 of the fuel during normal operation. For purposes of the design calculations a series of iterations are performed between the neutronics and thermal-hydraulics until convergence is reached. Convergence is firstly achieved of the neutronic parameters for an estimated spectral temperature distribution. Thereafter a set of thermal-hydraulics data are iteratively calculated until convergence is achieved of the coupled neutronics and thermal-hydraulics parameters. Based on this set of input data the comparative calculations were performed.

N
GN
P a
nd H
ydro
gen
Pro
duct
ion
Pre
conc
eptu
al D
esig
n R
epor
t N
GN
P-2
0-R
PT
-002
S
peci
al S
tudy
20.
2 –
Pro
toty
pe P
ower
Lev
el S
tudy
20
.2 P
roto
typ
e P
ow
er L
evel
Stu
dy
Ja
nu
ary
26
, 2
007
48 o
f 65
Tab
le 2
0.2
.7:
N
eutr
on
ics
Per
form
an
ce P
ara
met
ers
No R
&D
M
inim
al
R&
D
Mod
est
R&
D
Pa
ram
eter
(li
mit
) U
nit
sP
BM
R-
DP
P
Ca
se 1
Ca
se 2
Ca
se 3
C
ase
4C
ase
5C
ase
6C
ase
7C
ase
8
Pow
er l
evel
M
Wth
400
400
450
450
500
500
500
600
600
FC
R
m
2.0
2.0
2.0
2.0
2.0
2.0
2.4
2.4
2.0
k eff
1.00
01
1.00
01
1.00
01
1.00
00
1.00
00
1.00
01
1.00
01
1.00
00
1.00
00
Bur
nup
(<10
0,00
0)
MW
d/t H
M95
,723
94
,949
94
,508
94
,708
94
,254
94
,079
82
,895
82
,101
93
,462
Qm
ax/F
S (
<4.
5)
kW
2.80
2.
94
3.29
3.
13
3.51
3.
63
3.93
4
.66
4.
30
Pow
er P
eaki
ng
Qm
ax/Q
avg
3.17
3.
32
3.30
3.
15
3.17
3.
28
2.91
2.
87
3.24
Fue
l res
iden
ce ti
me
d 96
4 95
6 84
6 84
8 75
9 75
8 54
8 45
2 62
8
Hea
t-up
ov
er
reac
tor
(fro
m
inle
t pl
enum
to
ou
tlet
pl
enum
)
°C50
092
7 35
410
44
353
1041
50
010
04
451
1023
35
310
38
353
1012
35
310
18
353
1039

N
GN
P a
nd H
ydro
gen
Pro
duct
ion
Pre
conc
eptu
al D
esig
n R
epor
t N
GN
P-2
0-R
PT
-002
S
peci
al S
tudy
20.
2 –
Pro
toty
pe P
ower
Lev
el S
tudy
20
.2 P
roto
typ
e P
ow
er L
evel
Stu
dy
Ja
nu
ary
26
, 2
007
49 o
f 65
Tab
le 2
0.2
.8:
T
her
mal-
hyd
rau
lics
Per
form
an
ce P
ara
met
ers
No R
&D
M
inim
al
R&
D
Mod
est
R&
D
Pa
ram
eter
(li
mit
) U
nit
sP
BM
R-
DP
P
Case
1
Case
2
Case
3
Case
4
Case
5
Case
6
Case
7
Case
8
Pow
er l
evel
M
Wth
400
400
450
450
500
500
500
600
600
FC
R
m
2.0
2.0
2.0
2.0
2.0
2.0
2.4
2.4
2.0
Tav
g fu
el (
spec
trum
) °C
82
9 83
0 83
4 87
2 86
5 84
0 83
7 85
7 85
3
Tm
ax f
uel
(<12
50 °
C)
°C
1071
11
26
1145
11
45
1170
11
68
1050
12
09
1219
Tm
ax C
B (
<81
6 °C
) °C
41
4 29
7 29
7 41
4 37
4 29
7 29
7 29
7 29
6
Tm
ax R
PV
(<
371
°C)
°C
324
238
238
324
296
240
240
240
240
P o
ver
core
kP
a 22
8 10
4 13
0 23
7 23
2 15
8 23
1 32
6 22
5
P o
ver
the
reac
tor
kPa
332
152
191
344
339
235
342
483
334
Cir
cula
tor
pow
er
MW
th-
2,62
7 3,
730
11,1
44
10,2
91
5,09
1 7,
410
12,5
76
8,69
2

N
GN
P a
nd H
ydro
gen
Pro
duct
ion
Pre
conc
eptu
al D
esig
n R
epor
t N
GN
P-2
0-R
PT
-002
S
peci
al S
tudy
20.
2 –
Pro
toty
pe P
ower
Lev
el S
tudy
20
.2 P
roto
typ
e P
ow
er L
evel
Stu
dy
Ja
nu
ary
26
, 2
007
50 o
f 65
Ta
ble
20
.2.9
: V
olu
me
ver
sus
Tem
per
atu
re A
na
lysi
s d
uri
ng
No
rma
l O
per
ati
on
No R
&D
M
inim
al
R&
D
Mod
est
R&
D
Pa
ram
eter
(li
mit
) U
nit
sP
BM
R-
DP
P
Case
1C
ase
2C
ase
3
Case
4C
ase
5C
ase
6C
ase
7C
ase
8
Pow
er l
evel
M
Wth
400
400
450
450
500
500
500
600
600
FC
R
m
2.0
2.0
2.0
2.0
2.0
2.0
2.4
2.4
2.0
T<
900
°C
%
72.7
9 56
.56
58.6
1 55
.45
56.5
6 58
.61
61.7
5 59
.09
58.6
1
900
°C<
T <
1000
°C
%
27
.21
33.3
6 34
.26
39.9
3 37
.63
32.2
9 32
.76
32.2
5 32
.21
1000
°C
<T
<11
00 °
C
%
0.0
10.0
8 9.
18
4.62
5.
81
9.10
5.
49
8.66
9.
18
T>
1100
°C
%
0.
0 0.
0 0.
0 0.
0 0.
0 0.
0 0.
0 0.
0 0.
0

NGNP and Hydrogen Production Preconceptual Design Report NGNP-20-RPT-002 Special Study 20.2 – Prototype Power Level Study
20.2 Prototype Power Level Study January 26, 2007 51 of 65
20.2.6.1.1 Evaluation of Normal Operation Performance
Apart from the obvious advantages offered by opting for an existing design the normal operational performance of the selected designs are measured against the following neutronics and thermal hydraulics parameters: maximum power produced per pebble, maximum burnup achieved by the fuel, maximum burnup achieved, maximum fuel temperature achieved, maximum temperatures achieved in the metallic components, such as the CB, RPV, and housing of the control rods. Other parameters to consider are the so-called temperature swing at the outlet due to the heat-up difference in the bottom reflector graphite, pressure drop over the core due to the associated impact on the blower size, etc.
For purposes of this special study the comparison between tabled parameters provides a good measure of effectiveness.
In Table 20.2.7 it is observed that all the cases presented for normal operation are observed to be within acceptable burnup limits. Except for Cases 6 and 7 a burnup of around 95,000 MWd/tHM is observed. The reason for the lower burnup in Cases 6 and 7 is due to the lower fissile content in the smaller cores of these cases due to the increased fixed centre column.
In Case 7 the power produced per fuel sphere of 4.66 kW/pebble exceeded the limit of 4.5 kW/pebble. Even though the rest of all the cases produced a higher power per fuel sphere than the PBMR-DPP the maximum levels are within acceptable limits.
Table 20.2.8 shows that Case 8 features the maximum fuel temperature that is close to the limitation of 1250 °C. Case 6 displays the lowest peak fuel temperature during normal operation but has, like Case 7, a very large P over the reactor and thus requires a corresponding higher circulator power.
In Table 20.2.9 the temperature versus volume analysis shows that all cases apart from the PBMR-DPP design feature a considerable percentage of fuel at temperatures exceeding 1000 °C. No considerable amount of fuel exceeds 1100 °C during normal operation though.
At a higher power output than the DPP of 500 MWth, Cases 5 and 6 display the largest margin for the various parameters for the range of considerations. Due to the fact that the geometry would be similar to the PBMR-DPP, Case 5 would be the preferred option based on normal operating parameters.
20.2.6.2 Investment Protection
In order to evaluate the investment protection margins for the various cases Table 20.2.10 depicts a comparison of the thermal-hydraulics performance of the various options during a PLOFC event. This evaluation is performed for a case different than the PBMR-DPP direct cycle in that the pressure is assumed to remain constant at 9.0 MPa. For purposes of this investigation a similar run has been compiled for the PBMR-DPP case, i.e. assuming that a PLOFC occurred at 9.0 MPa.

N
GN
P a
nd H
ydro
gen
Pro
duct
ion
Pre
conc
eptu
al D
esig
n R
epor
t N
GN
P-2
0-R
PT
-002
S
peci
al S
tudy
20.
2 –
Pro
toty
pe P
ower
Lev
el S
tudy
20
.2 P
roto
typ
e P
ow
er L
evel
Stu
dy
Ja
nu
ary
26
, 2
007
52 o
f 65
Ta
ble
20
.2.1
0:
T
her
ma
l-H
yd
rau
lics
Per
form
an
ce d
uri
ng
a P
LO
FC
(9
.0 M
Pa
)
No R
&D
M
inim
al
R&
D
Mod
est
R&
D
Pa
ram
eter
(li
mit
) U
nit
sP
BM
R-
DP
P
Case
1C
ase
2C
ase
3
Case
4C
ase
5C
ase
6C
ase
7C
ase
8
Pow
er l
evel
M
Wth
400
400
450
450
500
500
500
600
600
FC
R
m
2.0
2.0
2.0
2.0
2.0
2.0
2.4
2.4
2.0
Tav
g fu
el
°C
1009
10
01
1031
10
72
1093
10
70
1039
11
33
1162
Tm
ax f
uel
(at
tim
e [h
])
(<16
00/1
700)
°C13
20(2
7h)
1315
(27h
)13
88(3
0h)
1418
(27h
)14
79(3
0h)
1460
(30h
)12
84(3
0h)
1408
(36h
)16
08(3
3h)
Tm
ax C
B (
<81
6)
°C
482
518
545
553
570
565
552
591
592
Tm
ax R
PV
(at
tim
e [h
])
(>37
1, <
427
for
3,00
0 hr
s; >
427,
< 5
38 f
or
1000
hrs
)
°C37
3(4
8h)
370
(48h
)38
5(5
6h)
393
(48h
)40
5(5
6h)
401
(56h
)39
7(4
8h)
428
(56h
)43
4(5
6h)

NGNP and Hydrogen Production Preconceptual Design Report NGNP-20-RPT-002 Special Study 20.2 – Prototype Power Level Study
20.2 Prototype Power Level Study January 26, 2007 53 of 65
20.2.6.2.1 Evaluation of Performance during a PLOFC (Investment Protection)
All cases are well within the limits for the PLOFC with the exception of the Case 8 peak fuel temperature.
20.2.6.3 Safety Performance (DLOFC)
In order to evaluate the inherent safety position of the various cases Table 20.2.11 depicts a comparison of the thermal-hydraulics performance of the DLOFC event. The reactor is assumed to operate at about 24 years full power. This would yield the most conservative conditions in terms of the thermal conductivities, i.e. where the fuel would be thermally taxed to its fullest. Subsequently, a sequence is run after the onset of the DLOFC event whereby the reactor is assumed to depressurize immediately down to ambient pressure, i.e. no heat loss is assumed with the exiting helium and the CB and RPV starts to lose heat via radiation only.
Since the DLOFC is assumed to be a Beyond Design Event the calculations are assumed to be best estimate. These results of the DLOFC analyses are listed in Table 20.2.11 and Table 20.2.12.
Following the DLOFC event an analysis is also performed of the volume of fuel expected at the elevated temperature levels. These results are listed in Table 20.2.12.

N
GN
P a
nd H
ydro
gen
Pro
duct
ion
Pre
conc
eptu
al D
esig
n R
epor
t N
GN
P-2
0-R
PT
-002
S
peci
al S
tudy
20.
2 –
Pro
toty
pe P
ower
Lev
el S
tudy
20
.2 P
roto
typ
e P
ow
er L
evel
Stu
dy
Ja
nu
ary
26
, 2
007
54 o
f 65
Tab
le 2
0.2
.11:
T
her
mal-
Hyd
rau
lics
Per
form
an
ce d
uri
ng a
DL
OF
C
No R
&D
M
inim
al
R&
D
Mod
est
R&
D
Pa
ram
eter
(li
mit
) U
nit
sP
BM
R-
DP
P
Case
1C
ase
2C
ase
3
Case
4C
ase
5C
ase
6C
ase
7C
ase
8
Pow
er l
evel
M
Wth
400
400
450
450
500
500
500
600
600
FC
R
M
2.0
2.0
2.0
2.0
2.0
2.0
2.4
2.4
2.0
Tav
g fu
el
°C
1126
11
11
1169
12
01
1249
12
32
1147
12
53
1354
Tm
ax f
uel
(at
tim
e [h
])
(<16
00/1
700)
°C14
99(4
5h)
1494
(45h
)15
80(4
5h)
1602
(42h
)16
79(4
5h)
1668
(48h
)14
97(4
5h)
1641
(45h
)18
35(4
5h)
Tm
ax C
B (
<81
6)
°C
579
(48h
)
571
(49h
)
602
(63h
)
609
(55h
)
630
(62h
)
625
(62h
)
612
(56h
)
653
(59h
)
671
(62h
)
Tm
ax R
PV
(at
tim
e [h
])
(>37
1, <
427
for
3,00
0 hr
s; >
427,
< 5
38 f
or
1000
hrs
)
°C41
9(5
6h)
414
(64h
)43
5(6
4h)
442
(56h
)45
9(6
4h)
455
(64h
) 44
3 (5
6h)
477
(64h
)49
2(6
4h)

N
GN
P a
nd H
ydro
gen
Pro
duct
ion
Pre
conc
eptu
al D
esig
n R
epor
t N
GN
P-2
0-R
PT
-002
S
peci
al S
tudy
20.
2 –
Pro
toty
pe P
ower
Lev
el S
tudy
20
.2 P
roto
typ
e P
ow
er L
evel
Stu
dy
Ja
nu
ary
26
, 2
007
55 o
f 65
Tab
le 2
0.2
.12:
V
olu
me
ver
sus
Tem
per
atu
re A
naly
sis
du
rin
g D
LO
FC
No R
&D
M
inim
al
R&
D
Mod
est
R&
D
Pa
ram
eter
(li
mit
) U
nit
sP
BM
R-
DP
P
Case
1C
ase
2C
ase
3
Case
4C
ase
5C
ase
6C
ase
7C
ase
8
Pow
er l
evel
M
Wth
400
400
450
450
500
500
500
600
600
FC
R
m
2.0
2.0
2.0
2.0
2.0
2.0
2.4
2.4
2.0
1200
°C<
T<
1300
°C
%
14.8
0 13
.21
11.1
3 10
.86
11.1
0 9.
03
14.4
3 11
.81
9.31
1300
°C<
T<
1400
°C
%
14.9
8 15
.19
14.3
7 14
.03
13.5
3 10
.30
19.2
7 14
.22
10.0
1
1400
°C<
T<
1500
°C
%
13.9
2 12
.08
13.6
4 14
.09
13.6
0 13
.62
14.7
0 14
.60
9.47
1500
°C<
T<
1600
°C
%
0.0
0.0
10.2
1 13
.96
10.1
5 13
.70
0.0
17.2
5 12
.48
1600
°C<
T<
1700
°C
%
0.0
0.0
0.0
0.0
0.0
9.17
0.
0 5.
0 11
.45
1700
°C<
T<
1800
°C
%
0.0
0.0
0.0
0.0
0.0
0.0
0.0
0.0
13.0
4
T>
1800
°C
%
0.0
0.0
0.0
0.0
0.0
0.0
0.0
0.0
3.14

NGNP and Hydrogen Production Preconceptual DesignReportNGNP-20-RPT-002 Special Study 20.2 – Prototype Power Level Study
20.2 Prototype Power Level Study January 26, 2007 56 of 65
20.2.6.3.1 Evaluation of Performance during a DLOFC (Safety Consideration)
Table 20.2.13: Overview of Maximum Temperatures Achieved during a DLOFC
Case # T < 1600 °C 1600 °C < T < 1800 °C T > 1800 °C
12345678
Cases 1, 2 & 6 yield maximum fuel temperatures during a DLOFC event lower than the set limit of 1600 °C. Even though Cases 3, 4, 5, & 7 have temperatures above 1600 °C, in Case 5 only 9.17 percent exceeds 1600 °C, while Case 7 only exceeds the 1600 °C limit by 5 percent. Case 8 displays the worst overall results with temperatures exceeding 1800 °C.

NGNP and Hydrogen Production Preconceptual DesignReportNGNP-20-RPT-002 Special Study 20.2 – Prototype Power Level Study
20.2 Prototype Power Level Study January 26, 2007 57 of 65
20.2.7 SUMMARY AND RECOMMENDATION
Based on the discriminating criteria noted in Table 20.2.6 a proposal for the power level could be derived. Eight design variations of the PBMR-DPP have been calculated to provide normal operating parameters, a PLOFC calculation to represent the design decisions for protecting the investment, and a DLOFC calculation of each case representing the safety aspects to be considered in the design. The following list of calculated results provides a summary relative to the list of discriminating criteria:
No R&D and design development required beyond PBMR-DPP:
Case 2: 450 MWth; Geometry similar to the PBMR-DPP.
Lower mass flow than PBMR-DPP – lower P over reactor – smaller components. 12.5 percent increase in power level from PBMR-DPP. Immediately deployable.
The elevated power level at 450 MWth from 400 MWth is simply due to the choice of RIT/ROT of 350/950 °C. The fuel temperature envelope remains unchallenged and the metallic components remain well within the observed code margins.
Minimal R&D required beyond PBMR-DPP:
Case 5: 500 MWth; Geometry similar to the DPP.
25 percent increase in power level from PBMR-DPP. Minimal R&D for fuel qualification to 1700 °C. Re-evaluation of existing fuel performance data.
In this case a re-evaluation of the existing experimental fuel data is anticipated for the qualification of fuel to 1700 °C. It is foreseen that a slightly modified strategy might be possible with respect to the interpretation of the fuel failure fraction based on more detailed modeling of the fuel failure mechanisms.
Modest R&D and design development required:
Case 6: 500 MWth; FCR diameter 2.4 m.
FCR discharge chute design needs to be re-evaluated. Higher P over reactor.
This case assumes an increase in the diameter of the fixed center reflector to 2.4 m from 2.0 m. The consideration of this design was due to the fact that the fuel temperatures in this case will remain within currently acceptable margins. Modest R&D is foreseen in terms of the impact

NGNP and Hydrogen Production Preconceptual DesignReportNGNP-20-RPT-002 Special Study 20.2 – Prototype Power Level Study
20.2 Prototype Power Level Study January 26, 2007 58 of 65
of the increased diameter on the discharge fuel chutes. A higher p over the core will also have to be accounted for in the economic evaluation.
Case 7: 600 MWth; FCR diameter 2.4 m
Qmax/Pebble = 4.66 kW – exceeds THTR and PBMR-DPP 4.5 kW/pebble limit. FCR discharge chute design needs to be reevaluated. Minimal R&D for fuel qualification to 1800 °C. Higher P over reactor.
Case 7 represents an overlap of minimal and modest R&D requirements. It assumes that the PBMR-DPP provides proof of some margin in the current design assumptions of 4.5 kW/pebble and the availability of better fuel qualification data. Due to an increase of the diameter of the fixed center reflector and the elevated power level the limits as discussed above will be marginal.
Therefore, based on the set of discriminating criteria as listed in Table 20.2.6 for the NGNP reactor, Case 5: 500 MWth with geometry similar to the PBMR-DPP is recommended. This is based on the following criteria:
The PBMR-DPP reactor can be immediately used as the basis for NGNP design - within the operational envelope of the PBMR- DPP. NGNP schedule will be met - minimal R&D required. No or minimal design development required. 25 percent higher power output is achievable while retaining the PBMR-DPP capital cost for the reactor and auxiliary systems and building.

NGNP and Hydrogen Production Preconceptual DesignReportNGNP-20-RPT-002 Special Study 20.2 – Prototype Power Level Study
20.2 Prototype Power Level Study January 26, 2007 59 of 65
REFERENCES
1. Statement of Work, Preconceptual Engineering Services for the Next Generation Nuclear Plant with Hydrogen Production, Project No. 23843, Idaho National Laboratory, July 2006.
2. A Public/Private Partnership to Develop the Next Generation Nuclear Plant Commercial Demonstration, NGNP Public/Private Partnership Working Group, October 2006.
3. VSOP-A: Augmented Computer Code System for Reactor Physics and Fuel Cycle Simulation NTC_060301/A (March 2006).
4. E Ziermann and G Ivens, Abschlussbericht über den Leistungsbetrieb des AVR-Versuchskernkraftwerkes JÜL-3448, FZJ Report, October 1997.
5. AVR - Experimental High-Temperature Reactor: 21 Years of Successful Operation for a Future Energy Technology Association of German Engineers, VDI-Society for Energy Technologies (Publ.), VDI-Verlag GmbH, June 1990.
6. Safety Analysis Report of the THTR Prototype 300 MWe Band I - Technical Report, April 1968.
7. Siemens - INTERATOM Hochtemperaturreaktor-Modul-Kraftwerksanlage – Kurzbeschreibung Nov. 1988.
8. H Reutler and G H Lohnert, Advantages of Going Modular in HTRs, Nucl. Eng. Des. 78 (1984) 129.
9. Auslegung der Reaktorkerne von gasgekühlten Hochtemperaturreaktoren, Wärmeübertragung im Kugelhaufen KTA-Rule 3102.2, Version 6/83.
10. K Robold, Wärmetransport im Inneren und in der Randzone von Kugelschüttungen, Kernforschungsanlage Jülich GmbH, JÜL-1796 (August 1982).
11. A Banerjea, K Hammeke, N Hüpping, H E Kipke and A Stoehr, Thermodynamische Stoffwerte von HELIUM im Bereich von 20 bis 1500 °C und 1 bis 100 bar Jül-1562, December 1978.
12. E Mulder, Evaluation of Reactor Physics Experiments and VSOP, MTNC-0013, Rev. 1, August 2006.

NGNP and Hydrogen Production Preconceptual DesignReportNGNP-20-RPT-002 Special Study 20.2 – Prototype Power Level Study
20.2 Prototype Power Level Study January 26, 2007 60 of 65
BIBLIOGRAPHY
None.

NGNP and Hydrogen Production Preconceptual DesignReportNGNP-20-RPT-002 Special Study 20.2 – Prototype Power Level Study
20.2 Prototype Power Level Study January 26, 2007 61 of 65
DEFINITIONS
None.

NGNP and Hydrogen Production Preconceptual DesignReportNGNP-20-RPT-002 Special Study 20.2 – Prototype Power Level Study
20.2 Prototype Power Level Study January 26, 2007 62 of 65
REQUIREMENTS
None.

NGNP and Hydrogen Production Preconceptual DesignReportNGNP-20-RPT-002 Special Study 20.2 – Prototype Power Level Study
20.2 Prototype Power Level Study January 26, 2007 63 of 65
LIST OF ASSUMPTIONS
1. In VSOP-A no non-local heat production is considered; i.e. all heat is considered to be
deposited at the point of fission in the core.
2. During a DLOFC calculation the core is assumed to immediately depressurize to 100 kPa.
3. The fluence- and temperature-dependent thermal conductivities are calculated according to
end-of-life irradiated reflector graphite properties.
4. For the effective thermal-conductivity within the pebble bed the models by Zehner-
Schlünder 9 are employed for temperatures up to 1400 °C and beyond that the model by
Robold 10.
5. Thermo-dynamic values employed for helium are derived from the equations provided in 11.
6. For the equilibrium calculation of all the cases the RCS was considered to be inserted into
the side reflector to a depth of about 2.25 m measured from the bottom of the top reflector.
7. For both PLOFC and DLOFC only best estimate calculations are performed.

NGNP and Hydrogen Production Preconceptual DesignReportNGNP-20-RPT-002 Special Study 20.2 – Prototype Power Level Study
20.2 Prototype Power Level Study January 26, 2007 64 of 65
TECHNOLOGY DEVELOPMENT
1. The only additional technology development required for the PBMR PHP reactor beyond that
required and underway for the DPP is a design data need that the range of fuel performance
data under conditions of DLOFC be extended. This is required to statistically supplement
prior German testing in the range of 1600 ºC to 2000 ºC.

NGNP and Hydrogen Production Preconceptual DesignReportNGNP-20-RPT-002 Special Study 20.2 – Prototype Power Level Study
20.2 Prototype Power Level Study January 26, 2007 65 of 65
APPENDICES
APPENDIX 20.2.1 PRESENTATION TO BEA, "20.2 POWER LEVEL SPECIAL STUDY," DECEMBER 6, 2006
Appendix 20.2.1 provides the slides presented on this special study at the December 2006 monthly meeting at the Shaw Group offices in Stoughton, MA.

APPENDIX 20.2.1: PRESENTATION TO BEA, "20.2 POWER LEVELSPECIAL STUDY," DECEMBER 6, 2006

1
20.2
P
ow
er
Level S
pecia
l S
tud
y20.2
P
ow
er
Level S
pecia
l S
tud
y
De
ce
mb
er
6,
20
06
De
ce
mb
er
6,
20
06

2
•S
ele
ct
Re
ac
tor
Po
we
r L
ev
el
Fo
r N
GN
P P
lan
t
•S
ele
ct
Hy
dro
ge
n P
ow
er
Le
ve
l F
or
NG
NP
Pla
nt
–C
ov
ere
d I
n
20.7
Ob
jec
tiv
es
Ob
jec
tiv
es

3
PB
MR
de
sig
n r
eq
uir
em
en
ts a
nd
se
lec
tio
ns
•P
BM
R-D
PP
de
sig
n a
pp
roa
ch
an
d s
ele
ctio
ns
•A
pp
roa
ch
to
NG
NP
po
we
r le
ve
l
•S
imu
latio
n t
oo
ls a
nd
in
pu
t d
ata
•D
iscrim
ina
tin
g c
rite
ria
•E
valu
ation r
esults &
com
parison
•S
um
mary
and r
ecom
mendation
Reacto
r P
ow
er
Level P
resen
tati
on
Ou
tlin
eR
eacto
r P
ow
er
Level P
resen
tati
on
Ou
tlin
e

4
Desig
n R
eq
uir
em
en
ts a
nd
Sele
cti
on
sD
esig
n R
eq
uir
em
en
ts a
nd
Sele
cti
on
s
•N
orm
al
Op
era
tio
n
Opera
te w
ithin
the G
erm
an L
EU
fuel te
st envelo
pe
Fuel T
max
< 1
25
0 °
C d
uring n
orm
al opera
tion
Main
tain
inle
t te
mpera
ture
to a
void
Wig
ner
energ
y b
uild
up
Lim
it v
elo
city thro
ugh g
raphite o
rifices <
100 m
/s
Meet C
ore
Barr
el (C
B)
and R
eacto
r P
ressure
Vessel (R
PV
) m
ate
rial
tem
pera
ture
constr
ain
ts
Utiliz
e F
ixed C
entr
al R
eflecto
r (F
CR
) to
pro
vid
e R
SS
insert
ion location
Pro
vid
e c
ontr
ol and s
hutd
ow
n in s
ide r
eflecto
r
Utiliz
e s
teel R
PV
for
passiv
e d
ecay h
eat re
moval
•O
ff N
orm
al
Op
era
tio
n
Pro
vid
e p
assiv
e h
eat re
moval during P
ressurized a
nd D
epre
ssurized L
oss
of F
orc
ed C
oolin
g E
vents
(P
LO
FC
and D
LO
FC
)
–M
ain
tain
accepta
ble
meta
llic r
eacto
r te
mpera
ture
s
–M
ain
tain
accepta
ble
RP
V tem
pera
ture
s
–Lim
it f
uel te
mpera
ture
s t
o a
ccepta
ble
valu
es

5
•P
BM
R d
esig
n r
eq
uire
me
nts
an
d s
ele
ctio
ns
PB
MR
-DP
P d
es
ign
ap
pro
ac
h a
nd
se
lec
tio
ns
•A
pp
roa
ch
to
NG
NP
po
we
r le
ve
l
•S
imu
latio
n t
oo
ls a
nd
in
pu
t d
ata
•D
iscrim
ina
tin
g c
rite
ria
•E
valu
ation r
esults &
com
parison
•S
um
mary
and r
ecom
mendation
Reacto
r P
ow
er
Level P
resen
tati
on
Ou
tlin
eR
eacto
r P
ow
er
Level P
resen
tati
on
Ou
tlin
e

6
PB
MR
PB
MR
-- DP
P R
ea
cto
r D
es
ign
DP
P R
ea
cto
r D
es
ign
•R
eacto
r P
ow
er
Level =
400M
Wt
•R
eacto
r In
let T
em
pera
ture
(R
IT)
= 5
00 °C
•R
eacto
r O
utlet T
em
pera
ture
(R
OT
) =
900 °
C
•A
vera
ge c
ore
pow
er
density 4
.77 M
W/m
3
•R
eacto
r P
ressu
re V
essel (R
PV
)
Inner
dia
mete
r of 6.2
m (
wall
thic
kness 0
.18m
)
Larg
est R
PV
readily
availa
ble
–W
ithin
curr
ent
manufa
ctu
ring lim
itations
–W
ithin
road tra
nsport
ation lim
itations
–W
ith m
ultip
le s
upplie
rs a
vaila
ble
•C
ore
barr
el (C
B)
Inner
dia
mete
r of 5.8
m (
wall
thic
kness 0
.06m
)
316 s
tain
less s
teel vessel to
main
tain
core
sta
bili
ty

7
PB
MR
PB
MR
-- DP
P R
eacto
r D
esig
n c
on
tD
PP
Reacto
r D
esig
n c
on
t ……
•S
ide R
efl
ecto
r
Sid
e r
eflecto
r consis
ts o
f tw
o b
locks
–In
ner
blo
ck 0
.40m
housin
g R
CS
;
–O
ute
r blo
ck 0
.50m
thic
k h
ousin
g h
eliu
m r
iser
channels
Repla
cem
ent lim
it o
f in
ner
reflecto
r =
fast neutr
on flu
ence o
f 2.2
x 1
022
at
80
0°C
0.9
0m
thic
kness (
0.7
75m
solid
thic
kness)
op
tim
al w
.r.t
. neutr
on e
conom
y
and c
apital cost
RC
S locate
d in s
ide r
eflecto
r
•A
nn
ula
r F
uel R
eg
ion
Annula
r core
layout –
thic
kness o
f fu
el zone 0
.85m
–N
o a
zim
uth
alX
enon s
win
gs
–R
eactivity c
ontr
ol possib
le fro
m s
ide r
eflecto
r

8
PB
MR
PB
MR
-- DP
P R
eacto
r D
esig
n c
on
tD
PP
Reacto
r D
esig
n c
on
t ……
•F
ixe
d C
en
tre
Co
lum
n (
FC
R)
= 2
.0 m
Optim
ized d
esig
n for
couple
d T
herm
al-
Hydra
ulic
s a
nd N
eutr
onic
perf
orm
ance a
s w
ell
as S
afe
ty
Su
ffic
ient
for
rea
ctivity c
on
tro
l fr
om
sid
e r
efle
cto
rs
RS
S locate
d in c
entr
al re
flecto
r
•E
ffe
cti
ve
co
re h
eig
ht
<1
1.0
m
No a
xia
l X
enon s
win
gs
Accepta
ble
pre
ssure
dro
p
Str
uctu
ral in
tegrity
of centr
al colu
mn

9
PB
MR
PB
MR
-- DP
P R
ea
cto
r L
ay
ou
tD
PP
Re
ac
tor
La
yo
ut

10
PB
MR
PB
MR
-- DP
P R
ea
cto
r In
tern
als
DP
P R
ea
cto
r In
tern
als 6
89
7
4
10 11
3
1
2
23308
5
Main
outlet
ple
num
–hot
heliu
m o
utlet
11
Main
inle
t ple
num
–heliu
m into
ris
er
channel in
sid
e r
eflecto
r (d
ue t
o
hig
h t
em
ps in d
irect
cycle
)
10
Core
barr
el to
p p
late
help
main
tain
str
uctu
ral in
tegrity
9
Top r
eflecto
r –
desig
ned f
or
heliu
m inle
t flow
, shie
ldin
g o
f th
e t
op
meta
llic c
om
ponents
8
Centr
e r
eflecto
r7
Sid
e r
eflecto
r (inner
and o
ute
r)6
Core
barr
el sid
es –
for
fixin
g the C
B a
nd t
o h
old
in p
ositio
n5
Fuel dis
charg
e c
one –
min
. angle
of 23 °C
to p
revent
pebble
blo
ckage
4
Bottom
reflecto
r –
desig
ned t
o h
ouse t
he h
ot
gas c
ham
ber
and s
lots
fo
r exitin
g h
eliu
m
3
Expansio
n c
om
pensato
r –
com
pensate
for
therm
al expansio
n o
f th
e
bottom
pla
te
2
Core
support
str
uctu
re –
Engin
eere
d f
or
support
of
the f
ixed c
entr
al
reflecto
r
1
Co
mp
on
en
tN
o

11
PB
MR
PB
MR
-- DP
P R
ea
cto
r S
ide
Re
fle
cto
rsD
PP
Re
ac
tor
Sid
e R
efl
ec
tors
Ou
ter
sid
e r
efle
cto
r se
alin
g
ke
ys
Inn
er
refle
cto
r
Ou
ter
refle
cto
r
Inn
er
refle
cto
r d
ow
el
Ris
er
ch
an
ne
l
Se
ism
ic r
estr
ain
t lo
ca
tio
n
Inn
er
refle
cto
r ke
ys
Co
ntr
ol ro
d b
ori
ng
Co
ntr
ol ro
d s
lee
ve
Inn
er
to o
ute
r
refle
cto
r lo
ck

12
PB
MR
PB
MR
-- DP
P R
ea
cto
r F
ixe
d C
en
tre
Re
fle
cto
rD
PP
Re
ac
tor
Fix
ed
Ce
ntr
e R
efl
ec
tor
RS
S c
hannel
Gra
de
NG
B1
8
blo
ck
NB
G1
8 b
lock
Su
rfa
ce
co
ola
nt flo
wslo
ts
NB
G1
8 b
lock
Ce
ntr
e c
oo
lan
t
ch
an
ne
l
Inte
rlo
ckin
g
keys
Do
we
ls
NB
G1
8 b
lock
Insp
ectio
nch
an
ne
ls
Ce
ntr
e c
oo
lan
t
ch
an
ne
l g
as
en
try

13
PB
MR
PB
MR
-- DP
P F
uel
DP
P F
uel
40
mO
ute
r Lo
w T
em
pera
ture
Isotr
opic
(O
LT
I)
thic
kness
35
mS
iCla
yer
thic
kness
40
mIn
ner
Low
Tem
pe
ratu
re Isotr
op
ic (
ILT
I)
layer
thic
kness
95
mB
uffer
layer
thic
kness
500
mK
ern
el dia
mete
r
Co
ate
d P
art
icle
:
9.6
(equili
brium
core
)%
U-2
35
Ura
niu
m e
nrich
men
t
9g/F
SH
eavy m
eta
l lo
adin
g
5m
mF
ue
l-fr
ee r
eg
ion th
ickness
50
mm
Fuel re
gio
n d
iam
ete
r
60
mm
Fue
l sphere
dia
me
ter
Sphe
rica
l-
Geo
me
try
Fu
el S
ph
ere
:
No
min
al V
alu
eU
nit
Ch
ara
cte
ris
tic
Fuel desig
n b
ased o
n irr
adia
tion tests
perf
orm
ed for
HT
R-M
OD
UL o
pera
tion
Bu
ffe
r C
-layer
SiC
-layer
De
nse C
-layer
UO
2-
kern
el

14
•P
BM
R d
esig
n r
eq
uire
me
nts
an
d s
ele
ctio
ns
•P
BM
R-D
PP
de
sig
n a
pp
roa
ch
an
d s
ele
ctio
ns
Ap
pro
ac
h t
o N
GN
P p
ow
er
lev
el
•S
imu
latio
n t
oo
ls a
nd
in
pu
t d
ata
•D
iscrim
ina
tin
g c
rite
ria
•E
valu
ation r
esults &
com
parison
•S
um
mary
and r
ecom
mendation
Reacto
r P
ow
er
Level P
resen
tati
on
Ou
tlin
eR
eacto
r P
ow
er
Level P
resen
tati
on
Ou
tlin
e

15
Ap
pro
ach
to
NG
NP
Po
wer
Level
Ap
pro
ach
to
NG
NP
Po
wer
Level
•E
mp
loy
kn
ow
led
ge
an
d u
nd
ers
tan
din
g g
ain
ed
fro
m t
he
PB
MR
-DP
P c
ore
de
sig
n a
s f
ar
as
po
ss
ible
•T
he n
orm
al
op
era
tio
n p
ow
er
level
can
be i
ncre
ased
by
ch
an
gin
g p
ara
mete
rs i
.e.
RIT
an
d R
OT
•L
ow
er
RIT
(350 °
C)
an
d h
igh
er
RO
T (
950 °
C )
im
plies
Use o
f fu
ll ra
nge o
f energ
y
Top e
nd for
pro
cess a
nd low
er
end for
pow
er
genera
tion

16
Desig
n S
ele
cti
on
s t
hat
Infl
uen
ce
Desig
n S
ele
cti
on
s t
hat
Infl
uen
ce
Co
re P
ow
er
Co
re P
ow
er
•D
uri
ng
no
rma
l o
pe
rati
on
:
Mass flo
w r
ate
Core
tem
pera
ture
ris
e
Maxim
um
and a
vera
ge f
uel te
mpera
ture
s
•D
uri
ng
PL
OF
C:
Meta
llic r
eacto
r in
tern
als
tim
e-a
t-te
mpera
ture
Reacto
r vessel tim
e-a
t-te
mpera
ture
•D
uri
ng
DL
OF
C:
Maxim
um
fuel tim
e-a
t-te
mpera
ture
whic
h is influenced b
y
–E
ffective o
ute
r core
dia
mete
r
•V
essel dia
mete
r, s
hip
pin
g w
eig
ht, a
nd s
upplie
r in
frastr
uctu
re
–E
ffective c
ore
heig
ht
•C
ore
pre
ssure
dro
p (
pebble
)
•A
xia
l neutr
onic
sta
bili
ty (
prism
atic)
•F
uel handlin
g (
prism
atic)
•C
ente
r re
flecto
r str
uctu
ral desig
n (
pebble
)
–A
nnula
r active c
ore
thic
kness
•C
ontr
ol ro
d e
ffectiveness (
pebble
)
–P
ow
er
density
–N
orm
al opera
tion a
vera
ge f
uel te
mpera
ture
s
Meta
llic r
eacto
r in
tern
als
tim
e-a
t-te
mpera
ture
Reacto
r vessel tim
e-a
t-te
mpera
ture

17
Ap
pro
ach
to
NG
NP
Po
wer
Level
Ap
pro
ach
to
NG
NP
Po
wer
Level
•A
ssu
me t
he G
erm
an
LE
U f
uel te
st
en
velo
pe
During n
orm
al opera
tion s
tay w
ithin
the b
urn
up-f
luence-t
em
pera
ture
envelo
pe
Main
tain
fuel T
max
<1250°C
during n
orm
al opera
tion
•L
arg
est
reacto
r p
ow
er
wit
ho
ut
an
y a
dd
itio
nal R
&D
or
desig
n d
evelo
pm
en
t b
eyo
nd
DP
P
Curr
ent P
BM
R-D
PP
reacto
r geom
etr
y w
ith v
ary
ing R
IT/R
OT
Main
tain
fuel T
max
<1600°C
during D
LO
FC
•L
arg
est
reacto
r p
ow
er
wit
h m
inim
al
R&
D
PB
MR
–D
PP
, i.e
. P
BM
R-D
PP
ge
om
etr
y a
do
pte
d a
s is
Main
tain
fuel T
max
<1700°C
for
limited tim
e d
uring D
LO
FC
•L
arg
est
reacto
r p
ow
er
wit
h m
od
est
R&
D a
nd
desig
n d
evelo
pm
en
t
Main
tain
fuel T
max
<1700°C
for
limited tim
e d
uring D
LO
FC
Oute
r re
acto
r dia
mete
rs m
ain
tain
ed
Incre
ase F
CR
thic
kness fro
m 2
.0 to 2
.4m
–D
esig
n im
pact
for
fuel chute
s e
tc.

18
•C
om
para
tively
assess t
he im
po
rtan
t co
up
led
neu
tro
nic
san
d
therm
al-
hyd
rau
lics p
ara
mete
rs f
or
a s
pectr
um
of
cases:
No
R&
D a
nd
desig
n d
evelo
pm
en
t re
qu
ired
beyo
nd
DP
P
–R
ef.
PB
MR
-DP
P:
400 M
Wt;
RIT
/RO
T=
500/9
00°C
; M
F=
179.5
kg
/s
–C
ase 1
: 400 M
Wt; R
IT/R
OT
=350/9
50°C
; F
CR
=2
.0 m
;M
F=
11
9.0
kg
/s
–C
ase 2
: 450 M
Wt; R
IT/R
OT
=350/9
50°C
; F
CR
=2
.0 m
; M
F=
13
4.0
kg
/s
Min
imal R
&D
req
uir
ed
–C
ase 5
: 500 M
Wt; R
IT/R
OT
=350/9
50°C
; F
CR
=2
.0 m
; M
F=
14
9.0
kg
/s
Mo
dest
R&
D a
nd
desig
n d
evelo
pm
en
t re
qu
ired
–C
ase 7
: 600 M
Wt; R
IT/R
OT
=350/9
50°C
; F
CR
=2
.4 m
; M
F=
17
9.0
kg
/s
–C
ase 8
: 600 M
Wt; R
IT/R
OT
=350/9
50°C
; F
CR
=2
.0m
; M
F=
17
9.0
kg
/s
Evalu
ati
on
Sco
pe
Evalu
ati
on
Sco
pe
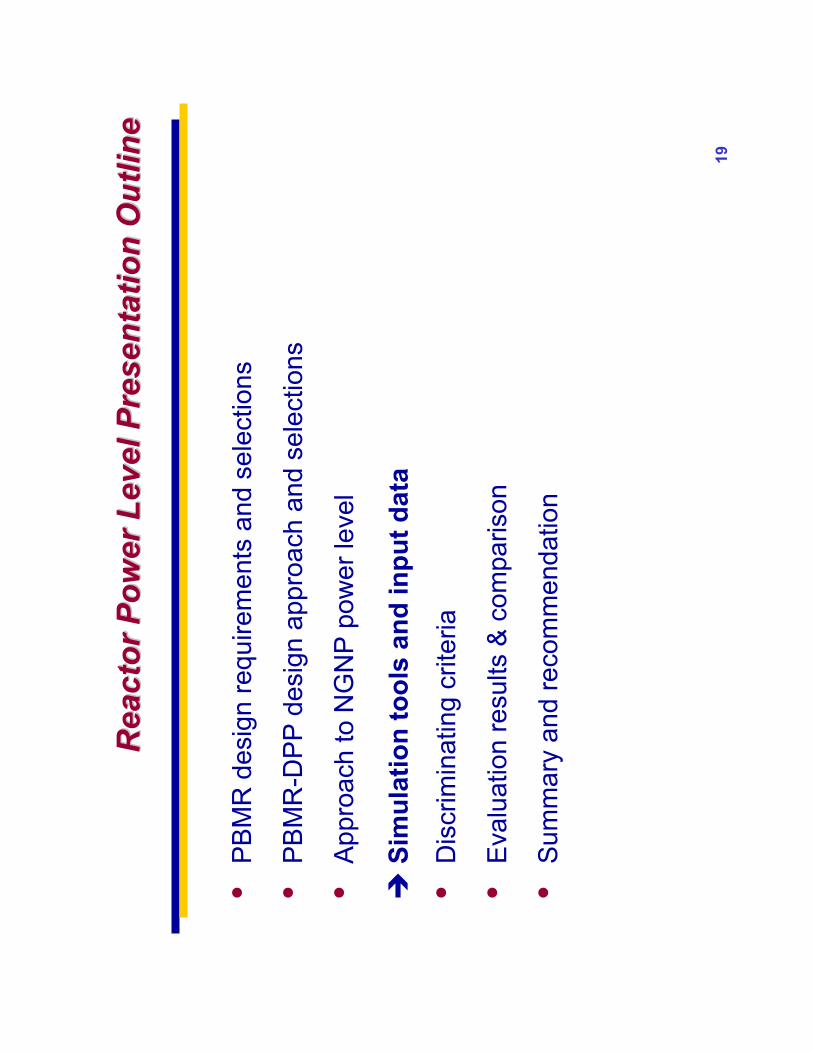
19
•P
BM
R d
esig
n r
eq
uire
me
nts
an
d s
ele
ctio
ns
•P
BM
R-D
PP
de
sig
n a
pp
roa
ch
an
d s
ele
ctio
ns
•A
pp
roa
ch
to
NG
NP
po
we
r le
ve
l
Sim
ula
tio
n t
oo
ls a
nd
in
pu
t d
ata
•D
iscrim
ina
tin
g c
rite
ria
•E
valu
ation r
esults &
com
parison
•S
um
mary
and r
ecom
mendation
Reacto
r P
ow
er
Level P
resen
tati
on
Ou
tlin
eR
eacto
r P
ow
er
Level P
resen
tati
on
Ou
tlin
e

20
VS
OP
VS
OP
-- AA
•A
naly
tical co
de s
yste
m f
or
the n
um
eri
cal sim
ula
tio
n o
f th
e
ph
ysic
s o
f th
erm
al re
acto
rs a
nd
esp
ecia
lly t
he c
ou
ple
d t
herm
al-
hy
dra
uli
cs
of
pe
bb
le b
ed
HT
Rs
.
Neu
tro
nic
Uses
Pro
cessin
gof cro
ss-s
ections,
Sets
up t
he r
eacto
r and f
uel ele
ment,
Evalu
ate
repeate
d n
eutr
on s
pectr
a,
Calc
ula
teneutr
on d
iffu
sio
n in 2
-or
3-D
,
Fuelburn
up,
Fuelshufflin
g,
Reacto
rcontr
ol,
Fuelcycle
costs
.
Th
erm
al H
yd
rau
lic U
ses
2D
Spatial D
imensio
ns
Co
nse
rva
tio
n o
f M
ass,
Mo
me
ntu
m a
nd
E
nerg
y
Ste
ady-S
tate
and Q
uasi S
teady-S
tate
The b
ala
nce o
f th
e g
radie
nt of th
e
pre
ssu
re,
the
hyd
rosta
tic f
orc
e o
f th
e
gra
vity,
and t
he f
rictional fo
rce a
re
calc
ula
ted p
er
unit v
olu
me.
Therm
al and e
ffective c
onductivitie
s a
re
calc
ula
ted a
s f
unction o
f te
mpera
ture
and f
luence.
Radia
tion is a
ccounte
d for
via
em
issiv
ity
of gra
phite, C
B a
nd R
PV

21
DP
P S
tea
dy
DP
P S
tea
dy
-- Sta
te C
om
pari
so
n
Sta
te C
om
pari
so
n
of
TIN
TE
an
d V
SO
Po
f T
INT
E a
nd
VS
OP
-- AA
2.1
82.0
9B
ar
P c
ore
31
02
71
°C
Tm
ax
RP
V
41
43
97
°C
Tm
ax
CB
92
78
97
°C
RO
T
83
08
69
°C
Tavg
Fu
el
10
73
10
83
°C
Tm
ax
Fu
el
VS
OP
-AT
INT
E
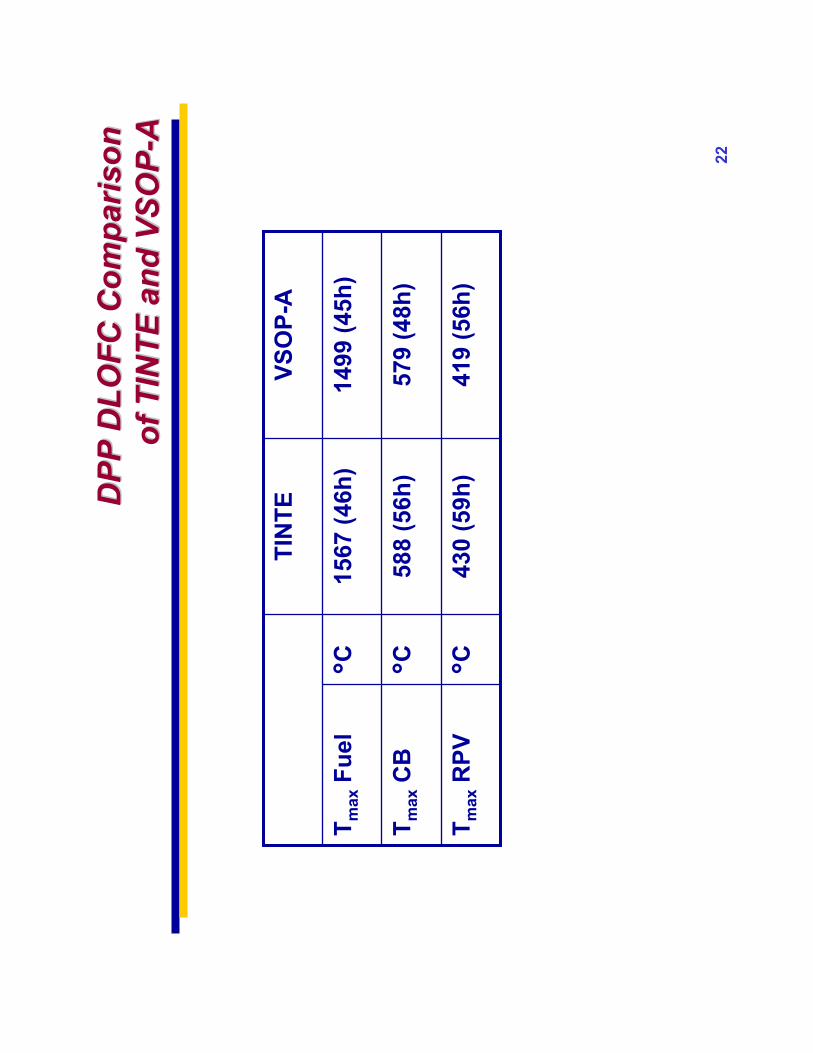
22
DP
P D
LO
FC
Co
mp
ari
so
n
DP
P D
LO
FC
Co
mp
ari
so
n
of
TIN
TE
an
d V
SO
Po
f T
INT
E a
nd
VS
OP
-- AA
419 (
56h
) 430 (
59h
)°C
Tm
ax
RP
V
579 (
48h
)588 (
56h
)°C
Tm
ax
CB
14
99 (
45h
)1567 (
46h
)°C
Tm
ax
Fu
el
VS
OP
-AT
INT
E

23
•P
BM
R d
esig
n r
eq
uire
me
nts
an
d s
ele
ctio
ns
•P
BM
R-D
PP
de
sig
n a
pp
roa
ch
an
d s
ele
ctio
ns
•A
pp
roa
ch
to
NG
NP
po
we
r le
ve
l
•S
imu
latio
n t
oo
ls a
nd
in
pu
t d
ata
Dis
cri
min
ati
ng
cri
teri
a
•E
valu
ation r
esults &
com
parison
•S
um
mary
and r
ecom
mendation
Reacto
r P
ow
er
Level P
resen
tati
on
Ou
tlin
eR
eacto
r P
ow
er
Level P
resen
tati
on
Ou
tlin
e

24
Dis
cri
min
ati
ng
Cri
teri
aD
iscri
min
ati
ng
Cri
teri
a
Cri
teri
aR
ela
tive W
eig
ht
•R
ea
din
es
s
Te
ch
no
log
y e
nab
lin
g R
&D
(in
clu
din
g f
ue
l)
Hig
h
an
d s
ch
ed
ule
Desig
n d
evelo
pm
en
t an
d s
ch
ed
ule
Hig
h
•P
erf
orm
an
ce
No
rmal
Op
era
tin
g c
on
dit
ion
sM
ed
ium
Investm
en
t p
rote
cti
on
(P
LO
FC
) M
ed
ium
Safe
ty c
on
sid
era
tio
n (
DL
OF
C)
Hig
h
•C
os
t Ca
pit
al
sp
ec
ific
co
st
(Re
ac
tor,
etc
.)H
igh
Op
era
tin
g c
ost
(in
clu
din
g F
uel
Cycle
co
st)
Med
ium

25
•P
BM
R d
esig
n r
eq
uire
me
nts
an
d s
ele
ctio
ns
•P
BM
R-D
PP
de
sig
n a
pp
roa
ch
an
d s
ele
ctio
ns
•A
pp
roa
ch
to
NG
NP
po
we
r le
ve
l
•S
imu
latio
n t
oo
ls a
nd
in
pu
t d
ata
•D
iscrim
ina
tin
g c
rite
ria
Evalu
ati
on
resu
lts &
co
mp
ari
so
n
•S
um
mary
and r
ecom
mendation
Reacto
r P
ow
er
Level P
resen
tati
on
Ou
tlin
eR
eacto
r P
ow
er
Level P
resen
tati
on
Ou
tlin
e

26
2.0
2.4
2.0
2.0
2.0
2.0
mF
CR
Mo
dest
R&
DM
inim
al
R&
DN
o R
&D
Case 8
Case 7
Case 5
Case 2
Case 1
DP
PU
nit
s
Kg
/s
°C
MW
th600
600
500
450
400
400
Po
wer
Level
179.0
350/
950
Ma
ss
flo
w
RIT
/
RO
T
179.5
500/
900
179.0
149.0
134.0
119.0
350/
950
350/
950
350/
950
350/
950
Po
wer
Level C
on
fig
ura
tio
n C
ases
Po
wer
Level C
on
fig
ura
tio
n C
ases

272.0
2.4
2.0
2.0
2.0
2.0
mF
CR
Mo
dest
R&
DM
inim
al
R&
DN
o R
&D
600
600
500
450
400
400
MW
thP
ow
er
350
997
350
996
350
995
350
990
350
994
500
957
°C
Heat-
up
over
the r
eacto
r
628
452
758
846
956
964
EF
PD
Fu
el in
-co
re
tim
e
Case 8
Case 7
Case 5
Case 2
Case 1
DP
PU
nit
sP
ara
mete
r
(Lim
it)
2.3
7
3.6
3
94,0
78
1.0
001
2.1
7
4.6
6
82,1
01
1.0
000
2.3
7
4.3
0
93,4
61
1.0
000
2.3
8
3.2
9
94,5
08
1.0
001
2.3
92.2
7Q
max/Q
avg
Po
wer
peakin
g
2.9
42.8
0k
WQ
max/F
S
(<4.5
)
94,9
49
95,7
23
MW
d/t
HM
Bu
rnu
p
(<100,0
00)
1.0
001
1.0
001
keff
No
rmal O
pera
tio
n:
No
rmal O
pera
tio
n:
Ne
utr
on
ics
Ne
utr
on
ics
Pe
rfo
rma
nc
eP
erf
orm
an
ce

28
833
844
833
829
827
830
°C
Ta
vg
Fu
el
Case 8
Case 7
Case 5
Case 2
Case 1
DP
PU
nit
sP
ara
mete
r
(Lim
it)
600
600
500
450
400
400
MW
thP
ow
er
2.0
2.4
2.0
2.0
2.0
2.0
mF
CR
3.3
44.8
32.3
51.9
11.5
23.3
2B
ar
P r
eacto
r
8.6
912.5
85.0
93.7
32.6
3-
MW
thC
ircu
lato
r p
ow
er
225
225
231
231
231
310
°C
Tm
ax
RP
V
(<371)
Mo
dest
R&
DM
inim
al
R&
DN
o R
&D
297
1148
299
1226
296
1173
296
1149
297
414
°C
Tm
ax
CB
(<816)
1130
1073
°C
Tm
axF
uel
(<1250)
No
rmal O
pera
tio
n :
No
rmal O
pera
tio
n :
TT-- H
Pe
rfo
rma
nc
eH
Pe
rfo
rma
nc
e

29
Case 8
Case 7
Case 5
Case 2
Case 1
DP
PU
nit
sP
ara
mete
r
600
600
500
450
400
400
MW
thP
ow
er
2.0
2.4
2.0
2.0
2.0
2.0
mF
CR
~0
9.8
6
34.1
2
56.0
3
Min
ima
l
R&
D
~0
9.1
8
32.2
1
58.6
1
~0
9.5
5
35.1
4
55.3
2
Mo
dest
R&
D
~0
9.8
6
34.1
3
39.1
1
~0
~0
%>
1100°C
10.8
327.2
1%
>1000°C
<1100°C
15.5
626.3
7%
>900°C
<1000°C
38.3
046.4
2%
<900°C
No
R&
D
No
rmal O
pera
tio
n:
No
rmal O
pera
tio
n:
Vo
lum
eV
olu
me
//T
em
pe
ratu
re A
na
lys
isT
em
pe
ratu
re A
na
lys
is

30
No
rmal O
pera
tio
n E
valu
ati
on
No
rmal O
pera
tio
n E
valu
ati
on
•A
ll t
he p
resen
ted
cases a
re w
ith
in t
he a
ccep
tab
le b
urn
up
lim
it
•C
ase 7
is e
xceed
ing
th
e e
nerg
y p
er
fuel sp
here
lim
it
•C
ases 1
, 2 &
5 h
ave a
big
ger
marg
in f
or
Tm
ax
fue
l th
an
Ca
se
6 &
7
•C
ase 8
is c
lose
to
th
e T
max
fuel lim
itati
on
of
1250 °
C
•C
ase 7
has a
very
larg
e
P o
ver
the r
eacto
r an
d h
igh
er
a c
ircu
lato
r
po
wer
•G
iven
its
hig
her
po
wer
of
500M
Wt,
Case 5
has t
he m
ost
marg
in f
or
the v
ari
ou
s p
ara
mete
rs f
or
the r
an
ge o
f co
nsid
era
tio
ns

31
11
60
11
33
10
70
10
31
10
01
10
09
°C
Ta
vg
Fu
el
60
06
00
50
04
50
40
04
00
MW
thP
ow
er
Case 8
Case 7
Case 5
Case 2
Case 1
DP
PU
nit
sP
ara
mete
r
(Lim
it)
29
3
(96
h)
49
5
13
19
(27
h)
2.0
No
R&
D
2.0
2.4
2.0
2.0
2.0
mF
CR
16
08
(33
h)
14
08
(36
h)
14
60
(30
h)
13
88
(30
h)
13
15
(27
h)
°C
(hr)
Tm
ax
Fu
el
(du
rati
on
)
(<1600/1
700)
43
3
(12
0h
)
42
8
(56
h)
40
1
(56
h)
38
4
(9h
)
38
7
(9h
)
°C
(hr)
Tm
ax
RP
V
(du
rati
on
)
(>371, <
427 f
or
3000h
rs;
>427, <
538 f
or
1000h
rs)
Mo
dest
R&
DM
inim
al
R&
D
PL
OF
C
59
16
05
56
55
37
51
8°C
Tm
ax
CB
(<816)
Investm
en
t P
rote
cti
on
:In
vestm
en
t P
rote
cti
on
:TT
-- H P
erf
orm
an
ce
H P
erf
orm
an
ce

32
Investm
en
t P
rote
cti
on
Evalu
ati
on
In
vestm
en
t P
rote
cti
on
Evalu
ati
on
du
rin
g P
LO
FC
du
rin
g P
LO
FC
All
cases a
re w
ell
within
the lim
its for
the Investm
ent
Pro
tection P
LO
FC
with t
he e
xception o
f th
e C
ase 8
peak
fuel te
mpera
ture
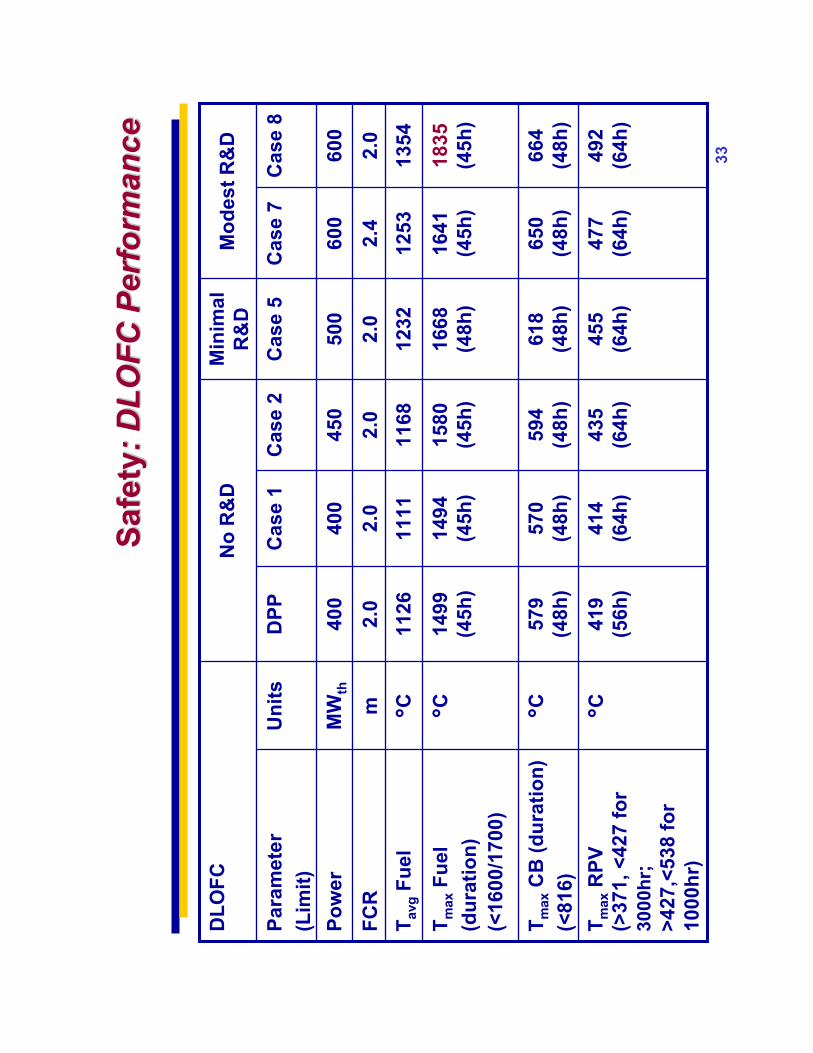
33
13
54
12
53
12
32
11
68
11
11
11
26
°C
Ta
vg
Fu
el
Ca
se
8C
as
e 7
Ca
se
5C
as
e 2
Ca
se
1D
PP
Un
its
Pa
ram
ete
r
(Lim
it)
60
06
00
50
04
50
40
04
00
MW
thP
ow
er
2.0
2.4
2.0
2.0
2.0
2.0
mF
CR
49
2
(64
h)
47
7
(64
h)
45
5
(64
h)
43
5
(64
h)
41
4
(64
h)
41
9
(56
h)
°C
Tm
ax
RP
V
(>371, <
427 f
or
3000h
r;
>4
27
,<5
38
fo
r
10
00
hr)
Mo
de
st
R&
DM
inim
al
R&
DN
o R
&D
DL
OF
C
61
8
(48
h)
16
68
(48
h)
66
4
(48
h)
18
35
(45
h)
65
0
(48
h)
16
41
(45
h)
59
4
(48
h)
15
80
(45
h)
57
0
(48
h)
57
9
(48
h)
°C
Tm
ax
CB
(d
ura
tio
n)
(<8
16
)
14
94
(45
h)
14
99
(45
h)
°C
Tm
ax
Fu
el
(du
rati
on
)
(<1
60
0/1
70
0)
Sa
fety
Sa
fety
: D
LO
FC
Pe
rfo
rma
nc
e:
DL
OF
C P
erf
orm
an
ce

34
Ca
se
8C
as
e 7
Ca
se
5C
as
e 2
Ca
se
1D
PP
Un
its
Pa
ram
ete
r
60
06
00
50
04
50
40
04
00
MW
thP
ow
er
2.0
2.4
2.0
2.0
2.0
2.0
mF
CR
12
.14
0.0
0.0
0.0
0.0
0.0
%>
17
00°C
13
.38
3.0
17
.15
0.0
0.0
0.0
%>
16
00°C
<1
70
0°C
14
.70
11
.90
10
.40
0.8
9
Min
imal
R&
D
11
.59
8.6
7
10
.89
10
.10
16
.39
14
.67
14
.45
12
.62
Mo
dest
R&
D
9.1
8
14
.65
13
.53
11
.04
0.0
0.0
%>
15
00°C
<1
60
0°C
11
.11
13
.86
%>
14
00°C
<1
50
0°C
15
.16
14
.82
%>
13
00°C
<1
40
0°C
13
.28
14
.84
%>
12
00°C
<1
30
0°C
No
R&
DD
LO
FC
DL
OF
C:
DL
OF
C:
Vo
lum
eV
olu
me
//T
em
pe
ratu
re A
na
lys
isT
em
pe
ratu
re A
na
lys
is

35
Evalu
ati
on
of
Safe
ty d
uri
ng
DL
OF
CE
valu
ati
on
of
Safe
ty d
uri
ng
DL
OF
C
•C
ases 1
an
d 2
have T
ma
xfu
el
tem
pera
ture
s b
elo
w 1
600 °
C
•C
ases 5
, an
d 7
have T
max
fuel
tem
pera
ture
s a
bo
ve 1
600 °
C;
it
is h
ow
ever
less t
han
10%
of
the c
ore
vo
lum
e
•C
ase 8
has T
ma
xfu
el te
mp
era
ture
s a
bo
ve 1
800 °
C

36
Reacto
r P
ow
er
Level P
resen
tati
on
Ou
tlin
eR
eacto
r P
ow
er
Level P
resen
tati
on
Ou
tlin
e
•P
BM
R d
esig
n r
eq
uire
me
nts
an
d s
ele
ctio
ns
•P
BM
R-D
PP
de
sig
n a
pp
roa
ch
an
d s
ele
ctio
ns
•A
pp
roa
ch
to
NG
NP
po
we
r le
ve
l
•S
imu
latio
n t
oo
ls a
nd
in
pu
t d
ata
•D
iscrim
ina
tin
g c
rite
ria
•E
valu
ation r
esults &
com
parison
Su
mm
ary
an
d r
ec
om
me
nd
ati
on

37
Dis
cri
min
ati
ng
Cri
teri
aD
iscri
min
ati
ng
Cri
teri
a
Cri
teri
aR
ela
tive
Weig
ht
•R
ead
iness
Tech
no
log
y e
nab
lin
g R
&D
(in
clu
din
g f
uel)
H
igh
an
d s
ch
ed
ule
Desig
n d
evelo
pm
en
t an
d s
ch
ed
ule
Hig
h
•P
erf
orm
an
ce
No
rmal O
pera
tin
g c
on
dit
ion
sM
ed
ium
Investm
en
t p
rote
cti
on
(P
LO
FC
) M
ed
ium
Safe
ty c
on
sid
era
tio
n (
DL
OF
C)
Hig
h
•C
os
t
Cap
ital sp
ecif
ic c
ost
(Reacto
r, e
tc.)
Hig
h
Op
era
tin
g c
os
t (i
nc
lud
ing
Fu
el C
yc
le c
os
t)M
ed
ium

38
No
R&
D a
nd
desig
n d
evelo
pm
en
t re
qu
ired
beyo
nd
DP
P
•C
ase 2
: 450 M
Wt;
FC
R d
iam
ete
r 2.0
m s
am
e a
s D
PP
Imm
edia
tely
deplo
yable
Low
er
mass f
low
–lo
wer
P o
ver
reacto
r–
sm
alle
r com
ponents
12.5
% incre
ase in p
ow
er
level fr
om
PB
MR
-DP
P
Min
imal R
&D
req
uir
ed
•C
ase 5
: 500 M
Wt;
FC
R d
iam
ete
r 2.0
m s
am
e a
s D
PP
Min
imal R
&D
for
fuel qualif
ication to 1
700 °
C
25%
Incre
ase in P
ow
er
level fr
om
PB
MR
-DP
P @
sam
e c
apital cost
Mo
dest
R&
D a
nd
desig
n d
evelo
pm
en
t re
qu
ired
•C
ase 7
: 600 M
Wt;
FC
R d
iam
ete
r 2.4
m
Qm
ax/P
ebble
= 4
.66 k
W –
exceeds T
HT
R a
nd D
PP
4.5
kW
t/pebble
lim
it
FC
R d
ischarg
e c
hute
desig
n n
eeds to b
e r
eevalu
ate
d
Min
imal R
&D
for
fuel qualif
ication to 1
700 °
C
Hig
her
P o
ver
reacto
r
Su
mm
ary
of
the
Be
st
Ca
se
sS
um
ma
ry o
f th
e B
es
t C
as
es
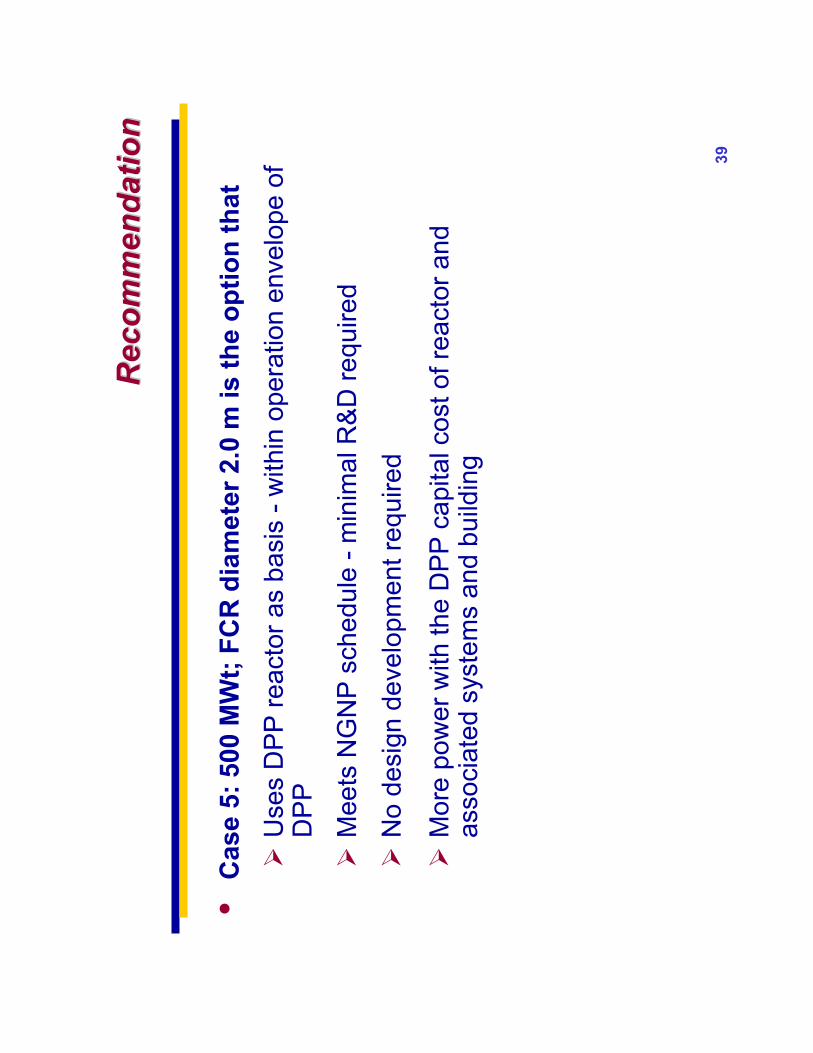
39
Reco
mm
en
dati
on
Reco
mm
en
dati
on
•C
ase 5
: 500 M
Wt;
FC
R d
iam
ete
r 2.0
m is t
he o
pti
on
th
at
Use
s D
PP
re
acto
r a
s b
asis
-w
ith
in o
pe
ratio
n e
nve
lop
e o
f D
PP
Me
ets
NG
NP
sch
ed
ule
-m
inim
al R
&D
re
qu
ire
d
No
de
sig
n d
eve
lop
me
nt
req
uire
d
More
pow
er
with the D
PP
capital cost of re
acto
r and
asso
cia
ted
syste
ms a
nd
bu
ildin
g