netl-trs-5-2014 high-temperature, high-pressure equation ... library/research/onsite research... ·...
TRANSCRIPT
High-Temperature, High-Pressure Equation of State: Solidification of Hydrocarbons and Viscosity Measurement of Krytox Oil Using Rolling-Ball Viscometer
3 October 2014
Office of Fossil Energy
NETL-TRS-5-2014
Disclaimer This report was prepared as an account of work sponsored by an agency of the United States Government. Neither the United States Government nor any agency thereof, nor any of their employees, makes any warranty, express or implied, or assumes any legal liability or responsibility for the accuracy, completeness, or usefulness of any information, apparatus, product, or process disclosed, or represents that its use would not infringe privately owned rights. Reference therein to any specific commercial product, process, or service by trade name, trademark, manufacturer, or otherwise does not necessarily constitute or imply its endorsement, recommendation, or favoring by the United States Government or any agency thereof. The views and opinions of authors expressed therein do not necessarily state or reflect those of the United States Government or any agency thereof.
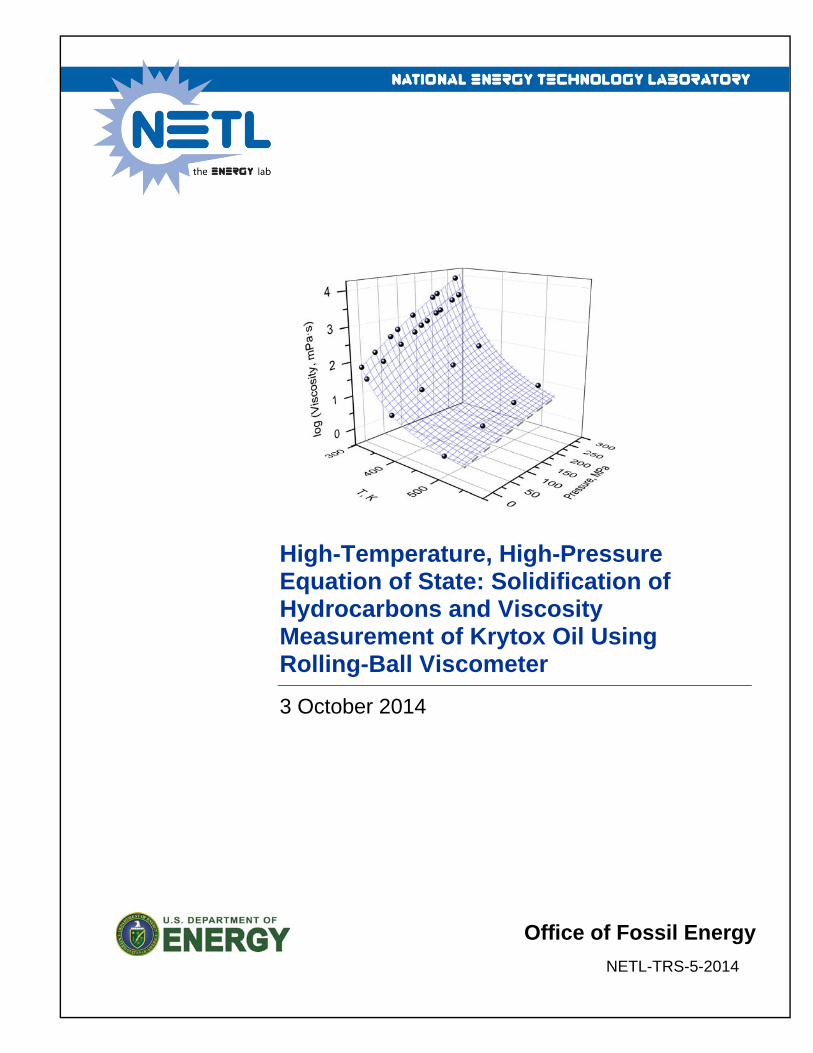
Cover Illustration: Surface fitting of the bis(2-ethylhexyl) phthalate (DEHP) viscosity data at 298 K, 311 K, 372 K, and 491 K (black data markers) and extrapolated DEHP viscosity values at 533 K (gray dashed line).
Suggested Citation: Gamwo, I. K.; Tapriyal, D.; Enick, R. M.; McHugh, M. A.; Morreale, B. D. High Temperature, High Pressure Equation of State: Solidification of Hydrocarbons and Measurement of Krytox Oil Using Rolling-Ball Viscometer Validation; NETL-TRS-5-2014; EPAct Technical Report Series; U.S. Department of Energy, National Energy Technology Laboratory: Morgantown, WV, 2014; p 48.
An electronic version of this report can be found at: http://www.netl.doe.gov/research/on-site-research/publications/featured-technical-reports
https://edx.netl.doe.gov/offshore
High-Temperature, High-Pressure Equation of State: Solidification of
Hydrocarbons and Measurement of Krytox Oil Using Rolling-Ball Viscometer Validation
NETL Ultra-Deepwater and Frontier Regions Research Program Equation of State Team
Isaac K. Gamwo1, Deepak Tapriyal2, Robert M. Enick1,3, Mark A. McHugh1,4, Bryan D. Morreale1
1U. S. Department of Energy, Office of Research and Development, National Energy
Technology Laboratory, 626 Cochrans Mill Road, Pittsburgh, PA 15236 2 U. S. Department of Energy, National Energy Technology Laboratory, URS, 626
Cochrans Mill Road, Pittsburgh, PA 15236 3 University of Pittsburgh, Department of Chemical and Petroleum Engineering, Benedum
Hall, 3700 O'Hara Street, Pittsburgh, PA 15261 4 Virginia Commonwealth University, Department of Chemical and Life Sciences
Engineering, 601 West Main Street, Richmond, VA 23284
NETL-TRS-5-2014
3 October 2014
NETL Contacts:
Isaac K. Gamwo, Principal Investigator
Kelly Rose, Technical Coordinator
George Guthrie, Focus Area Lead

This page intentionally left blank.
High-Temperature, High-Pressure Equation of State: Solidification of Hydrocarbons and Viscosity Measurement of Krytox Oil Using Rolling-Ball Viscometer
I
Table of Contents EXECUTIVE SUMMARY ...........................................................................................................1 1. INTRODUCTION ..................................................................................................................3 2. SOLIDIFICATION OF HYDROCARBONS ......................................................................5
2.1 EXPERIMENTAL .................................................................................................................5 2.2 RESULTS AND DISCUSSION ................................................................................................7 2.3 CONCLUSIONS .................................................................................................................14
3. BIS(2-ETHYLHEXYL) PHTHALATE (DEHP) DENSITY ...........................................16 3.1 EXPERIMENTAL ...............................................................................................................16 3.2 RESULTS AND DISCUSSION ..............................................................................................17 3.3 CONCLUSION ...................................................................................................................20
4. ROLLING-BALL VISCOSMETER ..................................................................................21 4.1 EXPERIMENTS ..................................................................................................................21 4.2 RESULTS AND DISCUSSION ..............................................................................................24 4.3 CONCLUSIONS .................................................................................................................35
5. REFERENCES .....................................................................................................................37
High-Temperature, High-Pressure Equation of State: Solidification of Hydrocarbons and Viscosity Measurement of Krytox Oil Using Rolling-Ball Viscometer
II
List of Figures Figure 1: View cell apparatus and picture of the view cell parts. ................................................... 6 Figure 2: Composite picture of the HTHP view cell apparatus in operation at one of the VCU
labs. ......................................................................................................................................... 7 Figure 3: Effect of pressures on the solidification temperatures of 2-methylnaphthalene. .......... 10 Figure 4: Effect of pressures on the solidification temperatures of p-xylene. .............................. 10 Figure 5: Percent deviation of the solidification temperature calculated with the quadratic
equation, Tcorr, from the available literature data .................................................................. 12 Figure 6: Percent deviation of the solidification temperatures calculated with the quadratic
equation, Tcorr, from the available literature data .................................................................. 12 Figure 7: Percent deviation of the solidification temperatures calculated with the Simon equation,
Tcorr, from the available literature data .................................................................................. 14 Figure 8: Percent deviation of the solidification temperatures calculated with the Simon equation,
Tcorr, from the available literature data .................................................................................. 14 Figure 9: Chemical structure of DEHP. ........................................................................................ 17 Figure 10: Schematic diagram of (A) the high-pressure view cell used in this study, and (B) the
LVDT used for volume measurements. ................................................................................ 17 Figure 11: Comparison of DEHP density data, ρ, obtained at different pressures, P, in this study
to a fit of the modified Tait equation. ................................................................................... 18 Figure 12: Chemical structure of the Krytox® GPL 100 series of fluorinated oils. ...................... 21 Figure 13: Expanded view of the windowed variable-volume rolling-ball viscometer. ............... 22 Figure 14: Complete system of the rolling-ball viscometer. ......................................................... 23 Figure 15: Rolling-ball viscometer calibration results based on terminal velocity of the Inconel
ball (d/D = 0.990). ................................................................................................................. 24 Figure 16: A linear fit (R2=0.98) of the intercept, a, values of the 298 K to 491 K linear isotherms
in Figure 14, when extrapolated to 533 K, a = 0.536 cm4·m-1·s-2. ....................................... 25 Figure 17: A linear fit (R2=0.99) of the slope, b, values of the linear isotherms in Figure 14, when
extrapolated to 533 K, b = 1.944 x10⁻³ cm4·m-1·s-2·MPa-1. .................................................. 25 Figure 18: Surface fitting of the DEHP viscosity data at 298 K, 311 K, 372 K, and 491 K and
extrapolated DEHP viscosity values at 533 K. ..................................................................... 26 Figure 19: Fitting parameter β in Equation 11 as a function of temperature. ............................... 27 Figure 20: Comparison of the calculated calibration constant using Equation 11 with the
experimental data. ................................................................................................................. 28 Figure 21: Rolling-ball viscometer results for the viscosity of Krytox® GPL 102 (lot K 1537)
over a wide-range of pressure at 311 K, 372 K, and 533 K. ................................................. 29 Figure 22: Log-log plot of f versus Re for the rolling-ball viscometer experiments. A linear
correlation for each isotherm such as those shown is indicative of laminar flow. ............... 30 Figure 23: Chandler Couette rheometer results for Krytox® GPL 101 at 242 MPa and 275 MPa
and 533 K. ............................................................................................................................. 32 Figure 24: Chandler Couette rheometer results for Krytox® GPL 102 at 208 MPa and 242 MPa
and 533 K. ............................................................................................................................. 32 Figure 25: A comparison of the 533 K viscosity values of Krytox® GPL 102 based on the rolling-
ball viscometer and the Couette rheometer at 1021 s-1. ........................................................ 34 Figure 26: Semi-log plot of Krytox® GPL 102 (lot K 1537) viscosity versus pressure. ............. 35
High-Temperature, High-Pressure Equation of State: Solidification of Hydrocarbons and Viscosity Measurement of Krytox Oil Using Rolling-Ball Viscometer
III
List of Tables Table 1: Solidification data for cyclooctane, cis-1,2-dimethylcyclohexane, and trans-1,4-
dimethylcyclohexane .............................................................................................................. 8 Table 2: Solidification data for p-xylene, o-xylene, and 2-methylnaphthalene .............................. 8 Table 3: Comparison of the solid-liquid transition data from this study to that available in the
literature .................................................................................................................................. 9 Table 4: Values for the solidification temperature at ambient pressure, T0, coefficients of the
quadratic equation (Equation 1), Ao, A1, and A2, the absolute average deviation (AAD, Equation 2), and the absolute average percent deviation (AAPD, Equation 3) .................... 11
Table 5: Values for the solidification temperature at ambient pressure, T0; coefficients of the Simon equation (Equation 4), a and c; and the absolute average deviation (AAD, Equation 2) and the absolute average percent deviation (AAPD, Equation 3). ................................... 13
Table 6: Experimental density data, ρ, at different temperatures, T, and pressures, P, for DEHP obtained in this study.a .......................................................................................................... 18
Table 7: Tait equation parameters, Band C, the mean absolute percent deviation, δ, and the standard deviation, λ, values obtained for each density isotherm, T. C has a constant value of 0.2275. .............................................................................................................................. 19
Table 8: Parameters, ai and bi, used in Equations 3 and 4 to predict o(T) and B(T) obtained from the fit of the Tait equation to the high-pressure density isotherms reported in this study and with C equal to 0.2275. ......................................................................................................... 20
Table 9: Coefficients of Equation 10 for viscosity of DEHP ....................................................... 26 Table 10: Krytox® GPL 102 rolling ball viscosity data. The conditions very close to the DVS
conditions are shown in bold ................................................................................................ 29 Table 11: Reynolds numbers, Re, and average shear rates, γ, associated with the rolling-ball
viscometer experiments. ....................................................................................................... 30 Table 12: Chandler Couette rheometer results for Krytox® GPL 101 and 102 obtained during two
separate runs. Approximately40 s required to achieve steady state at shear rate 1,021s-1.... 33 Table 13: Coefficients of surface fitting correlation, Equation 10, for Krytox® GPL 102 ........... 34

High-Temperature, High-Pressure Equation of State: Solidification of Hydrocarbons and Viscosity Measurement of Krytox Oil Using Rolling-Ball Viscometer
IV
This page intentionally left blank.
High-Temperature, High-Pressure Equation of State: Solidification of Hydrocarbons and Viscosity Measurement of Krytox Oil Using Rolling-Ball Viscometer
V
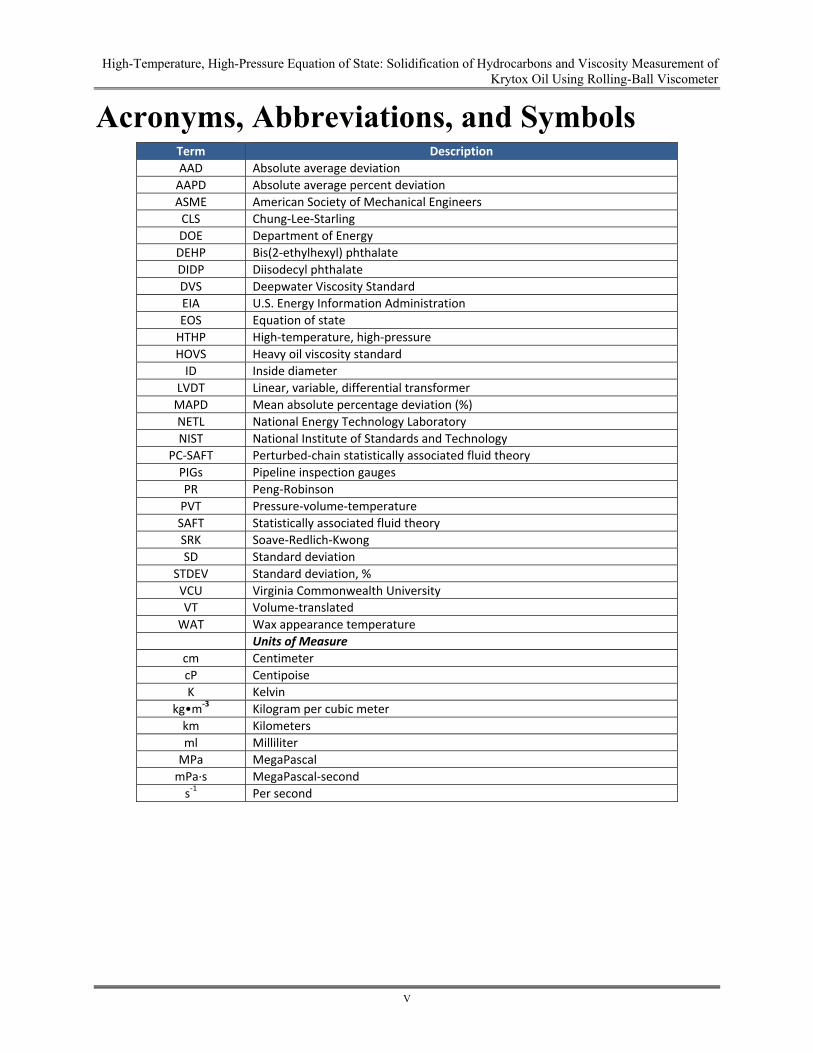
Acronyms, Abbreviations, and Symbols Term Description
AAD Absolute average deviation
AAPD Absolute average percent deviation
ASME American Society of Mechanical Engineers
CLS Chung‐Lee‐Starling
DOE Department of Energy
DEHP Bis(2‐ethylhexyl) phthalate
DIDP Diisodecyl phthalate
DVS Deepwater Viscosity Standard
EIA U.S. Energy Information Administration
EOS Equation of state
HTHP High‐temperature, high‐pressure
HOVS Heavy oil viscosity standard
ID Inside diameter
LVDT Linear, variable, differential transformer
MAPD Mean absolute percentage deviation (%)
NETL National Energy Technology Laboratory
NIST National Institute of Standards and Technology
PC‐SAFT Perturbed‐chain statistically associated fluid theory
PIGs Pipeline inspection gauges
PR Peng‐Robinson
PVT Pressure‐volume‐temperature
SAFT Statistically associated fluid theory
SRK Soave‐Redlich‐Kwong
SD Standard deviation
STDEV Standard deviation, %
VCU Virginia Commonwealth University
VT Volume‐translated
WAT Wax appearance temperature Units of Measure
cm Centimeter
cP Centipoise
K Kelvin
kg•m‐3 Kilogram per cubic meter
km Kilometers
ml Milliliter
MPa MegaPascal
mPa∙s MegaPascal‐second
s‐1 Per second
High-Temperature, High-Pressure Equation of State: Solidification of Hydrocarbons and Viscosity Measurement of Krytox Oil Using Rolling-Ball Viscometer
VI
Acknowledgments This work was completed as part of National Energy Technology Laboratory (NETL) research for the Department of Energy’s (DOE) Complementary Research Program under Section 999 of the Energy Policy Act of 2005. The authors wish to acknowledge Elena Melchert (DOE Office of Fossil Energy) for programmatic guidance, direction, and support.
The authors wish to acknowledge the excellent guidance, contributions, and cooperation of the NETL staff, particularly: Roy Long, NETL Technology Manager for providing technical guidance, continued coordination support for this project with industry, and the financial support of this project; George Guthrie, NETL-ORD Focus Area Lead who has been instrumental in leading various aspects from the initial level of the development of this project to the preparation of this report; and Kelly Rose, NETL-ORD-Offshore Technical Coordinator for continuous support of this project.
High-Temperature, High-Pressure Equation of State: Solidification of Hydrocarbons and Viscosity Measurement of Krytox Oil Using Rolling-Ball Viscometer
1
EXECUTIVE SUMMARY
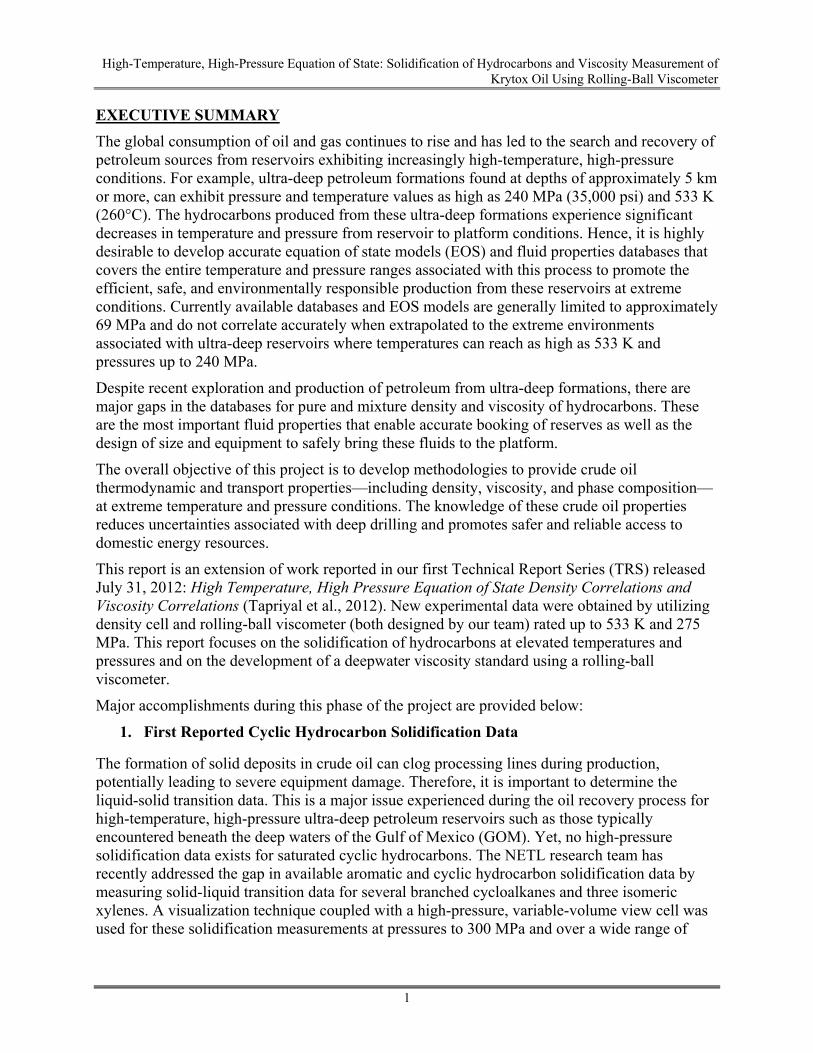
The global consumption of oil and gas continues to rise and has led to the search and recovery of petroleum sources from reservoirs exhibiting increasingly high-temperature, high-pressure conditions. For example, ultra-deep petroleum formations found at depths of approximately 5 km or more, can exhibit pressure and temperature values as high as 240 MPa (35,000 psi) and 533 K (260°C). The hydrocarbons produced from these ultra-deep formations experience significant decreases in temperature and pressure from reservoir to platform conditions. Hence, it is highly desirable to develop accurate equation of state models (EOS) and fluid properties databases that covers the entire temperature and pressure ranges associated with this process to promote the efficient, safe, and environmentally responsible production from these reservoirs at extreme conditions. Currently available databases and EOS models are generally limited to approximately 69 MPa and do not correlate accurately when extrapolated to the extreme environments associated with ultra-deep reservoirs where temperatures can reach as high as 533 K and pressures up to 240 MPa.
Despite recent exploration and production of petroleum from ultra-deep formations, there are major gaps in the databases for pure and mixture density and viscosity of hydrocarbons. These are the most important fluid properties that enable accurate booking of reserves as well as the design of size and equipment to safely bring these fluids to the platform.
The overall objective of this project is to develop methodologies to provide crude oil thermodynamic and transport properties—including density, viscosity, and phase composition—at extreme temperature and pressure conditions. The knowledge of these crude oil properties reduces uncertainties associated with deep drilling and promotes safer and reliable access to domestic energy resources.
This report is an extension of work reported in our first Technical Report Series (TRS) released July 31, 2012: High Temperature, High Pressure Equation of State Density Correlations and Viscosity Correlations (Tapriyal et al., 2012). New experimental data were obtained by utilizing density cell and rolling-ball viscometer (both designed by our team) rated up to 533 K and 275 MPa. This report focuses on the solidification of hydrocarbons at elevated temperatures and pressures and on the development of a deepwater viscosity standard using a rolling-ball viscometer.
Major accomplishments during this phase of the project are provided below:
1. First Reported Cyclic Hydrocarbon Solidification Data
The formation of solid deposits in crude oil can clog processing lines during production, potentially leading to severe equipment damage. Therefore, it is important to determine the liquid-solid transition data. This is a major issue experienced during the oil recovery process for high-temperature, high-pressure ultra-deep petroleum reservoirs such as those typically encountered beneath the deep waters of the Gulf of Mexico (GOM). Yet, no high-pressure solidification data exists for saturated cyclic hydrocarbons. The NETL research team has recently addressed the gap in available aromatic and cyclic hydrocarbon solidification data by measuring solid-liquid transition data for several branched cycloalkanes and three isomeric xylenes. A visualization technique coupled with a high-pressure, variable-volume view cell was used for these solidification measurements at pressures to 300 MPa and over a wide range of
High-Temperature, High-Pressure Equation of State: Solidification of Hydrocarbons and Viscosity Measurement of Krytox Oil Using Rolling-Ball Viscometer
2
temperatures starting at 293 K. These findings were released in the journal Fuel 2013, 111, 75–80.
2. Published First Paper on Deepwater Viscosity Standard. Identified Krytox 102 as a Viable Fluid for Deepwater Viscosity Standard (DVS)
This research is the first to successfully suggest and experimentally verify a fluid that exhibits the requirements of a desired Deepwater Viscosity Standard (DVS). Using both the rolling-ball viscometer and the National Energy Technology Laboratory (NETL) high-temperature, high-pressure (HTHP) Couette viscometer, the group determined that the perfluorpolyether oil known as DuPont Krytox 102 is a good candidate. Krytox 102 has a viscosity of ~26 cP at 533 K and 241 MPa. This viscosity is sufficiently close to 20 cP and has been suggested, in collaboration with the National Institute of Standards and Technology (NIST), as the Deepwater Viscosity Standard. If accepted, this fluid will allow industry and researchers to calibrate high-pressure viscometers and rheometers prior to studying oils found in ultra-deep reservoirs at extreme conditions. Results have been presented to the rheology community and were released in the International Journal of Thermophysics (Baled, 2013). Seven research groups in Australia, Spain, United Kingdom, and USA have already asked the NETL Research Team to provide Krytox 102 samples from the same lot for their studies of this fluid with their viscometers. To date none of these other groups have been able to obtain viscosity data at extreme conditions of 533 K and 241 MPa.
NETL’s research team has lead development of both a deepwater viscosity standard and cyclic hydrocarbon solidification data for the broader scientific community. The ability to identify and characterize a safe, inert, thermally-stable, environmentally-benign fluid that represents the rheology properties of light oils found in ultra-deep formations typically accessed via offshore platforms in the deep waters of the Gulf of Mexico, will foster safer drilling from reservoirs found in extreme conditions of temperatures and pressures.
High-Temperature, High-Pressure Equation of State: Solidification of Hydrocarbons and Viscosity Measurement of Krytox Oil Using Rolling-Ball Viscometer
3
1. INTRODUCTION
An assessment by the U.S. Energy Information Administration (EIA) projected that world energy consumption will grow by 56% between 2010 and 2040 (International Energy Outlook, 2013). Renewable sources of energy such as wind, solar and nuclear continue to play an important role, but fossil fuels will supply almost 80% of world energy use through 2040. To meet high demand, oil companies have to explore reservoirs at high temperature and pressure conditions.
After discovery of a reservoir, initial development of the field is dependent on volumetric estimation. Accurate density, viscosity, and phase composition predictions from accurate equation of state (EOS) models and transport equations must be available to better understand the amount of recoverable petroleum, as well as the economic potential of the reservoir and the rates at which this resource can be produced. Due to lack of experimental data at these conditions, various EOS models are used to predict the crude oil properties and determine reservoir evaluations. However, there are no EOS models which can predict the density and viscosity of crude oil accurately within 5% at extreme conditions. There are also many other challenges associated with drilling and production at these extreme conditions such lack of materials, electronics, tools, and calibrations standards that can be used at high-temperature, high-pressure (HTHP) conditions.
This project concentrates on generating the thermodynamic and transport properties (density, viscosity, phase behavior) data of oil or gas at extreme conditions of temperatures and pressures. This experimental data will be used to develop EOS and viscosity models, which are optimized and validated for HTHP conditions. These models are used in reservoir simulators to mimic the release of oil from reservoirs and to design equipment and materials to safely bring these fluids to platform conditions. One of the outcomes of this project will be increased safety while drilling ultra-deep wells and maintaining the long-term production of petroleum from these wells.
Solidification of Hydrocarbons:
The high temperatures and pressures associated with deep reservoirs maintain the high molecular weight organic substance of crude oil in a liquid state. However, during production, from ultra-deep reservoir, the heavy crude oil components start to precipitate due to a decrease in temperature and pressure. These heavy components accumulation constricts the flow area and can ultimately decrease production rates leading to economic losses. Here, the effect of pressure on the solidification of several saturated cyclic hydrocarbons and three xylene isomers was experimentally determined. The empirical quadratic equation and Simon equation were fit to the data for estimating solidification conditions.
Viscosity Standard Development:
Viscosity plays an important role in determining production rate and flow profile of crude oil. Current viscosity measurement techniques and instruments are optimized for low temperature and pressure conditions. The same instruments are used to measure the viscosity at HTHP conditions leading to uncertainties. To date there is no commercial or research-grade viscosity standard that can be used for accurate calibration of rheology equipment at extreme conditions associated with oils in ultra-deep formations. Krytox 102 was identified “Deepwater Viscosity Standard (DVS)” that exhibits the viscosity of 26 cP at 533 K and 241 MPa.
High-Temperature, High-Pressure Equation of State: Solidification of Hydrocarbons and Viscosity Measurement of Krytox Oil Using Rolling-Ball Viscometer
4
At the High-Temperature High-Pressure Workshop initiated by Schlumberger and Cambridge Viscosity (HTHP, 2010), it was concluded that a fluid with the properties of light oils found in ultra-deep formations needs to be identified and used as the deepwater viscosity standard or DVS. Such fluid has increasing importance as the search for oil sources in increasingly harsh conditions escalates. Our work has shown that DuPont’s Krytox® perfluoropolyether oils are an excellent DVS candidate. Krytox® oils were used because they are not susceptible to photochemical decay and they exhibit remarkable chemical and thermal stability (Paciorek et al., 1979). It was determined that Krytox® GPL 101 has a viscosity slightly less than the targeted value, while Krytox® GPL 102 exhibits a viscosity slightly above the 20 mPa·s value. A rolling-ball viscometer and Couette viscometer were used to determine the viscosity of this fluid over a wide range of temperature and pressure and to ascertain how closely this oil matches the target viscosity of 20 mPa·s at 533 K and 241 MPa.
High-Temperature, High-Pressure Equation of State: Solidification of Hydrocarbons and Viscosity Measurement of Krytox Oil Using Rolling-Ball Viscometer
5
2. SOLIDIFICATION OF HYDROCARBONS
Solidification in the pipelines is primarily caused by asphaltenes (high molecular weight aromatic organic substances) and waxes (high molecular weight, highly saturated organic substances) present in crude oil. Asphaltenes and wax solubility in crude oil is highly dependent on temperature, pressure, and overall composition of crude oil. They may start to precipitate due to a change in temperature and pressure during production. The undesired formation of solid deposits in crude oil leads to problems in its storage, transportation, and end use since these deposits can clog processing lines, which can subsequently damage sensitive equipment (Machado et al., 2008). During oil production from the reservoir, solidification can happen at pipeline inner walls and will increase radially as the temperature and pressure is further reduced. Several methods are used to suppress the formation of solid crystals when processing crude and lube oil (Goncalves et al., 2010; Marie et al., 2005; Petinelli, 1979; Ashbaugh et al., 2002; Senra et al., 2009; Ray et al., 2009). Methods used to treat wax deposits include chemical, thermal, and mechanical treatment. Examples of these include:
Chemicals are used for pour point depressants and wax inhibitors. They work by altering the properties of the crude oil to reduce wax formation. This method requires a high amount of additives (depending on crude oil properties) and is expensive.
Thermal treatment utilizes superheated steam or hot water flushed in the pipelines. This enables the melting of waxy deposits. This treatment requires plant shutdown which results in economic losses.
Mechanical treatment methods use pipeline inspection gauges (PIGs) and wax cutting to clean wax deposited on pipeline inner walls and are pushed along the line by the pressure of the oil flow. However, plugs are difficult to find in a long pipeline and, depending on the nature of plug, could be very expensive.
There is a substantial amount of literature reporting high-pressure, solid-liquid phase equilibrium data for n-paraffins up to carbon number 60 (Petinelli, 1979; Ji et al., 2004; Coutinho et al., 2000; Srivastava et al., 1992). These studies also report that the solid crystal structure of an n-paraffin not only depends on the number of carbons in the paraffin, but also whether the number of carbons is odd or even. There are fewer available literature studies on the effect of pressure on the solidification behavior of cyclic and aromatic hydrocarbons with the exception of several high-pressure studies on cyclohexane and benzene (Nagaoka and Makita, 1987a; Tanaka and Kawakami, 1996; Domańska and Morawski, 2004; Domańska et al., 2006). In this study, we determined the solid-liquid phase boundary of pure cyclooctane, methylcyclohexane, ethylcyclohexane, cis-1,2-dimethylcyclohexane, cis-1,4-dimethylcyclohexane, trans-1,4-dimethylcyclohexane, p-xylene, m-xylene, o-xylene, and 2-methylnaphthalene to pressures of 300 MPa and at temperatures starting at 293 K. The experimental solid-liquid phase transition data was fitted to two empirical equations, a second-order polynomial equation, and the Simon equation.
2.1 EXPERIMENTAL
2.1.1 Material
The following chemicals were purchased from Sigma-Aldrich and used as received: Cyclooctane (≥ 99 wt% purity), methylcyclohexane (≥ 99 wt% purity), ethylcyclohexane ( ≥ 99 wt% purity),
High-Temperature, High-Pressure Equation of State: Solidification of Hydrocarbons and Viscosity Measurement of Krytox Oil Using Rolling-Ball Viscometer
6
cis-1,2-dimethylcyclohexane (99 wt% purity), cis-1,4-dimethylcyclohexane ( 99 wt% purity), trans-1,4-dimethylcyclohexane ( ≥ 98 wt% purity), p-xylene ( ≥ 99 wt% purity), o-xylene ( ≥ 99 wt% purity), m-xylene ( ≥ 99 wt% purity), and 2-methylnaphthalene (97 wt% purity).
2.1.2 Density Cell
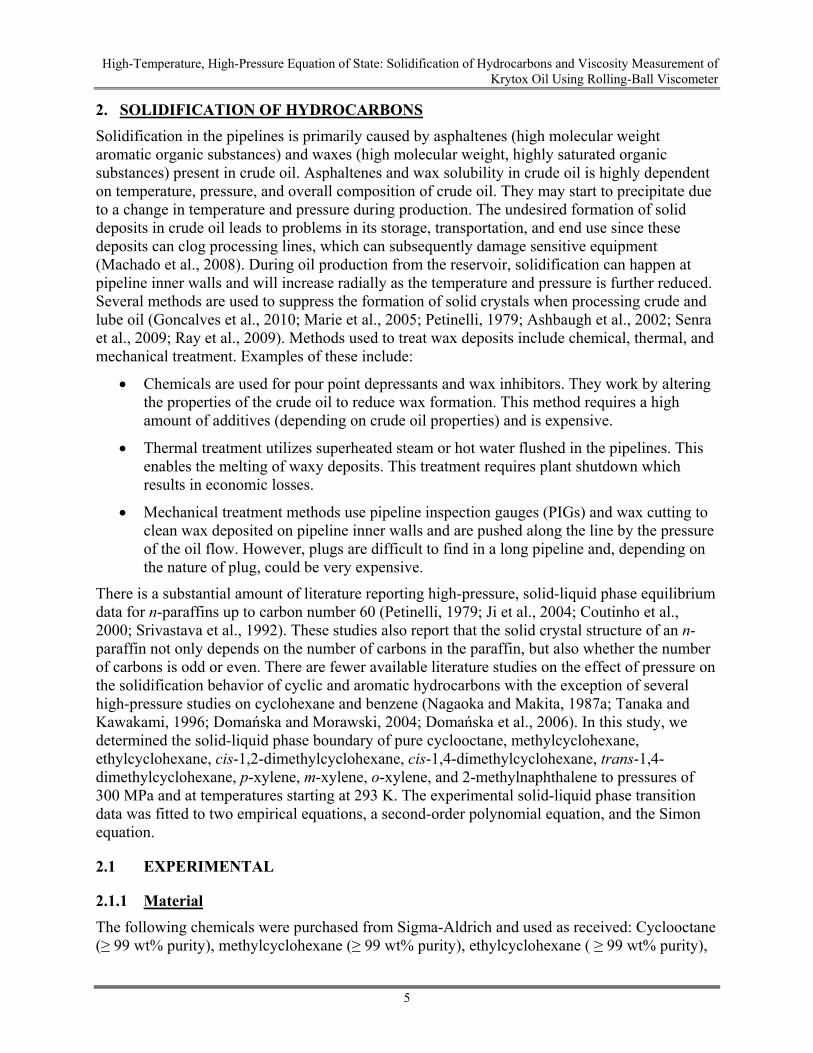
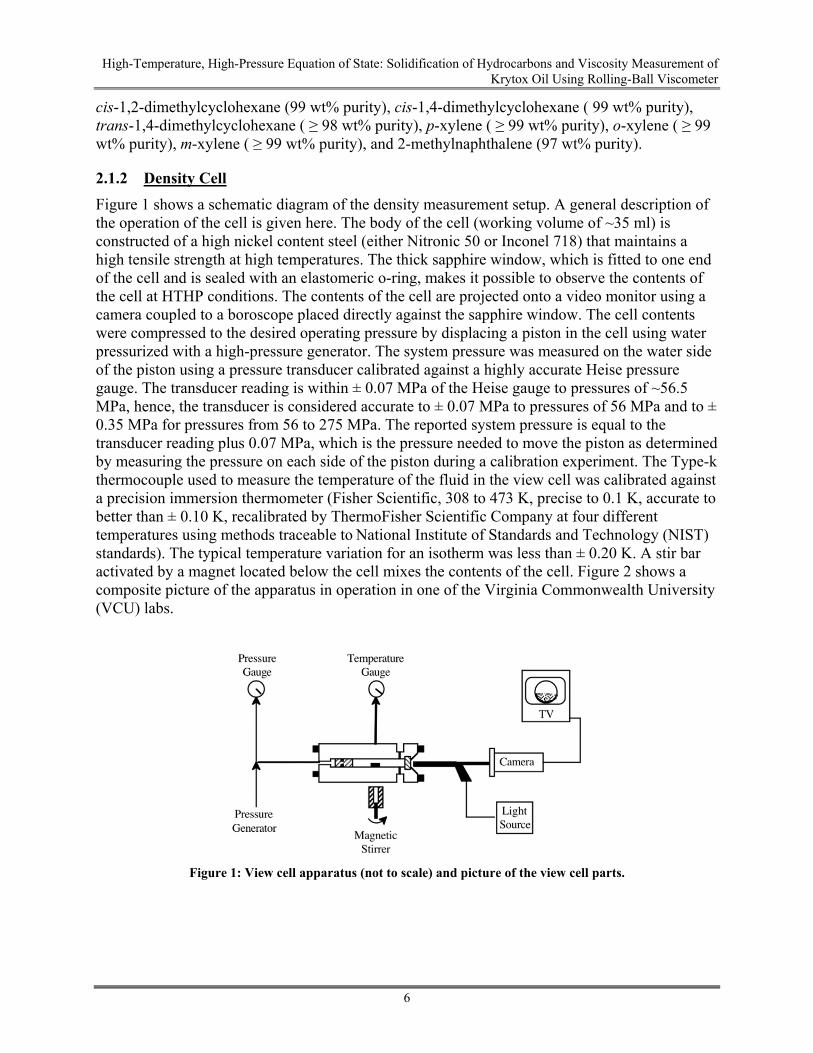
Figure 1 shows a schematic diagram of the density measurement setup. A general description of the operation of the cell is given here. The body of the cell (working volume of ~35 ml) is constructed of a high nickel content steel (either Nitronic 50 or Inconel 718) that maintains a high tensile strength at high temperatures. The thick sapphire window, which is fitted to one end of the cell and is sealed with an elastomeric o-ring, makes it possible to observe the contents of the cell at HTHP conditions. The contents of the cell are projected onto a video monitor using a camera coupled to a boroscope placed directly against the sapphire window. The cell contents were compressed to the desired operating pressure by displacing a piston in the cell using water pressurized with a high-pressure generator. The system pressure was measured on the water side of the piston using a pressure transducer calibrated against a highly accurate Heise pressure gauge. The transducer reading is within ± 0.07 MPa of the Heise gauge to pressures of ~56.5 MPa, hence, the transducer is considered accurate to ± 0.07 MPa to pressures of 56 MPa and to ± 0.35 MPa for pressures from 56 to 275 MPa. The reported system pressure is equal to the transducer reading plus 0.07 MPa, which is the pressure needed to move the piston as determined by measuring the pressure on each side of the piston during a calibration experiment. The Type-k thermocouple used to measure the temperature of the fluid in the view cell was calibrated against a precision immersion thermometer (Fisher Scientific, 308 to 473 K, precise to 0.1 K, accurate to better than ± 0.10 K, recalibrated by ThermoFisher Scientific Company at four different temperatures using methods traceable to National Institute of Standards and Technology (NIST) standards). The typical temperature variation for an isotherm was less than ± 0.20 K. A stir bar activated by a magnet located below the cell mixes the contents of the cell. Figure 2 shows a composite picture of the apparatus in operation in one of the Virginia Commonwealth University (VCU) labs.
Figure 1: View cell apparatus (not to scale) and picture of the view cell parts.
High-Temperature, High-Pressure Equation of State: Solidification of Hydrocarbons and Viscosity Measurement of Krytox Oil Using Rolling-Ball Viscometer
7
Figure 2: Composite picture of the HTHP view cell apparatus in operation at one of the
VCU labs. Schematic diagram of (2) the high-pressure view cell used in this study, and (3) the linear variable differential transformer (LVDT) used for volume measurements.
2.1.3 Experimental Procedure
Initially the temperature and pressure were adjusted until the hydrocarbon liquid phase in the cell was clear. The pressure was then isothermally increased and held constant for approximately 10 min. If the liquid remained clear, the pressure was increased until it became opaque and solid crystals were observed. The pressure was then decreased to obtain a clear liquid phase. This process was repeated until the interval between a clear phase and a slightly opaque solution with solid crystals was less than 0.34 MPa. This procedure was repeated at a new temperature to determine the new solidification pressure.
2.2 RESULTS AND DISCUSSION
2.2.1 Experimental Data
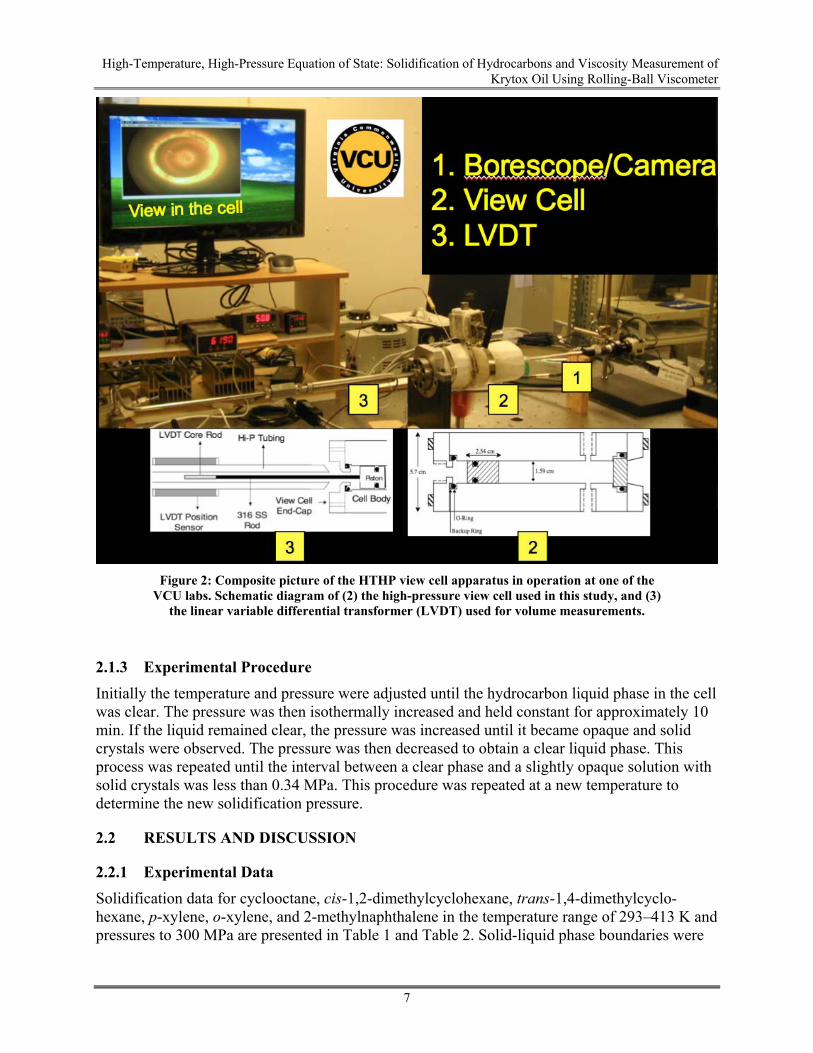
Solidification data for cyclooctane, cis-1,2-dimethylcyclohexane, trans-1,4-dimethylcyclo-hexane, p-xylene, o-xylene, and 2-methylnaphthalene in the temperature range of 293–413 K and pressures to 300 MPa are presented in Table 1 and Table 2. Solid-liquid phase boundaries were
High-Temperature, High-Pressure Equation of State: Solidification of Hydrocarbons and Viscosity Measurement of Krytox Oil Using Rolling-Ball Viscometer
8
not observed for methylcyclohexane, ethylcyclohexane, cis-1,4-dimethylcyclohexane, and m-xylene when operating at the same the temperature and pressure ranges.
Table 1: Solidification data for cyclooctane, cis-1,2-dimethylcyclohexane, and trans-1,4-dimethylcyclohexane
Cyclooctane cis‐1,2‐Dimethylcyclohexane trans‐1,4‐Dimethylcyclohexane
P (MPa) T (K) P (MPa) T (K) P (MPa) T (K)
18.4 294.9 202.7 295.7 172.1 295.2
63.4 314.9 212.4 298.6 181.3 298.3
103.7 333.5 217.2 300.5 193.5 302.1
196.2 373.8 219.9 301.5 227.9 312.6
247.6 394.4 230.2 304.8 252.3 320.3
300.8 413.4 242.2 309.1 273.3 326.3
Table 2: Solidification data for p-xylene, o-xylene, and 2-methylnaphthalene
p‐Xylene o‐Xylene 2‐Methylnaphthalene
P (MPa) T (K) P (MPa) T (K) P (MPa) T (K)
26.9 295.1 210.2 295.0 19.2 312.3
53.3 304.0 212.4 295.6 52.3 320.3
87.8 315.2 223.4 298.1 124.1 339.1
120.3 325.6 238.5 301.9 188.1 355.0
185.5 345.6 243.7 303.1 227.8 364.2
226.8 357.7 251.0 304.7 245.1 368.1
261.4 367.1 262.5 307.1 265.6 372.6
These data are compared to the literature data, which are very limited, in Table 3. Several researchers only reported two or three solidification temperatures at high pressures. This limits the accuracy of their solidification temperatures estimated at other pressures. There is a fair amount of solid-liquid literature data for 2-methyl naphthalene and p-xylene.

High-Temperature, High-Pressure Equation of State: Solidification of Hydrocarbons and Viscosity Measurement of Krytox Oil Using Rolling-Ball Viscometer
9
Table 3: Comparison of the solid-liquid transition data from this study to that available in the literature
Literature Data Points
Temperatures (K)
Temperatures
Accuracy (±K)
Maximum Pressure (MPa)
Pressures (MPa) for Solid‐Liquid Transition Data
Pressures Accuracy (±MPa)
p‐Xylene
Bridgman, 1926 2 303.2, 348.2 ‐ 186* 186 < P < 260 ‐
Castro et al., 1994 20 285.3 to 297.7
0.01 38 38 < P < 260 0.01
Isaacs, 1981 3 298.2,
319.2, 353.2 ‐ 228 228 < P < 260 ‐
Nagaoka and Makita, 1988; Nagaoka et al. 1989
4 293.2 to 323.2
0.1 114 114 < P < 260 0.5
Takagi, 1981 1 303.2 ‐ 52 52 < P < 260 ‐
o‐Xylene
Bridgman, 1926 2 303.2, 348.2 ‐ 539* P < 263 ‐
Isaacs, 1981 3 269.7,
298.2, 303.2 ‐ 251 251 < P < 263 ‐
2‐Methylnaphthalene
Kulkarni et al., 1974 3 323.2,
342.4, 357.2 0.1 203 203 < P < 266 1.3
Nagaoka and Makita, 1987b
5 308.2 to 343.2
0.1 137 137 < P < 266 0.5
Yokoyama et al., 1993
3 307.1 to 347.6
‐ 155 155 < P < 266 ‐
No Data for Cyclooctane, cis‐1,2‐Dimethylcyclohexane, and trans‐1,4‐Dimethylcyclohexane
*The pressure is an approximate value (Bridgman, 1926).
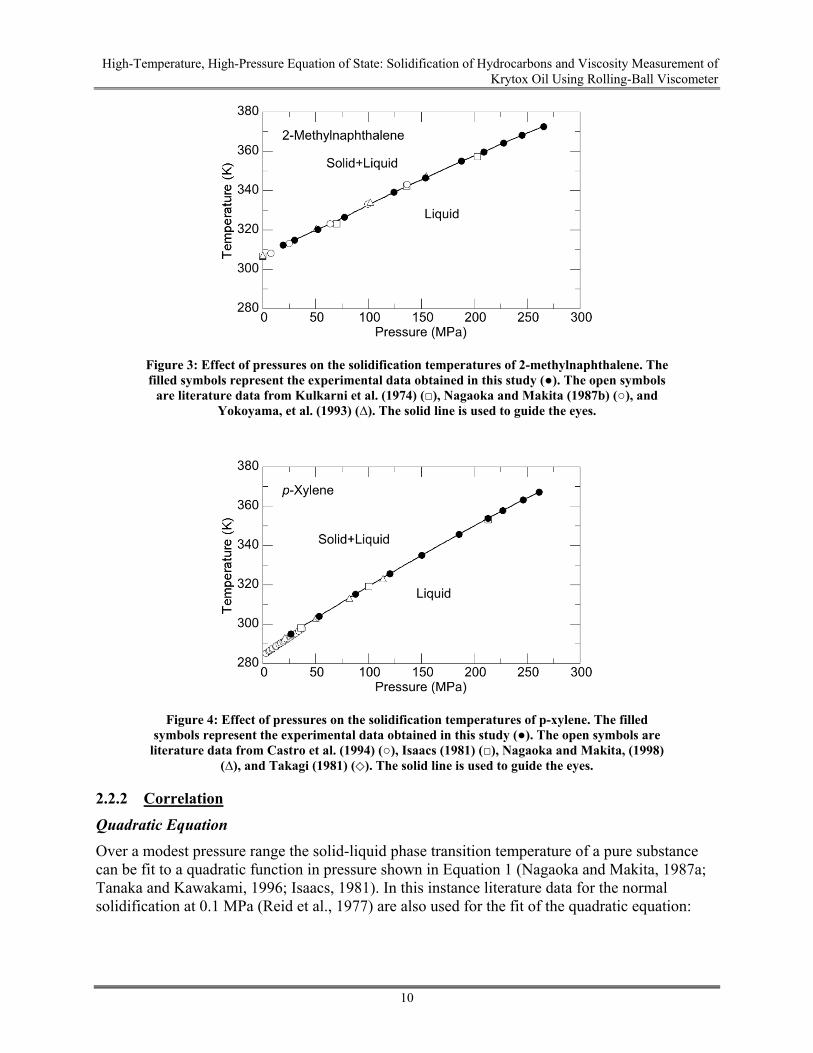
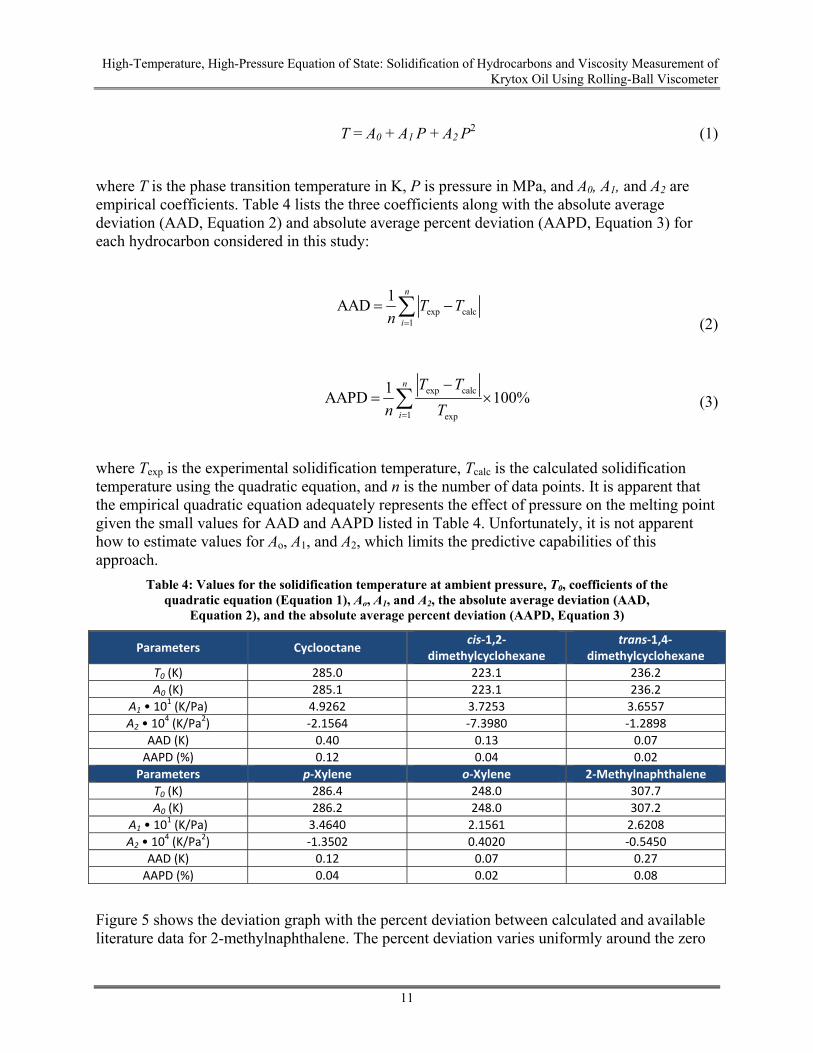
Solid-liquid phase boundary data for 2-methylnaphthalene are shown in Figure 3 and are in good agreement with literature data. Kulkarni et al. (1974) report data to within ± 0.1 K and ± 1.3 MPa; Nagaoka and Makita (1988, 1987b) report data to within ± 0.1 K and ± 0.5 MPa; and although Yokoyama et al. (1993) also report data for 2-methylnaphthalene, they do not report any accuracy for the temperatures and pressures. Figure 4 shows the solid-liquid data for p-xylene obtained in this study are in good agreement with literature data. Castro et al. (1994) reports data to within ± 0.01 K and ± 0.01 MPa; Isaacs (1981) reports data with no accuracy on the temperatures and pressures; Nagaoka and Makita (1988, 1987b) reports data to within ± 0.1 K and ± 0.5 MPa; and Takagi (1981) also reports data without any accuracy listed for the temperatures and pressures. Although the comparisons in Figure 3 and Figure 4 show very good agreement between literature data and data obtained in the present study for these few compounds, a more meaningful comparison can be made using a deviation graph showing the percent deviation between the two sets of solidification data. To facilitate the construction of a deviation graph, the experimental solidification temperatures obtained in this study are fit to a quadratic function of pressure so the data reported here can be compared directly to literature data at any temperature and pressure. Likewise, deviation graphs are constructed using the Simon equation fit to data obtained in the present study.
High-Temperature, High-Pressure Equation of State: Solidification of Hydrocarbons and Viscosity Measurement of Krytox Oil Using Rolling-Ball Viscometer
10
Figure 3: Effect of pressures on the solidification temperatures of 2-methylnaphthalene. The filled symbols represent the experimental data obtained in this study (●). The open symbols
are literature data from Kulkarni et al. (1974) (□), Nagaoka and Makita (1987b) (○), and Yokoyama, et al. (1993) (∆). The solid line is used to guide the eyes.
Figure 4: Effect of pressures on the solidification temperatures of p-xylene. The filled
symbols represent the experimental data obtained in this study (●). The open symbols are literature data from Castro et al. (1994) (○), Isaacs (1981) (□), Nagaoka and Makita, (1998)
(∆), and Takagi (1981) (◇). The solid line is used to guide the eyes.
2.2.2 Correlation
Quadratic Equation
Over a modest pressure range the solid-liquid phase transition temperature of a pure substance can be fit to a quadratic function in pressure shown in Equation 1 (Nagaoka and Makita, 1987a; Tanaka and Kawakami, 1996; Isaacs, 1981). In this instance literature data for the normal solidification at 0.1 MPa (Reid et al., 1977) are also used for the fit of the quadratic equation:
High-Temperature, High-Pressure Equation of State: Solidification of Hydrocarbons and Viscosity Measurement of Krytox Oil Using Rolling-Ball Viscometer
11
T = A0 + A1 P + A2 P2 (1)
where T is the phase transition temperature in K, P is pressure in MPa, and A0, A1, and A2 are empirical coefficients. Table 4 lists the three coefficients along with the absolute average deviation (AAD, Equation 2) and absolute average percent deviation (AAPD, Equation 3) for each hydrocarbon considered in this study:
exp calc1
1AAD
n
i
T Tn
(2)
exp calc
1 exp
1AAPD 100%
n
i
T T
n T
(3)
where Texp is the experimental solidification temperature, Tcalc is the calculated solidification temperature using the quadratic equation, and n is the number of data points. It is apparent that the empirical quadratic equation adequately represents the effect of pressure on the melting point given the small values for AAD and AAPD listed in Table 4. Unfortunately, it is not apparent how to estimate values for Ao, A1, and A2, which limits the predictive capabilities of this approach.
Table 4: Values for the solidification temperature at ambient pressure, T0, coefficients of the quadratic equation (Equation 1), Ao, A1, and A2, the absolute average deviation (AAD,
Equation 2), and the absolute average percent deviation (AAPD, Equation 3)
Parameters Cyclooctane cis‐1,2‐
dimethylcyclohexane trans‐1,4‐
dimethylcyclohexane
T0 (K) 285.0 223.1 236.2
A0 (K) 285.1 223.1 236.2
A1 • 101 (K/Pa) 4.9262 3.7253 3.6557
A2 • 104 (K/Pa2) ‐2.1564 ‐7.3980 ‐1.2898
AAD (K) 0.40 0.13 0.07
AAPD (%) 0.12 0.04 0.02
Parameters p‐Xylene o‐Xylene 2‐Methylnaphthalene
T0 (K) 286.4 248.0 307.7
A0 (K) 286.2 248.0 307.2
A1 • 101 (K/Pa) 3.4640 2.1561 2.6208
A2 • 104 (K/Pa2) ‐1.3502 0.4020 ‐0.5450
AAD (K) 0.12 0.07 0.27
AAPD (%) 0.04 0.02 0.08
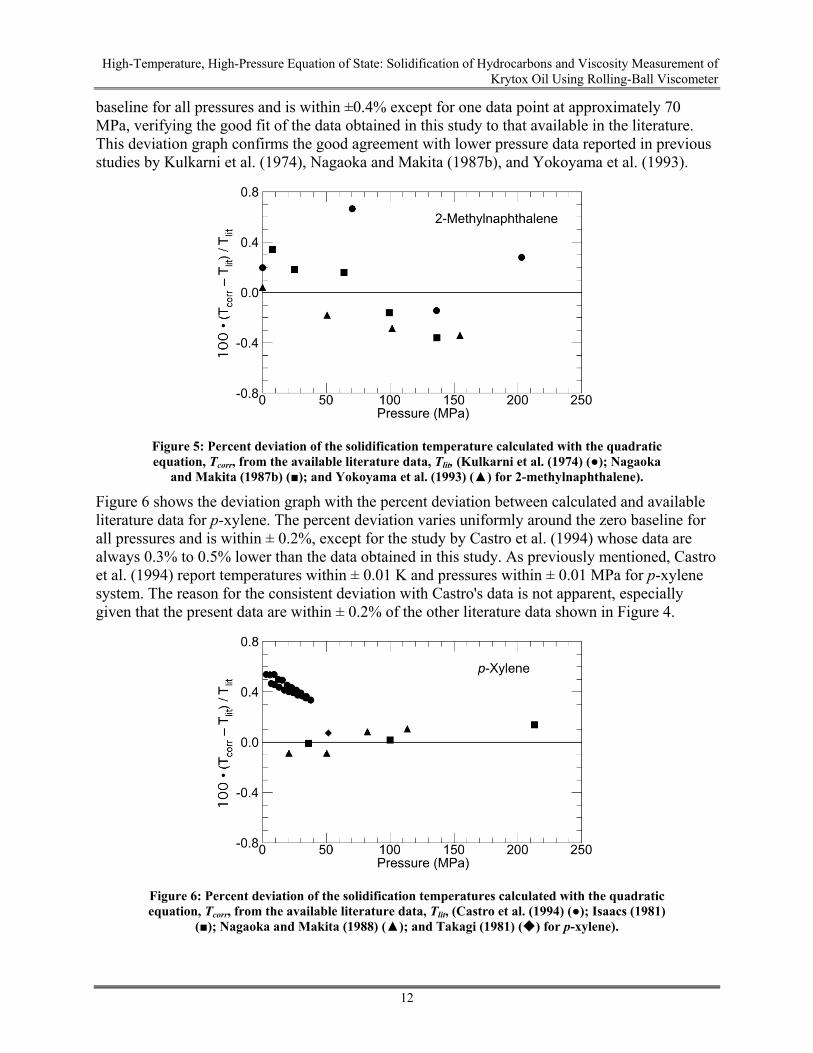
Figure 5 shows the deviation graph with the percent deviation between calculated and available literature data for 2-methylnaphthalene. The percent deviation varies uniformly around the zero
High-Temperature, High-Pressure Equation of State: Solidification of Hydrocarbons and Viscosity Measurement of Krytox Oil Using Rolling-Ball Viscometer
12
baseline for all pressures and is within ±0.4% except for one data point at approximately 70 MPa, verifying the good fit of the data obtained in this study to that available in the literature. This deviation graph confirms the good agreement with lower pressure data reported in previous studies by Kulkarni et al. (1974), Nagaoka and Makita (1987b), and Yokoyama et al. (1993).
Figure 5: Percent deviation of the solidification temperature calculated with the quadratic equation, Tcorr, from the available literature data, Tlit, (Kulkarni et al. (1974) (●); Nagaoka
and Makita (1987b) (■); and Yokoyama et al. (1993) (▲) for 2-methylnaphthalene).
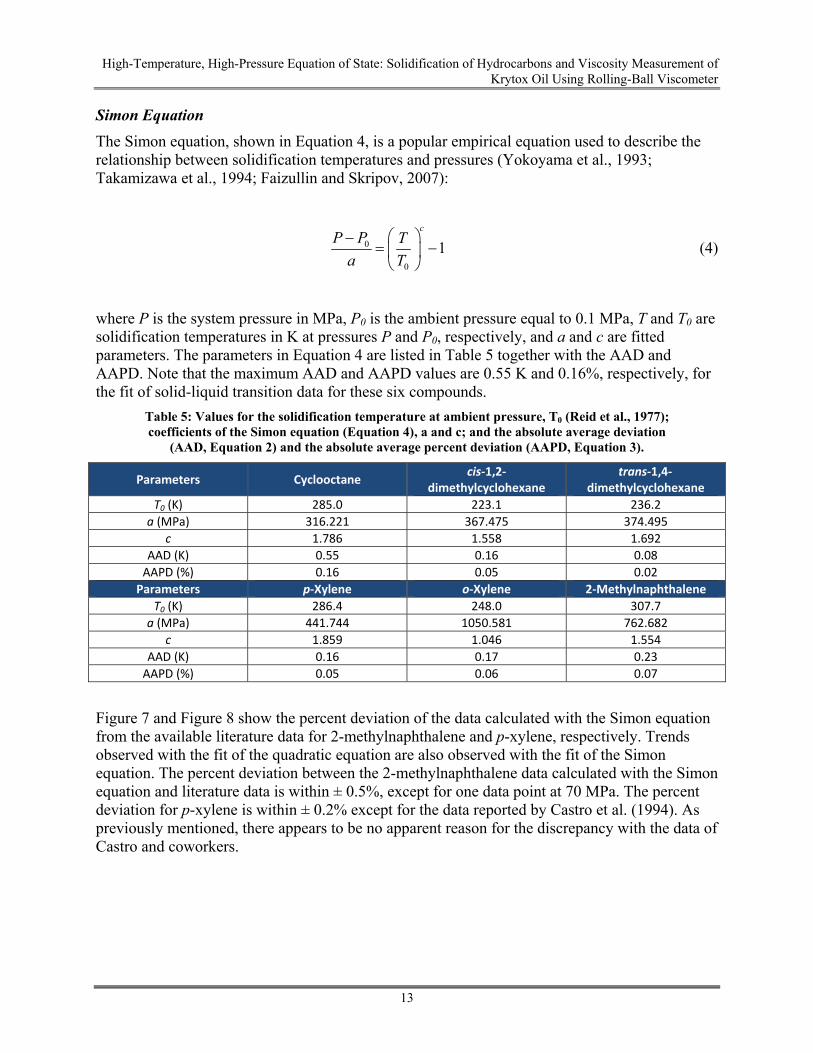
Figure 6 shows the deviation graph with the percent deviation between calculated and available literature data for p-xylene. The percent deviation varies uniformly around the zero baseline for all pressures and is within ± 0.2%, except for the study by Castro et al. (1994) whose data are always 0.3% to 0.5% lower than the data obtained in this study. As previously mentioned, Castro et al. (1994) report temperatures within ± 0.01 K and pressures within ± 0.01 MPa for p-xylene system. The reason for the consistent deviation with Castro's data is not apparent, especially given that the present data are within ± 0.2% of the other literature data shown in Figure 4.
Figure 6: Percent deviation of the solidification temperatures calculated with the quadratic equation, Tcorr, from the available literature data, Tlit, (Castro et al. (1994) (●); Isaacs (1981)
(■); Nagaoka and Makita (1988) (▲); and Takagi (1981) () for p-xylene).
High-Temperature, High-Pressure Equation of State: Solidification of Hydrocarbons and Viscosity Measurement of Krytox Oil Using Rolling-Ball Viscometer
13
Simon Equation
The Simon equation, shown in Equation 4, is a popular empirical equation used to describe the relationship between solidification temperatures and pressures (Yokoyama et al., 1993; Takamizawa et al., 1994; Faizullin and Skripov, 2007):
0
0
1c
P P T
a T
(4)
where P is the system pressure in MPa, P0 is the ambient pressure equal to 0.1 MPa, T and T0 are solidification temperatures in K at pressures P and P0, respectively, and a and c are fitted parameters. The parameters in Equation 4 are listed in Table 5 together with the AAD and AAPD. Note that the maximum AAD and AAPD values are 0.55 K and 0.16%, respectively, for the fit of solid-liquid transition data for these six compounds.
Table 5: Values for the solidification temperature at ambient pressure, T0 (Reid et al., 1977); coefficients of the Simon equation (Equation 4), a and c; and the absolute average deviation
(AAD, Equation 2) and the absolute average percent deviation (AAPD, Equation 3).
Parameters Cyclooctane cis‐1,2‐
dimethylcyclohexane trans‐1,4‐
dimethylcyclohexane
T0 (K) 285.0 223.1 236.2
a (MPa) 316.221 367.475 374.495
c 1.786 1.558 1.692
AAD (K) 0.55 0.16 0.08
AAPD (%) 0.16 0.05 0.02
Parameters p‐Xylene o‐Xylene 2‐Methylnaphthalene
T0 (K) 286.4 248.0 307.7
a (MPa) 441.744 1050.581 762.682
c 1.859 1.046 1.554
AAD (K) 0.16 0.17 0.23
AAPD (%) 0.05 0.06 0.07
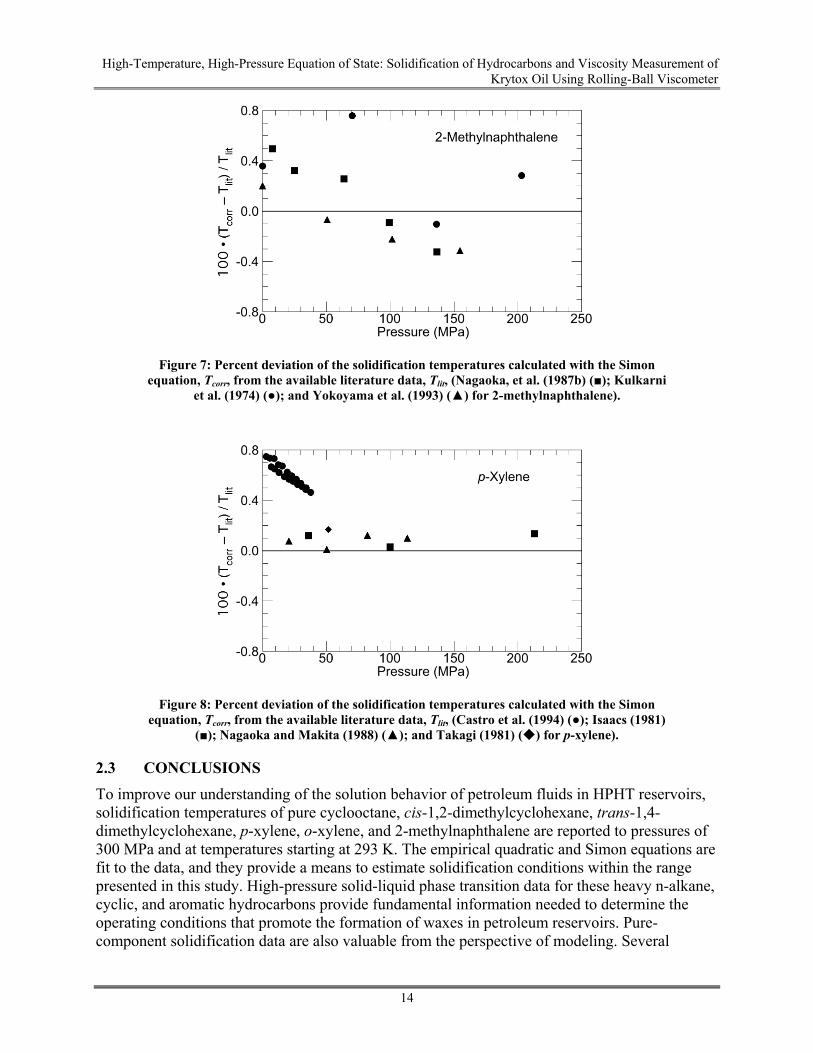
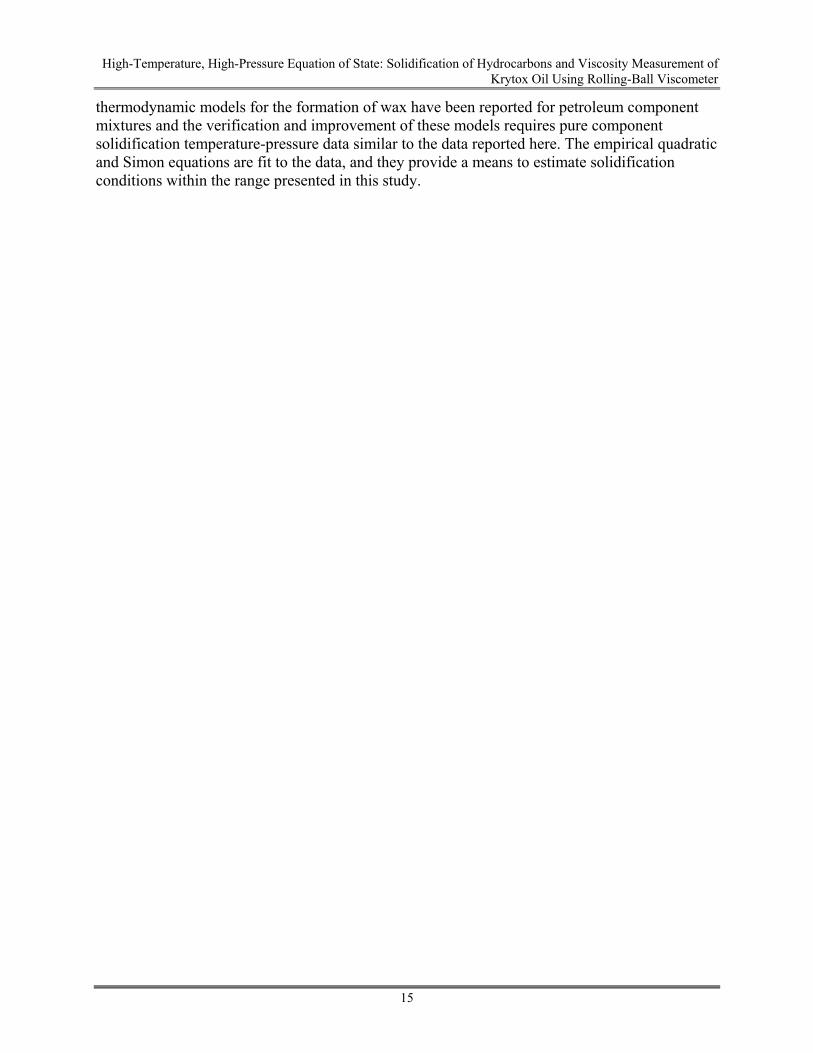
Figure 7 and Figure 8 show the percent deviation of the data calculated with the Simon equation from the available literature data for 2-methylnaphthalene and p-xylene, respectively. Trends observed with the fit of the quadratic equation are also observed with the fit of the Simon equation. The percent deviation between the 2-methylnaphthalene data calculated with the Simon equation and literature data is within ± 0.5%, except for one data point at 70 MPa. The percent deviation for p-xylene is within ± 0.2% except for the data reported by Castro et al. (1994). As previously mentioned, there appears to be no apparent reason for the discrepancy with the data of Castro and coworkers.
High-Temperature, High-Pressure Equation of State: Solidification of Hydrocarbons and Viscosity Measurement of Krytox Oil Using Rolling-Ball Viscometer
14
Figure 7: Percent deviation of the solidification temperatures calculated with the Simon
equation, Tcorr, from the available literature data, Tlit, (Nagaoka, et al. (1987b) (■); Kulkarni et al. (1974) (●); and Yokoyama et al. (1993) (▲) for 2-methylnaphthalene).
Figure 8: Percent deviation of the solidification temperatures calculated with the Simon
equation, Tcorr, from the available literature data, Tlit, (Castro et al. (1994) (●); Isaacs (1981) (■); Nagaoka and Makita (1988) (▲); and Takagi (1981) () for p-xylene).
2.3 CONCLUSIONS
To improve our understanding of the solution behavior of petroleum fluids in HPHT reservoirs, solidification temperatures of pure cyclooctane, cis-1,2-dimethylcyclohexane, trans-1,4-dimethylcyclohexane, p-xylene, o-xylene, and 2-methylnaphthalene are reported to pressures of 300 MPa and at temperatures starting at 293 K. The empirical quadratic and Simon equations are fit to the data, and they provide a means to estimate solidification conditions within the range presented in this study. High-pressure solid-liquid phase transition data for these heavy n-alkane, cyclic, and aromatic hydrocarbons provide fundamental information needed to determine the operating conditions that promote the formation of waxes in petroleum reservoirs. Pure-component solidification data are also valuable from the perspective of modeling. Several
High-Temperature, High-Pressure Equation of State: Solidification of Hydrocarbons and Viscosity Measurement of Krytox Oil Using Rolling-Ball Viscometer
15
thermodynamic models for the formation of wax have been reported for petroleum component mixtures and the verification and improvement of these models requires pure component solidification temperature-pressure data similar to the data reported here. The empirical quadratic and Simon equations are fit to the data, and they provide a means to estimate solidification conditions within the range presented in this study.
High-Temperature, High-Pressure Equation of State: Solidification of Hydrocarbons and Viscosity Measurement of Krytox Oil Using Rolling-Ball Viscometer
16
3. BIS(2-ETHYLHEXYL) PHTHALATE (DEHP) DENSITY
Bis(2-ethylhexyl) phthalate (DEHP) has been suggested as a reference fluid for viscosity measurements in the HTHP region. Prior to that, diisodecyl phthalate (DIDP) has been used as a reference fluid for moderately high viscosities in the range of 50 to 125 mPa•s. However, DIDP is commercially available only as a mixture of several phthalates esters of the isomers of isodecyl alcohols, which limits the application of DIDP as a reference fluid. Conversely, DEHP, obtained from the reaction of phthalic anhydride with 2-ethylhexanol, has the advantage of being available as a pure compound and, hence, DEHP is a better choice as the reference fluid for calibration of viscometers over wide pressure ranges. DEHP was chosen as the calibration fluid for the rolling-ball viscometer because of the large amount of HTHP data available, its ease in handling, its well-defined chemical structure, its availability at low cost in high purity, and its relatively high viscosity (although not high enough to be a viable candidate for the DVS). Because our team employs a rolling-ball viscometer, the density of the calibration fluid must be known at the same conditions that viscosity is to be measured.
Experimental density and viscosity data are reported for DEHP at pressures in excess of 1,000 MPa in an American Society of Mechanical Engineers (ASME) report published during the 1950s (Kleinschmidt et al., 1953). In the ASME report, experimental viscosities are reported at temperatures to 492 K; however, the density data are only reported to temperatures of 372 K. Therefore, density data for DEHP is required to calibrate the rolling-ball viscometer at 533K and 270MPa. Experimental density of DEHP was determined at 525 K and 270 MPa. This data was used for the calibration of rolling-ball viscometer at HTHP.
A variable-volume, high-pressure view cell was used for the determination of the single-phase pure component density of DEHP at temperatures and pressures to 525 K and 270 MPa, respectively. The density data, obtained at six different temperatures, was correlated with the modified Tait equation (Dymond and Malhotra, 1988) which contains three fitted parameters.
3.1 EXPERIMENTAL
3.1.1 Material
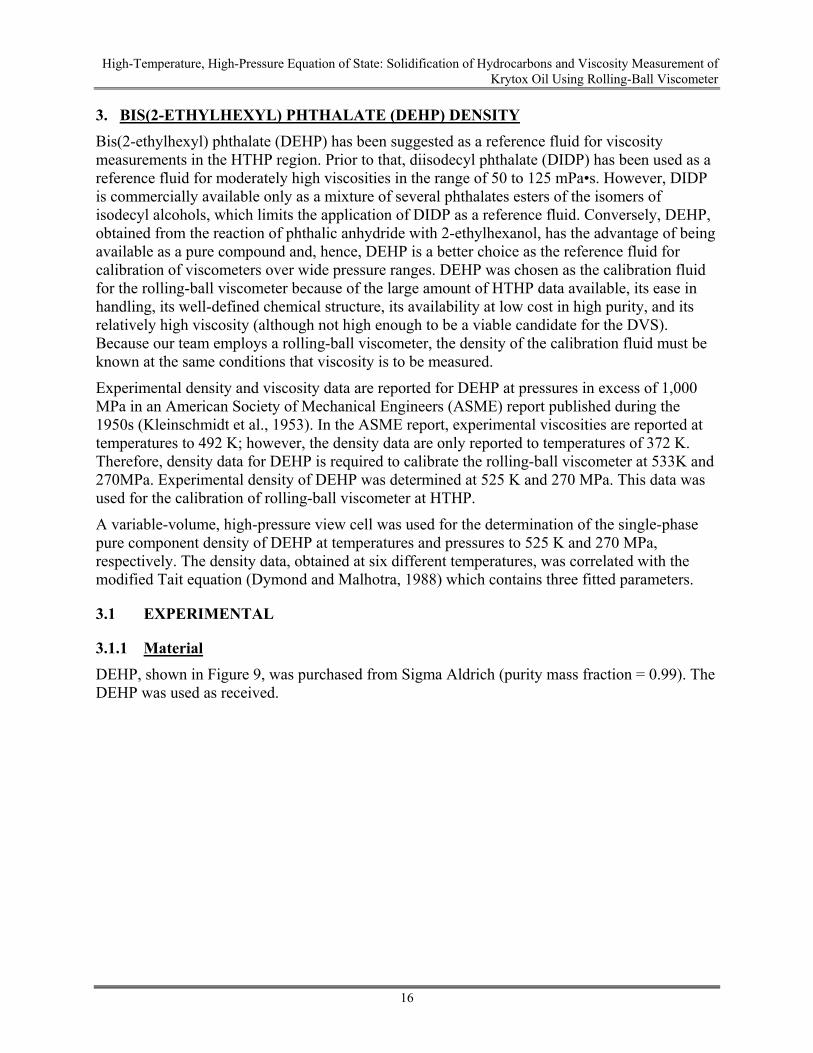
DEHP, shown in Figure 9, was purchased from Sigma Aldrich (purity mass fraction = 0.99). The DEHP was used as received.
High-Temperature, High-Pressure Equation of State: Solidification of Hydrocarbons and Viscosity Measurement of Krytox Oil Using Rolling-Ball Viscometer
17
Figure 9: Chemical structure of DEHP.
3.1.2 Experimental Method
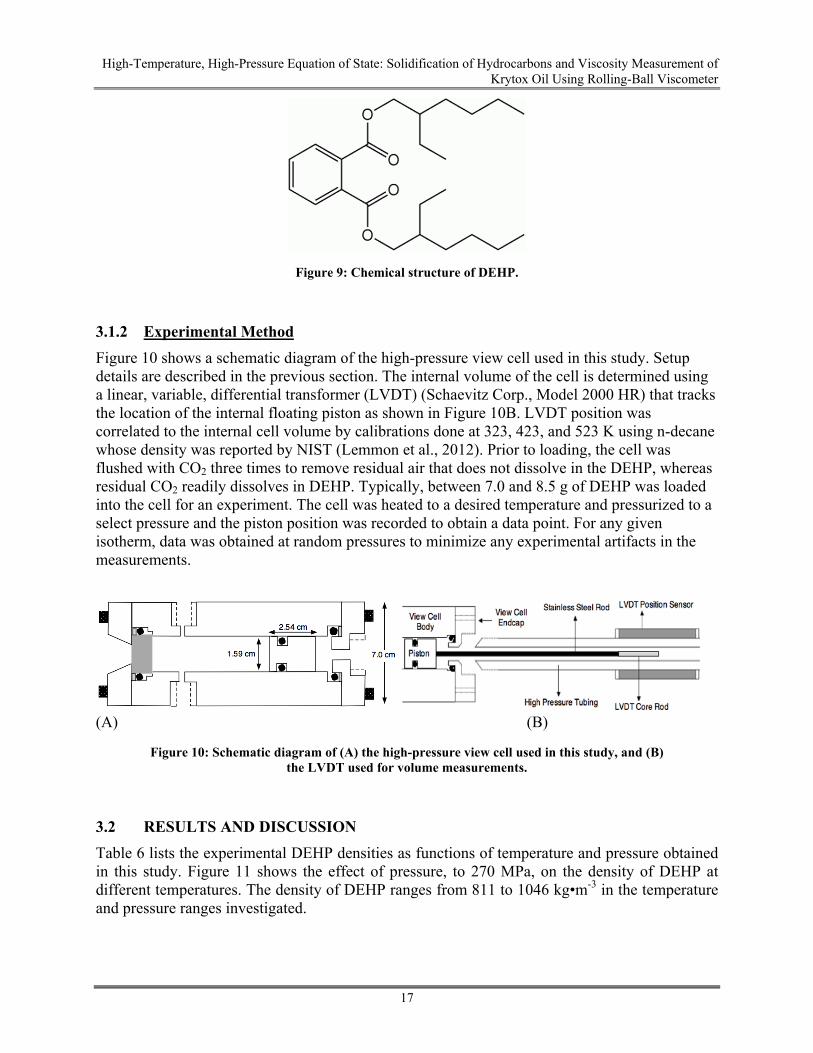
Figure 10 shows a schematic diagram of the high-pressure view cell used in this study. Setup details are described in the previous section. The internal volume of the cell is determined using a linear, variable, differential transformer (LVDT) (Schaevitz Corp., Model 2000 HR) that tracks the location of the internal floating piston as shown in Figure 10B. LVDT position was correlated to the internal cell volume by calibrations done at 323, 423, and 523 K using n-decane whose density was reported by NIST (Lemmon et al., 2012). Prior to loading, the cell was flushed with CO2 three times to remove residual air that does not dissolve in the DEHP, whereas residual CO2 readily dissolves in DEHP. Typically, between 7.0 and 8.5 g of DEHP was loaded into the cell for an experiment. The cell was heated to a desired temperature and pressurized to a select pressure and the piston position was recorded to obtain a data point. For any given isotherm, data was obtained at random pressures to minimize any experimental artifacts in the measurements.
(A) (B)
Figure 10: Schematic diagram of (A) the high-pressure view cell used in this study, and (B) the LVDT used for volume measurements.
3.2 RESULTS AND DISCUSSION
Table 6 lists the experimental DEHP densities as functions of temperature and pressure obtained in this study. Figure 11 shows the effect of pressure, to 270 MPa, on the density of DEHP at different temperatures. The density of DEHP ranges from 811 to 1046 kg•m-3 in the temperature and pressure ranges investigated.
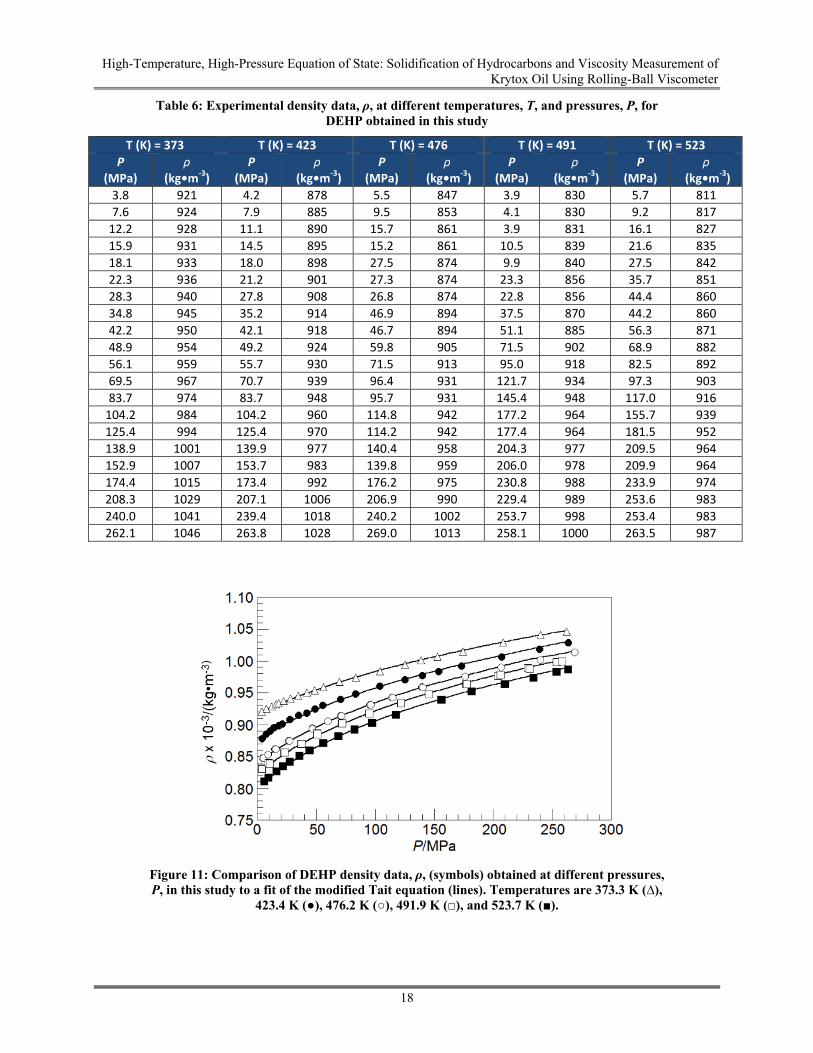
High-Temperature, High-Pressure Equation of State: Solidification of Hydrocarbons and Viscosity Measurement of Krytox Oil Using Rolling-Ball Viscometer
18
Table 6: Experimental density data, ρ, at different temperatures, T, and pressures, P, for DEHP obtained in this study
T (K) = 373 T (K) = 423 T (K) = 476 T (K) = 491 T (K) = 523
P (MPa)
ρ (kg•m‐3)
P (MPa)
ρ (kg•m‐3)
P(MPa)
ρ (kg•m‐3)
P(MPa)
ρ (kg•m‐3)
P (MPa)
ρ (kg•m‐3)
3.8 921 4.2 878 5.5 847 3.9 830 5.7 811
7.6 924 7.9 885 9.5 853 4.1 830 9.2 817
12.2 928 11.1 890 15.7 861 3.9 831 16.1 827
15.9 931 14.5 895 15.2 861 10.5 839 21.6 835
18.1 933 18.0 898 27.5 874 9.9 840 27.5 842
22.3 936 21.2 901 27.3 874 23.3 856 35.7 851
28.3 940 27.8 908 26.8 874 22.8 856 44.4 860
34.8 945 35.2 914 46.9 894 37.5 870 44.2 860
42.2 950 42.1 918 46.7 894 51.1 885 56.3 871
48.9 954 49.2 924 59.8 905 71.5 902 68.9 882
56.1 959 55.7 930 71.5 913 95.0 918 82.5 892
69.5 967 70.7 939 96.4 931 121.7 934 97.3 903
83.7 974 83.7 948 95.7 931 145.4 948 117.0 916
104.2 984 104.2 960 114.8 942 177.2 964 155.7 939
125.4 994 125.4 970 114.2 942 177.4 964 181.5 952
138.9 1001 139.9 977 140.4 958 204.3 977 209.5 964
152.9 1007 153.7 983 139.8 959 206.0 978 209.9 964
174.4 1015 173.4 992 176.2 975 230.8 988 233.9 974
208.3 1029 207.1 1006 206.9 990 229.4 989 253.6 983
240.0 1041 239.4 1018 240.2 1002 253.7 998 253.4 983
262.1 1046 263.8 1028 269.0 1013 258.1 1000 263.5 987
Figure 11: Comparison of DEHP density data, ρ, (symbols) obtained at different pressures, P, in this study to a fit of the modified Tait equation (lines). Temperatures are 373.3 K (∆),
423.4 K (●), 476.2 K (○), 491.9 K (□), and 523.7 K (■).
High-Temperature, High-Pressure Equation of State: Solidification of Hydrocarbons and Viscosity Measurement of Krytox Oil Using Rolling-Ball Viscometer
19
3.2.1 Modified Tait Equation
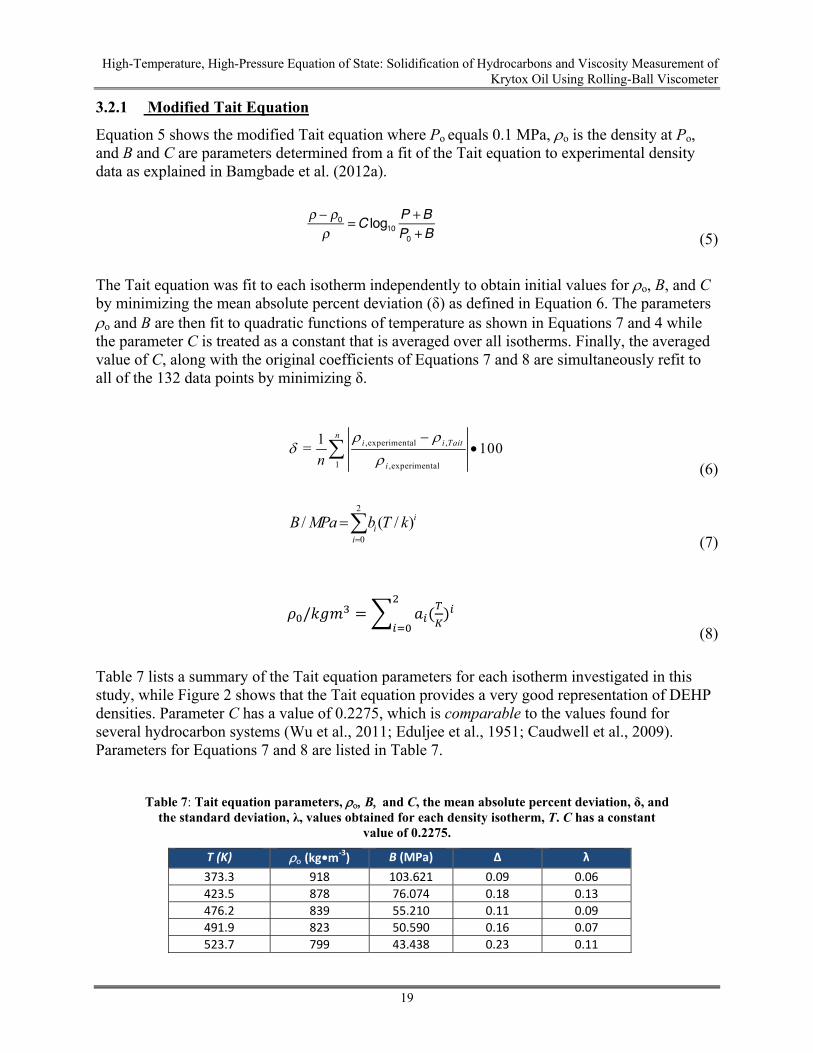
Equation 5 shows the modified Tait equation where Po equals 0.1 MPa, o is the density at Po, and B and C are parameters determined from a fit of the Tait equation to experimental density data as explained in Bamgbade et al. (2012a).
(5)
The Tait equation was fit to each isotherm independently to obtain initial values for o, B, and C by minimizing the mean absolute percent deviation (δ) as defined in Equation 6. The parameters o and B are then fit to quadratic functions of temperature as shown in Equations 7 and 4 while the parameter C is treated as a constant that is averaged over all isotherms. Finally, the averaged value of C, along with the original coefficients of Equations 7 and 8 are simultaneously refit to all of the 132 data points by minimizing δ.
,experimental ,
1 ,experimental
1= 100
ni i Tait
in
(6)
2
0
/ ( / )ii
i
B MPa b T k
(7)
/ (8)
Table 7 lists a summary of the Tait equation parameters for each isotherm investigated in this study, while Figure 2 shows that the Tait equation provides a very good representation of DEHP densities. Parameter C has a value of 0.2275, which is comparable to the values found for several hydrocarbon systems (Wu et al., 2011; Eduljee et al., 1951; Caudwell et al., 2009). Parameters for Equations 7 and 8 are listed in Table 7.
Table 7: Tait equation parameters, Band C, the mean absolute percent deviation, δ, and the standard deviation, λ, values obtained for each density isotherm, T. C has a constant
value of 0.2275.
T (K) (kg•m‐3) B (MPa) Δ λ
373.3 918 103.621 0.09 0.06
423.5 878 76.074 0.18 0.13
476.2 839 55.210 0.11 0.09
491.9 823 50.590 0.16 0.07
523.7 799 43.438 0.23 0.11
High-Temperature, High-Pressure Equation of State: Solidification of Hydrocarbons and Viscosity Measurement of Krytox Oil Using Rolling-Ball Viscometer
20
Table 8: Parameters, ai and bi, used in Equations 3 and 4 to predict o(T) and B(T) obtained from the fit of the Tait equation to the high-pressure density isotherms reported in this study
and with C equal to 0.2275.
ao• 10‐3 a1• 10
1 a2 • 104 bo• 10
‐5 b1• 10‐3 b2
1.1812 ‐6.4578 ‐1.6000 5.4233 ‐1.7277 1.4800
The Tait equation, with the parameters listed in Table 8, are used to compare density data obtained in this study with the data of Agaev et al. (1976), reported with an uncertainty of 0.03%, from 373.29 to 523.15 K to a maximum pressure of 80 MPa. The δ from this comparison is less than 0.60, which is less than the estimated accumulated experimental uncertainty in the data reported in the present study. In fact, a δ value of 0.57 is obtained when comparing data of Agaev et al. (1976) to those predicted with the Tait equation from T = 303.15 K to T = 548.15 K, which are temperatures well outside the range used to determine the Tait parameters in the present study. Hence, it is reasonable to conclude that the Tait equation provides a reliable method to estimate DEHP densities from 303.15 to 548.15 K and pressures to 270 MPa.
3.3 CONCLUSION
HTHP experimental density data for DEHP was obtained at temperatures from 373 to 525 K and pressures to 270 MPa. The density data were correlated to the modified Tait equation that provides a means for interpolating the density over a range of temperatures from 373 to 525 K and pressures to 270 MPa. This high-temperature, high-pressure density data were used to calibrate rolling-ball viscometer at extreme conditions. The calibrated rolling-ball viscometer was then used to determine the viscosity of Krytox oil presented below.
High-Temperature, High-Pressure Equation of State: Solidification of Hydrocarbons and Viscosity Measurement of Krytox Oil Using Rolling-Ball Viscometer
21
4. ROLLING-BALL VISCOSMETER
At the HTHP Workshop initiated by Schlumberger and Cambridge Viscosity (HTHP, 2010), two types of petroleum viscosity standards were identified, which have increasing importance as the search for oil sources in increasingly harsh conditions escalates. One viscosity standard represents the properties of light oils found in ultra-deep formations typically accessed via offshore platforms in the deep waters of the Gulf of Mexico (the deepwater viscosity standard or DVS). The other standard represents the properties of heavy oils produced from bitumen reserves found in shallower oil sands (the heavy oil viscosity standard or HOVS). The targeted DVS should have a dynamic viscosity of roughly 20 mPa·s at 533 K and 241 MPa, while the HOVS should have a dynamic viscosity of 1,000 mPa·s at 473 K and 10.34 MPa. The desired uncertainty for both standards was set at 5–10 % (Kasameyer et al., 2010). One of the conclusions of this meeting was that candidates for these standards should be assessed at multiple laboratories using different experimental techniques. For example, it was anticipated that the DVS and HOVS could be evaluated using oscillating-piston, rolling-ball, falling-object, torsional-crystal, vibrating-cylinder, oscillating-disk, vibrating-crystal, and capillary viscometers. A review of current viscometry laboratories (Goodwin, 2010) indicated, however, that these deepwater standard conditions of 533 K and 241 MPa would be particularly challenging and would require modifications to existing viscometry equipment.
Our preliminary work had shown that DuPont’s Krytox® perfluoropolyether oils are an excellent DVS candidate. Krytox® oils because they are not susceptible to photochemical decay and they exhibit remarkable chemical and thermal stability (Paciorek et al., 1979). It was determined that Krytox® GPL 101 has a viscosity slightly less than the targeted value, while Krytox® GPL 102 exhibits a viscosity slightly above the 20 mPa·s value. A rolling-ball viscometer and Couette viscometer were used to determine the viscosity of this fluid over a wide range of temperatures and pressures and to ascertain how closely this oil matches the target viscosity of 20 mPa·s at 533 K and 241 MPa.
4.1 EXPERIMENTS
4.1.1 Material
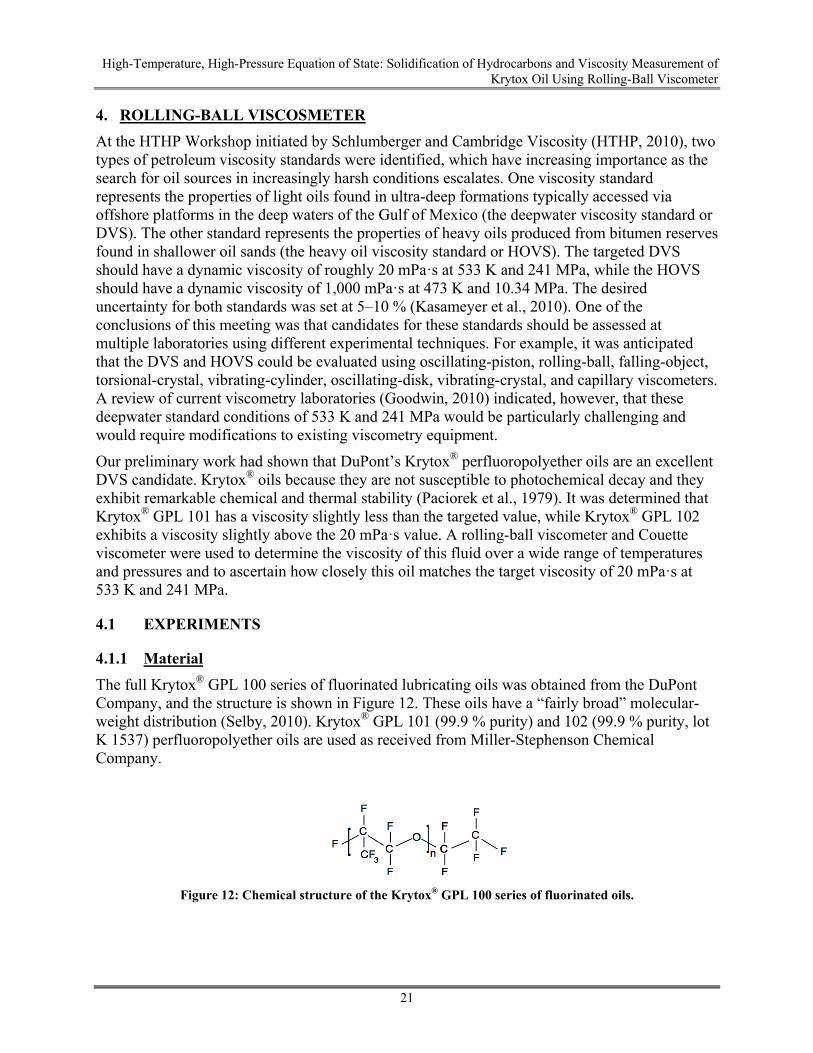
The full Krytox® GPL 100 series of fluorinated lubricating oils was obtained from the DuPont Company, and the structure is shown in Figure 12. These oils have a “fairly broad” molecular-weight distribution (Selby, 2010). Krytox® GPL 101 (99.9 % purity) and 102 (99.9 % purity, lot K 1537) perfluoropolyether oils are used as received from Miller-Stephenson Chemical Company.
Figure 12: Chemical structure of the Krytox® GPL 100 series of fluorinated oils.
High-Temperature, High-Pressure Equation of State: Solidification of Hydrocarbons and Viscosity Measurement of Krytox Oil Using Rolling-Ball Viscometer
22
A Cannon certified viscosity standard (Cannon® Instrument Company, Aqua 200, a silicone polymer with a viscosity of 215 mPa·s to 43.8 mPa·s over the 283–393 K range, lot 913803), is used to calibrate the HTHP Couette rheometer. It was purchased from Chandler Engineering.
Bis(2-ethylhexyl) phthalate, DEHP (99 % purity, Sigma Aldrich), is used to calibrate the rolling-ball viscometer.
4.1.2 Rolling-Ball Viscometer
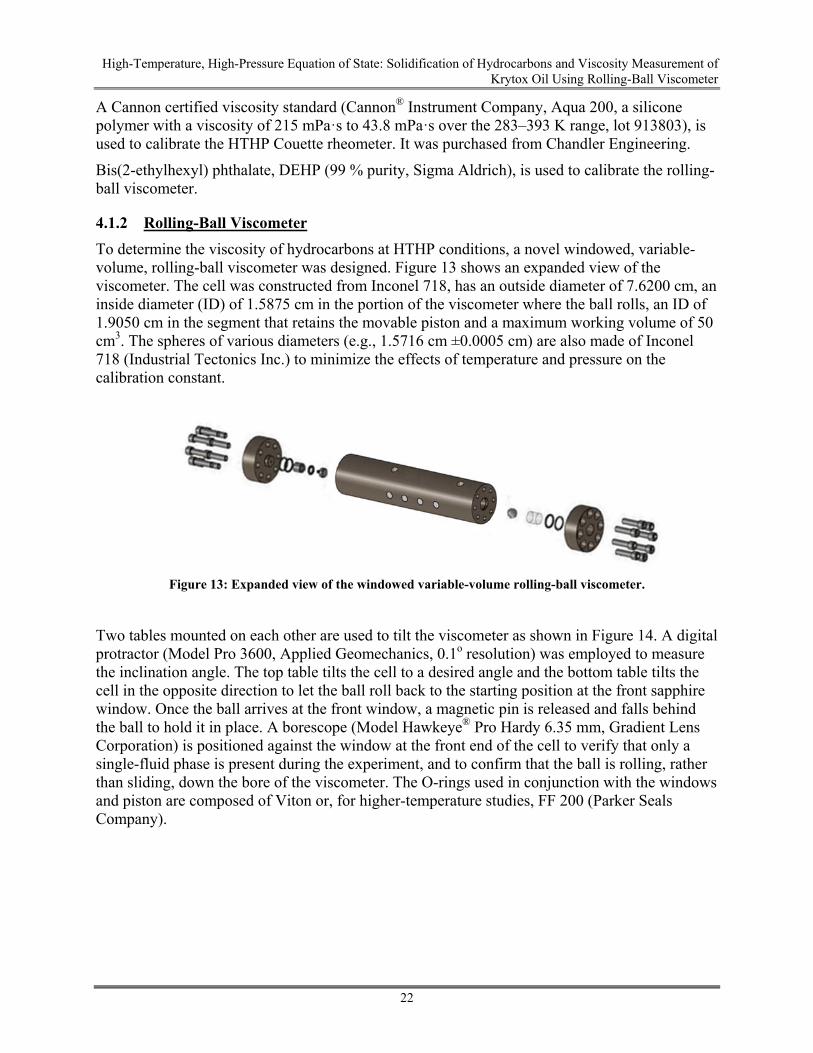
To determine the viscosity of hydrocarbons at HTHP conditions, a novel windowed, variable-volume, rolling-ball viscometer was designed. Figure 13 shows an expanded view of the viscometer. The cell was constructed from Inconel 718, has an outside diameter of 7.6200 cm, an inside diameter (ID) of 1.5875 cm in the portion of the viscometer where the ball rolls, an ID of 1.9050 cm in the segment that retains the movable piston and a maximum working volume of 50 cm3. The spheres of various diameters (e.g., 1.5716 cm ±0.0005 cm) are also made of Inconel 718 (Industrial Tectonics Inc.) to minimize the effects of temperature and pressure on the calibration constant.
Figure 13: Expanded view of the windowed variable-volume rolling-ball viscometer.
Two tables mounted on each other are used to tilt the viscometer as shown in Figure 14. A digital protractor (Model Pro 3600, Applied Geomechanics, 0.1o resolution) was employed to measure the inclination angle. The top table tilts the cell to a desired angle and the bottom table tilts the cell in the opposite direction to let the ball roll back to the starting position at the front sapphire window. Once the ball arrives at the front window, a magnetic pin is released and falls behind the ball to hold it in place. A borescope (Model Hawkeye® Pro Hardy 6.35 mm, Gradient Lens Corporation) is positioned against the window at the front end of the cell to verify that only a single-fluid phase is present during the experiment, and to confirm that the ball is rolling, rather than sliding, down the bore of the viscometer. The O-rings used in conjunction with the windows and piston are composed of Viton or, for higher-temperature studies, FF 200 (Parker Seals Company).
High-Temperature, High-Pressure Equation of State: Solidification of Hydrocarbons and Viscosity Measurement of Krytox Oil Using Rolling-Ball Viscometer
23
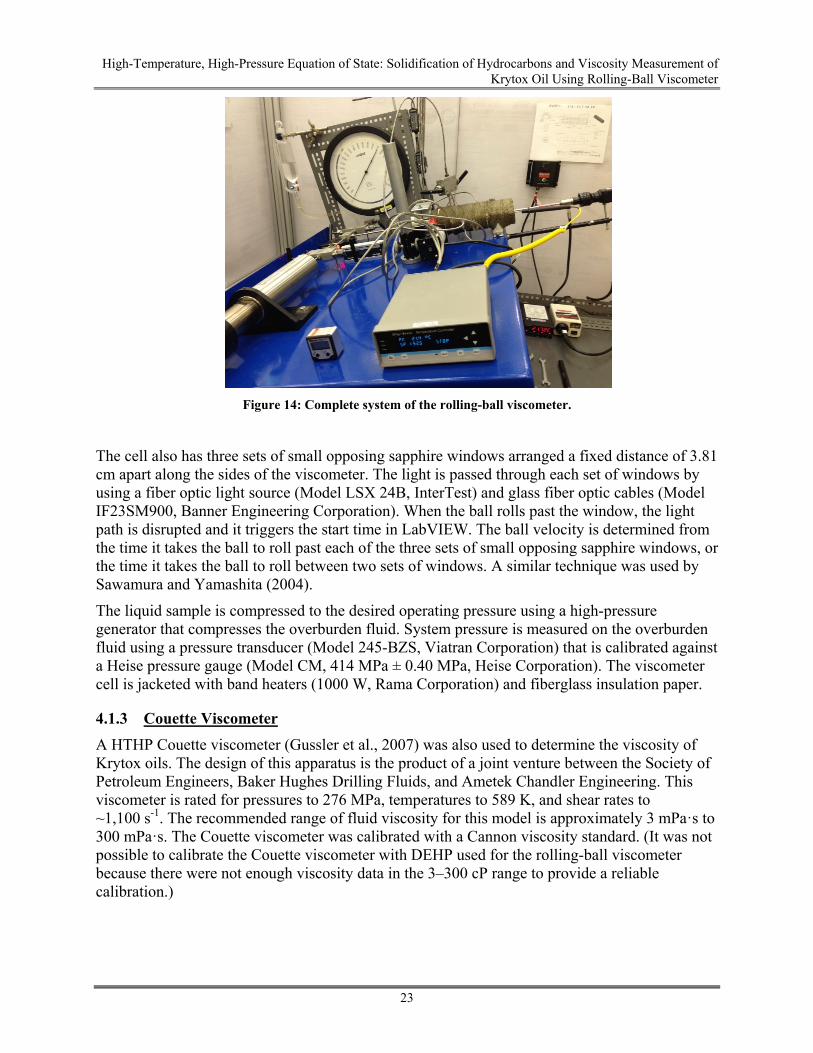
Figure 14: Complete system of the rolling-ball viscometer.
The cell also has three sets of small opposing sapphire windows arranged a fixed distance of 3.81 cm apart along the sides of the viscometer. The light is passed through each set of windows by using a fiber optic light source (Model LSX 24B, InterTest) and glass fiber optic cables (Model IF23SM900, Banner Engineering Corporation). When the ball rolls past the window, the light path is disrupted and it triggers the start time in LabVIEW. The ball velocity is determined from the time it takes the ball to roll past each of the three sets of small opposing sapphire windows, or the time it takes the ball to roll between two sets of windows. A similar technique was used by Sawamura and Yamashita (2004).
The liquid sample is compressed to the desired operating pressure using a high-pressure generator that compresses the overburden fluid. System pressure is measured on the overburden fluid using a pressure transducer (Model 245-BZS, Viatran Corporation) that is calibrated against a Heise pressure gauge (Model CM, 414 MPa ± 0.40 MPa, Heise Corporation). The viscometer cell is jacketed with band heaters (1000 W, Rama Corporation) and fiberglass insulation paper.
4.1.3 Couette Viscometer
A HTHP Couette viscometer (Gussler et al., 2007) was also used to determine the viscosity of Krytox oils. The design of this apparatus is the product of a joint venture between the Society of Petroleum Engineers, Baker Hughes Drilling Fluids, and Ametek Chandler Engineering. This viscometer is rated for pressures to 276 MPa, temperatures to 589 K, and shear rates to ~1,100 s-1. The recommended range of fluid viscosity for this model is approximately 3 mPa·s to 300 mPa·s. The Couette viscometer was calibrated with a Cannon viscosity standard. (It was not possible to calibrate the Couette viscometer with DEHP used for the rolling-ball viscometer because there were not enough viscosity data in the 3–300 cP range to provide a reliable calibration.)
High-Temperature, High-Pressure Equation of State: Solidification of Hydrocarbons and Viscosity Measurement of Krytox Oil Using Rolling-Ball Viscometer
24
4.2 RESULTS AND DISCUSSION
4.2.1 Rolling-Ball Viscometer Calibration with DEHP
DEHP was used to calibrate the rolling-ball viscometer. The viscosity and density of DEHP was taken from an ASME viscosity report (Kleinschmidt et al., 1953). Viscosity data points in the 2 mPa·s to 3,400 mPa·s range along the 298 K, 311 K, 372 K, and 491 K isotherms between 1 MPa and 260 MPa are used for calibration. Although the DEHP density values were inexplicably not listed in the tabular results for the 491 K isotherm, these values were determined by rearranging the viscosity expression used in Kleinschmidt et al. (1953) to solve for fl at 491 K, and the results were in good agreement with DEHP density data recently reported by Bamgbade et al. (2012a). The governing equation for determining the calibration constant, k, of a rolling-ball viscometer is
sinflb
vk (9)
where k has units of (cm4·m-1·s-2), is the viscosity in mPa·s, v is the terminal velocity of the rolling ball in cm·s-1, and b and fl are the ball density and fluid density, respectively, in g·cm-3. The tilt angle was set at 40°, 15°, and 10° for the isotherms 298 K, 311 K, 372 K, and 491 K, respectively. An Inconel 718 ball with a ball diameter, d, to viscometer ID diameter, D, ratio of 0.990 was used for the calibration of the viscometer at temperatures between 298 K to 491 K.
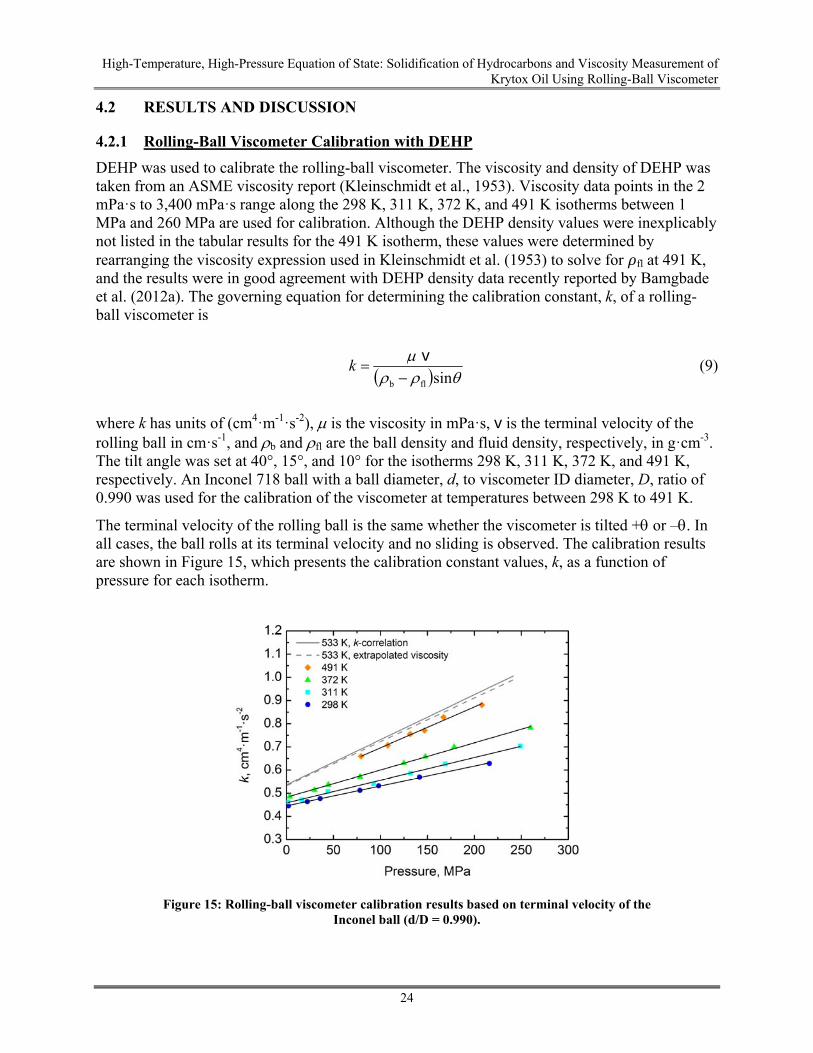
The terminal velocity of the rolling ball is the same whether the viscometer is tilted + or –. In all cases, the ball rolls at its terminal velocity and no sliding is observed. The calibration results are shown in Figure 15, which presents the calibration constant values, k, as a function of pressure for each isotherm.
Figure 15: Rolling-ball viscometer calibration results based on terminal velocity of the
Inconel ball (d/D = 0.990).
High-Temperature, High-Pressure Equation of State: Solidification of Hydrocarbons and Viscosity Measurement of Krytox Oil Using Rolling-Ball Viscometer
25
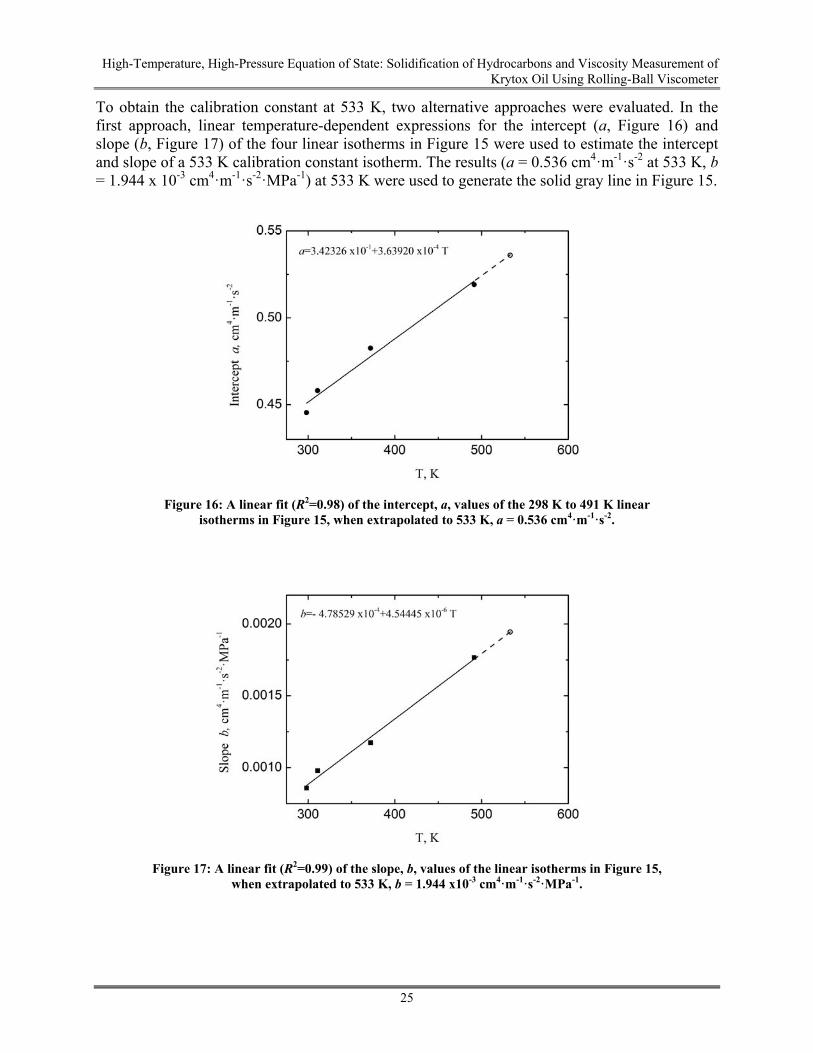
To obtain the calibration constant at 533 K, two alternative approaches were evaluated. In the first approach, linear temperature-dependent expressions for the intercept (a, Figure 16) and slope (b, Figure 17) of the four linear isotherms in Figure 15 were used to estimate the intercept and slope of a 533 K calibration constant isotherm. The results (a = 0.536 cm4·m-1·s-2 at 533 K, b = 1.944 x 10⁻³ cm4·m-1·s-2·MPa-1) at 533 K were used to generate the solid gray line in Figure 15.
Figure 16: A linear fit (R2=0.98) of the intercept, a, values of the 298 K to 491 K linear isotherms in Figure 15, when extrapolated to 533 K, a = 0.536 cm4·m-1·s-2.
Figure 17: A linear fit (R2=0.99) of the slope, b, values of the linear isotherms in Figure 15, when extrapolated to 533 K, b = 1.944 x10⁻³ cm4·m-1·s-2·MPa-1.
High-Temperature, High-Pressure Equation of State: Solidification of Hydrocarbons and Viscosity Measurement of Krytox Oil Using Rolling-Ball Viscometer
26
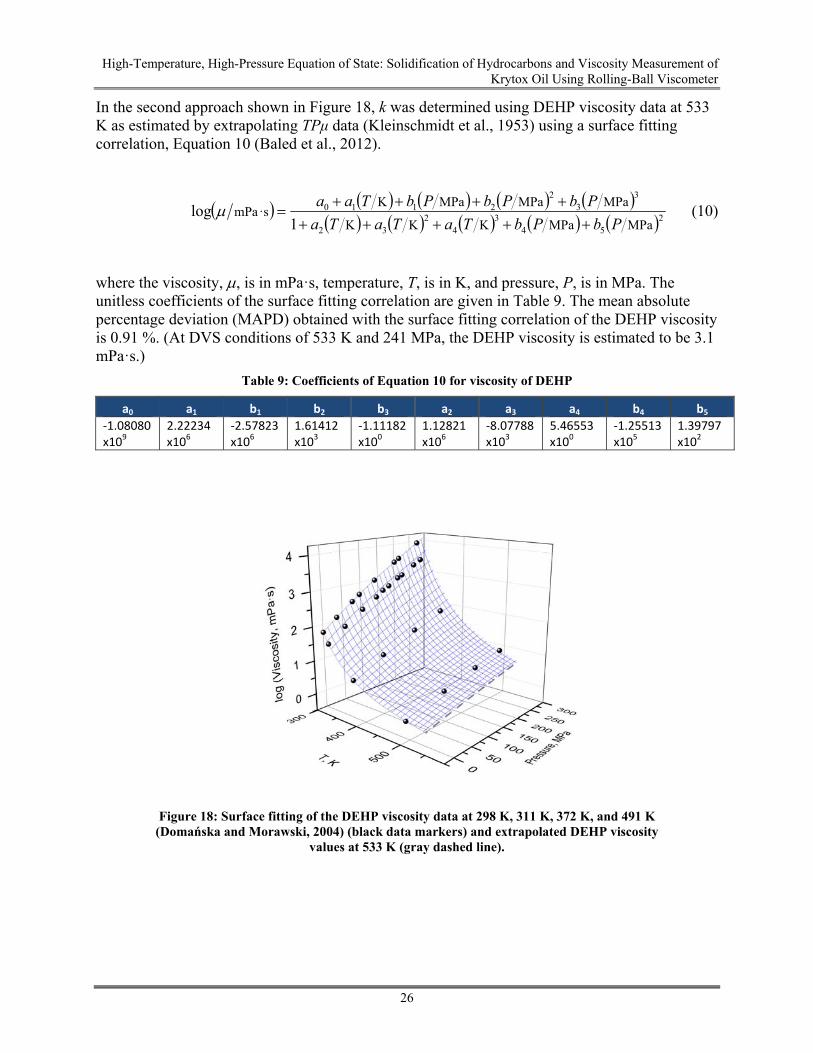
In the second approach shown in Figure 18, k was determined using DEHP viscosity data at 533 K as estimated by extrapolating TPμ data (Kleinschmidt et al., 1953) using a surface fitting correlation, Equation 10 (Baled et al., 2012).
254
34
232
33
22110
MPaMPaKKK
MPaMPaMPaK·smPa
1log
PbPbTaTaTa
PbPbPbTaa
(10)
where the viscosity, , is in mPa·s, temperature, T, is in K, and pressure, P, is in MPa. The unitless coefficients of the surface fitting correlation are given in Table 9. The mean absolute percentage deviation (MAPD) obtained with the surface fitting correlation of the DEHP viscosity is 0.91 %. (At DVS conditions of 533 K and 241 MPa, the DEHP viscosity is estimated to be 3.1 mPa·s.)
Table 9: Coefficients of Equation 10 for viscosity of DEHP
a0 a1 b1 b2 b3 a2 a3 a4 b4 b5
‐1.08080 x10⁹
2.22234 x10⁶
‐2.57823 x10⁶
1.61412x10³
‐1.11182 x100
1.12821x10⁶
‐8.07788 x10³
5.46553 x100
‐1.25513 x10⁵
1.39797x10²
Figure 18: Surface fitting of the DEHP viscosity data at 298 K, 311 K, 372 K, and 491 K
(Domańska and Morawski, 2004) (black data markers) and extrapolated DEHP viscosity values at 533 K (gray dashed line).
High-Temperature, High-Pressure Equation of State: Solidification of Hydrocarbons and Viscosity Measurement of Krytox Oil Using Rolling-Ball Viscometer
27
4.2.2 Pressure and Temperature Effect
The effects of temperature and pressure on the viscometer dimensions must be considered when determining the calibration constant at the desired conditions. High pressure will decrease the effective ball diameter and the simultaneous increase in the cell internal diameter. This effect is enhanced at elevated temperatures (Baled et al., 2012).
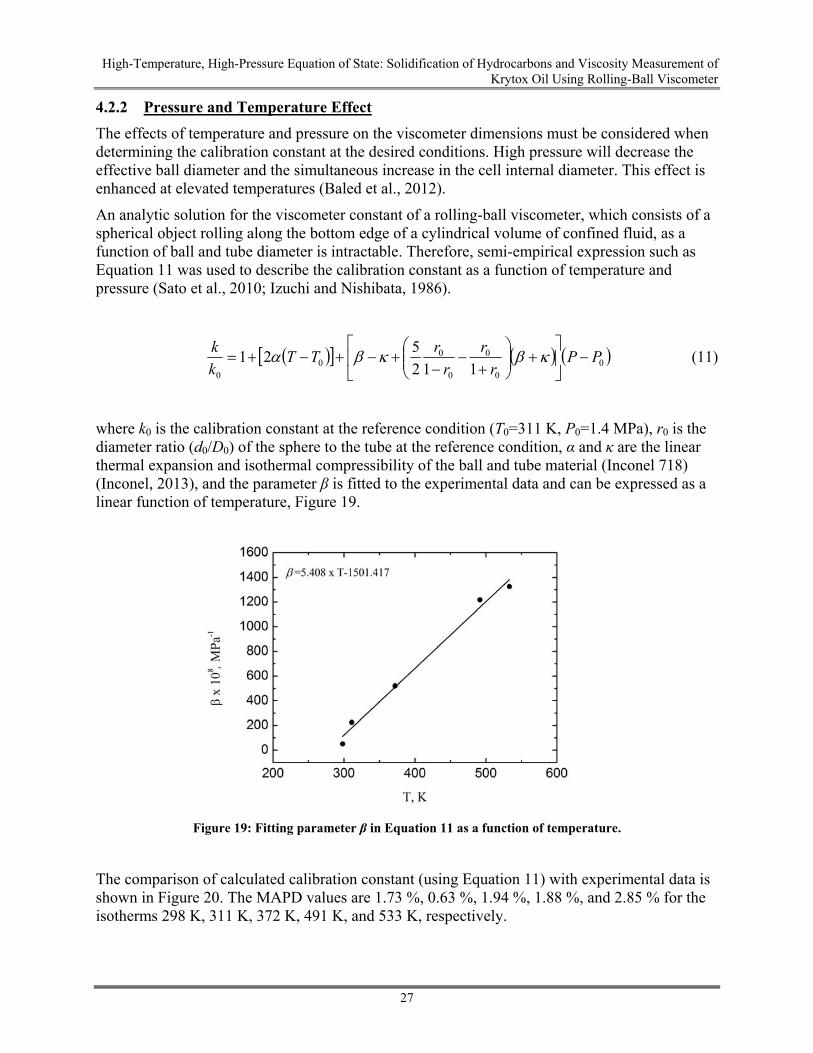
An analytic solution for the viscometer constant of a rolling-ball viscometer, which consists of a spherical object rolling along the bottom edge of a cylindrical volume of confined fluid, as a function of ball and tube diameter is intractable. Therefore, semi-empirical expression such as Equation 11 was used to describe the calibration constant as a function of temperature and pressure (Sato et al., 2010; Izuchi and Nishibata, 1986).
00
0
0
00
0 112
521 PP
r
r
r
rTT
k
k
(11)
where k0 is the calibration constant at the reference condition (T0=311 K, P0=1.4 MPa), r0 is the diameter ratio (d0/D0) of the sphere to the tube at the reference condition, α and κ are the linear thermal expansion and isothermal compressibility of the ball and tube material (Inconel 718) (Inconel, 2013), and the parameter β is fitted to the experimental data and can be expressed as a linear function of temperature, Figure 19.
Figure 19: Fitting parameter β in Equation 11 as a function of temperature.
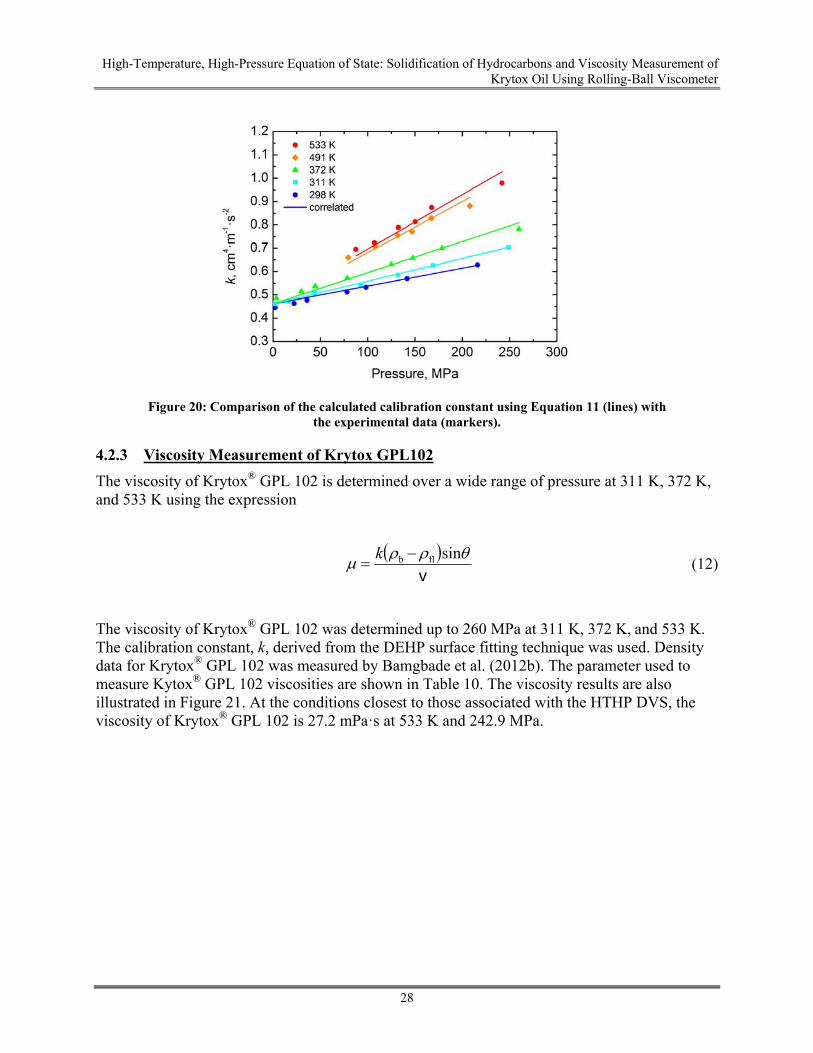
The comparison of calculated calibration constant (using Equation 11) with experimental data is shown in Figure 20. The MAPD values are 1.73 %, 0.63 %, 1.94 %, 1.88 %, and 2.85 % for the isotherms 298 K, 311 K, 372 K, 491 K, and 533 K, respectively.
High-Temperature, High-Pressure Equation of State: Solidification of Hydrocarbons and Viscosity Measurement of Krytox Oil Using Rolling-Ball Viscometer
28
Figure 20: Comparison of the calculated calibration constant using Equation 11 (lines) with
the experimental data (markers).
4.2.3 Viscosity Measurement of Krytox GPL102
The viscosity of Krytox® GPL 102 is determined over a wide range of pressure at 311 K, 372 K, and 533 K using the expression
v
sinflb k
(12)
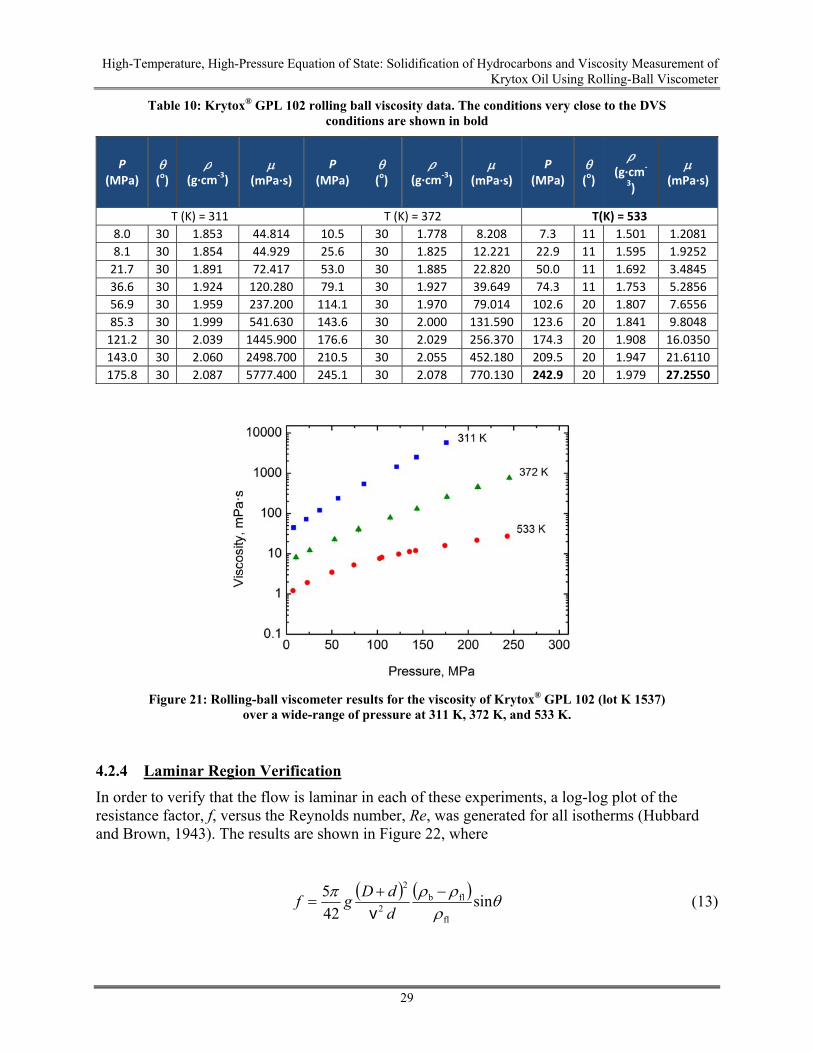
The viscosity of Krytox® GPL 102 was determined up to 260 MPa at 311 K, 372 K, and 533 K. The calibration constant, k, derived from the DEHP surface fitting technique was used. Density data for Krytox® GPL 102 was measured by Bamgbade et al. (2012b). The parameter used to measure Kytox® GPL 102 viscosities are shown in Table 10. The viscosity results are also illustrated in Figure 21. At the conditions closest to those associated with the HTHP DVS, the viscosity of Krytox® GPL 102 is 27.2 mPa·s at 533 K and 242.9 MPa.
High-Temperature, High-Pressure Equation of State: Solidification of Hydrocarbons and Viscosity Measurement of Krytox Oil Using Rolling-Ball Viscometer
29
Table 10: Krytox® GPL 102 rolling ball viscosity data. The conditions very close to the DVS conditions are shown in bold
P (MPa)
(o)
(g∙cm‐3)
(mPa∙s)
P (MPa)
(o)
(g∙cm‐3)
(mPa∙s)
P (MPa)
(o)
(g∙cm‐
3)
(mPa∙s)
T (K) = 311 T (K) = 372 T(K) = 533
8.0 30 1.853 44.814 10.5 30 1.778 8.208 7.3 11 1.501 1.2081
8.1 30 1.854 44.929 25.6 30 1.825 12.221 22.9 11 1.595 1.9252
21.7 30 1.891 72.417 53.0 30 1.885 22.820 50.0 11 1.692 3.4845
36.6 30 1.924 120.280 79.1 30 1.927 39.649 74.3 11 1.753 5.2856
56.9 30 1.959 237.200 114.1 30 1.970 79.014 102.6 20 1.807 7.6556
85.3 30 1.999 541.630 143.6 30 2.000 131.590 123.6 20 1.841 9.8048
121.2 30 2.039 1445.900 176.6 30 2.029 256.370 174.3 20 1.908 16.0350
143.0 30 2.060 2498.700 210.5 30 2.055 452.180 209.5 20 1.947 21.6110
175.8 30 2.087 5777.400 245.1 30 2.078 770.130 242.9 20 1.979 27.2550
Figure 21: Rolling-ball viscometer results for the viscosity of Krytox® GPL 102 (lot K 1537)
over a wide-range of pressure at 311 K, 372 K, and 533 K.
4.2.4 Laminar Region Verification
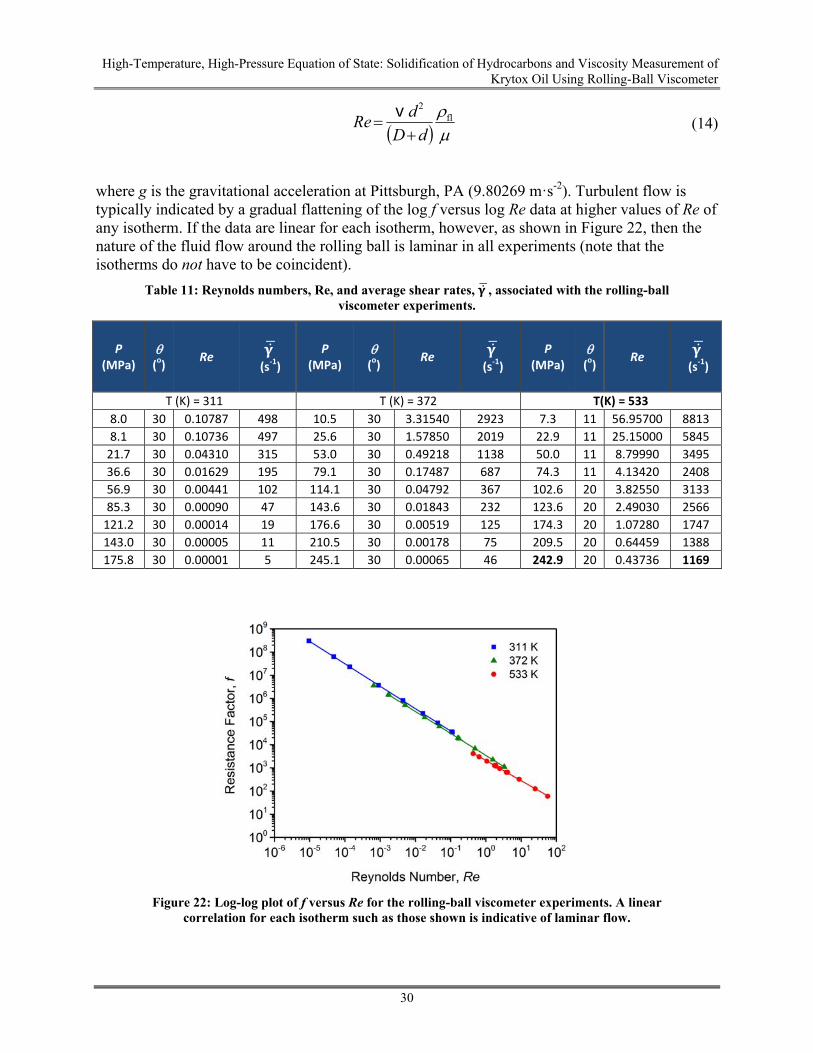
In order to verify that the flow is laminar in each of these experiments, a log-log plot of the resistance factor, f, versus the Reynolds number, Re, was generated for all isotherms (Hubbard and Brown, 1943). The results are shown in Figure 22, where
sin42
5
fl
flb2
2
d
dDgf
v (13)
High-Temperature, High-Pressure Equation of State: Solidification of Hydrocarbons and Viscosity Measurement of Krytox Oil Using Rolling-Ball Viscometer
30
fl
2
dD
dRe
v (14)
where g is the gravitational acceleration at Pittsburgh, PA (9.80269 m·s-2). Turbulent flow is typically indicated by a gradual flattening of the log f versus log Re data at higher values of Re of any isotherm. If the data are linear for each isotherm, however, as shown in Figure 22, then the nature of the fluid flow around the rolling ball is laminar in all experiments (note that the isotherms do not have to be coincident).
Table 11: Reynolds numbers, Re, and average shear rates, , associated with the rolling-ball viscometer experiments.
P (MPa)
(o)
Re (s‐1)
P (MPa)
(o)
Re (s‐1)
P (MPa)
(o)
Re (s‐1)
T (K) = 311 T (K) = 372 T(K) = 533
8.0 30 0.10787 498 10.5 30 3.31540 2923 7.3 11 56.95700 8813
8.1 30 0.10736 497 25.6 30 1.57850 2019 22.9 11 25.15000 5845
21.7 30 0.04310 315 53.0 30 0.49218 1138 50.0 11 8.79990 3495
36.6 30 0.01629 195 79.1 30 0.17487 687 74.3 11 4.13420 2408
56.9 30 0.00441 102 114.1 30 0.04792 367 102.6 20 3.82550 3133
85.3 30 0.00090 47 143.6 30 0.01843 232 123.6 20 2.49030 2566
121.2 30 0.00014 19 176.6 30 0.00519 125 174.3 20 1.07280 1747
143.0 30 0.00005 11 210.5 30 0.00178 75 209.5 20 0.64459 1388
175.8 30 0.00001 5 245.1 30 0.00065 46 242.9 20 0.43736 1169
Figure 22: Log-log plot of f versus Re for the rolling-ball viscometer experiments. A linear
correlation for each isotherm such as those shown is indicative of laminar flow.

High-Temperature, High-Pressure Equation of State: Solidification of Hydrocarbons and Viscosity Measurement of Krytox Oil Using Rolling-Ball Viscometer
31
4.2.5 Shear Rate Measurement
Unlike falling-cylinder viscometers that are characterized by a single shear rate at the surface of the falling cylinder as the fluid flows through the well-defined gap of fixed dimensions, the fluid flow around a close-clearance ball rolling through a tube experiences a range of shear rates.
Therefore, an average shear rate, units of s-1, is estimated for each experiment, using the expression below (Šesták and Ambros, 1973),
24.2
dD
D
v (15)
The average shear rates are provided in Table 11.
4.2.6 Uncertainty of the Rolling-Ball Viscometer Measurements
The standard uncertainties, u, are u(T) = 0.30 K, u(P) = 0.07 MPa below 56 MPa and 0.35 MPa from 56 to 241 MPa, u(t) = 0.05 s, u() = 0.1o, and the estimated accumulated experimental uncertainty in the reported Krytox® GPL 102 viscosity, Uc, calculated by applying the law of error propagation to Equation 12, is Uc(µ) = 2.4 % · µ (for 311 K and 372 K isotherms) and Uc(µ) = 4.7 % · µ (for 533 K isotherm), at a confidence level of approximately 95% (coverage factor, k = 2).
4.2.7 Couette Viscometer Measurement
The viscosity of Krytox® GPL 101 and 102 was measured at ~533 K over the 34 MPa to 276 MPa pressure range. With pressure and temperature fixed, the shear rate is increased from 85 s-1 to 1,021 s-1, and then decreased to 85 s-1. Results are shown in Figure 23 and Figure 24 for Krytox® GPL 101 and 102, respectively. In these figures, “up” refers to the first part of the experiment when shear rate was increased from 85 s-1 to 1,021 s-1 and “down” refers to the subsequent data collection as shear rate was incrementally decreased to 85 s-1. The gray bar refers to the targeted DVS of 20 mPa·s at 533 K and 242 MPa. The hysteresis in data collected was observed below 600 s-1. Regardless of the source of these unsystematic results at low shear, these data were not considered reliable. The data collected at shear rates greater than 600 s-1, however, were reproducible and exhibited the expected Newtonian behavior. In Table 12, viscosity data are reported only for shear rates of 1,021 s-1. Results from two series of data collection separated by six months are presented in Table 12.
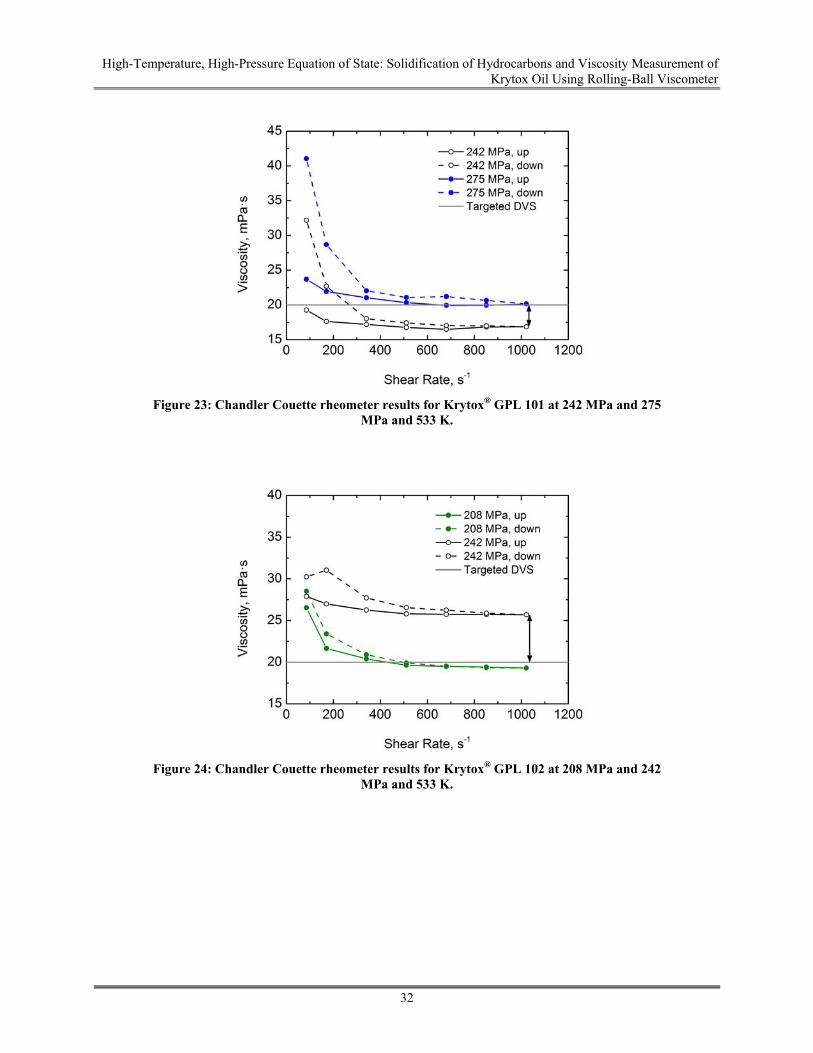
High-Temperature, High-Pressure Equation of State: Solidification of Hydrocarbons and Viscosity Measurement of Krytox Oil Using Rolling-Ball Viscometer
32
Figure 23: Chandler Couette rheometer results for Krytox® GPL 101 at 242 MPa and 275
MPa and 533 K.
Figure 24: Chandler Couette rheometer results for Krytox® GPL 102 at 208 MPa and 242
MPa and 533 K.
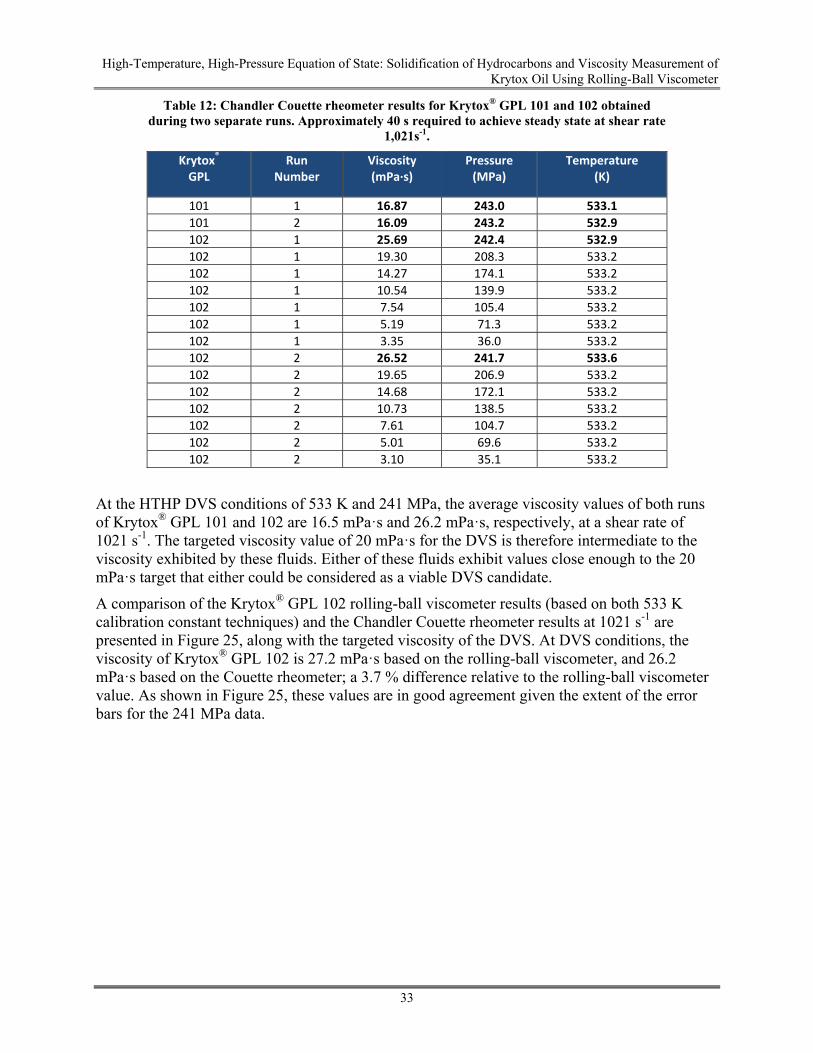
High-Temperature, High-Pressure Equation of State: Solidification of Hydrocarbons and Viscosity Measurement of Krytox Oil Using Rolling-Ball Viscometer
33
Table 12: Chandler Couette rheometer results for Krytox® GPL 101 and 102 obtained during two separate runs. Approximately 40 s required to achieve steady state at shear rate
1,021s-1.
Krytox®
GPL Run
Number Viscosity(mPa∙s)
Pressure(MPa)
Temperature (K)
101 1 16.87 243.0 533.1
101 2 16.09 243.2 532.9
102 1 25.69 242.4 532.9
102 1 19.30 208.3 533.2
102 1 14.27 174.1 533.2
102 1 10.54 139.9 533.2
102 1 7.54 105.4 533.2
102 1 5.19 71.3 533.2
102 1 3.35 36.0 533.2
102 2 26.52 241.7 533.6
102 2 19.65 206.9 533.2
102 2 14.68 172.1 533.2
102 2 10.73 138.5 533.2
102 2 7.61 104.7 533.2
102 2 5.01 69.6 533.2
102 2 3.10 35.1 533.2
At the HTHP DVS conditions of 533 K and 241 MPa, the average viscosity values of both runs of Krytox® GPL 101 and 102 are 16.5 mPa·s and 26.2 mPa·s, respectively, at a shear rate of 1021 s-1. The targeted viscosity value of 20 mPa·s for the DVS is therefore intermediate to the viscosity exhibited by these fluids. Either of these fluids exhibit values close enough to the 20 mPa·s target that either could be considered as a viable DVS candidate.
A comparison of the Krytox® GPL 102 rolling-ball viscometer results (based on both 533 K calibration constant techniques) and the Chandler Couette rheometer results at 1021 s-1 are presented in Figure 25, along with the targeted viscosity of the DVS. At DVS conditions, the viscosity of Krytox® GPL 102 is 27.2 mPa·s based on the rolling-ball viscometer, and 26.2 mPa·s based on the Couette rheometer; a 3.7 % difference relative to the rolling-ball viscometer value. As shown in Figure 25, these values are in good agreement given the extent of the error bars for the 241 MPa data.
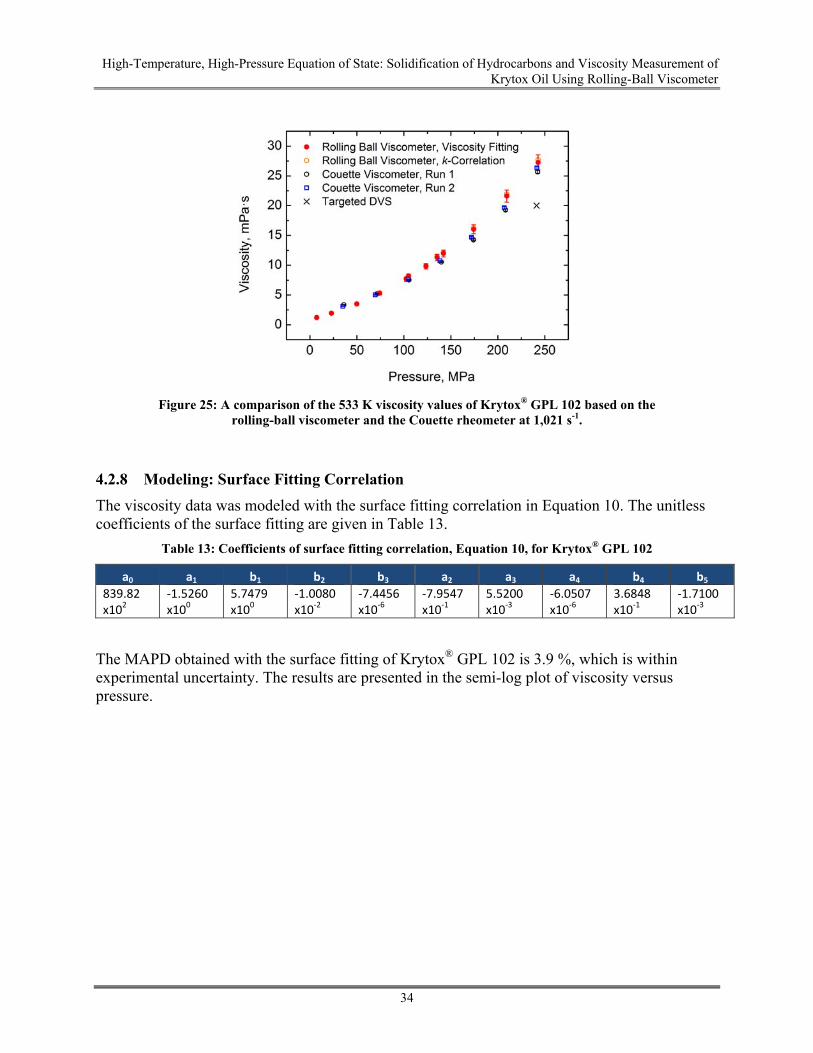
High-Temperature, High-Pressure Equation of State: Solidification of Hydrocarbons and Viscosity Measurement of Krytox Oil Using Rolling-Ball Viscometer
34
Figure 25: A comparison of the 533 K viscosity values of Krytox® GPL 102 based on the
rolling-ball viscometer and the Couette rheometer at 1,021 s-1.
4.2.8 Modeling: Surface Fitting Correlation
The viscosity data was modeled with the surface fitting correlation in Equation 10. The unitless coefficients of the surface fitting are given in Table 13.
Table 13: Coefficients of surface fitting correlation, Equation 10, for Krytox® GPL 102
a0 a1 b1 b2 b3 a2 a3 a4 b4 b5
839.82 x10²
‐1.5260 x100
5.7479 x100
‐1.0080 x10‐2
‐7.4456 x10‐6
‐7.9547 x10‐1
5.5200x10‐3
‐6.0507 x10‐6
3.6848 x10‐1
‐1.7100 x10‐3
The MAPD obtained with the surface fitting of Krytox® GPL 102 is 3.9 %, which is within experimental uncertainty. The results are presented in the semi-log plot of viscosity versus pressure.
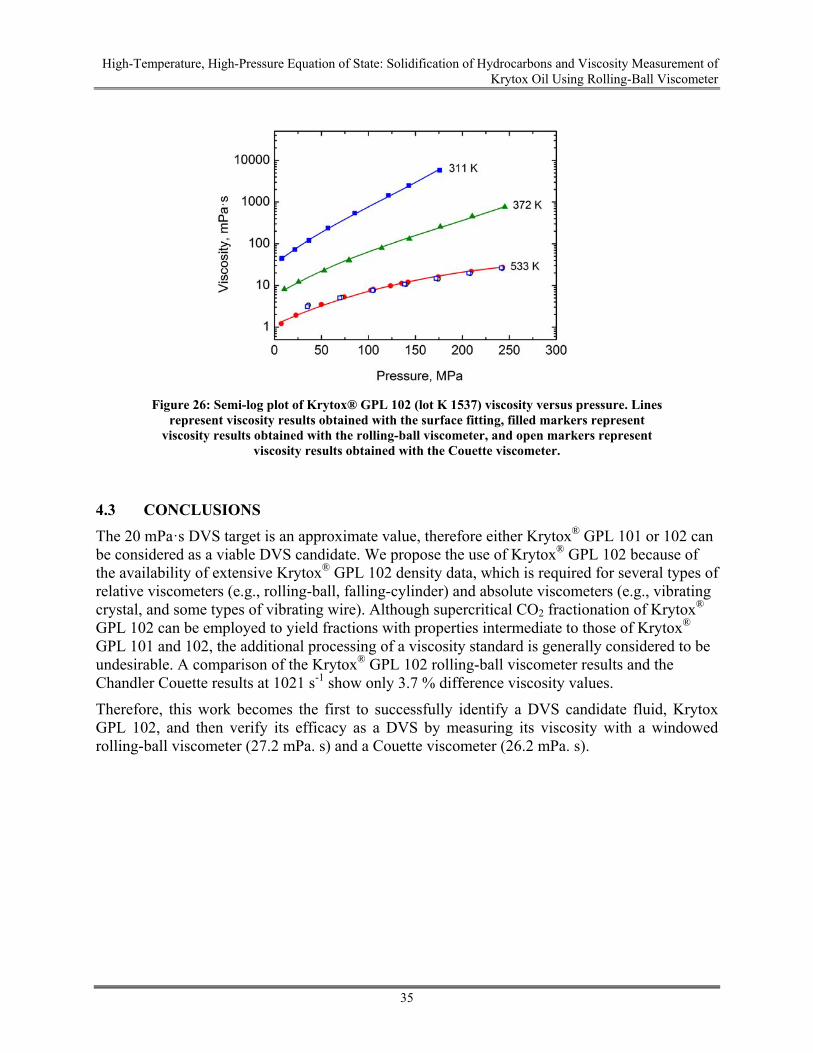
High-Temperature, High-Pressure Equation of State: Solidification of Hydrocarbons and Viscosity Measurement of Krytox Oil Using Rolling-Ball Viscometer
35
Figure 26: Semi-log plot of Krytox® GPL 102 (lot K 1537) viscosity versus pressure. Lines
represent viscosity results obtained with the surface fitting, filled markers represent viscosity results obtained with the rolling-ball viscometer, and open markers represent
viscosity results obtained with the Couette viscometer.
4.3 CONCLUSIONS
The 20 mPa·s DVS target is an approximate value, therefore either Krytox® GPL 101 or 102 can be considered as a viable DVS candidate. We propose the use of Krytox® GPL 102 because of the availability of extensive Krytox® GPL 102 density data, which is required for several types of relative viscometers (e.g., rolling-ball, falling-cylinder) and absolute viscometers (e.g., vibrating crystal, and some types of vibrating wire). Although supercritical CO2 fractionation of Krytox® GPL 102 can be employed to yield fractions with properties intermediate to those of Krytox® GPL 101 and 102, the additional processing of a viscosity standard is generally considered to be undesirable. A comparison of the Krytox® GPL 102 rolling-ball viscometer results and the Chandler Couette results at 1021 s-1 show only 3.7 % difference viscosity values.
Therefore, this work becomes the first to successfully identify a DVS candidate fluid, Krytox GPL 102, and then verify its efficacy as a DVS by measuring its viscosity with a windowed rolling-ball viscometer (27.2 mPa. s) and a Couette viscometer (26.2 mPa. s).
High-Temperature, High-Pressure Equation of State: Solidification of Hydrocarbons and Viscosity Measurement of Krytox Oil Using Rolling-Ball Viscometer
36
This page intentionally left blank.
High-Temperature, High-Pressure Equation of State: Solidification of Hydrocarbons and Viscosity Measurement of Krytox Oil Using Rolling-Ball Viscometer
37
5. REFERENCES
Agaev, N. A.; Kerimov, A. M.; Nuriddinov, Z.; Vyssh, I.; Zaved, U. Density of liquid dioctyl phthalate at high pressures and different temperatures. Neft Gaz 1976, 19, 72–74.
Ashbaugh, H. S.; Radulescu, A.; Prud'homme, R. K.; Schwahn, D.; Richter, D.; Fetters, L. J. Interaction of paraffin wax gels with random crystalline/amorphous hydrocarbon copolymers. Macromolecules 2002, 35, 7044–7053.
Baled, M.; Enick, R.; Burgess, W.; Jain, J.; Morreale, B.; Soong, Y.; Tapriyal, D.; Wu, Y.; Bamgbade, B.; McHugh, M.A. A windowed, variable-volume, rolling-ball viscometer rated to 260°C and 275 MPa. Presented at 18th Symposium on Thermophysical Properties, Boulder, CO, 2012.
Baled, O. H.; Tapriyal, D.; Morreale, D. B.; Soong, Y.; Gamwo, I. K.; Krukonis, V.; Babatunde, A. B.; Wu, Y.; McHugh, A. M.; Burgess, A. W.; Enick, M. R. Exploratory Characterization of a Perfluoropolyether Oil as a Possible Viscosity Standard at Deepwater Production Conditions of 533 K and 241 MPa. International Journal of Thermophysics 2013, 34, 1845–1864.
Bamgbade, B. A.; Wu, Y.; Baled, H. O.; Enick, R. M.; McHugh, M. A. Experimental density measurements of bis(2-ethylhexyl) phthalate at elevated temperatures and pressures. J. Chem. Thermodyn. 2012a, 63, 102–107.
Bamgbade, B. A.; Wu, Y.; Burgess, W. A.; McHugh, M. A. Experimental density and PC-SAFT Modeling of Krytox (perfluoropolyether) at pressure to 275 MPa and temperature to 533K. Fluid Phase Equilib. 2012b, 332, 159–164.
Bridgman, P. W. The effect of pressure on the viscosity of forty-three pure liquids. Proc. Am. Acad. Arts Sci. 1926, 61, 57–99.
Castro, S.; Taravillo, M.; Baonza, V. G.; Caceres, M.; Nunez, J. Thermodynamic behaviour of liquid p-xylene near freezing. J Chem Soc, Faraday Trans 1994, 90, 3645–3649.
Caudwell, D. R.; Trusler, J. P. M.; Vesovic, V.; Wakeham, W. A. Viscosity and Density of Five Hydrocarbon Liquids at Pressures up to 200 MPa and Temperatures up to 473 K. J. Chem. Eng. Data 2009, 54, 359–366.
Coutinho, J. A. P.; Dauphin, C.; Daridon, J. L. Measurements and modelling of wax formation in diesel fuels. Fuel 2000, 79, 607–616.
Domańska, U.; Morawski, P. Solid + liquid equilibria of (n-alkane + cyclohexane) mixtures at high pressures. Fluid Phase Equilib. 2004, 218, 57–68.
Domańska, U.; Morawski, P.; Wierzbicki, R. Phase diagrams of binary systems containing n-alkanes, or cyclohexane, or 1-alkanols and 2,3-pentanedione at atmospheric and high pressure. Fluid Phase Equilib. 2006, 242, 154–163.
Dymond, J. H.; Malhotra, R. The Tait equation: 100 years on. Int. J. Thermophys. 1988, 9, 941–951.
Eduljee, H. E.; Newitt, D. M.; Weale, K. E. Pressure-volume-temperature relations in liquids and liquid mixtures. Part I. The compression of n-hexane, n-heptane, n-octane, and of their binary and ternary mixtures, up to 5000 atmospheres. J. Chem. Soc. 1951, 3086–3091.

High-Temperature, High-Pressure Equation of State: Solidification of Hydrocarbons and Viscosity Measurement of Krytox Oil Using Rolling-Ball Viscometer
38
Faizullin, M. Z.; Skripov, V. P. The modified Simon equation and some properties of substances on the melting line. High Temp 2007, 45, 621–627.
Goncalves, J. L.; Bombard, A. J. F.; Soares, D. A.W.; Alcantara, G. B. Reduction of paraffin precipitation and viscosity of brazilian crude oil exposed to magnetic fields. Energy Fuels 2010, 24, 3144–3149.
Goodwin, A. Plausible Industrial reference Fluids for Viscosity. HTHP Viscosity Standards Workshop, Houston, Texas, Jan 22, 2010. https://www.slb.com/~/media/Files/core_pvt_lab/other/industrial_reference_fluids_viscosity.pdf
Gussler, W.; Pless, M.; Maxey, J.; Grover, P.; Perez, J.; Moon, J.; Boaz, T. A new extreme-hp/ht viscometer for new drilling-fluid challenges. SPE Drill Completion 2007, 22, 81–89.
HTHP Viscosity Standards Workshop Executive Summary. HTHP Viscosity Standards Workshop, Schlumberger and Cambridge Viscosity, Jan 22, 2010.
Hubbard, R. M.; Brown, G. G. The rolling-ball viscometer. Ind. Eng. Chem. Anal. Ed. 1943, 15, 212–218.
Inconel® alloy 718. http://www.specialmetals.com/products/inconelalloy718.php. (accessed June 2013).
International Energy Outlook 2013, with projections to 2040; U.S. Energy Information Administration, July 2013.
Isaacs, N. S. Liquid Phase High Pressure Chemistry; John Wiley & Sons: New York, 1981.
Izuchi, M.; Nishibata, K. A high pressure rolling-ball viscometer up to 1 GPa. Jap. J. Appl. Phys. 1986, 25, 1091–1096.
Ji, H.-Y.; Tohidi, B.; Danesh, A.; Todd, A. C. Wax phase equilibria: developing a thermodynamic model using a systematic approach. Fluid Phase Equilib. 2004, 216, 201–217.
Kasameyer, R.; Airey, D.; Cole, J. Viscometer State-of-the-Art. HTHP Viscosity Standards Workshop, Houston, TX, Jan 22, 2010. https://www.slb.com/~/media/Files/core_pvt_lab/other/high_pressure_viscometers.pdf
Kleinschmidt, R. V.; Bradbury, D.; Mark, M. Viscosity and Density of over Forty Lubricating Fluids of Known Composition at Pressures to 150,000 psi and Temperatures to 425 F; ASME Report; New York, 1953.
Kulkarni, A. A.; Luks, K. D.; Kohn, J. P. Phase-equilibriums behavior of systems carbon dioxide-2-methylnaphthalene and carbon dioxide-n-decane-2-methylnaphthalene. J. Chem. Eng. Data 1974, 19, 349–354.
Lemmon, E. W.; McLinden, M. O.; Friend, D. G. Thermophysical properties of fluid systems. In NIST Chemistry Webbook; NIST Standard Reference Database Number 69; Lindstrom, P. J., Mallard, W. G., Eds.; National Institute of Standards and Technology (NIST): Gathersburg, MD, 2012.
High-Temperature, High-Pressure Equation of State: Solidification of Hydrocarbons and Viscosity Measurement of Krytox Oil Using Rolling-Ball Viscometer
39
Machado, J. J. B.; de Loos, T. W.; Ihmels, E. C.; Fischer, K.; Gmehling, J. High pressure solid-solid and solid-liquid transition data for long chain alkanes. J. Chem. Thermodyn. 2008, 40, 1632–1637.
Marie, E.; Chevalier, Y.; Eydoux, F.; Germanaud, L.; Flores, P. Control of n-alkanes crystallization by ethylene-vinyl acetate copolymers. J. Colloid Interface Sci. 2005, 290, 406–418.
Nagaoka, K.; Makita, T. Effect of pressure on the solid-liquid phase equilibria of (carbon tetrachloride + p-xylene) and (carbon tetrachloride + benzene) systems. Int. J. Thermophys. 1988, 9, 535–545.
Nagaoka, K.; Makita, T. Solid-liquid phase equilibria of (α-methylnaphthalene + β-methylnaphthalene) and (chlorobenzene + bromobenzene) systems under high pressures. Int. J. Thermophys. 1987a, 8, 671–680.
Nagaoka, K.; Makita, T. Solid-liquid phase equilibria of benzene + cyclohexane system under high pressures. Int. J. Thermophys. 1987b, 8, 415–424.
Nagaoka, K.; Makita, T.; Nishiguchi, N.; Moritoki, M. Effect of pressure on the solid-liquid phase equilibria of binary organic systems. Int. J. Thermophys. 1989, 10, 27–34.
Paciorek, K. J. L.; Kratzer, R. H.; Kaufman, J.; Nakahara, J. H. Thermal oxidative studies of poly(hexafluoropropene oxide) fluids. J. Appl. Polym. Sci. 1979, 24, 1397–1411.
Petinelli, J. C. Influence of additives on the cystallization of n-paraffins in a hydrocarbon medium. Rev. Inst. Fr. Pet. 1979, 34, 771–790.
Ray, S. S.; Pandey, N. K.; Chatterjee, A. K. Effect of aromatics and iso-alkanes on the pour point of different types of lube oils. Fuel 2009, 88, 1629–1633.
Reid, R. C.; Prausnitz, J. M.; Sherwood, T. K. The Properties of Gases and Liquids, 3rd Ed.; McGraw Hill, 1977.
Sato, Y.; Yoshioka, H.; Aikawa, S.; Smith, Jr., R. L. A digital variable-angle rolling-ball viscometer for measurement of viscosity, density, and bubble-point pressure of CO2 and organic liquid mixtures. Int. J. Thermophys. 2010, 9, 1896–1903.
Sawamura, S.; Yamashita, T. Rolling-ball viscometer for studying water and aqueous solutions under high pressure. Proceedings of the 14th International Conference on the Properties of Water and Steam, Kyoto, 2004; pp 429–434.
Selby, K. DuPont performance lubricants. Personal communication, 2010.
Senra, M.; Scholand, T.; Maxey, C.; Fogler, H. S. Role of polydispersity and cocrystallization on the gelation of long-chained n-alkanes in solution. Energy Fuels 2009, 23, 5947–5957.
Šesták, J.; Ambros, F. On the use of the rolling-ball viscometer for the measurement of rheological parameters of power law fluids. Rheol. Acta 1973, 12, 70–76.
Shadravan, A.; Amani, M. HTHP 101-What every engineer or geoscientist should know about High Pressure High Temperature Wells. SPE Kuwait International Petroleum Conference and Exhibition, Kuwait, Dec 10–12, 2012.
High-Temperature, High-Pressure Equation of State: Solidification of Hydrocarbons and Viscosity Measurement of Krytox Oil Using Rolling-Ball Viscometer
40
Srivastava, S. P.; Tandon, R. S.; Verma, P. S.; Saxena, A. K.; Joshi, G. C.; Phatak, S. D. Crystallization behaviour of n-paraffins in Bombay-High middle-distillate wax/gel. Fuel 1992, 71, 533–537.
Takagi, T. Ultrasonic speeds and thermodynamics of (benzene+an isomeric xylene) under high pressures. J. Chem. Thermodyn. 1981, 13, 291–299.
Takamizawa, K.; Toratani, H.; Karasz, F. E. Application of a Simon-type equation to the relationship between glass transition temperature and pressure for polymers. Thermochim Acta 1994, 240, 23–30.
Tanaka, Y.; Kawakami, M. Solid-liquid phase equilibria in binary (benzene, cyclohexane + n-tetradecane, n-hexadecane) systems at temperatures 230–323 K and pressures up to 120 MPa. Fluid Phase Equilib. 1996, 125, 103–114.
Tapriyal, D.; Enick, R.; McHugh, M.; Gamwo, I. K.; Morreale, B. High Temperature, High Pressure Equation of State Density Correlations and Viscosity Correlations; NETL-TRS-1-2012; EPAct Technical Report Series; U.S. Department of Energy, National Energy Technology Laboratory: Morgantown, WV, 2012; pp 114.
Wu, Y.; Bamgbade, B.; Liu, K.; McHugh, M. A.; Baled, H.; Enick, R. M.; Burgess, W. A.; Tapriyal, D.; Morreale, B. D. Fluid Phase Equilib. 2011, 311, 17–24.
Yokoyama, C.; Ebina T.; Takahashi, S. Melting temperatures of several polycyclic and heteropolycyclic aromatic compounds under high pressures. Fluid Phase Equilib. 1993, 84, 207–223.

NETL Technical Report Series
Jared Ciferno Director Strategic Center for Natural Gas and Oil National Energy Technology Laboratory U.S. Department of Energy Maria Vargas Deputy Director Strategic Center for Natural Gas and Oil National Energy Technology Laboratory U.S. Department of Energy Roy Long Technology Manager Strategic Center for Natural Gas and Oil National Energy Technology Laboratory U.S. Department of Energy
Elena Melchert Program Manager Oil and Gas Production Office of Fossil Energy U.S. Department of Energy Cynthia Powell Director Office of Research and Development National Energy Technology Laboratory U.S. Department of Energy Kevin Donovan RES Program Manager URS Corporation