high temperature high pressure studies on some …
TRANSCRIPT

HIGH TEMPERATURE HIGH PRESSURE STUDIES ON SOME
NOVEL MATERIALS USING LASER HEATED DIAMOND
ANVIL CELL FACILITY
By
NISHANT NATVARLAL PATEL
PHYS01201104017
Bhabha Atomic Research Centre,
Mumbai – 400085,
INDIA
A thesis submitted to the
Board of Studies in Physical Sciences
In partial fulfillment of requirements
for the Degree of
DOCTOR OF PHILOSOPHY
of
HOMI BHABHA NATIONAL INSTITUTE
August, 2018

Homi BhabhaNational Institute
Recommendations of the Viva Voce Committee
As members of the Viva Voce Committee, we certify that we have read the dissertation preparedby Sbri. NisbaDt Natvarlal Patel entitled "ffigb Temperature ffigb Pressure Studies onSome Novel Mat~rials using Laser Heated Diamond Anvil CeU Facility" and recommendthat it may be accepted as fulfilling the thesis requirement for the award of Degree of Doctor ofPhilosophy.
Chairman Prof. N.K.Saboo
Guide!Convener Prof. M.N. Deo
Date: b f8 ( ~CJ
Date: ob )0:) (<u>1 '7
Prof. Amartya SenguptaExaminer
Member Prof. T.C. Kausbik
Member Date: 613h~Prof. N.V. Cbandrasbekar . 0 1_ ~N.\). ~~
TechnologyAdvisorDr. Meenaksbi Sunder }Yl~ Lwe;. ~
Date: D 610 31;;tOJ9
Final approval and acceptance of this thesis is contingent upon the candidate'ssubmission of the final copies of the thesis to HBNI.
I hereby certify that I have read this thesis prepared under my direction and recommendthat it may be accepted as fulfilling the thesis requirement.
Date: 06 If) 3/2-0' 4,
Place: MVV""\ \o~Dr. M. N. Deo
(Tbesis Supervisor)

STATEMENTBY AUTHOR
This dissertation has been submitted in partial fulfillment of requjrements for an advanced degree at Homi
Bhabha National Institute (HBNI) and is deposited in the Library to be made available to borrowers under
rules of the HBNI.
Brief quotations from this dissertation are allowable without special permission, provided that accurate
acknowledgement of source is made. Requests for permission for extended quotation from or
reproduction of this manuscript in whole or in part may be granted by the CompetentAuthority of HBNI
when in his or her judgment the p'roposeduse of the material is in the interests of scholarship. In all other
instances, however, permissionmust be obtained ITomthe author.
Mumbai
August 16,2018

DECLARATION
I, hereby declare that the investigation presented in the thesis has been carried out by me. The work is
original and has not been submittedearlier as a whole or in part for a degree / diploma at this or any other
Institution / University.
Mumbai@'~lo<&/~OI~
Nishant Natvarlal Patel
August 16,2018

List of Publications arising from the thesis
Journal
1) High Pressure Melting Curve of Osmium up to 35 GPa
Nishant N. Patel and Meenakshi Sunder,
J. Appl. Phys., 125, 055902 (2019).
2) Laser heated diamond anvil cell facility for high temperature high pressure research:
Application to material synthesis and melting studies
Nishant N. Patel, S. Meenakshi and Surinder M. Sharma,
Ind. J. Phys. 92, 1295 (2018)
3) Pressure-induced polymorphism in hypervalent CsI3,
Nishant N. Patel, M. Sunder, A B Garg and H K Poswal,
Phys. Rev. B, 96, 174114 (2017).
4) Synthesis of unconventional stoichiometric compounds in the K—Br system at high
pressures.
Nishant N. Patel, Ashok K. Verma, A. K. Mishra, M. Sunder and Surinder M.
Sharma,
Phys. Chem. Chem. Phys., 19, 7996 (2017).
5) LHDAC Setup for High Temperature and High Pressure Studies
Nishant N Patel, S. Meenakshi and S. M. Sharma,
AIP Conference Proceedings, 1591, 664 (2014).
Conferences
1) LHDAC Setup for High Temperature and High Pressure Studies.
Nishant N Patel, S. Meenakshi and S. M. Sharma,
58th DAE Solid State Physics Symposium, Thapar University, Patiala, Punjab, India
(2013).

2) Diamond Anvil Cell based Laser Heating facility for High Temperature - High
Pressure Research: Some Recent Results.
Nishant N Patel,
45/h Course: High Pressure Crystallography: Status Artis and Emerging
Opportunities,Erice-Sicily,Italy (2016).
3) K-Br System under Pressure: Synthesis of Unconventional Stoichiometric
Compounds.
Nishant N. Patel, Ashok K. Verma, A K. Mishra, Meenakshi Sunder and Surinder
M. Sharma,
MRSI National Symposium on Advances in Functional and Exotic Materials, Trichy,
Tamil Nadu, India (2018).
Date: 16/08/2018

Dedicated to My Parents,
Sons Vyom and Shlok & My Beloved Wife Purvi

ACKNOWLEDGEMENTS
I would like to thank all the people who have helped and motivated me during my
doctoral work. First and foremost I would like to express my gratitude to my advisor Prof. M. N.
Deo for his constant support and encouragement during my doctoral work. I would like to
express my gratitude to Dr. Meenakshi Sunder for her unconditional support and encouragement
throughout my research work. I owe much of the knowledge about high pressure physics from
her. She has introduced me to the field of high pressure high temperature experimental physics.
Special thanks to the members of my doctoral committee Prof. N. K. Sahoo (BARC),
Prof. T.C. Kaushik (BARC) and Prof. N.V. Chandrashekar (IGCAR) for their critical comments and
suggestions. I am thankful to my colleagues Dr. A. K. Verma, Dr. A. B. Garg, Dr. V. Srihari, Dr.
S. Karmakar and Dr. H. K. Poswal for their generous help during the Ph.D. work. My special
thanks to Dr. S. M. Sharma for sharing his insight into the high pressure physics. I am thankful to
Mr. A. Dwivedi, Ms. R. Vasanthi, Mr. R. R. Pokale and Mr. M. M. Tandel for their technical
help during the research work.
On this occasion I am deeply grateful to my colleague and friend Dr. Ajay K. Mishra and
Dr. Ram Niranjan for spending their valuable time in crucial discussions with me and for
stimulating my thinking at every stage of my research work. I also express my sincere gratitude
to my parents for their continuous encouragement and support. At the end I would like to thank
my beloved wife Purvi for her persistent encouragement and support throughout the tenure of
this doctoral work.

Contents
i
Contents
Page
No.
Synopsis vi
List of figures xvi
List of tables xxii
List of abbreviations xxiv
1. Introduction 1
1.1. Significance of high pressure high temperature (HPHT) research 1
1.1.1. Geophysics 1
1.1.2. Planetary physics 3
1.1.3. High Tc superconductors 4
1.1.4. Synthesis of novel stoichiometric compounds 5
1.1.5. Synthesis of superhard materials 6
1.1.6. Melting under pressure 8
1.2. Effect of pressure and temperature on condensed matter 9
1.2.1. Pressure effect 9
1.2.1.1. Hybridization 10
1.2.1.2. Hydrogen bond symmetrization 10
1.2.1.3. Reactivity 11
1.2.1.4. Electronic configuration 11

Contents
ii
1.2.1.5. Electronegativity 12
1.2.1.6. Chemical hardness 12
1.2.1.7. Coordination 13
1.2.2. Temperature effect 14
1.3. High pressure high temperature (HPHT) techniques 14
1.3.1. Static high pressure technique for HPHT research 15
1.3.1.1. Large volume apparatus 15
1.3.1.2. Diamond anvil cell (DAC) based HPHT techniques 21
1.3.2. Dynamic high pressure technique for HPHT measurements 24
1.4. Review of diagnostic techniques coupled to LHDAC 25
1.5. Organization of the present thesis 27
References 29
2. Laser Heated Diamond Anvil Cell (LHDAC) Facility for HPHT
Research
40
2.1. DAC based laser heating 41
2.2. Experimental details 41
2.2.1. Design of single sided laser heated diamond anvil cell facility 41
2.2.2. Sample loading in diamond anvil cell 48
2.2.3. Pressure measurement 50
2.2.4. System calibration and temperature measurement 50
2.2.5. Melting study 54
2.2.5.1. Phenomenon of melting 54
2.2.5.2. Detection of onset of melting in high pressure LHDAC

Contents
iii
experiments 55
2.3. Results and discussion 59
2.3.1. HPHT synthesis of metal nitride 60
2.3.1.1. HPHT synthesis of GaN 60
2.3.1.2. HPHT synthesis of γ-Mo2N 64
2.3.2. Melting curve of KBr up to 24 GPa 66
2.4. Conclusions 69
References 70
3. High Pressure Melting Curve of Osmium 73
3.1. Experimental details 75
3.2. Results and discussion 76
3.3. Conclusions 85
References 86
4. Synthesis of Unconventional Stoichiometric Compounds in the
K−Br System at High Pressures
89
4.1. Methodology 90
4.1.1. Experimental method 90
4.1.2. Theoretical method 92
4.2. Results and discussion 93
4.3. Conclusions 118
References 119

Contents
iv
5. Pressure Induced Polymorphism in Hypervalent CsI3 122
5.1. Structural details 124
5.2. Experimental method 126
5.2.1. Sample characterization 126
5.2.2. X-ray diffraction 126
5.2.3. Raman measurements 127
5.2.4. Electrical resistance measurements 129
5.3. Results and discussion 129
5.3.1. High pressure x-ray diffraction 129
5.3.2. High pressure Raman spectroscopy 139
5.3.3. High pressure electrical resistance measurements 143
5.4. Conclusions 147
References 148
6. Summary and Future Scope 150
6.1. Summary 150
6.2. Future scope 152

Contents
v
Appendix 154
A. Diamond anvil cell 154
B. X-ray diffraction 158
C. Raman spectroscopy 161
D. Scanning electron microscopy (SEM) 163
E. Ruby scale 164
F. Rietveld refinement 166

SYNOPSIS
Material behaviour at high pressure and high temperature conditions is of significant
interest in a wide range of scientific research areas, especially in material science, planetary
interiors and geophysics [1-3]. They are pivotal in the understanding and modeling of the earth’s
interior giving us insight into the melting behavior of elemental materials at high pressure high
temperature (HPHT) conditions. Hence in-situ HPHT techniques are indispensable for studying
physical properties of the minerals forming the Earth’s core and mantle. In addition, HPHT
studies are important for determination of P-V-T equation of state (EOS), phase transitions and
phase stability of materials [1, 4]. Recent research based on experimental investigations and
computational approaches provide several exciting examples, where non-ambient conditions
result in unexpected phenomena and structural changes [1, 5].
Materials can be subjected to HPHT, in static pressure conditions, using i) piston-cylinder
[6], (ii) multi anvils [7], (iii) toroid anvil [8], (iv) Paris-Edinburgh press [9], (v) diamond anvil
cell (DAC) based resistive heating [10], (vi) DAC based laser heating [11]. In the case of
dynamic pressure studies HPHT is achieved by shock compression [12]. Laser heated diamond
anvil cell (LHDAC) and shock compressions are only techniques capable of generating ultrahigh
pressure and temperature (i.e., P > 100 GPa, and T of the order of thousands of Kelvin).
LHDAC exploits the exclusive physical and optical properties of diamonds viz.,
hardness/strength, transparency across a broad range of electromagnetic spectrum, electrical
insulator etc., and provides a unique opportunity to investigate material properties at extreme
thermodynamic conditions wherein the nature of the chemical bonding in atoms change along
with modifications in their valence states and electronegativity. This results in an enhanced

Synopsis
vii
chemical reactivity thus increasing the feasibility of direct elemental reaction between inert
materials, leading to the formation of a plethora of novel and exotic phases with interesting
properties [13, 14]. The main advantage of the LHDAC technique over dynamic shock
experiments is that it provides a controlled means of achieving pressure and temperature
conditions that can be held constant for long periods of time. Hence it can be easily integrated
with a variety of diagnostic techniques like X-ray diffraction, Raman scattering, Brillouin
scattering, electrical transport and synchrotron based micro-probing techniques thereby
facilitating the investigation of a variety of pressure induced phenomena like melting, structural
phase transformations, changes in nature of bonding, chemical reactivity, and novel material
synthesis [3]. The independent control of pressure and temperature enables us to map the P-T
phase space which provides an opportunity to synthesize hitherto unknown unconventional
phases that can be quenched and examined at ambient temperature and pressure. In recent times,
the synthesis of superhard materials such as novel carbides, nitrides and borides have emerged as
one of the frontline problems in the field of HPHT research [15]. The results reported in this
thesis illustrate some interesting aspects of HPHT research on some selected materials with
exciting properties. The work reported includes the following:
(1) Development of instrumentation for laboratory based single sided LHDAC facility at
Purnima Labs, BARC, Mumbai for HPHT experiments.
(2) LHDAC based HPHT melting experiments for determination of high pressure melting
curve of osmium and KBr up to 35 and 24 GPa respectively.
(3) LHDAC based HPHT synthesis of gallium nitride (GaN) and molybdenum nitride
(Mo2N).

Synopsis
viii
(4) Synthesis of two new stoichiometric compounds, namely KBr3 and KBr5 at high
pressures in the K-Br system based on HPHT experiments.
(5) Results of ambient temperature high pressure synchrotron based x-ray diffraction, Raman
and electrical resistance study of CsI3.
The thesis is divided into six chapters. Chapter 1 gives a brief introduction to the field of
HPHT research highlighting its importance in diverse areas of scientific research. A review of
the available HPHT generation techniques along with their capabilities and limitations are also
reported in this chapter. Justification of our choice of laser heated diamond anvil cell (LHDAC)
technique over other techniques in terms of maximum pressure and temperature range achieved
and adaptability to various diagnostic techniques has also been described in this chapter.
Chapter 2 presents a detailed technical discussion and description of instrumentation of a
single sided LHDAC facility, which has been designed and set up at Purnima Labs, Bhabha
Atomic Research Centre (BARC), Mumbai, India. The salient feature of the LHDAC facility is
an angular geometry with an off-axis incidence of the NIR laser beam on the sample. The
advantage of this geometry over the usual 180 heating geometry is described at length in this
chapter. The set up utilizes the excellent features of the Yb doped fibre laser system such as
ideal beam quality, high stability, fibre delivery, compactness, selectivity of operating
wavelength and a reliability that is superior than the conventional solid state or gas laser. The
chapter also gives a detailed discussion on the challenges associated with accurate sample
temperature measurement, sample loading method and technical details of spectroradiometric
method for temperature determination. The importance of 10X magnification of sample image at
spectrometer input slit and use of 30 µm pinhole as the input slit of spectrometer for accurate

Synopsis
ix
sample temperature measurements have also been discussed. A brief review of the various
melting criteria used in LHDAC based high pressure melting studies and the various methods
employed for detection of onset of melting, viz., laser speckle method, flash heating method and
temperature plateau method have also been included in the chapter with specific examples. The
last part of the chapter reports the results of HPHT synthesis studies and melting experiments at
ambient and high pressures to demonstrate the versatility of the LHDAC facility for HPHT
investigations. The examples of synthesis experiments include the HPHT synthesis of GaN by
direct reaction of Ga metal with N2 at 9 GPa and 1925 K and the HPHT synthesis of Mo2N at 7
GPa and 2000 K using Mo metal and N2 as precursors. The results of high pressure melting
experiments on KBr upto 24 GPa by employing laser speckle method for detection of onset of
melting establish the suitability of the LHDAC set up for melting studies.
Chapter 3 describes the results of high pressure melting study on Osmium up to 35 GPa.
Osmium (Os) is an important refractory metal having the highest density (ρ ~ 22.59 g/cc) among
all the naturally occurring elements [16]. It has exceptional properties such as, high hardness, a
bulk modulus that is almost comparable to that of diamond under ambient temperature and
pressure conditions and extremely low thermal expansion and compressibility [17]. Its unique
properties make Os, a potentially important element for synthesis of superhard materials. Despite
these interesting properties and extensive high pressure theoretical investigations on osmium,
there have been no experimental reports to date on the high pressure melting curve Tm(P) of Os.
Motivated by these studies, high pressure melting study on Os was carried out up to 35 GPa
using the LHDAC facility described in Chapter 2 in conjunction with Mao Bell type DAC. The
pressure measurement and detection of onset of melting was carried out by ruby fluorescence
and laser speckle method respectively. The Simon-Glatzel equation was fitted to the
Synopsis
x
experimental data points in T vs P plot to get melting slope (dT/dP) at ambient pressure, which
was then compared with various reported theoretical melting slopes [18,19]. The fitted parameter
deduced from Simon-Glatzel equation was used to extrapolate the melting curve to higher
pressures. One of the important parameter of interest is the Grüneisen parameter (γ(ρ)) as a
function of density/volume, which in conjunction with Lindeman melting equation, enable us to
compute melting curve at any desired pressure. Hence a parameterized form of γ(ρ) based on
the method described by Burakovsky et al was considered in the present study and the
Grüneisen parameter was determined analytically using the experimentally obtained melting
slope [18]. The study also leads us to conclude that the Grüneisen parameter is dependent on Z
alone at very high compression.
Recent reports of synthesis and stabilization of phases with unconventional
stoichiometries, viz., KCl3, NaCl3, Na3Cl, lithium polyhydride etc., and the theoretical prediction
of many more such exotic compounds have made solid state chemistry under static compression
one of the most interesting and active areas of high pressure research [20-22]. Chapter 4
discusses the results of HPHT study on potassium-bromine (K-Br) system. The study has
indicated the synthesis of two new stoichiometric compounds, namely KBr3 and KBr5 at high
pressures in the K-Br system. A room temperature high pressure chemical reaction between KBr
and Br2 resulted in the formation of an orthorhombic KBr3 (SG: Pnma) at ~ 2.0 GPa. Further
compression lead to the formation of a monoclinic KBr5 (SG: P21) at ~ 6.0 GPa. Raman
spectroscopy and x-ray diffraction measurements were employed for detection and
characterization of the newly synthesized compounds. This is the first ever experimental
synthesis of a 1:5 stoichiometric compound in the alkali halogen system. The most unusual
observation accompanying the reaction is an anomalously large increase of sample chamber

Synopsis
xi
pressure (> 2GPa) during the KBr5 formation. This observation and the existence of isothermal
conditions in DAC based experiments lead us to conjecture that the change in internal energy is
converted directly to mechanical work during formation of KBr5. Furthermore, the KBr5 phase
remained stable up to the highest pressure (24 GPa) of our study. On decompression, KBr5
remained stable down to 5.0 GPa. High-pressure laser heating experiments carried out to get
further insight into the stability of newly synthesized KBr5 has revealed that at high pressure (14-
20 GPa) and high temperature (~ 1500 K), KBr5 decomposes into a trigonal KBr3 (SG: P-3c1),
instead of orthorhombic KBr3 (SG: Pnma), and Br2 with a large volume reduction. The bulk
modulus (B0) of KBr5 and KBr3 in orthorhombic and trigonal phase obtained by fitting the 3rd
order Birch Murnaghan equation of state (BM EOS) is 11.2, 11.8 and 15.5 GPa respectively.
Collaborative first-principles structural searches were carried out to solve the composition and
related crystal structures [23-24]. The proposed structures give good description to the
experimental Raman spectra and x-ray diffraction data.
Chapter 5 reports the results of high pressure investigations on cesium triiodide (CsI3).
The alkali halides serve as the simplest and model ionic solid for both static and dynamic high-
pressure investigations [25, 26]. Research interest in alkali halogen system has been rekindled by
the reports of synthesis of new unconventional stoichiometric compounds with unusual bonding
and electronic properties. NaCl3 at HPHT reported to be stable between 20 to 48 GPa has a
orthorhombic (SG: Pnma) structure; at 48 GPa it reportedly undergoes a phase transformation
into a metallic cubic (SG: Pm-3n) phase [20]. In K-Cl system, KCl3 has been reported to
crystallize in a trigonal (SG: P-3c1) structure at HPHT and it reportedly undergoes a structural
transition to a cubic (SG: Pm-3n) phase at higher pressure [22]. On the other hand, in the K-Br
system, as discussed in Chapter 4 of this thesis, KBr3 was synthesized in orthorhombic

Synopsis
xii
(SG:Pnma) phase above 2 GPa and was found to crystallize in the trigonal (SG: P-3c1) phase
during decomposition of KBr5 at HPHT [5]. Thus high pressure structural evolution in alkali
trihalides is far from clarity due to the absence of trigonal, orthorhombic and cubic phase in
NaCl3, KCl3 and KBr3 respectively. The high pressure study of CsI3 was carried out with an aim
to understand the structural transition sequence of alkali trihalides. The results of ambient
temperature high pressure synchrotron based x-ray diffraction, Raman and electrical resistance
study of CsI3 up to 29, 25 and 8 GPa respectively have been reported in this chapter. Three
distinct phase transitions were observed under quasihydrostatic condition. The ambient
orthorhombic (SG:Pnma) phase of CsI3 was observed to be stable up to a pressure of ~1.3 GPa
beyond which it was found to undergo a phase transition to a trigonal (SG:P-3c1) phase. The
stability region of the trigonal phase was found to be up to 22.6 GPa. Above this pressure the
trigonal phase was seen to transform to a cubic (SG: Pm-3n) phase which remained stable till the
maximum pressure of 29 GPa achieved in this study. A third order BM EOS fit to the pressure
volume (P-V) data yielded a bulk modulus of 17.7(9) GPa for the trigonal phase. Raman
spectroscopic measurements however indicated three phase transitions at ~ 1.3, 4.0 and 22.6 GPa
respectively. The electrical resistance measured in the low pressure region up to 8 GPa indicated
an electronic transition around 4 GPa confirming the Raman result observed at 4.0 GPa. The P-V
data when transformed to the universal equation of state (UEOS) showed a deviation from
linearity around 4.0 GPa confirming the electronic transition. The present study has thus
revealed a three phase structural transition sequence in alkali trihalides, viz., orthorhombic (SG:
Pnma) to trigonal (SG: P-3c1) to a cubic (SG: Pm-3n) phase.
The thesis is concluded with a brief summary in Chapter 6 for a quick glance at the key
aspects of the present work as well as a concise discussion on some major areas for future scope

Synopsis
xiii
of HPHT research. In addition, appendices have been included in the thesis to give a detailed
description of the working principles of the various experimental techniques and software
packages used for the studies presented in this thesis viz., DAC, x-ray diffraction measurements,
Raman spectroscopy, scanning electron microscopy, ruby fluorescence spectroscopy etc.

Synopsis
xiv
References
[1] H. K. Mao, X. J. Chen, Y. Ding, B. Li and L. Wang, Rev. Mod. Phys. 90, 015007 (2018).
[2] Z. Konôpková, R. S. McWilliams, N. Gómez-Pérez and A. F. Goncharov, Nature 534, 99
(2016).
[3] R. Torchio, O. Mathon and S. Pascarelli, Coord. Chem. Rev. 277-278, 80 (2014).
[4] H. Kojitani, S. Terata, M. Ohsawa, D. Mori, Y. Inaguma and M. Akaogi, American
Minrologist, 102, 2032 (2017).
[5] N. N. Patel, A. K. Verma, A. K. Mishra, M. Sunder and S. M. Sharma, Phys. Chem.
Chem. Phys. 19, 7996 (2017).
[6] R. Hinrichs and J. A. H. da Jornada, Rev. Sci. Inst., 68, 193 (1997).
[7] S. Zhai and E. Ito, Geoscience Frontiers 2, 101 (2011).
[8] L. G. Khvostantsev, V. N. Slesarev and V. V. Brazhkin, High Pressure Res. 24, 371
(2004).
[9] G. Morard , M. Mezouar , N. Rey , R. Poloni , A. Merlen , S. Le Floch , P. Toulemonde ,
S. Pascarelli , A. San-Miguel , C. Sanloup and G. Fiquet, High Pressure Res. 27, 223
(2007).
[10] S. Pasternak, G. Aquilanti, S. Pascarelli, R. Poloni, B. Canny, B. V. Coulet and L. Zhang,
Rev Sci Instrum. 79, 085103 (2008).
[11] Y. Meng, R. Hrubiak, E. Rod, R. Boehler and G. Shen, Rev. Sci. Instrum. 86, 072201
(2015).
[12] W. J. Nellis in G.L. Chiarotti, M. Bernasconi M & L. Ulivi (Eds) High Pressure
Phenomena, (Societa Italiana di Fisica), p 109 (2002).
Synopsis
xv
[13] A. F. Young, C. Sanloup, E. Gregoryanz, S. Scandolo, R. J. Hemley and H. K. Mao,
Phys. Rev. Lett. 96, 155501 (2006).
[14] A. Friedrich, B. Winkler, E. A. J. Arellano and L. Bayarjargal, Materials 4, 1648 (2011).
[15] A. Salamat, R. A. Fischer, R. Briggs, M. I. McMahon and S. Petitgirard, Coord. Chem.
Rev. 277-278, 15 (2014).
[16] J.W. Arblaster, Johnson Matthey Technol. Rev. 58, 137 (2014).
[17] J.W. Arblaster, Platinum Met. Rev. 57, 177 (2013).
[18] L. Burakovsky, N. Burakovsky and D. L. Preston, Phys. Rev. B, 92, 174105 (2015).
[19] K. D. Joshi, S. C. Gupta and S. Banerjee, J. Phys.: Condens. Matter, 21, 415402 (2009).
[20] W. Zhang, A. R. Oganov, A. F. Goncharov, Q. Zhu, S. E.Boulfelfel, A. O. Lyakhov, E.
Stavrou, M. Somayazulu, V. B. Prakapenka and Z. Konopkova, Science, 342, 1502
(2013).
[21] C. Pépin, P. Loubeyre, F. Occelli and P. Dumas, Proc. Nat. Acad. Sci., 112, 7672 (2015).
[22] W. Zhang, A. R. Oganov, Q. Zhu, S. S. Lobanov, E. Stavrou and A. F. Goncharov, Sci.
Rep., 6, 26265 (2016).
[23] A. O. Lyakhov, A. R. Oganov, H. T. Stokes and Q. Zhu, Comput. Phys. Commun. , 184,
1172 (2013).
[24] G. Kresse, and D. Joubert, Phys. Rev. B, 59, 1758 (1999).
[25] S. Wei, C. Zhu, Q. Li, Y. Zhou, Q. Li and Y. Ma, Phys. Chem. Chem. Phys.,16, 17924,
(2014).
[26] Y. Xu, J. S. Tse, A. R. Oganov, T. Cui, H. Wang, Y. Ma, and G. Zou, Phys. Rev B 79,
144110 (2009).

List of figures
xvi
List of Figures
Figure
No.
Figure Caption Page
No.
1.1 Cross sectional view of earth’s interior with depth and corresponding
pressure and temperature range………………………………………………..
2
1.2 Interior of Jupiter and associated pressure range…………………………….. 4
1.3 Pressure variation of chemical hardness in sodium (Na), Magnesium (Mg),
Gold (Au), Lithium (Li), Nickel (Ni), Carbon (C), and Nitrogen (N)………..
13
1.4 Schematic of cross sectional view of a piston cylinder press……………….. 16
1.5 Schematic of Bridgman anvil apparatus …………………………………… 17
1.6 a) Belt apparatus assembly and b) schematic of belt type and split cylinder. 18
1.7 Cross sectional view of toroidal anvils with pyrophyllite gasket at the
middle………………………………………………………………………….
19
1.8 a) Cross section of gasket assembly used in Paris–Edinburgh press. b)
Schematic diagram of Paris–Edinburgh press………………………………...
20
1.9 Photograph of MAA with sample assembly of recovered sample…………… 21
2.1 Photograph of the single sided LHDAC facility……………………………… 42
2.2 Simplified schematic layout of the LHDAC facility…………………………. 44
2.3 Photograph of the centrally aligned hotspot around the spectrograph pinhole
(PH) during laser heating……………………………………………………...
45

List of figures
xvii
2.4 Photograph of the water cooling jacket for the Mao Bell type DAC…………. 47
2.5 (a) Schematic diagram and (b) image of a typical sample assembly used for
LHDAC experiment…………………………………………………………...
48
2.6 Cryogenic apparatus for loading liquefied argon inside the DAC sample
chamber……………………………………………………………………….
50
2.7 (a) instrument spectral response (b) Typical observed experimental
incandescent spectrum and (c) comparison of QTH calibration lamp
spectrum obsereved in our setup with spectrum provided by the supplier…...
53
2.8 In-situ photograph of laser speckle pattern form on solid sample inside DAC. 57
2.9 SEM image of post laser heated iron sample using flash heating method
depicting (a) emergence of textural changes (b) bead formation upon
recrystallization……………………………………………………………….
58
2.10 Melting temperature determination of gadolinium (Gd) using temperature
plateau method………………………………………………………………..
59
2.11 Sample temperature as a function of time……………………………………. 61
2.12 In-situ photograph of incandescent light emitted by sample at a) time t=0 and
b) t=30 minutes……………………………………………………………….
62
2.13 a) Raman spectra of (a) Ga +N2 system before laser heating at 9 GPa at
ambient temperature shows the Raman active nitrogen modes and (b)
recovered heated sample after laser heating at 9 GPa and 1925 K……………
63
2.14 Le Bail fit ADXRD pattern of the retrieved sample after laser heating……… 64
2.15 Raman spectra of (a) Mo +N2 system before laser heating at 7 GPa at
ambient temperature. Inset shows the Raman active nitrogen modes and (b)

List of figures
xviii
recovered heated sample after laser heating at 7 GPa and 2000 K…………… 65
2.16 Planck fit to a typical incandescent spectrum of laser heated KBr corrected
for instrument spectral response. ……………………………………………..
68
2.17 Experimental melting curve of KBr upto 24 GPa. The available literature
data are shown in the figure for comparison…………………………………..
69
3.1 Image of sample chamber containg osmium, ruby ball and PTM …………… 76
3.2 Comparison of the experimental melting curve of Os and the corresponding
Simon-Glatzel fit with the various theoretical formalisms in pressure-
temperature coordinates ………………………………………………………
77
3.3 Comparison of melting curve of Os with Re and W…………………………. 79
3.4 Density dependence of the Grüneisen parameter obtained in the present study
compared with that of Burakovsky et al………………………………………
84
4.1 Pressure evolution of in situ Raman spectra of KBr + Br2…………………… 94
4.2 Image of sample chamber showing visual change in sample colour at 3.2
GPa……………………………………………………………………………
94
4.3 Structural and vibrational properties of the newly synthesized compound
KBr3 (SG: Pnma). (a) Experimental and theoretical Raman spectra, (b)
pressure variation of Raman mode frequencies. Filled circles show
experimental points and filled diamond show theoretical points, (c) Le-Bail
fit of the pressure release run of ADXRD data ……………………………..
95
4.4 Structural and vibrational properties of the newly synthesized compound
KBr5 (SG: P21). (a) Experimental and theoretical Raman spectrum, (b)
Pressure variation of Raman mode frequencies. Filled circles show
experimental points and filled diamond show theoretical points, (c) Le-Bail
List of figures
xix
fit of ADXRD data at 12 GPa……………………………………………………. 97
4.5 (a) Time evolution of in-situ Raman spectra of KBr5, KBr3 and Br2 from a
fixed sample position. Peaks marked with blue, red and green are guide to
eye for high intensity Raman modes corresponding to KBr3, KBr5 and Br2,
respectively at time t = 0 and (b) increase of sample chamber pressure with
time due to formation of the second stage compound, KBr5……………….
99
4.6 (a) Formation enthalpies in different reactions for KBr3, Enthalpies are given
per atom. (b) Experimental (filled symbols) and theoretical (lines) equations-
of-state, along with (c) pressure variation of theoretical (lines) and
experimental (symbols) lattice parameters of orthorhombic KBr3. (d) Phonon
dispersion curves and phonon density of states (PHDOS) for orthorhombic
KBr3 at 4 GPa…………….…………………………………………………..
101
4.7 (a) Formation enthalpies in different reactions for KBr5. Enthalpies are given
per atom. The experimental observations of simultaneous consumption of
Br2 and KBr3 ruled out second reaction for KBr5 formation. (b)
Experimental (filled symbols) and theoretical (lines) equations-of-state,
along with (c) pressure variation of theoretical (lines) and experimental
(symbols) lattice parameters of monoclinic KBr5. (d) Phonon dispersion
curves and phonon density of states (PHDOS) for KBr5 at 12 GPa………..
106
4.8 Experimental equations of state of KBr (B2 phase, SG: P m-3m), Br2 (SG:
Cmca), KBr3 (SG: Pnma) and KBr5 (SG: P21). Dotted lines are guide to the
eye. Error bars in pressure are within the symbol.…………………………..
108
4.9 Structural and vibrational properties of the newly synthesized trigonal KBr3
(SG: P-3C1) compound. (a) Experimental and theoretical Raman spectrum,
(b) Le-Bail fit to ADXRD data at 15 GPa.…………………………………..
113
4.10 (a) Experimental (filled symbols) and theoretical (lines) equations-of-state of
trigonal KBr3 (SG: P-3C1), (b) pressure variation of theoretical (lines) and
List of figures
xx
experimental (symbols) lattice parameters of trigonal KBr3 (SG: P-3C1).... 115
4.11 (a) Crystal structures of KBr3 (SG: Pnma) and KBr5 (SG: P21) and KBr3
(SG: P-3C1). (b) Enthalpy curve illustrating the structural stability of various
phases of KBr3. Here R-3m structural data was taken from Ref. [2]………….
117
5.1 a) Molecular orbital representation of 3c-4e bond in I3- , Crystal structure of
b) orthorhombic (SG: Pnma), c) trigonal (SG: P-3c1) and d) cubic (SG: Pm-
3n) CsI3………….……………………………………………….…………..
125
5.2 The ambient Raman spectra of CsI3 at various laser powers of the DPSS laser
( = 532 nm)…………………………………………………………………..
128
5.3 Structural evolution of ADXRD pattern of CsI3 with pressure. The arrows
indicate the new peaks………………………………………………………...
130
5.4 Rietveld refined ADXRD pattern of orthorhombic (SG: Pnma) CsI3 at 0.9
GPa. The Rp and wRp factors of the fit are 3.8 and 5.9 %, respectively...........
131
5.5 Rietveld refined ADXRD pattern of trigonal (SG: P-3c1) CsI3 at 12.2 GPa.
The Rp and wRp factors of the fit are 3.4 and 5.1 %, respectively....................
132
5.6 Rietveld refined ADXRD pattern of cubic (SG: Pm-3n) CsI3 at 26.8 GPa.
The Rp and wRp factors of the fit are 2.8 and 3.9%, respectively.....................
132
5.7 ADXRD pattern in the 2θ range of 2⁰ to 7⁰ for pressure released CsI3
depicting the coexistence of orthorhombic and trigonal phases at ambient
condition……………………………………………………………………….
134
5.8 Variation of volume per formula unit as a function of pressure for all the
three phases (orthorhombic, trigonal and cubic) of CsI3……………………...
135
5.9 Variation of normalized lattice parameters of CsI3 in the orthorhombic (SG:
Pnma) phase with pressure……………………………………………………
137

List of figures
xxi
5.10 Variation of normalized lattice parameters of CsI3 in the trigonal (SG: P-3c1)
phase with pressure……………………………………………………………
138
5.11 Pressure evolution of Raman spectra of CsI3. The bars indicate the Raman
modes at ambient conditions………………………………………………….
140
5.12 Variation of Raman mode frequencies of CsI3 with pressure. Dotted vertical
lines are placed at phase transition boundary………………………………….
142
5.13 Variation of electrical resistance of CsI3 with pressure. Arrows denote the
transition points………………………………………………………………..
144
5.14 Universal equation of state of CsI3 in the trigonal phase. The dotted line
denotes the electronic transition pressure..........................................................
146

List of tables
xxii
List of Tables
Table
No.
Table Caption Page
No.
1.1 List of transition metal nitrides with bulk modulus and hardness………………... 7
1.2 Comparison of maximum pressure achieved with different anvil materials……... 22
3.1 Comparison of the Simon-Glatzel fit parameters obtained in the present study
with that reported by various theoretical formalisms described in the
text…………………………………………………………………………………
78
3.2 Comparison of ambient pressure melting temperature and melting slope of some
hcp phase metals: Os [present study], Re [28], Mg [29], Zn [30] and Cd [31]…...
79
3.3 Experimental melting slope compared with that reported by various theoretical
formalisms described in the text…………………………………………………..
80
3.4 Comparison of the model parameters obtained in the present study with Ref [13].
84
4.1 Raman mode frequencies (ω0) of KBr3 (SG: Pnma) and their pressure coefficient
obtained by a linear fit…………………………………………………………….
104
4.2 Raman mode frequencies (ω0) of KBr5 (SG: P21) and their pressure coefficients
obtained by a quadratic fit…………………………………………………………
105
4.3 Intra-molecular bond-angles and bond-lengths of bromine atoms in different
systems…………………………………………………………………………….
109
4.4 Details of most probable compositions and their structures in the K− Br system

List of tables
xxiii
along with corresponding Bader charges (|e|) and electronic band gaps (Eg) in
electron-volts (eV)………………………………………………………………...
110
4.5 K—Br bond-lengths in different compounds…………………………………….. 112
4.6 Experimental and theoretical unit cell volume (V0), bulk modulus (B0) and
derivative of bulk modulus (B0’) obtained by fitting the Birch-Murnaghan
equation of state to the PV data of KBr3 and KBr5………………………………..
116
5.1 Summary of the pressure range of phase stability of the various alkali trihalides 123
5.2 Unit cell parameters and atomic coordinates of CsI3 in the orthorhombic, trigonal
and cubic phase……………………………………………………………………
133
5.3 Unit cell volume (V0 in Å3), bulk modulus (B0 in GPa) and pressure derivative
of bulk modulus (B′) obtained by fitting the third order Birch-Murnaghan
equation of state to the PV data of orthorhombic and trigonal CsI3. The
corresponding data for KBr3 [3] are also tabulated for comparison…………….
136
5.4 Unit cell parameters (a0, b0, c0 in Å), linear modulus (M0 in GPa) and pressure
derivative of linear modulus (M′) at ambient pressure obtained by fitting the
third order Birch-Murnaghan equation of state to the pressure variation of lattice
parameters of orthorhombic and trigonal CsI3…………………………………….
139
5.5 Raman mode frequencies of CsI3 at ambient pressure (ω0) and their pressure
coefficients for the orthorhombic and trigonal phase obtained by a linear or
quadratic fit………………………………………………………………………..
143

List of abbreviations
xxiv
List of Abbreviations
Abbreviation Full form
ADXRD Angle dispersive x-ray diffraction
BM EOS Birch Murnaghan equation of state
CN Coordination number
COHP Crystal orbit Hamiltonian populations
CW Continuous wave
DA Diamond anvil
DAC Diamond anvil cell
DOS Density of states
DPSS Diode pumped solid state laser
ECXRD Extreme condition x-ray diffraction
EOS Equation of state
ELF Electron-localization function
HPHT High pressure high temperature
IR Infrared
LED Light emitting diode
LHDAC Laser heated diamond anvil cell
MAA Multi anvil apparatus
MO Molecular orbital
MIR Mid infrared

List of abbreviations
xxv
NIR Near infrared
NMR Nuclear magnetic resonance
OCP One component plasma
P Pressure
PAW Projector augmented wave
PBE Perdew-Burke-Ernzerhof
PEP Paris–Edinburgh press
PTM Pressure transmitting medium
PV Pressure volume
QMD Quantum molecular dynamic
QTH Quartz tungsten halogen lamp
SEM Scanning electron microscope
SG Space group
T Temperature
Tc Superconducting temperature
Tm Melting temperature
UEOS Universal equation of state
V Volume
WC Tungsten carbide
XAFS X-ray absorption fine structure
XES X-ray emission spectroscopy

Chapter 1: Introduction
1
Chapter 1
Introduction
This chapter gives an overview of the field of high pressure high temperature (HPHT)
research. It begins with a discussion on the significance of HPHT research in diverse scientific
areas. A summary of some recent developments is followed by a brief discussion on pressure and
temperature effects on materials. The last part of the chapter gives a short review of the various
HPHT generation techniques and some of the diagnostic techniques, which are currently coupled
to diamond anvil cell based laser heating technique.
1.1 Significance of High Pressure High Temperature (HPHT) Research
1.1.1 Geophysics
Material behaviour under combined conditions of extreme high pressure (P) and high
temperature (T) was motivated by the curiosity to understand the Earth’s composition. Emil
Wiecherd was first to propose that the Earth is made up of heavy solid iron core [1]. Further,
observations of distant earthquakes by Beno Gutenberg led to the two shell Earth core model
with first accurate determination of core radius of ~2900 km [1,2]. Later, many seismologists
and geophysicists improved the model of Earth’s interior [3]. Even though information about
different layers of Earth’s interior, like crust, upper mantle, lower mantle, outer core and inner

Chapter 1: Introduction
2
core, as shown in Fig. 1.1, have been established based on density, the composition of these
layers are still unknown. For e.g., the density difference of around 10 % has been found between
actual density of Earth’s outer core and that of pure iron at similar pressure and temperature.
Hence, it is believed that outer core is made up of yet unknown composition of iron along with
some light elements like silicon, carbon, nitrogen, oxygen and sulfur [4]. Laboratory based
HPHT technique capable of simulating extreme high pressures (~ 360 GPa) and high
temperature condition (~ 5000-6000 K) equivalent to the pressure and temperature at the center
of Earth will be advantageous to resolve Earth core’s composition and the crystal structure of
iron at the pressure and temperature conditions existing at the inner core. The knowledge of the
structure and geochemical composition of Earth’s interior would be useful to understand heat
flow mechanism and its modeling [5].
Fig. 1.1: Cross sectional view of earth’s interior with depth, corresponding pressure and
temperature range.

Chapter 1: Introduction
3
1.1.2 Planetary physics
Apart from geophysicist, planetary physicists have also been fascinated in understanding
the composition of the planetary interior with an aim to provide plausible explanation for the
perplexing planetary observations. The spectroscopic evidence for the presence of gases like
methane (CH4), nitrogen (N2), carbon dioxide (CO2), water/ice (H2O) etc., in exoplanets, gas
giant planets and their satellites by the various outer space missions has motivated several studies
on the physical and chemical properties of these gases and their mixtures at HPHT. For e.g.,
clathrates of CH4, CO2 and other gases form the geology of extraterrestrial bodies in our solar
system. Clathrates are basically cage structures comprising a host water molecule in which guest
gas molecules are trapped. The study of stability of different clathrates under HPHT conditions is
important to understand the composition and geology of the outer space bodies. Interestingly,
methane clathrate, (also called methane hydrate) not only exists in icy moons and exoplanets but
also in Earth’s oceanic deposit and polar ice sheets [6, 7]. Release of CH4 from these deposits
into the Earth’s atmosphere would be one of the major concern for global warming. Similarly,
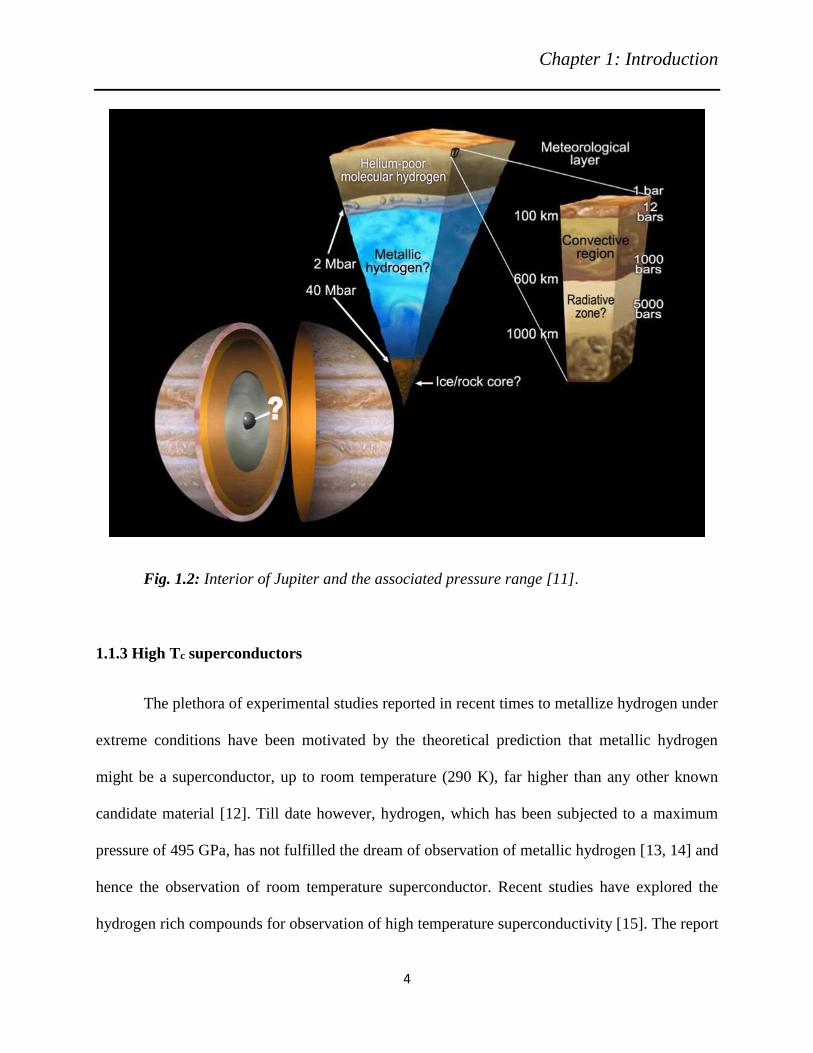
the detection of strong geomagnetic field associated with Jupiter has puzzled planetary scientists
[8]. Unlike Earth, the gas giants lack liquid iron core to generate magnetic field. The explanation
put forward to explain the origin of this field is that the pressure and temperature at the centre of
Jupiter is sufficient to metallize hydrogen, (Fig. 1.2) which is in superconducting phase and
produces the magnetic field [9,10]. This has led to a worldwide research in high pressure
laboratories to metallize hydrogen under HPHT.
Chapter 1: Introduction
4
Fig. 1.2: Interior of Jupiter and the associated pressure range [11].
1.1.3 High Tc superconductors
The plethora of experimental studies reported in recent times to metallize hydrogen under
extreme conditions have been motivated by the theoretical prediction that metallic hydrogen
might be a superconductor, up to room temperature (290 K), far higher than any other known
candidate material [12]. Till date however, hydrogen, which has been subjected to a maximum
pressure of 495 GPa, has not fulfilled the dream of observation of metallic hydrogen [13, 14] and
hence the observation of room temperature superconductor. Recent studies have explored the
hydrogen rich compounds for observation of high temperature superconductivity [15]. The report

Chapter 1: Introduction
5
of highest recorded superconducting temperature of ~ 203 K at 1.5 Mbar in H2S [16] has opened
up new avenues in the search for high Tc superconductors.
Chemical pre-compression in metal hydride is seen to lower the metallization pressure,
compared to pure H2, in metal hydrides [17]. Moreover, such materials dominated by hydrogen
element, high temperature superconductivity can be found after metallization [18]. Concurrently,
several metal hydrides have been predicted to be superconducting with high superconducting
temperature (Tc) [19]. For e.g., high Tc (~235 K) is predicted for polyhydride of Ca [19].
Similarly, alkali polyhydrides are also predicted to be superconductor [20]. Reaction of alkali
hydrides, i.e., LiH, NaH, KH etc., and alkaline earth metals with hydrogen at HPHT could
provide possible pathways for the synthesis of some of these novel superconducting
polyhydrides.
1.1.4 Synthesis of novel stoichiometric compounds
High pressure and high temperature conditions provide a pathway to unexpected
phenomena and stoichiometries in various materials. For instance, alkali halides (CsI), which are
prototype ionic compounds and insulator at ambient conditions, show pressure induced
metallization [21]. CsI is reported to be superconductor above 180 GPa with Tc ~2 K [22, 23].
The exotic behaviour of these simple compounds at extreme thermodynamic conditions has
given impetus to HPHT research in alkali-halogen system. The recent prediction of counter
intuitive compounds such as NaCl3, NaCl7, Na3Cl, Na2Cl3 and NaCl7 in (Na-Cl) system at high
pressure and successful synthesis of some of these compounds, i.e., NaCl3, NaCl7 and Na3Cl at
HPHT conditions are notable examples of effect of high pressure and high temperature on
stoichiometries [24]. Apart from alkali-halogen system, Mg-O, Fe-O, Xe-H etc., are recent

Chapter 1: Introduction
6
examples where novel compounds have been theoretically predicted at high pressures [25-27].
Similarly, Xe(H2)7 and Xe(H2)8, in Xe-H system are reported to contain the highest hydrogen
content among all the known compounds [27].
1.1.5 Synthesis of superhard materials
The search for superhard materials is driven by the constant industrial demand for new
materials with favourable properties like high strength, low compressibility etc. Towards this
end, HPHT conditions provide a unique opportunity to access chemical reaction pathways that
are unachievable by conventional chemical routes for the synthesis of compounds with desirable
properties. Among the numerous materials synthesized at HPHT conditions, the ones, which are
retrievable in metastable phase at ambient conditions, have proved to be a boon for technological
advancement. Diamond, one of the allotrope of carbon, is the most classic example of superhard
material synthesized deep inside the earth as well as in laboratories above 1500 K and 7.5 GPa.
The kinetic stability and metastable nature of diamond has enabled its retrieval at ambient
conditions. It is also noteworthy that the synthesis of amorphous diamond having bulk modulus,
hardness and thermal conductivity comparable to diamond has also been recently reported [28].
Another renowned material produced under pressure is cubic boron nitride, c-BN, ranked second
after diamond in hardness and finding a great many commercial uses [29]. Other promising
superhard binary systems are the C-N and Si-N system [30]. Interestingly, many transition metal
nitrides, carbides and borides are also promising candidates for ultrahard materials with
superlative properties [31]. Examples of binary transition metal carbides, nitrides and borides
with remarkable properties are the extremely high melting points of HfC (4201 K) [31] and TaC
(4223 K) [31], the large bulk modulus of OsB (453 GPa) [31], and the ultra-hardness of ReB2

Chapter 1: Introduction
7
(Hv = 30–48 GPa), WB4 (Hv = 46 GPa) and MoN (Hv = 38.5 GPa) [31]. Bulk modulus and
hardness of few binary transition metal nitrides including the nitrides synthesized as a part of this
thesis work are summarized in Table 1.1. High bulk modulus values are reported for platinum
group (VIII) metal borides and nitrides with stoichiometry MN2/MB2 , where M stands for
transition metal [32-36]. Structurally unusual features are observed in these nitrides, which
contain dinitrogen units within their crystal structures.
Table 1.1: List of transition metal nitrides with bulk modulus and hardness
Group Compound Bulk Modulus
(GPa)
Hardness
(GPa) Reference
IV
TiN 277-289 18-21 [37-41]
TiN2 385 ----- [42]
δ-ZrN 248 15.8-17.4 [37, 43]
c-Zr3N4 217-223 18 [44, 45]
δ-HfN 260 16.3-19.5 [37, 43]
c-Hf3N4 227-241 ----- [46, 47]
V
VN 265 6-15 [48, 49]
δ-NbN 348 13.3-20 [37, 43]
β-Ta2N 360 ----- [50]
ε-TaN 288 24.7 [51]
η-Ta2N3 319 16 [52, 53]

Chapter 1: Introduction
8
VI
hp-CrN 243 ----- [48]
Cr2N 275 15.7 [39, 51]
δ-MoN 345 38.5 [51, 54, 55]
γ-Mo2N 301-304 35.7 [39,55,]
VII
Re3N 395 ----- [56]
Re2N 401 ----- [56]
VIII
ε-Fe7N3 168 ----- [57]
γ-Fe4N 155 ----- [57]
ε-Fe3N 172 7.4 [58]
OsN2 358 ----- [32]
IrN2 428 ----- [32]
RhN2 235 ----- [33]
RuN2 330 ----- [34]
PtN2 354-372 ----- [35]
IIb Zn3N2 228 ----- [36]
IIIa GaN 188 ----- [59]
1.1.6 Melting under pressure
Melting behaviour of some elementary solids e.g., maxima in melting curve observed in
Li and Na have surprised researchers [60, 61]. Also, the nearly zero melting slopes at high

Chapter 1: Introduction
9
pressures reported for some transition metals like Sn [62] and their disagreement with the
experimental shock data and theoretically calculated melting temperatures are still debatable.
High pressure melting curve of iron is important for understanding the heat convection and
modeling of the Earth’s core, owing to the fact that, the outer core in made up of iron along with
other lighter elements ( like C, S, O etc.) in molten state. Although several models, starting from
Lindemann criteria to Kechin model, have been proposed yet they fail to explain microscopic
mechanism of melting [63, 64]. Hence, establishment of high pressure melting curves of various
elemental solids will be pivotal to understanding the phenomenon of melting.
1.2 Effect of Pressure and Temperature on Condensed Matter
Pressure (P), volume (V) and temperature (T) are the three thermodynamical variables
which decide the state of any matter. The effect of change in these variables is reflected in the
form of modification in intermolecular or/and intramolecular potentials in materials leading to
many novel and unexpected phase transitions, such as polymorphic transition, amorphization,
electronic transitions such as valence transition, metallization and molecular dissociation.
Macroscopically, variation in pressure and temperature is manifested in the form of volume
change when either of them is kept constant.
1.2.1 Pressure effect
From a microscopic perspective it may be stated that pressure directly affects the
equilibrium spacing of nuclei, distorts the electron clouds and modifies the restoring force, i.e.,
crystal potential. Thermodynamic expression for the change in energy as a result of applied
pressure at constant volume and temperature can be expressed as

Chapter 1: Introduction
10
W = VΔP (1.1)
where W, V and P is the work done, volume and pressure respectively. Application of pressure
of the 100 GPa on solid leads to a change in free energy of 1 eV. This energy is sufficient to alter
the bond lengths and the bond angles, which in turn govern the electronic and magnetic
properties of solids. Application of pressure of a few GPa results in a volume change as high as
50% or more in case of soft solids like hydrogen [65]. Thus Pressure can induce myriad changes
in the electronic properties of material as dicussed in the following subsection.
1.2.1.1 Hybridization
Pressure can drastically alter the nature of bonding, i.e., π and σ bond, ionic and covalent
nature of bonds etc. The hybridization of crystal orbitals is dramatically influenced by pressure.
The sp2 hybridization, which is fundamental in B, C and N, becomes unstable and is converted to
sp3 hybridization under pressure. For instance, in graphite, half of the π bonds (sp2 hybridization)
get converted into σ bond (sp3 hybridization) above 17 GPa, resulting in a new phase of carbon.
This new monoclinic phase of carbon is found to be superhard [66, 67]. The recent report of
superhard amorphous diamond, with a near complete conversion of π to σ bond is another
example of pressure effect on orbital hybridization [68, 69].
1.2.1.2 Hydrogen bond symmetrization
In the solid phase, each molecule of water (H2O) is attached to other water molecules by
forming a hydrogen bond between oxygen and hydrogen atom of different molecules. This open

Chapter 1: Introduction
11
geometry of water molecule exhibits an unusually rich pressure–temperature phase diagram.
Under pressure, the distance between donor (proton) and acceptor oxygen atoms reduces leading
to degenerate single well proton potential, wherein hydrogen atom is located midway between
two neighboring oxygen atoms, resulting in symmetrization of hydrogen bond. Infrared (IR),
Raman, and X-ray measurements [70-72] have provided evidence for transition of ice VII phase
to ice X phase having symmetric hydrogen bonds, when the distance between acceptor and donor
oxygen atoms decreases below 2.3 Å, i.e., 60 GPa pressure.
1.2.1.3 Reactivity
Pressure alters the reactivity and chemical affinity by bringing about changes in ionic
radii, electronic structure and bonding characters. Notable examples of reactivity change under
pressure are Van der Waal’s compounds formed by inert gas ‘argon’ with hydrogen [73], which
is stable up to 358 GPa, and other inert gas compounds formed by xenon with hydrogen [27],
fluorine [74] and oxygen [75]. Similarly, noble metals no longer remain noble but form nitrides
[76], when laser heated with molecular nitrogen under pressure. The reverse effect of pressure on
reactivity is also true e.g., reactive molecules like H2 and O2 become inert with respect to each
other and coexist in same crystal [77] under pressure.
1.2.1.4 Electronic configuration
The energy of s, p, d and f orbitals varies differently under compression. It is also known
that orbital with high angular momentum is favored at higher compressions thus leading to s to p

Chapter 1: Introduction
12
and s to d transitions. For instance, the synthesis of KAg2 under pressure is made possible by the
transition of electron from s to d orbital in potassium [78].
1.2.1.5 Electronegativity
Electronegativity determines the distribution of bonding electrons between two atoms
[79]. It is a quantitative measure of the effectiveness of nuclear charge as sensed within an outer
orbital vacancy. Application of pressure leads to a change in effective electronic configuration,
which in turn results in a change in electronegativity of atoms thus leading to different oxidation
states. Recent experimental and theoretical studies have reported the stabilization of higher
oxidation states of xenon (Xe0 – Xe2 – Xe4 – Xe6) under pressure [75, 80]. Higher oxidation
states have also been predicted for cesium in cesium polyfluoride compounds under compression
[81, 82]. It is also predicted that at high pressures, cesium, which has the least electronegativity
at ambient condition, could become p-block element and form compounds with fluorine, which
has the highest electronegativity.
1.2.1.6 Chemical hardness
Chemical hardness is defined as resistance of an atom to change its electronic
configuration [83]. Pressure affects the spatial distribution of electrons, which result in change in
the kinetic and potential energies and enthalpy of atoms thus leading to a change in chemical
hardness of atoms. Theoretically calculated trend in chemical hardness with pressure for selected
elements is shown in Fig. 1.3 [84].

Chapter 1: Introduction
13
Fig. 1.3: Pressure variation of chemical hardness in sodium (Na), Magnesium (Mg), Gold (Au),
Lithium (Li), Nickel (Ni), Carbon (C), and Nitrogen (N) [84].
1.2.1.7 Coordination
Pressure induced coordination change have been reported in liquids, solids and
amorphous/glasses. For instance, Liquid fayalite exhibits an average Fe–O coordination number
(CN) of 4.8 at ambient pressure which arises from the co-existence of approximately 60% FeO4
and 40% FeO6 units [85]. With increasing pressure up to 7.5 GPa, the average Fe–O CN
increases to 7.2 [86]. The CN change from 8 to 10 for platinum and 4 to 5 for indium in
intermetallic compound PtIn2 during CaF2 type to Fe2B type structural phase transition, is an
example of pressure induced change of coordination in solids [87].

Chapter 1: Introduction
14
1.2.2 Temperature effect
The primary effect of temperature is to induce diffusion and reduce kinetic barriers in
solids. Temperature also affects the population of different vibrational levels of each normal
mode, i.e., it induces high energy phonons in crystals. Non-equidistant energy of these
vibrational levels leads to a change in equilibrium distances between atoms [88]. It is noteworthy
that the volume change (ΔV/V0) observed from ambient temperature to the melting of solid is
typically ~ 6%.
According to Debye model, the thermal energy of a solid due to change in temperature is
given by
d
e
T
nRTE
T
D
th
D
−
=
0
3
31
9
(1.2)
where Eth, n, R, θD and ξ are thermal vibrational energy, number of atoms per formula unit, gas
constant, Debye temperature and (ħω/kT) respectively. The change in free energy of solids due
to temperature variation of 104 K is 1 eV, which is orders of magnitude smaller than the energy
associated with pressure variation [89].
1.3 High Pressure High Temperature (HPHT) Techniques
Pressure and temperature both lead to change in lattice parameters of materials. However,
pressure and temperature complement each other owing to the different microscopic mechanism

Chapter 1: Introduction
15
by which they alter the lattice parameters. In this sense the field of HPHT research opens up
novel phases in materials, enabling one to obtain P-V-T equation of state (EOS) and investigate
the phase diagram of important materials including their phase transitions and phase stability.
The available HPHT devices can be broadly classified into two major types viz., static
compression and dynamic compression based techiques. In the case of static compression
techniques, the time required to apply pressure is much longer than time required by the system
to reach thermal equilibrium. Hence all static compression methods are isothermal and require
external heating source to increase the sample temperature. In the case of dynamic pressure
studies, HPHT is achieved by shock compression using an explosive, laser or a projectile. The
following subsection gives a brief review of available HPHT techniques elucidating their
capabilities and limitations.
1.3.1 Static high pressure technique for HPHT research
The static compression techniques can be divided into large volume apparatus and
diamond anvil cell based techniques, which are briefly described in the following subsection.
1.3.1.1 Large volume apparatus
The major large volume techniques for generation of HPHT are the piston-cylinder,
Bridgman anvil apparatus, belt apparatus, Toroidal anvil, Paris–Edinburg cell and Multi-anvil
apparatus (MAA). As the name suggests, the sample volume subjected to HPHT in large volume
apparatus, ranges from few cm3 to mm3 [90]. The principal advantage of large volume apparatus
is the retrieval of a relatively large quantity of sample (volume of the order of mm3) for post
experimental analysis.

Chapter 1: Introduction
16
The piston-cylinder is the simplest of all the high pressure devices. Figure 1.4 shows a schematic
of cross-sectional view of a piston cylinder press. The sample pressure is generated by moving
the master ram upwards using a hydraulic press. In order to keep the whole system in
equilibrium and prevent deformation, one should apply pressure also from the top in the end
loaded type piston-cylinder apparatus. In non end-loaded apparatus, the mechanism to apply
pressure from the top is absent and hence it cannot be used to very high pressures. Pressure and
temperature range achieved in piston-cylinder apparatus is around 4 GPa and 2000 K [91]. It is
noteworthy that piston-cylinder is the only device which is capable of generation of hydrostatic
pressure.
Fig. 1.4: Schematic of cross-sectional view of a piston cylinder press [92]
All the other large volume apparatus are opposed anvil high pressure devices working on the
principle of massive support which states that if high pressure is generated on a small area of a
much larger body, it can support two or three times the compressive yield stress because of its
attachment to the surrounding material. Figure 1.5 shows a schematic of a tungsten carbide (WC)

Chapter 1: Introduction
17
anvil based Bridgman anvil apparatus capable of achieving a pressure up to 10 GPa. The use of
sintered diamond increases the pressure limit to 20.5 GPa [93]. A maximum temperature of 1400
K, using graphite disc heater, has been achieved in Bridgman anvil apparatus [93].
Fig. 1.5: Schematic of Bridgman anvil apparatus [94]
The belt apparatus (Fig. 1.6a) is another HPHT device capable of generating higher pressure
compared to piston-cylinder. This apparatus has two opposed anvils and a belt-type die, that
consist of a cylinder and several supporting rings, as shown in Fig. 1.6b. The belt-type die made
up of tungsten carbide limits the pressure bearing capacity of the belt apparatus. Recently, a
novel high pressure belt-type die with a split cylinder has been developed to increase pressure

Chapter 1: Introduction
18
bearing capability of the belt apparatus [95]. Typical pressures and temperatures achieved using
the belt apparatus is ~10 GPa and ~1700 K [96].
a)
b)
Fig. 1.6: a) Belt apparatus assembly [97] and b) schematic of belt-type and split
cylinder [98].

Chapter 1: Introduction
19
Toroidal anvil, developed by USSR physicist L. G. Khvostantsev in 1969, pushed the pressure
and temperature limits to ~16 GPa and 2500 K [99, 100]. As shown in Fig. 1.7, the sample in
toroidal anvil apparatus is encapsulated in BN or alumina cylinder, which serves as the sample
crucible. This crucible is surrounded by graphite cylinder and graphite caps, which act as a
heater when electrical current is passed through it and raises the sample temperature. This
assembly is then placed at the central hole of toroidal shaped pyrophyllite gasket. High pressure
is generated by applying load to the gasket placed between two toroidal shaped anvils using a
hydraulic press. Toroidal anvil apparatus is one of the preferred choice for chemical synthesis,
single crystal synthesis, electrical resistance measurements, Hall resistance measurements and
equation of state studies [100-102]. The high pressure capability of toroidal anvil apparatus is
limited by the WC anvils. The use of synthetic polycrystalline diamond in toroidal anvil has
however enabled a pressure ~35 GPa to be achieved [100].
Fig. 1.7: Cross-sectional view of toroidal anvils with pyrophyllite gasket at the middle
[103].

Chapter 1: Introduction
20
Paris–Edinburgh press (PEP) is another large volume apparatus capable of generating a
maximum pressure and temperature of 11 GPa and 1800 K respectively. Figure 1.8a shows a
typical gasket assembly used for PEP experiments. Pressure is generated by applying load to the
sample assembly using a hydraulic press as shown in Fig. 1.8b. The use of sintered diamond in
PEP has further increased the pressure limit up to 16.5 GPa [104]. The main advantage of Paris–
Edinburgh press is that it can be coupled with synchrotron based XRD and neutron diffraction
measurements [104].
a) b)
Fig. 1.8: a) Cross section of gasket assembly used in Paris–Edinburgh press [105]. b)
Schematic diagram of Paris–Edinburgh press [106].
In recent times multianvil apparatus has emerged as a popular large volume device for HPHT
studies. Multi-anvil (MAA) as shown in Fig. 1.9 can be defined as a high pressure apparatus with
more than one axis of loading with four or more anvils compressing the sample. The first multi-
anvil device with a tetrahedral anvils geometry, generated pressure of 10 GPa and temperature in

Chapter 1: Introduction
21
access of 3000 K [107]. In the past decade, the pressure limit of MAA has been raised to 27 GPa
[108]. It has been reported that MAA can generate pressures up to 1 Mbar using nano-
polycrystalline diamonds in conjunction with WC anvils [109]. The MAA, coupled with in situ
X-ray diffraction techniques, has proven to be ideal for HPHT structural studies in Earth and
planetary research [107].
Fig. 1.9: Photograph of MAA with sample assembly of recovered sample [110].
1.3.1.2 Diamond anvil cell (DAC) based HPHT techniques
The DAC is a device par excellence, which exploits the remarkable properties of
diamonds, such as high hardness and optical transparency to a wide range of electromagnetic
spectrum. It is noteworthy that DAC also enables an in-situ visual observation of the pressurized
sample. The additional advantage of DAC is that it can be easily integrated with a variety of
diagnostics like X-ray diffraction, Raman, Brillouin and synchrotron based micro-probing

Chapter 1: Introduction
22
techniques giving it an edge over large volume apparatus for materials research. In recent times,
the highest static pressure of 1.0 TPa has been achieved using a novel two stage DAC [111]. The
development of DAC has reduced the size of high pressure device substantially thus facilitating
easy transportation. The alternative anvil material used for high pressure experiments are
moissanite (SiC) [112], cubic Zirconia (ZrO2) [113] and Sapphire (Al2O3) [114, 115]. Table 1.2
summarizes the maximum pressure achieved with different anvil materials in comparison to
diamond.
Table 1.2: Comparison of maximum pressure achieved with different anvil materials.
Anvil material Diamond
[111]
SiC
[112]
Al2O3
[114,115]
ZrO2
[113]
Maximum Pressure
(GPa)
1065 59 26 17
The DAC also offers a powerful and versatile means of investigating the properties of
materials at sustained high temperatures and pressures by two techniques viz., resistive heating
and laser heating. Resistive heating in a DAC can be carried out by either internal heating or
external heating. In external heating method, a coil heater surrounding the anvils or a band heater
around DAC is used [116]. The maximum temperature attained by this technique is limited to
1300 K owing to graphitization and oxidation of the diamond anvils above this temperature as
well as mechanical instability of different parts of the DAC at elevated temperatures [116]. The
principle advantage of the DAC based resistive heating technique is the nearly uniform sample

Chapter 1: Introduction
23
temperature and the ease of sample temperature measurement using thermocouple while the
main disadvantage is the existence of large pressure inhomogeneity (gradient) across the sample.
The temperature limitation of external heating technique can be partially overcome by internal
resistively heated DAC technique. In this case, the electrical current is passed through the sample
itself and the temperature is measured by an optical pyrometer. The main limitation of this
technique is however the requirement of a metallic sample and the pressure gradient induced
deformation and failure of heating circuit at very high pressures. A maximum sample
temperature up to 3000K has been achieved by this technique [117]. The development of
designer diamond anvils overcomes this problem. In these anvils, the heating elements and the
measuring probes are fabricated on the culets by lithographic fabrication. These have been tested
up to 21 GPa and 2000K [118].
In recent times, laser heated diamond anvil cell (LHDAC) technique has emerged as a
valuable and versatile tool for achieving high pressures (P > 100 GPa) and temperatures (T ~
6000K) thus providing a unique opportunity to investigate material properties at these extreme
conditions. The optical transparency of diamond in the infrared (IR) region allows the use of
continuous wave (CW) near infrared (NIR) lasers such as neodymium doped yttrium aluminium
garnet (Nd3+:YAG), neodymium doped yttrium lithium fluoride (Nd3+:YLF), ytterbium (Yb)
doped fibre laser or MIR CO2 laser, the choice being driven by sample absorptivity.
Advancement in laser technology have made IR lasers more compact, stable (in terms of power
as well as pointing stability) and a maximum power reaching over more than 200 W . This has
facilitated a myriad of HPHT in-situ diagnostic techniques like Raman and Brillouin
spectroscopy, x-ray diffraction, x-ray absorption fine structure (XAFS), electrical transport,
NMR etc [119- 127]. A detailed discussion on LHDAC is presented in Chapter 2 of this thesis.

Chapter 1: Introduction
24
Materials subjected to HPHT conditions in LHDAC experiments with IR laser in the CW
mode are vulnerable to chemical reaction with surroundings, i.e., pressure transmitting medium,
pressure calibrant, diamond etc. Very recently, DAC based pulsed laser heating technique has
been developed to address these problems. The short heating duration, ~ µs, in pulsed laser
heating helps in suppressing thermally activated chemical diffusion and reaction. In addition, it
enables one to achieve higher sample temperature compared to CW laser heating; as the same
energy is delivered in much shorter period of time. This technique is useful for time resolved
measurements [128]. For instance, XRD measurements could be made possible, during pulsed
laser heating, when coupled with synchrotron x-ray sources having time resolved high brilliance
x-ray pulses of the order of femtosecond to nanosecond [128]. The measurement of the peak
sample temperature in case of pulsed laser heating however necessitates more complex
electronics.
1.3.2 Dynamic high pressure technique for HPHT measurements
In dynamic method, HPHT is achieved by launching a dynamic compression wave or
shock wave in the material. Shock is defined as a discontinuity in thermodynamic variables,
which propagates with supersonic velocity with respect to the material ahead of it and with
subsonic velocity with respect to the material behind it. A pressure wave which travels with a
speed higher than the system response time generates a shock in the system. Shock experiment is
an irreversible adiabatic process since the material does not have enough time to achieve thermal
equilibrium with the surrounding. Dynamic pressures are normally created by depositing high
energy densities over small time durations on the target materials by impacting with a flyer plate
moving at high velocity, or by a rapid deposition of energy using explosives [129], lasers [130],

Chapter 1: Introduction
25
particle beams etc., [131]. The shock experiment enables one to achieve extremely high
pressures of the order of TPa in the laboratory. During shock experiment, the system jumps from
one thermodynamic state to another thermodynamic state. Also, since the increase in temperature
is as a result of adiabatic process during shock compression, it does not necessarily require any
external heating mechanism to generate HPHT condition, which limits the independent control
over final pressure and temperature. The time duration involved in shock compression however
demands ultrafast diagnostic techniques. The sample characterization is also much more
involved and limited to fewer probes as compared to static high pressure techniques.
Recently, a new approach combining static and dynamic compression techniques has
been reported wherein strong shockwave is launched in precompressed samples. This allows one
to explore extreme conditions of matter, such as molecular fluid to the plasma state transition and
the superionic states of molecular solids [132]. This technique is quite promising since a few
GPa precompression can induce significant density increase in compressible fluids. The locus of
shock states (Hugoniot) accessible by the subsequent multiple shock compressions with same
precompressed state or series of shock compressions are reached at moderately lower
temperatures (~103-104 K) and higher densities (~ few Mbar), which is the advantageous over
conventional laser shock experiments, for planetary studies [89].
1.4 Review of Diagnostic Techniques Coupled to LHDAC
Diamond is transparent to a wide electromagnetic spectrum ranging from hard x-rays to
far IR. The use of diamond anvil in LHDAC thus enables the integration of many diagnostic
techniques for in situ investigation of materials at extreme conditions. Synchrotron based

Chapter 1: Introduction
26
ADXRD measurements are the most widely used diagnostic technique coupled to LHDAC.
Nearly all leading synchrotron facilities across the world, like PETRA III, APS, Spring8, ESRF
etc., have a dedicated beamline for LHDAC based ADXRD measurements for HPHT structural
and material synthesis studies [119, 120]. In addition, it also enables determination of the phase
diagram and high pressure melting curve of important materials.
Another popular diagnostic technique coupled to LHDAC is Raman spectroscopy, which
provides molecular and vibrational information of materials at HPHT conditions. For e.g., HPHT
Raman study of CO2 has been reported up to 65 GPa and 1600 K for its obvious importance in
planetary studies [121]. Similarly, N2 has been studied up to 120 GPa and 2500K using LHDAC
based Raman spectroscopy and a maxima in melting line at ~ 70 GPa has been observed [122].
LHDAC based Brillouin spectroscopy is an ideal technique for the study of elastic
properties of materials at HPHT condition. Recently this technique has been used to study elastic
properties of single crystal olivine up to 13 GPa and 1300K [123] and water – ice (H2O) system
up to 2500 K and several GPa pressure [123].
Resistivity measurement has also been recently coupled to LHDAC to study the melting
curve of Fe up to 1 Mbar and 3200K [124]. In this technique, sample in the form of wires, were
heated with an ytterbium fiber laser (λ = 1070 nm, TEM00 mode, CW). The change in the
electrical resistance of the sample wire is measured by the two-terminal method using
sourcemeter under a constant DC current [124].
Iron is one of the most important geophysical material and the accuracy of high pressure
melting curve of Fe with different melting criteria is still debatable. Recently, the melting line of
Fe has been reported up to 103 GPa by integrating synchrotron based XAS to LHDAC [125].

Chapter 1: Introduction
27
Similarly, synchrotron-based X-ray emission spectroscopy (XES) is well suited to probe the
local electronic structure of 3d transition metals such as Fe and Mn in their host phases. Laser
heated XES experiment on the crystal, magnesiowustite (Mg0.75Fe0.25)O, has been carried out to
study the spin state of ferrous iron up to 47 GPa and 1300 K [126].
Other spectroscopic techniques which have been successfully coupled to LHDAC are
nuclear resonant inelastic X-ray scattering and synchrotron based Mossbauer spectroscopy [127].
HPHT studies up to 100 GPa and 2500 K on iron containing minerals have been reported using
these methods [127].
1.5 Organization of the Present Thesis
The present thesis is organized in to six chapters. The introductory Chapter 1 gives a
brief overview and some recent development in the area of HPHT research followed by a
summary of the various available HPHT techniques highlighting the importance of LHDAC. The
design aspect and setting up of a Yb fibre laser based LHDAC facility forms the instrumentation
part of the thesis. The details of development of this facility and its successful application for
carrying out high pressure melting and HPHT synthesis experiments are described in Chapter 2.
The LHDAC facility has been employed for experimental determination of melting curve, up to
35 GPa, of elemental osmium, which has some remarkable properties like highest density among
elements and a bulk modulus that is almost comparable to that of diamond under ambient
temperature and pressure conditions. The details of the study are described in Chapter 3. The
synthesis of counterintuitive compounds in K-Br system viz., KBr3 and KBr5 at HPHT and their
ambient temperature high pressure study i.e., stoichiometry, crystal structure, vibrational

Chapter 1: Introduction
28
properties and theoretical calculation of bonding and electronic band structure have been
described in Chapter 4. Recent reports on the synthesis of alkali trihalide compounds in Na-Cl,
K-Br and K-Cl at extreme conditions have rekindled the interest in this new class of compounds
with unknown chemical and physical properties. Furthermore, the advent of bright synchrotron
source has made it possible to carry out high pressure ADXRD measurements with greater
resolution, accuracy and precision. Chapter 5 of this thesis describes the results of high pressure
structural, vibrational and transport measurements on the alkai trihalide “CsI3”. A brief summary
of the research work discussed in this thesis and some future extension of the present work are
highlighted in Chapter 6.

Chapter 1: Introduction
29
References:
[1] B. Gutenberg, Physikalische Zeitschrift ,14, 1217 (1913).
[2] B. Gutenberg, Ueber Erdbebenwellen. VII A. Beobachtungen an Registrierungen von
Fernbeben in Göttingen und Folgerungen über die Konstitution des Erdkörpers.
Nachrichten von der Königlichen Gesellschaft der Wissenschaften zu Göttingen.
Mathematisch-physikalische Klasse, 125-177 (1914).
[3] A. M. Dziewonski and D. L. Anderson, Phys. Earth Planet. Inter., 25, 297 (1981).
[4] D. C. Rubie , D. J. Frost, U. Mann, Y. Asahara, F. Nimmo, K. Tsuno, P. Kegler, A.
Holzheid and H. Palme, Earth Planet. Sci. Lett. 301, 31 (2011).
[5] D. Gubbins, B. Sreenivasan, J. Mound and S. Rost, Nature 473, 361(2011).
[6] A. Biastoch, T. Treude, L. H. Rüpke, U. Riebesell, C. Roth, E. B. Burwicz, W. Park,
M. Latif, C. W. Böning, G. Madec and K. Wallmann, Geophys. Res. Lett. 38, L08602
(2011).
[7] C. D. Ruppel, Nature Education Knowledge, 3, 29 (2011).
[8] S.W.H. Cowley and E.J. Bunce, Planetary and Space Science, 49,1067 (2001).
[9] R. Smoluchowski, The Astrophysical Journal, 200, L119 (1975).
[10] Bolton et al., Science 356, 821 (2017).
[11] https://www.tes.com/lessons/tg5Pp-QE-JVZwQ/jupiter
[12] N.W. Ashcroft, Phys. Rev. Lett. 21, 1748 (1968).
[13] N.W. Ashcroft, Phys. Rev. Lett. 92, 187002 (2004).
[14] Z. M. Geballe, H. Liu, A. K. Mishra, M. Ahart, M. Somayazulu, Y. Meng, M. Baldini
and R. J. Hemley, Angew. Chem. Int. Ed. 57, 688 (2018).
[15] R. P. Dias and I. F. Silvera, Science 355, 715 (2017).

Chapter 1: Introduction
30
[16] A. P. Drozdov, M. I. Eremets, I. A. Troyan, V. Ksenofontov and S. I. Shylin, Nature
525, 73 (2015).
[17] V. V. Struzhkin, D. Y. Kim, E. Stavrou, T. Muramatsu, H. K. Mao, C. J. Pickard, R. J.
Needs, V. B. Prakapenka and A. F. Goncharov, Nature Comm. 7, 12267 (2016).
[18] X. Feng, J. Zhang, G. Gao, H. Liu and H. Wang, RSC Adv. 5, 59292 (2015).
[19] H. Wang, J. S. Tse, K. Tanaka, T. Iitaka and Y. Ma, Proc.Natl. Acad. Sci. 109, 6463
(2012).
[20] P. Baettig and E. Zurek, Phys. Rev. Latt. 106, 237002 (2011).
[21] M. I. Eremets, K. Shimizu, T. C. Kobayashi and K. Amaya, Science 281, 1333 (1998).
[22] Y. Xu, J. S. Tse, A. R. Oganov, T. Cui, H. Wang, Y. Ma and G. Zuo, Phys. Rev. B 79,
144110 (2009).
[23] M. I. Eremets, K. Shimizu, T. C. Kobayashi and K. Amaya, J. Phys.: Condens. Matter
10, 11519 (1998).
[24] W. Zhang, A. R. Oganov, A. F. Goncharov, Q. Zhu, S. E.Boulfelfel, A. O. Lyakhov,
E. Stavrou, M. Somayazulu, V. B. Prakapenka and Z. Konopkova, Science, 342, 1502
(2013).
[25] Q. Zhu, A. R. Oganov and A. O. Lyaknov, Phys. Chem. Chem. Phys.15, 7696 (2013).
[26] H. Niu, A. R. Oganov, X. Q. Chen and D. Li, Sci. Rep. 5, 18347 (2015).
[27] M. Somayazulu, P. Dera, A. F. Goncharov, S. A. Gramsch, P. Liermann, W. Yang, Z.
Liu, H. K. Mao and R. J. Hemley, Nat. Chem. 2, 50 (2010).
[28] Z. Zeng, L. Yang, Q. Zeng, H. Lou, H. Sheng, J. Wen, D. J. Miller, Y. Meng, W.
Yang, W. L. Mao and H. K. Mao, Nat. Commun. 8, 322 (2017).
[29] G. Demazeau, Diamond and Related Materials 4, 284 (1995).

Chapter 1: Introduction
31
[30] O. O. Kurakevych, J. Superhard Mater. 31, 139 (2009).
[31] A. Friedrich, B. Winkler, E. A. Juarez-Arellano and L. Bayarjargal, Materials, 4, 648
(2011).
[32] H.O. Pierson, Handbook of Refractory Carbides and Nitrides; Noyes Publication: Park
Ridge, UT, USA, (1996).
[33] A. F. Young, C. Sanloup, E. Gregoryanz, S. Scandolo, R. J. Hemley and H. K. Mao,
Phys. Rev. Lett., 96, 155501:1 (2006).
[34] K. Niwa, D. Dzivenko, K. Suzuki, R. Riedel, I. Troyan, M. I. Eremets and M.
Hasegawa, Inorg. Chem., 53, 697 (2014).
[35] K. Niwa, K. Suzuki, S. Muto, K. Tatsumi, K. Soda, T. Kikegawa and M. Hasegawa,
Chem. Eur. J., 20, 13885 (2014).
[36] E. Gregoryanz, C. Sanloup, M. Somayazulu, J. Badro, G. Fiquet, H. K. Mao and R. J.
Hemley, Nat. Mater., 3, 294 (2004).
[37] S. J. Sedlmaier, M. Eberspächer and W. Schnick, Z. Anorg. Allg. Chem., 637, 362
(2011).
[38] Q. Yang, W. Lengauer, T. Koch, M. Scheerer and I. Smid, J. Alloy. Compd., 309, L5
(2000).
[39] O. Shebanova, E. Soignard and P. F. McMillan, High Pressure Res., 26, 87 (2006).
[40] H. Chen, F. Peng, H. K. Mao, G. Shen, H. P. Liermann, Z. Li and J. Shu, J. Appl.
Phys., 107, 113503:1 (2010).
[41] J. Musil, Surf. Coat. Tech., 125, 322 (2000).
[42] V. S. Bhadram, D. Y. Kim and T. A. Strobel, Chem. Mater., 28, 1616 (2016).
Chapter 1: Introduction
32
[43] X. J. Chen, V. V. Struzhkin, Z. Wu, M. Somayazulu, J. Qian, S. Kung, A. N.
Christensen, Y. Zhao, R. E. Cohen, H. K. Mao and R. J. Hemley, Proc. Natl. Acad.
Sci., 102, 3198 (2005).
[44] D. A. Dzivenko, A. Zerr, E. Schweitzer, M. Goken, R. Boehler and R. Riedel, Appl.
Phys. Lett., 90, 191910:1 (2007).
[45] A. Zerr, N. Chigarev, R. Brenner, D. A. Dzivenko and V. Gusev, Phys. Status Solidi-r,
4, 353 (2010).
[46] D. A. Dzivenko, A. Zerr, R. Boehler and R. Riedel, Solid State Commun., 139, 255
(2006).
[47] M. Mattesini, R. Ahuja and B. Johansson, Phys. Rev. B, 68, 184108:1 (2003).
[48] F. Rivadulla, M. Banobre-Lopez, C. X. Quintela, A. Pineiro, V. Pardo, D. Baldomir,
M. A. Lopez-Quintela, J. Rivas, C. A. Ramos, H. Salva, J. S. Zhou and J. B.
Goodenough, Nat. Mater., 8, 947 (2009).
[49] K. E. Davies, B. K. Gan, D. R. McKenzie, M. M. M. Bilek, M. B. Taylor, D. G.
McCulloch and B. A. Latella, J. Phys.-Condens. Mat., 16, 7947 (2004).
[50] W. W. Lei, D. Liu, X. F. Li, J. Zhang, Q. Zhou, Q. L. Cui and G. T. Zou, J. Phys.
Condens. Mat., 19, 425233:1 (2007).
[51] E. Soignard, O. Shebanova and P. F. McMillan, Phys. Rev. B, 75, 014104:1 (2007).
[52] A. Friedrich, B. Winkler, L Bayarjargal, E. A. Juarez-Arellano, W. Morgenroth, J.
Biehler, F. Schroder, J. Yan and S. M. Clark, J. Alloy Compd., 502, 5 (2010).
[53] A. Zerr, G. Miehe, J. Li, D. A. Dzivenko, V. K. Bulatov, H. Hofer, N. B. Casanova,
M. Fialin, G. Brey, T. Watanabe and M. Yoshimura, Adv. Funct. Mater., 19, 2282
(2009).

Chapter 1: Introduction
33
[54] M. Urgen, O. L. Eryilmaz, A. F. Cakir, E. S. Kayali, B. Nilufer and Y. Isik, Surf.
Coat. Tech., 94–95, 501 (1997).
[55] E. Soignard, P.F. McMillan, T. D. Chaplin, S. M. Farag, C. L. Bull, M. Somayazulu
and K. Leinenweber, Phys. Rev. B, 68, 132101:1 (2003).
[56] A. Friedrich, B. Winkler, L. Bayarjargal, W. Morgenroth, E. A. Juarez-Arellano,
V.Milman, K. Refson, M. Kunz and K. Chen, Phys. Rev. Lett., 105, 085504:1 (2010).
[57] J. F. Adler and Q. Williams, J. Geophys. Res., 110, B01203:1 (2005).
[58] R. Niewa, D. Rau, A. Wosylus, K. Meier, M. Hanfland, M. Wessel, R. Dronskowski,
D. A. Dzivenko, R. Riedel and U. Schwarz, Chem. Mater., 21, 392 (2009).
[59] H. Xia, Q. Xia, and A. L. Ruoff, Phys. Rev. B 47, 12925 (1993).
[60] E. Gregoryanz, O. Degtyareva, M. Somayazulu, R. J. Hemley and H. K. Mao, Phys.
Rev. Lett. 94, 185502 (2005).
[61] C. L. Guillaume, E. Gregoryanz, O. Degtyareva, M. I. McMahon, S. Evans, M.
Hanfland, M. Guthrie, S. V. Sinogeikin and H. K. Mao, Nat. Phys. 7, 211(2011).
[62] R. Hrubiak, Y. Meng and G. Shen, Nat. Comm. 8, 14562 (2017).
[63] F. D. Stacey and R. D. Irvine, Aust. J. Phys. 30, 631 (1977).
[64] V.V. Kechin, Phys. Rev. B 65, 052102 (2001).
[65] H. K. Mao and R. J. Hemley, Rev. Mod. Phys. 66, 671 (1994).
[66] W. L. Mao, H. K. Mao, P. Eng, T. Trainor, M. Newville, C. C. Kao, D. L. Heinz, J.
Shu, Y. Meng and R. J. Hemley, Science 302,425 (2003).

Chapter 1: Introduction
34
[67] Q. Li, Y. Ma, A. R. Oganov, H.Wang, H.Wang, Y. Xu, T. Cui, H. K. Mao and G. Zou,
Phys. Rev. Lett. 102, 175506 (2009).
[68] Y. Lin, L. Zhang, H.-k. Mao, P. Chow, Y. Xiao, M. Baldini, J. Shu and W. L. Mao,
Phys. Rev. Lett. 107, 175504 (2011).
[69] H. Niu, X. Q. Chen, S. Wang, D. Li, W. L. Mao and Y. Li, Phys. Rev. Lett. 108,
135501 (2012).
[70] E. Sugimura, T. Iitaka, K. Hirose, K. Kawamura, N. Sata and Y. Ohishi, Phys. Rev. B
77, 214103 (2008).
[71] A. F. Goncharov, V. V. Struzhkin, H. K. Mao and R. J. Hemley, Phys. Rev. Lett. 83,
1998 (1999).
[72] K. Aoki, H. Yamawaki, M. Sakashita and H. Fujihisa, Phys. Rev. B 54, 15673 (1996).
[73] C. Ji, A. F. Goncharov, V. Shukla, N. K. Jena, D. Popov, B. Li, J. Wang, Y. Meng, V.
B. Prakapenka, J. S. Smith, R. Ahuja, W. Yang and H. K. Mao., Proc. Natl. Acad. Sci.
114,3596 (2017).
[74] M. Kim, M. Debessai and C. S. Yoo, Nat. Chem. 2, 784 (2010).
[75] A. Dewaele, N. Worth, C. J. Pickard, R. J. Needs, S. Pascarelli, O. Mathon, M.
Mezouar and T. Irifune, Nat. Chem. 8, 784 (2016).
[76] J. C. Crowhurst, A. F. Goncharov, B. Sadigh, C. L. Evans, P. G. Morrall, J. L.
Ferreira and A. J. Nelson, Science, 311, 1275 (2006).
[77] W. L. Mao, H. K. Mao, Y. Meng, P. Eng, M. Y. Hu, P. Chow, Y. Q. Cai, J. Shu and R.
J. Hemley, Science 314, 636 (2006).
[78] L.J. Parker, T. Atou and J.V. Badding, Science 273, 95 (1996).
[79] R. T. Sanderson, J. Chem. Edu. 65, 112 (1988).

Chapter 1: Introduction
35
[80] Q. Zhu, D. Y. Jung, A. R. Oganov, C. W. Glass, C. Gatti and A. O. Lyakhov, Nat.
Chem. 5, 61 (2013).
[81] M. S. Miao, Nat. Chem. 5, 846 (2013).
[82] Q. Zhu, A. R. Oganov and Q. Zeng, Sci. Rep. 5, 7875 (2015).
[83] G. Makov, J. Phys. Chem. 99, 9337 (1995).
[84] X. Dong, A. R. Oganov, G. Qian, X. F. Zhou, Q. Zhu and H. T. Wang,
arXiv:1503.00230 [cond-mat.mtrl-sci].
[85] J. W. E. Drewitt, C. Sanloup, A. Bytchkov, S. Brassamin and L. Hennet, Phys. Rev. B,
87, 224201 (2013).
[86] H. Spice, C. Sanloup, B. Cochain, C. de Grouchy and Y. Kono, Geochimica et
Cosmochimica Acta, 148, 219 (2015).
[87] P. Modak and A. K. Verma, Inorg. Chem. 56, 14643 (2017).
[88] G. Lucazeau, J. Raman Spectroscopy, 34 , 478 (2003).
[89] R. Jeanloz, P. M. Celliers, G. W. Collins, J. H. Eggert, K. K. M. Lee, R. S.
McWilliams, S. Brygoo and P. Loubeyre, Proc. Nat. Acad. Sci., 104, 9172 (2007).
[90] M. I. Eremets, High Pressure Experimental Methods, Oxford University Press UK
(1999).
[91] M. Masotta, C. Freda, T. A. Paul, G. M. Moore, M. Gaeta, P. Scarlato and V. R. Troll,
Chem. Geol. 312–313 74 (2012).
[92] http://enikobali.hupont.hu/6/high-pressure-and-temperature-experiments-pressure
[93] M. Akaogi and T. Yamazaki, Proc. Japan Acad., 67(B), 61 (1991).
[94] P.W. Bridgmann, Proc. Am. Acad. Arts. Sci., 74, 425 (1942).
[95] L. Zhao, M. Li, L. Wang, E. Qu and Z. Yi, Rev. Sci. Instrum. 89, 035106 (2018).

Chapter 1: Introduction
36
[96] C. Venkateswaran, K. Anbukumaran, N. Victor Jaya and S. Natarajan, Rev. Sci.
instrum. 68, 189 (1997).
[97] F. Balima, F. Bellin, D. Michau, O. Viraphong, A. Poulon-Quintin, U. C. Chung, A.
Dourfaye and A. Largeteau, Materials and Design 139 ,541 (2018).
[98] Y. Yang, M. Li and B. Wang, Diamond & Related Materials 58 , 180 (2015).
[99] L. G. Khvostantsev, Report of the Institute or High Pressure Physics of the USSR
Academy of Sciences (1969).
[100] L. G. Khvostantsev, V. N. Slesarev and V. V. Brazhkin, High Press. Res. 24, 371
(2004).
[101] L. G. Khvostantsev and V. A. Sidorov, Phys. Stat. Sol. (a), 82, 389 (1984).
[102] L. F. Vereshchagin, L. G. Khvostantsev and V. A. Sidorov, High Temp. High Press.,
9, 629 (1977).
[103] https://www.researchgate.net/publication/271021637_Modeling_the_effect_of_
resistivity_of_the_heating_element_on_temperature_distribution_in_the_ Bridgman -
type _ Toroidal_Anvil.
[104] G. Morard , M. Mezouar , N. Rey , R. Poloni , A. Merlen , S. Le Floch , P.
Toulemonde , S. Pascarelli , A. San-Miguel , C. Sanloup and G. Fiquet, High Press.
Res. 27, 223 (2007).
[105] Y. Kono, C. Park, C. Kenney-Benson, G. Shen and Y. Wang, Phys. Ear. Planet. Inter.
228 , 269 (2014).
[106] M. Burchard, C. Weikusat, U.A. Glasmacher, S. Klotz, R. Miletich, C. Trautmann and
R. Neumann, pp 345, GSI Scientific Report (2008).
[107] R. C. Liebermann, High Press. Res. 31, 493 (2011).

Chapter 1: Introduction
37
[108] A. Kubo and M. Akaogi, Phys. Earth Planet. Inter. 121,85 (2000).
[109] S. Zhai and E. Ito, Geosci. Front. 2, 101 (2011).
[110] https://d32ogoqmya1dw8.cloudfront.net/images/NAGTWorkshops/mineralogy/
mineral_ physics/crunched_multi_anvil_cell.jpg.
[111] N. Dubrovinskaia, L. Dubrovinsky, N. A. Solopova, A. Abakumov, S. Turner, M.
Hanfland, E. Bykova, M. Bykov, C. Prescher, V. B. Prakapenka, S. Petitgirard, I.
Chuvashova, B. Gasharova, Y. L. Mathis, P. Ershov, I. Snigireva and A. Snigirev, Sci.
Adv. 2, e160034 (2016).
[112] J. Xu, J. Yen, Y.Wang and E. Huang, High Press. Res. 15, 127 (1996).
[113] K. Furuno, A. Onodera and S. Kume, Jap. J. Appl. Phys. 25, L646 (1986).
[114] J. Xu and H. K. Mao, Science 290, 783 (2000).
[115] J. Xu, H. K. Mao, R. J. Hemley and E. Hines, J. Phys. Cond. Matt. 14, 11543 (2002).
[116] N. Dubrovinskaia and L. Dubrovinsky, Rev. Sci. Instrum. 74, 3433 (2003).
[117] C. Zha and W. Bassett, Rev. Sci. Instrum. 74, 1255 (2003).
[118] S. T. Weir, D. D. Jackson, S. Falabella, G. Samudrala and Y. K. Vohra, Rev. Sci.
Instrum. 80, 013905 (2009).
[119] H. P. Liermann, Z. Konopkova, W. Morgenroth, K. Glazyrin, J. Bednarcik, E. E.
McBride, S. Petitgirard, J. T. Delitz, M. Wendt, Y. Bican, A. Ehnes, I. Schwark, A.
Rothkirch, M. Tischer, J. Heuer, H. Schulte-Schrepping, T. Kracht and H. Franz, J.
Synchrotron Radiat. 22, 908 (2015).
[120] M. Mezouar, W. A. Crichton, S. Bauchau, F. Thurel, H. Witsch, F. Torrecillas, G.
Blattmann, P. Marion, Y. Dabin, J. Chavanne, O. Hignette, C. Morawe and C. Borel,
J. Synchrotron Radiat. 12, 659 (2005).

Chapter 1: Introduction
38
[121] J.F. Lin, M. Santoro, V. V. Struzhkin, H. K. Mao and R. J. Hemley, Rev. Sci. Instrum.,
75, 3302 (2004).
[122] A. F. Goncharov, J. C. Crowhurst, V. V. Struzhkin and R. J. Hemley, Phys. Rev. Lett.
101, 095502 (2008).
[123] J. S. Zhang, J. D. Bass and G. Zhu, Rev. Sci. Instrum. 86, 063905 (2015).
[124] A. Basu and R. Boehler, Conference, APS March Meeting (2017).
[125] G. Aquilanti, A. Trapananti, A. Karandikar, I. Kantor, C. Marini, O Mathon, S.
Pascarelli and R. Boehler, Proc. Nat. Acd. Sci., 112, 12042 (2015).
[126] J. F. Lin, V. V. Struzhkin, S. D. Jacobsen, G. Shen, V. B. Prakapenka, H. K. Mao and
R. J. Hemley, J. Synchrotron Rad. 12, 637 (2005).
[127] J. Zhao, W. Sturhahn, J. F. Lin, G. Shen, E. E. Alp and H. K. Mao, High Press. Res.
24, 447 (2004).
[128] G. Aprilis, C. Strohm, I. Kupenko, S. Linhardt, A. Laskin, D. M. Vasiukov, V.
Cerantola, E. G. Koemets, C. McCammon, A. Kurnosov, A. I. Chumakov, R. Rüffer,
N. Dubrovinskaia and L. Dubrovinsky, Rev. Sci. Instrum. 88, 084501 (2017).
[129] S. Watson, W.N. MacPherson, J.S. Barton, J.D.C. Jones, A. Tyas, A.V. Pichugin,
A. Hindle, W. Parkes, C. Dunare and T..Stevenson, J. Phys.: Conf. Ser. 15, 226
(2005).
[130] K. Shigemori, Y. Hironaka, H. Nagatomo, S. Fujioka, A. Sunahara, T. Kadono, H.
Azechi and K. Shimizu, Appl. Phys. Lett. 102, 183501 (2013).
[131] A. Shyam and R. Shukla, J. Phys.: Conf. Ser. 377, 012112 (2012).

Chapter 1: Introduction
39
[132] S. Brygoo, M. Millot, P. Loubeyre, A. E. Lazicki, S. Hamel, T. Qi, P. M. Celliers, F.
Coppari, J. H. Eggert, D. E. Fratanduono, D. G. Hicks, J. R. Rygg, R. F. Smith, D. C.
Swift, G. W. Collins and R. Jeanloz, J. Appl. Phys. 118, 195901 (2015).
Chapter 2: LHDAC Facility for HPHT Research
40
Chapter 2
Laser Heated Diamond Anvil Cell (LHDAC) Facility
for HPHT Research
Diamond anvil cell based laser heating technique has emerged as a powerful and versatile
experimental tool, in recent times, for achieving ultrahigh pressures (P > 100 GPa) and
temperatures (T ~ 6000K) thus enabling the study of phase behaviour of materials at
thermodynamic conditions comparable to the Earth’s deep interior. Currently, single sided as
well as double sided laser heating techniques are widely used in synchrotron beam lines and
laboratories, making it a vital technique to bridge the gap between the pressure achieved by
shock experiments and static high pressures achieved by other large volume devices like toroidal
and multi-anvils described in Chapter 1 [1].
This chapter discusses the instrumentation details of the state of the art LHDAC facility
developed at the High Pressure and Synchrotron Radiation Physics Division (HP&SRPD),
Bhabha Atomic Research Centre (BARC) for accurate determination of thermodynamic
properties like pressure dependent melting and synthesis of novel materials at HPHT. The first
part of the chapter describes the design aspect and mode of operation of the LHDAC facility.
The results of HPHT synthesis of gallium nitride (GaN) [2] and molybdenum nitride (γ-Mo2N)
and high pressure melting curve of KBr are also presented in the chapter with an aim to highlight
the capabilities of the facility.
Chapter 2: LHDAC Facility for HPHT Research
41
2.1 DAC Based Laser Heating
The principal requirement for laser heating is a stable high power laser of appropriate
wavelength viz., near infrared (NIR) or mid infrared (MIR) laser that couples with the sample
directly [3, 4]. The transparency of diamond in the infrared (IR) region allows the use of
continuous wave (CW) NIR lasers such as neodymium doped yttrium aluminium garnet
(Nd3+:YAG), neodymium doped yttrium lithium fluoride (Nd3+:YLF), ytterbium (Yb) doped fibre
laser or MIR CO2 laser, the choice being driven by the sample absorbance [5-7]. The NIR laser
is usually used to heat metallic materials. In this case, the thermal energy results from the
collision of the excited electrons, created by photon-electron interaction, with the lattice
phonons. The MIR CO2 laser, on the other hand, is more suitable to heat minerals and
transparent oxides, exploiting the absorption of IR radiation by the lattice phonons.
Alternatively, it is also possible to heat the optically transparent minerals and oxides with the
NIR laser using certain laser absorber, like W, Pt, Ir etc., which absorb the NIR laser radiation
and transfer the thermal energy to the sample [8, 9]. The different emission wavelength of the
laser also necessitates the use of different optics. Thus BK7 glass is used with the NIR laser
source whereas ZnSe or CaF2 optics are necessary when MIR CO2 laser is used.
2.2 Experimental Details
2.2.1 Design of single sided laser heated diamond anvil cell facility
The major components of the LHDAC facility are a continuous wave (CW) air cooled
ytterbium (Yb) doped fibre laser ( = 1.07 µm, 100 W, TEM00, SP-100C-A-S6-A-A), an
indigenously developed Mao-Bell type DAC mounted on a high precision motorized XYZ stage

Chapter 2: LHDAC Facility for HPHT Research
42
(Kohzu YA 10A-R1 and ZA07A-VIF) and a 163 mm spectrograph with a 300 line grating
(Shamrock SR-163) coupled with a Peltier cooled CCD (Andor-DV 420-OE). The photograph of
the single sided LHDAC facility is shown in Fig. 2.1.
Fig. 2.1: Photograph of the single sided LHDAC facility.
The Yb doped fibre laser system serves as an excellent alternative to the Nd:YAG laser
with a remarkable combination of high power, ideal beam quality, high stability, fibre delivery,

Chapter 2: LHDAC Facility for HPHT Research
43
compactness, selectivity of operating wavelength and a reliability that is superior than the
conventional solid state or gas laser. These attributes, coupled with its low weight, make it most
suitable for its ease of setting up and portability of the system [10]. The laser power control is
achieved by a simple dc power supply and is computer controlled. Its high power and a near
perfect Gaussian beam profile is well suited to heat the sample in a DAC. The distribution of the
IR laser intensity has a Gaussian shape with a beam diameter of ~ 5 mm which increases to ~10
mm when a 2X beam expander is used. The optical arrangement of the LHDAC facility is shown
schematically in Fig. 2.2. The laser beam is focussed on the sample with the help of beam
steerer (BS1) and a 75 mm focal length plano-convex lens (L1). An NIR infinity corrected long
working distance (30 mm) apochromatic objective (OBJ) with 10X magnification facilitates the
observation of the sample in the DAC by illumination of white light. It also enables collection of
thermal radiation from the hotspot, which is then fed into the spectrograph (SPG), thus giving
access to multiwavelength spectroradiometry. The infinity corrected apochromatic objective also
minimizes the spherical and chromatic aberration upon insertion of auxiliary devices into the
data collection optical path. The aperture (A), which is an iris, reduces the beam diameter and
hence minimizes the aberration introduced by OBJ and the achromatic lens (L2) in the collection
path. The combination of OBJ and L2 is used to form an image of the sample at the spectrograph
input with 10X optical magnification. The standard rectangular spectrograph input slot is
replaced with a 30 µm diameter mirror polished pinhole (PH) to ensure collection of thermal
radiation from only a 3 µm circular area within the hotspot.

Chapter 2: LHDAC Facility for HPHT Research
44
Fig. 2.2: Simplified schematic layout of the LHDAC facility. OBJ: infinity corrected long
working distance apochromatic objective; L1, L3, L4: plano-convex lenses; L2:
achromatic lens; SPG: spectrograph (Shamrock SR-163); PH: 30µm pinhole; BS1, BS2,
BS3: beam steerers; PS1, PS2: polarizing beam splitters; WP: λ/2 wave plate; MM1,
MM2: movable mirrors; B1, B2, B3: 50:50 beam splitters; CB: cubic beam splitter; F1,
F3: low pass filters; F2, F4: neutral density filters; A: aperture (iris); LS: fibre optic
illuminator; DAC: diamond anvil cell. CCD1: Peltier cooled CCD (Andor-DV 420-OE)
for spectroradiometry; CCD2: visual CCD for sample imaging.

Chapter 2: LHDAC Facility for HPHT Research
45
For accurate temperature determination, it is very crucial to centre the hotspot around the
spectrograph pinhole (PH) as shown in Fig. 2.3. This is achieved by incorporating an imaging
system consisting of a high resolution visual CCD (CCD2). In addition, CCD2 also facilitates a
real-time imaging of the sample inside the DAC. To achieve perfect alignment of the hotspot, the
non-polarising cubic beam splitter (CB) is aligned so as to reflect half of the backscattered
radiation from the PH, which is then focused by a 20 mm focal length planoconvex lens (L3)
onto CCD2. The image of the sample at the spectrograph input (PH) and the DAC sample
chamber is observed using CCD2 by sliding the mirror (MM1) into and out of the optical path
respectively.
Fig. 2.3: Photograph of the centrally aligned hotspot around the spectrograph pinhole
(PH) during laser heating.
It may be noted that a critical aspect of the LHDAC facility is to ensure that the focus of
thermal radiation collection optics coincides with that of the heating NIR laser. Hence a 1 mW

Chapter 2: LHDAC Facility for HPHT Research
46
green He-Ne laser is used as an aligning laser. Optical alignment is achieved by coinciding the
optical path of NIR and the aligning laser using beamsplitter (B3) and movable mirror MM2.
The optical path of the NIR laser also includes two crossed polarizer beam splitter cube
combination (PS1 and PS2) with a /2 waveplate (WP) between them. The laser power incident
on the sample could be precisely controlled, keeping the beam profile unchanged, by rotating
WP, which is mounted on a motorized rotation stage, thereby enabling precise and fine control of
the incident IR laser power. This is imperative for accurate determination of melting
temperature. A 300 mW green diode pumped solid state (DPSS) laser (Cobolt Samba, = 532
nm) has also been incorporated in the set up. This laser serves as the probe laser for speckle
method, the details of which are described in the Section {2.2.5.2}. The precise positioning of
NIR laser on the sample inside the DAC is another critical requirement in laser heating
experiments. There is a danger of damaging the diamond anvils in case of incorrect positioning.
Hence a high precision motorized XYZ stage is incorporated in the set up to achieve fine and
reproducible positional control of the sample with respect to the focussed laser spot.
Furthermore, in order to avoid sample defocusing during laser heating, it is essential to maintain
the DAC body at near ambient conditions. This is achieved with the help of an in-house
fabricated water-cooling jacket for the DAC as shown in Fig. 2.4.
The salient feature of the LHDAC facility is an angular geometry with an off-axis
incidence of the NIR laser beam on the sample. The advantage of off-axis angular geometry over
the conventional on-axis heating geometry is that the optical components for laser focusing and
for collection of incandescent light are aligned and optimized for their different wavelengths
separately.

Chapter 2: LHDAC Facility for HPHT Research
47
Fig. 2.4: Photograph of the water cooling jacket for the Mao Bell type DAC.
This facilitates an independent control over the heating laser spot size, which in turn defines the
sample hot spot size during heating. Thus with a larger hotspot, the radial temperature gradient at
the sample, as described in Section {2.2.4}, is reduced resulting in a nearly flat temperature
profile within the central 3 µm probed sample region. In addition, the off-axis geometry prevents
obstruction of the diffracted beam by any optical component in LHDAC based in situ
spectroscopic measurements.

Chapter 2: LHDAC Facility for HPHT Research
48
2.2.2 Sample loading in diamond anvil cell
The sample loading forms a crucial aspect of the laser heating experiments. The studies
in this thesis have been carried out using a Mao-Bell type of DAC, with diamonds of ~ 400 µm
culet size. Stainless steel, tungsten, or rhenium gasket with ~ 200 µm diameter hole served as the
sample chamber. Prior to the experiment, the gasket with a starting thickness of ~ 250 µm was
preindented between the diamond anvils to a thickness of ~ 50 µm. For all high pressure
experiments, the sample along with a few ruby balls and a pressure transmitting medium (PTM)
was loaded inside the sample chamber. The schematic arrangement of the sample chamber and
its image are shown in Fig. 2.5 (a and b) respectively.
(a) (b)
Fig. 2.5: (a) Schematic diagram and (b) image of a typical sample assembly used for
LHDAC experiment.

Chapter 2: LHDAC Facility for HPHT Research
49
The role of PTM, which is usually a material of low shear strength, is to minimize the deviatoric
stresses in the sample and to create a hydrostatic pressure from a uniaxial compression. In
addition, the PTM also acts as a chemical barrier and prevents any reaction of the sample with
the gasket or diamond culets. Furthermore, since diamond, due to its high thermal conductivity,
acts as an extremely efficient heat sink, the PTM also serves as a thermal insulator in laser
heating experiments, preventing the conduction of heat from the sample to the diamond. Soft
solids with low thermal conductivity like CsI, KBr, NaCl are the commonly used PTM.
Alternatively, hard solids such as MgO and Al2O3 are also used owing to their chemical
inertness, high melting point and low thermal conductivity even though they provide a
nonhydrostatic media. In certain laser heating experiments, solid PTM are not suitable due to
their chemical reactivity at HPHT. In such cases, noble gases like Ar, He and Ne are the suitable
PTM. The benefits of noble gas PTM in laser heating experiments include its chemical inertness,
near-hydrostatic pressure conditions around the heated sample due to its low melting temperature
and good thermal insulation from the diamonds due to its low thermal conductivity. In our laser
heating experiments we have used either NaCl, KBr, Al2O3 as solid PTM and thermal insulator.
Alternatively, we have loaded liquefied argon inside the sample chamber by immersion
technique, using a cryogenic apparatus, as shown in Fig. 2.6. For this, the piston-cylinder of the
DAC, with sample loaded, is placed inside the cryogenic apparatus. The entire cryogenic
apparatus is then lowered inside a thermocol box into which liquid nitrogen is poured. Argon gas
is then let inside the cryogenic apparatus through the copper tubing welded around it. The
liquefaction of argon gas (boiling point 87.2 K) is achieved by cooling, using liquid nitrogen
(boiling point 77.2 K). The piston cylinder is then clamped and then transferred to the lever arm
for carrying out high pressure measurements.
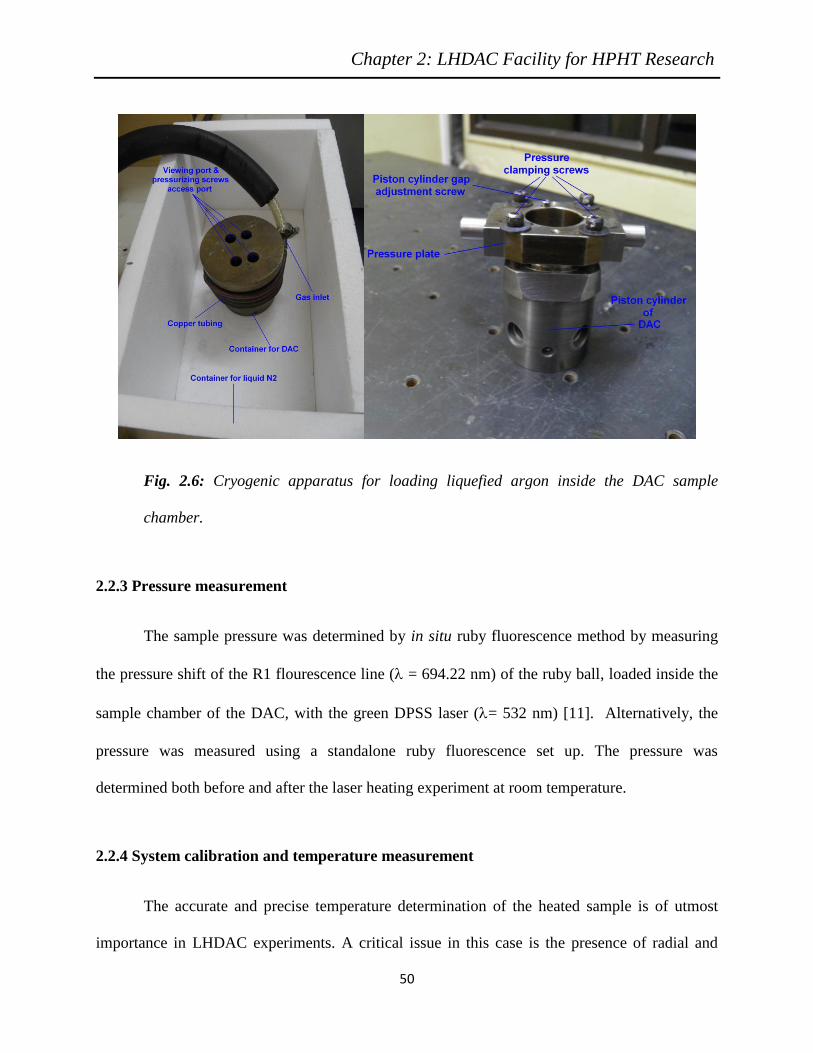
Chapter 2: LHDAC Facility for HPHT Research
50
Fig. 2.6: Cryogenic apparatus for loading liquefied argon inside the DAC sample
chamber.
2.2.3 Pressure measurement
The sample pressure was determined by in situ ruby fluorescence method by measuring
the pressure shift of the R1 flourescence line ( = 694.22 nm) of the ruby ball, loaded inside the
sample chamber of the DAC, with the green DPSS laser (= 532 nm) [11]. Alternatively, the
pressure was measured using a standalone ruby fluorescence set up. The pressure was
determined both before and after the laser heating experiment at room temperature.
2.2.4 System calibration and temperature measurement
The accurate and precise temperature determination of the heated sample is of utmost
importance in LHDAC experiments. A critical issue in this case is the presence of radial and

Chapter 2: LHDAC Facility for HPHT Research
51
axial temperature gradients [12]. The radial temperature gradients in LHDAC arise from variation
in laser intensity in the plane of the diamond culet and gasket hole, perpendicular to the
incoming laser beam whereas the axial temperature gradients arise from the flow of heat away
from the hotspot due to the high thermal conductivity of diamonds. While the axial temperature
gradients can be minimized by double sided heating of the sample, the radial temperature
gradients can be minimized by increasing the size of incident IR laser spot formed on the sample
[13]. A well known technique to achieve this is by using a pi shaper, which produces a flat top
temperature profile at the sample position [14]. Alternatively, the angular incidence geometry,
adapted in our set up, facilitates this by providing an independent control over the hot spot size.
In particular, for a typical 40 µm diameter hotspot of the incident IR laser, the central 3-4 µm
heated region has a nearly flat temperature profile. Hence in the present setup, with the help of a
pinhole (PH), we allow incandescent light only from a 3 µm central hotspot, into the
spectrograph for temperature measurement.
The sample temperature is measured by spectroradiometric technique wherein
incandescent light emitted by the heated sample is collected by the spectrograph (SPG) in a 400
nm spectral width (500 nm to 900 nm). The emitted thermal radiation is governed by the
Planck’s blackbody radiation law as given in Eq. 2.1 [15, 16].
( ) ( )
−
=
1exp
21,,
2
5
KT
hc
hcTTIv
(2.1)
where I(,T), (,T), h, k and c are the observed spectral intensity, emissivity, Planck’s
constant, Boltzmann constant and speed of light respectively. Emissivity described in Eq. 2.1 is a

Chapter 2: LHDAC Facility for HPHT Research
52
function of pressure, temperature and wavelength. It is the ratio of radiation emitted from a real
body to the radiation from a black body at the same temperature in thermal equilibrium. Thus it
has a value of 1 for an ideal black body and between 0 and 1 for a real body. However the
knowledge of wavelength dependent emissivity of materials at HPHT conditions is not known.
To overcome this problem one has to parameterize emissivity along with temperature. The
parameterization of emissivity is made feasible by assuming a gray body approximation i.e.,
invariance of emissivity over measured wavelength range [17]. Furthermore, in a LHDAC
facility, the optical elements and their alignment have a crucial effect on the temperature
measurement and hence the incandescent radiation collected from the heated sample by the
LHDAC optics is given by
( ) ( )
−
=
1exp
21,)(,
2
5
KT
hc
hcTRTI S
(2.2)
where R(λ) is the instrument spectral response function of the optical set up used for collecting
thermal radiation. The instrument spectral response function R(λ) of the optical set up is
prerequisite for carrying out temperature measurement. In order to determine R(λ), the
incandescent spectrum emitted by a standard calibration lamp (Istd) at a known temperature (Tstd)
is measured with the same optics as used in the actual experiment. The spectral intensity (Istd) is
mathematically divided by the spectral intensity calculated from Planck’s equation at Tstd in the
same wavelength range. The resulting quotient is the instrument spectral response function
(R(λ)). The raw spectrum collected in an experimental run at an unknown temperature (T) is then
divided by R(λ) to yield a corrected spectrum, which is subsequently fitted with the Planck
function to extract the temperature. In the present study, the temperature calibration was carried

Chapter 2: LHDAC Facility for HPHT Research
53
out using a quartz tungsten halogen (QTH) calibration lamp (Sciencetech, 24W, 250 V). Figure
2.7(a and b) shows the instrument response function R(λ) and the typical emission spectra of the
LHDAC set up respectively.
(a) (b)
(c)
Fig. 2.7: (a) instrument spectral response (b) Typical observed experimental
incandescent spectrum and (c) comparison of QTH calibration lamp spectrum obsereved
in our setup with spectrum provided by the supplier.

Chapter 2: LHDAC Facility for HPHT Research
54
2.2.5. Melting study
2.2.5.1 Phenomenon of melting
The study of melting curve of materials under HPHT is of fundamental importance for
basic science as well as for geophysical reasons. Thermodynamically, a material is said to melt
when the Gibbs free energy of solid and liquid phase becomes equal for given pressure. The
temperature at which the Gibbs free energies become equal is called its melting temperature at
that pressure. At the melting temperature, the solid and liquid phase coexists in equilibrium. The
fraction of solid and liquid phase depends on the amount of heat energy supplied, called latent
heat.
Gsolid (P,Tm) = Gliquid (P,Tm) (2.3)
where Gsolid and Gliquid are Gibbs free energy of solid and liquid phase respectively. P is pressure
and Tm is melting temperature at pressure P. Gibbs free energy is defined as
G = U + PV – TS (2.4)
where U is internal energy, P is pressure, V is volume, T is temperature and S is entropy.
The Gibbs free energy of the material changes with pressure and results in variation of the
melting temperature of material with pressure.
Several melt criteria have been proposed in order to measure the melting temperature.
Instability caused by vibrational motion of two simple rigid sublattices against each other [18],
diminishing of the second derivative of lattice energy with respect to lattice spacing [19],

Chapter 2: LHDAC Facility for HPHT Research
55
minimization of pressure with volume change [20], structural order-disorder transition [21] and
failure of elastic resistance against a shearing stress [22] are the important melt criteria based on
atomic properties. Although most of these criteria are used for determination of melting
temperature in theoretical methods, they cannot be directly implemented for experimental
determination of melting temperature unless they are manifested in the form of observable
properties of solids. Hence several other criteria have been proposed for detection of onset of
melting in experimental measurements.
2.2.5.2 Detection of onset of melting in high pressure LHDAC experiments
There is a lack of agreement among the various HPHT studies on the measured melting
temperature. This reflects the experimental difficulty in precise identification of onset of melting
and its accurate measurement. The various criteria for detection of melting in high pressure
LHDAC experiments are listed below:
i. Visual observation of the heated sample. This method however suffers from large errors
[23].
ii. Slope change in the plot of laser power as a function of temperature resulting from the
different optical properties of the new phase formed upon melting [24].
iii. Distinct change in reflectivity detected by a sharp change in the intensity of the reflected
signal measured by a photo diode [24].
iv. Flash heating method in which distinct areas of the pressurized sample are subjected to
short single laser pulses of a few milliseconds duration with ascending/descending input
laser power. This results in a gradual change in temperature of these areas [25]. Scanning

Chapter 2: LHDAC Facility for HPHT Research
56
electron microscope (SEM) measurement is carried out on the post heated retrieved
sample wherein onset of melting is indicated by the first observation of bead formation
due to recrystallization. The corresponding incandescent spectrum is then used to
determine the melting temperature.
v. In situ x-ray diffraction to look out for a signature of diffuse scattering from the liquid
phase [13,14].
vi. Sharp jump in the resistance of the sample upon melting [26].
vii. Laser speckle method wherein a defocused visible laser incident on the heated sample
surface creates a speckle interference pattern, as shown in Fig. 2.8, due to its surface
roughness [27, 28]. The onset of a continuous motion of this speckle pattern is inferred as
the melting point. The laser-speckle method enables one to distinguish between a solid-
liquid transition in which a continuous speckle motion is observed and a solid-solid
transition that shows up as an abrupt, discontinuous change in laser speckle pattern [29].
viii. Temperature plateau method wherein the incident IR laser power is increased/decreased
in very fine steps leading to a corresponding change in the sample temperature. The plot
of sample temperature vs incident laser power shows a plateau that corresponds to a small
range of incident laser power for which sample temperature remains stable. This plateau
is attributed to the latent heat associated with solid to liquid phase transition.
In the present thesis work, flash heating, laser speckle and temperature plateau methods
have been adapted for determination of melting temperature. All the three methods have their
own advantages and limitations. It may be noted that the flash heating method, which is
performed in the millisecond time scale prevents any chemical reactions.

Chapter 2: LHDAC Facility for HPHT Research
57
Fig. 2.8: In situ photograph of laser speckle pattern form on solid sample inside DAC.
In addition, SEM analysis of the post heated sample distinguishes between pre-melting
and bulk melting of the sample unambiguously thus bracketing the melting temperatures within
±100 K. However the limitation of this technique is the necessity of multiple flash heating runs
at each pressure, each requiring fresh identical sample and the time consuming ex-situ sample
analysis techniques. Furthermore, it is not suitable for substances such as solid forms of gases
and liquids, which are irretrievable at ambient conditions, for SEM analysis. The speckle
method, on the other hand, attributes onset of melting to the motion of laser speckle due to
changes in surface texture of the sample during melting. However, surface modification during
pre-melting could also result in changes in speckle pattern. Hence this method can result in
underestimation of the melting temperature in some cases. The advantage of this method

Chapter 2: LHDAC Facility for HPHT Research
58
however is its suitability for all materials and the relative ease of measurement, since a single
sample loading is adequate to carry out melting temperature measurements at various pressures.
Although the temperature plateau method does not distinguish between solid-solid and solid-
liquid transition, it is useful in resolving the underestimation of the melting temperature due to
pre-melting. Furthermore, the simultaneous implementation of laser speckle and temperature
plateau method in determination of onset of melting has also been successfully adapted in the
present LHDAC facility.
The melting temperatures at ambient pressure of known elements like iron, tungsten,
tantalum etc., were determined in order to standardize the experimental set up. Figure 2.9 (a and
b) shows the SEM images of post heated iron sample by flash heating method. It may be noted
that the observed ambient melting temperature of 1747(75) K is in reasonable agreement with the
reported melting temperature of 1811 K for iron [30]. Melting temperature of gadolinium metal
(Gd) at ambient pressure using temperature plateau method has been determined as 1536 K as
shown in Fig. 2.10 which is in good agreement with reported melting temperature 1585 K [31].
Fig. 2.9: SEM image of post laser heated iron sample using flash heating method
depicting (a) emergence of textural changes (b) bead formation upon recrystallization.

Chapter 2: LHDAC Facility for HPHT Research
59
Fig. 2.10: Melting temperature determination of gadolinium (Gd) using temperature
plateau method.
2.3. Results and Discussion
The laser heating facility has been employed for material synthesis and melting
experiments under HPHT. The performance evaluation of this facility was carried out with
several benchmarking melting experiments on standard samples such as Fe, Pt, W etc. A few
recent material synthesis and melting studies carried out on materials at high pressures are
discussed in the next subsections.

Chapter 2: LHDAC Facility for HPHT Research
60
2.3.1 HPHT synthesis of metal nitride
Transition metal nitrides have received considerable attention in recent years due to their
remarkable physical properties, such as high melting point, low compressibility and high
hardness as compared to pure metal [32, 33]. Hence they are promising candidates in the search
for superhard materials. Among them, GaN with direct band gap of 3.4 eV is extensively used
for light emitting diode (LED), optoelectronic application, laser diode, high power and low
frequency device applications etc. GaN has been reported to crystallize in the wurtzite structure.
Gallium metal does not react with nitrogen at ambient conditions. Hence reaction of gallium
metal or gallium oxide (Ga2O3) with ammonia is commonly used for synthesis of GaN.
Similarly, prediction of superconductivity in molybdenum nitride has led to an extensive study of
its synthesis [34]. Molybdenum nitride has been reported to crystallize as δ-MoN in hexagonal
structure (SG: P63/mmc) and γ-Mo2N in ordered NaCl structure (SG: Fm-3m) [35]. Both these
compounds possess high bulk modulus and show superconductivity at low temperatures. These
results motivated us to carry out HPHT synthesis of GaN and γ-Mo2N by direct chemical
reaction between elemental gallium and molybdenum with molecular nitrogen at HPHT.
2.3.1.1 HPHT Synthesis of GaN
Mao-Bell type DAC in conjunction with LHDAC facility was employed for synthesis of
GaN. Gallium metal foil of thickness ~10 µm and diameter ~80 µm, along with a few ruby balls
(~10 µm), was loaded into a 125 µm diameter hole of a hardened stainless steel gasket
preindented to a thickness of 50 µm. Liquid nitrogen was loaded in the DAC by cryogenic
immersion method. It acted as the PTM as well as reactant for the nitride synthesis. The DAC
was then pressurized to 9 GPa. Pressure measurement was carried out by ruby fluorescence

Chapter 2: LHDAC Facility for HPHT Research
61
method. On focusing the NIR laser on the gallium foil, bright thermal radiation, emitted by the
heated sample, was observed on the visual CCD (CCD2) indicating good coupling of the sample
with the laser. The sample was laser heated at 35 W input laser power for 90 minutes. A water-
cooling jacket arrangement for the piston cylinder of the DAC prevented the DAC body from
heating up. The sample temperature was recorded in time interval of 10 minutes by
spectroradiometry. As is evident from Fig. 2.11 the sample temperature decreased with time up
to 60 minutes from its initial value of 1925 K and thereafter became constant.
Fig. 2.11: Sample temperature as a function of time.
This indicates a change in the IR laser coupling with the sample and could be an indirect
indication of completion of chemical reaction of Ga with N2. This is also evident from in situ
photographs of incandescent light emitted by the sample at time t=0 and t=30 minutes as shown
in Fig. 2.12 (a and b) respectively.
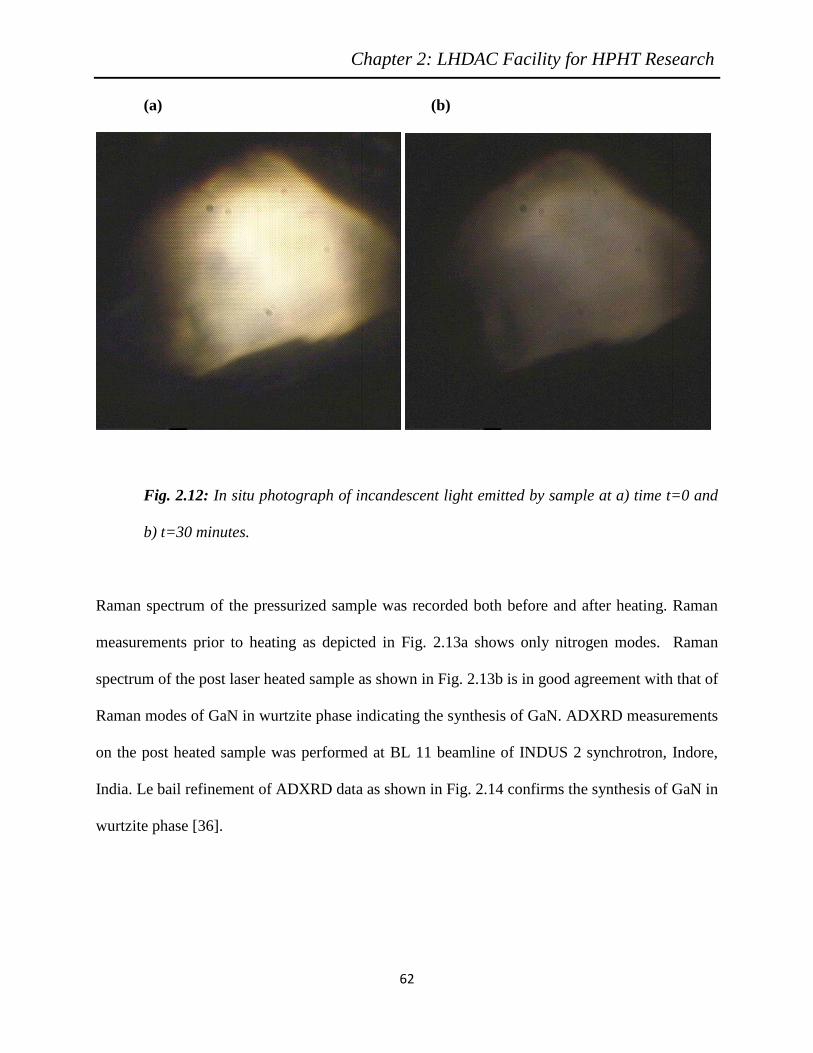
Chapter 2: LHDAC Facility for HPHT Research
62
(a) (b)
Fig. 2.12: In situ photograph of incandescent light emitted by sample at a) time t=0 and
b) t=30 minutes.
Raman spectrum of the pressurized sample was recorded both before and after heating. Raman
measurements prior to heating as depicted in Fig. 2.13a shows only nitrogen modes. Raman
spectrum of the post laser heated sample as shown in Fig. 2.13b is in good agreement with that of
Raman modes of GaN in wurtzite phase indicating the synthesis of GaN. ADXRD measurements
on the post heated sample was performed at BL 11 beamline of INDUS 2 synchrotron, Indore,
India. Le bail refinement of ADXRD data as shown in Fig. 2.14 confirms the synthesis of GaN in
wurtzite phase [36].

Chapter 2: LHDAC Facility for HPHT Research
63
(a)
(b)
Fig. 2.13: a) Raman spectra of (a) Ga +N2 system before laser heating at 9 GPa at
ambient temperature shows the Raman active nitrogen modes and (b) Temperature
quenched heated sample after laser heating at 9 GPa and 1925 K.

Chapter 2: LHDAC Facility for HPHT Research
64
Fig. 2.14: Le Bail fit ADXRD pattern of the retrieved sample after laser heating.
2.3.1.2 HPHT Synthesis of γ-Mo2N
Mao-Bell type DAC in conjunction with LHDAC facility was employed for synthesis of
γ-Mo2N. A molybdenum foil of thickness ~10 µm and diameter ~100 µm, along with a few ruby
balls (~10 µm), was loaded into a 150 µm diameter hole of a hardened stainless steel gasket
preindented to a thickness of 60 µm. Liquid nitrogen was loaded in the DAC by cryogenic
immersion method. It acted as the PTM as well as reactant for the nitride synthesis. The DAC
was pressurized to 7 GPa. Pressure measurement was carried out using ruby fluorescence
method. On focusing the NIR laser on the molybdenum foil, bright thermal radiation, emitted by
the heated sample, was observed on the visual CCD (CCD2) indicating good coupling of the

Chapter 2: LHDAC Facility for HPHT Research
65
sample with the laser. The sample was laser heated at 30 W input laser power for 600 sec. A
water-cooling jacket arrangement for the piston cylinder of the DAC prevented the DAC body
from heating up. The sample temperature was determined to be 2000 K by spectroradiometry.
Raman spectrum of the pressurized sample was recorded both before and after heating. Raman
measurements prior to heating as depicted in Fig. 2.15a shows only nitrogen modes. Raman
spectrum of the post laser heated sample as shown in Fig. 2.15b is in good agreement with that of
Bull et al [37] indicating the synthesis of γ-Mo2N. Although ADXRD measurements could not
be carried out on the post heated sample, the synthesis of γ-Mo2N is clearly inferred from the
Raman data.
(a)

Chapter 2: LHDAC Facility for HPHT Research
66
(b)
Fig. 2.15: Raman spectra of (a) Mo +N2 system before laser heating at 7 GPa at ambient
temperature. Inset shows the Raman active nitrogen modes and (b) recovered heated
sample after laser heating at 7 GPa and 2000 K.
2.3.2 Melting curve of KBr up to 24 GPa
The determination of melting curve of material under compression is technically difficult
and challenging both for experimentalists and theorists. There have been significant
discrepancies among the various reported studies on the melting curves of important materials
[38]. Furthermore, the high pressure melting behaviours of compounds are relatively unexplored.
Hence knowledge of the atomic bond dependent melting behaviour of solids can provide vital
inputs for future theoretical models.

Chapter 2: LHDAC Facility for HPHT Research
67
In the present study we have carried out high pressure melting experiments on the alkali
halide “KBr”. The high pressure behaviour of KBr is fairly simple with only two known phases
viz., B1 phase (SG: Fm-3m) in the pressure range of ambient to 2.3 GPa and a B2 phase (SG:
Pm-3m) at higher pressures [39]. The high pressure melting behaviour of KBr upto 4.0 GPa has
been reported using piston cylinder apparatus and Pt/Pt10%Rh thermocouple for temperature
measurements [40]. Boehler et al have reported high pressure melting study of KBr using
LHDAC up to 35 GPa wherein the onset of melting was detected by an abrupt change in the IR
laser absorption by the sample [41]. However the limitation of this technique is that it does not
distinguish between solid-solid and solid-liquid transition, as the sample absorption may also
change upon solid-solid transition. Hence in the present study, laser speckle method, which
distinguishes between solid-solid and solid-liquid transition, has been employed to investigate
the high pressure melting behaviour of KBr [29].
High pressure LHDAC based melting experiments on KBr was carried out using a Mao-
Bell type DAC with a 400 µm culet. A tungsten gasket preindented to 50 µm with a 150 µm
central hole formed the sample chamber and KBr itself served as the PTM as well as the buffer
medium for thermal insulation. A tungsten (W) foil (~ 80 µm diameter, ~ 10 µm thickness)
loaded along with the sample acted as the NIR laser coupler. Pressure measurement was carried
out by ruby fluorescence method at ambient temperature. Thermal emission spectra was
collected in fine steps of input laser power using the crossed polarizers (PBS1 and PBS2) and /2
waveplate (WP) assembly together with a video recording of the speckle pattern to determine the
onset of melting. Temperature measurement was carried out by spectroradiometry. For accurate
results, temperature was measured at the onset of laser speckle motion during melting while
increasing the laser power and at the disappearance of laser speckle motion during freezing while

Chapter 2: LHDAC Facility for HPHT Research
68
decreasing the laser power. The reported melting temperature is the mean value of temperatures
measured for multiple melting and freezing cycles at a given pressure. Figure 2.16 shows a
typical Planck fit to the collected incandescent spectrum. The variation of melting temperature
with pressure as shown in Fig. 2.17 is in good agreement with the previously reported result [41].
The present work thus provides the melting curve of KBr using a complimentary melting
temperature detection method and hence the results provide a standardized melting curve of KBr
that can be used for validation of theoretical models for ionic compounds.
Fig. 2.16: Planck fit to a typical incandescent spectrum of laser heated KBr corrected for
instrument spectral response. The fitted gray body curve (solid red line) yields a
temperature of 1844 K. The red dotted curves indicate the confidence interval yielding a
temperature uncertainty of 20 K.

Chapter 2: LHDAC Facility for HPHT Research
69
Fig. 2.17: Experimental melting curve of KBr upto 24 GPa. The available literature data
are shown in the figure for comparison.
2.4. Conclusions
A state of the art laser heated diamond anvil cell facility has been commissioned at High
Pressure & Synchrotron Radiation Physics Division, Bhabha Atomic Research Centre and
optimized for carrying out material synthesis and melting studies on materials at high pressures.

Chapter 2: LHDAC Facility for HPHT Research
70
References
[1] Y. Meng, G. Shen and H. K. Mao, J. Phys.: Condens. Matter 18, S1097 (2006).
[2] N. N. Patel, S. Meenakshi and S. M. Sharma, AIP Conf. Proc. 1591, 664 (2014).
[3] R. Boehler, Hyperfine Interactions 128, 307 (2000).
[4] D. Errandonea, J. Phys. Chem. Solids 67, 2017 (2006).
[5] S. Meenakshi, V. Vijayakumar and B. K. Godwal, Indian J. of Pure Appl. Phys. 44,
440 (2006).
[6] S. Petitgirard, A. Salamat, P. Beck, G. Weck and P. Bouvie, J. Synchrotron Rad. 21,
89 (2014).
[7] N. Subramanian, N. V. Chandra Shekar, N. R. Sanjay Kumar and P. Ch. Sahu,
Current Science 91, 175 (2006).
[8] J. F. Lin, M. Santoro, V. V. Struzhkin, H. K. Mao and R. J. Hemley, Rev. Sci.
Instrum.75, 3302 (2004a).
[9] A. F. Goncharov and J. C. Crowhurst, Rev. Sci. Instrum. 76, 063905 (2005).
[10] R. Boehler, H. G. Musshoff, R. Ditz, G. Aquilanti and A. Trapananti, Rev. Sci.
Instrum. 80, 045103 (2009).
[11] J. D. Barnett, S. Block and G. J. Piermarini, Rev. Sci. Instrum. 44, 1(1973).
[12] G. Shen, M. L. Rivers, Y. Wang, S. R. Sutton, Rev. Sci. Instrum. 72, 1273(2001).
[13] S. Anzellini, A. Dewaele, M. Mezouar, P. Loubeyre and G. Morard, Science 340,
464 (2013).
[14] V. B. Prakapenka, A. Kubo, A. Kuznetsov, A. Laskin, O. Skurikhin, P. Dera, M. L.
Rivers and S. R. Sutton, High Press. Res. 28, 225 (2008).
[15] R. Jeanloz and D. L. Heinz, J De Physique C8 83 (1984).

Chapter 2: LHDAC Facility for HPHT Research
71
[16] R. Boehler, Geophys. Rev. Lett. 13, 1153 (1986).
[17] J. Deng, Z. Du, L. R. Benedetti and K. K. M. Lee, J. Appl. Phys. 121, 025901(2017).
[18] J. Gilvarry, Phys. Rev. Lett. 16, 1089 (1966).
[19] N. Raschevsky, Z. Physik 40, 214 (1927).
[20] K. Herzfeld and M. Mayer, Phys. Rev. 46, 995 (1934).
[21] J. Lennard-Jones and A. Devonshire, Proc. Natl. Acad. Sci. 169, 317 (1938).
[22] L. Brillouin, Phys. Rev. 54, 916 (1938).
[23] P. Lazor, G. Shen and S. K. Saxena, Phys. Chem. Minerals 20, 86 (1993).
[24] R. Boehler, N. V. Bargen and A. Chopelas, J. Geophys. Res. 95, 21731(1990).
[25] L. Yang, A. Karandikar and R. Boehler, Rev. Sci. Instrum. 83, 063905 (2012).
[26] K. Ohta, Y. Kuwayama, K. Hirose, K. Shimizu and Y. Ohishi, Nature 534, 95(2016).
[27] R. Boehler, Nature 363, 534(1993).
[28] D. Errandonea, B. Schwager, R. Ditz, C. Gessmann, R. Boehler and M. Ross, Phys.
Rev. B 63 132104 (2001).
[29] M. Ross LLNL-TR-406604, https://e-reports-ext.llnl.gov/pdf/364495.pdf (2008).
[30] L. J. Swartzendruber, Bull. Alloy Phase Diagrams 3, 161(1982).
[31] W. M. Haynes, ed., CRC Handbook of Chemistry and Physics, CRC Press/Taylor
and Francis, Boca Raton, FL, 95th Edition (2015).
[32] A. Friedrich, B. Winkler, E. A. J. Arellano and L. Bayarjargal, Materials 4, 1648
(2011).
[33] E. H. Bordon, R. Riedel, A. Zerr, P. F. McMillan, G. Auffermann, Y. Ports, W.
Bronger, R. Kniep and P. Kroll, Chem. Soc. Rev. 35, 987 (2006).
[34] X. Zhao and K. J. Range, J. Alloys Comp. 296, 72 (2000).

Chapter 2: LHDAC Facility for HPHT Research
72
[35] E. Soignard, P. F. McMillan, T. D. Chaplin, S. M. Farag, C. L. Bull, M. S.
Somayazulu and K. Leinenweber, Phys. Rev. B 68, 132101 (2006).
[36] H. D. Xiao, H. L. Ma, C. S. Xue, J. Ma, F. J. Zong, X. J. Zhang, F. Ji and W. R. Hu,
Materials Chemistry and Physics 88, 180–184 (2004).
[37] C. L. Bull, T. Kawashima, P. F. McMillan, D. Machon, O. Shebanova, D.
Daisenberger, E. Soignard, E.T. Muromachi and L. C. Chapon, J. Solid. Stat. Chem.
179, 1762 (2006).
[38] J. R. Fuertes, A. Karandikar, R. Boehler and D. Errandonea, Phys. Earth and
Planetary Interiors 181, 69 (2010).
[39] A. Dewaele, A. B. Belonoshko, G. Garbarino, F. Occelli, P. Bouvier, M. Hanfland
and M. Mezouar, Phys. Rev. B 85, 214105 (2012).
[40] C. W. F. T. Pistorius, J. Phys. Chem. Solids 26, 1543 (1965).
[41] R. Boehler, M. Ross and D. B. Boercker, Phys. Rev. B 53, 556 (1996).

Chapter 3: High pressure melting curve of Osmium
73
Chapter 3
High Pressure Melting Curve of Osmium
Osmium (Os), which adopts a hexagonal closed packed structure, is one of the unique
element of the periodic table with exceptional properties, such as highest density among
elements, very high cohesive energy, high melting temperature and a bulk modulus that is almost
comparable to that of diamond under ambient temperature and pressure conditions [1-10]. These
superlative properties of osmium render it suitable for a variety of applications where durability
is the foremost requirement e.g., electrical contacts, wear-resistant machine components, tips for
high-quality ink pens, medical devices and armor-piercing weapon shells. Its extraordinarily high
bulk modulus and low thermal expansion also make osmium a potential candidate for the
synthesis of promising superhard materials [11].
The bulk modulus of Os was reported experimentally by Cynn et al to be 462 GPa,
which is higher than that of diamond (B0 = 446 GPa) [3]. However first principles calculations
and reanalysis of the experimental data of Cynn et al by Joshi et al dismissed this claim and
showed that the bulk modulus of Os is comparable with, but not more than that of diamond [3,
12]. Subsequent experimental and theoretical studies have reported a bulk modulus for Os
ranging from 392 to 476 GPa suggesting that the bulk modulus of Os is large, but still smaller
than that of diamond [4-7, 12-14]. The interest in Os has been further impelled by the
observation of a discontinuity in the pressure derivative of the axial ratio (c/a) around 25 GPa,

Chapter 3: High pressure melting curve of Osmium
74
which has been attributed to a pressure-induced isostructural Lifshitz transition [4, 15, 16]. A
recent experimental and theoretical study however reports that Os retains its hexagonal close-
packed structure to over 770 GPa with anomalies in the axial ratio at 150 and 440 GPa [2]. These
anomalies have been attributed to a topological change in the Fermi surface for valence electrons
and to an electronic transition associated with the pressure induced interaction between core
electrons respectively [2]. Subsequent synchrotron based angle dispersive x-ray diffraction
(ADXRD) study up to 207 GPa however do not indicate any anomaly in c/a ratio at 25 and 150
GPa [1].
Despite these interesting observations and extensive high pressure investigations on Os,
to the best of our knowledge, there have been no experimental report till date on the high
pressure melting curve Tm(P) of Os. It may be noted that the ambient pressure experimental
melting temperature of Os with 99.5 % and 99.7% purity was reported to be 3283 +/- 10 K and
3318 +/- 30 K respectively [17, 18]. Using available literature values of melting temperature as a
function of purity, Arblaster estimated the ambient pressure melting temperature of Os with
100% purity to be 3400 +/- 50 K [19]. Theoretical studies have also been reported to establish
the melting curve of Os at high pressures and to obtain its melting slope using various
approaches [13, 20-24]. Among them, the most recent ab initio quantum molecular dynamic
(QMD) simulations using Z method have computed its melting point at eight different pressure
points up to 500 GPa. [13]. Theoretical melting curve of Os up to 800 GPa has been reported
using first-principles calculations with a prediction of the shock melting around 450 GPa and
9200 K [22]. This value is much smaller than the calculated melting temperature of 13400 K
reported by Z method [13].

Chapter 3: High pressure melting curve of Osmium
75
Establishment of an experimental melting curve for osmium would resolve the observed
discrepancies in the various reported theoretical melting studies. The present chapter reports the
experimental melting curve of osmium up to 35 GPa using an air cooled Yb fibre laser based
laser heated diamond anvil cell (LHDAC) facility [25].
3.1 Experimental Details
High pressure LHDAC based melting experiments were performed using an indigenously
developed Mao-Bell type DAC having 400 µm culet [25]. Sample of thickness ~10 µm was
obtained by pressing a small flake of Os foil (purity 99.8%) between the two culets of DAC. The
sample chamber, which is a tungsten gasket with pre-indentation thickness of 50 µm with a 150
µm diameter hole, was completely filled with Al2O3 powder (purity, 99.9%), which was dried in
a furnace at 400 oC for 24 hrs prior to loading. The DAC was then pressed for compaction. A
shallow pit was then scooped in the Al2O3 layer into which Os foil of size ~100 µm was loaded
(as seen in Fig. 3.1). A thin layer of Al2O3 was placed over the sample to ensure thermal
insulation of the sample from the diamond. A few ruby balls of ~10 μm in diameter were also
placed in the sample chamber for pressure calibration. Pressure measurement was carried out
using ruby fluorescence method at room temperature. Temperature measurement was carried out
by spectroradiometry in the 500-900 nm wavelength range, by fitting the spectral intensity,
collected from a ~3 μm area in the centre of the hot spot, to the Planck’s blackbody radiation
law, as given in Eq. 2.1 of Section 2.2.4, assuming a gray body approximation i.e., invariance of
emissivity over the measured wavelength range.
The melting temperature at each pressure was determined using laser speckle method by
illuminating the laser heated spot with a defocused green laser [25]. The onset of melting is
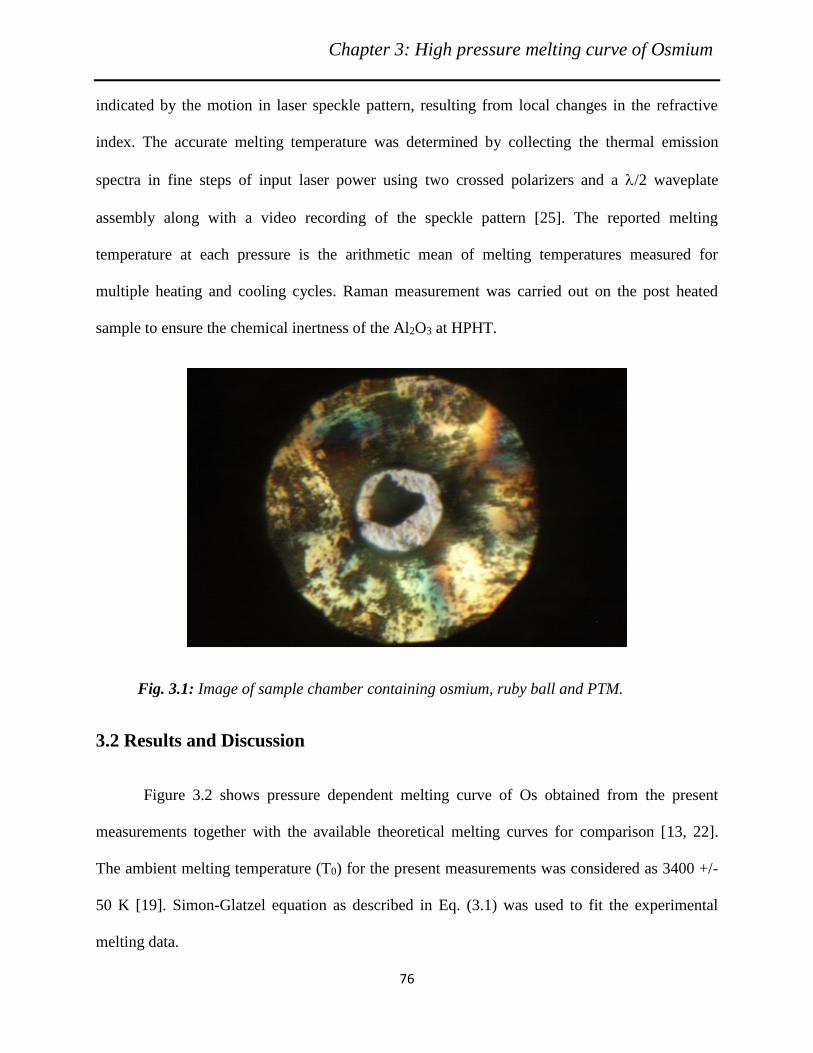
Chapter 3: High pressure melting curve of Osmium
76
indicated by the motion in laser speckle pattern, resulting from local changes in the refractive
index. The accurate melting temperature was determined by collecting the thermal emission
spectra in fine steps of input laser power using two crossed polarizers and a /2 waveplate
assembly along with a video recording of the speckle pattern [25]. The reported melting
temperature at each pressure is the arithmetic mean of melting temperatures measured for
multiple heating and cooling cycles. Raman measurement was carried out on the post heated
sample to ensure the chemical inertness of the Al2O3 at HPHT.
Fig. 3.1: Image of sample chamber containing osmium, ruby ball and PTM.
3.2 Results and Discussion
Figure 3.2 shows pressure dependent melting curve of Os obtained from the present
measurements together with the available theoretical melting curves for comparison [13, 22].
The ambient melting temperature (T0) for the present measurements was considered as 3400 +/-
50 K [19]. Simon-Glatzel equation as described in Eq. (3.1) was used to fit the experimental
melting data.

Chapter 3: High pressure melting curve of Osmium
77
−+=
C
mA
PPTT
1
00 1
(3.1)
where Tm and T0 are melting temperatures at the experimental pressure point (P) and at ambient
pressure (P0) respectively and A and C are the Simon-Glatzel fitting constants. The fitting
constants (A and C) and ambient melting temperature (T0) obtained for the present
measurements are tabulated in Table 3.1 along with the fitting parameters of reported theoretical
melting curves [13, 22].
Fig. 3.2: Comparison of the experimental melting curve of Os and the
corresponding Simon-Glatzel fit in pressure-temperature coordinates with the
various theoretical formalisms described in the text. The inset shows the
corresponding melting curve up to 500 GPa showing the Hugoniot melting point of
Ref. [22].

Chapter 3: High pressure melting curve of Osmium
78
Table 3.1: Comparison of the Simon-Glatzel fit parameters obtained in the present study with
that reported by various theoretical formalisms described in the text.
T0 in (K) Simon-Glatzel Fit Parameters Tm at 450 GPa
(K) A in (GPa) C
Present study 3405(26) 29.2(113) 2.01(56) 13700
Z- Method
Ref.[13]
3370(75) 36.065 1.89 13400
Ab-initio Ref. [22] 3463(67) 101.9(107) 1.67(6) 9200
It may be noted that the smooth behaviour of the experimental curve rules out any solid-solid
transition in the sample. Furthermore, the laser speckle technique employed for detecting the
onset of melting reiterates the absence of any solid-solid transition in osmium up to the melting
temperature. Interestingly, as evident from Fig. 3.3, the melting line of Os is seen to cross that of
W around 6 GPa making it the most refractory metal [27, 28]. Table 3.2 compares the melting
slope of Os with that of some reported hcp phase metals [28-31]. The melting slope obtained in
the present study has been tabulated and compared with the available theoretical melting slopes
in Table 3.3 [13, 20-24]. It may be noted that Kulyamina et al have extrapolated the available
experimental isobaric heating data on Os and obtained their melting slope [20, 21]. In view of the
fact that experimental values of ΔVm and ΔSm are not available, their usage of estimated values
could be the possible reason for deviation of their melting slope from the present study.

Chapter 3: High pressure melting curve of Osmium
79
Fig. 3.3: Comparison of melting curve of Os with Re [28] and W [27].
Table 3.2: Comparison of ambient pressure melting temperature and melting slope of some hcp
phase metals: Os [present study], Re [28], Mg [29], Zn [30] and Cd [31].
Os Re Mg Zn Cd
Melting point
(K) 3400 3453 923 690 594
Melting slope
(K GPa-1) 58 17 6 50 45
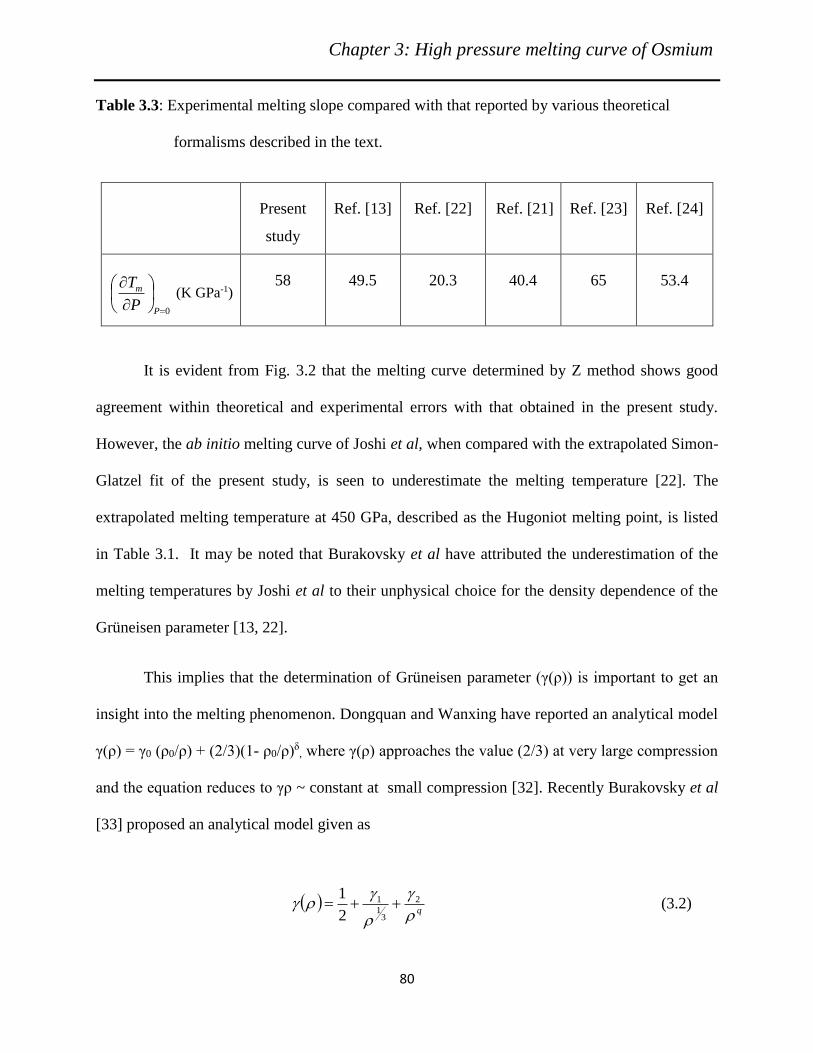
Chapter 3: High pressure melting curve of Osmium
80
Table 3.3: Experimental melting slope compared with that reported by various theoretical
formalisms described in the text.
Present
study
Ref. [13] Ref. [22] Ref. [21] Ref. [23] Ref. [24]
0=
P
m
P
T
(K GPa-1) 58 49.5 20.3 40.4 65 53.4
It is evident from Fig. 3.2 that the melting curve determined by Z method shows good
agreement within theoretical and experimental errors with that obtained in the present study.
However, the ab initio melting curve of Joshi et al, when compared with the extrapolated Simon-
Glatzel fit of the present study, is seen to underestimate the melting temperature [22]. The
extrapolated melting temperature at 450 GPa, described as the Hugoniot melting point, is listed
in Table 3.1. It may be noted that Burakovsky et al have attributed the underestimation of the
melting temperatures by Joshi et al to their unphysical choice for the density dependence of the
Grüneisen parameter [13, 22].
This implies that the determination of Grüneisen parameter (γ(ρ)) is important to get an
insight into the melting phenomenon. Dongquan and Wanxing have reported an analytical model
γ(ρ) = γ0 (ρ0/ρ) + (2/3)(1- ρ0/ρ)δ, where γ(ρ) approaches the value (2/3) at very large compression
and the equation reduces to γρ ~ constant at small compression [32]. Recently Burakovsky et al
[33] proposed an analytical model given as
( )q
2
31
1
2
1++=
(3.2)

Chapter 3: High pressure melting curve of Osmium
81
which asymptotically reduces to (1/2) as ρ→∞. The value of (1/2) for γ(ρ), at very large
compression, is obtained on the assumption that crystal reduces to one component plasma (OCP)
when density increase, upon compression, reaches 10 fold or higher. Using this model, γ(ρ) was
computed by considering three limiting case of γ(ρ) and using Lindemann melting criteria as
given in Eq. (3.3).
( )( )
3
1
ln
ln
2
1+=
d
Td m (3.3)
Based on the analytical model described in Eq. 3.2, γ(ρ) has been determined using two
approaches in the present study. In the first approach, model parameters (γ1, γ2 and q ) were
calculated using the experimental melting slope (dTm/dP), as determined by the Simon- Glatzel
fit, by imposing the following three conditions viz.,
Condition 1: For ρ→∞, γ(ρ) → OCP limit and Lindemann melting criteria reduces to
( ) ( )mmm
q
mmKT
Ze
Vq
=
+1
3
46exp
2231
2
31
1
(3.4)
where Vm, ρm Tm, K, e, Z and Γm are unit cell volume at melt, density at melt, melting
temperature of Os, Boltzmann constant, electron charge, atomic number and OCP coupling
parameter of Os at melt respectively. The value of the OCP coupling parameter at melt (m) for
Os was considered as 175 in the present study [34, 35].
Condition 2: At ambient pressure and temperature, the experimental value of γ(ρ) is 2.12 [36].
Thus Eq. (3.2) reduces to
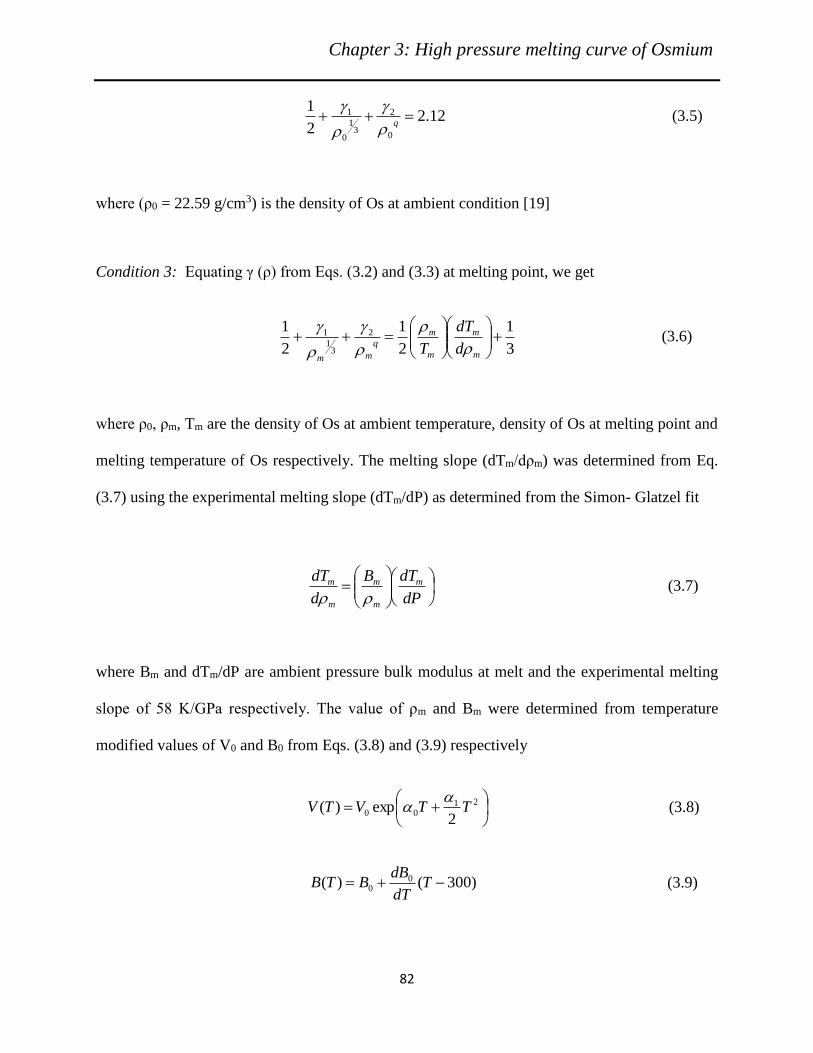
Chapter 3: High pressure melting curve of Osmium
82
12.22
1
0
2
31
0
1 =++q
(3.5)
where (ρ0 = 22.59 g/cm3) is the density of Os at ambient condition [19]
Condition 3: Equating γ (ρ) from Eqs. (3.2) and (3.3) at melting point, we get
3
1
2
1
2
1 2
31
1 +
=++
m
m
m
m
q
mmd
dT
T
(3.6)
where ρ0, ρm, Tm are the density of Os at ambient temperature, density of Os at melting point and
melting temperature of Os respectively. The melting slope (dTm/dρm) was determined from Eq.
(3.7) using the experimental melting slope (dTm/dP) as determined from the Simon- Glatzel fit
=
dP
dTB
d
dT m
m
m
m
m
(3.7)
where Bm and dTm/dP are ambient pressure bulk modulus at melt and the experimental melting
slope of 58 K/GPa respectively. The value of ρm and Bm were determined from temperature
modified values of V0 and B0 from Eqs. (3.8) and (3.9) respectively
+= 21
002
exp)( TTVTV
(3.8)
)300()( 00 −+= T
dT
dBBTB (3.9)

Chapter 3: High pressure melting curve of Osmium
83
where 0 is the ambient pressure thermal expansion coefficient, 1 is the first temperature
derivative of thermal expansion coefficient, B0 is the ambient temperature bulk modulus and
dB0/dT is the temperature derivative of the bulk modulus. The values of 0, 1, B0 and dB0/dT
were considered as 1.48 x 10⁻⁵ K-1, 5.2 x 10⁻⁹ K-2, 421 GPa and -0.054 GPa K-1 respectively [6].
The values of model parameters (γ1, γ2 and q) determined by solving Eqs. (3.4), (3.5) and (3.6)
simultaneously are tabulated in Table 3.4.
In this context it may be noted that, in absence of any report for experimental melting
slope for Os, Burakovsky et al had assumed that γ1 satisfies the γ1 = γ1 (Z) systematic, where Z
is the atomic number, and hence fixed the value of γ1 as 3.06 (g/ cm3)1/3 for solving the Eqs. (3.4)
and (3.5) simultaneously [33]. This essentially implies that the computation of their model
parameters (γ1, γ2 and q) were based on Condition 1 and Condition 2 only. In order to eliminate
the OCP dependence on the model parameters, as a second approach, we have applied Condition
2 and Condition 3 together with the assumption of γ1 as 3.06 (g/cm3)1/3. This essentially implies
that, except for γ1, the computation of the other two model parameters viz., γ2 and q, as tabulated
in Table 3.4, are based on experimental data. The variation of γ(ρ) as a function of 0/ is shown
in Fig. 3.4 wherein two regions have been marked. In region I, it is observed that the curves
obtained from both the approaches considered in present study (curves (a) and (b)) overlap. They
are however deviated from the theoretically calculated curve (c) in the ρ0/ρ range of 0.5 to 1.0
[13]. In view of the fact that the value of γ1 computed in the present study is same as that
considered by Burakovsky et al we conclude that the variation of γ(ρ) in this region is
predominantly dependent on (γ2 /ρq), which is the third term of Eq. (3.2) [13]. It may also be
noted that the value of (γ2/ρq) in the present study differs from that obtained by Z method by ~22
% at ambient density (ρ0/ρ = 1) [13].

Chapter 3: High pressure melting curve of Osmium
84
Table 3.4: Comparison of the model parameters obtained in the present study with Ref. [13].
Model parameter Present study Ref. [13]
1st approach 2nd approach
γ1 in ( g/cm3)1/3 3.063 3.060 3.060
γ2 in (g/cm3)q 1.35 x 10⁸ 1.31 x 10⁸ 4.1 x 10¹⁵
q 6.20 6.19 11.8
Fig. 3.4: Density dependence of the Grüneisen parameter obtained in the present
study compared with that of Ref. [13].

Chapter 3: High pressure melting curve of Osmium
85
In view of this, the coincidence of the three curves (a, b and c) in Region II leads us to conclude
that γ(ρ) in this region is virtually independent of higher order density term, i.e., (γ2/ρq). The
above observations, in conjunction with the reported Z dependence of γ1, lead us to conclude that
the Grüneisen parameter γ(ρ) is dependent only on Z at very high compression [33].
3.3 Conclusions
The melting curve of Os has been determined up to 35 GPa and 5800 K using the laser-
heated diamond anvil cell experiments employing laser speckle method for accurate detection of
onset of melting. The density dependence of Grüneisen parameter (γ(ρ)) has been determined
analytically, using the experimentally obtained melting slope, by adopting two approaches. The
study leads us to conclude that the Grüneisen parameter is dependent only on Z at very high
compression. The experimental melting curve obtained in the present study would provide an
important database for a definitive understanding of the phase diagram of Os and for developing
and testing condensed matter theories describing the equation of state, melting and phase
stability, which could be of immense fundamental scientific interest.
Chapter 3: High pressure melting curve of Osmium
86
References
[1] C. S. Perreault, N. Velisavljevic and Y. K. Vohra, Cogent Phys., 4, 1376899 (2017).
[2] L. Dubrovinsky, N. Dubrovinskaia, E. Bykova, M. Bykov, V. Prakapenka, C. Prescher,
K. Glazyrin, H. P. Liermann, M. Hanfland, M. Ekholm, Q. Feng, L. V. Pourovskii, M. I.
Katsnelson, J. M. Wills and I. A. Abrikosov, Nature, 525, 226 (2015).
[3] H. Cynn, J. E. Klepeis, C. S.Yoo and D. A.Young, Phys. Rev. Lett., 88, 2401 (2002).
[4] F. Occelli, D. L. Farber, J. Badro, C. M. Aracne, D. M. Teter, M. Hanfland, B. Canny and
B. Couzinet, Phys. Rev. Lett., 93, 095502 (2004).
[5] T. Kenichi, Phys. Rev. B, 70, 012101 (2004).
[6] M. M. Armentrout and A. Kavner, J. Appl. Phys., 107, 093528 (2010).
[7] B. K. Godwal, J. Yan, S. M. Clark and R. Jeanloz, J. Appl. Phys. 111, 112608 (2012).
[8] G. A. Voronin, C. Pantea, T. W. Zerda, L. Wang and Y. Zhao, J. Phys. Chem. Solids 66,
706 (2005).
[9] B. R. Sahu and L. Kleinman, Phys. Rev. B 72, 113106 (2005).
[10] M. Hebbache and M. Zemzemi, Phys. Rev. B 70, 224107 (2004).
[11] J. C. Zheng, Phys. Rev. B 72, 052105 (2005).
[12] K. D. Joshi, G. Jyoti and S. C. Gupta, High Press. Res., 23, 403 (2003).
[13] L. Burakovsky, N. Burakovsky and D. L. Preston, Phys. Rev. B, 92, 174105 (2015).
[14] Y. Liang and Z. Fang, J. Phys.: Condens. Matter 18, 8749 (2006).
[15] Y. Ma, T. Cui, L. Zhang, Y. Xie, and G. Zou, J. S. Tse, X. Gao and D. D. Klug, Phys.
Rev. B 72, 174103 (2005).
[16] D. Koudela, M. Richter, A. Möbius, K. Koepernik and H. Eschrig, Phys. Rev. B 74,
214103 (2006).

Chapter 3: High pressure melting curve of Osmium
87
[17] R. W. Douglass and E. F. Adkins, Trans. Met. Soc. AIME, 221, 248 (1961).
[18] A. G. Knapton, J. Savill and R. Siddall, J. Less Common Met., 2, 357 (1960).
[19] J. W. Arblaster, Platinum Met. Rev. 57, 177 (2013).
[20] E. Yu. Kulyamina, V. Yu. Zitserman and L. R. Fokin, Technical Physics, 62, 68 (2017).
[21] E. Yu. Kulyamina, V. Yu. Zitserman and L. R. Fokin, High. Temp. 53, 151 (2015).
[22] K. D. Joshi, S. C. Gupta and S. Banerjee, J. Phys.: Condens. Matter, 21, 415402 (2009).
[23] A. R. Regel and V. M.Glazov, Periodicheskiy zakon i fizicheskie svoistva elektronnykh
rasplavov [The Periodic Law and Physical Properties of Electronic Melts] (Nauka,
Moscow, 1978).
[24] T. Gorecki, High Temp. High Press., 11, 683 (1979).
[25] N. N. Patel, M. Sunder and S. M. Sharma, Indian J. Phys., in press (2018).
[26] G. Shen, M. L. Rivers, Y. Wang and S. R. Sutton, Rev. Sci. Instrum., 72, 1273 (2001).
[27] D. Errandonea, B. Schwager, R. Ditz, C. Gessmann, R. Boehler and M. Ross, Phys.Rev.B
63, 132104 (2001).
[28] L. Yang, A. Karandikar and R. Boehler, Rev. Sci. Instrum., 83, 063905 (2012).
[29] D. Errandonea, R. Boehler and M. Ross, Phys. Rev. B 65, 012108 (2001).
[30] D. Errandonea, S. G. MacLeod, J. Ruiz-Fuertes, L. Burakovsky, M. I. McMahon
C. W. Wilson, J. Ibañez, D. Daisenberger and C. Popescu, J. Phys.: Condens. Matter, in
press https://doi.org/10.1088/1361-648X/aacac0.
[31] D. Errandonea, J. Appl. Phys., 108, 033517 (2010).
[32] C. Dongquan, Z. Wanxing in: High Pressure Science and Technology, Part III, edited by
C. Homan, R. K. MacCrone, E. Whalley (North-Holland, Amsterdam, 1984) p. 247.
[33] L. Burakovsky and D. L. Preston, J. Phys. Chem. Solids 65, 1581 (2004).

Chapter 3: High pressure melting curve of Osmium
88
[34] L. Burakovsky and D. L. Preston, Phys. Rev. E 63, 067402 (2001).
[35] A. Y. Potekhin and G. Chabrier, Phys. Rev. E 62, 8554 (2000).
[36] C. Pantea, I. Stroe, H. Ledbetter, J. B. Betts, Y. Zhao, L. L. Daemen, H. Cynn and A.
Migliori, Phys. Rev. B 80, 024112 (2009).

Chapter 4: Synthesis of unconventional stoichiometric compounds in the K−Br
system at high pressures
89
Chapter 4
Synthesis of Unconventional Stoichiometric Compounds
in the K−Br System at High Pressures
Attaining the nearest closed-shell electronic configuration is the tendency of all main-
group elements during chemical synthesis of compounds. Alkali atoms have one extra electron in
their valence shell whereas halogen atoms lack one electron to attain the nearest noble gas
valence shell electronic configurations. As a result, the alkali atoms react, via electron exchange,
with the halogen group of elements. During this chemical reaction, alkali atom donates an
electron to the halogen atom to form a positive ion with charge +1 and the halogen atom, by
accepting one electron, becomes a negatively charged ion with charge -1. The electrostatic
attraction between the alkali and halogen ion result in ionic bonding in alkali halides. Alkali
halides considered as prototype ionic solids crystallize in one of the two known crystal structure
viz., NaCl structure (B1) having fcc lattice (SG: Fm-3m) with atomic positions Na at (0 0 0) and
Cl at (1/2 1/2 0) or CsCl structure (B2) having simple cubic lattice (SG: Pm-3m) with atomic
position Cs (0 0 0) and Cl (1/2 1/2 1/2), at ambient pressure and temperature. At high pressures
all the alkali halides are known to transform to the B2 structure. Apart from these AX
stoichiometric compounds, where A stands for alkali element and X stands for halogen, few
counterintuitive alkali trihalides, i.e., AX3, were synthesized recently [1, 2]. Furthermore, higher
polyhalides, i.e., AXn with n>3, are not known in whole alkali halogen system.

Chapter 4: Synthesis of unconventional stoichiometric compounds in the K−Br
system at high pressures
90
First-principles studies in recent past have proposed the formation of unconventional
stoichiometries at high pressures in alkali halogen system as well as other isostructural alkali
hydrogen systems [1-3]. NaCl3, lithium polyhydrides and KCl3 are notable examples of such
compounds which have been synthesized at high pressures and high temperatures in the
diamond-anvil cell (DAC) based experiments [1-3]. Interestingly, alkali hydrides show a high
pressure behaviour similar to alkali halide, i.e., B1 to B2 transition, and some of the proposed
alkali polyhydrides are predicted to be high temperature superconductors [4]. The experimental
realization of more such compounds and possible synthesis of higher polyhalides AXn , where
n>3, will enrich our understanding of the solid state chemistry of these simple elements and their
compounds at high pressure high temperature (HPHT) conditions; especially their reactions and
selectivity of different paths. With the above motivations, high temperature and high pressure
studies on K-Br system was initiated.
It may be noted that, to date, potassium bromide (KBr) is the only known stoichiometric
compound in the K-Br system. KBr exists in the rocksalt-type structure (B1 phase) at ambient
conditions and transforms to the cesium chloride-type structure (B2 phase) above 2.0 GPa [5]. In
this chapter the synthesis and characterization of two new stoichiometric compounds viz., KBr3
and KBr5 in K-Br systems above 2 GPa and 6 GPa at room temperature respectively have been
reported. The high pressure behaviour of these compounds and high pressure and and high
temperature stability of KBr5 would be discussed.
4.1 Methodology
4.1.1 Experimental Method
High pressure experiments were performed using an indigenously developed Mao-Bell
type DAC having 400 µm culet and ruby as pressure gauge. Prior to loading in the DAC, KBr

Chapter 4: Synthesis of unconventional stoichiometric compounds in the K−Br
system at high pressures
91
powder (purity, ~ 99.99%) was dried in a furnace at 200 oC for 24 hrs. Tungsten gaskets with
pre-indentation thickness of 50 µm and 150 µm diameters hole were used. A small pit was made
at the centre of compacted KBr. Bromine was directly loaded into the KBr pit and the DAC was
immediately closed. Due to the high vapour pressure of Br, its exact volume loaded in the DAC
could not be estimated. Pressure measurements were carried out using both ruby fluorescence
with pressure uncertainty of 0.1 GPa, and the equation of state (EOS) of KBr, with pressure
uncertainty of 0.2 GPa [5]. High pressure angle dispersive x-ray diffraction (ADXRD)
measurements were carried out at the extreme condition x-ray diffraction (ECXRD) (BL-11)
beamline of Indus II synchrotron source, India [6] and Xpress beamline of the Elettra
synchrotron source, Italy [7]. The sample to detector distance and the image plate orientation
angle were calibrated using CeO2 as standard. The x-ray data was collected using MAR345
detector. The 2D images were converted into intensity versus diffraction angle (2) plots
through radial integration using FIT2D software [8]. The lattice parameters were determined by
carrying out multi-phase Le Bail refinement using GSAS [9]. We could perform only Le Bail
refinement due to the spotty and textured nature of the diffraction images. The typical Rp and
wRp of the Le Bail fit were 2% and 3%, respectively. Raman measurements were carried out in
backscattering geometry using a triple stage micro-Raman spectrometer (Jobin Yvon T64000).
This set up is equipped with a liquid nitrogen cooled CCD detector and the excitation laser has a
wavelength of 532 nm.
Laser heated HPHT experiments were carried out using the LHDAC facility described in
Chapter 2 of this thesis [10]. The sample temperature was measured by spectroradiometry
technique wherein the thermal radiation emitted by the hot sample is collected in a 400 nm
spectral width. This technique has been described in detail in Chapter 2 of this thesis.

Chapter 4: Synthesis of unconventional stoichiometric compounds in the K−Br
system at high pressures
92
4.1.2 Theoretical Method
In order to determine the stoichiometries and related crystal structures, first-principles
crystal structure searches were performed using the USPEX code [11-13] in combination with
VASP code [11, 14-16]. These calculations were performed at 0, 4, 8 and 12 GPa allowing all
possible combinations of number of atoms in the unit cell. For most of the simulations, the
number of atoms were allowed to take values from 8 to 16 in the unit cell. In principle, variable-
composition searches can find out stable stoichiometries and their structures, but variable
compositions calculation did not yield a structure which agreed with both Raman and XRD data
of the compound formed in the second chemical reaction; hence fixed stoichiometry searches
were carried out in this case. Structural search with 24 atoms (for 1:3 composition) was
performed only at 15 GPa as none of the earlier structures showed agreement with post laser
heated experimental data. Structural optimizations, total energy and electronic band structure
calculations were done using Perdew-Burke-Ernzerhof (PBE) exchange-correlations [17]. Core
and valence electrons interaction was treated by the all-electron projector augmented wave
(PAW) method with K: 3p6, 4s1 and Br: 4s2, 4p5 valence electron configurations. In structural
searches, the plane wave basis set was constructed with an energy cut-off of 400 eV and
reciprocal space integrations were performed using Monkhorst-Pack method with 2 × 0.05 Å-1
grid spacing. Most important structures were re-optimized using an energy cut-off of 500 eV and
reciprocal space sampling with 2 × 0.02 Å-1 grid spacing. Electronic properties were
investigated by calculating valence charge density, Bader charge [18], electron-localization
function (ELF) [19], electronic density of state function and crystal orbit Hamiltonian
populations (COHP) [20-22]. Phonon calculations were performed using the QUANTUM-
ESPRESSO code [23]. Phonon calculations used the “von Barth-Car” (VBC) norm conserving
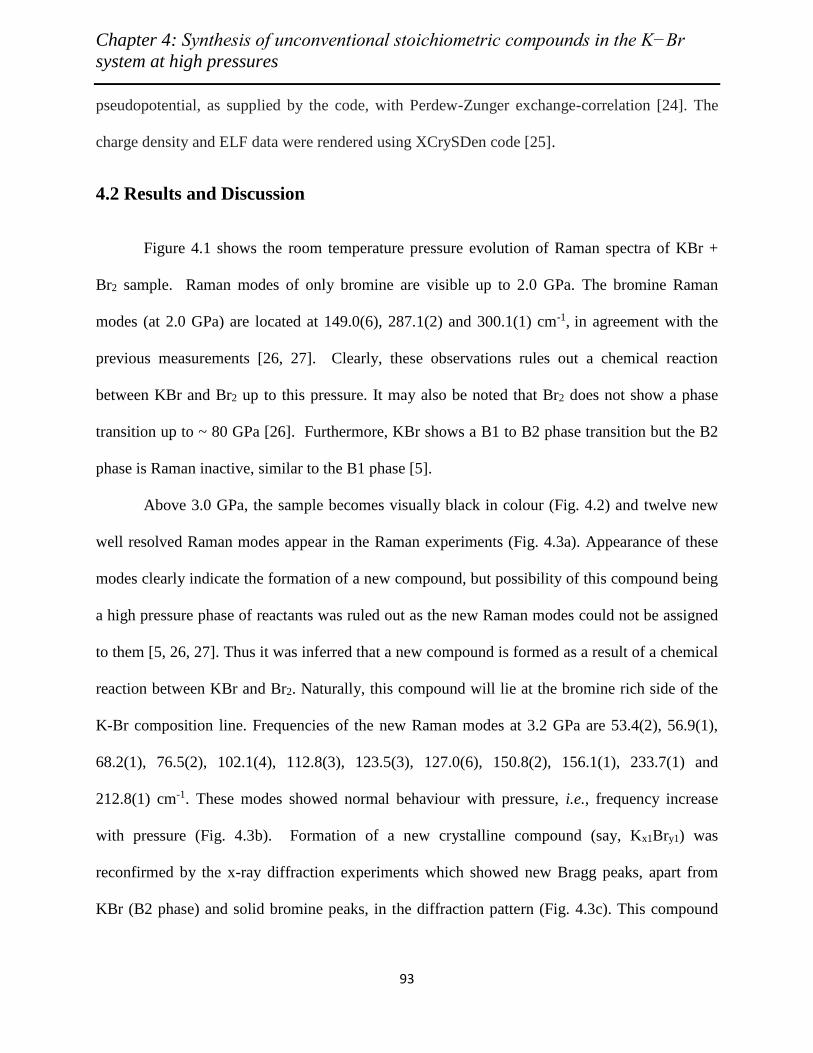
Chapter 4: Synthesis of unconventional stoichiometric compounds in the K−Br
system at high pressures
93
pseudopotential, as supplied by the code, with Perdew-Zunger exchange-correlation [24]. The
charge density and ELF data were rendered using XCrySDen code [25].
4.2 Results and Discussion
Figure 4.1 shows the room temperature pressure evolution of Raman spectra of KBr +
Br2 sample. Raman modes of only bromine are visible up to 2.0 GPa. The bromine Raman
modes (at 2.0 GPa) are located at 149.0(6), 287.1(2) and 300.1(1) cm-1, in agreement with the
previous measurements [26, 27]. Clearly, these observations rules out a chemical reaction
between KBr and Br2 up to this pressure. It may also be noted that Br2 does not show a phase
transition up to ~ 80 GPa [26]. Furthermore, KBr shows a B1 to B2 phase transition but the B2
phase is Raman inactive, similar to the B1 phase [5].
Above 3.0 GPa, the sample becomes visually black in colour (Fig. 4.2) and twelve new
well resolved Raman modes appear in the Raman experiments (Fig. 4.3a). Appearance of these
modes clearly indicate the formation of a new compound, but possibility of this compound being
a high pressure phase of reactants was ruled out as the new Raman modes could not be assigned
to them [5, 26, 27]. Thus it was inferred that a new compound is formed as a result of a chemical
reaction between KBr and Br2. Naturally, this compound will lie at the bromine rich side of the
K-Br composition line. Frequencies of the new Raman modes at 3.2 GPa are 53.4(2), 56.9(1),
68.2(1), 76.5(2), 102.1(4), 112.8(3), 123.5(3), 127.0(6), 150.8(2), 156.1(1), 233.7(1) and
212.8(1) cm-1. These modes showed normal behaviour with pressure, i.e., frequency increase
with pressure (Fig. 4.3b). Formation of a new crystalline compound (say, Kx1Bry1) was
reconfirmed by the x-ray diffraction experiments which showed new Bragg peaks, apart from
KBr (B2 phase) and solid bromine peaks, in the diffraction pattern (Fig. 4.3c). This compound
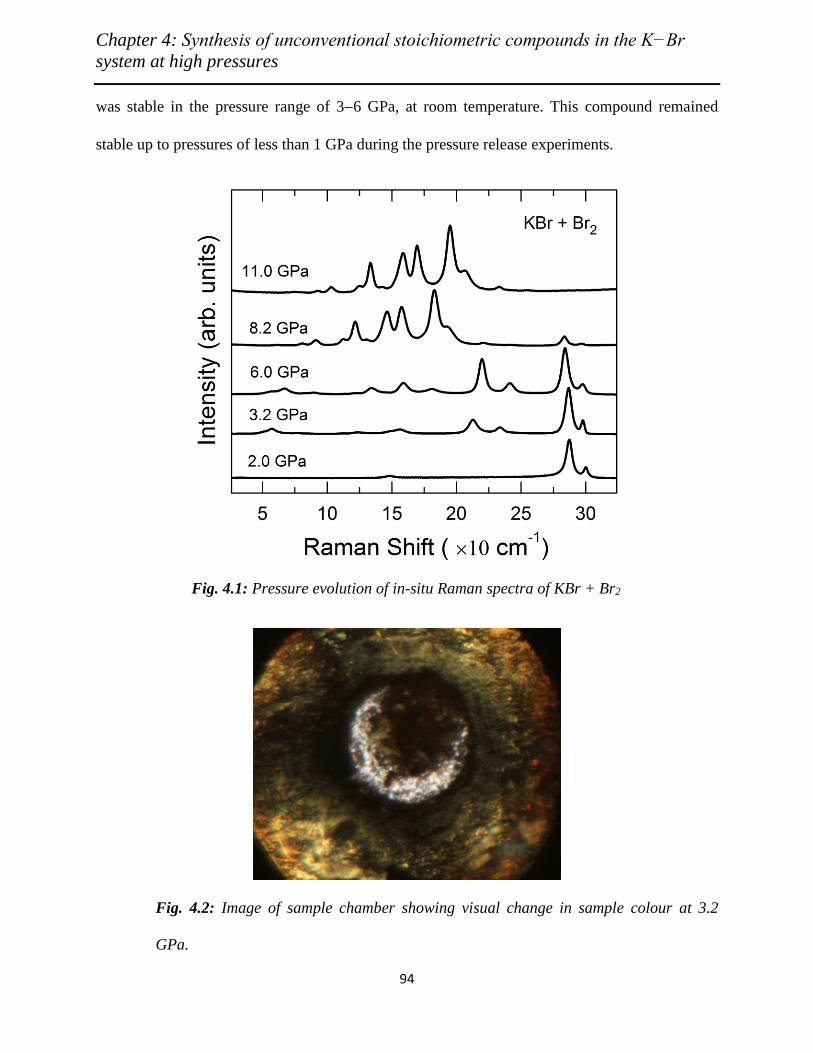
Chapter 4: Synthesis of unconventional stoichiometric compounds in the K−Br
system at high pressures
94
was stable in the pressure range of 3−6 GPa, at room temperature. This compound remained
stable up to pressures of less than 1 GPa during the pressure release experiments.
Fig. 4.1: Pressure evolution of in-situ Raman spectra of KBr + Br2
Fig. 4.2: Image of sample chamber showing visual change in sample colour at 3.2
GPa.

Chapter 4: Synthesis of unconventional stoichiometric compounds in the K−Br
system at high pressures
95
a)
b)

Chapter 4: Synthesis of unconventional stoichiometric compounds in the K−Br
system at high pressures
96
c)
Fig. 4.3: Structural and vibrational properties of the newly synthesized compound
KBr3 (SG: Pnma). (a) Experimental and theoretical Raman spectra, (b) pressure
variation of Raman mode frequencies. Filled circles show experimental points
and filled diamond show theoretical points, (c) Le-Bail fit of the pressure release
run of ADXRD data.
Above 6.0 GPa, nine additional well resolved Raman modes appeared (Fig. 4.4a). Intensities of
these modes grew with time. However intensities of the earlier observed twelve new modes and
bromine modes decreased with time. This observation indicates a simultaneous consumption of
both Kx1Bry1 and Br2 and the synthesis of another compound (say, Kx2Bry2) progressively. The
frequencies of these modes at 8.2 GPa are 84.4(2), 95.5(1), 116.1(2), 125.1(1), 134.2(2),
149.9(1), 162.0(1), 186.2(1) and 199.2(1) cm-1. Pressure variation of these modes is shown in

Chapter 4: Synthesis of unconventional stoichiometric compounds in the K−Br
system at high pressures
97
Fig. 4.4b. The x-ray diffraction experiments reconfirmed the formation of a new crystalline
compound (Fig. 4.4c).
a)
b)

Chapter 4: Synthesis of unconventional stoichiometric compounds in the K−Br
system at high pressures
98
c)
Fig. 4.4: Structural and vibrational properties of the newly synthesized compound
KBr5 (SG: P21). (a) Experimental and theoretical Raman spectrum, (b) Pressure
variation of Raman mode frequencies. Filled circles show experimental points
and filled diamond show theoretical points, (c) Le-Bail fit of ADXRD data at 12
GPa.
Unlike the first reaction, the second reaction progressed at a much slower rate and it took several
hours to complete. The time evolution of the various modes, under constant applied load, is
shown in Fig. 4.5a. This compound is also expected to lie in the bromine rich side of the K-Br
composition line. During the commencement of the second reaction, the sample chamber
pressure increased continuously with time. Time evolution of the sample chamber pressure was
monitored in several runs and the pressure was always found to increase by about 2−3 GPa (Fig.

Chapter 4: Synthesis of unconventional stoichiometric compounds in the K−Br
system at high pressures
99
4.5b). In these measurements, the sample pressure was measured from the same ruby ball
throughout the run at constant applied external load. To the best of our knowledge, this type of
direct observation of pressure increase has not been reported so far. In view of the fact that DAC
experiments are carried out at isothermal conditions, this observation implies the direct release of
internal energy change into mechanical work. This compound remained stable up to the highest
pressure of 24 GPa achieved in the present room temperature study. It may be noted that the
present experiments were carried out under non-hydrostatic conditions. However due to the soft
nature of both KBr and bromine, the deviatoric stresses are expected to be small in the pressure
range covered by the experiments and therefore not a determining factor for the chemical
reactions observed [28].
a)

Chapter 4: Synthesis of unconventional stoichiometric compounds in the K−Br
system at high pressures
100
b)
Fig. 4.5: (a) Time evolution of in-situ Raman spectra of KBr5, KBr3 and Br2 from
a fixed sample position. Peaks marked with blue, red and green are guide to eye
for high intensity Raman modes corresponding to KBr3, KBr5 and Br2,
respectively at time t = 0 and (b) increase of sample chamber pressure with time
due to formation of the second stage compound, KBr5.
For compound Kx1Bry1, the orthorhombic structure (SG: Pnma) of KBr3 stoichiometry
gave good agreement to the experimental x-ray diffraction pattern as shown in Fig. 4.3c.
Calculated Raman frequencies and their pressure variation show reasonably good agreement
with the experimental results (Figs. 4.2a and 4.2b). Calculated formation enthalpies also support

Chapter 4: Synthesis of unconventional stoichiometric compounds in the K−Br
system at high pressures
101
the existence of this compound at the experimental pressures (Fig. 4.6a). Interestingly, the
proposed structure is same as the ambient structure of CsI3 [29]. Recently, similar structure was
also reported in NaCl3 [1]. But unlike our work, the formation of NaCl3 was observed at much
higher pressures and higher temperatures. Calculated pressure-volume (PV) EOS and lattice
parameters are in reasonably good agreement with the experimental results (Fig. 4.6b and 4.6c).
Phonon dispersion calculations yield all frequencies positive indicating vibrational stability of
the compound (Fig. 4.6d).
a)

Chapter 4: Synthesis of unconventional stoichiometric compounds in the K−Br
system at high pressures
102
b)
c)

Chapter 4: Synthesis of unconventional stoichiometric compounds in the K−Br
system at high pressures
103
d)
Fig. 4.6: (a) Formation enthalpies in different reactions for KBr3, Enthalpies are
given per atom. (b) Experimental (filled symbols) and theoretical (lines)
equations-of-state, along with (c) pressure variation of theoretical (lines) and
experimental (symbols) lattice parameters of orthorhombic KBr3. (d) Phonon
dispersion curves and phonon density of states (PHDOS) for orthorhombic KBr3
at 4 GPa.
For Kx2Bry2 compound, the monoclinic structure (SG: P21) with KBr5 stoichiometry as
shown in Fig. 4.4c showed good agreement to the experimental x-ray diffraction pattern.
Calculated Raman frequencies and their pressure variation have a reasonably good match with

Chapter 4: Synthesis of unconventional stoichiometric compounds in the K−Br
system at high pressures
104
the experimental results (Figs. 4.3a and 4.3b). The experimental Raman frequencies and their
pressure coefficients for KBr3 and KBr5 are shown in Table 4.1 and Table 4.2 respectively.
Table 4.1: Raman mode frequencies (ω0) of KBr3 (SG: Pnma) and their pressure coefficient
obtained by a linear fit.
Raman mode frequency
ω0 (cm-1) (at P=3.2 GPa)
(dω/dp)
(cm-1/GPa)
53.4 2.15
56.9 3.07
68.2 3.38
76.5 4.14
102.1 3.00
112.8 4.70
123.5 1.23
127.0 2.71
150.8 3.08
233.7 2.57
212.8 2.84

Chapter 4: Synthesis of unconventional stoichiometric compounds in the K−Br
system at high pressures
105
Table 4.2: Raman mode frequencies (ω0) of KBr5 (SG: P21) and their pressure coefficients
obtained by a quadratic fit.
Raman mode frequency ω0 (cm-1)
(at P=8.2 GPa)
(dω/dp)
(cm-1/GPa)
(d2ω/dp2 )
(cm-1/GPa2)
84.4 6.25 -0.17
95.5 6.62 -0.19
116.1 6.03 -0.16
125.1 6.03 -0.19
134.2 6.17 -0.17
149.9 7.54 -0.24
162.0 6.02 -0.17
186.2 3.27 0.0
199.2 4.36 0.0
Calculated formation enthalpies also support the formation of this compound at the experimental
pressures (Fig 4.6a). This is the first experimental report of synthesis of an alkali-halide in 1:5
stoichiometry. Calculated PV-EOS and lattice parameters are in reasonably good agreement with
the experimental data (Fig. 4.7b and 4.7c). Calculated phononic properties establish the
vibrational stability of the proposed structure (Fig. 4.7d). Atomic volume for KBr5 has the largest
value among all others, namely KBr, Br2 and KBr3, explaining the observed pressure increase

Chapter 4: Synthesis of unconventional stoichiometric compounds in the K−Br
system at high pressures
106
during the formation of this compound (Fig. 4.8). Indeed, KBr5 has about 3.39 % higher atomic
volume than KBr at 12 GPa.
a)
b)
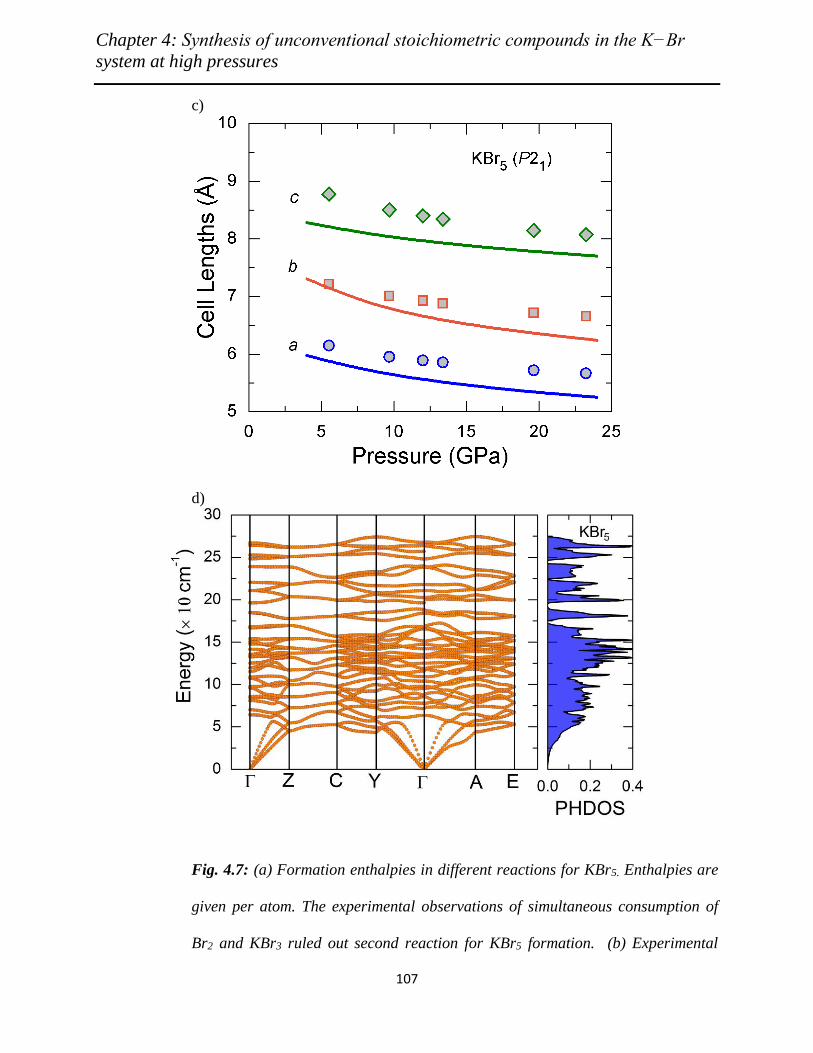
Chapter 4: Synthesis of unconventional stoichiometric compounds in the K−Br
system at high pressures
107
c)
d)
Fig. 4.7: (a) Formation enthalpies in different reactions for KBr5. Enthalpies are
given per atom. The experimental observations of simultaneous consumption of
Br2 and KBr3 ruled out second reaction for KBr5 formation. (b) Experimental

Chapter 4: Synthesis of unconventional stoichiometric compounds in the K−Br
system at high pressures
108
(filled symbols) and theoretical (lines) equations-of-state, along with (c) pressure
variation of theoretical (lines) and experimental (symbols) lattice parameters of
monoclinic KBr5. (d) Phonon dispersion curves and phonon density of states
(PHDOS) for KBr5 at 12 GPa.
Fig. 4.8: Experimental equations of state of KBr (B2 phase, SG: Pm-3m), Br2
(SG: Cmca), KBr3 (SG: Pnma) and KBr5 (SG: P21). Dotted lines are guide to the
eye. Error bars in pressure are within the symbol.

Chapter 4: Synthesis of unconventional stoichiometric compounds in the K−Br
system at high pressures
109
The orthorhombic KBr3 has an almost linear asymmetric Br3 units (Table 4.3). The Bader
charge analysis shows that the compound has a predominant ionic bonding between potassium
and Br3 unit, but bromine atoms are not bonded through ionic interactions (Table 4.4). The K—
Br bond-lengths in the three different stoichiometric compounds are tabulated in Table 4.5. The
total DOS function shows insulating nature of this compound.
Table 4.3: Intra-molecular bond-angles and bond-lengths of bromine atoms in different systems.
Material Space group Bond-angles (deg.) Bond-lengths (Å)
Br2 liquid ------- Br−Br 2.28
KBr3
P-3c1
(15 GPa)
Br1−Br2−Br2
179.47
Br1−Br2
Br2−Br2
2.90
2.51
Pnma
(4 GPa)
Br1−Br2−Br3
178.39
Br1−Br2
Br2−Br3
2.64
2.49
KBr5
P21
(16 GPa)
Br2−Br5−Br4
Br5−Br4−Br1
Br4−Br1−Br3
176.79
115.98
164.15
Br4−Br5
Br2−Br5
Br1−Br3
Br4−Br1
2.55
2.52
2.40
2.64

Chapter 4: Synthesis of unconventional stoichiometric compounds in the K−Br
system at high pressures
110
Table 4.4: Details of most probable compositions and their structures in the K− Br system along
with corresponding Bader charges (|e|) and electronic band gaps (Eg) in electron-volts (eV).
Compound Lattice parameters ( Å & ⁰ ) Atomic coordinates
Bader
Charge, |e| Theory P
(GPa)
Experimental P
(GPa)
KBr
(B2 phase)
a = 3.8339 4.0 K 1a 0.0000; 0.0000; 0.0000
Br 1b 0.5000; 0.5000; 0.5000
K: +0.80
Br:: −0.80
KBr3 (Pnma)
a = 9.3592
b = 5.7661
c = 8.4534
4.0 a = 9.339(3)
b = 5.712(1)
c = 8.309(1)
3.2 K1 4c 0.1687; 0.2500; 0.5281
Br1 4c 0.3428; 0.2500; 0.8463
Br2 4c 0.1243; 0.2500; 0.0445
Br3 4c 0.4233; 0.2500; 0.2625
K : +0.82
Br1 : −0.47
Br2 : −0.04
Br3 : −0.31
Eg: 2.01
KBr3 (Pm-3n)
a = 5.5332 16.0 K 2a 0.0000; 0.0000; 0.0000
Br 6c 0.2500; 0.0000; 0.5000
K : +0.74
Br : −0.24
Eg: 3.50
KBr3 (P-3C1)
a = 7.8357
b = 9.6237
γ = 120 ⁰
16.0 a = 7.838(1)
b = 9.841(2)
γ = 120 ⁰
15.4 K1 2b 0.0000; 0.0000; 0.0000
K2 4d 0.3333; 0.6666; 0.3223
Br1 6f 0.2463; 0.0000; 0.2500
Br2 12g 0.3488; 0.4223; 0.0753
K1 : +0.76
K2 : +0.75
Br1 : −0.41
Br2 : −0.17
Eg: 0.19

Chapter 4: Synthesis of unconventional stoichiometric compounds in the K−Br
system at high pressures
111
KBr5 (P21) a = 5.5564
b = 6.6484
c = 7.9628
β = 104.66 ⁰
12.0 a = 5.884(1)
b = 6.927(1)
c = 8.401(1)
β = 123.92 ⁰ (1)
12.0 K 2a 0.6977; 0.5012; 0.3788
Br1 2a 0.1552; 0.1931; -0.065
Br2 2a 0.1829; 0.3104; 0.3178
Br3 2a 0.7613; 0.3085; 0.7586
Br4 2a 0.6322; 0.1585; 0.0969
Br5 2a 0.2721; 0.4928; 0.6044
K : +0.78
Br1 : −0.02
Br2 : −0.31
Br3 : −0.20
Br4 : −0.17
Br5 : −0.07
Eg: 1.46
Br2 (Cmca)
a = 6.0946
b = 3.8610
c = 8.3080
8.0 Br 8f 0.0000; 0.8303; 0.3787

Chapter 4: Synthesis of unconventional stoichiometric compounds in the K−Br
system at high pressures
112
Table 4.5: K—Br bond-lengths in different compounds.
Material Space group
Pressure
(GPa)
Bond-lengths (Å)
KBr3 P-3c1
15.0 K−Br1
K−Br2
K−Br2
3.08
3.09
3.14
KBr3 Pnma
4.0 K−Br1
K−Br2
K−Br3
3.14
3.47
3.27
KBr5 P21
16.0 K−Br1
K−Br2
K−Br3
K−Br4
K−Br5
3.09
3.05
3.22
3.15
3.24
The monoclinic KBr5 compound has V-shaped pentabromide (Br5) units. All Br−Br
distances in the pentabromide unit are significantly larger than the distances in the liquid
bromine (Table 4.3). The Bader charge analysis shows a charge transfer from potassium atom to
the pentabromide unit. Therefore potassium (K+) and pentabromide unit (Br5−) mainly interact
through ionic interactions whereas the bromine atoms in pentabromide unit are bonded by
covalent interaction. The insulating nature of this compound is evident from the total DOS
function.

Chapter 4: Synthesis of unconventional stoichiometric compounds in the K−Br
system at high pressures
113
To get further insight into the chemical reaction pathways, laser heating experiments
were carried out using our laboratory based laser heated diamond anvil cell (LHDAC) facility in
the pressure range of 14−20 GPa and temperature of ~ 1500 K with typical temperature
uncertainty of 100 K. Post laser heated samples were investigated by Raman spectroscopy and
x-ray diffraction measurements. Detailed Raman measurements and structural refinements of the
various laser heated spots, showed an irreversible decomposition of KBr5 to a new compound,
say Kx3Bry3 as shown in Fig. 4.9a and 4.9b, rather than to the orthorhombic KBr3 phase (Fig.
4.3a) as the Raman spectra was distinctly different. Interestingly, a large pressure drop (~ 3GPa
in the 18 GPa run) was observed in all the laser heating experiments. This reconfirms the
formation of a low density monoclinic KBr5 compound at room temperature (Fig. 4.8). For
compound Kx3Bry3, the trigonal KBr3 structure gives an extremely good fit to the x-ray
diffraction pattern as shown in Fig. 4.9b. Similar structure has been recently reported in KCl3
between 20−40 GPa [2].
a)

Chapter 4: Synthesis of unconventional stoichiometric compounds in the K−Br
system at high pressures
114
b)
Fig. 4.9: Structural and vibrational properties of the newly synthesized trigonal
KBr3 (SG: P-3C1) compound. (a) Experimental and theoretical Raman spectrum,
(b) Le Bail fit to ADXRD data at 15 GPa.
Calculated PV-EOS and lattice parameters are in good agreement with the experimental
results (Figs. 4.10a, 4.10b and Table 4.6). Even though the calculated Raman spectrum shows
fairly good match with the experimental results, this phase has two small imaginary frequencies
at zone centre indicating the dynamical instability of the structure. However, a good agreement
between experimental and theoretical results prompted us to speculate that the trigonal phase
could be an entropically stabilized phase, as the experiments were performed at finite
temperatures whereas calculations were done at zero Kelvin temperature.

Chapter 4: Synthesis of unconventional stoichiometric compounds in the K−Br
system at high pressures
115
a)
b)
Fig. 4.10: (a) Experimental (filled symbols) and theoretical (lines) equations of
state of trigonal KBr3 (SG: P-3C1), (b) pressure variation of theoretical (lines)
and experimental (symbols) lattice parameters of trigonal KBr3 (SG: P-3C1).

Chapter 4: Synthesis of unconventional stoichiometric compounds in the K−Br
system at high pressures
116
Table 4.6: Experimental and theoretical unit cell volume (V0), bulk modulus (B0) and derivative
of bulk modulus (B0’) obtained by fitting the Birch-Murnaghan equation of state to the PV data
of KBr3 and KBr5.
Material Space
Group
V0
in Å3
B0
in GPa
B0’ V0
in Å3
B0
in GPa
B0’
Experiment Theory
KBr3 Pnma 534.37 11.8 4.0 574.09 11.1 4.0
P-3c1 770.73 15.5 4.55 764.47 14.4 4.33
KBr5 P21 417.68 11.2 4.58 418.35 13.8 3.65
The trigonal KBr3 has loosely formed Br3 units. Table 4.3 gives the Bader charges on
potassium and bromine atoms. Fig. 4.11a and 4.11b depicts the crystal structures of KBr3 (both
in the orthorhombic and trigonal phase) and KBr5 along with the enthalpy curve illustrating the
structural stability of various phases of KBr3.
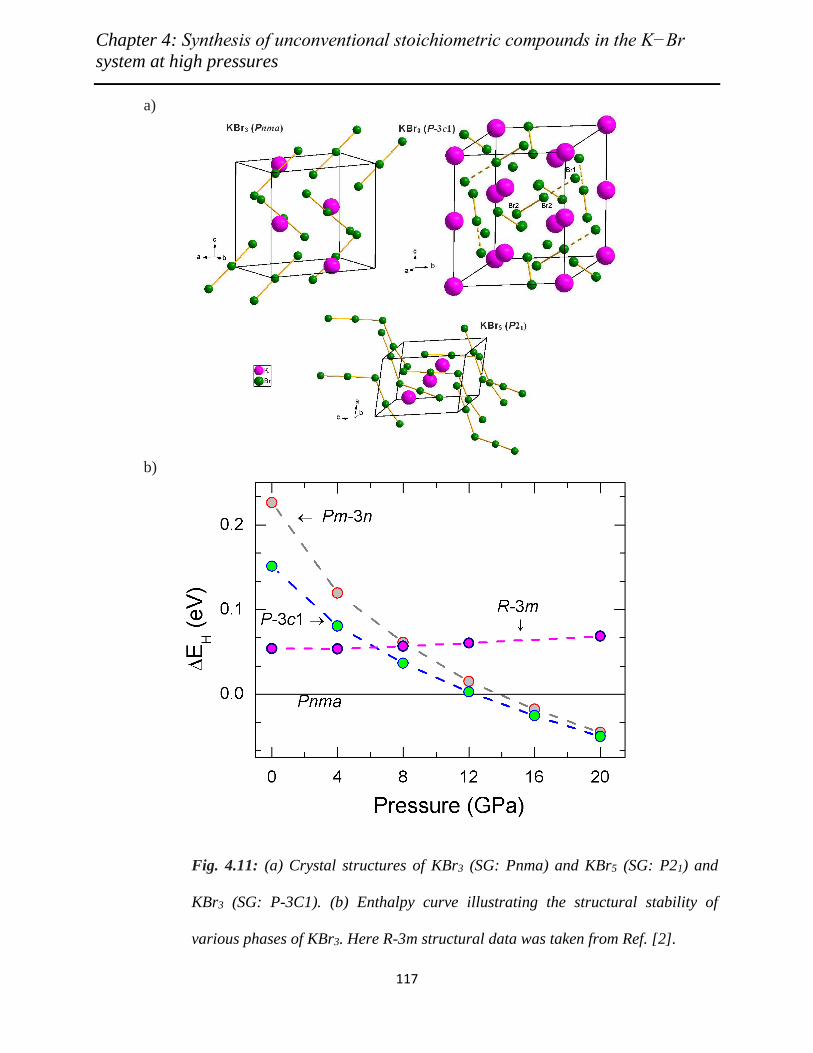
Chapter 4: Synthesis of unconventional stoichiometric compounds in the K−Br
system at high pressures
117
a)
b)
Fig. 4.11: (a) Crystal structures of KBr3 (SG: Pnma) and KBr5 (SG: P21) and
KBr3 (SG: P-3C1). (b) Enthalpy curve illustrating the structural stability of
various phases of KBr3. Here R-3m structural data was taken from Ref. [2].

Chapter 4: Synthesis of unconventional stoichiometric compounds in the K−Br
system at high pressures
118
The important aspect of this work is that both KBr3 and KBr5 form at low pressures and
room temperature in contrast to the compounds formed in the Na-Cl and K-Cl systems where
much higher pressure and higher temperature are needed. KBr and Br2 react only after B1 to B2
phase transition. Thus it appears that the B2 phase plays a significant role in this reaction. This
implies that the experimental retrieval of AX3 (A = alkali metals, X = halogens) stoichiometric
compounds at ambient pressure would be possible only for those alkali halides which exist either
in the B2 phase at ambient pressure or whose B2 to B1 hysteresis limit extend to ambient
pressure. This finding deposes the earlier belief of larger cation and anion radii requirement for
the formation of alkali polyhalides [30]. The proposition is well supported by the fact that KI3,
CsBr3, CsI3 and RbI3 exist at ambient conditions and also by the decomposition of NaCl3, KCl3
and KBr3 below 20, 2.0 and 1.0 GPa respectively. This may provide an impetus to the current
search for alkali polyhydrides since alkali hydrides also show B1 to B2 phase transition at high
pressures [31, 32].
4.3 Conclusions
This work reports the synthesis of two new stoichiometric compounds, viz., KBr3 and
KBr5 at high pressures in the K-Br system. Formation of these compounds were detected and
confirmed by Raman spectroscopy and x-ray diffraction measurements. Compositions and
related crystal structures were solved by first-principles structural search method. The most
unusual feature of monoclinic KBr5 formation is an abnormal pressure increase in the sample
chamber. Underlying chemical reaction in KBr5 formation proceeds very slowly in comparison
to the orthorhombic KBr3 formation reaction. On heating, the monoclinic KBr5 decomposes into
a trigonal KBr3 and Br2.

Chapter 4: Synthesis of unconventional stoichiometric compounds in the K−Br
system at high pressures
119
References
[1] W. Zhang, A. R. Oganov, A. F. Goncharov, Q. Zhu, S. E.Boulfelfel, A. O. Lyakhov, E.
Stavrou, M. Somayazulu, V. B. Prakapenka and Z. Konopkova, Science, 342, 1502
(2013).
[2] W. Zhang, A. R. Oganov, Q. Zhu, S. S. Lobanov, E. Stavrou and A. F. Goncharov, Sci.
Rep., 6, 26265 (2016).
[3] C. Pépin, P. Loubeyre, F. Occelli and P. Dumas, Proc. Nat. Acad. Sci., 112, 7672 (2015).
[4] P. Baettig and E. Zurek, Phys. Rev. Latt. 106, 237002 (2011).
[5] A. Dewaele, A. B. Belonoshko, G. Garbarino, F. Occelli, P. Bouvier, M. Hanfland and
M. Mezouar, Phys. Rev. B, 85, 214105 (2012).
[6] K. K. Pandey, H. K. Poswal, A. K. Mishra, A. Dwivedi, R. Vasanthi, N. Garg and S. M.
Sharma, Pramana J. Physics , 80, 607 (2013).
[7] A. Lausi, M. Polentarutti, S. Onesti, J.R. Plaisier, E. Busetto, G. Bais, L. Barba, A.
Cassetta, G. Campi, D. Lamba, A. Pifferi, S. C. Mande, D. D. Sarma, S. M. Sharma and
G. Paolucci, Eur. Phys. J. Plus, 43,130 (2015).
[8] A. P. Hammersley, S. O. Svensson, M. Hanfland, A. N. Fitch and D. Hausermann, High
Press. Res., 14, 235 (1996).
[9] A. C. Larson and R. B. Von Dreele, Los Alamos National Laboratory Report LUAR, 86,
748 (1994).
[10] N. N. Patel, S. Meenakshi and S.M. Sharma, AIP Conf. Proc., 1591, 664 (2014).
[11] A. R. Oganov and C. W. Glass, J. Chem. Phys., 124, 244704 (2006).
[12] A. R. Oganov, A. O. Lyakhov and M. Valle, Acc. Chem. Res., 44, 227 (2011).
Chapter 4: Synthesis of unconventional stoichiometric compounds in the K−Br
system at high pressures
120
[13] A. O. Lyakhov, A. R. Oganov, H. T. Stokes and Q. Zhu, Comput. Phys. Commun., 184,
1172 (2013).
[14] G. Kresse and J. Furthmuller, J. Comput. Mater. Sci. 6, 15 (1996); P. E. Blöchl, Phys.
Rev. B, 50, 17953 (1994).
[15] G. Kresse, and D. Joubert, Phys. Rev. B, 59, 1758 (1999).
[16] G. Kresse and H. Hafner, J. Phys.: Condens. Matter , 6, 8245 (1994).
[17] J. P. Perdew, K. Burke and M. Ernzerhof, Phys. Rev. Lett., 77, 3865 (1996).
[18] R. F. W. Bader, (Oxford Uni. Press, Oxford, 1990).
[19] A. D. Becke and K. E. Edgecombe, J. Phys. Chem., 92, 5397 (1990).
[20] R. Dronskowski and P. E. Blochl, J. Phys. Chem., 97, 8617 (1990).
[21] V. L. Deringer, A. L. Tchougréeff, R. Dronskowski, J. Phys. Chem. A, 115, 5461 (2011).
[22] S. Maintz, V. L. Deringer, A. L. Tchougréeff and R. Dronskowski, J. Comput. Chem., 34, 2557
(2013).
[23] P. Giannozzi, et al, J. Phys.: Condens. Matter, 21, 395502 (2009).
[24] J. P. Perdew and A. Zunger, Phys. Rev. B, 5048, 23 (1981).
[25] A. Kokalj, Comp. Mater. Sci., 28, 155 (2003).
[26] T. Kume, T. Hiraoka, Y. Ohya, S. Sasaki and H. Shimizu, Phys. Rev. Lett. , 94, 065506
(2005).
[27] A. J. Melveger, J. W. Brasch and E. R. Lippincott, Mat. Res. Bull., 4, 515 (1969).
[28] D. Errandoneaa, Y. Meng, M. Somayazulu and D. Hausermann, Physica B, 355, 116
(2005).
[29] R. M. Bozorth and L. Pauling, J. Am. Chem. Soc., 47,1561 (1925).
[30] G. L. Clark, Proc. Natl. Acad. Sci., 9, 117 (1923).
[31] S. J. Duclos, Y.K. Vohra and A. L. Ruoff, Phys. Rev. B, 36, 7664 (1987).

Chapter 4: Synthesis of unconventional stoichiometric compounds in the K−Br
system at high pressures
121
[32] H. D. Hochheimer, K. Strossner, W. Honle, B. Baranowski and F. Filipek, Z. Phys.
Chem., 143, 139 (1985).

Chapter 5: Pressure induced polymorphism in hypervalent CsI3
122
Chapter 5
Pressure Induced Polymorphism in Hypervalent CsI3
Alkali halides serve as the simplest and model ionic solid for both static and dynamic
high-pressure investigations. They exhibit a wide variety of phenomena like structural phase
transition, metallization, superconductivity etc., when subjected to compression and hence have
been extensively investigated, both experimentally and theoretically, for their high pressure
behaviour. Interest in the alkali halide system has been rekindled by the recent studies which
have reported the formation of low symmetry new unconventional stoichiometric compounds
with unusual bonding and electronic properties like NaCl3, Na3Cl, KCl3, KBr3, KBr5 etc., by
combining theoretical predictions and diamond anvil cell based high pressure experiments [1-3].
Among the alkali halides, cesium iodide solution is able to dissolve iodine, bromine or chlorine
and produce crystals whose chemical analysis could be expressed by the empirical formulas CsI3,
CsIBr2, CsBrI2, CsICl2, CsIBrCl etc [4]. Furthermore, CsI3 and CsIBr2 have been known to adopt
an orthorhombic (SG: Pnma) structure under ambient conditions which is the same structure as
that of alkali trihalides observed in the Na-Cl and K-Br systems, as described in Chapter 4 [1,
3]. It may also be noted that NaCl3 is stabilized both in orthorhombic (SG: Pnma) and cubic (SG:
Pm-3n) phase in the Na-Cl system; whereas KCl3 is stabilized both in trigonal (SG: P-3c1) and
cubic (SG: Pm-3n) phase in the K-Cl system and KBr3 is stabilized both in orthorhombic (SG:

Chapter 5: Pressure induced polymorphism in hypervalent CsI3
123
Pnma) and trigonal (SG: P-3c1) phase in the K-Br system. Table 5.1 summarizes the pressure
range of phase stability of the various alkali trihalides.
Table 5.1: Summary of the pressure range of phase stability of the various alkali
trihalides
Material Pressure range of stability
Orthorhombic
(SG: Pnma)
phase (GPa)
Trigonal (SG:
P-3c1) phase
(GPa)
Cubic (SG:
Pm-3n)
phase (GPa)
NaCl3 [1] 20 – 48 ------ > 48
KCl3 [2] ------ 8 – 20 > 20
KBr3 [3] 1 – 6 14 – 20 ------
As evident from Table 5.1, the absence of trigonal phase in NaCl3, orthorhombic phase in KCl3
and cubic phase in KBr3 makes it difficult to arrive at a systematics for the high pressure
structural transition sequence in alkali trihalide systems. Very recently, theoretical calculations by
Wei et al have predicted a Pm-3n phase for CsI3 under high pressure wherein endless linear chain
type structure, due to the hypervalence phenomenon of iodine, is reported [5]. Furthermore, their
calculations have also revealed a metallic phase for the Pm-3n phase of CsI3. In the light of the
above discussion, experimental high pressure investigations on CsI3 could shed more light on
understanding its structural evolution under compression and give better insight in the search for
alkali polyhalides.
With this motivation high pressure structural, vibrational and electrical transport
investigations on CsI3 was carried out at high pressure and room temperature. Existence of high

Chapter 5: Pressure induced polymorphism in hypervalent CsI3
124
purity stable single phase CsI3 at ambient condition justifies our preference of CsI3 over other
trihalides. In addition, the recent prediction of superconductivity at very low pressure ~ 10 GPa
in the predicted cubic phase of CsI3 has further encouraged us to investigate the high pressure
behaviour of CsI3 [5].
In the present study the high pressure behaviour of CsI3 at ambient temperature has been
investigated through synchrotron based ADXRD up to 29 GPa, Raman spectroscopy up to 25
GPa and Bridgman anvil apparatus based electrical resistance measurements up to 8 GPa to look
for the possibility of structural or electronic transition and any possible metallization under
compression.
5.1 Structural Details
The structure of CsI3 consists of Cs+ and [I3]- ions [6-8]. The I3
- anion belongs to the class
of hypervalent compounds which violate the Lewis octet rule [9, 10]. It has a linear geometric
structure wherein the central iodine atom shares two electrons with two adjacent iodine atoms by
forming a three-centre four-electron (3c-4e) bond and it gets one electron from cesium atom to
keep the other two iodine atoms together [11]. In terms of the molecular orbitals, the 3c-4e
bond as indicated in Fig. 5.1a can be described by a set of three molecular orbitals (MOs)
derived from colinear p-orbitals on each iodine atom and the two lower-energy MOs (bonding
and non bonding) are occupied by two electrons each. The structure of CsI3 was proposed to be
based on the simple orthorhombic lattice with space group Pnma as shown in Fig. 5.1b [12, 13].
Interestingly, similar crystal structures with space group Pnma have been reported for NaCl3 and
KBr3 under non ambient pressure and temperature conditions [1, 3].

Chapter 5: Pressure induced polymorphism in hypervalent CsI3
125
a) b)
c) d)
Fig. 5.1: a) Molecular orbital representation of 3c-4e bond in I3- , Crystal
structure of b) orthorhombic (SG: Pnma), c) trigonal (SG: P-3c1) and d) cubic
(SG: Pm-3n) CsI3.

Chapter 5: Pressure induced polymorphism in hypervalent CsI3
126
5.2 Experimental Method
5.2.1 Sample characterization
Polycrystalline CsI3 of purity (99.9%) was procured commercially from Sigma Aldrich.
The sample was characterized using x-ray diffraction. The cell constants and atomic coordinates
obtained by Rietveld refinement of the x-ray powder diffraction data confirmed it to be an
orthorhombic (SG: Pnma, Z = 4) structure with lattice parameters (a = 11.0837(7) Å, b =
6.8443(3) Å, c = 10.0262(6) Å) in good agreement with the literature values [12, 13]. The
observed Raman spectrum at ambient condition was consistent with the spectra reported earlier
in the literature and the Raman frequencies were found to match well with the reported values
[14].
5.2.2 X-ray diffraction
High pressure ADXRD measurements at room temperature were performed on powdered
CsI3 up to 29 GPa on the Xpress beamline at Elettra synchrotron radiation source, Trieste, Italy
[15]. A modified Mao-Bell type DAC with diamonds of culet size 400 m was used with ruby as
the internal pressure calibrant. Silicone oil was used as the PTM. It may be noted that 4:1
methanol- ethanol mixture as well as glycerol were tried as the PTM. However the sample was
found to dissolve in these two media which led us to select silicone oil as the PTM. The sample
chamber was a 150 µm diameter hole drilled in a tungsten gasket of starting thickness 250 µm
which was pre-indented to a thickness of 50 µm. Pressure measurement inside the sample
chamber was carried out using online ruby fluorescence set up installed at the Xpress beamline
[15]. ADXRD diffraction patterns at various pressures were collected using an image plate area

Chapter 5: Pressure induced polymorphism in hypervalent CsI3
127
detector (MarResearch) employing x-ray wavelength of 0.5007 Å/0.4957Å. The x-ray beam size
was constrained using a circular pin hole 30 μm in diameter, which eliminated the diffraction
lines from the gasket. The sample to image plate distance was calibrated using LaB6 and CeO2 as
standards. The x-ray data was collected at small pressure increment steps with a typical exposure
time of about 10 minutes. The scanned two-dimensional diffraction images were corrected for
image plate tilt and converted to intensity vs 2 profile through radial integration using FIT2D
software [16]. The lattice parameters of the sample were determined by carrying out full profile
Rietveld refinement using GSAS [17]. The parameters refined included the overall scaling factor,
Chebyshev polynomial background, lattice constants, Pseudo-Voigt profile function parameters,
atomic fractional coordinates and spherical harmonics correction. Multi-phase refinement was
carried out and the profile was fitted with the Pseudo-Voigt peak shape with the background
fitted by linear interpolation of selected set of points. The fitting procedure was iterative and was
terminated on attaining an acceptable weighted R factor or goodness of fit.
5.2.3 Raman measurements
High pressure Raman investigations up to 25 GPa were carried out on polycrystalline
CsI3 using a modified Mao-Bell type DAC and a micro Raman system having a resolution of
better than 2 cm-1 using a backscattering geometry. Raman signal excited using a 532 nm DPSS
laser (Ventus, Laser Quantum), was collected using Jobin Yvon T64000 triple stage Raman
spectrograph (with 1800 line grating) equipped with a Peltier cooled CCD detector (Synapse).
The sample sensitivity to laser intensity was checked by collecting the ambient Raman spectra at
various laser powers as shown in Fig. 5.2, which clearly indicate that the sample remains
unaffected by the laser power in the present measurements. The sample loading procedure for

Chapter 5: Pressure induced polymorphism in hypervalent CsI3
128
these measurements was similar to the one described above for the XRD measurements. Silicone
oil was used as the pressure transmitting medium and pressure calibration was carried out using
ruby fluorescence technique. The Raman spectra for CsI3 were recorded at different pressures
under quasihydrostatic conditions in the entire spectral region of interest (50– 250 cm-1). The
typical laser power and data collection time for the Raman measurements was 4 mW and 10 sec
respectively.
Fig. 5.2: The ambient Raman spectra of CsI3 at various laser powers of the DPSS
laser ( = 532 nm).

Chapter 5: Pressure induced polymorphism in hypervalent CsI3
129
5.2.4 Electrical resistance measurements
High pressure electrical resistance measurements up to 8 GPa was carried out using
opposed Bridgman anvil set-up consisting of a 12 mm face diameter tungsten carbide (WC) anvil
pair [18]. A pair of pyrophyllite gasket of thickness 200 μm each with a central hole 3 mm in
diameter was used to contain the sample. Bismuth was used for the pressure calibration along
with steatite as the PTM. Stainless steel wire of 60 µm diameter was used as the leads for the
four probe electrical resistance measurements. A well compacted sample pellet was prepared in
a pellet making die by application of 2 ton load. Small rectangular shaped sample of approximate
dimension 2 mm × 1.5 mm × 0.1 mm was then cut and used for the four probe electrical
resistance measurements. Sample was placed directly in contact with the four electrical leads.
Thin mylar sheets protected the sample from direct contact with talc and also ensured good
electrical contact by preventing talc from entering the sample and electrical leads. A constant
current was passed through the two outer leads by a Keithley sourcemeter and the voltage drop
across the two inner leads was measured, using a Keithley nanovoltmeter, at each value of
pressure with two minutes of pressure soaking time.
5.3 Results and Discussion
5.3.1 High pressure x-ray diffraction
The evolution of diffraction pattern of CsI3 during pressure increase is depicted in Fig.
5.3. The x-ray patterns could be indexed to the ambient orthorhombic (SG: Pnma) phase up to
1.3 GPa. On further pressure increase, new diffraction peaks are seen to emerge along with those
of the ambient orthorhombic phase indicating the onset of a structural phase transition above 1.3
GPa. On further increase of pressure, the intensity of the diffraction peaks corresponding to the

Chapter 5: Pressure induced polymorphism in hypervalent CsI3
130
Pnma phase reduces and the intensity of the new peaks is seen to build up. The new diffraction
peaks could be assigned to a trigonal (SG: P-3c1) phase by employing Crysfire and Check Cell
software [19-21]. The ambient and the trigonal phase are seen to coexist up to a pressure of about
10 GPa. Interestingly, this trigonal structure is similar to the structure of KBr3 and KCl3 [2, 3].
Fig 5.3: Structural evolution of ADXRD pattern of CsI3 with pressure. The arrows
indicate the new peaks.
On further pressurization, CsI3 is found to remain in the trigonal phase till 22.6 GPa. Beyond this
pressure, the diffraction peaks associated with the trigonal phase with Miller indices (100), (002),

Chapter 5: Pressure induced polymorphism in hypervalent CsI3
131
(10-2), (110), (111), (200), (112) etc., are seen to disappear. The disappearance of these
diffraction peaks indicate yet another structural phase transition. This new phase could be
indexed to a cubic (SG: Pm-3n) structure and it remains stable up to the highest pressure of 29
GPa achieved in the present study.
The multiphase Rietveld refinement of all the diffraction patterns was carried out to
extract information on the structural evolution using GSAS software. A representative Rietveld
refinement pattern for the ambient orthorhombic (SG: Pnma) phase collected at 0.9 GPa is
shown in Fig. 5.4. The Rietveld refined patterns of the trigonal and cubic phase are depicted in
Figs. 5.5 and 5.6 respectively. The unit cell parameters and the atomic coordinates extracted for
the different phases are tabulated in Table 5.2. Figure 5.1c and 5.1d show the crystal structure of
CsI3 in the trigonal (SG: P-3c1) and cubic (SG: Pm-3n) phase.
Fig. 5.4: Rietveld refined ADXRD pattern of orthorhombic (SG: Pnma) CsI3 at
0.9 GPa. The Rp and wRp factors of the fit are 3.8 and 5.9 %, respectively.

Chapter 5: Pressure induced polymorphism in hypervalent CsI3
132
Fig. 5.5: Rietveld refined ADXRD pattern of trigonal (SG: P-3c1) CsI3 at 12.2
GPa. The Rp and wRp factors of the fit are 3.4 and 5.1 %, respectively.
Fig. 5.6: Rietveld refined ADXRD pattern of cubic (SG: Pm-3n) CsI3 at 26.8 GPa.
The Rp and wRp factors of the fit are 2.8 and 3.9%, respectively.

Chapter 5: Pressure induced polymorphism in hypervalent CsI3
133
Table 5.2: Unit cell parameters and atomic coordinates of CsI3 in the orthorhombic,
trigonal and cubic phase.
CsI3
Phase
Pressure
(GPa)
Unit cell Parameters Atomic coordinates
Lattice
parameter (Å)
γ
x y z
Orthorhombic
(S.G.: Pnma)
0.9
a = 10.9148(6)
b = 6.6755(3)
c = 9.8240(5)
90⁰
Cs 4c 0.8320(5); 0.2500; 0.4672(5)
I1 4c 0.5732(6); 0.2500; 0.7393(6)
I2 4c 0.3804(5); 0.2500; 0.5455(6)
I3 4c 0.1636(6); 0.2500; 0.3535(5)
Trigonal
(S.G.: P-3c1)
12.2
a = 8.7896(4)
c = 10.8780(8)
120⁰
Cs1 2b 0.0000; 0.0000; 0.0000
Cs2 4d 0.3333; 0.6666; 0.8304(14)
I1 6f 0.2405(12); 0.0000; 0.2500
I2 12g 0.3488(6); 0.4294(8); 0.0699(5)
Cubic
(S.G.:Pm-3n)
26.8
a = 5.9046(3)
90⁰
Cs 2a 0.0000; 0.0000; 0.0000
I 6c 0.2500; 0.0000; 0.5000

Chapter 5: Pressure induced polymorphism in hypervalent CsI3
134
During decompression, the cubic to trigonal transition is found to be reversible whereas
the ADXRD pattern of the pressure released sample, as shown in Fig. 5.7, indicates the
coexistence of the trigonal and ambient orthorhombic phase. The variation of volume per
formula unit as a function of pressure for the orthorhombic, trigonal and cubic phase is shown in
Fig. 5.8.
Fig. 5.7: ADXRD pattern in the 2θ range of 2⁰ to 7⁰ for pressure released CsI3
depicting the coexistence of orthorhombic and trigonal phases at ambient
condition.

Chapter 5: Pressure induced polymorphism in hypervalent CsI3
135
Fig. 5.8: Variation of volume per formula unit as a function of pressure for all the
three phases (orthorhombic, trigonal and cubic) of CsI3. Symbols denote the
experimental data points and solid lines denote third order Birch- Murnaghan
equation of state fit to the data. Error bars are within symbols.
It may be noted that the volume at ambient pressure (Vo) employed for the trigonal phase
was obtained by extrapolating the P-V data to ambient pressure. The bulk modulus and its
pressure derivative for the orthorhombic (SG: Pnma) and trigonal (SG: P-3c1) phases were
calculated by a third order Birch–Murnaghan equation of state [22] fit to the P-V data
represented by
P(V) = (3/2)Bo [(Vo/V)7/3 - (Vo/V)5/3] {1 +3/4(B′ – 4)[(Vo/V)2/3 -1]} (5.1)

Chapter 5: Pressure induced polymorphism in hypervalent CsI3
136
where Bo and Vo are the ambient pressure bulk modulus and volume respectively, B′ is the
pressure derivative of bulk modulus and V is the volume at pressure P. The results of the P-V
data fit are tabulated and compared with the analogous compound reported in the K-Br system in
Table 5.3. The bulk modulus for the cubic phase could not be determined because of fewer
experimental data points.
Table 5.3: Unit cell volume (V0 in Å3), bulk modulus (B0 in GPa) and pressure derivative
of bulk modulus (B′) obtained by fitting the third order Birch-Murnaghan equation of
state to the PV data of orthorhombic and trigonal CsI3. The corresponding data for KBr3
[3] are also tabulated for comparison.
CsI3
KBr3 Ref. [3]
Pnma P-3c1 Pnma P-3c1
V0 (Å3)
766.4(16)
1034(6)
534.37
770.73
Bulk modulus B0 (GPa)
5.6(6)
17.7(9)
11.8
15.5
B′
12(2)
3.94(12)
4.0
4.55

Chapter 5: Pressure induced polymorphism in hypervalent CsI3
137
Pressure dependencies of the normalized lattice parameters for the orthorhombic (SG:
Pnma) and trigonal (SG: P-3c1) phases are plotted in Figs. 5.9 and 5.10 respectively. The fitted
linear modulus and their pressure derivatives are summarized in Table 5.4. It is evident from
Table 5.4 that, in the orthorhombic phase, the largest unit cell axis (a- axis) is the least
compressible whereas the smallest unit cell axis (b-axis) is the most compressible.
Fig. 5.9: Variation of normalized lattice parameters of CsI3 in the orthorhombic
(SG: Pnma) phase with pressure. The symbols and solid line denote the
experimental data points and the third order Birch-Murnaghan fit to the
experimental data respectively. Error bars are within symbols.

Chapter 5: Pressure induced polymorphism in hypervalent CsI3
138
Fig. 5.10: Variation of normalized lattice parameters of CsI3 in the trigonal (SG:
P-3c1) phase with pressure. The symbols and solid line denote the experimental
data points and the third order Birch-Murnaghan fit to the experimental data
respectively. Error bars are within symbols.

Chapter 5: Pressure induced polymorphism in hypervalent CsI3
139
Table 5.4: Unit cell parameters (a0, b0, c0 in Å), linear modulus (M0 in GPa) and pressure
derivative of linear modulus (M′) at ambient pressure obtained by fitting the third order Birch-
Murnaghan equation of state to the pressure variation of lattice parameters of orthorhombic and
trigonal CsI3.
CsI3 a0
(Å)
M0a
(GPa)
Ma′ b0
(Å)
M0b
(GPa)
Mb′ c0
(Å)
M0c
(GPa)
Mc′
Pnma
11.111(14)
18(6)
77(36)
6.866(6)
13.7(15)
29(5)
10.045(7)
19.9(17)
24(4)
P-3c1
9.846(16)
57(3)
11.4(3)
9.846(16)
57(3)
11.4(3)
12.32(6)
45(6)
12.8(10)
The layered structure along b-axis explains the high compressibility in this direction and
resultant low linear modulus for b-axis whereas the presence of large number of sigma bonds in
ac-plane explains the low compressibility of a-axis and c-axis. In the trigonal phase, the c-axis is
seen to be little more compressible than the a-axis and b-axis.
5.3.2 High pressure Raman spectroscopy
Figure 5.11 shows the evolution of Raman spectra of CsI3 with pressure. The Raman
spectra of CsI3 at ambient condition, as depicted in Fig. 5.11, is in good agreement with the
reported values [14]. There are five distinct Raman modes observed at 94, 102, 138.7, 149 and

Chapter 5: Pressure induced polymorphism in hypervalent CsI3
140
167.5 cm-1 at ambient condition. The Raman mode at 94 and 102 cm-1 could be attributed to the
symmetrical stretching vibration of the I3- units. The Raman modes at 138.7 and 149 cm-1
correspond to the antisymmetrical stretching vibration of the I3- units.
Fig. 5.11: Pressure evolution of Raman spectra of CsI3. The bars indicate the Raman
modes at ambient conditions.
With increasing pressure, all the Raman mode frequencies show a positive slope with pressure.
Above 1.3 GPa, abrupt changes in the Raman spectra are observed and additional Raman modes
appear at 59.0, 77.0 and 110.3 cm-1. The appearance of new Raman modes above 1.3 GPa
indicate the onset of a phase transition. This new phase has been attributed to the trigonal (SG:

Chapter 5: Pressure induced polymorphism in hypervalent CsI3
141
P-3c1) phase as observed in our present ADXRD measurements. On further increase of pressure,
the highest frequency Raman mode corresponding to the Pnma phase is seen to survive upto 10
GPa along with the Raman modes corresponding to the trigonal phase, confirming coexistence
of both the phases in the pressure range of 1.3 to 10 GPa.
The pressure dependence of mode frequencies is shown in Fig. 5.12. Raman mode
frequencies at ambient pressure and coefficient of their pressure derivatives obtained by linear or
quadratic fit are summarized in Table 5.5. Above 4.0 GPa, a splitting is observed for the Raman
mode at 107 and 118 cm-1. In addition, major intensity redistribution is observed in the overall
Raman spectra. It is evident from Fig. 5.12 that all the Raman modes show a change of slope
above 4.0 GPa. Hence the various attributes around 4.0 GPa such as slope change and mode
splitting indicate yet another phase transition in CsI3. At still higher pressures, the intensities of
all the Raman modes are found to decrease with increasing pressure. Above 13 GPa, the mode at
77 cm-1 is found to soften and a complete loss of Raman intensity is observed above 22.6 GPa
indicating a phase transformation to a Raman inactive phase or amorphization or band gap
closure/collapse. However, based on our ADXRD measurements this transition has been
attributed to the structural phase transition to the cubic (SG: Pm-3n) phase. It may be noted that
this cubic phase in CsI3 has been reported to be a metallic phase by theoretical calculation by
Wei et al [5]. Similar crystal structure has also been reported for NaCl3 [1]. Reappearance of
Raman modes during pressure release reconfirms the reversible nature of observed phase
transition. The pressure released pattern shows Raman modes of both trigonal and ambient
orthorhombic phase corroborating our ADXRD results. The existence of trigonal phase upon
pressure release suggest small energy difference between the trigonal and the orthorhombic
phase.
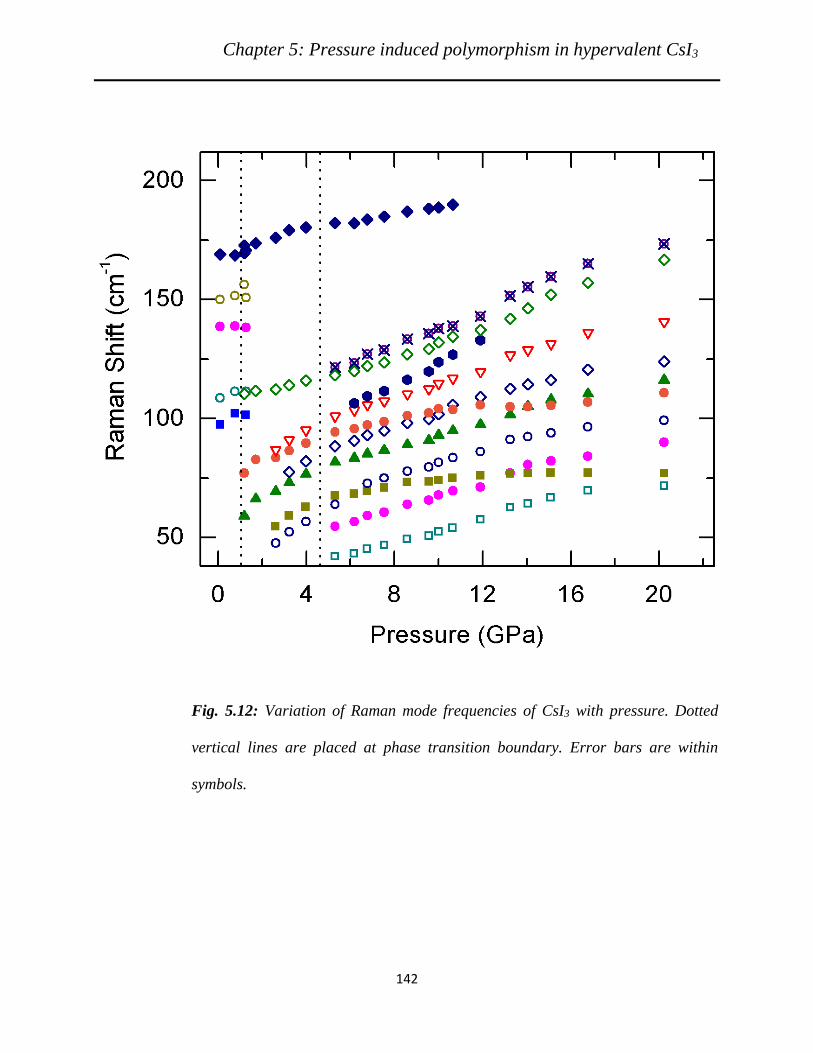
Chapter 5: Pressure induced polymorphism in hypervalent CsI3
142
Fig. 5.12: Variation of Raman mode frequencies of CsI3 with pressure. Dotted
vertical lines are placed at phase transition boundary. Error bars are within
symbols.

Chapter 5: Pressure induced polymorphism in hypervalent CsI3
143
Table 5.5: Raman mode frequencies of CsI3 at ambient pressure (ω0) and their pressure
coefficients for the orthorhombic and trigonal phase obtained by a linear or quadratic fit.
Orthorhombic (SG:Pnma)
phase in the pressure
range of 0.1MPa to 1.3
GPa
Trigonal (SG:P-3c1)
phase in the pressure
range of 1.3 to 4.0 GPa
Trigonal (SG:P-3c1) phase in the
pressure range of 4.0 to 20 GPa
ω (cm-1) at
0.1 MPa
dω0/dp
(cm-1/GPa)
ω (cm-1) at
2.6 GPa
dω0/dp
(cm-1/GPa)
ω (cm-1) at
5.3 GPa
dω0/dp
(cm-1/GPa)
d2 ω0/dp2
(cm-1/GPa2)
94 3.7(24) 47.7 6.5(5) 42 2.3(1) ------
102 2.5(12) 54.7 5.8(7) 54.6 2.5(1) ------
138.7 -0.3(4) 69.3 5.9(8) 63.8 5.5(4) -0.12(1)
149 0.7(12) 73.2 6.1 67.5 2.7(1) -0.081(6)
167.5 1.9(1) 83.5 4.0(7) 81.8 2.5(1) ------
86.9 5.9(5) 88.4 2.6(1) ------
112.2 1.9(3) 94.3 3.8(4) -0.12(2)
101.0 2.9(1) ------
104.4 4.6(2) ------
118.2 3.4(1) ------
121.7 3.7(1) ------
5.3.3 High pressure electrical resistance measurements
Figure 5.13 depicts the variation of electrical resistance with pressure for CsI3. Initially
the resistance decreases with pressure up to 1.6 GPa and beyond this pressure it starts increasing.

Chapter 5: Pressure induced polymorphism in hypervalent CsI3
144
This change in the slope is attributed to the orthorhombic to trigonal phase transition observed in
the XRD and Raman measurements. On further increase of pressure, the resistance continues to
increase with a plateau like region up to 4.5 GPa beyond which there is an exponential increase
in the resistance and around 8 GPa the resistance value exceeds the limit of the measuring
instrument. This sharp increase in the resistance, in the absence of any structural phase transition
as observed in our XRD studies, is indicative of major electronic rearrangements. The changes
observed in the Raman spectra around 4.0 GPa also corroborate the present observation. It is also
noteworthy that a reversible behaviour is observed on pressure release consistent with our
Raman and ADXRD measurements.
Fig. 5.13: Variation of electrical resistance of CsI3 with pressure. Arrows denote
the transition points.

Chapter 5: Pressure induced polymorphism in hypervalent CsI3
145
A significant feature of the present study is the observation of a transition around 1.3 GPa
in the x-ray measurements which is well corroborated by Raman and electrical resistance
measurements. Hence we attribute this to a first order structural transition from an orthorhombic
(SG: Pnma) to a trigonal (SG: P-3c1) phase accompanied with volume discontinuity of 4.5%. It
may also be noted that although Raman spectra show significant changes around 4.0 GPa, our x-
ray diffraction measurements indicate no signature of any structural phase transition around this
pressure. Furthermore, an anomaly is also observed in the electrical resistance measurements.
The P-V data as shown in Fig. 5.8 do not reveal any discontinuity around 4.0 GPa. This leads us
to believe that this transition could be an electronic transition.
In order to better understand the anomaly in the Raman and resistance data we have
analyzed the experimental P-V data for the trigonal phase through the use of the universal
equation of state (UEOS) calculated by fixing Vo to the extrapolated value at ambient pressure
[23]. The UEOS can be represented as follows:
lnH = ln[PX2/3(1-X)] = lnB0 + (1-X) (5.2)
where X=(V/Vo)1/3, P is the pressure, Vo is the ambient volume and is related to Bo
’ by
= 3(Bo’-1)/2 (5.3)
In particular, electronic transition will lead to a deviation from linearity in the UEOS [23,
24]. As observed from the UEOS plot shown in Fig. 5.14, there is indeed a change of slope
corresponding to a pressure of ~ 4.1 GPa ((1-X) ~ 0.06). This pressure is in good agreement
with the pressure at which the Raman modes show splitting and is also consistent with the

Chapter 5: Pressure induced polymorphism in hypervalent CsI3
146
anomaly observed between 4 and 5 GPa in the electrical resistance behaviour with pressure. This
leads us to conclude that CsI3 shows an electronic transition at ~ 4.0 GPa.
Fig. 5.14: Universal equation of state (i.e., lnH vs (1-X) where H= [PX2/3(1-X)]
and X= (V/Vo)1/3 for CsI3 in the trigonal phase. The dotted line denotes the
electronic transition pressure.
It is noteworthy that up to now all the high pressure phases of all alkali trihalide (NaCl3,
KBr3, KCl3) have been reported to decompose on pressure release to ambient conditions [1-3].
The recovery of CsI3 in the metastable high pressure phase (SG: P-3c1) at ambient conditions

Chapter 5: Pressure induced polymorphism in hypervalent CsI3
147
thus makes CsI3 unique in whole alkali polyhalogen system reported so far. This may have
considerable impact on the ongoing search and synthesis of alkali polyhydrides, which are also
considered to be potential candidates to show high temperature superconductivity [25, 26].
5.4 Conclusions
The ambient temperature high pressure behaviour of CsI3, investigated using three
complimentary high pressure techniques viz., ADXRD, Raman and electrical resistance
measurement, indicate three phase transitions up to 29 GPa. The onset of the ambient
orthorhombic to trigonal structural phase transition is found to occur above 1.3 GPa and is
associated with a volume discontinuity of 4.5%. The coexistence of the orthorhombic and
trigonal phase is observed up to 10 GPa. The stability region of the trigonal phase is found to be
up to 22.6 GPa above which the trigonal phase transforms to a cubic phase which remains stable
till the maximum pressure of 29 GPa achieved in this study. The present study has thus revealed
a three phase structural sequence in alkali trihalides, viz., orthorhombic (SG: Pnma) to trigonal
(SG:P-3c1) to finally cubic phase (SG:Pm-3n). In addition to the structural phase transitions, an
electronic transition has also been observed around 4.0 GPa. The results of the present
investigation thus throw light on the structural transition sequence of alkali polyhalides as a
whole and provide useful inputs in understanding and standardizing the pressure effects on the
alkali trihalide systems. The observation of a trigonal phase intermediate between the
orthorhombic and the cubic phase in our study as against the theoretical prediction of a direct
orthorhombic to cubic phase transition at 7.8 GPa will encourage further improvements in
computational models for detailed theoretical investigation of alkali polyhalides.

Chapter 5: Pressure induced polymorphism in hypervalent CsI3
148
References
[1] W. Zhang, A. R. Oganov, A. F. Goncharov, Q. Zhu, S. E.Boulfelfel, A. O. Lyakhov, E.
Stavrou, M. Somayazulu, V. B. Prakapenka and Z. Konopkova, Science, 342, 1502
(2013).
[2] W. Zhang, A. R. Oganov, Q. Zhu, S. S. Lobanov, E. Stavrou and A. F. Goncharov, Sci.
Rep., 6, 26265 (2016).
[3] N. N. Patel, Ashok K. Verma, A. K. Mishra, M. Sunder and S. M. Sharma, Phys. Chem.
Chem. Phys., 19, 7996 (2017).
[4] G.L. Clark, Proc. Nat. Acad. Sci., 9, 117 (1923).
[5] S. Wei, J. Wang, S. Deng, S. Zhang and Q. Li, Sci. Rep., 5,14393 (2015).
[6] G. L. Breneman and R. D. Willett, Acta Cryst. B 25, 1073 (1969).
[7] C. L. Rose and S. Mooney, Acta Cryst., 12, 187 (1959).
[8] J.C. Slater, Acta Cryst. 12, 197 (1959).
[9] J.I. Musher, Angew. Chem. Int. Ed., 8, 54 (1969).
[10] G.N. Lewis, J. Am. Chem. Soc., 38, 262 (1916).
[11] G.C. Pimentel, J. Chem. Phys., 19, 446 (1951).
[12] R.M. Bozorth and L. Pauling, J. Am. Chem. Soc. 47, 1561 (1925).
[13] H.A. Tasman and K.H. Boswijk, Acta Cryst., 8, 59 (1955).
[14] K. Odagi, H. Nakayama and K. Ishii, Bull. Chem. Soc. Jpn., 63, 3277 (1990).
[15] A. Lausi, M. Polentarutti, S. Onesti, J.R. Plaisier, E. Busetto, G. Bais, L. Barba, A.
Cassetta, G. Campi, D. Lamba, A. Pifferi, S. C. Mande, D. D. Sarma, S. M. Sharma and
G. Paolucci, Eur. Phys. J. Plus, 43,130, (2015).
[16] A. P. Hammersley, S. O. Svensson, M. Hanfland, A. N. Fitch and D. Hausermann, High
Press. Res., 14, 235 (1996).
Chapter 5: Pressure induced polymorphism in hypervalent CsI3
149
[17] A. C. Larson and R. B. Von Dreele, Los Alamos National Laboratory Report LUAR ,
86, 748 (1994).
[18] P. W Bridgmann, J. Appl. Phys., 12, 461 (1941).
[19] R. Shirley, The Crysfire 2002 System for Automatic Powder Indexing: User's Manual,
(2002).
[20] P. E.Werner, L. Eriksson and M. Westdahl, J. Appl. Cryst. 18, 367, (1985).
[21] J. Laugier and B. Bochu, CHEKCELL Graphical indexing and spacegroup assignment
helper tool, (2002).
[22] F. Birch, J. Geophys. Res., 83, 1257 (1978).
[23] J.H. Rose, J.R. Smith, F. Guinea and J. Ferrante, Phys. Rev. B 29, 2963 (1984).
[24] S.K. Sikka, Phys. Rev. B 38, 8463 (1988).
[25] P. Baettig and E. Zurek, Phys. Rev. Lett., 106, 237002 (2011).
[26] J. Hooper and E. Zurek, J. Phys. Chem. C, 116, 13322 (2012).

Chapter 6: Summary and future scope
150
Chapter 6
Summary and Future Scope
6.1 Summary
The studies presented in this thesis highlight the significance of laser heating in material
synthesis and investigation of the phase behaviour of materials at high pressure high temperature
(HPHT). The work included can be broadly classified as follows
(1) Development of instrumentation for HPHT laser heating of materials.
(2) Determination of melting curve of some elemental systems and compounds at
HPHT.
(3) HPHT synthesis of some novel and counterintuitive materials.
The instrumentation part of the thesis includes the design, development and
standardization of a single sided laser heated diamond anvil cell (LHDAC) in an off-axis angular
heating geometry incorporating spectroradiometry for temperature determination. Three melting
criteria were implemented in the LHDAC facility, viz., flash heating method, laser speckle
method and temperature plateau method. In addition, a cryo-loader was designed for cryogenic
loading of liquefied argon, as the pressure transmitting medium, in the DAC.
Chapter 6: Summary and future scope
151
Establishment of melting curve of elements and compounds is of considerable
importance in applied physics and geophysics. As a part of this thesis work, the high pressure
melting curve of KBr was determined up to 24 GPa and compared with available literature data.
The first experimental report of high pressure melting curve of Os up to 35 GPa has also been
reported is this thesis. The study was aimed at resolving the discrepancies in melting curve and
melting slope at ambient pressure reported by the various theoretical melting studies. The
experimental melting slope was used for the analytical determination of Grüneisen parameter
(γ(ρ)).
LHDAC is an invaluable tool for HPHT synthesis of new and novel materials. The
feasibility of the LHDAC facility, developed as a part of this thesis work, for material synthesis
has been demonstrated by the HPHT synthesis of GaN by direct reaction of Ga metal with N2 at
9 GPa and 1925 K and the HPHT synthesis of Mo2N at 5 GPa and 1500 K using Mo metal and
N2 as precursors.
In addition, synthesis of two new counter-intuitive stoichiometric compounds, viz., KBr3
and KBr5, in K-Br system is a major outcome of this thesis. A room temperature high pressure
chemical reaction between KBr and Br2 resulted in the formation of an orthorhombic KBr3 (SG:
Pnma) at ~ 2.0 GPa. Further compression led to the formation of a monoclinic KBr5 (SG: P21) at
~ 6.0 GPa. The stoichiometry and crystal structure of this compound was determined using
ADXRD and Raman measurements in conjunction with ab-initio evolutionary structural search.
It may be noted that KBr5 is the first ever compound synthesized in 1:5 stoichiometry in whole
alkali–halogen system. HPHT experiments on KBr5 using LHDAC facility, carried out in
pressure range of 14-20 GPa showed that KBr5 decomposes above 1500 K in to KBr3 and Br2

Chapter 6: Summary and future scope
152
with large drop in sample chamber pressure and KBr3 synthesized in laser heating experiments
was stabilized in trigonal (SG: P-3c1) structure rather than orthorhombic (SG: Pnma) structure.
Ambient temperature high pressure ADXRD, Raman and electrical resistance
measurements were also carried out on the alkali trihalide “CsI3” up to 29, 25 and 8 GPa
respectively. The studies confirmed three phase transitions up to 29 GPa under quasihydrostatic
conditions. The ambient orthorhombic phase was found to transform to a trigonal structural
phase above 1.3 GPa with a volume discontinuity of 4.5%. The stability region of the trigonal
phase was found to be up to 22.6 GPa. At further higher pressure the trigonal phase was found to
transform to a cubic phase which remained stable till the maximum pressure of 29 GPa achieved
in this study. Furthermore, an electronic transition was also observed around 4.0 GPa. The study
has thus revealed a three phase structural sequence in alkali trihalides, viz., orthorhombic (SG:
Pnma) to trigonal (SG:P-3c1) to finally cubic phase (SG:Pm-3n) in CsI3. These results throw
light on the structural transition sequence of alkali polyhalides and provide useful inputs in
understanding the pressure effects on the alkali trihalide systems.
6.2 Future Scope
The work reported in this thesis highlight the importance of HPHT LHDAC facility for
investigation of the phase behaviour of materials and for synthesis of novel materials. Future
extension could include incorporation of double sided heating in present LHDAC facility. This
would minimize the axial temperature gradient in the heated sample. Also, the Gaussian profile
of TEM00 mode of IR laser introduce large radial temperature gradient, which has been
minimized in the present study by defocusing the incident IR laser in the adapted angular

Chapter 6: Summary and future scope
153
geometry. The incorporation of a focal-πshaper to get flat top IR laser profile at the sample
position in 180⁰ heating geometry could also be another desirable extension.
The present work has also shown that a variety of diagnostic techniques are required to
understand the behaviour of materials at non ambient pressure and temperature conditions. An
important aspect would be to couple the LHDAC facility to important diagnostic techniques like
ADXRD at the ECXRD synchrotron beam line at Indus-2, Indore and Raman spectroscopy for in
situ characterization of the synthesized samples. This would also be advantageous for detection
and characterization of unquenchable HPHT phases.
A significant aspect of HPHT research is the investigation of phase behaviour of
interesting materials. The melting curve of the refractory metal “Os” has been experimentally
established for the first time up to 35 GPa. Future work could include the investigation of
melting behaviour of other presently unexplored refractory metals like Iridium (Ir) and Hafnium
(Hf).
Furthermore, material synthesis at HPHT also provides a unique opportunity to study
high pressure chemistry and validation of octet rule at extreme conditions. The access to new
chemical pathways for the synthesis of counter-intuitive compounds in LHDAC would be
beneficial for realization of alkali polyhalides in yet unexplored alkali-halogen systems, like Cs-
Cl, Cs-F, Cs-Br etc.

Appendix A: Diamond anvil cell
154
A. Diamond Anvil Cell
Diamond anvil cell (DAC) is a revolutionary compact device, which can fit into the palm
of one’s hand, capable of generating very high static pressures of a few Mbars in laboratory. It
exploits the fact that diamond is hardest material known to mankind, with a bulk modulus of 440
GPa, to achieve extremely high pressures. The basic principle of the DAC as shown in Fig. A.1
is very simple. The sample placed in a hole drilled in metallic gasket filled with a pressure
transmitting fluid is squeezed between the flat parallel faces of two opposed diamond anvils
(DA) by applying an uniaxial load, which pushes the two opposed anvils together. Generation of
high pressure is based on the principle of massive support.
DAs are made from commercially available jewel cut diamonds by polishing off the tip of
each diamond to generate a flat circular culet. Apart from jewel cut diamond many other custom
made anvil designs, as shown in Fig. A.2, are also used in DAC.
Fig. A.1: Schematic diagram of DAC [1].

Appendix A: Diamond anvil cell
155
Fig. A.2: Various designs of DA used in DAC for high pressure generation [1].
Fig. A.3: Various designs of DAC used for high pressure generation [2].
The variations in the DAC as illustrated Fig. A.3 arise from the different ways in which the
force-generating and the anvil-alignment mechanisms are designed. DAC used for experiments
presented in this thesis is of Mao-Bell design and are shown in Fig. A.4. In this design one

Appendix A: Diamond anvil cell
156
diamond with culet diameter d in mm, is mounted on the piston and another on the cylinder of
the DAC as shown in Fig. A.5. The maximum pressure achieved by DAC for a given culet size is
estimated by the following
Pmax = 12.5/d2 (A1)
For practical purpose P = 0.8Pmax is considered as a safe limit for diamond in high pressure DAC
experiments.
Fig. A.4: Mao-Bell type diamond anvil cells used for studies presented in this thesis.
a) b)
Fig. A.5: Translation and tilt adjustment screws in a) cylinder and b) piston respectively.

Appendix A: Diamond anvil cell
157
Due to the brittle nature of diamond the diamond anvil centering and tilt alignment is a
crucial part of DAC preparation. Hence extreme care has to be taken to align the DA to prevent
their premature failure. Figure A.6a and b shows unaligned DA wherein relative anvil translation
and tilt is more than the experimentally accepted limits. In the case of Mao-Bell DAC as shown
in Fig. A.5, the tilt adjustment screws on the piston are used to adjust the parallelism of DA and
translation screws on the cylinder are used for their lateral alignment. The mechanism for
applying a smoothly varying load is a belleville spring-loaded lever arm with a mechanical
advantage of 5:1 actuated by a screw. This cell can sustain a pressure of ~ 1 Mbar with ordinary
diamond anvils and is capable of generating a pressure of ~ 5 Mbar with bevelled DA [3].
a) b) c)
Fig. A.6: a) Microscopic image of tilt misalignment between two DA. Optical path
difference resulting from the tilt of the two culets result in the observed colour fringes; b)
microscopic image of translation misalignment between the two DA; c) microscopic
image of perfectly aligned DA.
References:
[1] http://sites.coloradocollege.edu/pcervantes/facilities/
[2] https://www.almax-easylab.com/ProductList.aspx?id=10030
[3] R. Dias and I. F. Silvera, Science, 355, 715 (2017).
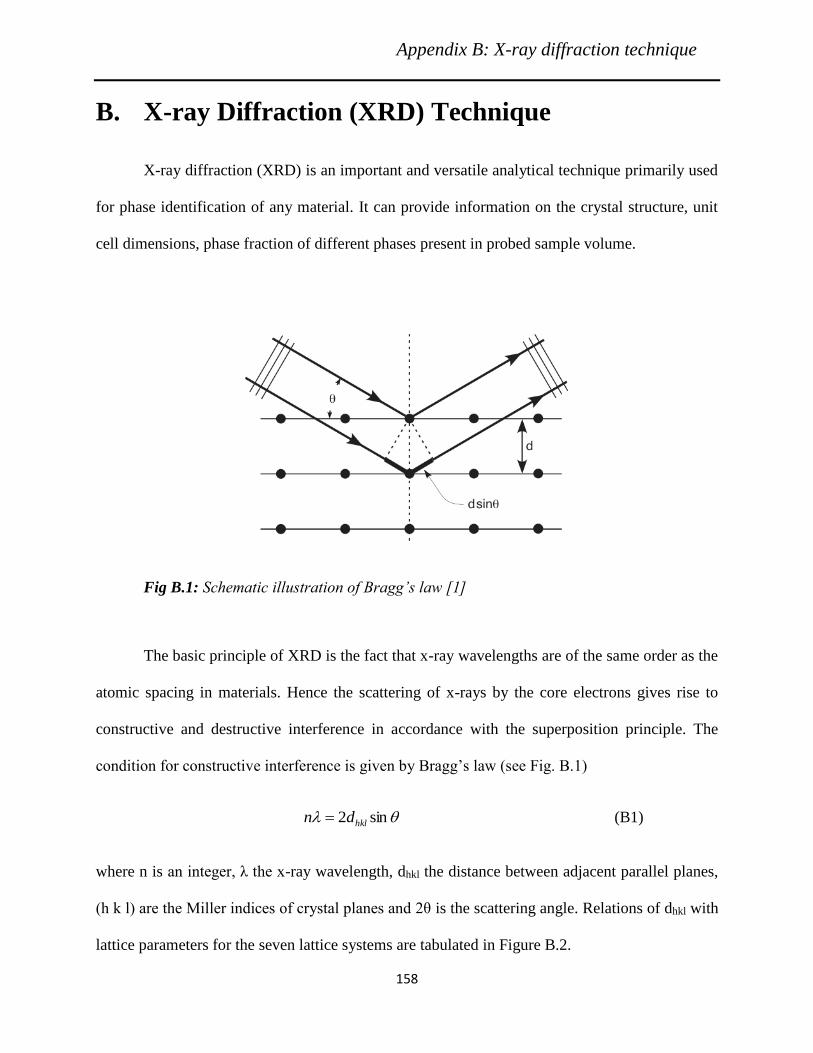
Appendix B: X-ray diffraction technique
158
B. X-ray Diffraction (XRD) Technique
X-ray diffraction (XRD) is an important and versatile analytical technique primarily used
for phase identification of any material. It can provide information on the crystal structure, unit
cell dimensions, phase fraction of different phases present in probed sample volume.
Fig B.1: Schematic illustration of Bragg’s law [1]
The basic principle of XRD is the fact that x-ray wavelengths are of the same order as the
atomic spacing in materials. Hence the scattering of x-rays by the core electrons gives rise to
constructive and destructive interference in accordance with the superposition principle. The
condition for constructive interference is given by Bragg’s law (see Fig. B.1)
sin2 hkldn = (B1)
where n is an integer, λ the x-ray wavelength, dhkl the distance between adjacent parallel planes,
(h k l) are the Miller indices of crystal planes and 2θ is the scattering angle. Relations of dhkl with
lattice parameters for the seven lattice systems are tabulated in Figure B.2.

Appendix B: X-ray diffraction technique
159
Fig. B.2: Relations of dhkl with lattice parameters for seven lattice systems where a, b, c,
α, β and γ are lattice parameters of the crystal [2].
Bragg condition gives only positional information of the diffracted x-ray beam whereas the
intensity of diffracted light is given by Eq. B2 and Eq.B3.
2
hklhkl SI
(B2)
( ) =
++m
j
jjjjhkl lzkyhxifS1
2exp
(B3)
where Shkl and fhkl are structure factor and atomic form factor, xj, yj and zj are fractional
coordinates of jth atom. The structure factor Shkl sums the result of scattering from all the atoms

Appendix B: X-ray diffraction technique
160
in the unit cell to form a diffraction peak from the (hkl) plane of atoms. Thus the intensity of
diffracted light is determined by i) position of atoms in atomic plane, i.e., their fractional
coordinates, and ii) atomic form factors (fhkl) of atoms. fhkl is a function of atomic number (Z)
and increases with increasing Z.
References
[1] https://commons.wikimedia.org/wiki/File:Bragg_diffraction.png
[2] http://www.xtal.iqfr.csic.es/Cristalografia/parte_04-en.html.

Appendix C: Raman spectroscopy
161
C. Raman spectroscopy
Raman spectroscopy is a powerful spectroscopic technique used to observe the
vibrational, rotational and other low energy excitations in materials. A compound’s unique
Raman spectrum arises from its molecular vibrations due to which this technique serves as a
finger print of the molecule. Raman scattering is an inelastic scattering of photons by atom’s
elementary excitations in materials arising from a change in the polarizability. When a beam of
monochromatic light is incident on the sample, photons are absorbed by it and scattered. The
vast majority of photons are scattered elastically resulting in Rayleigh scattering, whereas a small
fraction of light (~ one photon per 106 photons) is scattered inelastically giving rise to Raman
spectrum. The wavelength of the Raman lines are hence different from the incident
monochromatic light. Most of the Raman scattered photons are shifted to longer wavelengths
i.e., ε < ε0, (Stokes shift), but a small portion are shifted to shorter wavelengths i.e., ε > ε0 (anti-
Stokes shift). Stokes lines result when, during light matter interaction, the system excited from
the ground state returns to a higher energy state. The anti Stokes lines, on the other hand, are
observed during the transition of system from excited state to the ground state. In each case, the
incident photon excites an electron into a higher virtual energy level and then the electron decays
back to a lower level, emitting a scattered photon. The relative intensity of Stokes and anti
Stokes lines depend on the number of electrons occupying the high energy states. Figure C.1
shows Raman and Rayleigh scattering in the form of energy level diagram.

Appendix C: Raman spectroscopy
162
Fig. C.1: Energy level diagram depicting Rayleigh, Stokes and anti Stokes Raman
scattering. ν0 is incident photon frequency, energy ε0 = hν0, and Δν is frequency
corresponding to the energy difference between excited and ground state respectively.
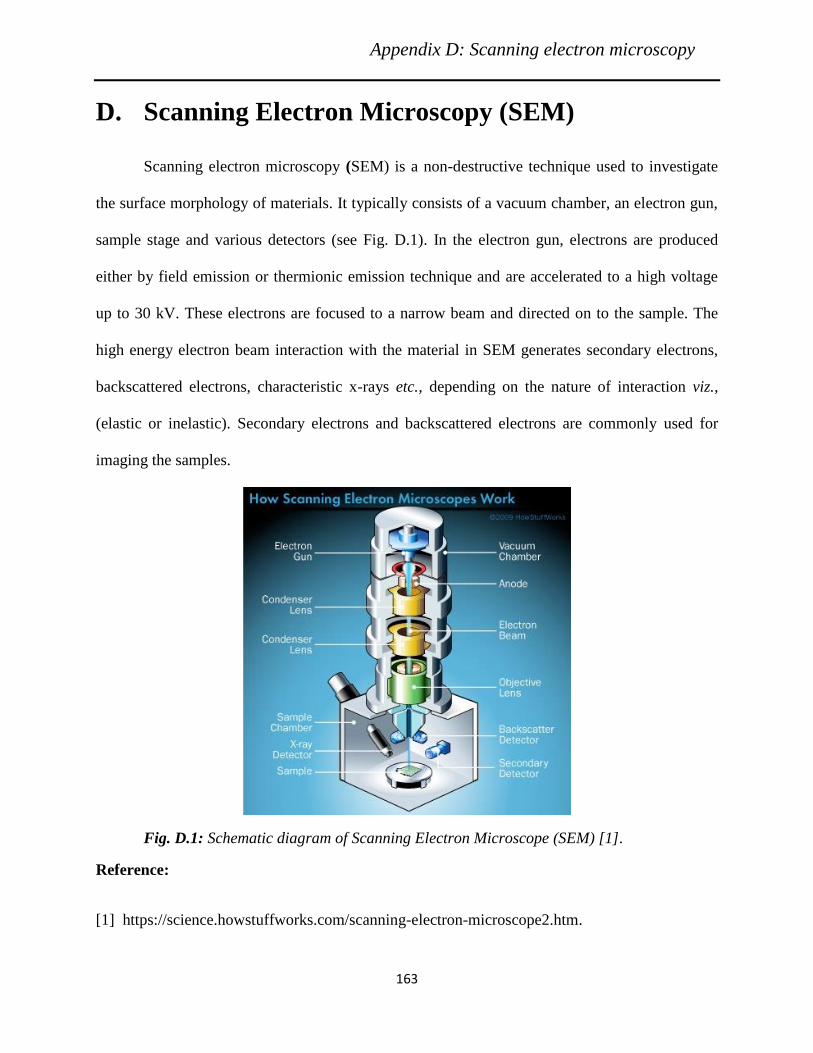
Appendix D: Scanning electron microscopy
163
D. Scanning Electron Microscopy (SEM)
Scanning electron microscopy (SEM) is a non-destructive technique used to investigate
the surface morphology of materials. It typically consists of a vacuum chamber, an electron gun,
sample stage and various detectors (see Fig. D.1). In the electron gun, electrons are produced
either by field emission or thermionic emission technique and are accelerated to a high voltage
up to 30 kV. These electrons are focused to a narrow beam and directed on to the sample. The
high energy electron beam interaction with the material in SEM generates secondary electrons,
backscattered electrons, characteristic x-rays etc., depending on the nature of interaction viz.,
(elastic or inelastic). Secondary electrons and backscattered electrons are commonly used for
imaging the samples.
Fig. D.1: Schematic diagram of Scanning Electron Microscope (SEM) [1].
Reference:
[1] https://science.howstuffworks.com/scanning-electron-microscope2.htm.

Appendix E: Ruby pressure scale
164
E. Ruby Pressure Scale
Ruby gauge is an important and popular gauge for pressure determination in DAC based
high pressure experiments. Compositionally, ruby is 0.05 wt% Cr3+ doped alumina. It has a
strong luminescence doublet peaks R1 and R2 at 694.2 nm and 692.8 nm under ambient
conditions. Energy band U or Y is populated when visible laser is incident on the ruby crystal.
Pumping of these levels populates the metastable states 2T1 and 2E by fast non-radiative decay.
Subsequently, much slower (τ ~ 3 ms) radiative transition from metastable state 2E to ground
state takes place giving rise to R1 and R2 lines.
Fig. E.1: Energy level diagram for fluorescence of Ruby [1].
Initially, ruby pressure gauge was developed by calibrating the wavelength shift of R1
line with pressure against the Decker equation of state for NaCl up to 19.5 GPa [2]. It was found
that the R1 line shifts approximately linearly with pressure, with a coefficient dP/dλ=2.746
Kbar/Å or dλ/dP= 0.364 Å/Kbar. Calibration of ruby scale at higher pressure up to 180 GPa was
Appendix E: Ruby pressure scale
165
subsequently done using shock equation of state data of some metals (like Cu, Mo, Pd and Ag)
[3].
Pressure calibration for quasihydrostatic and hydrostatic experiments can be expressed as
−
+
= 1
24.6941
1904B
BP
(E1)
where P is in GPa and δλ is the wavelength shift of R1 line in nm and B is 7.665 and 5 for
hydrostatic and quasihydrostatic conditions respectively.
References
[1] http://freewiring.today/ruby-laser-with-energy-level-diagram.html
[2] D. L. Decker, J. Appl. Phys., 42, 3239 (1971).
[3] H. K. Mao, P. M. Bell, J. W. Shaner and D. J. Steinberg, J. Appl. Phys., 49, 3276 (1978).

Appendix F: Rietveld refinement
166
F. Rietveld Refinement
The x-ray powder diffraction data analysis consist of three parts viz., (i) conversion of the
azimuthal integration of 2D image plate data to produce a 1D output in 2θ, d-spacing, or q-space
using Fit2D software, (ii) Le Bail fitting of 1D intensity vs 2θ diffraction profile and (iii)
Rietveld refinement of the diffraction profile using GSAS software [1].
The first step of integration of the 2D data necessitates accurate calibration of
experimental geometry such as sample to detector distance, beam centre, detector tilt and
detector rotation angle. Standards (Calibrant) such as cerium oxide (CeO2), lanthanum
hexaboride (LaB6) etc., whose lattice parameters and hence d-spacings are accurately known, are
used to calibrate the above parameters along with x-ray wavelength. The Fit2D software then
interpolates each pixel on the image to a d-spacing and integrates to give 1D diffraction peak
profile [2].
The second step, i.e., Le Bail profile refinement requires the initial guess lattice
parameters and space groups of all solid phases present in the XRD data. In this method, a
polynomial profile describing the background to the diffraction profile is calculated, and this is
refined using a least squares method. Then the individual integrated peak intensities and shapes
are treated as least squares parameters. The peak shapes are modelled as Gaussian, Lorentzian or
Pseudo-Voigt profiles (Pseudo-Voigt peak profile is a convolution of a Gaussian and a
Lorentzian peak). Hk2 is the variance of diffraction peak, which varies with 2θ and is given by
WVU kk ++= tantanH 22
k (F1)

Appendix F: Rietveld refinement
167
Furthermore, the individual Bragg peak positions are obtained through refinement of the unit
cell dimensions i.e., the lattice parameters a, b, and c, and the angles between them viz., α, β, and
γ.
The Le Bail refinement method provides information about the lattice parameters and
peak shape, but does not take into account the atomic position, site occupancies, phase fraction,
thermal effect and preferred orientation of the sample.
In the third step, Rietveld refinement is performed on Le Bail refined data. In this
method, the structure factor and Debye-Waller factors for each atom are considered to calculate
the peak intensities. The principle of Rietveld refinement is to minimize the sum of the
differences of observed and calculated profile (function S) using linear least square method.
2
S
−=
k
c
ko
kkc
YYw (F2)
where wk is the statistical weight, c is an overall scaling factor. Y0 and Yc are observed and
calculated profile respectively.
Reference:
[1] B. H. Toby, J. Appl. Cryst,. 34, 210 (2001).
[2] A P Hammersley, ESRF Internal Report, ESRF98HA01T, FIT2D V9.129 Reference Manual
V3.1 (1998).