high pressure-high temperature phase diagram of ammonia
TRANSCRIPT
HAL Id: hal-00202017https://hal.archives-ouvertes.fr/hal-00202017
Preprint submitted on 4 Jan 2008
HAL is a multi-disciplinary open accessarchive for the deposit and dissemination of sci-entific research documents, whether they are pub-lished or not. The documents may come fromteaching and research institutions in France orabroad, or from public or private research centers.
L’archive ouverte pluridisciplinaire HAL, estdestinée au dépôt et à la diffusion de documentsscientifiques de niveau recherche, publiés ou non,émanant des établissements d’enseignement et derecherche français ou étrangers, des laboratoirespublics ou privés.
High pressure-high temperature phase diagram ofammonia
Sandra Ninet, Frédéric Datchi
To cite this version:Sandra Ninet, Frédéric Datchi. High pressure-high temperature phase diagram of ammonia. 2008.�hal-00202017�
hal-
0020
2017
, ver
sion
1 -
4 J
an 2
008
High pressure-high temperature phase diagram of ammonia
S. Ninet∗ and F. Datchi
Institut de Mineralogie et de Physique des Milieux Condenses,
Departement Physique des Milieux Denses, CNRS UMR 7590,
Universite Pierre et Marie Curie - Paris VI,
4 place Jussieu, 75252 Paris Cedex 05, France.
(Dated: January 7, 2008)
Abstract
The high pressure(P)-high temperature(T) phase diagram of solid ammonia has been investi-
gated using diamond anvil cell and resistive heating techniques. The III-IV transition line has
been determined up to 20 GPa and 500 K both on compression and decompression paths. No
discontinuity is observed at the expected location for the III-IV-V triple point. The melting line
has been determined by visual observations of the fluid-solid equilibrium up to 9 GPa and 900 K.
The experimental data is well fitted by a Simon-Glatzel equation in the covered P-T range. These
transition lines and their extrapolations are compared with reported ab initio calculations.
PACS numbers: 62.50.+p,64.70.Dv,64.70.K,61.50.-f,63.20.-e,64.60.-i
1
I. INTRODUCTION
Giant planets are mainly composed of simple molecular compounds such as H2O, H2, He,
CH4 and NH31. In particular, a layer of mixed ices (NH3, H2O, CH4) has been proposed to
exist in the interior of Uranus and Neptune. In this layer, extreme thermodynamic conditions
are supposed (20<P<300 GPa and 2000<T<5000 K)2 and the knowledge of the properties
of these ”hot” ices are crucial to a good examination of astrophysical data.
Experimental data under high P-T conditions are also very important to validate ab initio
calculations3,4 performed on NH3 and H2O. A very similar phase diagram has been predicted
for these two compounds. In particular, a spectacular superionic phase is predicted at high
pressures and temperatures3. In this phase, the molecular nature of these ices disappears
and hydrogen atoms diffuse in all the N- or O- network. This prediction has stimulated many
recent experimental works on the melting curve of water as the latter is expected to exhibit
a clear kink at the onset of the transition. A change of slope in the melting curve of water
ice has been reported in three different experimental studies, but its location substantially
differ between them: 47 GPa and 1000 K in Ref. 5, 43 GPa and 1500 K in Ref. 6, and
35 GPa and 1040 K in Ref. 7. By contrast, no discontinuity has been observed in another
melting study up to 50 GPa and 1100 K8. Theoretical predictions of the fluid-superionic
solid transition pressure range between 30 and 75 GPa at 2000 K3,4. The exact location
of the superionic phase is important for models of planetary interiors as it determines for
example whether the Neptune and Uranus isentropes cross the superionic phase.
Unlike water, experimental data on ammonia under high static P-T conditions are very
scarce. Experiments in a diamond anvil cell have been so far limited to 373 K9. Several
shock-wave experiments10,11,12,13,14 have reported equation of state and electrical conductiv-
ity data in the range ∼2-65 GPa, 1100-4600 K, but these are restricted to the fluid phase.
New experiments are thus needed to bridge the present gap between static and dynamic
investigations.
The presently accepted phase diagram of ammonia is shown in Fig. 1. Above 4 GPa,
three different phases may be stabilized depending on the temperature. In increasing order
of temperature, these are the ordered, orthorhombic phase IV, the plastic (orientationally
disordered) cubic phase III, and the fluid. The IV-III and III-fluid transition lines have been
determined up to 373 K9,16,17. Evidences for a solid phase transition in NH3 at 14 GPa and
2

14 14
12 12
10 10
8 8
6 6
4 4
2 2
0 0
Pre
ssure
(G
Pa)
350
350
300
300
250
250
200
200
Temperature (K)
Fluid
IIIFCC
IVOrthorhombic
II hcpI
Cubic
VOrthorhombic
FIG. 1: (Color online) Phase diagram of ammonia (NH3). The structure of phase IV as determined
by Loveday et al15 is depicted.
300 K to phase V were initially reported by Gauthier et al. using Raman18 and Brillouin19
spectroscopies. We recently confirmed this transition using single-crystal x-ray diffraction20
and Raman spectroscopy21, but unlike Gauthier et al.’s suggestion of a cubic structure for
the high pressure phase, we found that the latter is isostructural to phase IV (space group
P212121). The transition was detected at 12 and 18 GPa for NH3 and ND3 respectively at
room temperature.
In this paper, we report experimental measurements of the phase diagram of NH3 in the
range [1-20 GPa] and [300-900K]. The III-IV transition line has been determined up to 20
GPa and 500 K in order to detect the influence of the isostructural phase transition. The
melting curve has been determined up to 9 GPa and 905 K. No evidence for the superionic
phase has been observed in this P-T range.
II. EXPERIMENTAL METHODS
Samples of NH3 were cryogenically loaded in membrane diamond anvil cells as described
in Refs. [20,22]. A gold ring between the rhenium gasket and the sample was employed to
prevent any possible chemical reaction between ammonia and rhenium at high temperature.
Pressure was determined with the luminescence of SrB4O7:Sm2+ at high temperature23,24.
3

Ram
an in
tens
ity (
u.a.
)
35003400330032003100Raman Shift (cm
-1)
(b)
(a)III
IV
FIG. 2: Raman spectra of solid NH3 phases IV and III in the ν1-ν3 region. The spectra were
collected at 373 K, 9.7 and 9 GPa. Photographs of polycrystalline samples of phase III (a) and IV
(b) are shown in inset.
A ruby ball was also used below 600 K. The uncertainties on pressure measurements are
typically less than 0.02 GPa at ambient temperature and around 0.15 GPa at 900 K.
Membrane diamond anvil cells (mDAC) made of high-temperature Inconel alloy were
used. With a commercial ring-shaped resistive heater around the mDAC, sample temper-
atures up to 750 K could be obtained. Above 750 K, an internal heater located around
the diamond-gasket assembly is used in addition. These heaters are temperature regulated
within 1 K. During heating, a continuous flow of Ar/H2 reducing gas mixture is directed
onto the mDAC. The temperature of the sample was determined thanks to a K-type ther-
mocouple fixed by ceramic cement on the head of one diamond, and cross-checked with the
temperature determined in situ from the ruby up to 600 K24. With these techniques, a
temperature uncertainty inferior to 5 K is obtained, as validated by previous studies25,26,27.
Measurements of Raman spectra were performed using a T64000 spectrometer in
backscattering geometry. Angular-dispersive x-ray diffraction spectra were collected on the
ID09 station of the ESRF (Grenoble, France).
III. RESULTS AND DISCUSSION
A. III-IV transition line
The transition between the disordered phase III and ordered phase IV has been investi-
gated as a function of pressure and temperature up to 20 GPa and 500 K. The transition
4

20
15
10
5
0
Pre
ssure
(G
Pa)
500450400350300250
Temperature (K)
III
IV
II
V
Fluid
FIG. 3: The III-IV transition line. Our experimental points in compression (dots) and decompres-
sion (green lozenge) are presented along with literature data (crosses: Kume et al.17, diamonds:
Hanson et al.9). Solid lines represent the fits to Simon-Glatzel equations (Eqs. [1,2,3])
pressure has been determined along isotherms during compression and decompression. We
used several criteria to detect the transition: (1) by detecting the pressure discontinuity: a
rapid pressure drop of a few tenth of GPa is observed at the III-IV transition due to the
volume discontinuity (1.5% at 300 K20). The transition pressure is defined as the lower
pressure; (2) by X-ray diffraction: patterns of phase III (cubic) and phase IV (orthorhom-
bic) are easily recognizable; (3) by visual observation: reticulation is observed in phase IV
(birefringent phase), which disappears in phase III (see pictures in Fig. 2); (4) by Raman
spectroscopy: the shape of the ν1 − ν3 band is very different between the two phases; the
modes are broad in the disordered phase III and sharper in the ordered phase IV (Fig. 2).
Our experimental points are presented in Fig. 3 and in Table I. They form two dis-
tinct transition curves corresponding respectively to compression and decompression mea-
surements. These two data sets are well fitted by the following Simon-Glatzel (SG) type
equations28 :
PIII→IV (T ) = 3.9(1) + 3.7(2)
[
(
T
293.15
)3.1(1)
− 1
]
(1)
PIV →III(T ) = 3.3(1) + 4.5(4)
[
(
T
293.15
)2.8(1)
− 1
]
(2)
Taking the average of these two curves as the transition line gives the following SG
5

equation:
PIV ⇄III(T ) = 3.6(2) + 4.1(6)
[
(
T
293.15
)3.0(2)
− 1
]
(3)
The use of the SG equation is usually restricted to the description of melting curves.
We note though that this phenomenological law is valid for any first-order phase transition
satisfying Clausius-Clapeyron’s relation (dP/dT = ∆H/T∆V where ∆H and ∆V are the
enthalpy and volume discontinuities at the transition), provided that ∆H/∆V is a linear
function of pressure29. The III-IV transition is a first-order transition between a plastic phase
(III) where the H atoms are highly disordered (they may occupy as much as 192 positions30)
and an ordered phase (IV) where H atoms have definite positions. The fcc packing in phase
III also indicates the weak influence of the H-bonds in this phase. This phase transition can
thus be viewed as a pseudo-melting of the hydrogen sublattice.
The experimental data points of Hanson and Jordan9 and Kume et al.17 are also presented
in figure 3. Hanson and Jordan’s transition pressures above 300 K are on average lower than
ours but the slopes are very similar. A good agreement can also be observed between Kume
et al.’s data and our experimental points taken on decompression.
Our main goal in studying the III-IV transition line was to detect whether the presence
of the transition between the two isostructural solids IV and V detected at 12 GPa at 300 K
had a measurable inference on this line, such as a discontinuity of slope. This is actually
not the case, no discontinuity being observable within the precision of our measurements
up to 500 K and 20 GPa. In our single-crystal x-ray diffraction experiments, the IV-V
transition was detected thanks to the systematic and sudden splitting of the crystal and
the discontinuous change of slope of the c/a ratio20. Although no volume jump could be
measured within uncertainties (∼ 0.06 cm3/mol), the transition must be first-order since
the two phases are isosymmetric. Using Raman spectroscopy, we observed a small jump
in some lattice modes at 12 GPa, 300 K and around 20 GPa at 50 K21. In figure 3, the
IV-V transition line based on these two points is drawn. The absence of discontinuity at the
expected III-IV-V triple point (ca. 9 GPa, 390 K) is not really surprising since the volume
difference between IV and V is very small. It is also possible that, between 300 and 380 K,
the IV-V transition line ends at a critical point where the transition becomes second-order.
The existence of such critical points have been predicted by Landau31,32 and observed in a
few materials such as Cr-doped V2O333, NH4PF6
34 and cerium35. The proximity of a Landau
6

TABLE I: Experimental data for the III-IV transition line. T is the temperature measured with
the thermocouple in K. P is the pressure measured with the borate or the ruby in GPa.
PIII→IV TIII→IV PIII→IV TIII→IV PIII→IV TIII→IV
3.69 291.0 7.33 363.0 13.90 445.3
4.00 298.0 7.47 361.1 14.92 454.5
4.08 298.0 7.66 369.9 15.41 454.5
4.16 298.0 7.80 369.9 15.78 464.2
4.29 302.1 8.00 375.5 16.64 473.0
4.52 313.5 8.04 375.5 16.71 473.0
4.81 313.2 8.59 380.6 17.54 482.0
5.03 323.0 9.05 384.4 18.92 490.7
5.06 323.0 9.16 387.4 19.84 499.9
5.23 322.3 7.33 363.0
5.75 332.2 7.47 361.1
5.79 336.0 7.66 369.9
5.84 336.0 7.80 369.9
5.93 328.8 8.00 375.5
6.24 343.2 8.04 375.5
6.28 341.5 8.59 380.6 PIV →III TIV →III
6.32 343.2 9.05 384.4 17.37 483.1
6.55 351.6 9.16 387.4 16.02 473.1
6.58 351.6 9.55 392.5 14.72 459.3
6.36 346.6 9.89 400.5 13.42 445.7
7.04 351.6 10.05 400.5 12.66 436.3
7.18 360.5 10.39 408.0 11.00 418.1
7.22 360.9 10.55 408.0 8.95 390.1
7.24 361.1 11.50 417.7 6.97 361.1
7.26 361.9 12.21 427.0 5.93 342.2
7.31 362.7 12.68 435.8 3.39 296.3
7.31 361.1 12.86 435.8
7

9
8
7
6
5
4
3
2
1
Pre
ssur
e (G
Pa)
900800700600500400300
Temperature (K)
III
Fluid
FIG. 4: Experimental melting points determined in this work. The symbols are associated with
two separates experiments. The solid line represents the fit to our data with a Simon-Glatzel
equation. The inset shows a photograph of the solid-fluid equilibrium at 473 K. A ruby ball and
some samarium powder are visible.
1.5
1.0
0.5
Pre
ssure
(G
Pa)
350300250200
Temperature (K)
Fluid
III
I
II
This work
Mills et al.
Hanson et al.
Vereschagin et al. Grace & Kennedy
FIG. 5: Comparison of the melting line obtained in this work (red dots and line) with previous
experimental studies9,16,36,37.
critical point could also explain the weak volume discontinuity at ambient temperature.
8
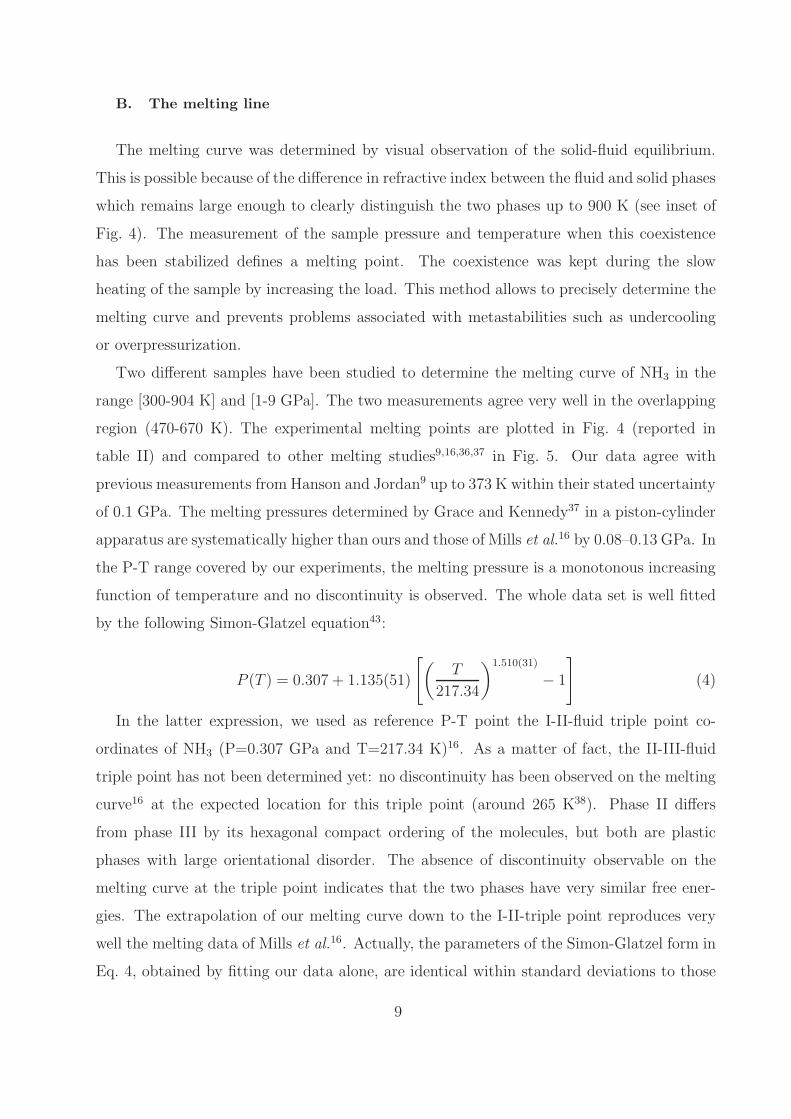
B. The melting line
The melting curve was determined by visual observation of the solid-fluid equilibrium.
This is possible because of the difference in refractive index between the fluid and solid phases
which remains large enough to clearly distinguish the two phases up to 900 K (see inset of
Fig. 4). The measurement of the sample pressure and temperature when this coexistence
has been stabilized defines a melting point. The coexistence was kept during the slow
heating of the sample by increasing the load. This method allows to precisely determine the
melting curve and prevents problems associated with metastabilities such as undercooling
or overpressurization.
Two different samples have been studied to determine the melting curve of NH3 in the
range [300-904 K] and [1-9 GPa]. The two measurements agree very well in the overlapping
region (470-670 K). The experimental melting points are plotted in Fig. 4 (reported in
table II) and compared to other melting studies9,16,36,37 in Fig. 5. Our data agree with
previous measurements from Hanson and Jordan9 up to 373 K within their stated uncertainty
of 0.1 GPa. The melting pressures determined by Grace and Kennedy37 in a piston-cylinder
apparatus are systematically higher than ours and those of Mills et al.16 by 0.08–0.13 GPa. In
the P-T range covered by our experiments, the melting pressure is a monotonous increasing
function of temperature and no discontinuity is observed. The whole data set is well fitted
by the following Simon-Glatzel equation43:
P (T ) = 0.307 + 1.135(51)
[
(
T
217.34
)1.510(31)
− 1
]
(4)
In the latter expression, we used as reference P-T point the I-II-fluid triple point co-
ordinates of NH3 (P=0.307 GPa and T=217.34 K)16. As a matter of fact, the II-III-fluid
triple point has not been determined yet: no discontinuity has been observed on the melting
curve16 at the expected location for this triple point (around 265 K38). Phase II differs
from phase III by its hexagonal compact ordering of the molecules, but both are plastic
phases with large orientational disorder. The absence of discontinuity observable on the
melting curve at the triple point indicates that the two phases have very similar free ener-
gies. The extrapolation of our melting curve down to the I-II-triple point reproduces very
well the melting data of Mills et al.16. Actually, the parameters of the Simon-Glatzel form in
Eq. 4, obtained by fitting our data alone, are identical within standard deviations to those
9

TABLE II: Experimental data for the melting line. Tm is the temperature measured with the
thermocouple in K. Pm is the pressure measured with the borate in GPa.
Pm Tm Pm Tm
1.01 298.3 4.94 6 33.0
1.23 322.0 5.03 6 43.1
1.66 371.1 5.24 6 52.9
1.71 372.0 5.37 6 65.8
2.21 420.1 5.50 681.1
2.79 473.1 5.51 671.7
2.93 484.3 6.04 705.9
3.03 492.8 6.26 723.4
3.22 509.4 6.30 724.6
3.53 529.9 6.47 740.1
3.57 530.4 6.76 762.6
3.76 553.8 7.04 784.5
3.90 562.1 7.29 805.1
4.12 580.8 7.62 826.4
4.15 582.0 8.04 849.6
4.26 586.3 8.33 869.0
4.48 604.1 8.55 884.3
4.65 616.8 8.97 903.9
determined by Mills et al.16 by fitting their own melting data between 220.5 and 305 K.
The melting line of NH3 is compared to those of the isoelectronic solids H2O25, CH4
44
and neon26,39 in Fig. 6. This comparison is shown both on a absolute P-T scale and using
reduced units45 to rescale the melting lines on the same density map. Although none of
these solids ”corresponds” stricto sensu, it can be seen that the melting line of NH3 is closer
to that of methane than to the one of water at high P-T. In particular, the slopes dTm/dPm
of the melting curves of NH3 and CH4 are very similar and much less pressure dependent
than for H2O. Since the main difference between CH4 and H2O, in terms of intermolecular
10

121086420
P*=Pσ3/ε
3.0
2.5
2.0
1.5
1.0
T* =
T//
ε
2015105
P (GPa)
800
600
400
T (
K)
H2O (VII)
NH3 (III)
CH4
Ne
(a)
(b)
FIG. 6: (Color online) Comparison between the melting lines of the isoelectronic solids H2O, NH3,
CH4 and Ne on absolute (a) and reduced (b) scales.
interactions, is the absence of hydrogen bonds in CH4, the similitude between CH4 and NH3
indicates that the hydrogen bonds have little influence on the melting properties of NH3 in
the P-T range covered by our experiments.
C. Phase diagram at high temperatures: comparison with ab initio calculations
To compare our experimental results to the ab initio molecular dynamics (AIMD) simu-
lation of Cavazzoni et al.3, we reproduced the phase diagram predicted by these authors in
Fig. 7. Since the calculations probed pressures above 30 GPa, comparison can only be made
with the extrapolation of the Simon-Glatzel equations determined for both the III-IV phase
line (Eq. [3]) and the melting line (Eq. [4]). Starting from a sample of phase IV at 30 GPa,
Cavazzoni et al. observed a phase transition to a hcp plastic phase at ca. 500 K and then
melting around 1500 K. At 60 GPa, the ordered-plastic phase transition was observed be-
tween 500 and 1000 K, succeeded by the plastic-superionic phase transition between 1000 K
and 1200 K. This superionic phase was also obtained at 150 and 300 GPa in the same tem-
perature range. Although phase III is fcc, we have observed above that the difference in free
energy between the hcp and fcc plastic phases is very small, so we can assimilate the hcp
11

3.0
2.5
2.0
1.5
1.0
0.5
Tem
pera
ture
(10
3 K
)
100806040200
Pressure (GPa)
Superionic solid
Mo
lecu
lar
Flu
id
Ionic Fluid
Ordered molecular solid
Plastic molecularSolid
FIG. 7: (Color online) Phase diagram of ammonia according to ab initio molecular dynamics
simulations of Ref. 3. Fits to present experimental data (red solid lines) and their extrapola-
tions (broken lines) are shown. The black dots represent P-T points where simulations predict a
transition between phase IV and a hcp plastic solid.
plastic phase obtained by Cavazzoni et al. with phase III. The extrapolation of our III-IV
transition line puts the transition at 570 K at 30 GPa and 720 K at 60 GPa, i.e. close to
the predicted ones. On the other hand, the experimental and calculated melting lines are
rather different. Cavazzoni et al. predict a melting temperature of ∼1500 K at 30 GPa, that
is 400 K lower than the extrapolation of our Simon-Glatzel fit. It is rather surprising since
AIMD simulations usually tend to overestimate the melting temperature40. If we rely on
calculations, a strong deviation from the behaviour predicted by the Simon-Glatzel equation
should be observed between 9 and 30 GPa. This is one motivation to pursue the experiments
to higher P-T conditions.
IV. CONCLUSIONS
In this paper, we have presented an experimental investigation of the high P-T phase
diagram of NH3. We have examined the evolution of the III-IV transition line up to 500 K
and of the melting curve up to 900 K. These two first-order transition lines can be well fitted
with Simon-Glatzel equations and no discontinuities have been observed on both lines. The
presence of a Landau critical point ending the IV-V first-order transition line is a possible
explanation for the non-observation of the III-IV-V triple point. A good agreement is found
12
between the extrapolation of present measurements and ab initio predictions of the ordered-
plastic solid transitions, but not for the melting curve. Higher P-T conditions need to be
probed to evidence the predicted superionic phase.
Acknowledgments
The authors are indebted to B. Canny for his help in preparing the experiments and
acknowledge the ESRF for provision of beamtime.
∗ Electronic address: [email protected]
1 W. B. Hubbard, Science 214, 145 (1981).
2 W. Hubbard, M. Podoloak, and D. Stevenson, Neptune and Triton (D.P. Cruikshank, 1995).
3 C. Cavazzoni, G. Chiarotti, S. Scandolo, E. Tosatti, M. Bernasconi, and M. Parrinello, Science
283, 44 (1999).
4 N. Goldman, L. E. Fried, I.-F. W. Kuo, and C. J. Mundy, Phys. Rev. Lett. 94, 217801 (2005).
5 A. F. Goncharov, N. Goldman, L. E. Fried, J. C. Crowhurst, I. F. W. Kuo, C. J. Mundy, and
J. M. Zaug, Phys. Rev. Lett. 94, 125508 (2005).
6 B. Schwager, L. Chudinovskikh, A. Gavriliuk, and R. Boehler, J. Phys.: Condens. Matter 16,
1177 (2004).
7 J.-F. Lin, E. Gregoryanz, V. V. Struzhkin, M. Somoayazulu, H.-K. Mao, and R. J. Hemley,
Geophys. Res. Lett. 32, L11306 (2005).
8 N. A. Dubrovinskaya and L. Dubrovinsky, in Annual report of the Bayerisches Geoinstitut
(2004), p. 34, URL http://www.bgi.uni-bayreuth.de/annual_report/2004/c_34.phtml.
9 R. C. Hanson and M. Jordan, J. Phys. Chem 84, 1173 (1980).
10 R. Dick, J. Chem. Phys 74, 4053 (1981).
11 A. Mitchell and W. J. Nellis, J. Chem. Phys 76, 6273 (1982).
12 W. J. Nellis, D. C. Hamilton, N. C. Holmes, H. B. Radousky, F. H. Ree, A. C. Mitchell, and
M. Nicol, Science 240, 779 (1988).
13 H. Radousky, A. Mitchell, and W. Nellis, J. Chem. Phys 93, 8235 (1990).
13

14 W. J. Nellis, N. C. Holmes, A. C. Mitchell, D. C. Hamilton, and M. Nicol, J. Chem. Phys. 107,
9096 (1997).
15 J. S. Loveday, R. J. Nelmes, W. G. Marshall, J. M. Besson, S. Klotz, and G. Hamel, Phys. Rev.
Lett. 76, 74 (1996).
16 R. L. Mills, D. H. Liebenberg, and P. Pruzan, J. Phys. Chem. 86, 5219 (1982).
17 T. Kume, S. Sasaki, and H. Shimizu, J. Raman Spectrosc. 32, 383 (2001).
18 M. Gauthier, P. Pruzan, J. C. Chervin, and J. M. Besson, Phys. Rev. B 37, 2102 (1988).
19 M. Gauthier, P. Pruzan, J. C. Chervin, and A. Polian, Solid State Comm. 68, 149 (1988).
20 F. Datchi, S. Ninet, M. Gauthier, A. M. Saitta, B. Canny, and F. Decremps, Phys. Rev. B 73,
174111 (2006).
21 S. Ninet, F. Datchi, and A. M. Saitta, to be published.
22 S. Ninet, F. Datchi, A. M. Saitta, M. Lazzeri, and B. Canny, Phys. Rev. B 74, 104101 (2006).
23 F. Datchi, R. LeToullec, and P. Loubeyre, J. Appl. Phys. 81, 3333 (1997).
24 F. Datchi, A. Dewaele, Y. L. Godec, and P. Loubeyre, Phys. Rev. B 75, 214104 (2007).
25 F. Datchi, P. Loubeyre, and R. LeToullec, Phys. Rev. B 61, 6535 (2000).
26 F. Datchi and B. Canny, Phys. Rev. B 69, 144106 (2004).
27 V. M. Giordano and F. Datchi, Europhys. Lett. 77, 46002 (2007).
28 F. Simon and G. Glatzel, Z. Annorg. Allg. Chem. 178, 309 (1929).
29 A. V. Voronel, Sov. Phys. Tech. Phys. 3, 2458 (1958).
30 R. B. VonDreele and R. C. Hanson, Acta Cryst. C40, 1635 (1984).
31 J. C. Toledano and P. Toledano, The Landau theory of phase transitions (World Scientific,
1987).
32 L. Landau and E. Lifchitz, Statistical physics (Ellipses, 1967).
33 A. Jayaraman, D. B. McWhan, J. P. Remeika, and P. D. Dernier, Phys. Rev. B 2, 3751 (1970).
34 I. P. Swainson, R. P. Hammond, J. K. Cockcroft, and R. D. Weir, Phys. Rev. B 66, 174109
(2002).
35 R. I. Beecroft and C. A. Swenson, J. Phys. Chem. Solids 15, 234 (1960).
36 L. F. Vereschagin and F. F. Voronov, Z. Fizi. Khimi. 30, 329 (1958).
37 J. D. Grace and G. C. Kennedy, J. Phys. Chem. Solids 28, 977 (1967).
38 R. L. Mills and B. Olinger, unpublished.
39 W. L. Vos, J. A. Schouten, D. A. Young, and M. Ross, J. Chem. Phys. 94, 3835 (1991).
14

40 L. Koci, R. Ahuja, and A. B. Belonoshko, Phys. Rev. B 75, 214108 (2007).
41 U. Setzmann and W. Wagner, J. Phys. Chem. Ref. Data 20, 1061 (1991).
42 A. Belonoshko and S. K. Saxena, Geochim. Cosmochim. Acta 56, 3611 (1992).
43 Numbers in parentheses indicate the 95% confidence interval for the fit parameters
44 The melting line of methane has only been determined up to 400 K. At higher temperatures,
we use the extrapolation of the melting law given in Ref. 41
45 We use reduced units derived from the law of corresponding states : P ∗ = Pσ3/ǫ, T ∗ = T/ǫ,
where σ and ǫ are respectively the position and depth of the mimimum of the effective pair
potential. For these two parameters, we use the values determined for the exp-6 potential by
Belonoshko and Saxena42 for H2O, NH3 and CH4, and by Vos et al. 39 for Ne.
15