nepal public land transport survey 2013cbs.gov.np/image/data/2015/report on nepal land transport...
TRANSCRIPT

Nepal Public Land Transport Survey
2013
A Statistical Report
Central Bureau of Statistics
National Planning Commission Secretariat
Government of Nepal
June 2014

ii
Nepal Public Land Transport Survey
2013
A Statistical Report
Central Bureau of Statistics
National Planning Commission Secretariat
Government of Nepal
June 2014
iii
Published by
Central Bureau of Statistics
Thapathali, Kathmandu,
Nepal.
Phone: 4229406, 4245946-48
Fax: 977-1-4227720
E-mail: [email protected]
Website: http://www.cbs.gov.np
First Edition: June 2014
Cover Page Photographs: Webpage
Survey Glimpses Photographs: Shantwana Sharma

iv
Table of Contents
Abbreviations and Acronyms .............................................................................................................................. vi
Chapter I .............................................................................................................................................................. 1
Survey Methodology ............................................................................................................................................. 1
1.1 Introduction ......................................................................................................................................................... 1
1.2 Background ......................................................................................................................................................... 2
1.3 Objectives of the Survey ..................................................................................................................................... 2
1.4 Scope and Coverage ............................................................................................................................................ 3
1.5 Sampling Design ................................................................................................................................................. 5
1.6 Field Work .......................................................................................................................................................... 6
1.7 Vehicle Listing .................................................................................................................................................... 7
1.8 Data Management ............................................................................................................................................... 8
1.9 Survey Limitations .............................................................................................................................................. 9
1.10 Lessons Learned ................................................................................................................................................ 9
Chapter II ........................................................................................................................................................... 10
Introductory Information .................................................................................................................................. 10
Chapter III ......................................................................................................................................................... 17
Expenditure and Income of Transport Service .................................................................................................. 17
Annex I ............................................................................................................................................................... 23
Name List of Survey Team ................................................................................................................................. 23
Annex II .............................................................................................................................................................. 28
Enterprise Survey Questionnaire ....................................................................................................................... 28
Annex III ............................................................................................................................................................ 34
Listing Form of Transport Entrepreneurs' Vehicles ......................................................................................... 34
Annex IV ............................................................................................................................................................. 35
Survey Glimpses ................................................................................................................................................. 35

v
List of Tables
Table 1: Distribution of public land transport vehicles by type ........................................................... 10
Table 1A: Distribution of sampled vehicles by ecological belt .............................................................. 11
Table 2: Distribution of vehicles by country of manufacturing ............................................................ 11
Table 3: Average years of vehicles since manufactured and operated by type ................................... 12
Table 4: Average number of days the vehicle is operated in a reference year .................................... 12
Table 5: Number of vehicles per transport entrepreneur by vehicle type ........................................... 13
Table 6: Distribution of the distance mainly travelled by vehicles ....................................................... 13
Table 7: Average expected age (years) of vehicle as reported by the entrepreneur ........................... 14
Table 8: Distribution of problems/suggestions reported by transport entrepreneurs ........................ 14
Table 9: Average and total number of regularly employed individuals by vehicle type .................... 15
Table 10: Average number of regularly employed individuals per vehicle by distance travelled ..... 16
Table 11: Average annual expenditure on employees (Rupees) on different items by vehicle type .. 18
Table 11A: Total annual expenditure on employees (Percent) on different items by vehicle type .... 18
Table 12: Average annual operational expenditure (Rupees) on different items by vehicle type ..... 19
Table 13: Average annual other expenditure (Rupees) on different items by vehicle type ................ 19
Table 14: Annual financial transaction (Rupees) by vehicle type ........................................................ 20
Table 15: Annual amount of capital investment (Rupees) on different items by vehicle type ........... 20
Table 16: Annual amount of capital income (Rupees) by vehicle type ............................................... 21
Table 17: Taxes, royalties and fees paid annually to the Government (Rupees) by vehicle type ...... 21
Table 18: Annual income from the sale of services (Rupees) by vehicle type ...................................... 22
Table 19: Other annual income (Rupees) by vehicle type .................................................................... 22

vi
Abbreviations and Acronyms
BS Bikram Sambat
BSO Branch Statistical Office
CBS Central Bureau of Statistics (Nepal)
CSPro Census and Survey Processing
GDP Gross Domestic Product
ISIC International Standard Industrial Classifications of All Economic Activities
NPISH Non-Profit Institutions Serving the Households
PSU Primary Sampling Unit
SSU Secondary Sampling Unit
STATA Statistical Analysis
VDC Village Development Committee
1
Chapter I
Survey Methodology
1.1 Introduction
Nepal is a country with more than three-quarter of the population inhabited in rural areas. Due to
the recent expansion of different types of roads in Nepal, 73 out of 75 districts are connected
with the road network. About 1.6 million land transport vehicles have been registered in Nepal1
by the end of Fiscal Year 2069-70 BS (15 July 2013). The total length of the road in Nepal is
25133 km including well-surfaced (7799 km), graveled (6830 km) and earthen (10504 km)
roads2.
The Nepal Public Land Transport Survey 2013 is designed to collect information on one of the
fast-growing sectors of trade-in services. This sector is extracted from Section H (Transport and
Storage) of the International Standard Industrial Classifications of All Economic Activities
(ISIC) Revision IV. The ISIC is the international reference classification of productive activities.
The division 49 under Section H deals with "Land transport and transport via pipelines". The
group 492 is focused to "Other land transport" which includes all land-based transport activities
other than rail transport. This survey covers three classes under this group, 4921 (Urban and
suburban passenger land transport), 4922 (Other passenger land transport) and 4923 (Freight
transport by road) of ISIC 2008. Non-mechanized land transport services of passenger transport
by man- or animal-drawn vehicles such as bicycle, rickshaw, carts, mules, horses, etc. are
excluded from the survey.
Since the survey is focused on the trading aspect, the private, government, corporation,
diplomatic, institutional and the service-oriented vehicles belonging to Non-Profit Institutions
Serving the Households (NPISH) are not covered in this survey. The public vehicles incorporates
both the passenger and freight vehicles with the number plate having black background and
white alphabets (for public) and green background and white alphabets (for tourist). They
include vehicles used for the public purposes such as taxi, jeep, van, pickup, tipper, tempo, auto
rickshaw, power tiller, tractor, microbus, minibus, mini truck, bus, truck, lorry, water tanker,
petrol tanker and any type of tourist vehicles. Ambulances, cranes, dozers, rollers and fire
brigades are not included in the survey.
1 Department of Transport Management, Ministry of Physical Infrastructure and Transport
2 Thirteenth Development Plan, National Planning Commission

2
1.2 Background
One of the major concerns of the Government of Nepal is to strengthen the economic statistics
for evidence-based policy. To make Gross Domestic Product (GDP) estimation more realistic,
the secondary data sources that it uses need to be frequently updated. The survey of public land
transport is the continuation of the backing up of the data required for the national accounts
estimates in Nepal. The Trade Statistics Section of the CBS has carried out the Distributive
Trade Survey of Nepal in 2008 and Freight Margin Survey in 2011 to serve for this purpose. The
two surveys Private Educational Institution Survey 2014 and the survey dealing with the repair
and maintenance of vehicles are in pipelines to support the generation of trade in services
statistics in Nepal.
The Nepal Land Transport Survey 2013 envisages to capture the input and the output from the
public land transport sector. Many sectors of industries are affected by the land transport sector
in Nepal as this plays key role in the fluctuations of prices of goods.
1.3 Objectives of the Survey
Nepal Public Land Transport Survey 2013 was carried out for the first time in Nepal for such a
large scale. However, a small study on public land transport had been conducted in 2003-04. The
overall objective of this survey was to generate statistics required for the contribution of public
land transport service to the national economy.
The survey was designed with the following specific objectives:
(i) To estimate the contribution of public land transport service to the national economy;
(ii) To analyze the impact of employment at the national level by the transport sector;
(iii) To update the data and pattern of land transport sector required for the GDP estimation
(iv) To fill data gap felt in the transport services
(v) To provide relevant statistics required for the development of transport sector to planners,
policy makers and researchers.

3
1.4 Scope and Coverage
With the objectives mentioned above, the public land transport survey was carried out to
estimate the major expenditure components of transport service at national level by type of
vehicles. The key survey results are representative to the following 10 types (groups) of vehicles:
1. Bus/Minibus
2. Truck/Minitruck/Tipper
3. Taxi
4. Jeep/Van
5. Microbus
6. Tempo
7. Tractor/Power tiller
8. Tourist vehicles
9. Water tanker
10. Petrol Tanker
The scope of the survey was covered in the following topics of public vehicles:
1. Introductory Information
It has questions on transport entrepreneur such as name, address, type of the vehicle operated,
plate number of the vehicle, country and model number of vehicle manufactured, years of the
operation, frequency of the operation of the vehicle, etc.
2. Number of Regular Employees in Vehicle
This section covers the information on employment. Five types of employees were identified.
They are classified by paid, unpaid, contract basis with gender disaggregation. The types of
employees classified were Manager/Entrepreneur, Driver, Conductor, Helper and Others.
3. Expenditure on Transport Employees
The information on salary, allowance and other benefits provided to regular employees of the
vehicle were recorded in this section.

4
4. Operating and Other Expenditures
In this section, the information on operating and other expenditures were covered. Expenditures
incurred on operating business during the reference period were covered under operating
expenditure. It included expenditures on fuel, lubricants, spare parts, repair and maintenance,
rent, different organizational and operational fees.
Other expenditures covered miscellaneous expenditure incurred during the reference period.
They were insurance premiums, commissions, compensations and donations.
5. Financial Description
The information on financial transaction made during the reference period was captured in this
section. It constitutes loans taken and given, interest received or given and any other type of
financial transactions made.
6. Capital Expenditure
The information on the capital expenditure and property gained during the reference period was
collected in this section. It included vehicle, garage/building, main engine, tyre/tube, body
building, capital repair and maintenance, machine/equipment and other items. It covered both the
purchased/additional cost and the cost of sold/deduced during the reference period.
7. Tax, Royalty, Fee
The information on the taxes, royalties, and fees paid to the government and other institutions
during the reference period was collected under this section. It included vehicle tax, road tax,
enterprise registration, renewal and permit fees, local government fees, route permit fees paid to
the government, and other indirect taxes, royalties, fees, etc.
8. Income from Enterprise
This section included questions on income of transport entrepreneur from the sale of services
during the reference period. It covered income from sale of transport services (fare), income
from contract and other income.
The other income included income from secondary activities of the transport entrepreneur during
the reference period. It covered income from renting out building, renting out vehicle, amount
received from compensation, claim of vehicle insurance, etc.
5
9. Miscellaneous
The miscellaneous section of the questionnaire included questions on the type of the distance the
vehicle was operated and the operational age of the vehicle. The information on the respondent,
enumerator and supervisor of the survey were also collected in this section.
1.5 Sampling Design
The sampling design adopted in Nepal Public Land Transport Survey 2013 was stratified cluster
sampling. There 10 strata on 3 domains of the sample selection were:
Domain: 3 Ecological belts (Mountains, Hills and Plains)
Strata: 10 strata of vehicle types as mentioned above
Final selection : vehicle entrepreneur represented by unique vehicle number
Domains of selection
The origin of the vehicle for the survey purpose is considered as the district where it is registered
in the respective associations based on its type. For this purpose, three domains were created: the
Mountains, the Hills and the Plains. For each domain, the number of vehicles were selected and
distributed by its type. In many domains, all type of vehicles were not selected as some of them
were absent in the particular domain. For the vehicle type Bus/Minibus, Jeep/Van and
Tractor/Power tiller, three domains of the Mountains, Hills and Tarai was maintained. Tourist
vehicles (taxi, bus) and Water tanker were found only in the Hills domain. However, for other
vehicle types, the Mountains and Hills were merged to a single domain due to the insufficient
population size as a result of rare presence of vehicle associations in mountainous districts.
Selection of Strata
From each domain selected, 10 types of vehicles were selected proportionately. The number of
vehicles to be selected were fixed at some percentage by each type and domain as far as possible.
Final selection
From each domain selected, an exhaustive listing of vehicles was prepared based on the type of
the vehicle where the vehicles registered in districts were sorted from east to west as explicit
stratification. From each domain certain percentages of vehicles were selected with systematic
sampling ordered by district.

6
Sampling Frame
The sampling frame for Nepal Public Land Transport Survey 2013 is prepared from the team of
33 Branch Statistical Offices (BSOs) and the Trade Statistics Section of the CBS. Each BSO
collected the list of all the public vehicles and their relevant information, by their type. The type
of the vehicles had been classified based on the income/expenditure pattern of them so as to
minimize the average value within each type of vehicle. This classification does not exactly fit to
the classification adopted by the Department of Transport Management for the registration
purpose, which is a bit aggregated form based upon the size of the vehicle.
1.6 Field Work
Field Staff
The field staffs were selected from Central Bureau of Statistics and Branch Statistical Offices.
The officers of BSO were also deputed for the district level supervision of the respective
districts. The officers of Trade Statistics Section made the overall central supervision.
Training of Field Staff
As training is very important in any sort of economic surveys, an intensive training was imparted
to the staff involved in public land transport survey. Firstly, a master training was organized for
the head of the Branch Statistics Offices by Trade Statistics Section on the third week of January
2013 (16-19 January) at Butwal (Rupandehi) and on the fourth week of January 2013 (27-30
January) at Itahari (Sunsari) for the officers involved in the survey. The officers were trained and
briefed on:
(i) importance of transport sector on national accounting and the contribution of transport
services to GDP
(ii) sample selection and field operation
(iii) concepts and definitions used in the survey questionnaire, and
(iv) responsibilities of the officers to be involved in the survey.
They were also given the guidelines for training to district officers, field supervisors and
enumerators. The officers of CBS participated in the training program.
The second level training was organized in two places. The intensive training for district
supervisors and enumerators was organized by Trade Statistics Section at Itahari (Sunsari), and
Butwal (Rupandehi). The duration of the training was 3 days each (22-22 January 2013) at

7
Butwal (Rupandehi) and (31 January-2 February 2013) at Itahari (Sunsari) for the field
supervisors and enumerators. The supervisors and enumerators were also briefed and trained to
fill up different questionnaires designed for the survey work. They were given guidelines in the
training to maintain consistency of procedures employed and uniformity of concepts and
definitions used. Each supervisor and enumerator was provided instructions manuals for their
better understanding of the objectives of conducting the survey.
Field Enumeration
Nepal Public Land Transport Survey 2013 was carried out in 6 months. The management of the
field work team was done by the BSOs.
Field Supervision
An intensive supervision over the field work was carried out by the supervisory staff comprising
district level officers and supervisors. In addition, field supervision was carried out to various
districts by the officers and supervisors of trade statistics section of CBS.
Reference Period
The reference period of the survey was the last fiscal year preceding the interview with the
transport entrepreneur 2011/12 (2068/69 BS).
1.7 Vehicle Listing
A complete vehicle listing was done prior to the main enumeration work. The following
information was collected in the listing of the households:
1. Vehicle Serial Number
2. Name of District
3. Name of Transport Entrepreneurs' Association
4. Zone Code mentioned in the Plate Number of the Vehicle
5. Vehicle Number mentioned in the Plate Number of the Vehicle
6. Name of Entrepreneur
7. District of Entrepreneur
8. VDC/Municipality of Entrepreneur
9. Ward Number of Entrepreneur
10. Telephone Number of Entrepreneur

8
11. Mobile Phone Number of Entrepreneur
12. Type of Vehicles
Code of Types of Vehicles
1. Bus/Minibus
2. Truck/Minitruck/Tipper
3. Taxi
4. Jeep/Van
5. Microbus
6. Tempo
7. Tractor/Power tiller
8. Tourist vehicles3 (Taxi)
9. Tourist vehicles (Bus)
10. Water tanker
11. Petrol tanker
1.8 Data Management
After data collection, inconsistency checks and error removing were done to improve the quality
of the survey data. The procedure of editing was done by the staff of Trade Statistics Section of
CBS for maintaining the quality of compiled and processed data. The computer programming for
data entry, editing and tabulation for the public transport survey was done using the software
packages CSPro and STATA.
Data Entry
The staff of Trade Statistics Section of CBS and some enumerators involved in survey were
involved in the data entry. The quality of the data was maintained by checking the filled-in
questionnaires on sample basis. The data entry work was completed within a month.
Data Editing and Cleaning
It was a time-consuming work but editing ensured the data were of a high quality. The editing
was designed to identify several types of error such as missing data, inconsistencies (e.g. type of
vehicles and identification of the vehicle represented by plate number, etc.)
3 The tourist taxi and tourist bus was combined to tourist vehicles later during the field enumeration.

9
Output Tables
The computer program was designed to produce a set of output tables for each type of the
vehicle. The interpretation of the tables are made except that of income and expenditure
questions.
1.9 Survey Limitations
The survey was designed based on the available lists of the vehicles prepared by the Branch
Statistical Offices during listing operation. Later the survey frame was updated using the number
of vehicles registered in the Transport Management Department. It provided the weights of the
vehicles by its type. Due to the small size of the sample, the results could not be representative in
the sub-national level.
1.10 Lessons Learned
The complete list of the vehicles was the major challenge for the survey sample design. As the
list was prepared based on their operation and affiliation to their respective association of the
vehicles rather than their registration, the source of the list was the different vehicle associations
which couldn't furnish enough information needed for the stratification as envisaged.

10
Chapter II
Introductory Information
This chapter presents introductory tables on geographic distribution of the public land transport
vehicles, origin and age of manufacturing of the vehicles, age and distance of operation of the
vehicles, regularly employed individuals by type of vehicles and problems and suggestions
reported by the transport entrepreneurs.
Table 1: Distribution of public land transport vehicles by type
Type of Vehicle Total Sample Percent
Bus/Minibus 37995 459 32.1
Truck/Minitruck/Tipper 26218 394 22.1
Taxi 7758 173 6.5
Jeep/Van 11159 189 9.4
Microbus 8182 151 6.9
Tempo 5084 62 4.3
Tractor/Power tiller 16387 219 13.8
Tourist vehicle 877 19 0.7
Water tanker 818 14 0.7
Petrol tanker 4066 56 3.4
Total 118544 1736 100
Table 1 presents the distribution of the public land transport vehicles by their types. The total
number of vehicles that are operated throughout the country in the reference year 2011/12 (Fiscal
Year 2068/69 Bikram Sambat), the sample of the vehicles selected by type and the percentage
distribution of the sample are presented in the table. The total number vehicles under operation is
118,544 and 1,736 vehicles representing from 10 subgroups created for the survey purpose are
selected for the enumeration. About one-third of the vehicles under selection are buses and
minibuses. The trucks, minitrucks and tippers are the second common public transport vehicles.
Around 1.5 percent of the estimated public vehicles were selected for the interview with the
transport entrepreneurs in the survey.

11
Table 1A: Distribution of sampled vehicles by ecological belt
Type of Vehicle Mountains Hills Tarai Total
No. Percent No. Percent No. Percent No. Percent
Bus/Minibus 12 0.9 234 52.6 213 46.4 459 100
Truck/Minitruck/Tipper 0 0.0 267 55.7 127 44.3 394 100
Taxi 0 0.0 143 77.1 30 23.0 173 100
Jeep/Van 16 4.0 132 58.4 41 37.6 189 100
Microbus 0 0.0 118 57.0 33 43.1 151 100
Tempo 0 0.0 33 34.6 29 65.4 62 100
Tractor/Power tiller 10 2.0 72 25.2 137 72.8 219 100
Tourist vehicle 0 0.0 19 100.0 0 0.0 19 100
Water tanker 0 0.0 14 100.0 0 0.0 14 100
Petrol tanker 0 0.0 37 66.1 19 33.9 56 100
Total 38 1.0 1069 52.3 629 46.7 1736 100
Table 1A presents the distribution of the public vehicles by ecological belt. The origin of the
vehicle is the place where they are registered or mainly operated considering the unit of
registration or operation as the district. There were negligible number of vehicles in the
Mountains whereas they were almost equally distributed to the Hills and the Tarai, Only
Bus/Minibus, Jeep/Van and Tractor/Power tiller were found to be registered in the Mountains.
Tourist vehicles and Water taker were found only in the Hills. Tractor/Power tiller and Tempo
are more common to Tarai.
Table 2: Distribution of vehicles by country of manufacturing
Country Percent
India 89.0
Japan 4.5
Nepal 2.4
South Korea 1.3
China 1.2
Germany 0.6
Indonesia 0.5
Other 0.6
Total 100
There were 89 percent of the vehicles that were running during the reference year 2011-12 had
been manufactured in India. Japan stood the second in terms of the country of manufacturing.
More than two percent of the vehicles that were under operation were manufactured in Nepal.

12
Table 3: Average years of vehicles since manufactured and operated by type
Type of Vehicle
Manufactured
(years)
Operated
(years)
Bus/Minibus 7.4 6.6
Truck/Minitruck/Tipper 6.7 6.3
Taxi 10.2 9.0
Jeep/Van 10.5 9.1
Microbus 7.2 6.5
Tempo 14.7 13.5
Tractor/Power tiller 5.2 4.6
Tourist vehicle 20.9 20.5
Water tanker 11.2 10.7
Petrol tanker 10.6 9.8
Total 8.0 7.2
In Nepal, mean years of vehicles that are operated since manufactured is 8. Tourist vehicles were
found to be the oldest in terms of years of manufacturing (20.9 years). Tractors and power tillers
were found to be the newest ones (5.2 years) based on different types of vehicles sampled. The
average age of operation of the running public vehicles was found to be 7.2 years. The oldest age
of the vehicles were the tourist vehicles (buses) and the newest ones were tractor/power tiller.
The survey had not accommodated the newly arrived taxis at the Tribhuvan International
Airport.
Table 4: Average number of days the vehicle is operated in a reference year
Type of Vehicle Mean Median
Bus/Minibus 231 240
Truck/Minitruck/Tipper 222 231
Taxi 286 300
Jeep/Van 246 250
Microbus 277 288
Tempo 291 300
Tractor/Power tiller 232 240
Tourist vehicle 267 300
Water tanker 317 315
Petrol tanker 136 120
Total 238 240
The mean period of operation of the public transport vehicles in Nepal is 238 days in a year. The
median value of the operation was 240 days, which is very close to the mean value of operation.
Water tankers were found to be the most operated vehicles (317 days) whereas petrol tankers
were operated 136 days in a reference year.
13
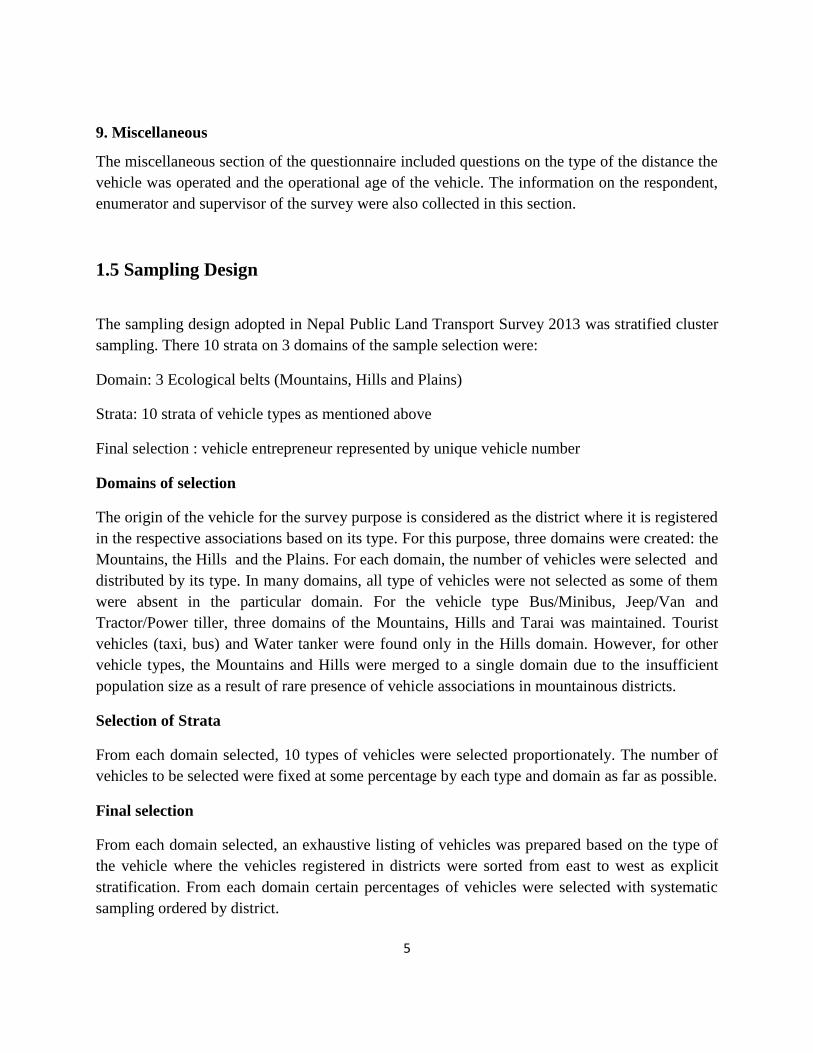
Table 5: Number of vehicles per transport entrepreneur by vehicle type
Type of Vehicle Mean Maximum
Bus/Minibus 1.8 60
Truck/Minitruck/Tipper 2.2 22
Taxi 1.3 7
Jeep/Van 1.2 13
Microbus 1.4 7
Tempo 2 13
Tractor/Power tiller 1.2 6
Tourist vehicle 1.2 4
Water tanker 2.7 8
Petrol tanker 5.4 50
Total 1.8 60
The mean number of similar types of vehicles owned by the transport entrepreneurs was 1.8 for
the reference year. Petrol tanker was the vehicle, which was owned most by a single
entrepreneur. The maximum value of the number of the vehicles was as high as 60 for some
types of vehicles, especially the bus or minibus as observed in the sampled entrepreneurs.
Table 6: Distribution of the distance mainly travelled by vehicles
Percent
Type of Vehicle Short
(<=25 km)
Medium
(26-100 km)
Long
(>100 km) Total
Bus/Minibus 18.4 37.1 44.5 100
Truck/Minitruck/Tipper 6.6 20.4 73.0 100
Taxi 68.4 30.3 1.3 100
Jeep/Van 42.8 48.2 9.0 100
Microbus 37.9 36.9 25.3 100
Tempo 95.5 4.5 0.0 100
Tractor/Power tiller 54.8 41.5 3.7 100
Tourist vehicle 73.7 5.3 21.1 100
Water tanker 50.0 50.0 0.0 100
Petrol tanker 7.1 17.9 75.0 100
Total 31.3 32.4 36.3 100
Almost one-third of the vehicles were found to be operated each in short (less than or equal to 25
kilometers), in medium (26 to 100 kilometers), and long (more than 100 kilometers) distance.
Tempo and water tanker were found to be operated only to the short and the medium distances
whereas three-fourth of the petrol tanker, truck, minitruck and tipper were under operation for
the long distance during the reference year.

14
Table 7: Average expected age (years) of vehicle as reported by the entrepreneur
Type of Vehicle Mean
(Minimum)
Mean
(Maximum)
Mean
(Average)
Bus/Minibus 18.0 24.0 21.0
Truck/Minitruck/Tipper 17.5 23.3 20.4
Taxi 17.9 24.7 21.3
Jeep/Van 17.0 23.7 20.3
Microbus 20.7 26.5 23.6
Tempo 21.6 27.1 24.4
Tractor/Power tiller 14.2 19.7 16.9
Tourist vehicle 27.7 32.3 30.0
Water tanker 23.3 27.6 25.5
Petrol tanker 24.3 32.4 28.4
Total 17.9 23.9 20.9
The expected minimum age of the all the public vehicles was 17.9 years and the maximum value
for this was 23.9 maintaining the calculated average to be 20.9 years as reported by the transport
entrepreneurs. The tractor and power tiller was reported to have the lowest age (16.9 years) and
tourist vehicles and petrol tanker were found to be reported with highest age of operation.
Table 8: Distribution of problems/suggestions reported by transport entrepreneurs
Major Suggestions Multiple Responses
Problems/Suggestions No. of
Entrepreneur Percent
No. of
Entrepreneur Percent
Improve road condition 280 14.9 357 20.6
Stop strikes in transport sector 134 7.9 220 12.7
Urge traffic rules compliance 132 7.2 227 13.1
Adopt scientific fare system 86 5.7 134 7.7
Provide subsidy on fuel price 75 4.5 156 9.0
Reduce interest rate on transport loan 41 2.4 68 3.9
Ensure availability of fuel/spare parts 29 1.5 52 3.0
Limit fare discount to real student 25 1.4 72 4.1
Compensate from guilty in accident 23 1.3 46 2.6
Reduce insurance premium 7 0.5 20 1.2
Others 255 14.0 529 30.5
No problem/suggestion reported 649 38.7 649 37.4
Total 1736 100 1736 (2530) 100 (145.7)
15
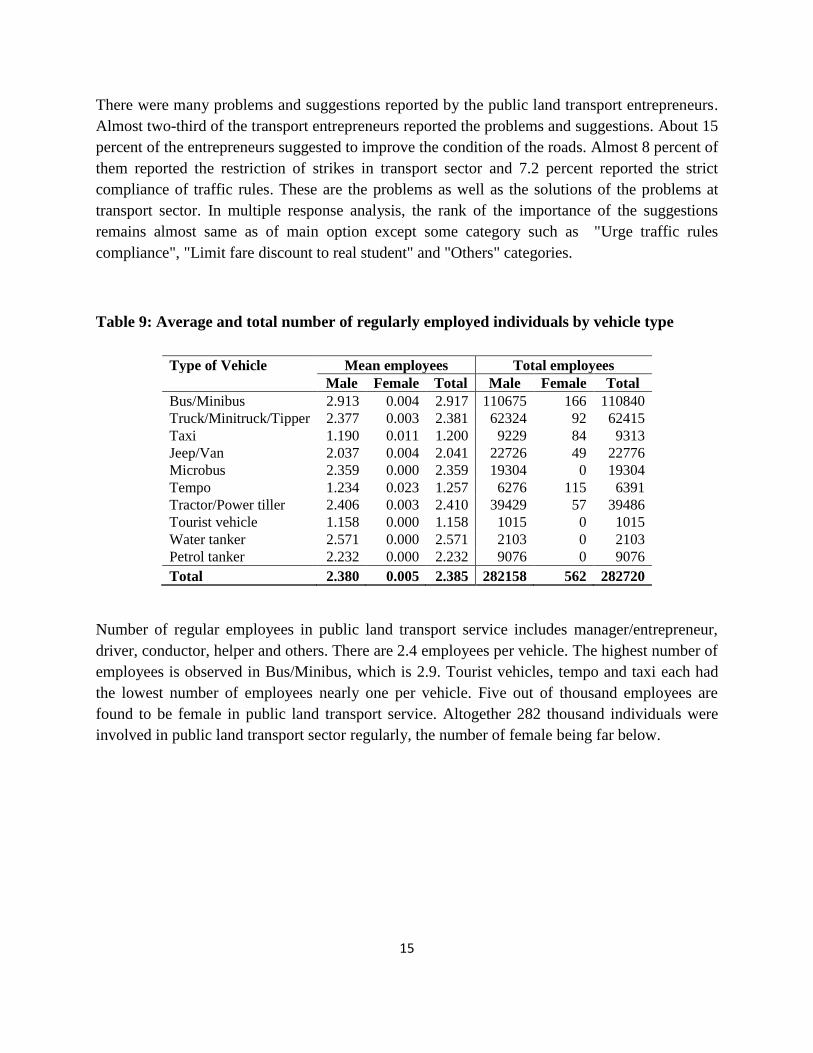
There were many problems and suggestions reported by the public land transport entrepreneurs.
Almost two-third of the transport entrepreneurs reported the problems and suggestions. About 15
percent of the entrepreneurs suggested to improve the condition of the roads. Almost 8 percent of
them reported the restriction of strikes in transport sector and 7.2 percent reported the strict
compliance of traffic rules. These are the problems as well as the solutions of the problems at
transport sector. In multiple response analysis, the rank of the importance of the suggestions
remains almost same as of main option except some category such as "Urge traffic rules
compliance", "Limit fare discount to real student" and "Others" categories.
Table 9: Average and total number of regularly employed individuals by vehicle type
Type of Vehicle Mean employees Total employees
Male Female Total Male Female Total
Bus/Minibus 2.913 0.004 2.917 110675 166 110840
Truck/Minitruck/Tipper 2.377 0.003 2.381 62324 92 62415
Taxi 1.190 0.011 1.200 9229 84 9313
Jeep/Van 2.037 0.004 2.041 22726 49 22776
Microbus 2.359 0.000 2.359 19304 0 19304
Tempo 1.234 0.023 1.257 6276 115 6391
Tractor/Power tiller 2.406 0.003 2.410 39429 57 39486
Tourist vehicle 1.158 0.000 1.158 1015 0 1015
Water tanker 2.571 0.000 2.571 2103 0 2103
Petrol tanker 2.232 0.000 2.232 9076 0 9076
Total 2.380 0.005 2.385 282158 562 282720
Number of regular employees in public land transport service includes manager/entrepreneur,
driver, conductor, helper and others. There are 2.4 employees per vehicle. The highest number of
employees is observed in Bus/Minibus, which is 2.9. Tourist vehicles, tempo and taxi each had
the lowest number of employees nearly one per vehicle. Five out of thousand employees are
found to be female in public land transport service. Altogether 282 thousand individuals were
involved in public land transport sector regularly, the number of female being far below.

16
Table 10: Average number of regularly employed individuals per vehicle by distance
travelled
Type of Vehicle Short
(<=25 km)
Medium
(26-100 km)
Long
(>100 km)
Bus/Minibus 2.5 2.8 3.2
Truck/Minitruck/Tipper 2.4 2.4 2.4
Taxi 1.1 1.3 1.6
Jeep/Van 2.0 2.0 2.1
Microbus 2.3 2.7 1.9
Tempo 1.2 2.0
Tractor/Power tiller 2.4 2.4 2.8
Tourist vehicle 1.1 1.0 1.2
Water tanker 2.3 2.9
Petrol tanker 2.0 2.1 2.3
Total 2.0 2.5 2.6
Average number of regularly paid employees is the highest for the vehicles operated in the long
distance (more than 100 km distance), which is 2.6. In a short distance of 25 km or less, the
average number stood at 2.5. The figure stands at 2 for the short distance vehicles running at less
than or equal to 25 km.

17
Chapter III
Expenditure and Income of Transport Service
The expenditure and income section of the public land transport survey collects information on
all the capital and recurrent expenditure made on the vehicles and the gross income derived from
operating transport service including its ancillary activities. The average annual expenditures and
incomes are derived based on the expenses/income made on particular items. This is expected to
provide the average values of the items that make expenditure or income on them.
The mean values presented in the subsequent tables are the positive values of the items. Any
values which were not incurred were treated as missing, not zero. So proper care should be taken
while deriving the totals of these values and making interpretations based on this.
18
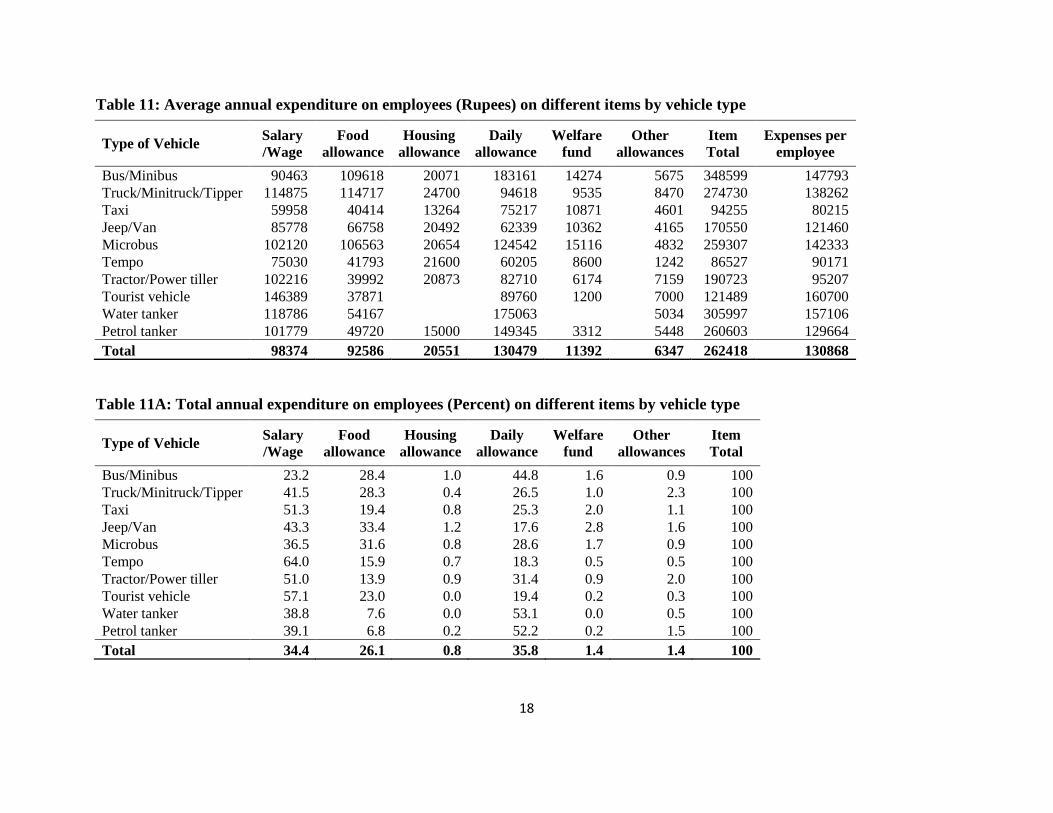
Table 11: Average annual expenditure on employees (Rupees) on different items by vehicle type
Type of Vehicle Salary
/Wage
Food
allowance
Housing
allowance
Daily
allowance
Welfare
fund
Other
allowances
Item
Total
Expenses per
employee
Bus/Minibus 90463 109618 20071 183161 14274 5675 348599 147793
Truck/Minitruck/Tipper 114875 114717 24700 94618 9535 8470 274730 138262
Taxi 59958 40414 13264 75217 10871 4601 94255 80215
Jeep/Van 85778 66758 20492 62339 10362 4165 170550 121460
Microbus 102120 106563 20654 124542 15116 4832 259307 142333
Tempo 75030 41793 21600 60205 8600 1242 86527 90171
Tractor/Power tiller 102216 39992 20873 82710 6174 7159 190723 95207
Tourist vehicle 146389 37871
89760 1200 7000 121489 160700
Water tanker 118786 54167
175063
5034 305997 157106
Petrol tanker 101779 49720 15000 149345 3312 5448 260603 129664
Total 98374 92586 20551 130479 11392 6347 262418 130868
Table 11A: Total annual expenditure on employees (Percent) on different items by vehicle type
Type of Vehicle Salary
/Wage
Food
allowance
Housing
allowance
Daily
allowance
Welfare
fund
Other
allowances
Item
Total
Bus/Minibus 23.2 28.4 1.0 44.8 1.6 0.9 100
Truck/Minitruck/Tipper 41.5 28.3 0.4 26.5 1.0 2.3 100
Taxi 51.3 19.4 0.8 25.3 2.0 1.1 100
Jeep/Van 43.3 33.4 1.2 17.6 2.8 1.6 100
Microbus 36.5 31.6 0.8 28.6 1.7 0.9 100
Tempo 64.0 15.9 0.7 18.3 0.5 0.5 100
Tractor/Power tiller 51.0 13.9 0.9 31.4 0.9 2.0 100
Tourist vehicle 57.1 23.0 0.0 19.4 0.2 0.3 100
Water tanker 38.8 7.6 0.0 53.1 0.0 0.5 100
Petrol tanker 39.1 6.8 0.2 52.2 0.2 1.5 100
Total 34.4 26.1 0.8 35.8 1.4 1.4 100

19
Table 12: Average annual operational expenditure (Rupees) on different items by vehicle type
Type of Vehicle Fuel Lubric
ant
Spare
parts
Repair/Ma
intenance Rent
Member
ship fees
Frequent/
Daily fees
Route
permit
fees
Environ
ment test
fees
Others Item
Total
Bus/Minibus 794005 34848 24977 19528 12997 17225 53946 12291 404 15136 939862
Truck/Minitruck/Tipper 1078662 47210 42287 26949 12711 11460 23496 11164 408 33034 1242910
Taxi 247724 14086 12996 9768 10997 5806 12300 2857 124 15320 302729
Jeep/Van 300638 25355 21847 12861 7217 18029 31886 10404 396 17318 410458
Microbus 524662 45552 28224 21049 11325 7835 49194 15931 286 17672 679619
Tempo 116708 9324 10332 8933 4699 14195 14344 8008 629 12336 173818
Tractor/Power tiller 360891 19103 17312 10919 15047 3384 11783 5270 737 52831 446577
Tourist vehicle 220308 17900 9512 4911 12750 14836 30888 70 464 3200 282011
Water tanker 693698 45778 34429 24586
12000 12480
339 2575 812801
Petrol tanker 680703 48719 29706 20931 16000 9761 20707 3144 515 15874 805609
Total 658437 33200 26470 18319 12075 11674 34557 10005 395 25037 786001
Table 13: Average annual other expenditure (Rupees) on different items by vehicle type
Type of Vehicle Vehicle
Insurance
Passenger
Insurance
Bank
Commission Compensation
Donation
/Gift Other
Item
Total
Bus/Minibus 23537 14129 27305 94617 6254 12621 71926
Truck/Minitruck/Tipper 22113
69490 55307 6983 17858 55703
Taxi 14856 6414 5869 10871 3070 3359 17190
Jeep/Van 16432 5535 13736 26755 4238 7491 28675
Microbus 20688 9109 32750 52668 5212 10258 51050
Tempo 5494 5477
15155 1658 3481 10423
Tractor/Power tiller 14991
5000 113079 4208 11524 43798
Tourist vehicle 21655 20194
20667 1317 52033 39435
Water tanker 16116
214600 7000 14837 100886
Petrol tanker 21626
30667 63917 6028 11580 45135
Total 20549 10895 31857 73679 5475 13211 51791

20
Table 14: Annual financial transaction (Rupees) by vehicle type
Received/Purchased Given/Sold
Type of Vehicle Loan Interest Other Item Total Loan Interest Other Item Total
Bus/Minibus 621899 48000
622268 329240 216200 70000 220480
Truck/Minitruck/Tipper 665162
15700 665467 270005 303979
305102
Taxi 399518
399518
82542
82542
Jeep/Van 495811
495811 185000 186400
186371
Microbus 769909
769909
227980 60000 230002
Tempo 369363 48000
349271
127335
127335
Tractor/Power tiller 366119
366119 179155 139438
145830
Tourist vehicle 2240000
2240000
461547
461547
Water tanker
266000
266000
Petrol tanker 825000
825000
506750
506750
Total 579854 48000 15700 579088 238635 220376 65906 222230
Table 15: Annual amount of capital investment (Rupees) on different items by vehicle type
Type of Vehicle Vehicle Garage/
Building
Main
engine
Tyre/
Tube
Body
building
Capital
repair
Machine/
Equipment Other
Item
Total
Bus/Minibus 1958270 40478 81542 103780 90812 52373 18151 16773 337374
Truck/Minitruck/Tipper 1809474 200000 81134 183036 61106 55962 20803 10298 286458
Taxi 1018328 20900 31458 20823 22763 16774 6291 9089 132193
Jeep/Van 1355812 277383 69964 52094 42228 36178 13133 22457 221810
Microbus 2770847 17345 85359 52576 29904 34933 11565 9731 204090
Tempo 564438 350000 106315 22408 18098 17267 9921 4204 155949
Tractor/Power tiller 1091081 23260 59314 54644 27810 27562 13606 6391 145143
Tourist vehicle 3200000
18900 27085 9500 13250
50000 251240
Water tanker
70000 94769 19750 56111 21000 12000 152643
Petrol tanker
53615 120107 109800 72552 13400 11800 207020
Total 1583324 102863 73693 98368 60644 44528 15784 13461 252371
21
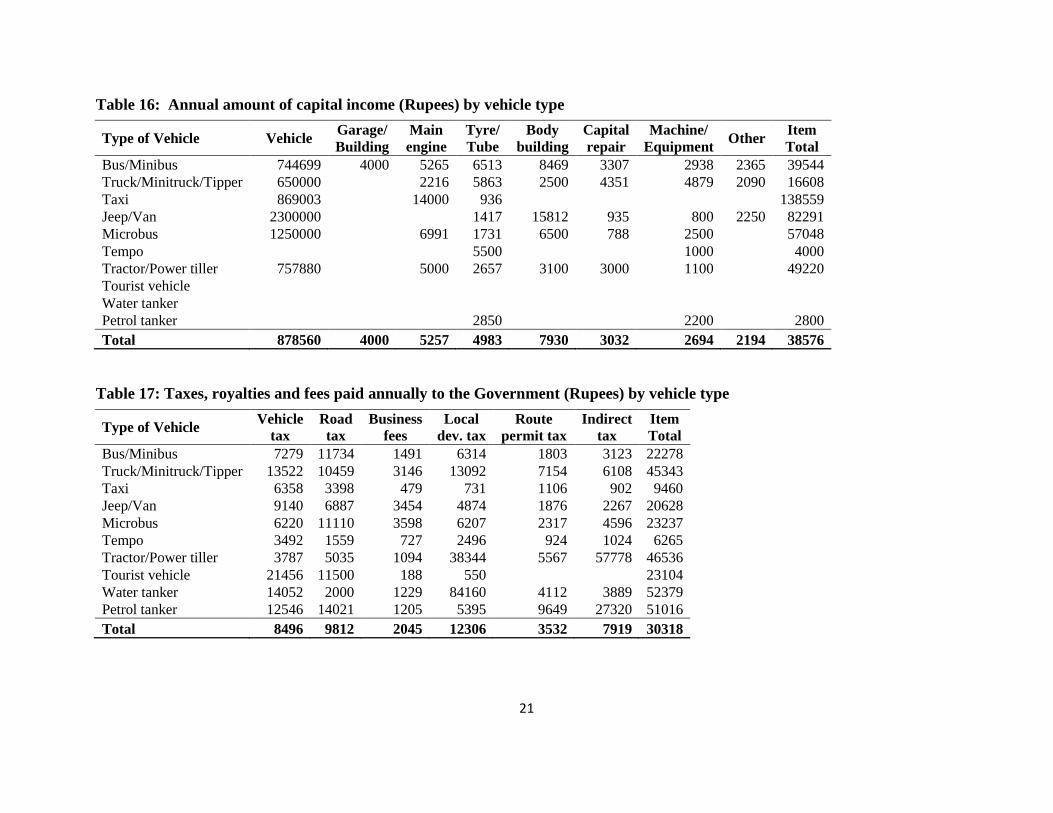
Table 16: Annual amount of capital income (Rupees) by vehicle type
Type of Vehicle Vehicle Garage/
Building
Main
engine
Tyre/
Tube
Body
building
Capital
repair
Machine/
Equipment Other
Item
Total
Bus/Minibus 744699 4000 5265 6513 8469 3307 2938 2365 39544
Truck/Minitruck/Tipper 650000
2216 5863 2500 4351 4879 2090 16608
Taxi 869003
14000 936
138559
Jeep/Van 2300000
1417 15812 935 800 2250 82291
Microbus 1250000
6991 1731 6500 788 2500
57048
Tempo
5500
1000
4000
Tractor/Power tiller 757880
5000 2657 3100 3000 1100
49220
Tourist vehicle
Water tanker
Petrol tanker
2850
2200
2800
Total 878560 4000 5257 4983 7930 3032 2694 2194 38576
Table 17: Taxes, royalties and fees paid annually to the Government (Rupees) by vehicle type
Type of Vehicle Vehicle
tax
Road
tax
Business
fees
Local
dev. tax
Route
permit tax
Indirect
tax
Item
Total
Bus/Minibus 7279 11734 1491 6314 1803 3123 22278
Truck/Minitruck/Tipper 13522 10459 3146 13092 7154 6108 45343
Taxi 6358 3398 479 731 1106 902 9460
Jeep/Van 9140 6887 3454 4874 1876 2267 20628
Microbus 6220 11110 3598 6207 2317 4596 23237
Tempo 3492 1559 727 2496 924 1024 6265
Tractor/Power tiller 3787 5035 1094 38344 5567 57778 46536
Tourist vehicle 21456 11500 188 550
23104
Water tanker 14052 2000 1229 84160 4112 3889 52379
Petrol tanker 12546 14021 1205 5395 9649 27320 51016
Total 8496 9812 2045 12306 3532 7919 30318

22
Table 18: Annual income from the sale of services (Rupees) by vehicle type
Type of Vehicle Transport
service Contract Other Item Total
Bus/Minibus 2008513 144701 65474 2031398
Truck/Minitruck/Tipper 2568339 46279 78584 2575737
Taxi 608750 100247 22778 624892
Jeep/Van 954082 32131 60316 965399
Microbus 1496701 129992 19784 1512971
Tempo 566588 6000 2195 567189
Tractor/Power tiller 1018446 186471 113936 1033206
Tourist vehicle 848200 2500
848332
Water tanker 1864514
1864514
Petrol tanker 1704117
1704117
Total 1688171 106127 59891 1701701
Table 19: Other annual income (Rupees) by vehicle type
Type of Vehicle House
rent
Vehicle
rent Compensation
Vehicle
insurance Other
Item
Total
Bus/Minibus 107230 66322 52963 177668 28500 91837
Truck/Minitruck/Tipper 50000 50447 20251 101814 500000 73648
Taxi 28151 45489 11754 100000 6500 31819
Jeep/Van 60000 86899 17764 50000 60000 88664
Microbus 20000 50545 36240 118699 45000 66130
Tempo
12661 66500
19810
Tractor/Power tiller 18473 69388 53631 242833 118182 106361
Tourist vehicle 12000
7000
9500
Water tanker
50000
50000
Petrol tanker
483000 12000 200000
294500
Total 72153 68315 32855 147255 108499 85576

23
Annex I
Name List of Survey Team
Annex 1.1: Name list of the core team
S.No. Name Designation Office
1 Uttam Narayan Malla Director General Central Bureau of Statistics (CBS)
2 Suman Raj Aryal Deputy Director General Economic Statistics Division, CBS
3 Kapil Prasad Timalsena Statistics Officer Trade Statistics Section, CBS
4 Shantwana Sharma Statistics Officer Trade Statistics Section, CBS
5 Bhim Bahadur Sakha Statistics Assistant Trade Statistics Section, CBS
6 Surya Tamang Office Assistant Trade Statistics Section, CBS
Annex 1.2: Name list of the survey report team
S.No. Name Designation Office
1 Bikash Bista Director General Central Bureau of Statistics (CBS)
2 Suman Raj Aryal Deputy Director General Economic Statistics Division, CBS
3 Ram Hari Gaihre Director Trade Statistics Section, CBS
4 Nava Raj Lamsal Director Trade Statistics Section, CBS
5 Kapil Prasad Timalsena Statistics Officer Trade Statistics Section, CBS
6 Shantwana Sharma Statistics Officer Trade Statistics Section, CBS
7 Bhim Bahadur Sakha Statistics Assistant Trade Statistics Section, CBS
8 Prabha Pokharel Statistics Assistant Trade Statistics Section, CBS

24
Annex 1.3: Name list of heads of the Branch Statistics Offices involved in the survey
training
S. No. Name Deputation BSO Training Centre
1 Ghan Shyam Sapkota Supervisor Baglung Butwal, Rupandehi
2 Kapil Dev Joshi Statistics Officer Bajura Butwal, Rupandehi
3 Pom Narayan Poudel Statistics Officer Banke Butwal, Rupandehi
4 Laxman Kandel Statistics Officer Dang Butwal, Rupandehi
5 Dan Bahadur Airi Supervisor Doti Butwal, Rupandehi
6 Shiva Raj Neupane Statistics Officer Gorkha Butwal, Rupandehi
7 Pramod Kumar Gurung Supervisor Jumla Butwal, Rupandehi
8 Padam Raj Pandey Statistics Officer Kanchanpur Butwal, Rupandehi
9 Aniruddha Prasad Upadhyay Statistics Officer Kapilbastu Butwal, Rupandehi
10 Ram Bandhu Regmi Statistics Officer Kaski Butwal, Rupandehi
11 Kamal Prasad Nepal Statistics Officer Palpa Butwal, Rupandehi
12 Tulsi Ram Pokhrel Statistics Officer Pyuthan Butwal, Rupandehi
13 Moti Ram Rokka Supervisor Surkhet Butwal, Rupandehi
14 Jagu Lal Basyal Director Syangja Butwal, Rupandehi
15 Lila Prasad Mishra Director Chitwan Butwal, Rupandehi
16 Krishna Raj Pandey Statistics Officer Bhojpur Itahari, Sunsari
17 Purna Bahadur Gharti Magar Statistics Officer Dhankuta Itahari, Sunsari
18 Pravin Kumar Chaudhari Supervisor Dhanusha Itahari, Sunsari
19 Vinaya Kumar Pandey Statistics Officer Mahottari Itahari, Sunsari
20 Nanda Lal Sapkota Statistics Officer Makwanpur Itahari, Sunsari
21 Ashok Kumar Bhattarai Statistics Officer Morang Itahari, Sunsari
22 Tika Ram Mahato Statistics Officer Okhaldhunga Itahari, Sunsari
23 Surya Kumar Kuinkel Statistics Officer Panchthar Itahari, Sunsari
24 Nava Raj Poudel Statistics Officer Parsa Itahari, Sunsari
25 Tika Ram Sharma Statistics Officer Sindhuli Itahari, Sunsari
26 Bodh Prasad Acharya Statistics Officer Sunsari Itahari, Sunsari
27 Subhas Adhikari Statistics Officer Udayapur Itahari, Sunsari
28 Dinanath Lamsal Statistics Officer Kavre Itahari, Sunsari
29 Dharma Ratna Bajracharya Statistics Officer Kathmandu Itahari, Sunsari
30 Nava Raj Lamsal Statistics Officer Nuwakot Itahari, Sunsari

25
Annex 1.4: Name list of enumerators and supervisors involved in the survey training
S.No. Name Deputation BSO Training Centre
1 Radhika Thapa Magar Enumerator Baglung Butwal, Rupandehi
2 Ram Chandra Subedi Enumerator Baglung Butwal, Rupandehi
3 Surendra Prasad Panta Enumerator Bajura Butwal, Rupandehi
4 Lanka Bahadur Bom Supervisor Banke Butwal, Rupandehi
5 Arun Vitu Upadhyay Enumerator Banke Butwal, Rupandehi
6 Nirmal Regmi Nayab Subba Dang Butwal, Rupandehi
7 Madhav Poudel Kharidar Dang Butwal, Rupandehi
8 Tek Bahadur Gharti Enumerator Doti Butwal, Rupandehi
9 Sita Ram Surseli Kharidar Gorkha Butwal, Rupandehi
10 Janak Bahadur Bohara Enumerator Jumla Butwal, Rupandehi
11 Shambhu Narayan Panta Supervisor Kanchanpur Butwal, Rupandehi
12 Lal Bahadur Nepali Kharidar Kanchanpur Butwal, Rupandehi
13 Kamal Poudel Supervisor Kapilbastu Butwal, Rupandehi
14 Ram Chandra Wagle Enumerator Kapilbastu Butwal, Rupandehi
15 Kalu Ram Mandal Kharidar Kapilbastu Butwal, Rupandehi
16 Ram Prasad Wagle Statistics Officer Kaski Butwal, Rupandehi
17 Govinda Poudel Kharidar Kaski Butwal, Rupandehi
18 Surya Giri Kharidar Kaski Butwal, Rupandehi
19 Dipak Koirala Statistics Officer Kathmandu Butwal, Rupandehi
20 Krishna Chaulagain Enumerator Kathmandu Butwal, Rupandehi
21 Mingma Sherpa Kharidar Nuwakot Butwal, Rupandehi
22 Kanta Lal Chaudhari Supervisor Palpa Butwal, Rupandehi
23 Shiva Sharma Parajuli Enumerator Pyuthan Butwal, Rupandehi
24 Krishna Prasad Dhungana Account Surkhet Butwal, Rupandehi
25 Rajendra Prasad Chaudhari Supervisor Surkhet Butwal, Rupandehi
26 Surendra Raj Poudel Supervisor Syangja Butwal, Rupandehi
27 Bishwa Darshan Dhungana Supervisor Chitwan Itahari, Sunsari
28 Renu Ghimire Supervisor Chitwan Itahari, Sunsari
29 Manu Pokharel Enumerator Bhojpur Itahari, Sunsari
30 Kamal Kumar Lamichhane Kharidar Dhankuta Itahari, Sunsari
31 Bij Kumar Yadam Supervisor Dhanusha Itahari, Sunsari
32 Raj Kishor Shah Supervisor Mahottari Itahari, Sunsari
33 Indira Neupane Kharidar Makwanpur Itahari, Sunsari
34 Urmila Sahi Supervisor Makwanpur Itahari, Sunsari
35 Ram Krishna Ghimire Enumerator Makwanpur Itahari, Sunsari
36 Bishnu Prasad Adhikari Supervisor Makwanpur Itahari, Sunsari
37 Tulasa Baral Supervisor Morang Itahari, Sunsari
38 Mithila Adhikari Kharidar Morang Itahari, Sunsari
39 Ramesh Shrestha Enumerator Morang Itahari, Sunsari
40 Subas Adhikari Enumerator Okhaldhunga Itahari, Sunsari
41 Nava Raj Shrestha Supervisor Panchthar Itahari, Sunsari
42 Devi Prasasd Humagain Enumerator Panchthar Itahari, Sunsari
26
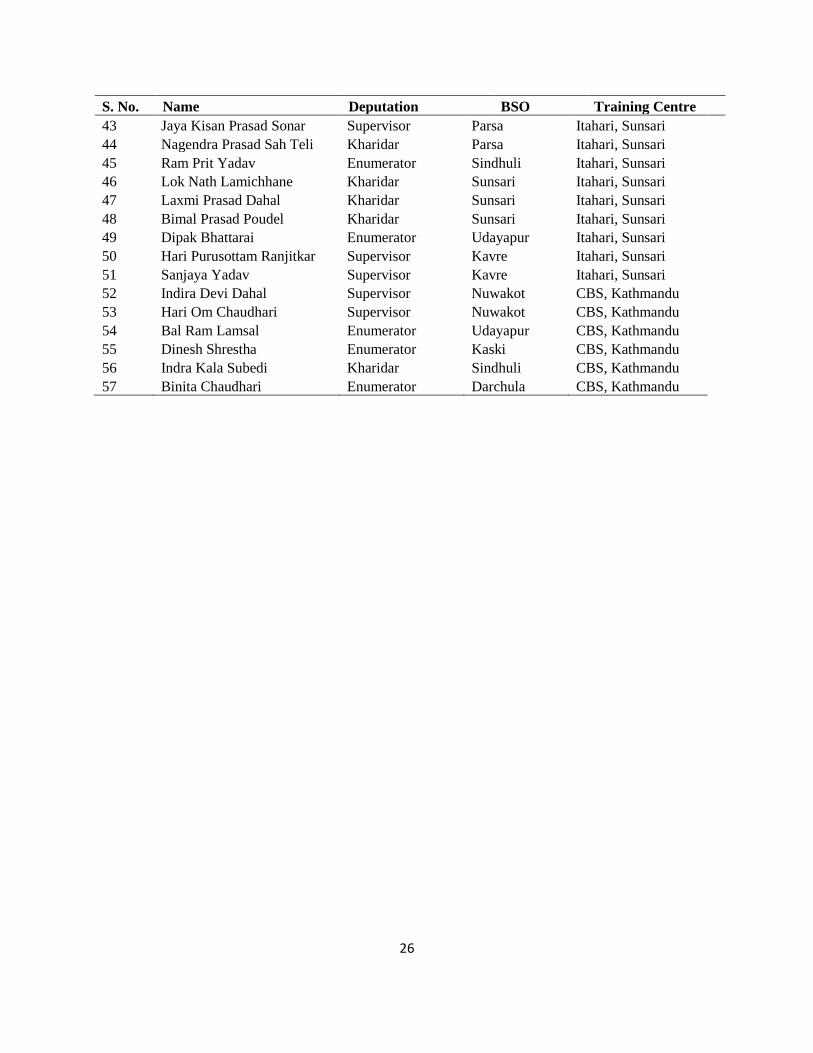
S. No. Name Deputation BSO Training Centre
43 Jaya Kisan Prasad Sonar Supervisor Parsa Itahari, Sunsari
44 Nagendra Prasad Sah Teli Kharidar Parsa Itahari, Sunsari
45 Ram Prit Yadav Enumerator Sindhuli Itahari, Sunsari
46 Lok Nath Lamichhane Kharidar Sunsari Itahari, Sunsari
47 Laxmi Prasad Dahal Kharidar Sunsari Itahari, Sunsari
48 Bimal Prasad Poudel Kharidar Sunsari Itahari, Sunsari
49 Dipak Bhattarai Enumerator Udayapur Itahari, Sunsari
50 Hari Purusottam Ranjitkar Supervisor Kavre Itahari, Sunsari
51 Sanjaya Yadav Supervisor Kavre Itahari, Sunsari
52 Indira Devi Dahal Supervisor Nuwakot CBS, Kathmandu
53 Hari Om Chaudhari Supervisor Nuwakot CBS, Kathmandu
54 Bal Ram Lamsal Enumerator Udayapur CBS, Kathmandu
55 Dinesh Shrestha Enumerator Kaski CBS, Kathmandu
56 Indra Kala Subedi Kharidar Sindhuli CBS, Kathmandu
57 Binita Chaudhari Enumerator Darchula CBS, Kathmandu

27
Annex 1.5: List of Survey Materials distributed to Enumerators during Training
S. No. of Number of Survey Instruments
No. BSO Sample Questionnaires Manuals Note Pads Remarks
1 Baglung 39 76 6 5
2 Bajura 2 4 2 5
3 Banke 51 96 6 7
4 Bhojpur 13 28 6 5
5 Chitwan 66 130 6 7
6 Dandeldhura 0 0 6 5
7 Dang 48 104 6 7
8 Darchula 0 0 6 5
9 Dhankuta 10 20 6 5
10 Dhanusha 21 34 6 5
11 Doti 5 12 2 5
12 Gorkha 32 64 6 5
13 Jumla 8 18 6 5
14 Kanchanpur 50 100 6 7
15 Kapilbastu 193 254 6 7
16 Kaski 198 386 6 7
17 CBS 230 350 6 7
18 Kathmandu 75 154 6 7
19 Kavre 23 46 6 7
20 Mahottari 8 18 2 5
21 Makwanpur 289 578 6 10
22 Morang 79 150 6 7
23 Nuwakot 4 8 2 5
24 Okhaldhunga 5 8 2 5
25 Palpa 37 74 6 5
26 Panchthar 26 50 6 5
27 Parsa 60 126 6 7
28 Pyuthan 8 16 6 5
29 Rukum 0 0 6 5
30 Sindhuli 2 4 2 5
31 Sunsari 71 142 6 7
32 Surkhet 31 60 6 5
33 Syangja 27 54 6 5
34 Udayapur 25 48 6 5
Total 1736 3212 180 199

28
Annex II
Enterprise Survey Questionnaire

29
Government of Nepal
National Planning Commission Secretariat
Central Bureau of Statistics
Nepal Public Land Transport Survey 2013
Reference Period: Fiscal Year 2011/12
All the information collected in this questionnaire will be confidential as per the Statistical Act
1958. They will be used collectively for statistical purposes only.
1. Introductory Information
1.1 Name of transport entrepreneur
1.2 Type of vehicle selected (Code*)
1.3 Plate number of vehicle selected
1.4 Country of manufacturing/Model number of vehicle selected
1.5 Name of affiliated Association/Committee
1.6 Address of transport entrepreneur
1.6.1 District
1.6.2 VDC/Municipality
1.6.3 Ward number/Village, Tole
1.7 Contact telephone/fax number of transport entrepreneur
1.8 Email address of transport entrepreneur
1.9 Starting year of operation of transport entrepreneurship
1.10 Number of days of operation of vehicle in the reference period
1.11 Number of similar types of vehicles operated in the reference period
*Code of the types of vehicle
Type of vehicle Code Type of vehicle Code Type of vehicle Code
Bus/Minibus …………. 1 Truck/Minitruck/Tipper... 2 Taxi ………………… 3
Jeep/Van ……………… 4 Microbus ………………. 5 Tempo ……………… 6
Tractor/Power tiller …… 7 Tourist vehicle (Taxi) …………. 8 Tourist vehicle (Bus) ………. 9
Water tanker …………. 10 Petrol tanker …………… 11
District code Form number

30
2. Employment: Number of regular employees in vehicle
S.
No. Type of
employees
Paid Unpaid Contract Total
Male Female Male Female Male Female Male Female 2.1 Manager/
Entrepreneur
2.2 Driver 2.3 Conductor 2.4 Helper 2.5 Other
3. Expenditure on transport employees: Salary, allowance and other benefits provided
to regular employees of the vehicle
S. No. Expenditure title Annual expenditure
(Rs.) 3.1 Salary/Wages (including festival allowance)
3.2 Food allowance
3.3 Housing allowance
3.4 Daily/Trip allowance
3.5 Welfare fund
3.6 Other expenditure on employees
4A. Operating expenditure: Expenditure incurred on operating business during the
reference period
S. No. Expenditure title Annual expenditure
(Rs.) 4.1.1 Fuel (Diesel, Petrol, etc.)
4.1.2 Lubricants and other oils
4.1.3 Minor spare parts
4.1.4 Minor repair and maintenance
4.1.5 Rent (Garage/Building)
4.1.6 Organization membership fees
4.1.7 Organization daily/frequent fees
4.1.8 Route permit fees paid to transport entrepreneurs'
association
4.1.9 Environment test fees
4.1.10 Other operating expenditure

31
4B. Other expenditure: Miscellaneous expenditure incurred during the reference
period
S. No. Expenditure title Annual expenditure
(Rs.)
4.2.1 Non-life (vehicle) insurance premium
4.2.2 Passenger life insurance premium
4.2.3 Bank commission
4.2.4 Compensation
4.2.5 Donation, gift
4.2.6 Other (Specify) …
5. Financial transaction: Financial transaction made during the reference period
S. No. Type of financial
transaction
Received/Purchased
annual expenditure (Rs.) Given/Sold annual
expenditure (Rs.)
5.1 Loan
5.2 Interest
5.3 Other
6. Capital expenditure: Capital expenditure and property gained during the reference
period
S. No. Description Purchased/Additional
annual cost (Rs.)
Purchased/Deduced
annual cost (Rs.)
6.1 Vehicle
6.2 Garage/Building
6.3 Main engine
6.4 Tyre/Tube
6.5 Body building
6.6 Capital repair & maintenance
6.7 Machine/Equipment
6.8 Other

32
7. Tax, royalty, fee: Tax, royalty, fee paid to the government and other institution
during the reference period
S. No. Description Annual amount
(Rs.) 7.1 Vehicle tax
7.2 Road tax
7.3 Enterprise registration, renewal and permit fee
7.4 Local government fee
7.5 Route permit fee (to the government)
7.6 Other indirect tax, royalty, fee, etc.
8A. Income: Income of transport entrepreneur from the sale of services during the
reference period
S. No. Description of income Annual income (Rs.)
8.1.1 Income from the sale of transport service
8.1.2 Income from contract
8.1.3 Other (Specify) …
8B. Other income: Income of transport entrepreneur from other transport activities
during the reference period
S. No. Description of income Annual income (Rs.) 8.2.1 Income from renting out building
8.2.2 Income from renting out vehicle
8.2.3 Amount received from compensation
8.2.4 Amount received from claim of vehicle insurance
8.2.5 Other (Specify) …

33
9. Miscellaneous
9.1 Which distance does your vehicle mainly travel during the reference year?
Short distance/Local level (Up to 25 k.m.) …..……1
Medium distance (26 to 100 k.m.) ………….…..…2
Long distance (Greater than 100 k.m.) ……………3
9.2 Normally, what is the operational age of your vehicle?
Name of enumerator:
Signature:
Date:
Name of officer/supervisor:
Signature:
Date:
Minimum Maximum
Operational age (years)
Name of respondent:
Designation:
Problems/Suggestions:

34
Annex III
Listing Form of Transport Entrepreneurs' Vehicles
S. No. District
Transport
Entrepreneurs'
Association
Plate No. of Vehicle Name and Address of Transport Entrepreneur Type of
Vehicle Zone
Code
Vehicle
Number
Name of
Entrepreneur District VDC/NP
Ward
No.
Telepho
ne No.
Mobile
Phone No.
Type of Vehicle: 1. Bus/Minibus 2. Microbus (Diesel/Petrol/Gas) 3. Tempo (Diesel/Gas/Battery) 4. Taxi 5. Jeep/Van 6. Truck/Minitruck/Tipper
7. Tractor/Power tiller 8. Tourist vehicle (Taxi) 9. Tourist vehicle (Bus) 10. Water Tanker 11. Petrol Tanker

35
Annex IV
Survey Glimpses
Training of heads of the Branch Statistics Offices involved in the survey