global land transport infrastructure requirements · pdf fileglobal land transport...
TRANSCRIPT

2013
GLOBAL LAND TRANSPORT INFRASTRUCTURE REQUIREMENTS
Estimating road and railway infrastructure capacity and costs to 2050
INFORMATION PAPER
John DULAC

2013
This paper reflects the views of the IEA Secretariat but does not necessarily reflect the views or policies of the IEA’s individual member countries. The paper does not constitute advice on any specific issue or situation. The IEA makes no representation or
warranty, express or implied, in respect of the paper’s content (including its completeness or accuracy) and shall not be responsible for any use of, or reliance on, the paper. Comments are welcome, directed to [email protected].
John DULAC
GLOBAL LAND TRANSPORT INFRASTRUCTURE REQUIREMENTS
Estimating road and railway infrastructure capacity and costs to 2050
INTERNATIONAL ENERGY AGENCY
The International Energy Agency (IEA), an autonomous agency, was established in November 1974. Its primary mandate was – and is – two-fold: to promote energy security amongst its member
countries through collective response to physical disruptions in oil supply, and provide authoritative research and analysis on ways to ensure reliable, affordable and clean energy for its 28 member countries and beyond. The IEA carries out a comprehensive programme of energy co-operation among its member countries, each of which is obliged to hold oil stocks equivalent to 90 days of its net imports. The Agency’s aims include the following objectives:
n Secure member countries’ access to reliable and ample supplies of all forms of energy; in particular, through maintaining effective emergency response capabilities in case of oil supply disruptions.
n Promote sustainable energy policies that spur economic growth and environmental protection in a global context – particularly in terms of reducing greenhouse-gas emissions that contribute to climate change.
n Improve transparency of international markets through collection and analysis of energy data.
n Support global collaboration on energy technology to secure future energy supplies and mitigate their environmental impact, including through improved energy
efficiency and development and deployment of low-carbon technologies.
n Find solutions to global energy challenges through engagement and dialogue with non-member countries, industry, international
organisations and other stakeholders.IEA member countries:
Australia Austria
Belgium Canada
Czech RepublicDenmark
Finland France
GermanyGreece
HungaryIreland
ItalyJapan
Korea (Republic of)LuxembourgNetherlandsNew Zealand NorwayPolandPortugalSlovak RepublicSpainSwedenSwitzerland
TurkeyUnited Kingdom
United States
The European Commission also participates in
the work of the IEA.
© OECD/IEA, 2013International Energy Agency
9 rue de la Fédération 75739 Paris Cedex 15, France
www.iea.org
Please note that this publication is subject to specific restrictions that limit its use and distribution.
The terms and conditions are available online at http://www.iea.org/termsandconditionsuseandcopyright/
© OECD/IEA 2013 Global Land Transport Infrastructure Requirements Estimating road and railway infrastructure capacity and costs to 2050
Page | 3
Table of contents Acknowledgements ................................................................................................................... 5
Executive summary ................................................................................................................... 6
Introduction .............................................................................................................................. 8
Limitations of the study ........................................................................................................... 10
Data collection ........................................................................................................................ 11
Road infrastructure ................................................................................................................. 11
Bus rapid transit ............................................................................................................... 12
Rail infrastructure .................................................................................................................... 13
High‐speed rail ................................................................................................................. 13
Scenario introduction .............................................................................................................. 15
4DS results .............................................................................................................................. 16
Road ......................................................................................................................................... 16
Spotlight on BRT ............................................................................................................... 18
Spotlight on parking ......................................................................................................... 19
Rail ........................................................................................................................................... 20
Spotlight on HSR .............................................................................................................. 21
Cost estimates ......................................................................................................................... 22
2DS comparison ...................................................................................................................... 25
Road ......................................................................................................................................... 25
BRT ................................................................................................................................... 26
Parking ............................................................................................................................. 26
Rail ........................................................................................................................................... 27
HSR ................................................................................................................................... 27
Conclusions ............................................................................................................................. 29
Annex ...................................................................................................................................... 31
IEA MoMo regions ................................................................................................................... 31
Historic infrastructure database .............................................................................................. 31
Infrastructure cost database ................................................................................................... 34
Road ................................................................................................................................. 36
Rail ................................................................................................................................... 38
Projection methodology .......................................................................................................... 39
Road ................................................................................................................................. 40
BRT estimates .................................................................................................................. 43
Parking estimates ............................................................................................................. 44
Rail ........................................................................................................................................... 45
High‐speed rail estimates ................................................................................................ 46
Acronyms, abbreviations and units of measure ....................................................................... 49
Acronyms and abbreviations ................................................................................................... 49
Units of measure ..................................................................................................................... 49
References .............................................................................................................................. 50
Global Land Transport Infrastructure Requirements © OECD/IEA 2013 Estimating road and railway infrastructure capacity and costs to 2050
Page | 4
List of figures
Figure 1 • Expected global travel growth in the 4DS ........................................................................ 8
Figure 2 • Historic paved roadway lane‐km (left axis) and BRT trunk‐km (right axis) .................... 11
Figure 3 • Global BRT development (trunk corridors) .................................................................... 12
Figure 4 • Historic global rail track‐km (left axis) and HSR track‐km (right axis) ............................ 13
Figure 5 • Historic and expected global HSR development ............................................................ 14
Figure 6 • 4DS roadway projections ............................................................................................... 16
Figure 7 • 4DS roadway occupancy levels ...................................................................................... 17
Figure 8 • 4DS BRT projections ....................................................................................................... 19
Figure 9 • 4DS parking projections ................................................................................................. 19
Figure 10 • 4DS railway projections ................................................................................................ 20
Figure 11 • 4DS HSR projections ..................................................................................................... 21
Figure 12 • 4DS annual infrastructure expenditure projections ..................................................... 23
Figure 13 • 2DS roadway projections ............................................................................................. 25
Figure 14 • 2DS BRT network projections ....................................................................................... 26
Figure 15 • 2DS parking projections ............................................................................................... 26
Figure 16 • 2DS railway projections ................................................................................................ 27
Figure 17 • 4DS HSR network and 2DS HSR network potential ...................................................... 28
Figure 18 • Global paved lane‐km using linear historic projections ............................................... 40
Figure 19 • Average historic roadway occupancy levels for several global regions (2000‐10) ...... 41
Figure 20 • Historic passenger travel (pkm) to HSR track‐km ........................................................ 47
List of tables
Table 1 • Land transport infrastructural additions to 2050 ............................................................ 29
Table 2 • Countries, regions and aggregate regions analysed in the IEA MoMo ........................... 31
Table 3 • Data availability ............................................................................................................... 32
Table 4 • Collected data in country‐year points in select regions .................................................. 35
Table 5 • Observed cost range to build new road, rail and parking infrastructure, 2010 (in thousand USD) ............................................................................................................ 35
Table 6 • Roadway cost assumptions (thousand USD per paved lane‐km, 2010) .......................... 37
Table 7 • Parking cost assumptions (million USD per km2) ............................................................ 38
Table 8 • Railway cost assumptions (thousand USD per track‐km, 2010) ...................................... 39
Table 9 • Historic and applied road construction capacity limits for select global regions ............ 41
Table 10 • Historic and applied road density limits for select global regions ................................ 42
Table 11 • Parking space and size assumptions (per PLDV, in m2) ................................................. 44
Table 12 • Applied rail construction capacity limits for select global regions ................................ 45
Table 13 • Applied rail density limits for select global regions ....................................................... 46
List of boxes
Box 1 • The IEA Mobility Model (MoMo) .......................................................................................... 9
Box 2 • Supply and demand: estimating road additions to maintain global occupancy levels ...... 18
Box 3 • Roadway limitations: accounting for useable land ............................................................ 18

© OECD/IEA 2013 Global Land Transport Infrastructure Requirements Estimating road and railway infrastructure capacity and costs to 2050
Page | 5
Acknowledgements This publication was prepared by the International Energy Agency (IEA) Directorate of Sustainable Energy Policy and Technology (SPT). It was developed under the lead of John Dulac. The IEA Mobility Model (MoMo) team, including François Cuenot, Hiroyuki Kaneko, Alex Koerner and Tali Trigg, provided significant input and support throughout the development of this publication and the supporting infrastructure development module. Lew Fulton, former Head of the Energy Technology Policy Division, also provided significant guidance and input.
This work was guided by Bo Diczfaluzy, former Director of SPT, Didier Houssin, Director of SPT, Jean‐François Gagné, Head of the Energy Technology Policy Division, and Cecilia Tam, Head of the Energy Demand Technology Unit, all of whom provided valuable input and guidance. A special thanks to Annette Hardcastle for her support on the production of this report. In the IEA Communication and Information Office, Cheryl Haines edited this report, and Bertrand Sadin and Angela Gosmann provided graphic design and layout.
Special thanks go to the International Road Federation (IRF), International Union of Railways (UIC) and World Resources Institute Center for Sustainable Transport (EMBARQ). The data they provided was invaluable in the development of the IEA’s database on historic land transport infrastructure. A special thank you to the Asian Development Bank (ADB) and International Transport Forum (ITF), who have supported the Agency’s efforts to collect project cost data and government transport budgets.
For more information on this publication, please contact:
John Dulac, IEA Energy Analyst
Email: [email protected]
Global Land Transport Infrastructure Requirements © OECD/IEA 2013 Estimating road and railway infrastructure capacity and costs to 2050
Page | 6
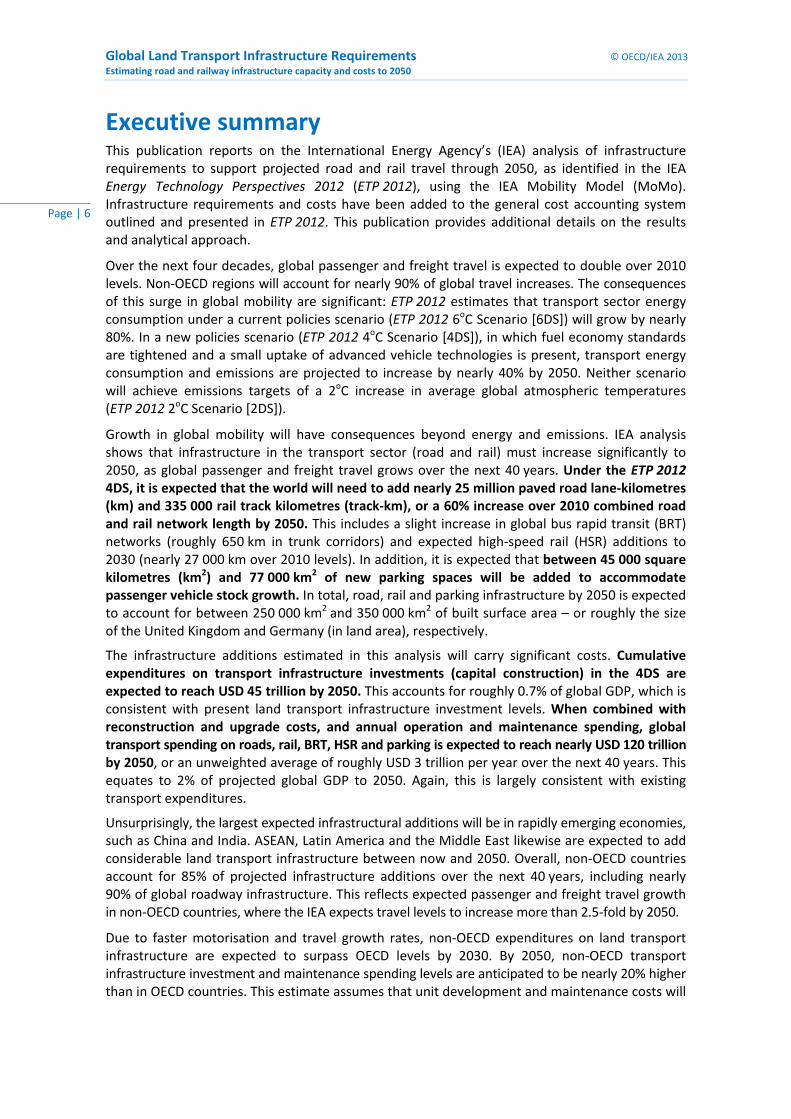
Executive summary This publication reports on the International Energy Agency’s (IEA) analysis of infrastructure requirements to support projected road and rail travel through 2050, as identified in the IEA Energy Technology Perspectives 2012 (ETP 2012), using the IEA Mobility Model (MoMo). Infrastructure requirements and costs have been added to the general cost accounting system outlined and presented in ETP 2012. This publication provides additional details on the results and analytical approach.
Over the next four decades, global passenger and freight travel is expected to double over 2010 levels. Non‐OECD regions will account for nearly 90% of global travel increases. The consequences of this surge in global mobility are significant: ETP 2012 estimates that transport sector energy consumption under a current policies scenario (ETP 2012 6oC Scenario [6DS]) will grow by nearly 80%. In a new policies scenario (ETP 2012 4oC Scenario [4DS]), in which fuel economy standards are tightened and a small uptake of advanced vehicle technologies is present, transport energy consumption and emissions are projected to increase by nearly 40% by 2050. Neither scenario will achieve emissions targets of a 2oC increase in average global atmospheric temperatures (ETP 2012 2oC Scenario [2DS]).
Growth in global mobility will have consequences beyond energy and emissions. IEA analysis shows that infrastructure in the transport sector (road and rail) must increase significantly to 2050, as global passenger and freight travel grows over the next 40 years. Under the ETP 2012 4DS, it is expected that the world will need to add nearly 25 million paved road lane‐kilometres (km) and 335 000 rail track kilometres (track‐km), or a 60% increase over 2010 combined road and rail network length by 2050. This includes a slight increase in global bus rapid transit (BRT) networks (roughly 650 km in trunk corridors) and expected high‐speed rail (HSR) additions to 2030 (nearly 27 000 km over 2010 levels). In addition, it is expected that between 45 000 square kilometres (km2) and 77 000 km2 of new parking spaces will be added to accommodate passenger vehicle stock growth. In total, road, rail and parking infrastructure by 2050 is expected to account for between 250 000 km2 and 350 000 km2 of built surface area – or roughly the size of the United Kingdom and Germany (in land area), respectively.
The infrastructure additions estimated in this analysis will carry significant costs. Cumulative expenditures on transport infrastructure investments (capital construction) in the 4DS are expected to reach USD 45 trillion by 2050. This accounts for roughly 0.7% of global GDP, which is consistent with present land transport infrastructure investment levels. When combined with reconstruction and upgrade costs, and annual operation and maintenance spending, global transport spending on roads, rail, BRT, HSR and parking is expected to reach nearly USD 120 trillion by 2050, or an unweighted average of roughly USD 3 trillion per year over the next 40 years. This equates to 2% of projected global GDP to 2050. Again, this is largely consistent with existing transport expenditures.
Unsurprisingly, the largest expected infrastructural additions will be in rapidly emerging economies, such as China and India. ASEAN, Latin America and the Middle East likewise are expected to add considerable land transport infrastructure between now and 2050. Overall, non‐OECD countries account for 85% of projected infrastructure additions over the next 40 years, including nearly 90% of global roadway infrastructure. This reflects expected passenger and freight travel growth in non‐OECD countries, where the IEA expects travel levels to increase more than 2.5‐fold by 2050.
Due to faster motorisation and travel growth rates, non‐OECD expenditures on land transport infrastructure are expected to surpass OECD levels by 2030. By 2050, non‐OECD transport infrastructure investment and maintenance spending levels are anticipated to be nearly 20% higher than in OECD countries. This estimate assumes that unit development and maintenance costs will

© OECD/IEA 2013 Global Land Transport Infrastructure Requirements Estimating road and railway infrastructure capacity and costs to 2050
Page | 7
continue to be somewhat less expensive in non‐OECD countries: with nearly 45% more infrastructure than in OECD countries by 2050, 20% more spending is most likely a conservative estimate.
If countries pursue travel “avoid and shift” policies, as recommended in ETP 2012, global transport infrastructure requirements could be reduced considerably. With nearly 23% fewer vehicle kilometres of travel in 2050 in the 2DS, roadway additions decrease by more than 10 million lane‐km as road passenger and freight travel are either shifted (e.g. to bus or to rail) or eliminated (e.g. due to land use changes). Global passenger vehicle parking is also expected to decrease substantially in the 2DS – to nearly 27 000 km2 less than estimated in 4DS projections. In contrast, global rail additions would need to increase in the 2DS to accommodate greater rail travel: nearly 200 000 track‐km above 4DS projections, including nearly 90 000 km of additional HSR over expected 4DS HSR additions to 2030. BRT networks in the 2DS grow to more than 25 000 trunk‐km by 2050, a ten‐fold increase over 4DS projections.
Despite increases in expenditures on rail, HSR and BRT infrastructure in the 2DS, cumulative global land transport infrastructure spending decreases by nearly USD 20 trillion over 4DS estimates. The bulk of those savings come from reduced roadway investment and maintenance costs, which account for nearly USD 15 trillion of total projected savings. Parking reductions also save roughly USD 10 trillion over 4DS spending levels, while rail expenditures (including HSR) increase by nearly USD 3.5 trillion. BRT network additions under the 2DS add another USD 350 billion over 4DS spending levels (only one‐tenth of the increased rail costs).
Cost estimates presented in the 2DS do not include other transport investments related to shifts to more sustainable transport (e.g. purchases of additional trains and BRT buses). However, the considerable difference between road and parking savings over rail, BRT and HSR additions suggests that 2DS investments and maintenance costs are most likely to be far less than 4DS spending levels, even when those costs are included. In fact, ETP 2012 estimates show that global vehicles, fuels and infrastructure expenditures to 2050 are nearly USD 515 trillion in the 4DS. Transport expenditure estimates in the 2DS, including more expensive trains and buses, amount to roughly USD 465 trillion – representing net savings of USD 50 trillion, or USD 30 trillion in savings in vehicle and fuel expenditures and USD 20 trillion in infrastructure savings as identified in this analysis (IEA, 2012).
The potential shift of travel to more sustainable modes in the ETP 2012 2DS could result in significant estimated savings on infrastructure investments and maintenance costs. The infrastructure analysis presented in this publication is only a partial analysis of the effects of “avoid and shift” policies on society; however, the substantial savings estimated from infrastructure costs suggest that increased transit and intelligent land‐use planning should provide net mobility benefits with net reductions in transport spending, energy use and emissions – and therefore net benefits to society.
Global Land Transport Infrastructure Requirements © OECD/IEA 2013 Estimating road and railway infrastructure capacity and costs to 2050
Page | 8
Introduction In the past decade, global average per‐capita GDP increased nearly 75% (in real, 2010 USD), with average per‐capita GDP in regions such as China, India, Southeast Asia and Eastern Europe more than doubling (UNSD, 2010). This growth in wealth contributed to a considerable surge in demand for mobility, both in terms of passenger travel and in movement of goods. In particular, road and rail passenger and freight travel increased by 40%, or by 15 trillion annual person‐kilometres (pkm) and freight tonne‐kilometres (tkm) since 2000 – the equivalent of flying more than 400 million people around the circumference of the globe each year (IEA, 2012). Asia and the Pacific in particular accounted for more than half of that growth.
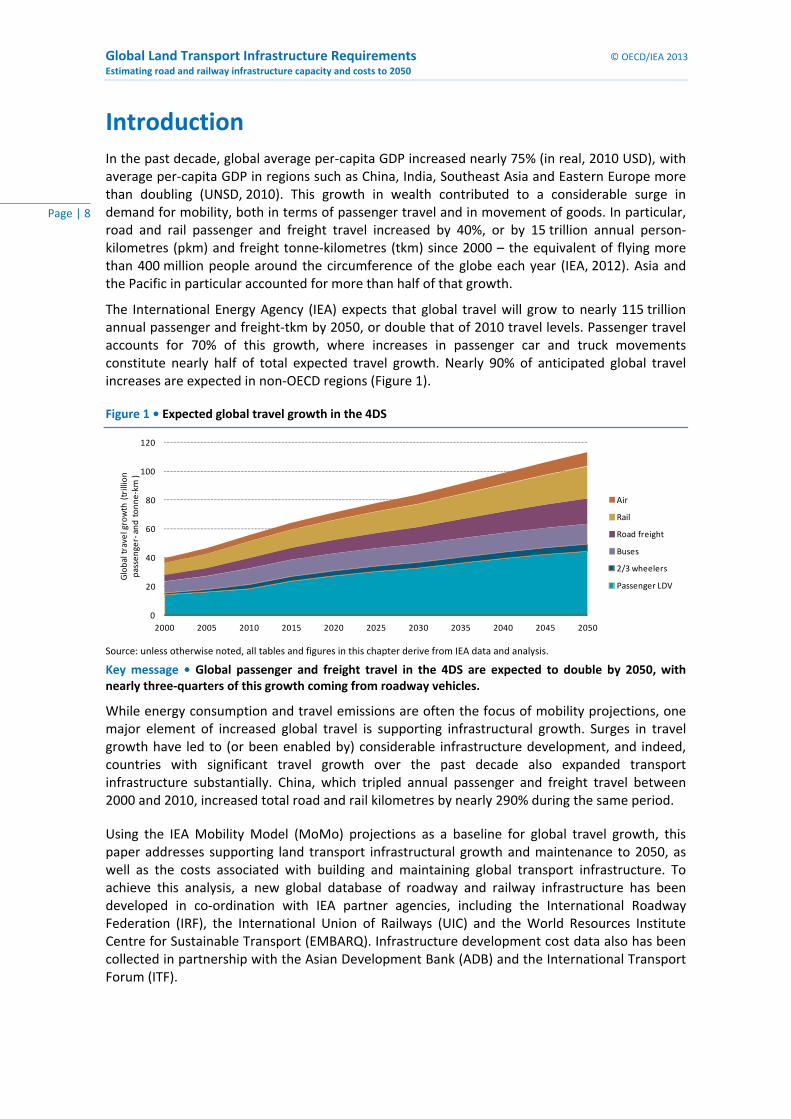
The International Energy Agency (IEA) expects that global travel will grow to nearly 115 trillion annual passenger and freight‐tkm by 2050, or double that of 2010 travel levels. Passenger travel accounts for 70% of this growth, where increases in passenger car and truck movements constitute nearly half of total expected travel growth. Nearly 90% of anticipated global travel increases are expected in non‐OECD regions (Figure 1).
Figure 1 • Expected global travel growth in the 4DS
Source: unless otherwise noted, all tables and figures in this chapter derive from IEA data and analysis.
Key message • Global passenger and freight travel in the 4DS are expected to double by 2050, with nearly three‐quarters of this growth coming from roadway vehicles.
While energy consumption and travel emissions are often the focus of mobility projections, one major element of increased global travel is supporting infrastructural growth. Surges in travel growth have led to (or been enabled by) considerable infrastructure development, and indeed, countries with significant travel growth over the past decade also expanded transport infrastructure substantially. China, which tripled annual passenger and freight travel between 2000 and 2010, increased total road and rail kilometres by nearly 290% during the same period.
Using the IEA Mobility Model (MoMo) projections as a baseline for global travel growth, this paper addresses supporting land transport infrastructural growth and maintenance to 2050, as well as the costs associated with building and maintaining global transport infrastructure. To achieve this analysis, a new global database of roadway and railway infrastructure has been developed in co‐ordination with IEA partner agencies, including the International Roadway Federation (IRF), the International Union of Railways (UIC) and the World Resources Institute Centre for Sustainable Transport (EMBARQ). Infrastructure development cost data also has been collected in partnership with the Asian Development Bank (ADB) and the International Transport Forum (ITF).
0
20
40
60
80
100
120
2000 2005 2010 2015 2020 2025 2030 2035 2040 2045 2050
Global travel growth (trillion
passenger‐and tonne‐km )
Air
Rail
Road freight
Buses
2/3 wheelers
Passenger LDV
© OECD/IEA 2013 Global Land Transport Infrastructure Requirements Estimating road and railway infrastructure capacity and costs to 2050
Page | 9
Box 1 • The IEA Mobility Model (MoMo)
The IEA Mobility Model (MoMo) is a global transport model that has been developed since 2003. It contains detailed by‐mode, by‐fuel and by‐region historical data and projections to 2050 for the transport sector and its energy and greenhouse gas (GHG) implications. It is divided into OECD and non‐OECD countries, and 28 global regions, which include countries such as the United States, China, Russia, India, Brazil, Japan, Korea, France, Germany, the United Kingdom and South Africa (a list of regions can be found in Table 2 in the Annex of this paper). MoMo covers all transport modes and each of the existing and future fuel pathways that power worldwide mobility. It is capable of assessing the impact of new technologies on energy use, GHG emissions and vehicle/fuel costs, as well as analysing similar impacts due to modal shifting cross transport modes (Fulton et al., 2009).
The infrastructure modelling used in this analysis is an on‐going development at the IEA, as part of MoMo. Continued collection of historic infrastructure data and project costs will help improve the assumptions and calculations applied here. Future work will also include the development of an air infrastructure projection model, as well as related modules that look at the required materials to support the world’s growing transport infrastructure. The modules likewise will look at energy input and emissions output related to building and maintaining global transport infrastructure. This development of new modules, in addition to providing a better understanding of the energy, materials and emissions related to transport infrastructure, will provide an improved analysis of the potential savings from “avoid/shift” transport policies.
The findings discussed in this paper represent global travel growth in two scenarios, as defined by the IEA Energy Technology Perspectives 2012 (ETP 2012). In one scenario, transport sector development and expenditures are projected by assuming a continuation of most past trends, with transport policies in the pipeline today to be adopted. This is called the 4oC scenario (4DS), and is consistent with a broader ETP scenario that is estimated to contain atmospheric temperature rise to 4oC. 4DS projections are then compared to the ETP 2012 2oC (2DS), which includes both vehicle technology and fuels improvements (an improve strategy) along with hypothesised shifts in travel and reductions in travel growth (an avoid/shift strategy). A combined avoid/shift and improve strategy is consistent with the ETP 2012 2DS objective of cutting transport fuel use and CO2 emissions significantly by 2050, in line with a 2oC atmospheric temperature increase target (IEA, 2012).
The following sections of this paper describe the historic trends observed in global land transport infrastructure and the results of the 4DS infrastructure projections estimated to 2050. Regional transport investment and maintenance cost assumptions and subsequent anticipated global expenditures on transport infrastructure operations, maintenance and development are presented. 4DS infrastructure and cost projections then are compared to 2DS estimates. Last, the implications of the results and this infrastructure modelling are discussed with regards to long‐term transport sector development and investments. Additional information regarding the historic data, methodological processes and assumptions used in this analysis can be found in the Annex of this paper.

Global Land Transport Infrastructure Requirements © OECD/IEA 2013 Estimating road and railway infrastructure capacity and costs to 2050
Page | 10
Limitations of the study The findings discussed in this paper and in ETP 2012 represent the national and regional spatial resolutions applied in the MoMo on an annual basis. Global transport sector trends and projections are analysed in 28 regions, listed in the Annex of this report. Due to limitations in available data on a finer spatial resolution (e.g. urban transport) or on an improved time scale (only annual averages are considered), the analysis performed for this paper does not consider the specific local effects of transport infrastructure on travel growth, and vice‐versa. Average values, such as road occupancy levels (i.e. travel per infrastructural kilometre), have been applied as estimates of overall transport and infrastructural trends for the 28 MoMo regions.
In addition, the specific feedback effects of transport infrastructure development have not been taken explicitly into account within the model. IEA vehicle travel estimates continue to be a function of car ownership, GDP per capita and fuel price. Rebound effects (e.g. increased travel activity in response to infrastructure growth) are not addressed in this analysis, although they may influence to some extent overall infrastructure growth, travel activity and subsequent energy consumption and emissions.

© OECD/IEA 2013 Global Land Transport Infrastructure Requirements Estimating road and railway infrastructure capacity and costs to 2050
Page | 11
Data collection Historic land transport infrastructure data have been collected and compiled by the IEA from sources including IRF (2012), UIC (2012), the Institute for Transportation and Development Policy (ITDP, 2007) and EMBARQ (2012). Data have been gathered on more than 25 indicators, including network length, type (e.g. motorway and secondary roads) and quality of infrastructure (e.g. percent paved road) from 1999 to 2010. Where possible, data have been collected from countries and region around the world, though in some cases it was necessary to assume that indicators in some countries or regions were similar to others. Data were available annually or frequently (e.g. every other year) for most OECD countries. In non‐OECD countries, especially Latin America and Africa, data often were infrequent or limited. Continued refinement of the database is on‐going.
The following descriptions describe the historic trends delineated in the infrastructure database. Additional information on the basic methodologies used to develop the historic infrastructure database and the limitations of historic data can be found in the Annex of this paper.
Road infrastructure
Since 2000, global roadway network length increased by approximately 12 million lane‐km. China and India accounted for more than 50% of paved lane‐km additions during that period. Total paved roadway increased by nearly 11 million lane‐km during the same period (Figure 2). Nearly three‐quarters of that growth occurred in non‐OECD countries, while some OECD countries, such as Italy, Australia and New Zealand, experienced slight losses in total roadway network length. In addition, the overall extent of global paved roadway increased over the past decade. Paved lane‐km accounted for 53% of total global road lane‐km in 2000. By 2010, nearly 60% of all road lane‐km were paved.
Figure 2 • Historic paved roadway lane‐km (left axis) and BRT trunk‐km (right axis)
Sources: IRF (2012); EMBARQ, ALT‐BRT and IEA (2012).
Key message • Global roadway infrastructure grew by more than 35% in the past decade, where China and India accounted for more than half of paved lane‐km additions.
As noted previously, the most significant growth in roadway network occurred in China and India, where China nearly tripled its paved roadway network since 2000. China has roughly the same land area as the United States with more than four times the population (CIA, 2012), although it currently has 30% less roadway kilometres than the United States. The IEA anticipates that China will surpass the United States in annual road vehicle kilometres (vkm) by 2025 and that by 2050
0
500
1 000
1 500
2 000
2 500
0
10
20
30
40
50
2000 2001 2002 2003 2004 2005 2006 2007 2008 2009
BRT trunk‐km
Roadway lane‐km (million)
OECD North America
OECD Europe
OECD Pacific
China
India
ASEAN
Latin America
Africa
Other
BRT networkBRT network

Global Land Transport Infrastructure Requirements © OECD/IEA 2013 Estimating road and railway infrastructure capacity and costs to 2050
Page | 12
China will travel nearly twice the number of annual vkm as the United States. China will likely continue to build new roadways at substantial rates and that it will obtain similar if not greater levels of paved roadway kilometres than the United States by 2050, or well before.
India, which is roughly one‐third the size of the United States in total land area (CIA, 2012), added nearly 1 million paved lane‐km in the past decade. In contrast to China and the United States, India’s roadway density (paved lane‐km per km2 of land) is already quite high (roughly 1.4 times the roadway density of the United States). Its average population density is also significantly higher than both the United States and China.1 In addition, average national Indian road occupancy levels (vkm to paved lane‐km) are quite low in comparison to other countries, despite highly congested urban centres. From a historical capacity perspective, India therefore may not need to increase total national roadway network as quickly as China in order to support projected vehicle travel growth. On the other hand, expected surges in mobility demand, especially in the form of private motorisation, may require India to ramp up construction of roadway lane‐km to maintain low national occupancy levels.
Bus rapid transit
BRT network data have been collected as part of the roadway infrastructure data collected for this analysis (Figure 2). BRT infrastructure is technically considered to be a part of roadway; however, BRT systems require considerable investment in specific infrastructure. BRT systems typically involve high‐capacity buses in corridors that use private lanes isolated from the rest of traffic and boarding systems similar to metro systems (IEA, 2012).
The IEA has collaborated with EMBARQ as a member of the global BRT data group to compile recent data and develop a comprehensive historic database from over 100 BRT systems on every continent (EMBARQ, ALC‐BRT and IEA, 2012). This includes both BRT trunk corridors (considered in this analysis) as well as local feeder networks. The BRT systems are described in IEA Bus Rapid Transit: Cost and CO2 Implications of Future Deployment Scenarios, presented at the Transportation Research Board in 2011 (Trigg and Fulton, 2012).
Figure 3 • Global BRT development (trunk corridors)
Source: EMBARQ, ALT‐BRT and IEA (2012).
Key message • Global BRT network length nearly tripled over the past decade and is expected to grow another 1 200 km by 2025.
Since the first BRT network opened in Curitiba, Brazil in 1972, more than 2 000 km of BRT trunk‐km have been constructed across the globe (Figure 3). By the end of 2011, there were nearly
1 The number of people per km2 is approximately 32 in the United States, 140 in China and 367 in India. These estimates do not account for specific population densities, such as urban densities or population density per square kilometre of habitable land.
0
1
2
3
4
1972 1982 1994 1999 2003 2007 2011 2015 2019 2023
BRT trunk‐km
(thousand)
Planned or proposed
Currently under construction
In operation
© OECD/IEA 2013 Global Land Transport Infrastructure Requirements Estimating road and railway infrastructure capacity and costs to 2050
Page | 13
2 200 km of BRT network worldwide, where more than half of trunk‐km were in non‐OECD countries. The bulk of 2011 BRT network length (1 600 trunk km) was constructed in the last decade, with global trunk corridor kilometres doubling every two to three years. China, the Association of Southeast Asian Nations (ASEAN) and Latin American countries together added roughly 800 km of trunk corridor, or 40% of total trunk‐km additions since 2000.
Despite recent growth in the global BRT network and announced plans for continued expansion in coming years, there is no guarantee that network development will continue at a rapid pace beyond 2015. Presently, an additional 1 200 BRT trunk‐km are planned or proposed for development; however, the future of many of those BRT developments is not certain. As a result, in the 4DS, the global BRT network is not assumed to grow considerably beyond the expected 3 000 trunk‐km by 2025.
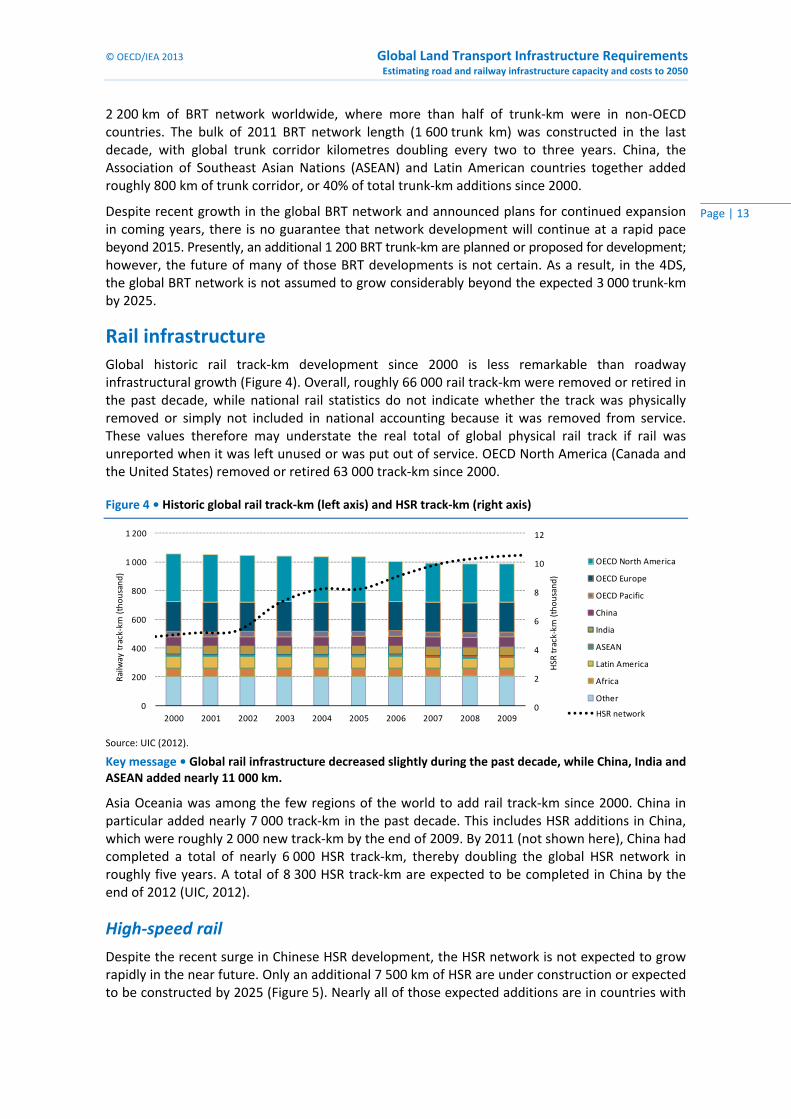
Rail infrastructure Global historic rail track‐km development since 2000 is less remarkable than roadway infrastructural growth (Figure 4). Overall, roughly 66 000 rail track‐km were removed or retired in the past decade, while national rail statistics do not indicate whether the track was physically removed or simply not included in national accounting because it was removed from service. These values therefore may understate the real total of global physical rail track if rail was unreported when it was left unused or was put out of service. OECD North America (Canada and the United States) removed or retired 63 000 track‐km since 2000.
Figure 4 • Historic global rail track‐km (left axis) and HSR track‐km (right axis)
Source: UIC (2012).
Key message • Global rail infrastructure decreased slightly during the past decade, while China, India and ASEAN added nearly 11 000 km.
Asia Oceania was among the few regions of the world to add rail track‐km since 2000. China in particular added nearly 7 000 track‐km in the past decade. This includes HSR additions in China, which were roughly 2 000 new track‐km by the end of 2009. By 2011 (not shown here), China had completed a total of nearly 6 000 HSR track‐km, thereby doubling the global HSR network in roughly five years. A total of 8 300 HSR track‐km are expected to be completed in China by the end of 2012 (UIC, 2012).
High‐speed rail
Despite the recent surge in Chinese HSR development, the HSR network is not expected to grow rapidly in the near future. Only an additional 7 500 km of HSR are under construction or expected to be constructed by 2025 (Figure 5). Nearly all of those expected additions are in countries with
0
200
400
600
800
1 000
1 200
2000 2001 2002 2003 2004 2005 2006 2007 2008 2009
Railway track‐km (thousand)
OECD North America
OECD Europe
OECD Pacific
China
India
ASEAN
Latin America
Africa
Other0
2
4
6
8
10
12
HSR
track‐km (thousand)
HSR network

Global Land Transport Infrastructure Requirements © OECD/IEA 2013 Estimating road and railway infrastructure capacity and costs to 2050
Page | 14
existing HSR (e.g. France, Spain, China and Japan). A potential 14 000 km additional HSR track has been planned or proposed in other countries beyond 2015. However, the future of many of those HSR developments, such as the proposed HSR rail lines in Iran, Turkey, Morocco, Brazil, Argentina and the United States, is not certain. To this extent, the global HSR network may not grow considerably beyond the expected 23 000 track‐km by 2025.
Figure 5 • Historic and expected global HSR development
Source: UIC (2012).
Key message • Global HSR network length nearly tripled in the past decade, where China in particular added roughly 2 000 km of HSR track between 2000 and 2009.
0
8
16
24
32
40
1964 1984 1992 2000 2005 2010 2015 2020 2025
HSR
track‐km (thousand)
Planned or proposed
Under construction
In operation

© OECD/IEA 2013 Global Land Transport Infrastructure Requirements Estimating road and railway infrastructure capacity and costs to 2050
Page | 15
Scenario introduction ETP 2012 unveils three dramatically different energy futures: the 6DS, which is where the world is now heading; the 4DS, an assessment of what announced policies can deliver; and the 2DS. The ETP 2012 2DS explores the technology options and policies needed to realise a sustainable future based on greater energy efficiency and a more balanced energy system. It identifies the technology options and policy pathways that ensure an 80% chance of limiting long‐term global temperature increase to 2°C, provided that non‐energy related CO2 emissions and other GHGs also are reduced (IEA, 2012).
In the transport sector, the 6DS stimulates what will happen if the various transport policies currently under consideration are not implemented, including post‐2015/16 fuel economy standards in the European Union and the United States. In contrast, the 4DS represents the trajectory that unfolds with existing and upcoming policies, including a tightening of fuel economy standards up to 2025 for both passenger light‐duty vehicles (LDVs) and road‐freight vehicles as well as a slow penetration of hybrid, plug‐in hybrid‐electric and battery‐electric vehicles over the coming decades. In both scenarios, total projected passenger and freight travel remains similar to 2050. LDV travel worldwide increases nearly 2.5‐fold in both the 6DS and 4DS.
In contrast, the 2DS for transport comprises the improve and avoid/shift strategies in order to achieve the transport sector contribution to the 2°C target. The improve strategy focuses on vehicle and fuel improvements that lower GHG emissions, including a tightening of fuel economy standards and an increased share of efficient technologies. Policies adopted in the 2DS improve the share of the most efficient modes, including virtual mobility and policies that promote carpooling, car sharing, BRT systems and high‐speed trains.
The ETP 2012 2DS transport scenario not only provides a basis to analyse the effect of technological improvements and modal‐shifting policies on travel, efficiency, mode shares, energy use and CO2 emissions, but also a framework to examine costs and investments in the transport sector over the next four decades. Under the 2DS, annual global travel demand is estimated to increase by nearly 35 trillion pkm and 15 trillion tkm; however, the 2DS has 10 trillion fewer annual passenger and freight‐tkm by 2050 than in the both the 6DS and 4DS. This represents an “avoidance” of roughly 10% of base travel projections by 2050. In addition, nearly one‐quarter of passenger light‐duty vehicles, road freight and air travel are shifted to more energy‐efficient travel modes, such as urban and inter‐urban bus and rail systems – a progressive “shift” of roughly 25% of passenger LDV and air travel by 2050.
The findings considered in this paper represent global land transport infrastructure development with respect to travel growth in the 4DS and 2DS. Infrastructure growth in the 6DS is not addressed explicitly in this paper; however, infrastructure growth in both the 4DS and 6DS is similar, as net travel increases to 2050 are the same in both scenarios. To this extent, the infrastructure projections identified here in the 4DS represent both scenarios. 2DS infrastructure growth reflects the changes in net passenger and freight travel as a result of avoid/shift policies.
Two other scenarios are referred to occasionally in this paper as reference comparisons to infrastructure development under the 4DS. “Historic capacity” refers to transport infrastructure development at current rates of construction. In regions where considerable surges in transport demand are expected, these historic averages have been applied to illustrate the effect of travel demand on local infrastructure if those regions do not ramp up development to support expected travel growth. “High baseline” refers to infrastructural development if regions build at rates fast enough to avoid high travel occupancy levels. Neither Historic capacity nor High baseline reflects changes in 4DS travel estimates; rather, both illustrate the effects of varying transport infrastructural growth rates with regards to 4DS travel projections.

Global Land Transport Infrastructure Requirements © OECD/IEA 2013 Estimating road and railway infrastructure capacity and costs to 2050
Page | 16
4DS results Infrastructure development projections and the subsequent cost estimates have been developed using the IEA MoMo and infrastructural database. Each infrastructure category (road, BRT, rail and HSR) has been considered with regards to 4DS and 2DS transport sector growth, where 2DS results are discussed later in the scenario comparison section of this paper. Further information about the basic methodologies used to develop the transport sector projections applied in this analysis can be found in the Annex.
Road
Under the 4DS, global road traffic activity is expected to more than double to nearly 43 trillion annual vehicle kilometres by 2050. To accommodate this growth, global road infrastructure is expected to increase by roughly 60% above 2010 levels by 2050 – an increase of roughly 14 million paved lane‐km by 2030 and an additional 11 million paved lane‐km by 2050 (Figure 6). China and India account for nearly half of expected roadway additions. In contrast, some OECD countries, such as Germany and Japan, are expected to slightly reduce total paved road lane‐km as national vehicle travel begins to decrease over time.
Figure 6 • 4DS roadway projections
Key message • Global roads are likely to grow by nearly 25 million paved lane‐km by 2050 in the 4DS.
4DS construction capacity assumptions were based on regional historic averages (see projection methodology in Annex), where higher annual averages were applied to allow room for future growth. If countries with low average historic growth continue to build at a slower pace, roadway additions to 2050 will be roughly 5 million paved lane‐km less than projected here (Figure 6, Historic capacity). In contrast, if regions with growing travel were to build at maximum historic capacities, global road infrastructure would increase by nearly 8 million paved lane‐km over 4DS projections (Figure 6).
The assumed rates of roadway expansion applied in the model are critical to determine the level of vehicle travel to roadway infrastructure, which is a broad measure of traffic congestion for countries in the future. If countries can add roadway even faster than assumed here, especially in congested urban areas, there will be less pressure on traffic. If they are slower (which is quite possible), roadway congestion (as estimated by average occupancy levels) could worsen. There is also the risk of a powerful feedback effect: adding more roadway infrastructure can encourage a faster uptake of cars and spur more travel. However, these specific feedback effects have not been taken explicitly into account within the model. IEA vehicle travel estimates continue to be a function of car ownership and fuel price, where ownership primarily is a function of income growth.
0
10
20
30
40
50
60
70
80
2000 2005 2010 2015 2020 2025 2030 2035 2040 2045 2050
4DS roadway (million paved lane‐km)
OECD North America
OECD Europe
OECD Pacific
China
India
ASEAN
Latin America
Africa
Other
High baseline
Historic capacity

© OECD/IEA 2013 Global Land Transport Infrastructure Requirements Estimating road and railway infrastructure capacity and costs to 2050
Page | 17
Under 4DS roadway projections to 2050, average national infrastructure occupancy levels (average vehicle kilometres per lane kilometre) are not expected to increase significantly in OECD countries (Figure 7). In general, OECD member countries are expected to continue to add roadway infrastructure at a pace commensurate with vehicle travel increases, which are relatively moderate relative to 2010 travel levels. In contrast, average national road occupancy levels among non‐OECD countries are expected to increase significantly by 2050 as vehicle travel rapidly intensifies. In most non‐OECD countries, road travel will outpace infrastructure additions due to limitations in construction capacity. In particular, China and India experience significant growth in average road occupancy levels, despite continued roadway construction.
Under the 4DS, China, which is expected to surpass road infrastructure density levels in the United States by 2050, will have nearly four times the number of vehicles and twice the number of annual vehicle kilometres as the United States by 2050. In terms of vehicle travel per infrastructural kilometre, China’s average national road vehicle occupancy levels will increase 2.5‐fold by 2050, or 1.4 times the average present road occupancy levels in the United States. This jump in average road occupancy levels in China will have significant implications for road traffic activity, especially in urban centres.
Figure 7 • 4DS roadway occupancy levels
Key message • Roadway occupancy levels under the 4DS are likely to increase significantly in China and India, where roadway travel is expected to outpace infrastructure additions, while average occupancy levels are projected to decrease slightly in Latin America as infrastructure additions catch up to travel demand.
India’s average road occupancy is expected to increase 6.5‐fold from 2010 levels, or like China, roughly 1.5 times current levels in the United States. In contrast, India is projected to have roughly half the vehicle ownership rate of China by 2050. As Indian road occupancy levels continue to rise beyond 2050 and vehicle ownership approaches expected Chinese and OECD ownership levels, this will have significant future implications on roadway traffic levels in India.
If countries with low average historic growth continue to build at average historic capacity (Figure 6), average global road occupancy levels would increase by nearly 10%. In particular, average roadway occupancy levels in non‐OECD regions would rise substantially, with average congestion levels increasing more than 50% over 4DS levels in Latin America, Africa and the Middle East. Thus, while slight decreases in annual roadway additions may be small in comparison to nearly 25 million expected new global road lane‐km, they would have considerable implications on overall roadway capacity and local traffic levels in several regions.
If countries were to build at maximum historic capacities (Figure 6), average global road occupancy levels would decrease by roughly 5%. However, maximum construction capacities would only decrease average occupancy levels marginally in non‐OECD countries (less than 10% in Latin America, Africa and the Middle East). This contrast in average regional road occupancy
0
200
400
600
800
1 000
1 200
Vehicle travel per paved lane‐km
(thousand vehicle‐km)
OECD Non OECD China India ASEAN Middle East Latin America Africa
2010
2030
2050
Global Land Transport Infrastructure Requirements © OECD/IEA 2013 Estimating road and railway infrastructure capacity and costs to 2050
Page | 18
levels suggests that emerging countries with lower than average historic roadway construction levels need to ramp up infrastructure development rates in order to address roadway occupancy increases from expected surges in vehicle travel.
Box 2 • Supply and demand: estimating road additions to maintain global occupancy levels
Since IEA travel estimates are national and multinational in scope, it is difficult to say how 4DS estimates translate into local traffic congestion in urban areas around the world. Yet, as global urbanisation rates rise with vehicle travel demand, it is likely that urban roadway occupancy, especially in non‐OECD countries, will increase considerably.
Box 3 • Roadway limitations: accounting for useable land
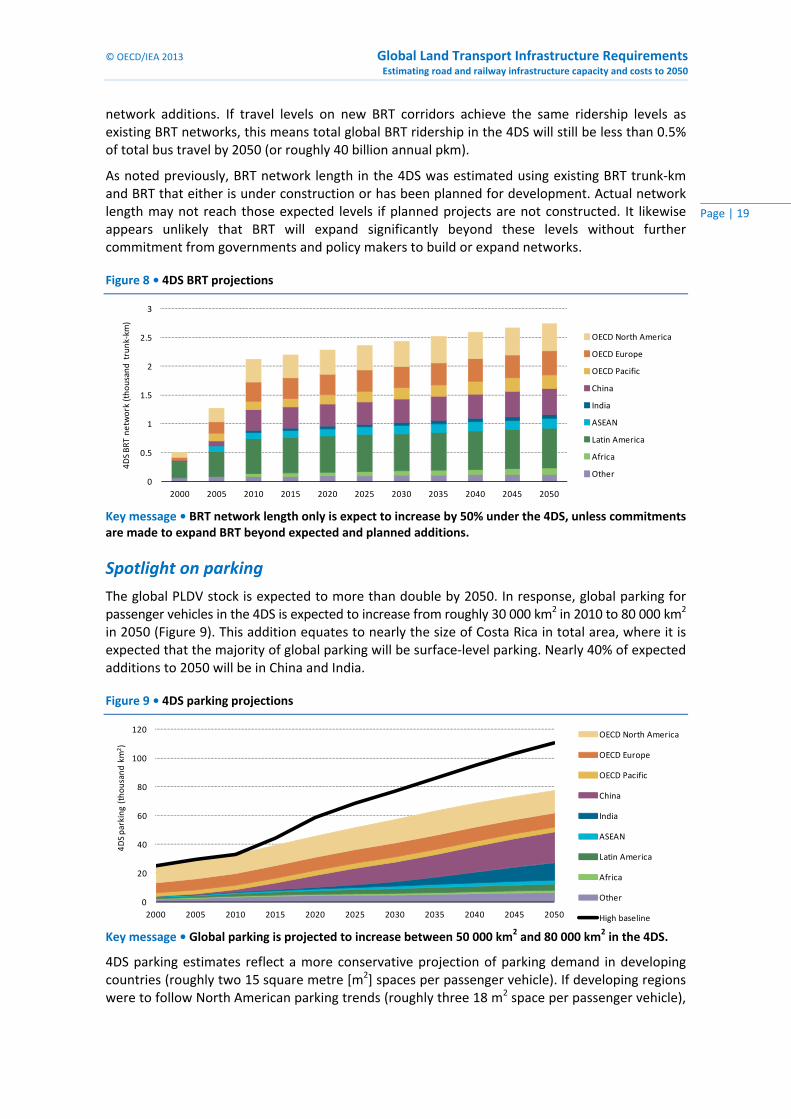
Spotlight on BRT
Expected and planned BRT networks in the 4DS will increase current BRT trunk‐km by nearly 50% by 2050 to 2 800 trunk‐km (Figure 8). 60% of this expected network will be in non‐OECD countries, with Latin American countries and China constituting nearly 45% of total expected BRT
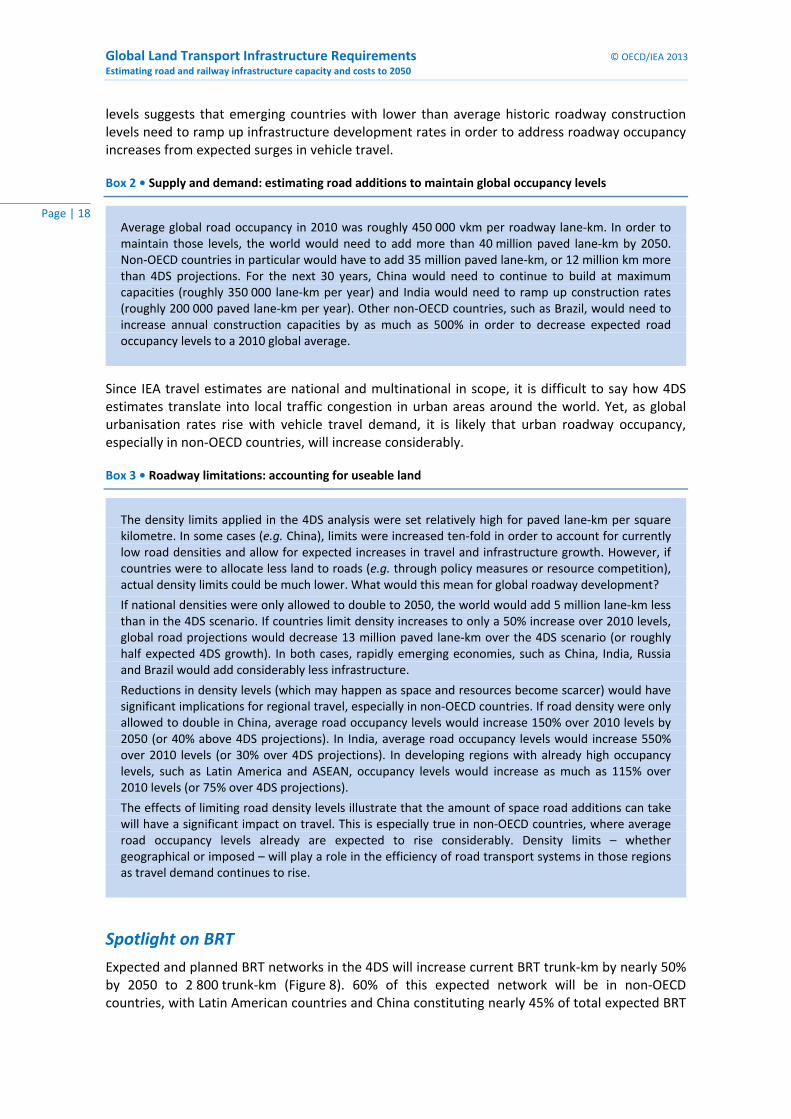
Average global road occupancy in 2010 was roughly 450 000 vkm per roadway lane‐km. In order to maintain those levels, the world would need to add more than 40 million paved lane‐km by 2050. Non‐OECD countries in particular would have to add 35 million paved lane‐km, or 12 million km more than 4DS projections. For the next 30 years, China would need to continue to build at maximum capacities (roughly 350 000 lane‐km per year) and India would need to ramp up construction rates (roughly 200 000 paved lane‐km per year). Other non‐OECD countries, such as Brazil, would need to increase annual construction capacities by as much as 500% in order to decrease expected road occupancy levels to a 2010 global average.
The density limits applied in the 4DS analysis were set relatively high for paved lane‐km per square kilometre. In some cases (e.g. China), limits were increased ten‐fold in order to account for currently low road densities and allow for expected increases in travel and infrastructure growth. However, if countries were to allocate less land to roads (e.g. through policy measures or resource competition), actual density limits could be much lower. What would this mean for global roadway development?
If national densities were only allowed to double to 2050, the world would add 5 million lane‐km less than in the 4DS scenario. If countries limit density increases to only a 50% increase over 2010 levels, global road projections would decrease 13 million paved lane‐km over the 4DS scenario (or roughly half expected 4DS growth). In both cases, rapidly emerging economies, such as China, India, Russia and Brazil would add considerably less infrastructure.
Reductions in density levels (which may happen as space and resources become scarcer) would have significant implications for regional travel, especially in non‐OECD countries. If road density were only allowed to double in China, average road occupancy levels would increase 150% over 2010 levels by 2050 (or 40% above 4DS projections). In India, average road occupancy levels would increase 550% over 2010 levels (or 30% over 4DS projections). In developing regions with already high occupancy levels, such as Latin America and ASEAN, occupancy levels would increase as much as 115% over 2010 levels (or 75% over 4DS projections).
The effects of limiting road density levels illustrate that the amount of space road additions can take will have a significant impact on travel. This is especially true in non‐OECD countries, where average road occupancy levels already are expected to rise considerably. Density limits – whether geographical or imposed – will play a role in the efficiency of road transport systems in those regions as travel demand continues to rise.
© OECD/IEA 2013 Global Land Transport Infrastructure Requirements Estimating road and railway infrastructure capacity and costs to 2050
Page | 19
network additions. If travel levels on new BRT corridors achieve the same ridership levels as existing BRT networks, this means total global BRT ridership in the 4DS will still be less than 0.5% of total bus travel by 2050 (or roughly 40 billion annual pkm).
As noted previously, BRT network length in the 4DS was estimated using existing BRT trunk‐km and BRT that either is under construction or has been planned for development. Actual network length may not reach those expected levels if planned projects are not constructed. It likewise appears unlikely that BRT will expand significantly beyond these levels without further commitment from governments and policy makers to build or expand networks.
Figure 8 • 4DS BRT projections
Key message • BRT network length only is expect to increase by 50% under the 4DS, unless commitments are made to expand BRT beyond expected and planned additions.
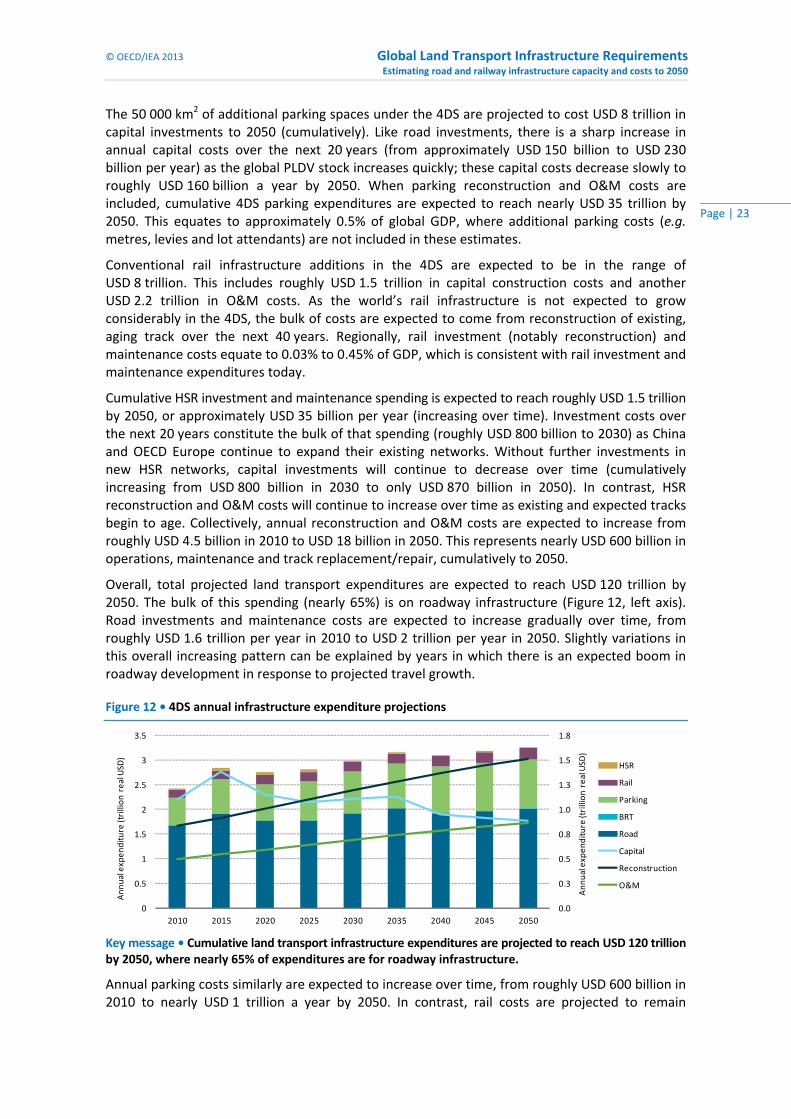
Spotlight on parking
The global PLDV stock is expected to more than double by 2050. In response, global parking for passenger vehicles in the 4DS is expected to increase from roughly 30 000 km2 in 2010 to 80 000 km2 in 2050 (Figure 9). This addition equates to nearly the size of Costa Rica in total area, where it is expected that the majority of global parking will be surface‐level parking. Nearly 40% of expected additions to 2050 will be in China and India.
Figure 9 • 4DS parking projections
Key message • Global parking is projected to increase between 50 000 km2 and 80 000 km2 in the 4DS.
4DS parking estimates reflect a more conservative projection of parking demand in developing countries (roughly two 15 square metre [m2] spaces per passenger vehicle). If developing regions were to follow North American parking trends (roughly three 18 m2 space per passenger vehicle),
0
0.5
1
1.5
2
2.5
3
2000 2005 2010 2015 2020 2025 2030 2035 2040 2045 2050
4DS BRT network (thousand trunk‐km
)
OECD North America
OECD Europe
OECD Pacific
China
India
ASEAN
Latin America
Africa
Other
0
20
40
60
80
100
120
2000 2005 2010 2015 2020 2025 2030 2035 2040 2045 2050
4DS parking (thousand km
2)
OECD North America
OECD Europe
OECD Pacific
China
India
ASEAN
Latin America
Africa
Other
High baseline

Global Land Transport Infrastructure Requirements © OECD/IEA 2013 Estimating road and railway infrastructure capacity and costs to 2050
Page | 20
global parking infrastructure would increase to nearly 110 000 km2 by 2050, an area roughly the size of Cuba (Figure 9). This would have significant implications for India in particular, whose parking infrastructure would increase nearly 5 600% over 2010 levels. Parking in China under the High Baseline Scenario would increase nearly 16‐fold by 2050.
Rail
Global rail travel is projected to double by 2050 in the 4DS to nearly 23 trillion annual pkm and tkm. To support this growth, global rail track‐km need to increase by roughly 30% above 2010 levels by 2050, or approximately 335 000 additional track‐km by 2050 (Figure 10). Already planned and under construction HSR development accounts for roughly 30 000 track‐km of those additions. Regionally, China and India represent nearly one‐quarter of expected conventional rail track‐km additions, while OECD North America, OECD Europe, Russia (together with other former Soviet countries) and Latin America account for approximately 75% of remaining expected track‐km additions.
In the 4DS, global railway travel per track‐km is not expected to increase as significantly as road occupancy levels. Rail occupancy levels in OECD member countries are expected to remain relatively constant as track is added at a level commensurate with rail traffic growth. In some OECD regions, rail travel is projected to increase only slightly; in these regions, rail occupancy levels potentially could increase without any need for additional infrastructure.
Figure 10 • 4DS railway projections
Key message • The global rail network is expected to increase 30% above 2010 levels by 2050 in the 4DS.
In non‐OECD countries, rail travel per track‐km increase between 5% and 90%, depending on the country; although none of these projected increases are as remarkable as road occupancy growth discussed above. The less outstanding increases in rail occupancy levels across the globe can be explained in part by overall capacities of rail cars to carry more passenger and freight‐tonnes than roadway vehicles. While significant roadway vehicle additions will be necessary to accommodate growth in passenger and freight road‐travel demand, considerably fewer railway cars will be necessary to accommodate rail traffic growth.
If countries were to build rail at maximum historic capacities (Figure 10, High baseline), global rail track‐km would increase by roughly 15% over 4DS estimates to a global total of 1.5 million track‐km. Average global rail occupancy levels subsequently would decrease by 10%, with travel in some regions, such as ASEAN and China, decreasing by as much as 25% over 4DS levels. This marginal global decrease in average rail occupancy levels relative to increases in network length suggests that countries may not need to pursue significant railway development above 4DS construction levels in order to accommodate rail travel growth.
0
200
400
600
800
1 000
1 200
1 400
1 600
2000 2005 2010 2015 2020 2025 2030 2035 2040 2045 2050
4DS railw
ay (thousand track‐km)
OECD North America
OECD Europe
OECD Pacific
China
India
ASEAN
Latin America
Africa
Other
High baseline

© OECD/IEA 2013 Global Land Transport Infrastructure Requirements Estimating road and railway infrastructure capacity and costs to 2050
Page | 21
Spotlight on HSR
Expected and planned HSR networks to 2025 in the 4DS will produce significant growth in HSR track and travel over the next 15 years. By 2030, it is expected that the global HSR network will reach 44 000 km (Figure 11). 60% of this growth (or 17 000 km) will be in China. OECD Europe, including notably France and Spain, accounts for 90% of remaining additions. OECD North America and most of non‐OECD regions (including Africa, ASEAN and Russia), have not been included in the 4DS: although some countries, such as the United States, have begun planning of HSR lines, financing and other barriers (e.g. legal challenges) may impede or slow the achievement of those projects.
Figure 11 • 4DS HSR projections
Key message • Global HSR network length may grow as much 28 000 km by 2030, but additions beyond then are unsure.
While HSR growth to 2030 represents a 3‐fold increase of the 2010 HSR track network, it still represents only a tiny fraction of total global rail track‐km: roughly 4% of global rail km in 2030 and only 3% in 2050. Similarly, an estimated 1 trillion HSR pkm in 2025 (if this actually is achieved) only represents one fifth of net projected global passenger rail travel in 2025. If no additional HSR tracks are constructed above and beyond existing and planned HSR networks, the share of projected global passenger rail travel on HSR would drop to less than one tenth of passenger rail pkm by 2050.
These restricted shares of passenger rail travel along the aforesaid potential global HSR network are due to the limits of an HSR network that covers only roughly a dozen countries. Despite significant growth, more than two‐thirds of the global population still would not have access to HSR under the 4DS. In particular, little HSR is expected in North America, Latin America, Africa, India, South and Southeast Asia, the Middle East and Russia in the 4DS. Yet, these regions represent more than half of global passenger rail travel.
0
10
20
30
40
50
2000 2005 2010 2015 2020 2025 2030 2035 2040 2045 2050
4DS HSR
network (thousand track‐km)
OECD Europe
OECD Pacific
China
Latin America
Other

Global Land Transport Infrastructure Requirements © OECD/IEA 2013 Estimating road and railway infrastructure capacity and costs to 2050
Page | 22
Cost estimates Infrastructure costs have been considered as part of this analysis in order to estimate the costs to society related to transport infrastructure investments and maintenance. Cost estimates for infrastructure development, operations and maintenance were collected with IEA partners, representing more than 1 300 country year points (i.e. projects per country and per year). Additional information on the cost database can be found in the Annex of this paper.
4DS projections modelled in this analysis represent 25 million additional infrastructural kilometres (paved lane‐km and track‐km) by 2050. Together, net road (including BRT), rail (including HSR) and parking additions in the 4DS account for nearly USD 120 trillion in expected investment and maintenance expenditures to 2050 (as for all ETP 2012 estimates, costs are in real 2010 dollars but not discounted to present value). This represents roughly 2% of global cumulative GDP to 2050, which appears broadly consistent with existing national transport infrastructure expenditures in many countries today.
Global road capital construction, reconstruction and operations and maintenance (O&M) costs to 2050 are by far the largest land transport infrastructure spending in the 4DS. Annual capital costs are projected to reach as high as USD 1.1 trillion over the next 20 years (in real, undiscounted terms) as developing countries ramp up roadway construction to meet travel demand. Those costs will drop back slightly to around USD 700 billion a year by 2050 as infrastructure levels slowly begin to catch up to travel increases. Cumulatively, capital construction costs to 2050 represent roughly USD 33 trillion, or 0.6% of GDP.
Road reconstruction costs are expected to continue to rise as the world’s roadway infrastructure continues to grow and age. Current global expenditure on reconstruction of roads is roughly USD 400 billion a year. By 2050, as capital costs begin to increase, annual reconstruction and upgrade costs are expected to rise to as much as USD 700 billion a year – meaning that the world will spend as much on fixing and rebuilding existing infrastructure as it does building new roadway. Cumulatively, reconstruction costs to 2050 represent nearly USD 22 trillion, or 0.4% of global GDP. Again, these values, combined with capital costs (or roughly 1% of GDP), appear to fall in par with current global spending on road investments.
Road O&M costs also are expected to increase over time as roadway infrastructure continues to expand. By 2050, annual O&M costs are projected to reach as much as USD 650 billion per year (over roughly USD 350 billion in 2010). When combined with road investments (capital and reconstruction), this means that cumulative road expenditures are expected to be in the range of USD 75 trillion. This equates to roughly 0.5% to 1.5% of regional or national GDP, which is consistent with national accounts on road capital and maintenance expenditures today. Naturally, regions with large expected capital investments (e.g. China and India) and large networks to maintain (e.g. OECD North America) have higher projected roadway costs. China and India alone account for nearly USD 26 trillion of total global road expenditures. When combined with the United States, European Union, Russia and Brazil, these regions represent nearly 70% of projected global spending on roadways.
Global BRT network development and maintenance under the 4DS is expected to cost roughly USD 50 billion dollars to 2050. The bulk of those expenditures will be reconstructing BRT corridors as they age (roughly USD 30 billion) while O&M of existing and expected BRT networks will cost roughly USD 10 billion between now and 2050. These expenditures (roughly USD 1.2 billion per year) fall in line with existing annual BRT spending levels and reflect rather consistent BRT expenditures to 2050 (in real, undiscounted terms) as few additional BRT corridors are expected to be constructed under the 4DS.
© OECD/IEA 2013 Global Land Transport Infrastructure Requirements Estimating road and railway infrastructure capacity and costs to 2050
Page | 23
The 50 000 km2 of additional parking spaces under the 4DS are projected to cost USD 8 trillion in capital investments to 2050 (cumulatively). Like road investments, there is a sharp increase in annual capital costs over the next 20 years (from approximately USD 150 billion to USD 230 billion per year) as the global PLDV stock increases quickly; these capital costs decrease slowly to roughly USD 160 billion a year by 2050. When parking reconstruction and O&M costs are included, cumulative 4DS parking expenditures are expected to reach nearly USD 35 trillion by 2050. This equates to approximately 0.5% of global GDP, where additional parking costs (e.g. metres, levies and lot attendants) are not included in these estimates.
Conventional rail infrastructure additions in the 4DS are expected to be in the range of USD 8 trillion. This includes roughly USD 1.5 trillion in capital construction costs and another USD 2.2 trillion in O&M costs. As the world’s rail infrastructure is not expected to grow considerably in the 4DS, the bulk of costs are expected to come from reconstruction of existing, aging track over the next 40 years. Regionally, rail investment (notably reconstruction) and maintenance costs equate to 0.03% to 0.45% of GDP, which is consistent with rail investment and maintenance expenditures today.
Cumulative HSR investment and maintenance spending is expected to reach roughly USD 1.5 trillion by 2050, or approximately USD 35 billion per year (increasing over time). Investment costs over the next 20 years constitute the bulk of that spending (roughly USD 800 billion to 2030) as China and OECD Europe continue to expand their existing networks. Without further investments in new HSR networks, capital investments will continue to decrease over time (cumulatively increasing from USD 800 billion in 2030 to only USD 870 billion in 2050). In contrast, HSR reconstruction and O&M costs will continue to increase over time as existing and expected tracks begin to age. Collectively, annual reconstruction and O&M costs are expected to increase from roughly USD 4.5 billion in 2010 to USD 18 billion in 2050. This represents nearly USD 600 billion in operations, maintenance and track replacement/repair, cumulatively to 2050.
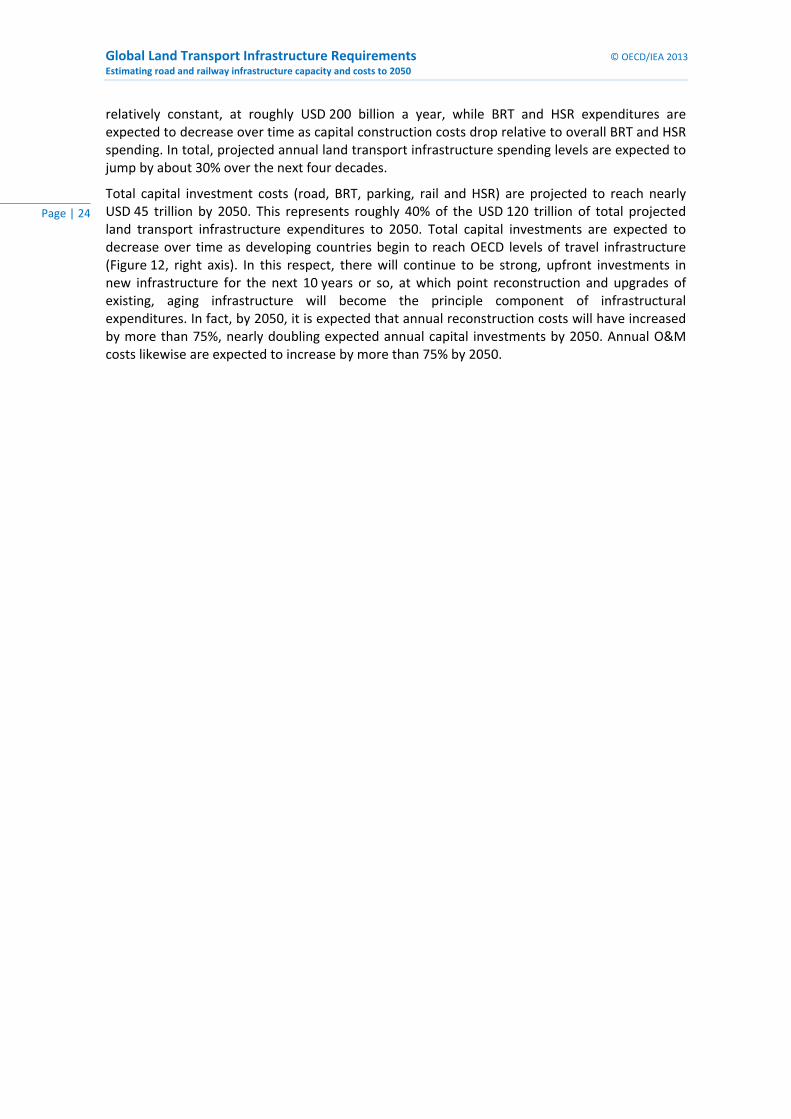
Overall, total projected land transport expenditures are expected to reach USD 120 trillion by 2050. The bulk of this spending (nearly 65%) is on roadway infrastructure (Figure 12, left axis). Road investments and maintenance costs are expected to increase gradually over time, from roughly USD 1.6 trillion per year in 2010 to USD 2 trillion per year in 2050. Slightly variations in this overall increasing pattern can be explained by years in which there is an expected boom in roadway development in response to projected travel growth.
Figure 12 • 4DS annual infrastructure expenditure projections
Key message • Cumulative land transport infrastructure expenditures are projected to reach USD 120 trillion by 2050, where nearly 65% of expenditures are for roadway infrastructure.
Annual parking costs similarly are expected to increase over time, from roughly USD 600 billion in 2010 to nearly USD 1 trillion a year by 2050. In contrast, rail costs are projected to remain
0.0
0.3
0.5
0.8
1.0
1.3
1.5
1.8
0
0.5
1
1.5
2
2.5
3
3.5
2010 2015 2020 2025 2030 2035 2040 2045 2050
Annual expenditure (trillion real USD
)
Annual expenditure (trillion real USD
)
HSR
Rail
Parking
BRT
Road
Capital
Reconstruction
O&M
Global Land Transport Infrastructure Requirements © OECD/IEA 2013 Estimating road and railway infrastructure capacity and costs to 2050
Page | 24
relatively constant, at roughly USD 200 billion a year, while BRT and HSR expenditures are expected to decrease over time as capital construction costs drop relative to overall BRT and HSR spending. In total, projected annual land transport infrastructure spending levels are expected to jump by about 30% over the next four decades.
Total capital investment costs (road, BRT, parking, rail and HSR) are projected to reach nearly USD 45 trillion by 2050. This represents roughly 40% of the USD 120 trillion of total projected land transport infrastructure expenditures to 2050. Total capital investments are expected to decrease over time as developing countries begin to reach OECD levels of travel infrastructure (Figure 12, right axis). In this respect, there will continue to be strong, upfront investments in new infrastructure for the next 10 years or so, at which point reconstruction and upgrades of existing, aging infrastructure will become the principle component of infrastructural expenditures. In fact, by 2050, it is expected that annual reconstruction costs will have increased by more than 75%, nearly doubling expected annual capital investments by 2050. Annual O&M costs likewise are expected to increase by more than 75% by 2050.

© OECD/IEA 2013 Global Land Transport Infrastructure Requirements Estimating road and railway infrastructure capacity and costs to 2050
Page | 25
2DS comparison Under the 2DS, road and rail infrastructure additions are reduced by nearly 10 million kilometres. All of these infrastructural reductions come from reduced roadway development as a result of shifted or avoid road travel. In contrast, rail infrastructure is projected to increase by nearly 200 000 track‐km over 4DS levels as passenger and freight travel are shifted to rail. HSR growth accounts for roughly 140 000 km of those 200 000 additional track‐km.
Overall, road (including BRT), rail (including HSR) and parking additions in the 2DS represent nearly a USD 20 trillion savings over 4DS cost projections, or a savings of roughly 0.3% of global cumulative GDP to 2050. The results of the 2DS road, rail and parking projections in comparison to the 4DS are discussed in detail in the following sections.
Road In contrast to the 4DS, annual road vehicle travel decreases by nearly 25% by 2050 in the 2DS (approximately 9 trillion annual vehicle kilometres by 2050). In terms of passenger and freight travel, this means that roughly 13% of pkm and tkm are shifted to other modes. As a result, road infrastructure in the 2DS is expected to be approximately 10 million paved lane‐km lower than in 4DS projections to 2050 (Figure 13). In particular, China and India are expected to add 3.5 million lane‐km less than in 4DS projections.
Figure 13 • 2DS roadway projections
Key message • Roadway growth in the 2DS is projected to decrease nearly 20% over 4DS levels, which equates to nearly USD 15 trillion in projected savings on infrastructure spending.
Average global roadway occupancy levels in the 2DS are 10% less than in 4DS projections by 2050. In particular, average road occupancy levels in China drop by more than 20% over 4DS levels, thereby stabilising by 2030. In India, average road occupancy levels decrease by 15% from 4DS projections, and in Latin America, Africa and the Middle East, they decrease by roughly 5% over 4DS projections. While these reductions are less notable than in China and India, 2DS travel and road occupancy decreases in Latin America, Africa and the Middle East mean that average congestion levels in those regions will decline by as much as 15% in comparison to 2010 levels by 2050.
Under the 2DS, global roadway investment and maintenance expenditures are projected to decrease nearly USD 15 trillion from 4DS transport spending levels. This equates to roughly USD 350 billion per year in road expenditure savings, or a 20% decrease over expected average annual 4DS expenditure levels. In particular, OECD North America, Russia, ASEAN, Latin America and Africa are expected to decrease transport infrastructure expenditures over the 4DS by more than 25%.
0
10
20
30
40
50
60
70
2000 2005 2010 2015 2020 2025 2030 2035 2040 2045 2050
2DS roadway (million paved lane‐km)
OECD North America
OECD Europe
OECD Pacific
China
India
ASEAN
Latin America
Africa
Other
4DS roadway
Global Land Transport Infrastructure Requirements © OECD/IEA 2013 Estimating road and railway infrastructure capacity and costs to 2050
Page | 26
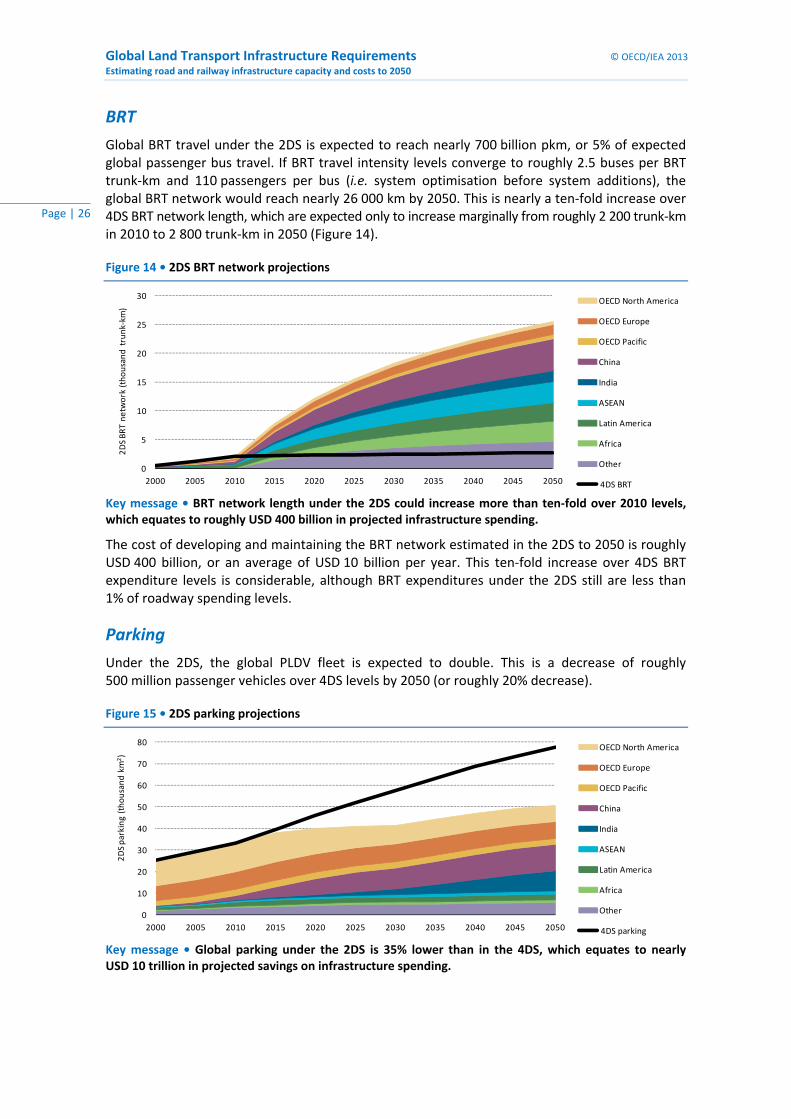
BRT
Global BRT travel under the 2DS is expected to reach nearly 700 billion pkm, or 5% of expected global passenger bus travel. If BRT travel intensity levels converge to roughly 2.5 buses per BRT trunk‐km and 110 passengers per bus (i.e. system optimisation before system additions), the global BRT network would reach nearly 26 000 km by 2050. This is nearly a ten‐fold increase over 4DS BRT network length, which are expected only to increase marginally from roughly 2 200 trunk‐km in 2010 to 2 800 trunk‐km in 2050 (Figure 14).
Figure 14 • 2DS BRT network projections
Key message • BRT network length under the 2DS could increase more than ten‐fold over 2010 levels, which equates to roughly USD 400 billion in projected infrastructure spending.
The cost of developing and maintaining the BRT network estimated in the 2DS to 2050 is roughly USD 400 billion, or an average of USD 10 billion per year. This ten‐fold increase over 4DS BRT expenditure levels is considerable, although BRT expenditures under the 2DS still are less than 1% of roadway spending levels.
Parking
Under the 2DS, the global PLDV fleet is expected to double. This is a decrease of roughly 500 million passenger vehicles over 4DS levels by 2050 (or roughly 20% decrease).
Figure 15 • 2DS parking projections
Key message • Global parking under the 2DS is 35% lower than in the 4DS, which equates to nearly USD 10 trillion in projected savings on infrastructure spending.
0
5
10
15
20
25
30
2000 2005 2010 2015 2020 2025 2030 2035 2040 2045 2050
2DS BRT network (thousand trunk‐km
)
OECD North America
OECD Europe
OECD Pacific
China
India
ASEAN
Latin America
Africa
Other
4DS BRT
0
10
20
30
40
50
60
70
80
2000 2005 2010 2015 2020 2025 2030 2035 2040 2045 2050
2DS parking (thousand km
2)
OECD North America
OECD Europe
OECD Pacific
China
India
ASEAN
Latin America
Africa
Other
4DS parking

© OECD/IEA 2013 Global Land Transport Infrastructure Requirements Estimating road and railway infrastructure capacity and costs to 2050
Page | 27
If in addition to avoid/shift policies countries were to pursue parking policies to bring the global parking average down to two 15 m2 spaces per vehicle, PLDV parking could be reduced by as much as 27 000 km2 (Figure 15). Projected parking additions in China and India would be reduced by nearly 12 000 km2 while parking in OECD North America would decrease by nearly 6 000 km2.
Parking infrastructure investment costs in the 2DS would decrease by nearly USD 4 trillion, or 45% over 4DS projections. When paired with reconstruction and O&M costs, global parking infrastructure expenditures would decrease nearly USD 10 trillion over 4DS spending levels. This equates to roughly USD 250 billion a year saved on parking infrastructure expenditures.
Rail
Annual rail travel in the 2DS is expected to increase by more than 6.1 trillion pkm and tkm, or nearly 30% over 4DS rail travel. Global rail infrastructure is therefore expected to increase to 1.5 million track‐km, or roughly 200 000 track‐km more than expected 4DS rail additions (Figure 16). Average global rail occupancy levels under the 2DS would increase by roughly 10%. This appears to be a reasonable increase, given rail capacity to accommodate heavy levels of passenger and freight movements.
Under the 2DS, global rail investment and maintenance expenditures are projected to increase to nearly USD 1.5 trillion, or a 20% increase over 4DS transport spending levels. This equates to an average of nearly USD 35 billion per year in additional costs, or one tenth of the USD 350 billion annual savings from road expenditure savings in the 2DS. These cost estimates do not include HSR development (discussed below); although, both conventional rail and HSR additions in the 2DS still are a small portion of the savings from 2DS road savings.
Figure 16 • 2DS railway projections
Key message • Global parking under the 2DS is 15% higher than in the 4DS, which equates to nearly USD 1.5 trillion in additional infrastructure spending.
HSR
Under the 2DS, global HSR travel is expected to reach nearly 4 trillion pkm, or 35% of expected global rail pkm. If HSR travel intensity levels were to remain around 25 million pkm per HSR track‐km, this growth in HSR travel would mean that the global HSR network would grow to about 135 000 km by 2050, or an addition of 90 000 track‐km beyond expected 2025 HSR network length (Figure 17). While this jump in HSR network length may appear considerable, it actually falls in line with total potential global HSR network length if all planned and proposed (either officially or at least conceptually) HSR track were built.
0
200
400
600
800
1 000
1 200
1 400
1 600
2000 2005 2010 2015 2020 2025 2030 2035 2040 2045 2050
2DS railw
ay (thousand track‐km)
OECD North America
OECD Europe
OECD Pacific
China
India
ASEAN
Latin America
Africa
Other
4DS railway

Global Land Transport Infrastructure Requirements © OECD/IEA 2013 Estimating road and railway infrastructure capacity and costs to 2050
Page | 28
The increases in HSR travel and network length mean considerable investments. In order to achieve a 130 000 km global HSR network under the 2DS, HSR spending needs to double 4DS spending levels to USD 80 billion per year for capital infrastructure additions alone (not including reconstruction or O&M). This amounts to a total capital investment of USD 3 trillion by 2050.
Cumulative HSR investment and maintenance costs under the 2DS are projected to reach USD 4 trillion by 2050. This is roughly half of expected rail expenditures in the 2DS, even though HSR network length would only account for 8% of total global rail track‐km. While HSR investment and maintenance costs in the 2DS are considerable compared to conventional rail expenditures, they nonetheless are small relative to savings from road in the 2DS.
Figure 17 • 4DS HSR network and 2DS HSR network potential
Key message • HSR network length under the 2DS could increase nearly 8.5‐fold over 2010 levels, which equates to an additional USD 4 trillion in projected infrastructure spending.
0
20
40
60
80
100
120
140
2000 2005 2010 2015 2020 2025 2030 2035 2040 2045 2050
2DS HSR
(thousand track‐km)
2DS network
Planned or proposed
Under construction
In operation

© OECD/IEA 2013 Global Land Transport Infrastructure Requirements Estimating road and railway infrastructure capacity and costs to 2050
Page | 29
Conclusions
The infrastructure projections developed for this analysis and ETP 2012 illustrate the potential of the avoid and shift strategy to reduce total infrastructure development (especially road) while reducing global expenditures on land transport infrastructure by as much as USD 20 trillion by 2050. These policies, when part of an avoid/shift and improve strategy, as identified in the ETP 2012 2DS, could mean a total potential savings of USD 70 trillion in vehicles, fuel and infrastructure expenditures (IEA, 2012). These strategies would likewise contribute to considerable energy reduction over the 4DS and significant GHG abatement in the transport sector by 2050.
Total infrastructure additions and cumulative capital, reconstruction and O&M expenditures (in real and undiscounted USD) are shown in Table 1 for the 4DS and 2DS. These estimates may change depending on how quickly countries allow infrastructure to grow, how much money countries invest in land transport infrastructure, and how countries devise policies to manage travel demand and shift travel to more energy efficient and sustainable modes.
The simple accounting of projected costs in this publication does not reflect all costs (e.g. pollution and travel time) associated with an avoid/shift strategy, nor does it consider the other potential benefits or impacts of those policies (e.g. some types of transport may be more highly valued than others). It is important to note that improving transport networks to allow greater, more sustainable mobility with decreased demand for private motorised travel also may affect the net benefits of the system: if overall mobility in the 2DS were reduced compared to the 4DS, then those lost benefits would need to be compared to the cost reductions presented in this paper.
Table 1 • Land transport infrastructural additions to 2050
Infrastructure
(thousands of units, to the left) Expenditures (billion USD)
4DS 2DS 4DS 2DS
OE
CD
Road (paved lane-km) 3 300 -500 29 600 24 100
BRT (trunk-km) 0.26 2.4 27 84
Rail (track-km) 136 210 4 100 4 600
HSR (track-km) 11 34 580 1 300
Parking (km2) 4 700 -6 000 18 900 13 600
Total - - 53 200 43 700
No
n-O
EC
D
Road (paved lane-km) 22 000 15 300 45 800 36 700
BRT (trunk-km) 0.36 21 100 21 322
Rail (track-km) 198 324 3 700 4 500
HSR (track-km) 18 83 820 2 800
Parking (km2) 39 700 23 600 14 700 10 200
Total - - 65 000 54 500
Wo
rld
Road (paved lane-km) 25 300 14 800 75 400 61 100
BRT (trunk-km) 0.62 24.5 48 406
Rail (track-km) 334 534 7 800 9 300
HSR (track-km) 29 117 1 400 4 100
Parking (km2) 44 400 17 600 33 600 24 000
Total - - 118 200 98 200
Global Land Transport Infrastructure Requirements © OECD/IEA 2013 Estimating road and railway infrastructure capacity and costs to 2050
Page | 30
“Stick”‐type policies that discourage driving and encourage shifts to more sustainable modes of travel could result in lost benefits for some people. However, “carrot” policies – namely the provision of more transit and non‐motorised modes of travel – and more intelligent land‐use planning (smart growth) are the source of potentially large social benefits. Such improvements are not the focus of this paper; however, since some stick policies, such as higher fuel or parking prices, may be needed to achieve the 2DS results presented here and in ETP 2012, the effects and costs to society of those policies deserves further investigation.
The contrast between the 4DS and 2DS presented in this paper and in ETP 2012 suggests that large land transport infrastructure expenditure savings are possible by shifting away some travel from cars and towards mass transit modes. Improving transport options through increased development of higher capacity, more efficient travel modes should allow substantial net mobility benefits with net reductions in projected transport energy use, emissions and infrastructure expenditures – and therefore substantial net benefits to society.

© OECD/IEA 2013 Global Land Transport Infrastructure Requirements Estimating road and railway infrastructure capacity and costs to 2050
Page | 31
Annex
IEA MoMo regions
Table 2 lists the global regions and specific countries analysed in the IEA Mobility Model (MoMo) and this paper.
Table 2 • Countries, regions and aggregate regions analysed in the IEA MoMo
OECD Non-OECD
OECD North America EU 6
Canada OETE
Mexico Russia
United States ATE
OECD Europe China
France ODA
Germany ASEAN
Italy India
United Kingdom Middle East
EU 18-EU G4 Latin America
EU Nordic Brazil
Non-EU Nordic Other Latin America
Non-EU OE2 Africa
OECD Pacific South Africa
Australia and New Zealand Other Africa
Japan
Korea
Other OECD
Historic infrastructure database
Historic land transport infrastructure data have been collected and compiled by the IEA from sources including IRF (2012), UIC (2012), ITDP and EMBARQ. Data have been gathered on more than 25 indicators, including network length, type (e.g. motorway and secondary roads) and quality of infrastructure (e.g. percent paved road) from 1999 to 2010. Where possible, data have been collected from countries and region around the world, though in some cases it was necessary to assume that indicators in some countries or regions were similar to others. Data were available annually or frequently (e.g. every other year) for most OECD countries (Table 3). In non‐OECD countries, especially Latin America and Africa, data were often infrequent or limited.
IRF World Road Statistics (WRS) 2011 data have been compiled and segregated for each country and year from 1999 to 2009. Road data include indicators on roadway length by road class (motorway, highway, secondary, and other), paved surface and density. These indicators data have been compiled, and then any missing or inconsistent annual national data have been estimated.

Global Land Transport Infrastructure Requirements © OECD/IEA 2013 Estimating road and railway infrastructure capacity and costs to 2050
Page | 32
Table 3 • Data availability
Roadway BRT networks Railway
Total length
Length by
class
Lane-km
% paved
Density (km/km2)
Length RidershipTotal length
Length by electrification
HSR length
HSR ridership
OE
CD
OECD North America
Canada n/a n/a n/a
Mexico n/a n/a
United States
OECD Europe
France
Germany
Italy
United Kingdom
EU 18-EU G4
EU Nordic
Non-EU Nordic n/a n/a n/a n/a
Non-EU OE2
OECD Pacific
Australia/New Zealand n/a n/a
Japan
Korea
Other OECD n/a n/a
Non
-OE
CD
EU 6 n/a n/a
OETE n/a n/a n/a n/a
Russia n/a n/a n/a n/a
ATE n/a n/a n/a n/a
China
ODA n/a n/a n/a n/a
ASEAN n/a n/a
India n/a n/a
Middle East n/a n/a
Latin America
Brazil n/a n/a
Other Latin America n/a n/a
Africa
South Africa n/a n/a
Other Africa n/a n/a
Annual data Some data Estimated data
Frequent data Limited data n/a Non-applicable
In the case of missing annual road data, several general assumptions have been made depending on the country and overall availability of data. In general, the following rules have been applied to the missing values.

© OECD/IEA 2013 Global Land Transport Infrastructure Requirements Estimating road and railway infrastructure capacity and costs to 2050
Page | 33
For countries with only one year of data available (or the same data for several years with no other available data) historic values have been assumed for all years to avoid any spikes in regional data (i.e. plateau effect).
Where data were available (and distinguishable for different years), missing data have been filled between available years by interpolating available data linearly from previous and ensuing years.
In the case of missing data at the beginning or end of a country time series or where interpolation was not possible, missing data have been filled using either:
average total annual increase/decrease for the time series, where the average has been taken from available data (applied selectively);
the linear trend of immediately preceding or ensuing data (applied selectively); or
values from the preceding or ensuing data (i.e. plateau effect).
In the case of inconsistent official data (e.g. motorways that drop from 1 000 km in 1999 to 3 000 km in 2000 and back to 1 100 km in 2001), IRF data have been replaced using data from official national sources (when available) or using approximations determined by the aforesaid methods. These substitutions have been applied to avoid any inconsistencies or spikes in data trends, especially as many of the identified inconsistencies often have been a result of changes in roadway classifications.
Data have been validated to ensure that none of the aforementioned methods would result in negative infrastructure values or any improbable annual additions of roadway. Data also have been validated to ensure that any calculated categorical values (e.g. motorways, highways, secondary and other roads) are equal to the equivalent reported net roadway values.
Certain additional data values have been calculated using IRF WRS annual statistics. In particular, paved motorway, highway and non‐motorway/highway roads (NMH) have been estimated using IRF roadway kilometre statistics and reported percent of roadway that is paved. These paved roadway kilometre estimates have been used to project infrastructural development, where it has been assumed that new roadway is most likely to be paved.
Paved motorway kilometres have been estimated using the following assumptions:
Since all motorways under IRF definition are paved, 100% of motorways have been assigned to paved roadway kilometres.
Net paved road kilometres less paved motorway have been used to determine the number of paved highway kilometres, where it has been assumed highways are most likely to be paved before secondary or other roads.
Last, any paved NMH road kilometres (i.e. secondary and other roads) have been calculated in the case that net paved roadway is greater than both the sum of paved motorway and paved highway kilometres.
Lane‐km estimates have been approximated in order to provide a better perspective of the relationship between vehicle travel and roadway infrastructure. This analysis has assumed that lane‐km estimates are a better indicator of space for vehicle travel (e.g. vehicle accommodation) than net roadway kilometres.
To determine lane‐km estimates, an approximate method has been used since very few nations have available statistical lane‐km data. The following assumptions have been made and verified using actual country lane‐km data when available.
Motorways have been assumed to have an average of five lanes, as most motorways have between four and six lanes. Very few nations have eight‐ to ten‐lane motorways, and the net
Global Land Transport Infrastructure Requirements © OECD/IEA 2013 Estimating road and railway infrastructure capacity and costs to 2050
Page | 34
length of those “super” motorways is minimal in comparison to the net length of all motorway lane‐kilometres. Five lanes therefore have been assumed to be an appropriate estimation.
Highways have been assumed to have an average of three lanes. These values were determined using historic lane‐km statistics and highway lane‐km estimates for the United States, United Kingdom and Republic of Korea. Three lanes per highway kilometre likewise is considered to be an appropriate estimate as many highways, especially in rural and inter‐urban areas, have long stretches of two lane roadway that would skew the average lane‐km estimates of tradition four to six lane highways.
NMH have been estimated to have an average of two lanes per roadway kilometre, where the vast majority of rural and secondary roads are likely to have only two lanes (one in each direction). Historic statistical data from the United States, United Kingdom and Republic of Korea corroborate this estimated value.
Lane‐km estimates have been compared to official historic, statistical data in the United States, United Kingdom and Korea. The range of error, depending on the category of roadway, is from 2% to 6.5%. There is no consistency in the categorical errors between the three countries; for example, differences in motorway and highway lane‐km are not consistent between the three countries. There likewise is no consistency in annual percent errors for lane‐km estimates, nor does there appear to be any linear trends in the annual errors when compared to historic data. Given the size of the statistical errors (an overall value of less than 4%) and the inconsistent nature of the individual and annual errors, it has been assumed the lane‐km estimates applied in this analysis were appropriate.
For rail, UIC Railway Time Series (SIC) data have been compiled and segregated for each country across the globe from 2000 to 2009. Data include indicators on track length, electrification and revenue pkm and tkm. UIC SIC also includes data on HSR networks and development.
As with IRF WRS data, several assumptions for missing and inconsistent UIC SIC data have been made depending on the country and availability of data. In general, the following rules have been applied to the missing values.
For countries with only one year of data available (or the same data for several years with no other available, different data), the same values have been assumed for all years to avoid any spikes in data.
Where data were available, missing data have been filled between available years by interpolating available data linearly from previous and ensuing years.
Where missing data were at the beginning or end of a country time series and where interpolation was not possible, missing data have been filled using either the average total annual increase/decrease for the time series or using the immediately preceding or ensuing data (i.e. plateau effect).
As with roadway, inconsistent railway data have been reassigned to avoid regional spikes using official national data (when available) or through the above methods.
Infrastructure cost database
Cost estimates for infrastructure development, operations and maintenance have been collected in partnership with ITF, IRF, UIC and ADB. In particular, data from more than 400 transport projects and demonstrations were collected as part of the Sustainable Transport Initiative at ADB. Cost data also have been collected from the Cities Development Initiative for Asia (CDIA), Central Asia Regional Economic Cooperation (CAREC), Victoria Transport Policy Institute (VTPI), Network for Environmentally Sustainable Transport in Latin America and the Caribbean (NESTLAC),

© OECD/IEA 2013 Global Land Transport Infrastructure Requirements Estimating road and railway infrastructure capacity and costs to 2050
Page | 35
Institute for Transportation and Development Policy (ITDP), the Global Environment Facility and United Nations Environment Programme (GEF/UNEP), the Japan International Cooperation Agency (JICA) and the World Bank. Historic national infrastructure investments and transport sector budget data also have been collected for OECD member countries, ITF country participants and ADB developing member countries. This data has been used to validate the projected infrastructure costs in this analysis relative to existing infrastructure expenditure levels.
In total, data have been obtained for transport development projects and national transport budgets in more than 110 countries, representing more than 1 300 country‐year points (number of projects per country and year). Half of collected data is from non‐OECD countries, while nearly two‐thirds of non‐OECD data is from Asia and the Pacific (Table 4).
Table 4 • Collected data in country‐year points in select regions
Country-year points
OECD North America 171
OECD Europe 420
OECD Pacific 57
China 112
India 48
ASEAN 108
Middle East 6
Latin America 45
Africa 8
World Total 1 320
In general, collected project costs have been delineated by project component, including capital cost, planning and consulting, equipment acquisition, interest charged and operation and maintenance provisions. Data also has been unitised according to project descriptions (e.g. cost per roadway lane‐km, per railway track‐km and per square metre of parking). For this analysis, capital infrastructure (e.g. construction) and O&M costs have been considered, where capital costs have been assumed to include any related planning and development expenses, as well as any particular project costs such as equipment acquisitions.
Table 5 • Observed cost range to build new road, rail and parking infrastructure, 2010 (in thousand USD)
Capital Reconstruction/upgrade O&M
Road (per lane-km) OECD 700-3 000 3-1 200 8-40
Non-OECD 150-2 700 5-2 300 1-30
Rail (per track-km)* OECD 2 000-18 000 - 40-300
Non-OECD 85-3 900 160-3 000 10-820
Parking (per m2) OECD 0.1-0.8 - 0.003-0.05
Non-OECD 0.3-0.4 - 0.001-0.04
* Extreme rail project costs, such as tunnel boring, were excluded in these estimates.
Note 1: “‐“ indicates that no data has been collected to date.
Note 2: BRT and HSR costs assumptions are discussed separately in the following sections.
Note 3: specific cost assumptions for road, rail and parking infrastructure projections are detailed in the following sections.
Sources: IEA estimates based on ADB (2012); ITF (2011); IRF (2012); UIC (2012).
Collected transport infrastructure costs reflect a broad range of investment and maintenance costs with regards to the nature and scope of individual projects (Table 5). Collected data also
Global Land Transport Infrastructure Requirements © OECD/IEA 2013 Estimating road and railway infrastructure capacity and costs to 2050
Page | 36
occasionally represents project‐specific costs such as equipment acquisitions that do not necessarily represent global averages in infrastructure investment and maintenance costs. While specific infrastructure development and maintenance costs vary depending on the nature of the project and the intensity of infrastructural use, the overall average of collected infrastructure costs on a unitised basis (e.g. per infrastructural kilometre) appears relatively constant across global regions, especially when exceptional project costs are discounted.
To account for any project‐specific uncertainties, average region‐wide estimates have been applied for road, rail and parking infrastructure projections. Similarly, O&M costs have been estimated using average regional values. When no cost data were available for a particular region, average OECD or non‐OECD capital cost values have been applied. Similarly, when no specific regional O&M data were available, annual O&M costs have been approximated using an average of roughly 3% of capital development costs. This value has been assumed to be appropriate given that the bulk of collected project O&M costs fall between 1% and 5% of net capital costs.
Road
Roadway development costs have been split into two categories: construction of new infrastructure and reconstruction, and upgrades of existing, older infrastructure. Reconstruction and upgrade costs differ from annual O&M expenditures as they generally include civil works such as road strengthening, surface reconstruction and rehabilitation, and shoulder widening. Because reconstruction and upgrade costs involve work on existing roadway, they generally are less expensive than new construction. At the same time, they tend to be far more expensive than regular roadway maintenance.
New road construction costs for projects collected in this analysis ranged from roughly USD 100 000 to USD 2.7 million per lane‐km, depending on the type of roadway (e.g. expressway, motorways and access roads), the project location (e.g. urban roads, interurban motorways and rural roads) and the specific scope of the project (for example, if civil works included bridges or tunnels construction). Collected project costs also may be inclusive of other miscellaneous expenses, such as equipment purchases and roadway facilities construction (e.g. service stations).
As a general rule, individual project costs that appeared outstandingly exceptional or extraneous have been removed from net project capital costs when project cost elements could not be segregated. Overall, the bulk of collected roadway construction projects had costs that fall within a rather consistent range. Most road capital development costs ranged between USD 600 000 and USD 1.5 million per lane‐km, where the average global construction cost is roughly USD 1.3 million per lane‐km. Expressway and urban roadway construction generally had higher per lane‐km costs.
Roadway reconstruction and upgrade costs ranged from roughly one‐tenth to one‐third of capital construction costs. Again, the cost of those reconstruction and upgrade projects depended on the nature of the project and the location of the roadway. Some upgrade projects consist of paving existing, unpaved roads. Other upgrade and reconstruction projects included full‐road milling and resurfacing. Urban road reconstruction projects and reconstruction projects involving other infrastructure, such as bridges in need of repair, generally had higher per lane‐km costs.
The following average regional roadway construction and reconstruction/upgrade cost values have been applied in the infrastructure model with respect to data collected for this analysis, where regional variations reflect overall trends in collected cost data (Table 6). No distinctions have been made between rural, interurban and urban construction costs, as this level of detail is not possible on a regional scale. To the same extent, average reconstruction and upgrade costs have been considered collectively, as the model does not distinguish between road upgrades and the reconstruction of existing roads.

© OECD/IEA 2013 Global Land Transport Infrastructure Requirements Estimating road and railway infrastructure capacity and costs to 2050
Page | 37
Table 6 • Roadway cost assumptions (thousand USD per paved lane‐km, 2010)
Construction Reconstruction/upgrade O&M
OECD North America 1 200 200 30
OECD Europe 1 200 200 30
OECD Pacific 1 300 250 40
China 1 200 200 35
India 1 000 150 30
ASEAN 1 100 150 33
Middle East 1 000 150 30
Latin America 1 100 200 35
Africa 1 200 200 35
Operation and maintenance costs have been estimated at the aforesaid approximation of roughly 3% of capital costs for each region, where only capital construction costs have been used and not reconstruction costs. Here, it has been assumed that O&M costs would be roughly the same for newly constructed and reconstructed roadway. Naturally, this may vary by region and the specific new or reconstructed roadway. Likewise, while roadway O&M costs tend to start low and increase with the age of the road, for the purpose of this analysis, average constant annual O&M costs have been applied.
It also has been assumed in the model that roadway surfaces have a lifetime value of roughly 20 years. Accordingly, net roadway kilometres existing in 2010 will require reconstruction or upgrading at least once by 2030 and once again by 2050. Likewise, any roadway infrastructure constructed between now and 2030 will require reconstruction or upgrading at least once by 2050. O&M frequency has been estimated for at least once every four years. Naturally, roads with higher traffic or exceptional wear may require more frequent reconstruction and maintenance schedules. However, these assumed values have been applied as a universal estimate for roadway reconstruction and O&M frequencies.
BRT
Data on 83 BRT projects have been collected, including costs for roadway trunk development, station construction and BRT signalisation. In particular, data from ITDP and EMBARQ have been collected and applied on a per‐kilometre basis for the additional expected, planned and potential BRT networks applied within the 4DS and 2DS.
Overall BRT infrastructure development costs ranged from roughly USD 1 million to more than USD 50 million per trunk‐km, where average development costs were approximately USD 9 million per trunk‐km. Because of the vast range in collected data, particularly between OECD and non‐OECD countries, separate averages have been applied for OECD and non‐OECD regions. OECD regions are assumed to have an average BRT trunk development cost of roughly USD 15 million, while non‐OECD regions have been assumed to have an average capital construction cost of USD 7 million per trunk‐km.
Reconstruction costs, as with roadway reconstruction estimates, have been assumed to be roughly half of BRT capital development costs, where it is assumed that only roadway surfaces would need reconstruction, rather than all supporting trunk infrastructure. Like roadway infrastructure, it has been assumed that trunk road surfaces have a lifetime value of roughly 20 years.
Annual operation and maintenance costs have been approximated at the global average from collected cost data, or roughly 3% of capital costs. O&M frequency has been estimated for at least once every 3 years, although local BRT conditions may require more frequent maintenance.

Global Land Transport Infrastructure Requirements © OECD/IEA 2013 Estimating road and railway infrastructure capacity and costs to 2050
Page | 38
Parking
Parking cost data have been collected for several OECD cities as well as for parking development projects in Indonesia and India (ADB, 2012; VTPI, 2011). In general, non‐OECD parking cost estimates were considerably less expensive than OECD values; although these varied according to the type of parking structure (e.g. street, surface, multi‐story and underground). The average cost for surface level parking was roughly USD 150 per square metre, or USD 150 million per square kilometre. To account for regional price differences, the following average regional values have been applied in the model. No distinctions have been made between rural, interurban and urban parking values for the region‐wide analysis, although it is expected that costs will be higher for urban development projects and slightly lower for rural or interurban parking (Table 7).
Table 7 • Parking cost assumptions (million USD per km2)
Construction Reconstruction O&M
OECD North America 300 240 9
OECD Europe 300 240 9
OECD Pacific 250 200 7.5
China 150 120 4.5
India 150 120 4.5
ASEAN 150 120 4.5
Middle East 175 140 5.3
Latin America 150 120 4.5
Africa 120 95 3.6
Reconstruction costs (e.g. resurfacing) have been estimated as roughly 80% of capital development costs, where it has been assumed that parking infrastructure on average would need to be replaced at least once every 20 years. Operation and maintenance costs have been approximated as roughly 3% of construction costs. Average parking O&M has been assumed for every three years.
For the purpose of this analysis, it has been assumed that average parking development costs include any additional land purchases. Naturally, the abovementioned costs would be expected to rise if additional land purchases costs were necessary, especially in the urban context.
Rail
Railway development costs (not including HSR) ranged from USD 80 thousand to USD 3.9 million per track‐km (not including projects with extensive tunnelling). In some cases, this included auxiliary construction costs such as railway bridges, minor tunnels, signalling, communications, electrified track and service and access roads. Global average per track‐km construction costs were roughly USD 3 million per track‐km.
The nature of specific rail projects makes it difficult to assess the average cost per track‐km of railway development. Track electrification, tunnels and bridges construction, and auxiliary costs (e.g. railway stations) can raise rail development costs considerably. Consequently, the average costs applied in the model have been assumed to include infrastructural development and any related infrastructural construction such as signalisation, possible electrification, tunnels, bridges, stations and equipment (Table 8). Naturally, project costs may vary depending on the specific scope of a railway project.
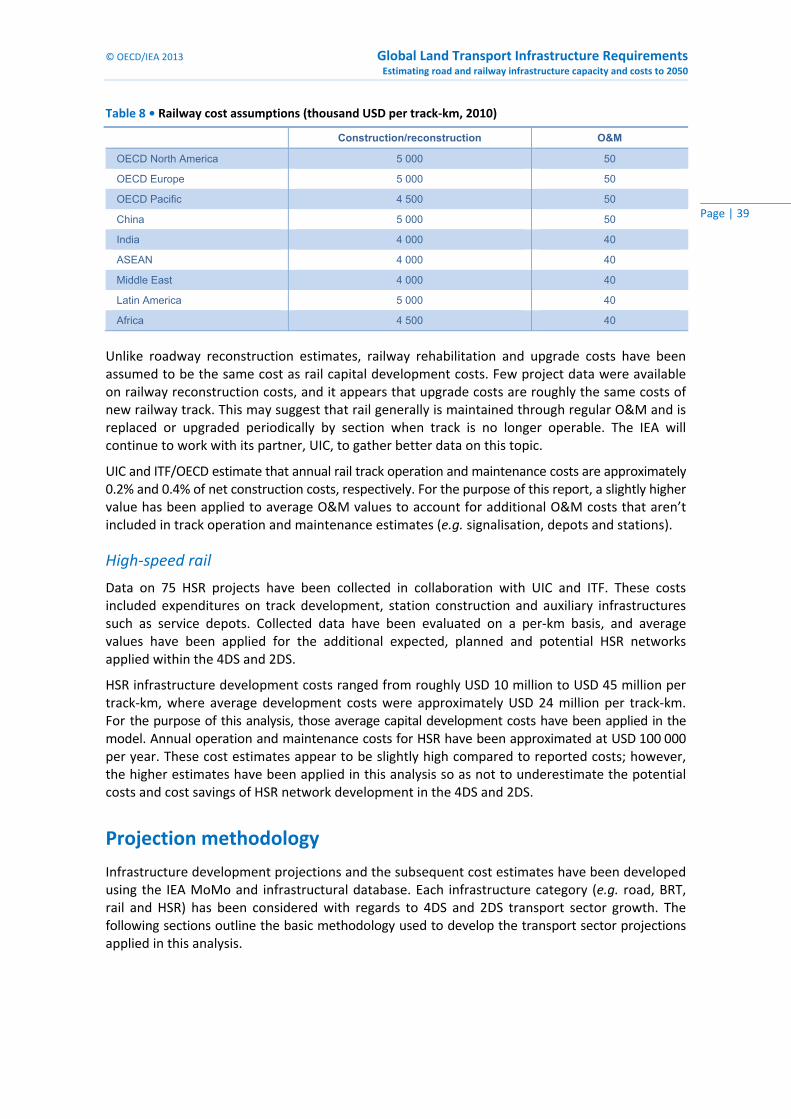
© OECD/IEA 2013 Global Land Transport Infrastructure Requirements Estimating road and railway infrastructure capacity and costs to 2050
Page | 39
Table 8 • Railway cost assumptions (thousand USD per track‐km, 2010)
Construction/reconstruction O&M
OECD North America 5 000 50
OECD Europe 5 000 50
OECD Pacific 4 500 50
China 5 000 50
India 4 000 40
ASEAN 4 000 40
Middle East 4 000 40
Latin America 5 000 40
Africa 4 500 40
Unlike roadway reconstruction estimates, railway rehabilitation and upgrade costs have been assumed to be the same cost as rail capital development costs. Few project data were available on railway reconstruction costs, and it appears that upgrade costs are roughly the same costs of new railway track. This may suggest that rail generally is maintained through regular O&M and is replaced or upgraded periodically by section when track is no longer operable. The IEA will continue to work with its partner, UIC, to gather better data on this topic.
UIC and ITF/OECD estimate that annual rail track operation and maintenance costs are approximately 0.2% and 0.4% of net construction costs, respectively. For the purpose of this report, a slightly higher value has been applied to average O&M values to account for additional O&M costs that aren’t included in track operation and maintenance estimates (e.g. signalisation, depots and stations).
High‐speed rail
Data on 75 HSR projects have been collected in collaboration with UIC and ITF. These costs included expenditures on track development, station construction and auxiliary infrastructures such as service depots. Collected data have been evaluated on a per‐km basis, and average values have been applied for the additional expected, planned and potential HSR networks applied within the 4DS and 2DS.
HSR infrastructure development costs ranged from roughly USD 10 million to USD 45 million per track‐km, where average development costs were approximately USD 24 million per track‐km. For the purpose of this analysis, those average capital development costs have been applied in the model. Annual operation and maintenance costs for HSR have been approximated at USD 100 000 per year. These cost estimates appear to be slightly high compared to reported costs; however, the higher estimates have been applied in this analysis so as not to underestimate the potential costs and cost savings of HSR network development in the 4DS and 2DS.
Projection methodology
Infrastructure development projections and the subsequent cost estimates have been developed using the IEA MoMo and infrastructural database. Each infrastructure category (e.g. road, BRT, rail and HSR) has been considered with regards to 4DS and 2DS transport sector growth. The following sections outline the basic methodology used to develop the transport sector projections applied in this analysis.

Global Land Transport Infrastructure Requirements © OECD/IEA 2013 Estimating road and railway infrastructure capacity and costs to 2050
Page | 40
Road
Several relationships between pkm and tkm, vehicle travel and roadway infrastructure have been considered in this analysis. Ultimately, the relationship between vehicle travel, expressed as vkm (both passenger and freight vehicles), and roadway paved lane‐km has been applied since, in principle, infrastructural capacity limits vehicle flow. To some extent, paved lane‐km additions also may spur vkm growth, at least locally; although the influence of infrastructure additions on road travel demand has not been considered as part of this analysis.
Road paved lane‐km have been projected using an iterative process developed through observations in various projections of potential road infrastructure growth to 2050. Historic vkm to paved lane‐kilometre ratios first were applied to IEA MoMo vkm estimates to 2050 for the 28 global regions analysed in MoMo. The results of this linear projection, shown below (Figure 18), clearly are unrealistic: the roadway density (road km per km2 of land) for the entire country of India under this projection would be more than the present density of roads in New York City in the United States. Under these linear projections, China and India alone would more than double present global road network length by 2050.
Figure 18 • Global paved lane‐km using linear historic projections
Source: IEA linear projections based on IRF (2012).
Key message • Global road infrastructure using a linear projection would result in improbable levels of roadway in China and India.
This improbable growth in road infrastructure under a linear historic projection of vehicle travel to paved lane‐km can be explained by low historic average road occupancy levels (vkm to paved lane‐km) as well as large expected surges in vehicle travel in China and India. In fact, of the 28 regions analysed in MoMo, China and India currently have the two lowest road occupancy levels (Figure 19). Average annual vehicle travel (total vkm, shown by bubble size below) in China and India also is considerably low when compared to OECD regions. As a result, linear roadway infrastructure projections to 2050 are skewed both by low historic road occupancy levels and by significant future increases in annual vehicle travel to 2050.
To account for these unrealistic initial projections of roadway paved lane‐km, a more dynamic, iterative projection method has been developed to account for several assumed influences on infrastructure development. First, historic national vkm to paved lane‐km ratios have been applied to road projections on a sliding scale rather than as a fixed ratio (as applied in the linear projections displayed in Figure 18). In other words, average historic road occupancy levels have been taken for the three previous years (i,j,k) of each subsequent annual projection for present year, Yl, instead of using the same historic value over the whole modelling time frame. These moving averages allow for increases (or decreases) in average vehicle travel per infrastructural
0
15
30
45
60
75
2010 2020 2030 2040 2050
Roadway lane‐km (million)
OECD North America
OECD Europe
OECD Pacific
China
India
ASEAN
Latin America
Africa
Other

© OECD/IEA 2013 Global Land Transport Infrastructure Requirements Estimating road and railway infrastructure capacity and costs to 2050
Page | 41
kilometre as countries’ road travel demands change over time. The moving averages allow countries like China and India to increase average vkm per roadway kilometre before necessarily adding additional infrastructure.
Figure 19 • Average historic roadway occupancy levels for several global regions (2000‐10)
Source: IRF (2012), IEA (2012).
Note: bubble sizes indicate average annual historic vehicle travel (vkm) between 2000 and 2010.
Key message • Average roadway occupancy levels in China and India still remain considerably low compared to other regions of the world, although travel in urban areas may be significantly more congested.
Table 9 • Historic and applied road construction capacity limits for select global regions
Historic average annual construction capacity
(paved lane-km) Applied annual construction limits
(paved lane-km)
OECD North America 225 000 225 000
OECD Europe 255 000 255 000
OECD Pacific 25 000 30 000
China 350 000 355 000
India 98 000 110 000
ASEAN 54 000 60 000
Middle East 18 000 80 000
Latin America 15 000 100 000
Africa 11 000 25 000
Construction capacity limits have been applied using historic annual roadway addition values to ensure that net annual paved lane‐km additions did not exceed realistic national capability to build new road (Table 9). In general, high upper limits have been applied for countries with low average annual historic construction capacities to provide room for future additions in the case of considerable projected future vehicle travel growth. In countries with no reported historic roadway growth, average regional construction capacity limits have been applied from countries of similar size and development status.
In addition to construction capacity limits, roadway density limits (paved lane‐km per km2 of land) have been applied. Here it has been assumed that countries will build roadway to achieve high infrastructural capacity (vkm per paved lane‐km) rather than build indefinitely or use valuable land for transport infrastructure. Density limits therefore have been applied and compared to historic international roadway densities to ensure that roadway infrastructure projections do not exceed realistic nominal levels, where Japan has the highest current average national roadway density in the world at roughly 5.5 paved lane‐km per square kilometre of land.
0
200
400
600
800
1 000
Vehicle‐km to
paved lane‐km (thousand)
OECD N. America OECD Europe OECD Pacific China India ASEAN Latin America Africa

Global Land Transport Infrastructure Requirements © OECD/IEA 2013 Estimating road and railway infrastructure capacity and costs to 2050
Page | 42
Again, high upper limits have been applied to provide room for future additions in the case of considerable projected future vehicle travel growth (Table 10).
Table 10 • Historic and applied road density limits for select global regions
2010 density level (paved lane-km
per km2 land) Applied density limit (paved lane-km
per km2 land)
OECD North America 0.5 1.5
OECD Europe 2.1 4
OECD Pacific 0.4 1.5
Japan 5.5 6
China 0.7 1.5
India 1.3 3
ASEAN 0.4 1.5
Middle East 0.2 1
Latin America 0.05 1
Africa 0.04 1
Last, a roadway occupancy threshold has been applied to road infrastructure projections. Brazil currently has the highest average national roadway occupancy level, at roughly 1.5 million vkm per paved lane‐km. This is considerably higher than most regions of the world (Figure 19). To ensure that the roadway construction and density limits applied in this model do not result in extreme roadway occupancy levels, a threshold of 1.8 million vkm per paved lane‐km has been applied to the projections. The threshold triggers roadway growth beyond construction capacity and road density limits at the previous annual road occupancy ratio in the case that road travel levels supersede the 1.8 million vkm per paved lane‐km threshold.
Overall, the dynamic, iterative projections outlined above can be expressed by the following equations:
· , , · ·
, , , ,
where:
Pl paved lane‐km for present year (Yl)
Pk paved lane‐km for previous year (Yk)
Vl projected vehicle travel for present year (Yl)
Ck road occupancy level for previous year (Yk)
Ci,j,k average road occupancy level for previous years Yi,Yj,Yk
L land area in square km
D density limit
B construction capacity limit
T road occupancy threshold
indicates mathematical operator, then
indicates mathematical operator, else.
1
2

© OECD/IEA 2013 Global Land Transport Infrastructure Requirements Estimating road and railway infrastructure capacity and costs to 2050
Page | 43
In short, equations (1) and (2) validate that paved lane‐km projections fall within the construction, density and road occupancy threshold limits applied within the model. If and when any of those conditions are not met, annual roadway length is calculated using the respective limits (e.g. construction limit plus previous road length).
Equations (1) and (2) also allow the model user to understand the effects that any of the applied limits have on road infrastructure growth. How congested (in terms of vehicle travel per road lane‐km) would roadways be if countries with expected surges in vehicle travel continue building at low annual construction rates? How much additional road would countries with high roadway occupancy levels need to build in order to bring occupancy levels down to the global average (i.e. less than 500 000 vkm per paved lane‐km)? What would this mean for roadway density levels? These possibilities are considered in the results section of this paper.
BRT estimates
BRT infrastructure projections have been estimated using a different approach from conventional roadway development. In the 4DS, existing BRT trunk‐km have been paired with BRT that is currently under construction or that has been planned for development. It has been assumed that additional BRT development beyond those expected and planned trunk additions will be marginal without additional commitment to planning and development.
BRT development in the 2DS has been estimated using potential BRT passenger travel estimates that are calculated using historic BRT ridership figures with regards to regional bus travel. Global BRT ridership accounted for nearly 25 billion pkm in 2010, or less than 0.5% of global bus pkm. Countries with long‐established BRT networks, such as Colombia, have achieved as much as 15% of local public transit travel by BRT (Echeverry et al, 2004), although national BRT pkm still remain a small portion (less than 2%) of total national passenger bus travel in those countries.
In terms of network travel, current BRT passenger travel equates to bus frequencies of roughly 0.8 to 2.5 buses per BRT trunk‐km during average operating hours, with roughly 80 to 110 persons per bus.2 When considered from an annual perspective, where most BRT buses generally travel about 95 000 to 110 000 km per year, global BRT trunk‐km occupancy is roughly 120 000 annual bus vkm per BRT km.
If overall global BRT travel levels remains around 120 000 annual bus vkm per BRT km and BRT travel along expected networks reaches similar if not higher travel intensity levels, global BRT passenger travel is likely to reach 40 billion annual pkm by 2050 on existing and expected BRT networks, or still less than 0.5% of global passenger bus travel in 2050. That potential level of BRT passenger travel may not be achieved if expected BRT network additions have low initial passenger travel levels or if existing BRT lines experience decreases in ridership levels in the future.
In the 2DS, projections have been made to 2050 using historic weighted global BRT travel levels per BRT trunk‐km. It has been assumed that regional BRT passenger travel in the 2DS could reach 5% of total global bus pkm by 2050 (approximately a ten‐fold increase over 4DS levels), where average regional bus travel frequencies and load factors would converge by 2050 to high “throughput” (passengers per BRT trunk‐km per hour) levels. Here, bus frequencies per BRT trunk‐km and passenger load factors have been assumed to converge to high existing (2010) throughput levels for new BRT network additions as well as in cities with existing BRT networks and low bus travel frequencies or passenger load factors. Places with high existing bus frequencies (e.g. 2.5 buses per trunk‐km) and high passenger load factors (e.g. 100 passengers
2 There were 2 151 km of BRT track in 2010, with 4 137 buses in services during an average 12 hour operating period at an average speed of 23 km/h. This equates to a global headway average of roughly 2.7 minutes between buses (Trigg and Fulton, 2012; EMBARQ, ALT‐BRT and IEA, 2012).
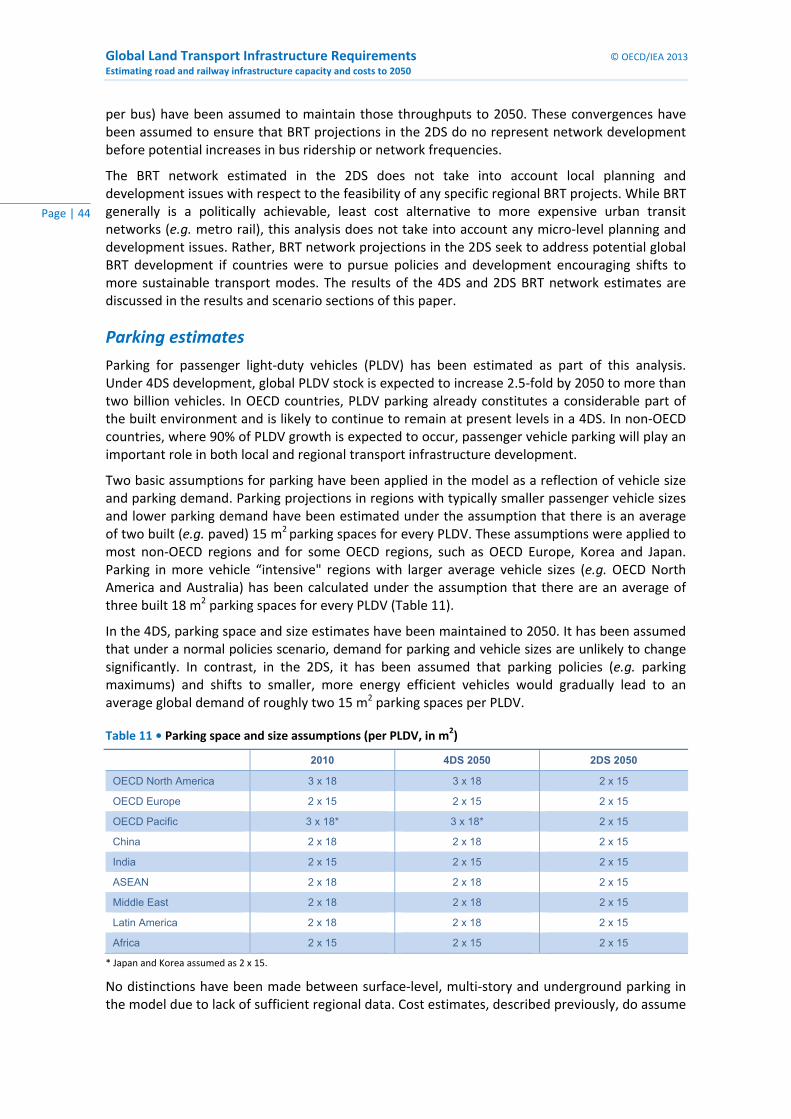
Global Land Transport Infrastructure Requirements © OECD/IEA 2013 Estimating road and railway infrastructure capacity and costs to 2050
Page | 44
per bus) have been assumed to maintain those throughputs to 2050. These convergences have been assumed to ensure that BRT projections in the 2DS do no represent network development before potential increases in bus ridership or network frequencies.
The BRT network estimated in the 2DS does not take into account local planning and development issues with respect to the feasibility of any specific regional BRT projects. While BRT generally is a politically achievable, least cost alternative to more expensive urban transit networks (e.g. metro rail), this analysis does not take into account any micro‐level planning and development issues. Rather, BRT network projections in the 2DS seek to address potential global BRT development if countries were to pursue policies and development encouraging shifts to more sustainable transport modes. The results of the 4DS and 2DS BRT network estimates are discussed in the results and scenario sections of this paper.
Parking estimates
Parking for passenger light‐duty vehicles (PLDV) has been estimated as part of this analysis. Under 4DS development, global PLDV stock is expected to increase 2.5‐fold by 2050 to more than two billion vehicles. In OECD countries, PLDV parking already constitutes a considerable part of the built environment and is likely to continue to remain at present levels in a 4DS. In non‐OECD countries, where 90% of PLDV growth is expected to occur, passenger vehicle parking will play an important role in both local and regional transport infrastructure development.
Two basic assumptions for parking have been applied in the model as a reflection of vehicle size and parking demand. Parking projections in regions with typically smaller passenger vehicle sizes and lower parking demand have been estimated under the assumption that there is an average of two built (e.g. paved) 15 m2 parking spaces for every PLDV. These assumptions were applied to most non‐OECD regions and for some OECD regions, such as OECD Europe, Korea and Japan. Parking in more vehicle “intensive" regions with larger average vehicle sizes (e.g. OECD North America and Australia) has been calculated under the assumption that there are an average of three built 18 m2 parking spaces for every PLDV (Table 11).
In the 4DS, parking space and size estimates have been maintained to 2050. It has been assumed that under a normal policies scenario, demand for parking and vehicle sizes are unlikely to change significantly. In contrast, in the 2DS, it has been assumed that parking policies (e.g. parking maximums) and shifts to smaller, more energy efficient vehicles would gradually lead to an average global demand of roughly two 15 m2 parking spaces per PLDV.
Table 11 • Parking space and size assumptions (per PLDV, in m2)
2010 4DS 2050 2DS 2050
OECD North America 3 x 18 3 x 18 2 x 15
OECD Europe 2 x 15 2 x 15 2 x 15
OECD Pacific 3 x 18* 3 x 18* 2 x 15
China 2 x 18 2 x 18 2 x 15
India 2 x 15 2 x 15 2 x 15
ASEAN 2 x 18 2 x 18 2 x 15
Middle East 2 x 18 2 x 18 2 x 15
Latin America 2 x 18 2 x 18 2 x 15
Africa 2 x 15 2 x 15 2 x 15
* Japan and Korea assumed as 2 x 15.
No distinctions have been made between surface‐level, multi‐story and underground parking in the model due to lack of sufficient regional data. Cost estimates, described previously, do assume
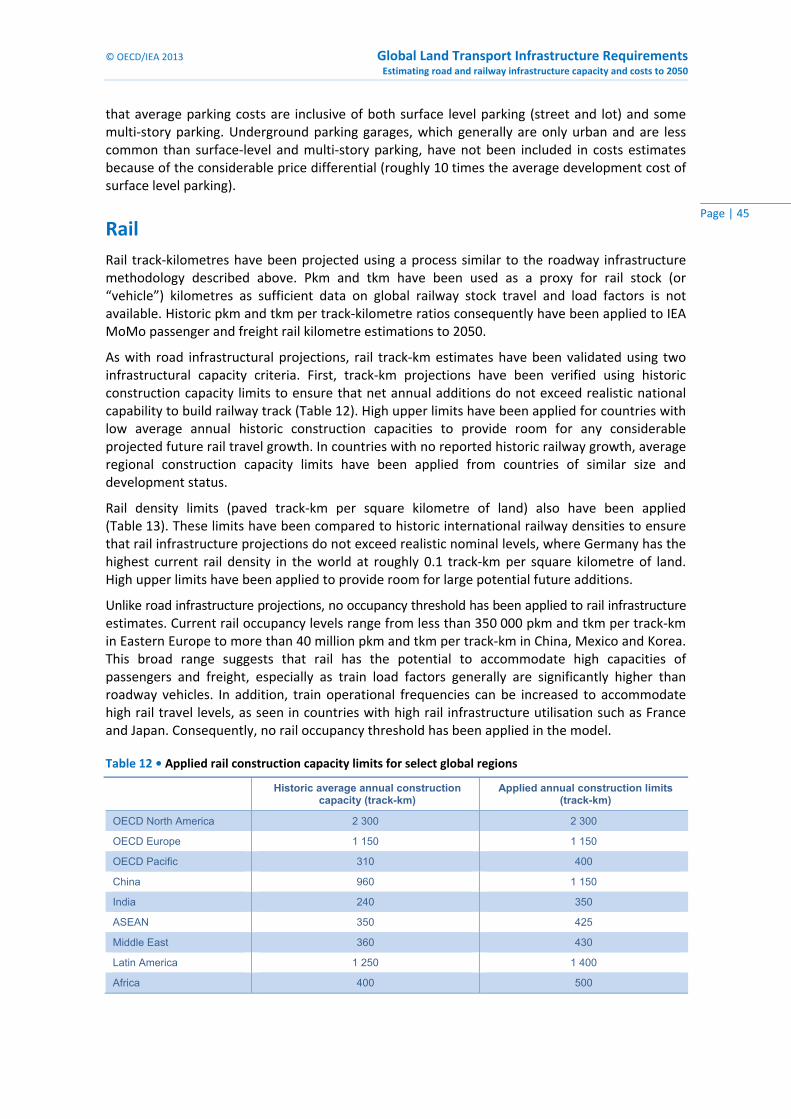
© OECD/IEA 2013 Global Land Transport Infrastructure Requirements Estimating road and railway infrastructure capacity and costs to 2050
Page | 45
that average parking costs are inclusive of both surface level parking (street and lot) and some multi‐story parking. Underground parking garages, which generally are only urban and are less common than surface‐level and multi‐story parking, have not been included in costs estimates because of the considerable price differential (roughly 10 times the average development cost of surface level parking).
Rail
Rail track‐kilometres have been projected using a process similar to the roadway infrastructure methodology described above. Pkm and tkm have been used as a proxy for rail stock (or “vehicle”) kilometres as sufficient data on global railway stock travel and load factors is not available. Historic pkm and tkm per track‐kilometre ratios consequently have been applied to IEA MoMo passenger and freight rail kilometre estimations to 2050.
As with road infrastructural projections, rail track‐km estimates have been validated using two infrastructural capacity criteria. First, track‐km projections have been verified using historic construction capacity limits to ensure that net annual additions do not exceed realistic national capability to build railway track (Table 12). High upper limits have been applied for countries with low average annual historic construction capacities to provide room for any considerable projected future rail travel growth. In countries with no reported historic railway growth, average regional construction capacity limits have been applied from countries of similar size and development status.
Rail density limits (paved track‐km per square kilometre of land) also have been applied (Table 13). These limits have been compared to historic international railway densities to ensure that rail infrastructure projections do not exceed realistic nominal levels, where Germany has the highest current rail density in the world at roughly 0.1 track‐km per square kilometre of land. High upper limits have been applied to provide room for large potential future additions.
Unlike road infrastructure projections, no occupancy threshold has been applied to rail infrastructure estimates. Current rail occupancy levels range from less than 350 000 pkm and tkm per track‐km in Eastern Europe to more than 40 million pkm and tkm per track‐km in China, Mexico and Korea. This broad range suggests that rail has the potential to accommodate high capacities of passengers and freight, especially as train load factors generally are significantly higher than roadway vehicles. In addition, train operational frequencies can be increased to accommodate high rail travel levels, as seen in countries with high rail infrastructure utilisation such as France and Japan. Consequently, no rail occupancy threshold has been applied in the model.
Table 12 • Applied rail construction capacity limits for select global regions
Historic average annual construction
capacity (track-km) Applied annual construction limits
(track-km)
OECD North America 2 300 2 300
OECD Europe 1 150 1 150
OECD Pacific 310 400
China 960 1 150
India 240 350
ASEAN 350 425
Middle East 360 430
Latin America 1 250 1 400
Africa 400 500

Global Land Transport Infrastructure Requirements © OECD/IEA 2013 Estimating road and railway infrastructure capacity and costs to 2050
Page | 46
Table 13 • Applied rail density limits for select global regions
2010 Density level (track-km
per km2 land) Applied density limit (track-km
per km2land)
OECD North America 0.01 0.1
OECD Europe 0.04 0.1
OECD Pacific* 0.004 0.1
China 0.006 0.05
India 0.02 0.05
ASEAN 0.003 0.05
Middle East 0.002 0.05
Latin America 0.004 0.05
Africa 0.002 0.05
* Includes Australia and New Zealand with Japan and Korea.
Overall, rail track‐km projections can be expressed by the following equation (3):
· , , · ·
, , , ,
where:
Rl track‐km for present year (Yl)
Rk track‐km for previous year (Yk)
Tl projected passenger and freight travel for present year (Yl)
Ck rail occupancy level for previous year (Yk)
Ci,j,k average rail occupancy level for previous years Yi,Yj,Yk
L land area in square km
D density limit
B construction capacity limit
indicates mathematical operator, then
indicates mathematical operator, else.
As with roadway projections, equation (3) validates that rail track‐km projections fall within the construction and density limits applied within the model. Equation (3) likewise allows the model user to understand the effects that any of the applied limits have on rail infrastructure growth. Those effects are discussed in the results section of this paper.
High‐speed rail estimates
HSR infrastructure projections have been estimated using a different approach from conventional rail track‐km development. In the 4DS, existing HSR has been paired with HSR that is currently under construction or that has been planned for development by 2030. This expected HSR network length has been applied and maintained to 2050. It has been assumed that additional HSR track‐km development beyond 2025 is unlikely without significant commitment to planning and development, especially as only 18 000 km additional HSR track has been planned or proposed for development beyond 2015. Moreover, as noted previously, it is possible that some of those projects may not come to fruition, especially if impeding barriers, such as financing, are not ensured.
3

© OECD/IEA 2013 Global Land Transport Infrastructure Requirements Estimating road and railway infrastructure capacity and costs to 2050
Page | 47
Potential additional HSR development under the 2DS has been estimated using potential HSR ridership estimates that have been calculated from historic HSR ridership figures. Those initial ridership estimates have been compared to total expected global rail ridership to 2050.
Global HSR ridership (excluding China, which has not reported annual passenger travel along its HSR network to date to UIC) accounted for nearly 200 billion pkm by 2010, or roughly 7% of global rail pkm. On a national level, HSR travel has historically counted for roughly one‐third of total national passenger rail travel, with the exception of France and Spain, which averaged more than half of net domestic passenger rail travel on HSR (UIC, 2012).
HSR travel intensity over HSR infrastructure varies by country, where unsurprisingly the highest average passenger travel per HSR track‐km is in countries known for their HSR (e.g. France and Japan) and in countries with high population densities along HSR corridors (e.g. Taipei and Korea) (Figure 20). Other countries, such as Spain and Belgium, have considerably lower travel levels along HSR lines. These lower average HSR occupancy levels may be explained by smaller populations along HSR corridors and by overall lower passenger rail travel in those countries. For example, Spain has low HSR track occupancy levels compared to other countries, yet HSR travel accounts for more than half of total national rail pkm.
Overall, global HSR track occupancy (weighted by network length) is roughly 25 million annual pkm per HSR km. The slight decrease in the weighted global HSR occupancy level between 2000 and 2009 (Figure 20) can be explained by the drops in national HSR ridership per HSR track‐km in Germany and Italy, where most other countries increased ridership levels per infrastructural km since 2000.
The shifts in German and Italian passenger travel over HSR network length between 2004 and 2006 are not the result of decreased HSR ridership; in fact, HSR pkm in both countries nearly doubled between 2000 and 2009. Rather, HSR track occupancy levels dropped because of large network expansions relative to HSR passenger travel growth in 2004 and 2005 (the same can be said of Spain between 2002 and 2008). Both Germany and Italy doubled their respective HSR networks between 2004 and 2006, while HSR passenger travel in both countries increased by roughly 10% during that period. As a result, HSR track occupancy levels decreased. By 2008, however, German and Italian HSR occupancy levels started increasing again, suggesting that there may be a slight lag between HSR development and HSR travel demand.
Figure 20 • Historic passenger travel (pkm) to HSR track‐km
Source: UIC (2012).
Key message • Global HSR occupancy levels are roughly 25 million pkm per HSR track‐km.
Assuming that overall global HSR travel remains around 25 million annual pkm per HSR track‐km and that HSR travel in China will reach similar if not higher HSR travel intensity levels, global HSR
0
10
20
30
40
2000 2001 2002 2003 2004 2005 2006 2007 2008 2009
Pkm
to HSR
track‐km (million)
France
Belgium
Germany
Italy
Spain
Japan
Korea
Taipei, China
World average
Global Land Transport Infrastructure Requirements © OECD/IEA 2013 Estimating road and railway infrastructure capacity and costs to 2050
Page | 48
passenger travel is likely to reach 550 billion annual pkm by 2025 on existing and expected HSR networks, or roughly 10% of global passenger rail travel in 2025. If the proposed additional 14 000 track‐km of HSR lines beyond 2015 actually are constructed and similar travel levels are achieved along those corridors, global HSR pkm potentially could reach nearly 1 trillion annual passenger kilometres by 2025, or roughly 20% of projected global passenger rail travel. That potential level of HSR passenger travel, however, could take considerably longer to achieve if new HSR lines have low initial passenger travel levels, such as those in Spain and Belgium.
In the 2DS, projections have been made to 2050 using historic weighted global HSR travel levels per HSR track‐km. It has been assumed that countries with existing or expected HSR will maintain or marginally increase historic HSR travel as a percentage of total national rail pkm. In addition, it has been assumed that regions without expected or proposed HSR could achieve up to 30% HSR pkm of total rail pkm by 2050 with relevant planning and development. These estimates have been applied to determine potential global HSR network length by 2050.
The HSR network estimated in the 2DS does not take into account local planning and development issues with respect to the feasibility of specific HSR projects. Naturally, some countries, due to physical terrain or extreme distances between cities, may not be suitable for HSR development. To this extent, the HSR projections analysed in this model are macro‐level estimates. In order to ensure those projections are not unrealistic, HSR track‐km estimates in the 2DS consequently have been compared to total existing, planned and proposed HSR, including proposals that have not been pursued actively.
© OECD/IEA 2013 Global Land Transport Infrastructure Requirements Estimating road and railway infrastructure capacity and costs to 2050
Page | 49
Acronyms, abbreviations and units of measure
Acronyms and abbreviations
2DS ETP 2012 2°C Scenario 4DS ETP 2012 4°C Scenario 6DS ETP 2012 6°C Scenario ADB Asian Development Bank ASEAN Association of Southeast Asian Nations BRT bus rapid transit CO2 carbon dioxide EMBARQ World Resources Institute Centre for Sustainable Transport ETP IEA Energy Technology Perspectives GDP gross domestic product GHG greenhouse gases HSR high‐speed rail IEA International Energy Agency IRF International Road Federation ITDP Institute for Transportation and Development Policy ITF International Transport Forum LDV light‐duty vehicles MoMo IEA Mobility Model NMH non‐motorway/highway roads O&M operations and maintenance SIC UIC Railway Time Series UIC International Union of Railways USD United States dollar WRS World Road Statistics PLDV passenger light‐duty vehicles
Units of measure
pkm passenger kilometre tkm tonne kilometre km kilometre km2 square kilometre vkm vehicle kilometre

Global Land Transport Infrastructure Requirements © OECD/IEA 2013 Estimating road and railway infrastructure capacity and costs to 2050
Page | 50
References ADB (Asian Development Bank) (2012), Sustainable Fuel Partnership Study: Exploring an
Innovative Market Scheme to Advance Sustainable Transport and Fuel Security. ADB, Manila. http://www.adb.org/sites/default/files/projdocs/2009/41270‐REG‐TAR.pdf
CIA (Central Intelligence Agency) (2012), The World Factbook: Field Listing: Area. US Central Intelligence Agency. https://www.cia.gov/library/publications/the‐world‐factbook/fields/2147.html
Echeverry, J.C., Ibanez, A.M. and Hillon, L.C. (2004), “The Economics of Transmilenio, a Mass Transit System for Bogota”, Economia, Vol. 5, No. 2, Brookings Institution Press, Washington, DC, pp.151‐196.
EMBARQ, ALC‐BRT (Across Latitudes and Cultures ‐ Bus Rapid Transit) and IEA (2012), Global BRT data, Washington, DC. www.brtdata.org
Fulton L., Cazzola P. and Cuenot F. (2009), ”IEA Mobility Model (MoMo) and its use in the ETP 2008”, Energy Policy, Vol. 3, No. 10, Elsevier, Amsterdam, pp. 3758‐3768, www.sciencedirect.com/science/article/pii/S0301421509005345.
IEA (International Energy Agency) (2002) Bus Systems for the Future: Achieving Sustainable Transport Worldwide, OECD/IEA, Paris
IEA (2012) Energy Technologies Perspectives 2012, OECD/IEA, Paris
ITDP (Institute for Transportation & Development Policy) (2007), Bus Rapid Transit Planning Guide, ITDP, New York City. http://www.itdp.org/404/bus‐rapid‐transit‐planning‐guidebrt‐planning‐guide‐in‐english.
IRF (International Road Federation) (2012), World Road Statistics, IRF, Geneva.
Trigg T. and Fulton L. (2012) “Bus Rapid Transit: Cost and CO2 Implications of Future Deployment Scenarios”, TRB 2012 Proceedings, Washington, DC.
UIC (Union Internationale de chemins de fer) (2012), Railway Time Series, UIC, Paris.
UNSD (United Nations Statistics Division) (2010), GDP and its breakdown at current prices in US Dollars, UNSD, New York City. http://unstats.un.org/unsd/snaama/dnllist.asp.

International Energy Agency • 9 rue de la Fédération • 75739 Paris Cedex 15, France
Buy IEA publications online:
www.iea.org/books
PDF versions available at 20% discount
A number of books printed before January 2012
are now available free of charge in pdf format
on our website
Onlinebookshop
Tel: +33 (0)1 40 57 66 90
E-mail: [email protected]

This document and any map included herein are without prejudice to the status of or sovereignty over any territory, to the delimitation of international frontiers and boundaries and to the name of
any territory, city or area.
IEA Publications 9, rue de la Fédération, 75739 Paris cedex 15
Printed in France by IEA, January 2013
Cover design: IEA. Photo credits: © IEA/OECD, 2013.
9 rue de la Fédération 75739 Paris Cedex 15
www.iea.org