nasa satellite data enable research on the impact of covid
TRANSCRIPT
Bryan N. Duncan (NASA)
NASA Satellite Data Enable Research on the Impact of COVID-19 on World Air Quality
November 12th, 2020: Potomac Geophysical Society (Virtual)

Landsat 9
PACE
NI-SARSWOT
TEMPO
GRACE-FO (2)
ICESat-2 CYGNSS (8) NISTAR, EPIC(DSCOVR / NOAA)
QuikSCATLandsat 7(USGS)
Terra
Aqua
CloudSatCALIPSOO
Aura
SMAP
Suomi NPP (NOAA)
Landsat 8(USGS)
GPM
OCO-2
GRACE (2) OSTM/Jason 2(NOAA)
FormulationImplementationPrimary OpsExtended Ops
ISS InstrumentsCATS, LIS, SAGE IIITSIS-1, OCO-3, ECOSTRESS, GEDI CLARREO-PF, TSIS-2 Sentinel-6A/B
JPSS-2 InstrumentsRBI, OMPS-Limb
NASA Earth Science Missions
05.17.17
MAIA
GeoCARB
TROPICS (12)
SORCE,TCTE (NOAA)

Aura Mission
MLS
OMI
Ozone Layer Air Quality
Climate
Microwave Limb Sounder (MLS)Ozone Monitoring Instrument (OMI)
Aura is an integrated observatory of atmospheric composition.
Some Historical Perspective
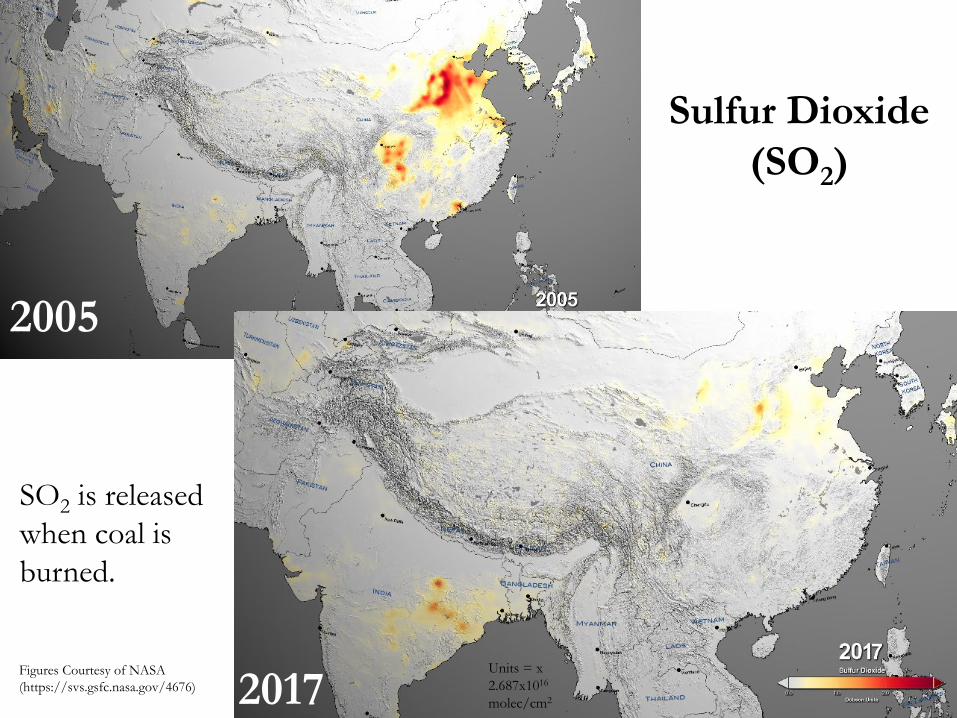
Sulfur Dioxide (SO2)
Units = x 2.687x10¹⁶
molec/cm2
2005
2017
SO2 is released when coal is burned.
Figures Courtesy of NASA (https://svs.gsfc.nasa.gov/4676)

Satellite data indicate that NO2levels decreased from 2005 - 2018 by 20-60% in U.S. urban areas.
Nitrogen Dioxide (NO2)
2005
2018
Images courtesy of NASA.
NO2 is released when coal & gasoline are burned, so it is an indicator of economic activity.
Impact of COVID-19
Tour of the World

Images courtesy of Zach Fasnacht (OMI Team)
Global Changes in NO2 Levels: April 2020 vs 5 Previous Years

Images courtesy of Zach Fasnacht (OMI Team)
Global Changes in NO2 Levels: August 2020 vs 5 Previous Years

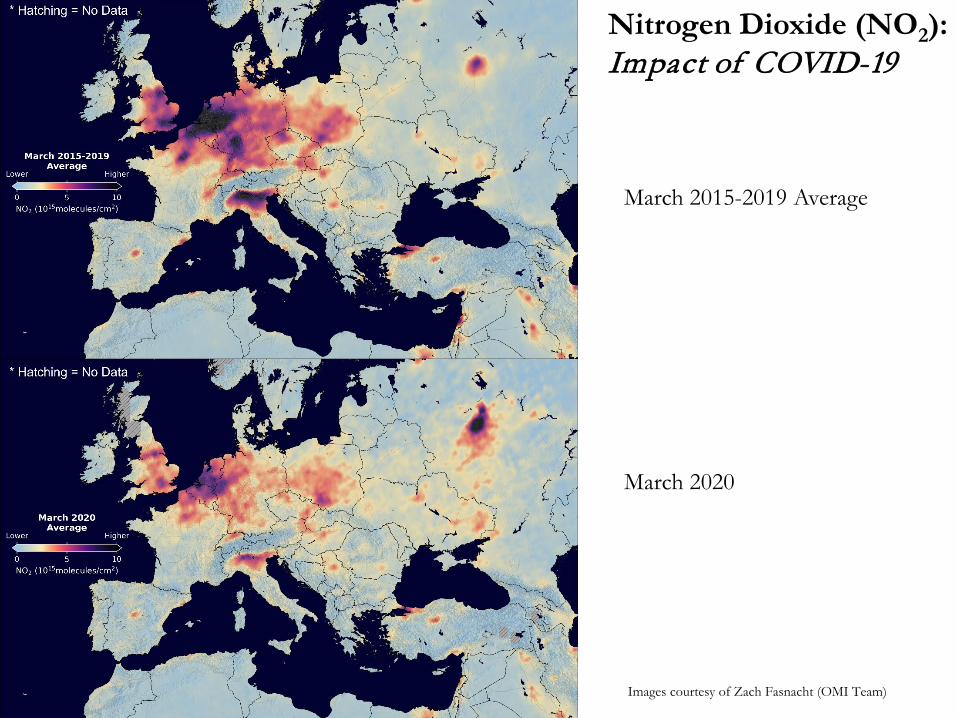
Q1:“incremental scientific value for OMI &MLS”Nitrogen Dioxide (NO2): Impact of COVID-19
March 2015-2019 Average
March 2020
Difference
Satellite data indicate that NO2levels decreased by 30-40% in U.S. urban areas.
Images courtesy of Zach Fasnacht (OMI Team)

Q1:“incremental scientific value for OMI &MLS”Nitrogen Dioxide (NO2): Impact of COVID-19
March 2015-2019 Average
March 2020
Difference
ΔNO2 levels (Δemissions + Δatmospheric chemistry + Δweather)
Satellite data indicate that NO2levels decreased by 30-40% in U.S. urban areas.
Images courtesy of Zach Fasnacht (OMI Team)

Most areas of the Eastern U.S. decreased by ~30-40% after stay-at-home orders came into effect.
The images were released in April and May and are available at https://svs.gsfc.nasa.gov/4810. More details may be found at https://airquality.gsfc.nasa.gov.
Changes in NO2 Levels in Southeastern US
Nitrogen Dioxide (NO2): Impact of COVID-19
March 2015-2019 Average
March 2020
Images courtesy of Zach Fasnacht (OMI Team)

Nitrogen Dioxide (NO2): Impact of COVID-19
March 2020 - March 2015-2019 Average
Images courtesy of Zach Fasnacht (OMI Team)

Figure Courtesy of NASA (https://svs.gsfc.nasa.gov/4810 & https://so2.gsfc.nasa.gov/no2/no2_index.html )
Nitrogen Dioxide (NO2): Impact of COVID-19

Nitrogen Dioxide (NO2): Impact of COVID-19
Images courtesy of Zach Fasnacht (OMI Team)

Aura Ozone Monitoring Instrument (OMI)Reductions in Sulfur Dioxide & Nitrogen Dioxide Air Pollution over
South Asia Associated with Efforts to Control the Spread of COVID-19Can Li, Lok Lamsal, Yasuko Yoshida, Joanna Joiner, Bryan Duncan + GSFC Aura OMI Team
On March 24, 2020, Prime Minister Modiordered a nationwide stay-at-home order forIndia’s 1.3 billion citizens in an attempt to slowthe spread of COVID-19.
The images show OMI data of SO2 (left) andNO2 (right) over South Asia as an average ofMarch 25 – April 25. The top images show themeans of the period in previous years, while thebottom images show the means for 2020.
The highest SO2 levels are over eastern India andprimarily associated with electricity generation;the coal burned has sulfur impurities.Independent estimates indicate that electricitygeneration for India was down about 10% and25% in March and April 2020, respectively, ascompared to March and April 2019. Oneexception is in southern India which could berelated to increased thermal power generationthat came on line before the stay-at-home order.However, there was not a similar increase inNO2, so possibly coal with higher sulfur contentwas used in 2020 relative to 2019 without asignificant increase in coal consumed.
NO2 is primarily emitted from fossil fuel use. Theimages show that widespread decreases (~30-60%) in NO2 levels have occurred over most ofSouth Asia. The highest NO2 levels are in easternIndia and are primarily associated with electricitygeneration.
OMI SO2 OMI NO2
2017-19
2020
2017-19
2020
Images courtesy of NASA SVS Images courtesy of SVS

Tropospheric nitrogen dioxide (NO2) indicates economic activities, as NO2 is primarily emitted from fossil fuel consumption.
We evaluated the reduction in satellite measurements of NO2tropospheric vertical column densities (TVCD) before and after the Lunar New Year (LNY). The observed reduction in 2020 is ~20% larger than the typical holiday-related reduction.
We relate to this reduction to two of the government’s actions: the announcement of the first report in each province and the date of a province’s lockdown. Both actions are associated with nearly the same magnitude of reductions.
Abrupt decline in tropospheric nitrogen dioxide over China after the outbreak of COVID-19
Fei Liu (USRA/GSFC), Sarah A. Strode (USRA/GSFC), Yasuko Yoshida (SSAI/GSFC), Sungyeon Choi (SSAI/GSFC), Lok N. Lamsal(USRA/GSFC), Can Li (ESSIC/GSFC), Nickolay A. Krotkov (GSFC), Joanna Joiner (GSFC) and others
Top: Average OMI tropospheric NO2vertical column densities over China in 2020. (A) -20 to -1, (B) 0-19, and (C) 20-39 days relative to the 2020 Lunar New Year.
Bottom: Daily variations in 7-day moving averages of OMI NO2 TVCDs over China. Shading shows standard error of the mean. Values are normalized to the mean of the period of -20 to -1 days relative to Lunar New Year.

OMI Data & OMI Team are Enabling Research & Applications

Q1:“incremental scientific value for OMI &MLS”The OMI NO2 data can enable scientific and applied research.
• Air Quality: While air pollution is decreasing around the world due to lockdown orders, the USgovernment has relaxed pollution emission restrictions on some industrial sectors (e.g., powerplants). Therefore, the changes in air pollution associated with the pandemic will serve as anatural experiment in how the atmosphere responds to changes in pollutant emissions fromvarious sources.
• Climate: Several recent studies by the proposers have shown that NO2 emissions inferred fromsatellite data serve as an effective proxy for co-emitted CO2 emissions from cities and powerplants. Therefore, researchers may be able to assess the impact of the pandemic on climategas emissions.
• Economics: Given that most world economies are driven by fossil fuels, economists may useNO2 data, a non-traditional source of data for this community, to assess the impact of thepandemic on economic activity around the world, including in countries without reliableeconomic data.
• Intelligence Agencies: The global intelligence community will likely find interesting uses of theNO2 data for assessing the impact of the pandemic on world countries, including with worldgovernments that purposely misrepresent or withhold the true extent of the pandemic’simpact.
• Health Professionals: The NO2 data may be used to gauge the effectiveness (e.g., reduction inemissions from traffic and industry) of lockdown efforts to contain or slow the pandemic in agiven area.

OMI Data Are Facilitating Scientific Research of the Impact of the Pandemic on Air Quality around the World
Zach Fasnacht (SSAI), Joanna Joiner (NASA) + GSFC Aura Ozone Monitoring Instrument (OMI) Team
Data from the Aura Ozone Monitoring Instrument (OMI) are facilitating scientific research on the impact of the COVID-19 pandemic on global air quality. As of early September 2020, the OMI Team has identified peer-reviewed manuscripts already published in the scientific literature since the start of the pandemic. Undoubtedly, there will be many more publications using OMI data of two major air pollutants:
• Nitrogen dioxide (NO2) is primarily emitted from burning fossil fuels (diesel, gasoline, coal). If processed and interpreted carefully, NO2 levels observed from space serve as an effective proxy for NO2 levels at Earth's surface.
• Sulfur dioxide (SO2) is emitted from anthropogenic activities that include electricity generation, oil and gas extraction, and metal smelting. SO2 is emitted during electricity generation if the coal burned has sulfur impurities that are not removed (or not “scrubbed”) from the plant’s exhaust stacks
https://acd-ext.gsfc.nasa.gov/Documents/Publications/covid/

22
Example: OMI Team Efforts: COVID-19
https://so2.gsfc.nasa.gov/no2/no2_index.htmlhttps://airquality.gsfc.nasa.gov/
For More Information