how nasa satellite instruments can help characterizing the...
TRANSCRIPT

MODIS MISR
OMI
How NASA Satellite Instruments Can Help Characterizing the Eyja Volcano Ash Plume
Ralph Kahn1, David Nelson2, Mike Garay2, Dave Diner3, and the MISR TeamTianle Yuan1, Lorraine Remer1, Rob Levy4, and the MODIS TeamJoanna Joiner1, Nick Krotkov5, ArlinKrueger5, and the OMI/TOMS Team
1NASA Goddard Space Flight Center; 2Raytheon; 3Jet Propulsion Lab/Caltech; 4SSAI; 5UMBC

NASA NOAA Europe
Identification
Physical/chemical properties
Height
Aerosol extinction (AERONET, MODIS, MISR,
AVHRR, PARASOL)Particle Size (AERONET, MODIS, MISR)
Multispectral (MODIS, AVHRR, SEVERI)
Visual (MODIS, MISR, ALI, ASTER, GOES, SEVERI)
Ash absorption (OMI, SCIAMACHY, GOME2)
Thermal IR (MODIS, AIRS, GOES, AVHRR, SEVERI)
Composition (OMI, AIRS, SCIAMACHY, GOME2, IASI)
Lidar (CALIPSO, MPLNET, EARLINET)
Stereo height (MISR, ASTER)
Volcanic Plume Remote Sensing
MODIS Team, NASA/GSFC

• NASA, Terra & Aqua– launches 1999, 2001– 705 km polar orbits, descending
(10:30 a.m.) & ascending (1:30 p.m.)• Sensor Characteristics
– 36 spectral bands ranging from 0.41 to 14.385 µm
– cross-track scan mirror with 2330 km swath width
– Spatial resolutions:• 250 m (bands 1 - 2)• 500 m (bands 3 - 7)• 1000 m (bands 8 - 36)
– 2% reflectance calibration accuracy– onboard solar diffuser & solar
diffuser stability monitor
MODerate-resolution Imaging Spectroradiometer [MODIS]
MODIS Team, /
Improved over AVHRR: • Calibration • Spatial Resolution • Spectral Range & # Bands

MODIS Monthly Global Aerosol Products
• Water & some Land• Globe ~ Every 2 days• ~ 10:30 AM & 1:30 PM
Mid-vis AOT
• Fine/Coarse Ratio• Sensitivity to PM10
Source: MODIS Atmospheres Web Site
Direct Downlink
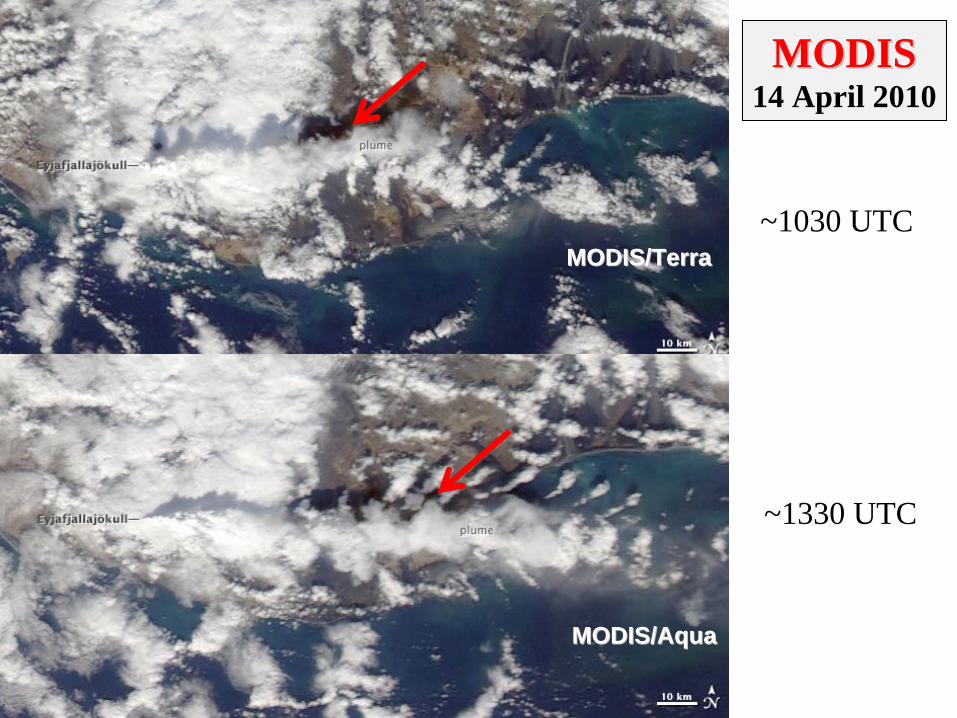
MODIS/TerraMODIS/Terra
MODISMODIS14 April 2010
MODIS/AquaMODIS/Aqua
~1030 UTC
~1330 UTC

Vis Radiance ImageVis Radiance Image
550 nm Aerosol Extinction550 nm Aerosol Extinction Aerosol FineAerosol Fine--Mode FractionMode Fraction
MODIS/AquaMODIS/Aqua15 April 2010 1330 UTC

MODIS/TerraMODIS/Terra17 April 2010 Aerosol Optical Depth
Localized Ash PlumeCALIPSO Track

MODIS/TerraMODIS/Terra17 April 2010 Fine-Mode Fraction
Coarse-Mode Particles

CALIPSO Space CALIPSO Space LidarLidar17 April 2010 Nighttime overpass
http://http://www.nasa.gov/mission_pages/calipso/main/index.htmlwww.nasa.gov/mission_pages/calipso/main/index.html
523 and 1064 nm channels; ~100m horizontal resolution
North South
Sloping Ash Plume over France
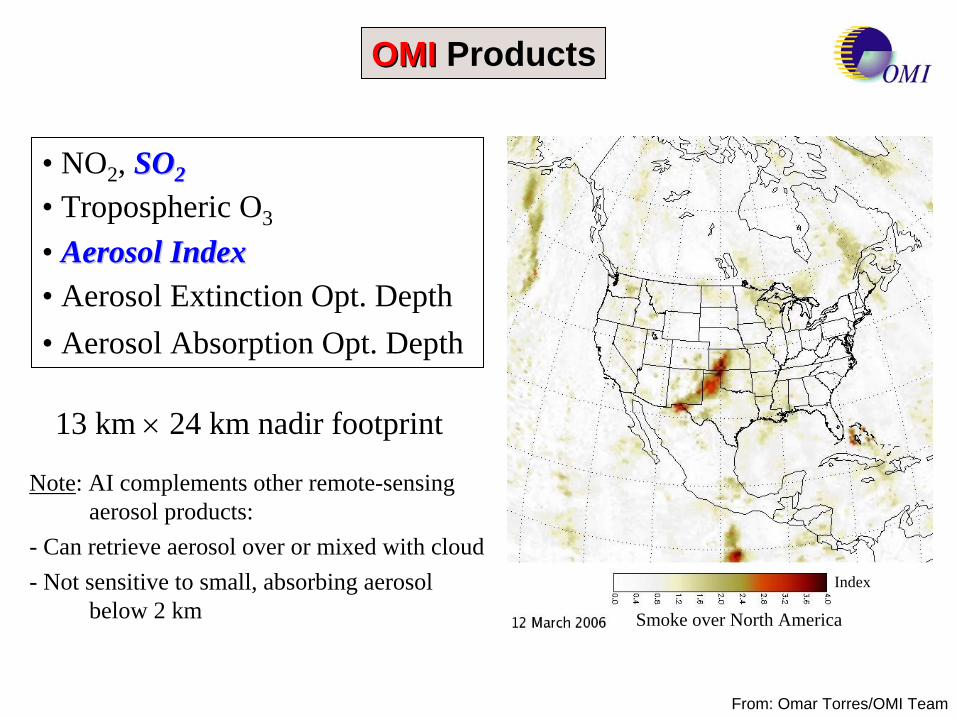
OMI OMI Products
From: Omar Torres/OMI Team
• NO2 , SOSO22
• Tropospheric O3
• Aerosol IndexAerosol Index• Aerosol Extinction Opt. Depth • Aerosol Absorption Opt. Depth
Note: AI complements other remote-sensingaerosol products:
- Can retrieve aerosol over or mixed with cloud- Not sensitive to small, absorbing aerosol
below 2 km Smoke over North America
Index
13 km
24 km nadir footprint

Krotkov, aerocenter
UMBC UMBC SOSO22 Web SiteWeb Sitehttp://so2.umbc.edu/omi/

5/11/2010 Krotkov, aerocenter 12
SOSO22 30 April 2010 – Sector Iceland
NOAA/NESDIS OMI NearNOAA/NESDIS OMI Near--RealReal--Time Time Web SiteWeb SiteEuropean Mirror: http://sacs.aeronomie.be/nrt + GOME-2 & SCIAMACHY
OMI-estimated total SO2 mass: 2-5 K-tons/day
http://satepsanone.nesdis.noaa.gov/pub/OMI/OMISO2/index.htmlhttp://satepsanone.nesdis.noaa.gov/pub/OMI/OMISO2/index.html

5/11/2010 Krotkov, aerocenter
OMI-estimated total SO2 mass: up to ~10 K-tons/day
OMI OMI –– EyjaEyja Ash CloudAsh Cloud6 May 2010
Aerosol IndexAerosol Index SOSO22

5/11/2010 Krotkov, aerocenter 14
MODIS Image MODIS Image & & OMI Aerosol IndexOMI Aerosol Index6 May 2010
OMI Aerosol OMI Aerosol IndexIndex
MODIS Vis ImageMODIS Vis Image

• Nine CCD push-broom cameras• Nine view angles at Earth surface:
70.5º forward to 70.5º aft• Four spectral bands at each angle:
446, 558, 672, 866 nm• Studies Aerosols, Clouds, & Surface
Multi-angle Imaging SpectroRadiometer
http://wwwhttp://www--misr.jpl.nasa.govmisr.jpl.nasa.gov

SmokeSmoke from Mexico -- 02 May 2002
0.0 1.2 -.25 3.0 0.0 1.0
Aerosol:AmountSizeShape
MediumMediumSphericalSphericalSmokeSmokeParticlesParticles
DustDust blowing off the Sahara Desert -- 6 February 2004
LargeLargeNonNon--SphericalSphericalDustDustParticlesParticles
0.0 1.2 -.25 3.0 0.0 1.0

MISR Team, JPL and GSFC
MISR-Derived Ash Plume Aerosol Amount & PropertiesPlume Aerosol Amount & PropertiesEyjafjalljökull Volcano 19 April 2010

position in first image
Surface
Parallax : Apparent change in position
Second view angle(no cloud motion)
Apparentposition
Satellite
Surface
height abovethe surface
First view angle
Apparentposition in first image
Surface
Cloud Motion + Parallax
Second view angle(with cloud motion)
Concept: Stereo-imaging
• Applies to Clouds ANDAerosol plumes near-source:Wildfire smoke, Desert dust, Volcanic ash
• MISR Stereo Height retrievals are purely geometric –not sensitive to sensor calibration
• Heights are retrieved at 1 km horizontal resolution, keyed to the layer of maximum contrast
R. Marchand, U. Washington

1
2
3
4
5
1
2
3
4
5
0.0 0.6 1.2 0.0 1.2 2.4 0 5000 10,000
Oregon Fire Sept 04 2003 Orbit 19753 Blks 53-55 MISR Aerosols V17, Heights V13 (no winds)
Kahn, et al., JGR 2007
0
2
4
6
8
10
0 2 4 6 8 10
Atmospheric Stability
P 1-2P 4-5
0 50 100
0.5
1.5
2.5
3.5
4.5
5.5
6.5
7.5
8.5
9.5
Hei
ght (
km)
Number of Pixels
P1
0 100 200
0.5
1.5
2.5
3.5
4.5
5.5
6.5
7.5
8.5
9.5
Hei
ght (
km)
Number of Pixels
P2
0 50 100
0.5
1.5
2.5
3.5
4.5
5.5
6.5
7.5
8.5
9.5
Hei
ght (
km)
Number of Pixels
P3
0 50 100
0.5
1.5
2.5
3.5
4.5
5.5
6.5
7.5
8.5
9.5H
eigh
t (km
)
Number of Pixels
P4
0 20 40 60
0.5
1.5
2.5
3.5
4.5
5.5
6.5
7.5
8.5
9.5
Hei
ght (
km)
Number of Pixels
P5

MODIS Image + Fire PowerFire Power
Source 1Source 1
Source 2Source 2
Source 3Source 3
Source 4Source 4
1122
33
44
55
66
7788
Source 1Source 1(159)(159)
Source 2Source 2(25)(25) Source 3Source 3
(490)(490)
Source 4Source 4(720)(720)
0
1
2
3
4
5
6
0 5 10 15 20 25 30
Distance from Source 1 (km
1
2 3 4
5
6 78
Source 3Source 3
Detail of Wildfire Source RegionOregon Fire Sept 04 2003
MISR Plume Heights Plume Heights for Sub-patches
MISR Nadir 275 m 275 m Image
304
308
312
316
320
324
328
0 1 2 3 4 5
(km-1)
Ta(NCEP)
Ta(G=6K/km)
Ta(G=5K/km)
Very Simple Plume Parcel Model
Broad swath + high spatial resolution Broad swath + high spatial resolution help characterizing sources
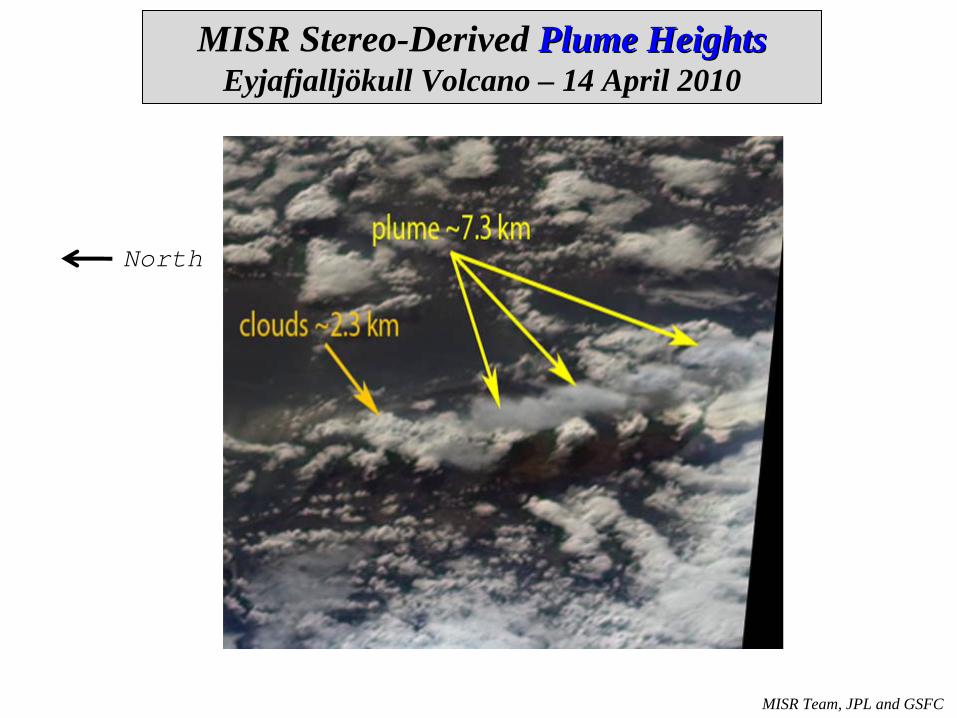
MISR Stereo-Derived Plume HeightsPlume HeightsEyjafjalljökull Volcano – 14 April 2010
MISR Team, JPL and GSFC
North
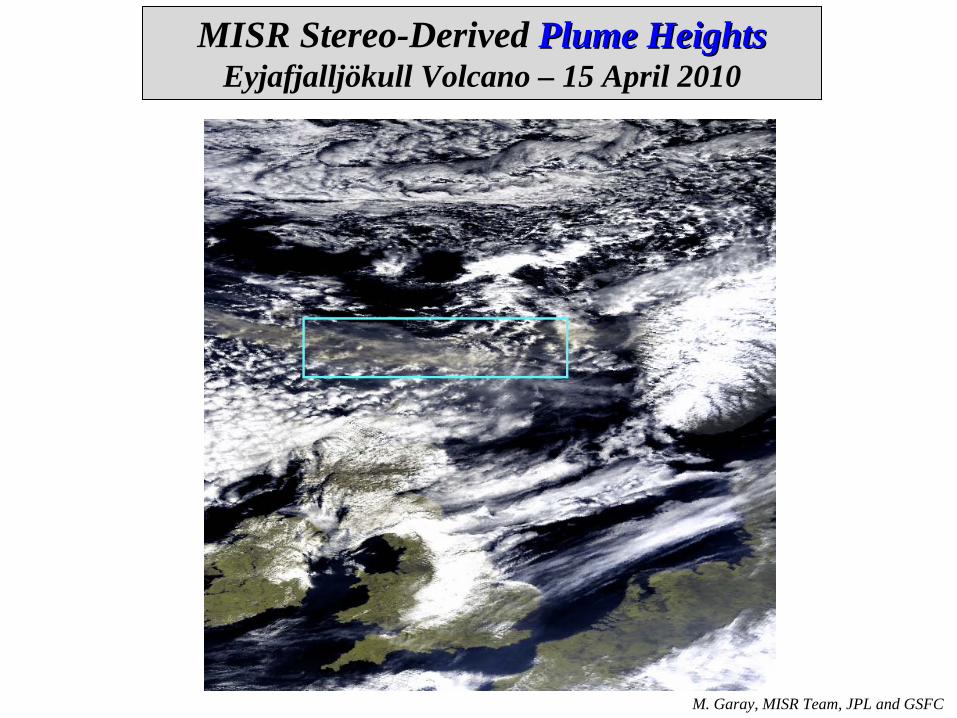
MISR Stereo-Derived Plume HeightsPlume HeightsEyjafjalljökull Volcano – 15 April 2010
M. Garay, MISR Team, JPL and GSFC

MISR Stereo-Derived Plume HeightsPlume Heights15 April 2010 15 April 2010 Orbit 54917 Path 206 Blk 41 UT 11:38
D. Nelson and the MISR Team
km0
2
4
6
8
Ht~ 1.92 km
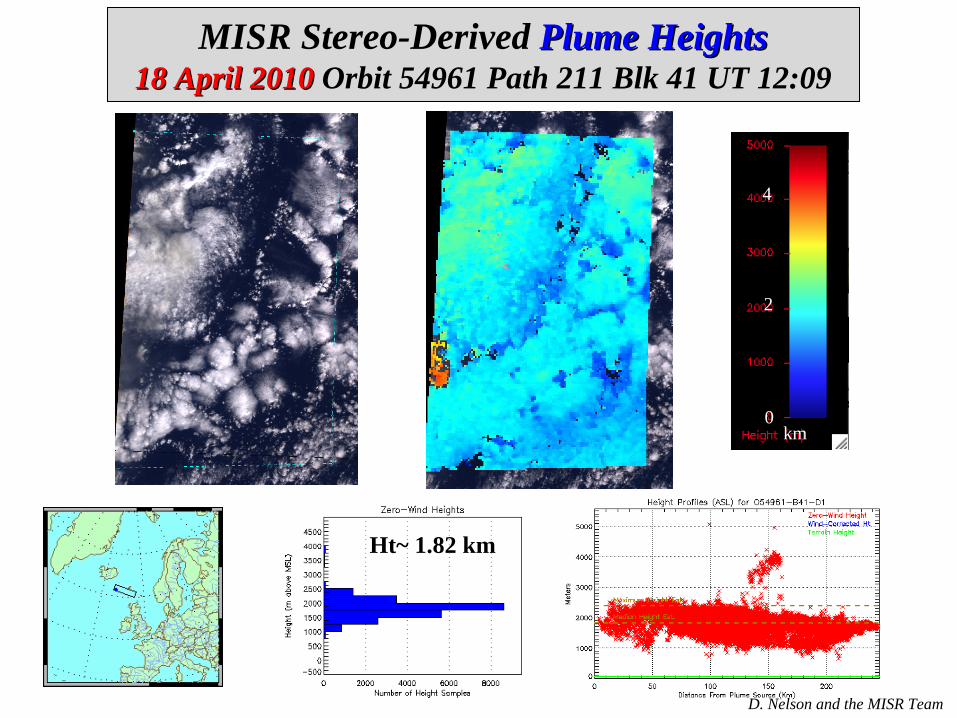
MISR Stereo-Derived Plume HeightsPlume Heights18 April 2010 18 April 2010 Orbit 54961 Path 211 Blk 41 UT 12:09
D. Nelson and the MISR Team
0
2
4
km
Ht~ 1.82 km

D. Nelson and the MISR Team
km0
1
2
3
4
5
MISR Stereo-Derived Plume HeightsPlume Heights19 April 2010 19 April 2010 Orbit 54976 Path 218 Blk 39 UT 12:51

D. Nelson and the MISR Team
MISR Stereo-Derived Plume HeightsPlume Heights19 April 2010 19 April 2010 Orbit 54976 Path 218 Blk 39 UT 12:51
Height: Blue Blue = Wind-corrected
XX- & AlongAlong--TrackWinds
Ht~ 1.08 km
X--TrackWinds Along--TrackWinds
Zero-Wind Ht
http://wwwhttp://www--misr2.jpl.nasa.gov/EPAmisr2.jpl.nasa.gov/EPA-- Plumes/Plumes/

MISR Stereo-Derived Plume HeightsPlume Heights03 May 2010 03 May 2010 Orbit 55180 Path 220 Blk 39 UT 13:04
D. Nelson and the MISR Team
0
2
4
km
Ht~ 3.83 km

D. Nelson and the MISR Team, JPL and GSFC
North
5
4
3
2
1
0km
km0
2
4
6
MISR Stereo-Derived Plume HeightsPlume Heights07 May 2010 07 May 2010 Orbit 55238 Path 216 Blk 40 UT 12:39
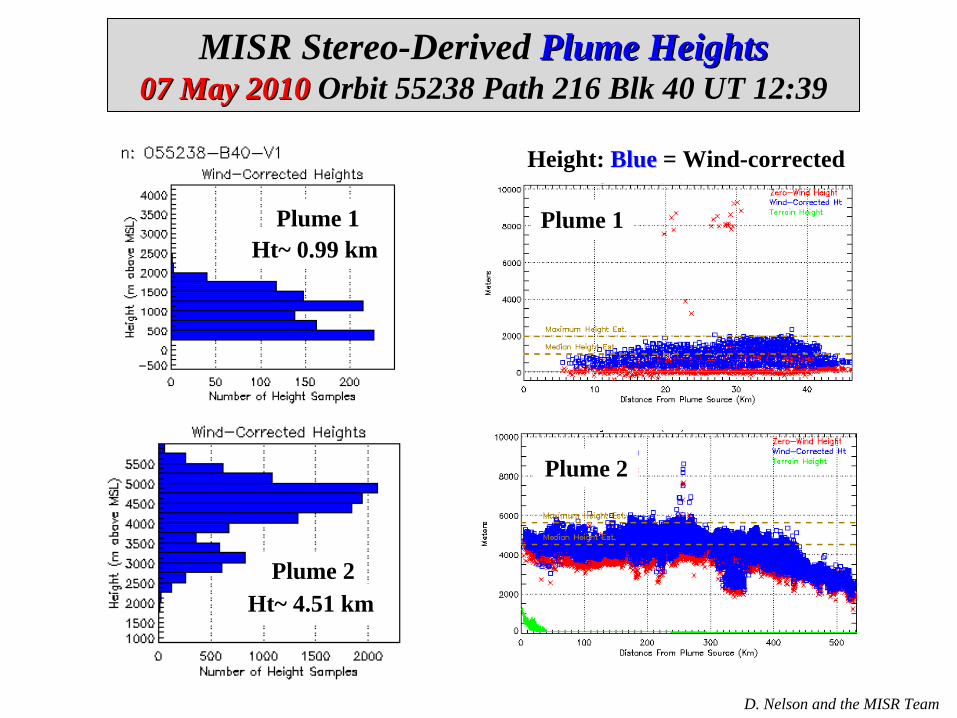
D. Nelson and the MISR Team
MISR Stereo-Derived Plume HeightsPlume Heights07 May 2010 07 May 2010 Orbit 55238 Path 216 Blk 40 UT 12:39
Height: Blue Blue = Wind-corrected
Plume 1
Plume 2
Ht~ 0.99 km
Ht~ 4.51 kmPlume 2
Plume 1

MISR Stereo-Derived Plume HeightsPlume Heights13 May 2010 13 May 2010 Orbit 55325 Path 210 Blk 41 UT 12:03
D. Nelson and the MISR Team
Ht~ 2.21 km
km0
2
4
6

MISR Stereo-Derived Plume HeightsPlume Heights16 May 2010 16 May 2010 Orbit 55369 Path 215 Blk 40 UT 12:33
D. Nelson and the MISR Team
Ht~ 6.51 km
0
2
4
km
6
8

MISR Eyja Near-Source CoverageCoverage
MISR Team, JPL and GSFC
Path 217
Path 218Path 219Path 220Path 221
Path 216
Path 215
Path 214
Path 213
Path 212
Path 211

MISR Eyja Near-Source CoverageCoverageMay-December 2010
MISR Team, JPL and GSFC
Site Date Orbit Path Block UT Timex-Track
(km) Lat Lon#555t 22-May-10 55456 209 40 11:52:31 26.0 E 62.25 -5.23
#554t 23-May-10 55471 216 39 12:35:26 172.2 E 62.94 -12.4
#555t 24-May-10 55485 207 40 11:40:17 126.3 W 62.25 -5.23
#554t 25-May-10 55500 214 40 12:23:14 26.6 E 62.94 -12.4
#553t 26-May-10 55515 221 39 13:06:09 166.3 E 63.63 -19.6
#554t 27-May-10 55529 212 40 12:11:00 122.1 W 62.94 -12.4
#553t 28-May-10 55544 219 39 12:53:56 24.5 E 63.63 -19.6
#555t 29-May-10 55558 210 40 11:58:39 101.6 E 62.25 -5.23
#553t 30-May-10 55573 217 39 12:41:43 120.4 W 63.63 -19.6
#555t 31-May-10 55587 208 40 11:46:26 49.3 W 62.25 -5.23
#554t 1-Jun-10 55602 215 39 12:29:22 100.2 E 62.94 -12.4
#554t 3-Jun-10 55631 213 40 12:17:09 47.1 W 62.94 -12.4
#553t 4-Jun-10 55646 220 39 13:00:04 96.1 E 63.63 -19.6
#555t 5-Jun-10 55660 211 40 12:04:47 176.5 E 62.25 -5.23
#553t 6-Jun-10 55675 218 39 12:47:51 47.5 W 63.63 -19.6
#555t 7-Jun-10 55689 209 40 11:52:34 26.8 E 62.25 -5.23
#554t 8-Jun-10 55704 216 39 12:35:29 173.1 E 62.94 -12.4
#555t 9-Jun-10 55718 207 40 11:40:20 125.5 W 62.25 -5.23
#554t 10-Jun-10 55733 214 40 12:23:16 27.2 E 62.94 -12.4
Etc…

A Few Additional Thoughts
What might help:
• More airborne samples airborne samples of volcanic ash & other aerosols
• Better optical models optical models for volcanic ash
• A study of the relationships among source source energeticsenergetics, plume heightplume height, & atmospheric stability atmospheric stability structure
• Including AERONET AERONET column AOD in the mix of data
Seems like an opportunity to effect better communicationbetter communicationamong resources, and not just for this volcanic eruption

Aerosol-Climate (also Volcano PlumeVolcano Plume) PredictionPrediction
SatellitesSatellites
Model ValidationModel Validation•• ParameterizationsParameterizations•• Climate SensitivityClimate Sensitivity•• Underlying mechanismsUnderlying mechanisms
CURRENT STATECURRENT STATE•• Initial ConditionsInitial Conditions•• AssimilationAssimilation
RemoteRemote--sensing Analysissensing Analysis•• Retrieval ValidationRetrieval Validation•• Assumption RefinementAssumption Refinement
frequent, global snapshots;
AOD, aerosolair mass type,plume height
space-time interpolation,
PREDICTIONPREDICTION
SubSub--orbitalorbital
targeted chemical & microphysical detail
point-locationtime series
Regional Context Regional Context
R. Kahn