multidimensional poverty - ophi
TRANSCRIPT

Multidimensional
Poverty

Motivation
“We are almost blind when the
metrics on which action is based
are ill-designed or when they are
not well understood”
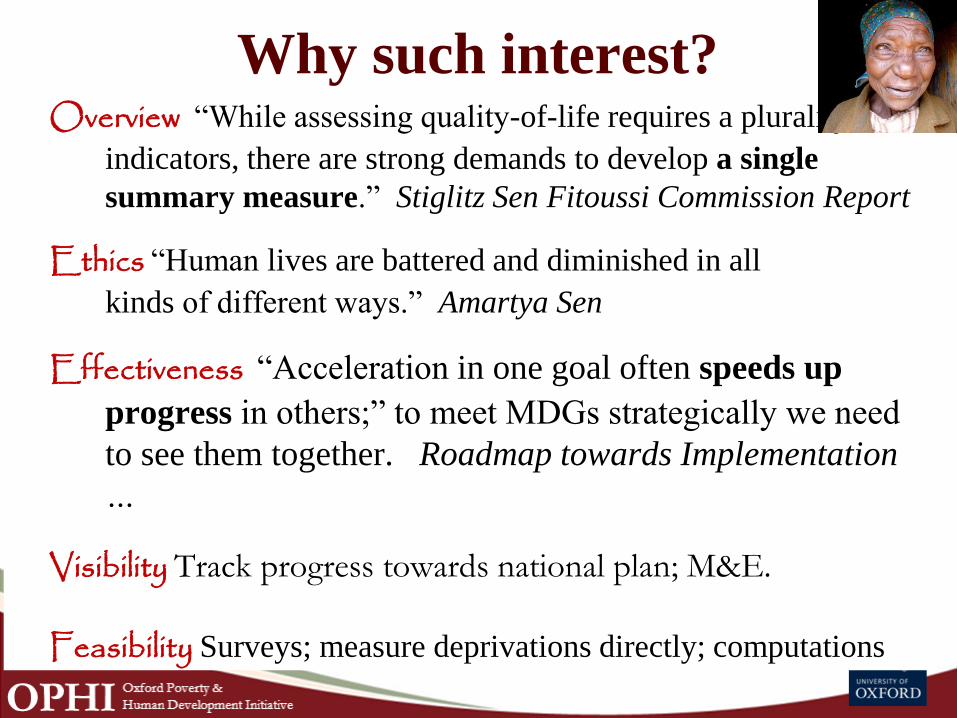
Why such interest?Overview “While assessing quality-of-life requires a plurality of
indicators, there are strong demands to develop a single
summary measure.” Stiglitz Sen Fitoussi Commission Report
Ethics “Human lives are battered and diminished in all
kinds of different ways.” Amartya Sen
Effectiveness “Acceleration in one goal often speeds up
progress in others;” to meet MDGs strategically we need
to see them together. Roadmap towards Implementation
…
Visibility Track progress towards national plan; M&E.
Feasibility Surveys; measure deprivations directly; computations
Why Multidimensional Poverty Measures?
• Income poverty does not show health or education or
social deprivations, nor does its reduction reduce
them.
• Multidimensional poverty measures complement
income poverty measures, both globally and
nationally.

Source: Whelan Layte Maitre 2004 Understanding the Mismatch between Income Poverty & Deprivation
Income poverty does not proxy
material deprivations in Europe

Source: Whelan Layte Maitre 2004 Understanding the
Mismatch between Income Poverty & Deprivation
In Europe, while 20% of
people are persistently
income poor, and 20% are
persistently materially
deprived, ONLY 10% of
people are BOTH
persistently income poor
and materially deprived.
This observation motivated
the move in Europe to a
multidimensional poverty
measure EU 2020. Income
doesn’t tell the full story –
even of material deprivation
in industrial economies
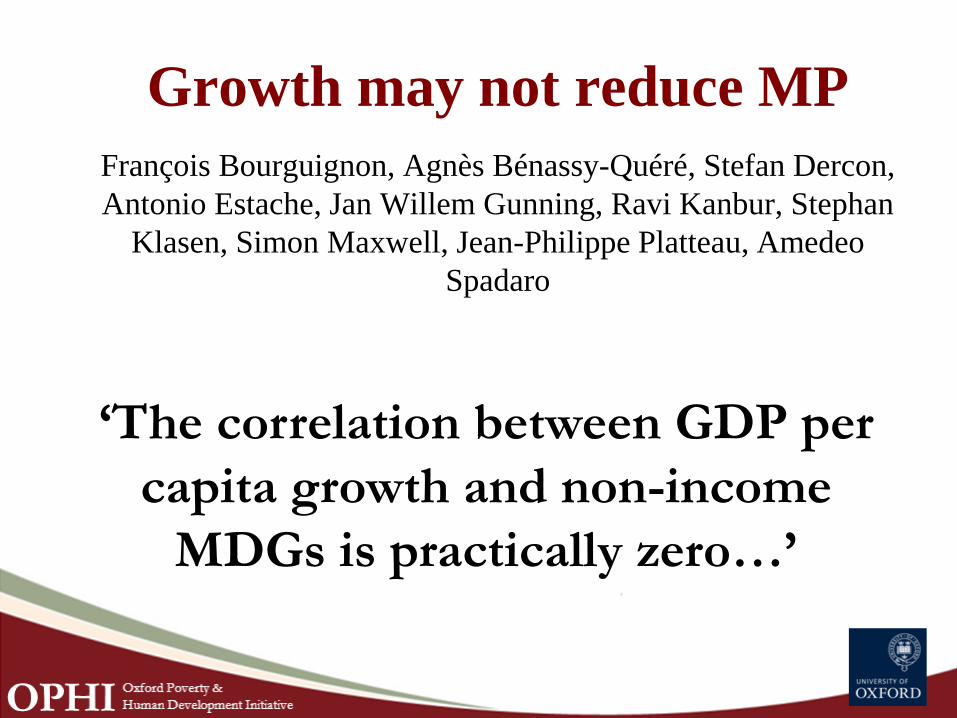
Growth may not reduce MP
François Bourguignon, Agnès Bénassy-Quéré, Stefan Dercon,
Antonio Estache, Jan Willem Gunning, Ravi Kanbur, Stephan
Klasen, Simon Maxwell, Jean-Philippe Platteau, Amedeo
Spadaro
‘The correlation between GDP per
capita growth and non-income
MDGs is practically zero…’

Growth? Necessary but Insufficient.
India: strong economic growth since 1980s.
1998-9 NHFS-2: 47% children under 3 were undernourished
2005-6 NHFS-3: 46% were undernourished (wt-age)
“Growth, of course, can be very helpful in achieving development, but
this requires active public policies to ensure that the fruits of economic
growth are widely shared, and also requires – and this is very important
– making good use of the public revenue generated by fast economic
growth for social services, especially for public healthcare and public
education.”Dreze and Sen ‘Putting Growth in its Place’ Outlook. November 2011
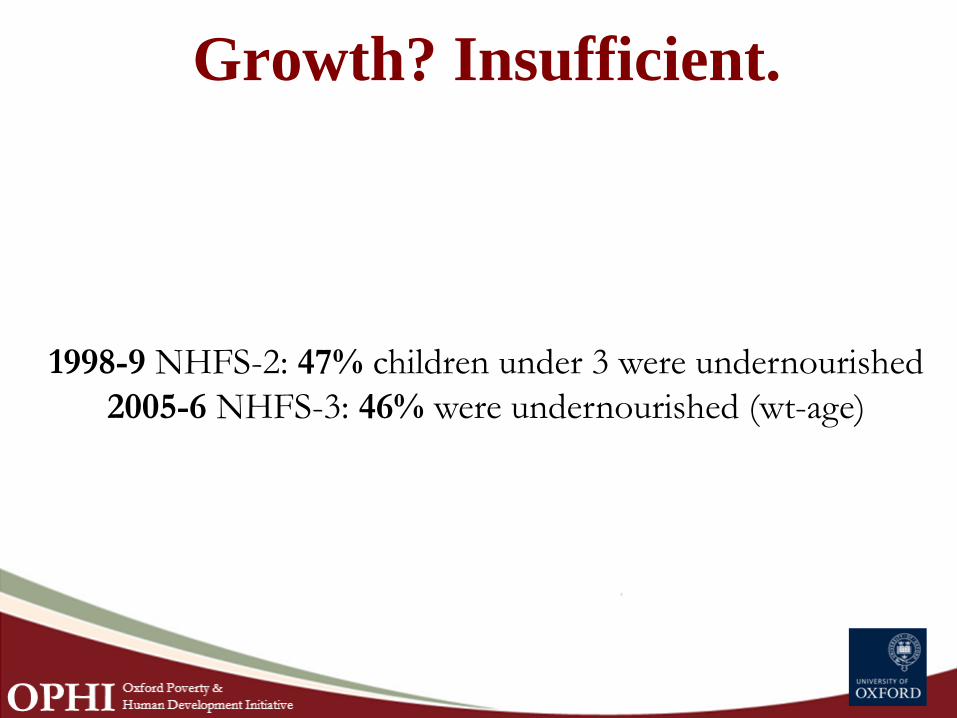
Growth? Insufficient.
1998-9 NHFS-2: 47% children under 3 were undernourished
2005-6 NHFS-3: 46% were undernourished (wt-age)

MEASURING
MULTIDIMENSIONAL
POVERTYALKIRE FOSTER METHOD

Multidimensional Poverty- the challenge:
• A government would like to create an official
multidimensional poverty indicator
• Desiderata
– It must understandable and easy to describe
– It must conform to “common sense” notions of poverty
– It must be able to target the poor, track changes, and guide
policy.
– It must be technically solid
– It must be operationally viable
– It must be easily replicable

Practical Steps
• Select– Purpose of the index (monitor, target, etc)
– Unit of Analysis (indv, hh, cty)
– Dimensions
– Specific variables or indicators for each dimension
– Whether variables or dimensions should be aggregated with others or left independent
– Cutoff for each independent variable/dimension
– Value of deprivation for each variable/dimension
– Identification method
– Aggregation method

© Mihika Chatterjee 2014 TEDx Wooster13
Dimensions, Weights, Indicators

© Mihika Chatterjee 2014 TEDx Wooster
Person Health Education HousingEmployme
nt
Person 1
Person 2
Person 3
Person 4

© Mihika Chatterjee 2014 TEDx Wooster
Person Health Education HousingEmployme
nt
Person 1
Person 2
Person 3
Person 4

© Mihika Chatterjee 2014 TEDx Wooster
Build a Deprivation Score
for Each Person
Nathalie, Cameroon

© Mihika Chatterjee 2014 TEDx Wooster17
Who is Poor?
A person who is deprived in more than 1/3rd
of the weighted indicators is MPI poor
Nathalie, Cameroon

Aggregation: Alkire & Foster - Appropriate for Ordinal data -
The MPI is the product of two components:
1) Incidence ~ the percentage of people who
are poor, or the headcount ratio H.
2) Intensity of people’s deprivation ~
the average percentage of dimensions in
which poor people are deprived A.
MPI = H× A

From a Measure
to
a Tool

1. Intuitive – easy to understand headline
2. Birds-eye view - can be unpacked
a. by region, ethnicity, rural/urban, etc
b. by indicator, to show composition
c. by ‘intensity’ to show inequality among poor
3. Adds Value:
a. focuses on people with multiple deprivations
b. shows people’s simultaneous deprivations.
4. Incentives to reach the poorest of the poor
5. Flexible you choose indicators/cutoffs/values
6. Robust to wide range of weights and cutoffs
7. Academically Rigorous – axiomatic & empirical
Policy Interest – Why?

From a measure to a tool
An income poverty
measure tells us
who is income poor.

From a measure to a tool
The MPI headcount tells us
who is multidimensionally
poor.
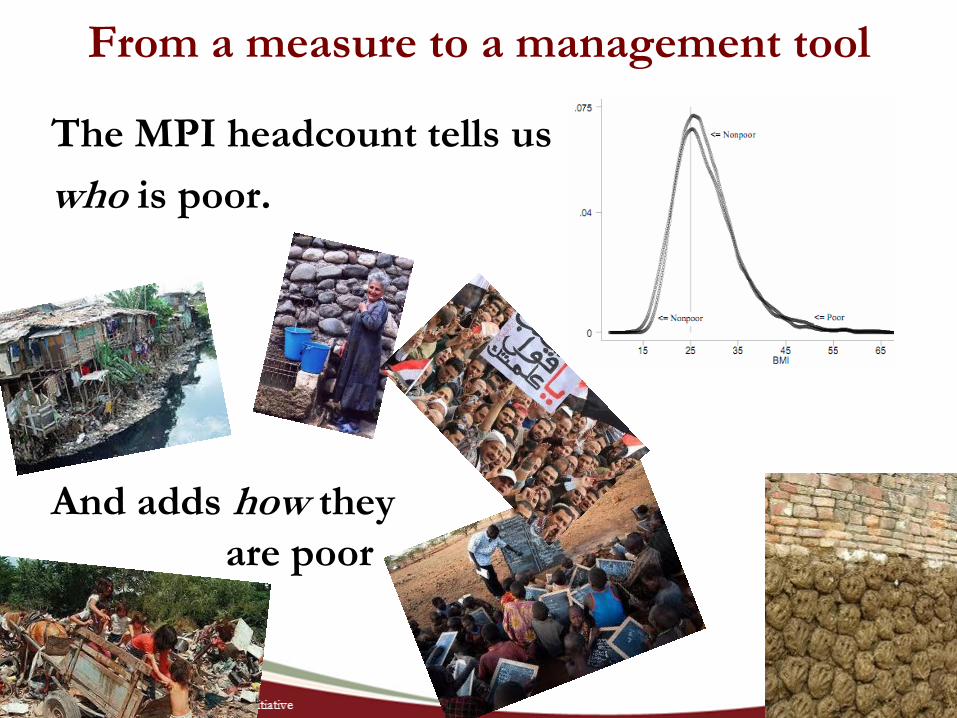
From a measure to a management tool
The MPI headcount tells us
who is poor.
.
And adds how they
are poor

Nepal 2006
Nepal 2011
30%
35%
40%
45%
50%
55%
60%
65%
70%
75%
0% 10% 20% 30% 40% 50% 60% 70% 80% 90% 100%
Ave
rag
e I
nte
nsi
ty o
f P
ove
rty (
A)
Incidence - Percentage of MPI Poor People (H)
What MPI shows – National level
How MPI decreased in Nepal 2006-11

Decomposition By Region
(or social group) – shows inequalities

26
How did MPI go
down?
Monitor each
indicator

Indicator Changes by region (Nepal)
-0.11
-0.09
-0.07
-0.05
-0.03
-0.01
0.01
0.03
An
nu
ali
zed
Ab
solu
te C
ha
ng
e
in p
rop
ort
ion
wh
o i
s p
oo
r an
d d
ep
rive
d i
n..
.
Nutrition
Child MortalityYears of SchoolingAttendance
Cooking FuelSanitation
Water
Electricity
Floor
Assets

The MPI: High Resolution
The MPI can be broken down in different ways:
1. By Headcount – to show how many are poor
2. By Dimension – to show how people are poor
3. By Intensity – to show who has greatest intensity
4. By Sub-group – to show how groups vary (in
headcount, intensity, and composition)
In fact, it is the MPI Plus a dashboard (a set)
of consistent subindices that unpack the
AF analysis and supply powerful analysis.

Some Policy Applications of MPIs:
• Track poverty over time (official statistics)
• Compare poverty by region, ethnicity, rural/urban
• Monitor indicator changes (measure to manage)
• Coordinate different policy actors
• Target marginalized regions, groups, or households
• Evaluate policy impacts

MPI National
Applications

MPI in Action
Official National MPIs
Colombia
Mexico
Bhutan
Philippines
Others: China, Tunisia, Indonesia, Chile,
Costa Rica, Vietnam, Eastern Caribbean,
Honduras, Pakistan, Angola

Colombia’sMultidimensional
Poverty Index(IMPI)
Education Childhood & youth
conditionsLabor Health Public utilities &
housing conditions

Colombia 2011, 2013:
MPI-Colombia
Educational
ConditionsChildhood &
YouthWork Health
Housing &
Public Services
Schooling
Illiteracy
School Attendance
At the right
level
Access to
infant
services
No Child
Labour
Absence of
long-term
unemploy-
ment
Coverage
Access to
health care
given a
necessity
Improved
Water
Flooring
Overcrowdin
g
Sanitation
Exterior
Walls
Formal
work0.1
0.2 0.2 0.2 0.2 0.2
0.05
0.1 0.1
0.04
Used to allocate
resources in
national
development
plan

National Development Plan 2010-2014: goals in the reduction of
poverty using a complete profile
(MPI & income)

PobrezaLínea Base
PND 2008
Dato
2011
Dato
2012Análisis Goal
MPI (Multidimensional Poverty) 34.7% 29.4% 27.0% 22.5%
Educational achievement (≥15 yrs)
Literacy (≥15 yrs)
58.8% 54.6% 53.1% 52.8%
14.2% 12.0% 12.1% 12.0%
School attendance (6-16)
No school lag (7-17)
Access to child care services (0-5)
Children not working (12-17)
5.4% 4.8% 4.1% 3.5%
33.4% 34.1% 33.3% 33.1%
12.1% 10.8% 9.4% 10.6%
5.5% 4.5% 3.7% 2.9%
Long-term unemployment
Formal employment
9.6% 9.1% 10.0% 9.3%
80.6% 80.4% 80.0% 74.7%
Health insurance
Access to health services
24.2% 19.0% 17.9% 0.5%
8.9% 8.2% 6.6% 2.4%
Access to water source
Adequate sewage system
Adequate floors
Adequate external walls
No critical overcrowding
12.9% 12.0% 12.3% 10.9%
14.1% 14.5% 12.1% 11.3%
7.5% 6.3% 5.9% 5.6%
3.1% 3.2% 2.2% 2.1%
15.7% 14.2% 13.1% 8.4%
FUENTE: DANE
0%-10% avance 10%-25% avance >25% avance
A(1)
D(4)
B(2)
C(3)
E(5)
*** Change 2011-2012 est. significant
***
***
***
***
***
***
***
***
Sectoral goalsFor accomplishing the strategy
High official commissionMonitoring an integrated poverty reduction

38
High Official Commission
Monitoring the national strategy for the reduction of poverty using official poverty
measures▪ Leaders
– Presidency (Mandatory presence of the President of
Colombia)
– Department for Social Prosperity
– National Planning Department
▪ Permanent members
– Ministry of Health
– Ministry of Labour
– Ministry of Housing
– Ministry of Agriculture
– Ministry of Education
– Ministry of Finance
Geographical Targeting(Poverty maps
Municipal MPI Colombia)

Municipal MPI Colombia
Headcount ratio, urban-rural areas, 2005
MPI proxy based on Census Data 2005

I P M
A family is “graduated” from if:
Sufficient condition:
Not in extreme income
povertyNot multidimensionally
poor
&

From 2010 to 2012, 1,7 million persons overcame income poverty and 700
thousand extreme poverty
On the other hand, 1.3 million persons were no longer MPI poor
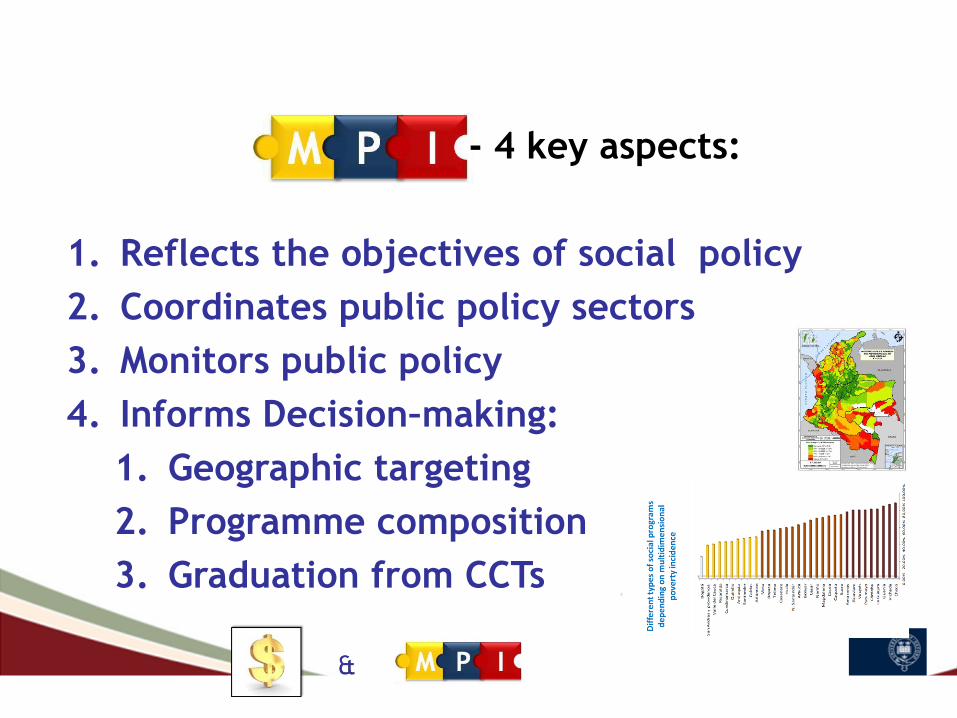
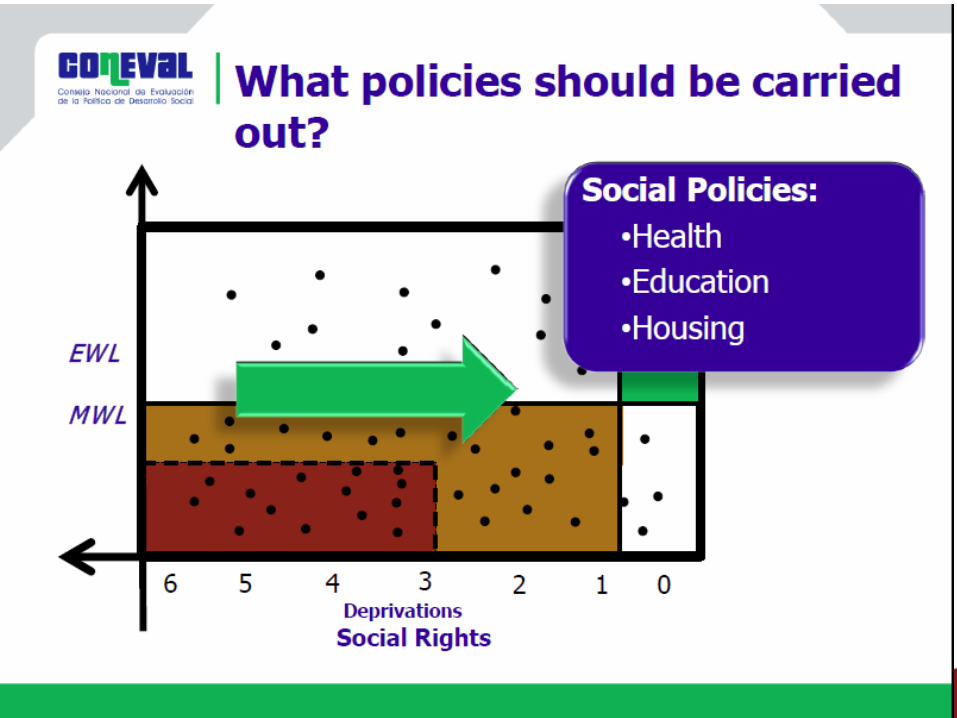
- 4 key aspects:
1. Reflects the objectives of social policy
2. Coordinates public policy sectors
3. Monitors public policy
4. Informs Decision–making:
1. Geographic targeting
2. Programme composition
3. Graduation from CCTs

www.coneval.gob.mx
Multidimensional Poverty in MexicoMethodology & results
First released December, 2009

Using the multidimensional approach for policy purposes
• The new National Development Plan was launched in May 2013 with 14 indicators. 2 of them are taken from the multidimensional poverty methodology
• In 2013 the President and the Minister of Social Development established poverty strategies and
goals for all Ministries
• Opposing political parties use and believe in the multidimensional poverty estimates since 2009 (as
well as the media)
• State Governors are now concerned about reducing poverty. They keep asking how can they do it.
Territorial
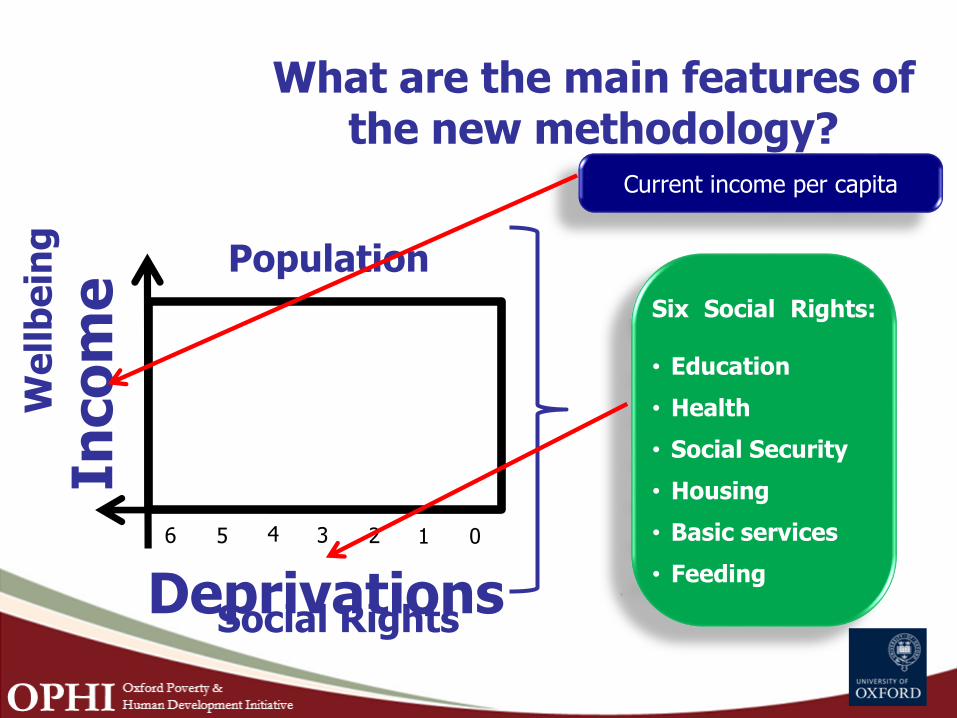
What are the main features of the new methodology?
Social RightsDeprivations
Population
We
llb
ein
g
Inco
me
Current income per capita
Six Social Rights:
• Education
• Health
• Social Security
• Housing
• Basic services
• Feeding
03 2 1456
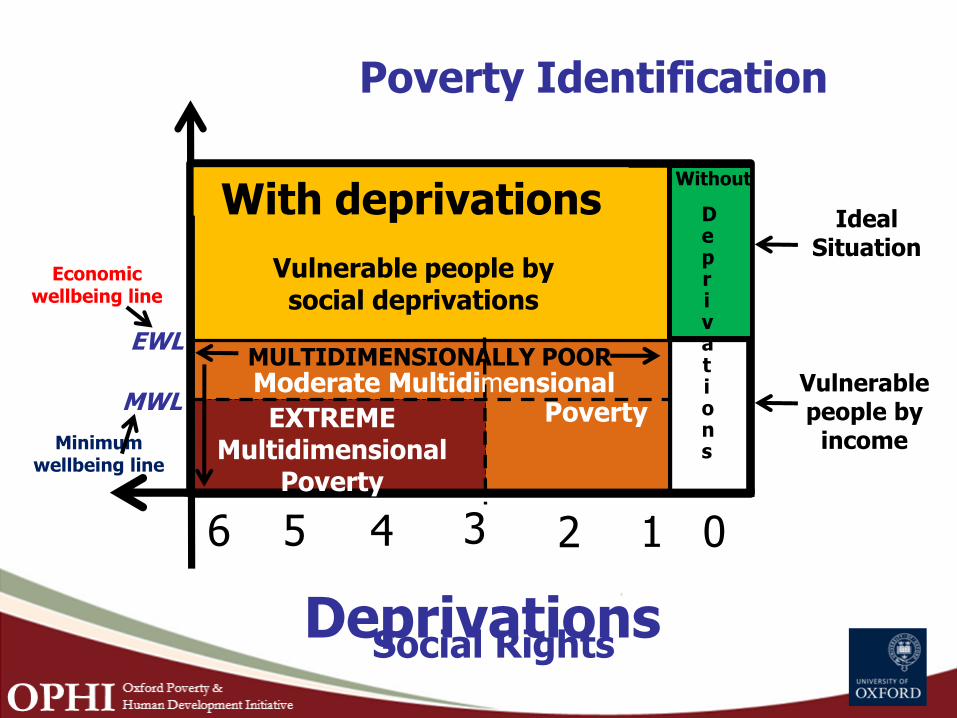
Social RightsDeprivations
Poverty Identification
EWL
With deprivations
EXTREME Multidimensional
Poverty
03
Moderate MultidimensionalPoverty
Vulnerable people by social deprivations
Vulnerable people by
income
5 24 16
Ideal Situation
MWL
Without
Deprivations
MULTIDIMENSIONALLY POOR
Economic wellbeing line
Minimum wellbeing line

MOTIVATION
CONEVAL: from 2008 to 2010 five out of six social deprivations
decreased, but one increased: access to food. Food access
deprivation increased by 4.2 million.
Social Deprivations 2008-2010
Rezagoeducativo
Acceso a losservicios de
salud
Acceso a laseguridad social
Calidad yespacios de la
vivienda
Acceso a losservicios básicos
en la vivienda
Acceso a laalimentación
21.9
40.8
65.0
17.7 19.221.720.6
31.8
60.7
15.2 16.5
24.9
Education Health Social SecurityDwelling spaces & materials
Dwelling basicservices Food
access
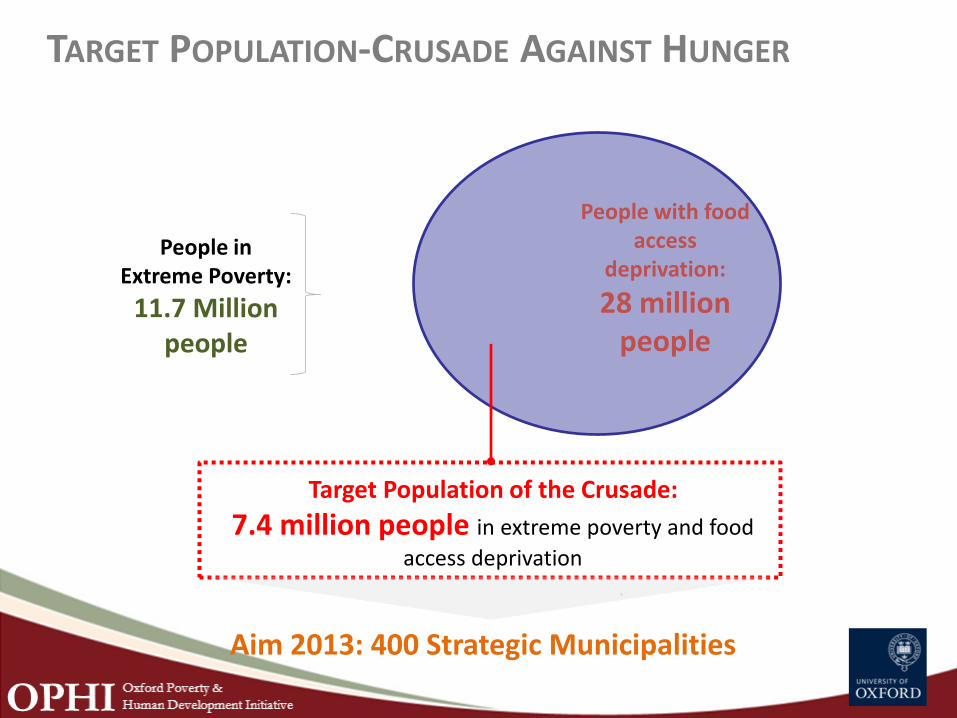
TARGET POPULATION-CRUSADE AGAINST HUNGER
Target Population of the Crusade:
7.4 million people in extreme poverty and food
access deprivation
People in Extreme Poverty:
11.7 Million people
People with food access
deprivation:
28 million people
Aim 2013: 400 Strategic Municipalities
The Multidimensional
Poverty Peer Network
(MPPN)
AND OTHER VOICES

The Multidimensional Poverty Peer Network
Launched in June 2013 at University of Oxford with:
• President Santos of Colombia
• Ministers from 16 countries in person
• A lecture from Professor Amartya Sen
• http://www.ophi.org.uk/policy/policynetwork/
Supported by the German Federal Ministry for Economic Cooperation and
Development (BMZ)


The Global Multidimensional Poverty
Peer Network (MPPN) had 22 countries in 2013
Angola, Bhutan, Brazil, Chile, China, Colombia, Costa Rica,
Ecuador, El Salvador, Dominican Republic, Germany, Honduras,
India, Iraq, Malaysia, Mexico, Morocco, Mozambique, the
Organization of Caribbean States, Pakistan, Peru, Philippines,
Seychelles, South Africa, Tunisia, Turkey, Uruguay, and VietnamSupported by

MPPN has 32 countries plus international
agencies in 2014
Supported by the German Federal Ministry for Economic
Cooperation and Development (BMZ)

Tajikistan
Nepal
Djibouti
Recent New Members

The Network’s Agenda
• Expansion of Multidimensional Poverty Index
• National measures (Colombia, Mexico, Philippines,
Bhutan, Chile, Vietnam, Costa Rica, Eastern Caribbean)
• An Effective and Informed Voice in the Post
2015 Discussions
• MPPN Survey
• Ongoing work to advance an MPI2015+
• The Promotion of Joint Research and
Development of Practical Tools
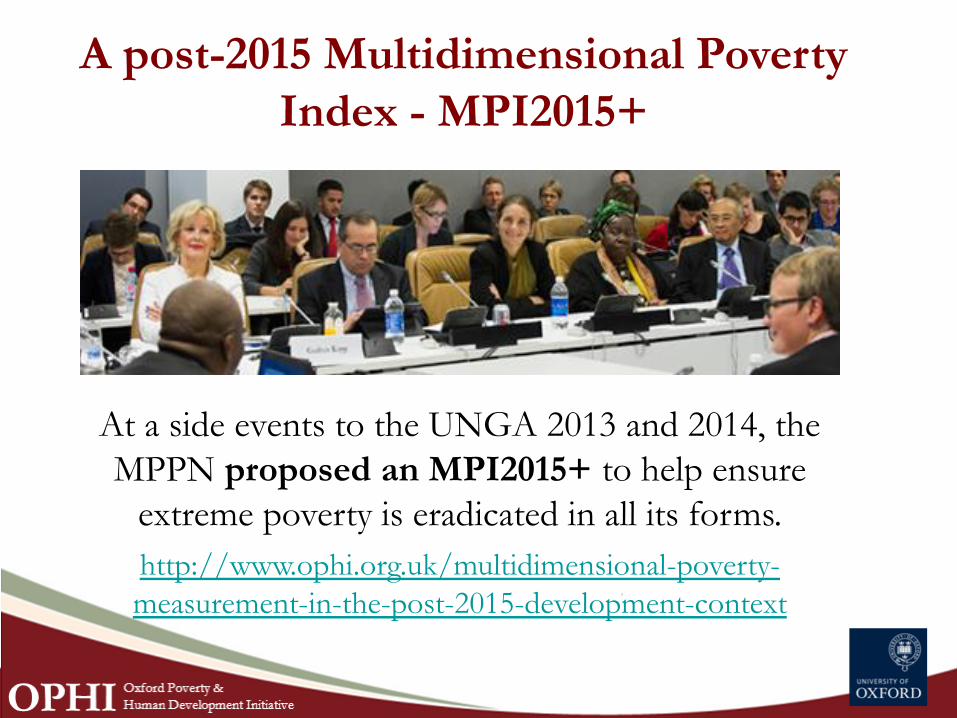
A post-2015 Multidimensional Poverty
Index - MPI2015+
At a side events to the UNGA 2013 and 2014, the
MPPN proposed an MPI2015+ to help ensure
extreme poverty is eradicated in all its forms.
http://www.ophi.org.uk/multidimensional-poverty-
measurement-in-the-post-2015-development-context

© Mihika Chatterjee 2014 TEDx Wooster 5
8
“Development is, ultimately, the progress of human freedom and capability
to lead the kind of lives that people have reason to value.”
~ Amartya Sen (Uncertain Glory, 2013, p 43)

© Mihika Chatterjee 2014 TEDx Wooster
For more information, visit:
http://www.ophi.org.uk/
www.mppn.org
Look out for forthcoming textbook: Multidimensional Poverty
Measurement and Analysis by Alkire, Foster, Seth, Santos, et al
(OUP, expected publication date mid-2015)