global multidimensional poverty index 2017 - ophi · ophi briefing 47 may 2017 global...
TRANSCRIPT

OPHI Briefing 47 | May 2017
Global Multidimensional Poverty Index 2017
PB 1
OPHIwwwophiorgukOXFORD POVERTY amp HUMAN DEVELOPMENT INITIATIVE ODID
BRIEFING 47 2017
Global Multidimensional Poverty Index 2017
The 2017 global Multidimensional Poverty Index (MPI) provides a headline estimation of poverty and its composition for 103 countries across the world The global MPI measures the nature and intensity of poverty based on the profile of overlapping deprivations each poor person experiences It aggregates these into meaningful indexes that can be used to inform targeting and resource allocation and to design policies that tackle the interlinked dimensions of poverty together
Sabina Alkire and Gisela Robles
The 2017 global MPI covers 54 billion people or 76 of the worldrsquos population living in 103 countries In 2017 we cover
KEY FINDINGS FROM THE GLOBAL MPI 2017
bull
bull
bull
bull
bull
A total of 145 billion people from 103 countries are multidimensionally poor[1] 265 of the people living in these countries
Forty-eight percent of the poor people live in South Asia and 36 in Sub-Saharan Africa
Most MPI poor people ndash 72 ndash live in middle income countries
Half of the multidimensionally poor (48) are children aged 0ndash17
Nearly half of all MPI poor people are destitute ndash 706 million ndash and so experience extreme deprivations like severe malnutrition in at least one-third of the dimensions
In Uganda 22 of people live in a household where at least one person experiences a severe disability Poverty in these households is higher 77 of people are poor vs 69 in other households
The MPI and its indicators are disaggregated by 988 subnational regions in 78 countries The poorest regions are in Chad Burkina Faso Niger Ethiopia South Sudan Nigeria Uganda and Afghanistan Inside Afghanistan poverty rates vary from 25 in Kabul to 95 in Urozgan
bull
THE GLOBAL MPI AND THE SUSTAINABLE DEVELOPMENT GOALS
bull
bull
bull
The global MPI is a new generation of multidimensional measures that supports key priorities in the Sustainable Development Goals (SDGs)
High-resolution poverty diagnostics are needed to leave no one behind The global MPI is disaggregated by children disability status subnational regions and ruralurban areas Linked indices of destitution and severe poverty highlight the very poorest
The SDGs call for analyses of interlinkages across indicators The global MPI is built upon solid household-level multidimensional poverty profiles
The SDGs advocated integrated multisectoral policies The global MPI shows the composition of poverty by indicator nationally ndash and for every dis-aggregated group ndash hence providing evidence for policy design
two new countries Algeria and El Salvador and have updated MPI statistics for 23 countries using new datasets
At its essence the global MPI supports the global recognition that poverty has many forms and dimensions so measures that complement monetary poverty are needed The first goal of the SDGs is to end poverty in all its forms and dimensions The second sentence of the pivotal SDG document Transforming Our World The 2030 Agenda for Sustainable Development reads lsquoWe recognise that eradicating poverty in all its
bull
wwwophiorguk
Alkire and Robles
2 3
forms and dimensions including extreme poverty is the greatest global challenge and an indispensable requirement for sustainable developmentrsquo (UN 2015)
Discussions leading up to the SDGs highlighted the need for new poverty measures In December 2014 the UN Secretary General Ban Ki Moon wrote lsquoPoverty measures should reflect the multidimensional nature of povertyrsquo[2]
A United Nations General Assembly Resolution on 19 December 2014 also lsquounderlines the need to better reflect the multidimensional nature of development and povertyrsquo It invites member states and others lsquoto consider developing complementary measurements ndash ones lsquothat better reflect that multidimensionalityrsquo (ARES69238 Paragraph 5) Relatedly the Addis Ababa Accord[3] called on the United Nations and others to lsquorecognize the multidimensional nature of povertyrsquo
Table 1 The global MPI indicators mapped to the SDGs
Dimension Indicator Related SDG
Health
Education
Living Standard
Nutrition
Child Mortality
Years of Education
School Attendance
Cooking Fuel
Sanitation
Drinking Water
Electricity
Floor
Assets
SDG 2 (Zero Hunger)
SDG 3 (Health and Well-being)
SDG 4 (Quality Education)
SDG 4 (Quality Education)
SDG 7 (Affordable and Clean Energy)
SDG 6 (Clean Water and Sanitation)
SDG 6 (Clean Water and Sanitation)
SDG 7 (Affordable and Clean Energy)
SDG 11 (Sustainable Cities and Communities)
SDG 1 (No Poverty)
The global MPI responds to this need for new ways to measure multidimensional poverty And as Table 1 shows the present global MPI reflects core SDGs[4]
Poverty profile Pedro Ecuador
Ass
et O
wne
rshi
p
EducationHealth Standard of Living
Years of Schooling
Child Mortality
Cook
ing
Fuel
Sani
tatio
n
Wat
er
Elec
tric
ity
Floo
ring
10 Indicators
3 Dimensions
Nutrition School Attendance
Pedro is a 38-year-old man who lives in a small town about a one-hour drive on a dirt road west of Cantildear Ecuador He and his wife had five children four of whom survive aged 4 10 16 and 17 They also take care of Pedrorsquos stepfather Pelayo who is 77 years old and unable to work Pelayo used to receive a pension but that ended due to problems with his identity card
Pedro and his wife make about US$10ndash$15 a day But they can find work only one week per month So the family income is only $675 a year They do have electricity and a latrine Water from a hose on an outside patio is a short walk away But their house is has a dirt floor They cook outside with wood in a small rudimentary fireplace They do not own a TV radio or any electrical appliance or even a bicycle They own two head of cattle two pigs and three chickens
Pedro is poor according to the global MPI The coloured boxes in the chart show the deprivations he faces
John
Ham
moc
k | O
PHI
OPHI Briefing 47 | May 2017
Global Multidimensional Poverty Index 2017
2 3
The global MPI looks at poverty through a lsquohigh-resolutionrsquo lens It directly measures the nature and magnitude of overlapping deprivations in health education and living standard for each household The MPI relays vital information on who is poor and how they are poor enabling policymakers to target resources and design policies more effectively
As a measure of acute multidimensional poverty the global MPI offers an essential complement to income poverty indices because it measures and compares deprivations directly It can be broken down by social groups and geographical areas to reveal poverty patterns within countries ndash and by indicators to show which deprivations drive poverty in different regions It can also be used to track changes in poverty over time
The global MPI was developed in 2010 by the Oxford Poverty and Human Development Initiative (OPHI) and the United Nations Development Programme (UNDP) for the UNDPrsquos flagship Human Development Reports 2010ndash2015 (Alkire and Santos 2014) The figures and analysis are updated by OPHI using newly released data twice per year In 2018 we may further align the global MPI with the SDGs A measure of lsquomoderatersquo poverty may be developed to reflect challenges in countries that have low levels of acute poverty according to the global MPI
INSIDE THE MPI THREE DIMENSIONS TEN INDICATORSWho is poor A person is identified as multidimensionally poor (or lsquoMPI poorrsquo) if she is deprived in at least one third of the weighted MPI indicators set out in Figure 1
WHAT IS THE GLOBAL MPI CONSTRUCTING THE GLOBAL MPIThe global MPI was created using a method developed by Alkire and Foster (2011) The Alkire Foster method is flexible and can be used with different dimensions indicators weights and cutoffs to create measures specific to different societies and situations
The MPI is the product of incidence and intensity
MPI = H x A
bull Incidence is the percentage of people who are poor (or the headcount ratio H)
bull Intensity is the average share of indicators in which poor people are deprived (A)
ThreeDimensions
of Poverty
Nutrition
Child Mortality
Years of Schooling
School Attendance
Cooking FuelImproved SanitationSafe Drinking WaterElectricityFlooringAsset Ownership
Health
Education
LivingStandard
Fig 1 Dimensions and indicators of global MPI
Table 2 The dimensions indicators deprivation thresholds and weights of the MPI
Dimension Indicator Deprived if
Health
Education
Living Standard
Nutrition
Child Mortality
Years of Education
School Attendance
Cooking Fuel
Sanitation
Drinking Water
Electricity
Floor
Assets
Any adult or child for whom there is nutritional information is malnourished
Any child has died in the household within the last five years
No household member has completed five years of schooling
Any school-aged child is not attending school up to the age at which they would complete class 8
The household cooks with dung wood or charcoal
The householdrsquos sanitation facility is not improved (according to SDG guidelines) or it is improved but shared with other households
The household does not have access to safe drinking water (according to SDG guidelines) or safe drinking water is a 30-minute or longer walk from home roundtrip
The household has no electricity
The household has a dirt sand or dung floor
The household does not own more than one radio TV telephone bike motorbike or refrigerator and does not own a car or truck
Relative weight
16
16
16
16
118
118
118
118
118
118
wwwophiorguk
Alkire and Robles
4 5
WHO ARE THE POOR AND WHERE DO THEY LIVE
Half of MPI poor people are children[5]
When we disaggregate the MPI by children we find child poverty to be strikingly high[6] Of the 145 billion people who are multidimensionally poor 48 are children That is a total of 689 million children who live in multidimensional poverty And poverty rates are higher among children 37 of children are poor whereas 23 of adults aged 18 and above are poor
Disaggregating the global MPI by children we find
Half of all multidimensionally poor people ndash 48 ndash are children
Nearly two out of every five children ndash 37 ndash are multidimensionally poor This means 689 million children are living in multidimensional poverty
Most MPI poor children live in South Asia (44) and in Sub-Saharan Africa (43)
In 36 countries including India at least half of all children are MPI poor
bull
bull
bull
bull
In Ethiopia Niger and South Sudan over 90 of children are MPI poor
Half of MPI poor children live in lsquoalertrsquo level fragile states and child poverty levels are the highest in the worst of the fragile states
Two-thirds of poor children live in middle income countries
Poor children are on average deprived in 52 of weighted indicators
As Figure 2 shows the most common deprivations children face are in cooking fuel sanitation flooring malnutrition and electricity
bull
bull
bull
bull
bull
Figure 2 shows the proportion of people who are poor and deprived in each indicator Childrenrsquos deprivations are significantly higher in each of the ten indicators
40
35
30
25
20
15
10
5
0
Proportion of individuals poor and deprived in
Years of schooling
School attendance
Child mortality
Nutrition ElectricitySanitation Water FloorCooking fuel
Assets
1314
5
18
9
22
13
22
10
30
1615
8
26
14
35
1917
9
Children 0 ndash17 Adults 18+
Fig 2 Child and adult deprivations in ten MPI indicators
7
OPHI Briefing 47 | May 2017
Global Multidimensional Poverty Index 2017
4 5
Half of MPI poor people live in South AsiaAbout half of the MPI poor live in South Asia (48) and 36 live in Sub-Saharan Africa This is a different distribution from $190day income poverty estimations aggregated in the same
way ndash because MPI is higher in South Asia In South Asia 416 of the population are MPI poor and 192 are poor by the extreme income poverty measure ndash so the rate is more than doubled[7] In Sub-Saharan Africa multidimensional poverty affects 601 of the population $190day poverty 464 so MPI poverty is one-third higher
Over one billion MPI poor people live in middle income countries[8]
Over one billion people ndash almost three quarters of all multi-dimensionally poor people (72) ndash live in middle income
countries Of these 86 million poor people live in in upper middle income countries and 961 million in lower middle income countries[9] What is striking is that the income cate-gories have overlapping levels of multi dimensio nal poverty In upper middle income countries the incidence of MPI varies from 0ndash42 in lower middle income countries itrsquos 0ndash68 and in low income countries 29ndash91 of national
Fig 4a Distribution of population by income category
Fig 4b Distribution of MPI poor persons by income category
Fig 3a Distribution of population by region
Sub-Saharan Africa (16)
Europe and Central Asia (2)
Latin America and Caribbean (9)
South Asia (31)
Arab States (6)
East Asia and the Pacific (36)
Fig 3b Distribution of MPI poor persons by region
Sub-Saharan Africa (36)
Europe and Central Asia (0)
Latin America and Caribbean (2)
East Asia and the Pacific (10)
Arab States (4)
South Asia (48)
Upper middle income (6)
High income non-OECD (0)
Low income (28)
Lower middle income (66)
Upper middle income (35)
High income non-OECD (0)
Low income (10)
Lower middle income (52)
wwwophiorguk
Alkire and Robles
6 7
populations live in acute multidimensional poverty When we focused on subnational regions the incidence of MPI varies from 0ndash74 in upper middle income countries from 0ndash92 in lower middle income countries and from 4ndash99 in low income countries
International aid and multidimensional poverty Differently distributedAid flows are complex and are only part of any poverty reduction strategy Measured in international currencies they do not reflect the unit costs of reducing a deprivation They must be analyzed alongside national public expenditures and other flows they supplement Yet the MPI portrays acute multidimensional poverty and unmet needs for public health and nutrition inputs basic education water sanitation housing electricity and other needs So a natural question is to what extent is the aid that deliberately targets those priority sectors flowing to the places where people who experience these overlapping deprivations live
To start such a conversation we describe aid allocations for 101 of the countries included in the global MPI 2017[10] using the information in the Creditor Reporting System (CRS) from the Organisation of Economic Cooperation and Development (OECD) that contains information from Development Assistance Committee (DAC) countries and International Organizations (IO) We only consider Official Development Assistance (ODA) flows and we do not yet include Other Official Flows (OOF) We also include only aid commitments to priority sectors that reflect MPI indicators[11] in a range of three years from the date of the survey used for each country They add up to $45 billion in 2015 constant USD
Table 3 shows that 28 of the MPI poor live in countries classified as low income Those countries received 42 of the donor flows to priority social sectors But 66 of MPI poor people live in lower middle income countries which receive 49 of these aid flows This is shaped by very low allocations to ndia where each poor person is allocated $135 of aid And 6 of MPI poor people live in upper middle income countries which receive a generous 9 of aid flows The flows from IO are more reflective of the distribution of MPI poor than the DAC flows
Analysis of aid flows to individual countries is also important If we consider ODA from DAC donors which is thought to represent the bulk of development aid the countries that receive very low aid flows in priority social sectors may not be those who need it least One of the countries with the lowest aid flows is a high income country Trinidad and Tobago
Fig 5a Priority sector ODA flows from DAC countries
ODA from DAC countries to priority sectors of 101 countries by income category of recipients
Upper middle income (12)
Lower middle income (44)
Low income (44)
Fig 5b Priority Sector ODA flows from DAC countries and IO
ODA from DAC and IO to priority sectors of 101 countries by income category of recipients
Lower middle income (49)
Upper middle income (9)
Low income (42)
and two are upper middle income countries Algeria and also China ndash which has mobilized tremendous domestic resources and political will for poverty reduction by 2020 But eight lower middle income countries including the most populous in terms of MPI poor such as Pakistan ($230) Nigeria ($140) and India ($064) receive very low allocations in priority social sector aid from DAC countries And nine of the 20 countries in which aid allocation from DAC donors in priority social sectors totals less than $550 per person are low income countries These include Ethiopia ($517)
OPHI Briefing 47 | May 2017
Global Multidimensional Poverty Index 2017
6 7
Total priority sectors
ODA from DAC countries three years previous to country-specific MPI
ODA from IO three years previous to country-specific MPI
ODA from IO and DAC three years previous to country-specific MPI
Share of MPI poor people
Low income
Lower middle income
Upper middle income
Total
441
435
124
100
407
545
49
100
421
494
85
100
28
66
6
100
Table 3 Allocation of ODA from DAC countries and IO for priority sectors and distribution of MPI poor income categories
DAC = Development Assistance Committee (bilateral aid) IO = International Organisations (multilateral aid) including the World Bank regional development banks some UN agencies and other multilateral agencies
Note
Niger ($450) Chad ($210) and Somalia ($210) In each of these four countries over 80 of people are MPI poor The remaining low income countries receive $6 to $32 per MPI poor person from DAC countries
To understand whether and when aid is catalyzing action and further public expenditure to fight poverty in multiple dimensions requires in-depth analysis What is clear is that the distribution of ODA flows differ significantly from the distribution of multidimensionally poor people
GOING UP CLOSE MPI WITHIN MYANMAR AFGHANISTAN AND CHAD
The MPI and its indicators are disaggregated by 988 subnational regions in 78 countries revealing an astonishing subnational diversity The poorest regions are in Chad Burkina Faso Niger Ethiopia South Sudan Nigeria Uganda and Afghanistan
For example in 52 subnational regions from 16 countries over 90 of people are poor ndash 110 million out of the 119 million living in these regions are MPI poor
These disaggregations show subnational diversity Inside Afghanistan poverty rates vary from 25 in Kabul to 95 in Urozgan In Chad itrsquos 53ndash99 In Nigeria the range is a massive 8ndash92 always with capital cities having the lowest MPI Of course the range also depends upon the number and size of the subnational regions
The case studies below profile subnational analyses of Myanmar Afghanistan and Chad
The legend used for the maps is the following
125 ndash 281
282 ndash 452
453 ndash 583
584 ndash 651
652 ndash 843844 ndash 954955 ndash 990
MPI incidence ()
wwwophiorguk
Alkire and Robles
8 9
USERrsquoS GUIDE TO INTERPRETING THE MPI
Sometimes people presume that the MPI is lsquojustrsquo an index ndash one number ndash showing the level of poverty But as these case studies show the MPI is always unpacked in different ways to show who is poor and how they are poor By design the MPI can be lsquobroken downrsquo into interesting consistent and partial subindices Here is a userrsquos guide to interpreting the MPI
Headcount Ratio or Incidence Letrsquos start with the most familiar number the percentage of people who are MPI poor This is called the headcount ratio or incidence of poverty or the lsquopoverty ratersquo For example in Myanmar 301 of people are poor because they are deprived in 3333 or more of the weighted MPI indicators
Intensity This is the average deprivation score among the poor In Myanmar intensity is 446 This means that the poor in Myanmar are on average deprived in 446 of the weighted indicators For example consider Neheso She is deprived in both health indicators as well as in cooking fuel sanitation water flooring and assets Her deprivations are labelled on the left hand side of the chart on the right The height of the boxes shows the weight of each indicator On the right hand side we stack up her deprivations and find that her deprivation score is 60 All poor people have deprivation scores between 3333 and 100 The average of the deprivation scores of all poor people is intensity
The MPI When you multiply 301 x 446 you obtain 0134 This is the MPI for Myanmar It shows that poor people in Myanmar are deprived in 134 of the deprivations that would be experienced if every person in Myanmar was poor and was deprived in all indicators The important thing is that MPI ranges from 0 to 1 and higher levels show higher poverty
How to Reduce MPIMPI goes down if a) somebody becomes non-poor so the incidence of poverty goes down or b) the intensity goes down because a poor person gets rid of a deprivation To accomplish either one though what is needed is to reduce deprivations in any one of the MPIrsquos ten indicators So we need to drill down and see how to do that
The MPI can also be broken down by indicators which is a useful tool for public policy The MPI itself is simply the percentage of people who are poor and deprived in each indicator multiplied by the weight on that indicator You add them up and obtain the value of MPI Remember that health and education indicators are weighted at 16 and living standard at 118 So in Myanmar the MPI
(0134) is also equal to (137+ 117+122+85)(16) + (29+222+113+216+51+14)(118) Visually you can see that the height of the graphic on the bottom left of page 9 is 0134 and each indicator lsquocontributesrsquo to it So if we reduce any depri vation of any poor person in any indicator what happens The height of the MPI goes down
If you prefer you can simply look at the table at the bottom of the page which shows the percentage of people in Myanmar who a) are MPI poor (because they have overlapping deprivations that stack up to one-third or more) and b) are deprived in each indicator For example 122 of people are MPI poor and have no one in their household who has completed five years of schooling We call these the lsquocensored headcount ratiosrsquo of each indicator If any of these very important deprivations goes down MPI goes down The bottom right hand chart on page 9 shows the censored headcount ratios for the Rakhine in Myanmar compared to the national average Similarly the chart on page 11 compares censored headcount ratios for two regions in Chad
These are the fundamental building blocks of the MPI Incidence Intensity Censored Headcount ratios and (weighted) Indicator contributions to MPI If you download the online data tables you will find all of these statistics (and some others) for every single country rural-urban area subnational region and for children But the goal is not just to understand poverty it is to use this information to fight poverty and suffering ndash through better policies and actions
140
Health Education Living Standards
NutritionChild
mortalityYears of
schoolingSchool
attendanceCooking
fuel Sanitation Drinking water Electricity Floor Assets
137 117 122 85 290 222 113 216 51
rarr
67
33
40
50
60
70
80
90
100
10
20
30
0
larr
larr
Hea
lthSt
anda
rd o
f Liv
ing
Nutrition
SanitationWater
Assets
Educ
atio
n
Flooring
Cooking Fuel
Child Mortality
NEHESO IS DEPRIVED IN
wwwophiorguk
8
Alkire and Robles
OPHI Briefing 47 | May 2017
Global Multidimensional Poverty Index 2017
8 9
MYANMAR
Myanmar (DHS 2014ndash15) is home to 53 million people Of these nearly 16 million or 30 are multidimensionally poor The poorest regions are Rakhine in the southwest and Shan and Kayin in the east pictured in the lightest green on the map of multidimensional poverty in Myanmar on the left In Rakhine just over half of the population (51) are multidimensionally poor with particularly high deprivations in nutrition cooking fuel sanitation assets and electricity (see the chart below) Among children aged 0-17 37 of them are poor whereas 26 of adults in Myanmar are MPI poor In rural areas child poverty rises to 44 of children whereas in urban areas itrsquos 14
MYANMAR
Kachin 1901
Shan 3952
Kayah 2303
Kayin 3694
Tanintharyi 2895
Mon 2486
Yangon 1257
Mandalay 24112
Chin 33813
8 Ayeyarwadd 390
10 Rakhine 513
11 Magway 274
Sagaing 31614
9 Bago 306
1
2
3
4
5
6
78
9
1011
1213
14
Multidimensional poverty in Myanmar
Cens
ored
hea
dcou
nt ra
tios
in th
e re
gion
pr
opor
tion
who
is p
oor a
nd d
epriv
ed in
Deprivation among the poor in Myanmar
The composition of poverty among Rakhine state and across Myanmar
60
30
50
20
10
40
0
10
20
30
40
50
60
0
Rakhine Myanmar (national)
Years of schooling
School attendance
Child mortality
Nutrition
Electricity
Sanitation
Drinking water
Floor
Cooking fuel
Assets
H ( MPI poor people)000
002
004
006
008
010
012
014
016
Composition of Myanmarrsquos MPIMPIvalue
Paul
Arp
s | F
lickr
CC
BY
20
wwwophiorguk
Alkire and Robles
10 11
Afghanistanrsquos national MPI is the highest in South Asia and 56 of Afghanis are acutely poor by the MPI Afghanistanrsquos poorest region Urozgan near central Afghanistan has an MPI of 0624 which is larger than the national MPI of Niger and 95 of people are poor This is followed by Nooristan (94) in the northeast and Badghis (79) and Kandahar (72) in the west and south of the country (see the map above) We do not have nutritional data for Afghanistan but 28 of people live in a household where a child has died ndash which is the highest figure for this indicator across every region of the world except Sub-Saharan Africa
Fully 59 of children are multidimensionally poor in Afghanistan and 53 of adults That means Afghanistan has 97 million MPI poor child ren and 75 million poor adults So well over half ndash in fact 56 of Afghanistanrsquos poor people are children Unfortunately 38 of poor people live in a household where a school-aged child is not attending school so attention to childrenrsquos deprivations is of critical importance In terms of region three-quarters of Afghanis live in rural areas where 65 of people are poor In the urban areas poverty rates are lower at 29
1
2
3
45 6 7 8
9
101112
1314
15
16
1718
1920
21
22
23
24 25 2627
2829
3031
32
33 34
AFGHANISTAN AFGHANISTAN
Herat 6331
Badghis 7932
Faryab 4943
Jawzjan 6094
Balkh 5575Kunduz 6056
Takhar 6517
Nooristan 9379
Badakhshan 6758
Ghazni 47416
Zabul 34617
Urozgan 94518Kandahar 72119
Helmand 61820
10 Kunarha 583
11 Laghman 704
12 Nangarhar 549
13 Khost 578
14 Paktya 452
15 Paktika 281
Nimroz 45421
Farah 61422
Ghor 74623
Sar-e Pol 67824
Samangan 64325
Baghlan 59726
Panjsher 25827
Daykundi 61532
Bamyan 61033
28 Kapisa 536
30 Logar 414
31 Wardak 679
Parwan 58634
29 Kabul 253
Multidimensional poverty in Afghanistan
John
Ass
elin
| Fl
ickr
CC
BY-
NC
-ND
20
OPHI Briefing 47 | May 2017
Global Multidimensional Poverty Index 2017
10 11
Chad (DHS 2014ndash15) is the fourth poorest among the 103 countries analyzed Fully 87 of people live in multidimensional poverty Over 80 of the population are poor and lack electricity adequate sanitation flooring and clean cooking fuel and over half (52) of the population are multidimensionally poor and have a school-aged child at home who is not attending school The poorest subnational regions in Chad are the drought-affected regions of Lac Wadi Fira Sila and Kanem In the regions of Lac and Kanem nearly 65 of the population are poor and have at least one malnourished woman or child (see the map above)
It might seem that in such a poor country (in 12 of Chadrsquos 20 regions more than 95 of people are poor) the MPI cannot add much analysis But the indicator details tell a new story Letrsquos compare the two poorest regions Lac and Wadi Fira ndash in which 98ndash99 of people are poor In Lac 34 of people are poor and have experienced the death of a child whereas in Wadi Fira itrsquos much lower at 20 But in Wadi Fira 97 of people lack clean drinking water whereas in Lac itrsquos 64 (the chart below) So clearly even between two extremely poor regions policy responses need to differ
CHAD CHAD
Lac and Wadi Fira Deprivation levels by indicator
Multidimensional poverty in Chad
12
3
4
5
6
789
101112
1314 15
1617
1819
Borkou Tibesti 891
Ennedi 9682Wadi Fira 993Ouaddaiuml 9534
Sila 9895Salamat 9786Moyen Chari 7417
Mayo Kebbi Ouest 86312Mayo Kebbi Est 86113
8 Mandoul 881
10 Logone occidental 791
11 Tandjileacute 843
Chari Baguirmi 96914
9 Logone oriental 881
15 Gueacutera 954
16 Hadjer Lamis 954
17 Lac 981
18 Kanem 98519 Barh El Gazal 957
20 Batha 957
20
YS Years of schooling
School attendance
CM Child mortality
N Nutrition
Electricity
Sanitation
Drinking water
Floor
Cooking fuel
Assets
SA
CF
S
DW
E
F
A
30
50
20
10
0
40
60
70
80
90
100
N CM YS SA CF S DW E F A
Ken
Doe
rr |
Flic
kr C
C B
Y 2
0
wwwophiorguk
Alkire and Robles
12 13
NEWS FLASHMPI DISAGGREGATION BY DISABILITY STATUS SOON TO BE STANDARD
In a recent study we disaggregated the global MPI by disability status for the first time[12] It was not previously possible to disaggregate the global MPI by disability but surveys that include standardized questions on disability are set to increase
Ugandarsquos 2011 Demographic and Health Survey (DHS) pioneered the Washington Group questions on disability a form of which will be included in DHS and Multiple Indicator Cluster Surveys (MICS) from 2017 onwards In Uganda 4 of people aged 5 years and above were living with a disability and 22 of all people live in a household where at least one member lives with a severe disability
As Figure 6 above shows households with at least one member with a severe disability faced higher levels of multidimensional poverty ndash a
77 poverty rate as compared with 69 among households without disability As comparable data become available the global MPI will be disaggregated by disability status in order to track ndash and hopefully to help reduce ndash the interlinkages among these conditions
Fig 6 Incidence of multidimensional poverty in Uganda by disability status
0
01
02
03
04
05
06
07
08
09
03
05
02
01
0
04
06
07
08
09
without disabilitywith disability
Bria
n W
olfe
| Fl
ickr
CC
BY-
NC
20
OPHI Briefing 47 | May 2017
Global Multidimensional Poverty Index 2017
12 13
DESTITUTIONThe distressing condition of destitution
bull Half of the MPI poor people live in destitution
bull In six countries and 117 subnational regions 50 or more of people are destitute
bull Most of the highest levels of destitution are found in Sub-Saharan Africa
bull Pakistan has more destitute people ndash 37 million ndash than East Asia and the Pacific (26 million) or the Arab States (26 million)
bull India has more destitute people (295 million) than Sub-Saharan Africa (282 million)
bull But most of the destitute people ndash 362 of the 706 million ndash live in South Asia
The MPI reflects acute multidimensional poverty in developing countries It measures absolute levels of poverty ndash which are very low in a number of countries such as China and many areas of Latin America For many countries a lsquomoderatersquo measure of multidimensional poverty is needed
Even so since 2014 we have reported a measure of destitution that identifies a subset of the MPI poor who are the poorest of the poor Unfortunately nearly half of all MPI poor people are destitute ndash 706 million men women and children
As with the MPI destitute people are deprived in one-third or more weighted indicators but the destitution indicators are more extreme They include severe malnutrition losing two or more children having a child out of primary school having no household member who has completed more than one year of schooling using open defecation fetching water that is unsafe or 45 or more minutes away not owning even a mobile phone or radio and cooking with wood or dung or straw only[13] To leave no one behind we must take urgent action to end the distressing condition of destitution
Figure 7 on the next page shows the percentage of the population who are MPI poor which is the height of the beige bar and the percentage who are living in destitution which is the height of the red subcomponent At a glance we can see that destitution rates ranges from 0 to 714 of the population What else do we see
First there are pockets of destitution even in low MPI countries In countries like Turkmenistan Bosnia and Herzegovina Barbados Uzbekistan and Azerbaijan 30 or more of MPI poor people are destitute But in South Africa less than 9 of the MPI poor are destitute
Second there are positive stories In 57 countries less than 10 of the population are destitute Similarly 506 subnational regions have less than 10 of the population living in destitution
Third in general destitution rates tend to be lower than $190day extreme income poverty rates But destitution is markedly higher than income poverty in Pakistan Mauritania Sudan Gambia Chad Ethiopia Niger and South Sudan This underscores the importance of measuring and fighting poverty in all its forms and dimensions
In some countries and regions destitution is still lsquothe normrsquo because it affects half of more of the population Six countries have more than 50 of their population living in destitution ndash and together they are home to 100 million poor people Drilling down in 117 subnational regions 50-92 of the population are destitute (161 million) These high destitution regions are mainly located in Sub-Saharan Africa Yet there are pockets of destitution in other regions In East Asia and the Pacific eight regions within Timor LrsquoEste have over 50 of people living in destitution Within the Arab States 58 of people in Sudanrsquos Central Darfur and 50 of people in Yemenrsquos Hajjah regions are destitute Within South Asia Afghanistanrsquos Urozgan Nooristan and Kandahar provinces have 50ndash78 of people living in destitution In Latin America six regions of Haiti plus Potosi in Bolivia have 20ndash36 of people living in destitution
Looking at the high rates of destitution we might presume that destitution is largely an African story But it is not Of the 706 million people who are destitute 362 million live in South Asia and 282 million in Sub-Saharan Africa In addition 26 million live in the Arab States another 26 million live in East Asia and over 8 million live in Latin America plus nearly 300000 in Europe and Central Asia India has over 295 million destitute people more than the total number if destitute people in all of Sub-Saharan Africa And Pakistan has 37 million destitute people according to its 201213 dataset more than either the Arab States or East Asia and the Pacific region
The story of destitution is not over But it should be These figures call for vigorous attention to be focused on destitution in South Asia and in Sub-Saharan Africa ndash and for even low poverty countries to track and empty the pockets of deep poverty in their midst
wwwophiorguk
Alkire and Robles
14 15
Fig 7 Comparing the headcount ratios of MPI poor destitute and $190day poor
$190day poorDestituteMPI poor
20 040 6080100
South SudanNigerEthiopiaChadBurkina FasoSomaliaSierra LeoneBurundiMaliCentral African RepublicGuineaDem Rep of CongoLiberiaUgandaMozambiqueTimor-LesteMadagascarGuinea -BissauBeninGambiaSenegalCote drsquoIvoireTanzaniaZambiaAfghanistanRwandaMalawiSudanNigeriaMauritaniaTogoHaitiCameroonYemenPakistanNamibiaIndiaBangladeshKenyaRep of CongoComorosZimbabweLao Peoplersquos Dem RepGhanaCambodiaLesothoVanuatuMyanmarDjiboutiNepalBhutanGuatemalaBoliviaSao Tome and PrincipeGabonNicaraguaSwazilandHondurasIndonesiaMoroccoTajikistanIraqPhilippinesPeruMongoliaSouth AfricaDominican RepublicViet NamEl SalvadorSurinameTrinidad and TobagoColombiaAzerbaijanBrazilMaldivesBelizeSyrian Arab RepublicChinaEgyptEcuadorGuyanaUzbekistanJamaicaJordanLibyaAlgeriaAlbaniaUkraineMexicoTunisiaPalestineSaint LuciaBarbadosThailandMoldovaMacedoniaBosnia and HerzegovinaKyrgyzstanTurkmenistanArmeniaMontenegro
KazakhstanSerbia
OPHI Briefing 47 | May 2017
Global Multidimensional Poverty Index 2017
14 15
REFERENCESAddis Ababa Accord (2015) lsquoAccord of the Third International Conference on Financing for Development Revised Draft 6 Mayrsquo
Alkire S and Foster J (2011) lsquoCounting and multidimensional poverty measurementrsquo Journal of Public Economics vol 95(7ndash8) pp 476ndash487
Alkire S Dorji L Gyeltshen S and Minten T (2016) Child Poverty in Bhutan Insights from Multidimensional Child Poverty Index and Qualitative Interviews with Poor Children National Statistics Bureau Bhutan
Alkire S and Robles G (2017) lsquoMultidimensional Poverty Index ndash summer 2017 brief methodological note and resultsrsquo OPHI MPI Methodological Notes 44 Oxford Poverty and Human Development Initiative University of Oxford
Alkire S and Santos ME (2014) lsquoMeasuring acute poverty in the developing world robustness and scope of the multidimensional poverty indexrsquo World Development vol 59 pp 251ndash274
Alkire S Jindra C Robles G and Vaz A (2017) lsquoChildrenrsquos multidimensional poverty disaggregating the global MPIrsquo OPHI Briefing 46 Oxford Poverty and Human Development Initiative University of Oxford
Organisation of Economic Cooperation and Development (OECD) (2017) lsquoCreditor reporting system (CRS) aid activity databasersquo Available here (Last accessed on 13 May 2017)
Pinilla-Roncancio M and Alkire S (2017) lsquoHow poor are people with disabilities around the globe A multidimensional perspectiversquo OPHI Research in Progress 48a Oxford Poverty and Human Development Initiative University of Oxford
United Nations (2015) Transforming Our World The 2030 Agenda for Sustainable Development ARES701
NOTES[1] All aggregates use 2013 population data[2] Section 51 paragraph 135[3] Addis Ababa Accord 2015 paragraph 119[4] Discussions are underway to consider whether data permit
adjustments to further align the global MPI with the SDGs[5] This section draws on lsquoChildrenrsquos multidimensional poverty
disaggregating the global MPIrsquo by Alkire et al (2017)[6] As with $190day poverty children are identified as poor
if they live in an MPI poor household Alternatively Child MPIs can be constructed that reflect each individual childrsquos deprivations by gender and age cohort (see Alkire et al 2016) but data are not available to build a global Child MPI with individual child data
[7] $190 is not available for Afghanistan Omitting Afghani stan 414 of people are MPI poor in South Asia
[8] We use income category definitions from July 2016 throughout this document
[9] The global MPI covers 92 of all people living in low or middle income countries It covers 99 of people living in low income countries (29 countries) 99 of the population in lower middle income countries (43) and 82 in upper middle income countries (29)
[10] There is no information on allocation to Macedonia and Palestine For those countries with MPI data from 2016 ODA flows allocated between 2011 and 2015 have been considered For South Sudan with 2010 MPI data ODA flows between 2011 and 2015 are used as this is the closest five-year period available
[11] The categories included are basic education basic health basic drinking water supply and basic sanitation (alone and together) electric power transmission and distribution low-cost housing multisector aid for basic social services developmental food aid and food security assistance
[12] Pinilla and Alkire 2017
[13] The indicators of electricity and flooring are unchanged
ONLINE RESOURCES
OPHIrsquos interactive databank enables you to study over 100 developing countries in terms of multidimensional poverty Choose interactive data visualizations to explore where and in which indicators people are poor or destitute and to show how MPI values compare with complementary data such as $190day poverty Or download a country briefing file for any country which contains explanations of its MPI and is illustrated with graphs maps and charts Excel data tables have all the details of MPI plus population standard errors sample sizes and much more Methodological notes provide any particularities of each countryrsquos survey data treatment
See wwwophiorgukmultidimensional-poverty-index
Oxford Poverty and Human Development Initiative (OPHI)
Oxford Department of International Development (ODID)Queen Elizabeth House (QEH)University of Oxford3 Mansfield Road Oxford OX1 3TBUnited Kingdom
ophi_oxford
ophioxford
ophi_oxford
Telephone+44 (0)1865 271915
Emailophiqehoxacuk
Websitewwwophiorguk
wwwophiorguk
Alkire and Robles
16 PB
MU
LTID
IMEN
SIO
NA
L PO
VERT
Y IN
DEX
ACR
OSS
TH
E W
ORL
D
0 ndash
005
01
ndash 0
2
02
ndash 0
3
03
ndash 0
4
04
ndash 0
5
05
+
005
ndash 0
1
OXFORD POVERTY amp HUMAN DEVELOPMENT INITIATIVE
OPHIT E N Y E A R
OPHIANNIVERSARY

wwwophiorguk
Alkire and Robles
2 3
forms and dimensions including extreme poverty is the greatest global challenge and an indispensable requirement for sustainable developmentrsquo (UN 2015)
Discussions leading up to the SDGs highlighted the need for new poverty measures In December 2014 the UN Secretary General Ban Ki Moon wrote lsquoPoverty measures should reflect the multidimensional nature of povertyrsquo[2]
A United Nations General Assembly Resolution on 19 December 2014 also lsquounderlines the need to better reflect the multidimensional nature of development and povertyrsquo It invites member states and others lsquoto consider developing complementary measurements ndash ones lsquothat better reflect that multidimensionalityrsquo (ARES69238 Paragraph 5) Relatedly the Addis Ababa Accord[3] called on the United Nations and others to lsquorecognize the multidimensional nature of povertyrsquo
Table 1 The global MPI indicators mapped to the SDGs
Dimension Indicator Related SDG
Health
Education
Living Standard
Nutrition
Child Mortality
Years of Education
School Attendance
Cooking Fuel
Sanitation
Drinking Water
Electricity
Floor
Assets
SDG 2 (Zero Hunger)
SDG 3 (Health and Well-being)
SDG 4 (Quality Education)
SDG 4 (Quality Education)
SDG 7 (Affordable and Clean Energy)
SDG 6 (Clean Water and Sanitation)
SDG 6 (Clean Water and Sanitation)
SDG 7 (Affordable and Clean Energy)
SDG 11 (Sustainable Cities and Communities)
SDG 1 (No Poverty)
The global MPI responds to this need for new ways to measure multidimensional poverty And as Table 1 shows the present global MPI reflects core SDGs[4]
Poverty profile Pedro Ecuador
Ass
et O
wne
rshi
p
EducationHealth Standard of Living
Years of Schooling
Child Mortality
Cook
ing
Fuel
Sani
tatio
n
Wat
er
Elec
tric
ity
Floo
ring
10 Indicators
3 Dimensions
Nutrition School Attendance
Pedro is a 38-year-old man who lives in a small town about a one-hour drive on a dirt road west of Cantildear Ecuador He and his wife had five children four of whom survive aged 4 10 16 and 17 They also take care of Pedrorsquos stepfather Pelayo who is 77 years old and unable to work Pelayo used to receive a pension but that ended due to problems with his identity card
Pedro and his wife make about US$10ndash$15 a day But they can find work only one week per month So the family income is only $675 a year They do have electricity and a latrine Water from a hose on an outside patio is a short walk away But their house is has a dirt floor They cook outside with wood in a small rudimentary fireplace They do not own a TV radio or any electrical appliance or even a bicycle They own two head of cattle two pigs and three chickens
Pedro is poor according to the global MPI The coloured boxes in the chart show the deprivations he faces
John
Ham
moc
k | O
PHI
OPHI Briefing 47 | May 2017
Global Multidimensional Poverty Index 2017
2 3
The global MPI looks at poverty through a lsquohigh-resolutionrsquo lens It directly measures the nature and magnitude of overlapping deprivations in health education and living standard for each household The MPI relays vital information on who is poor and how they are poor enabling policymakers to target resources and design policies more effectively
As a measure of acute multidimensional poverty the global MPI offers an essential complement to income poverty indices because it measures and compares deprivations directly It can be broken down by social groups and geographical areas to reveal poverty patterns within countries ndash and by indicators to show which deprivations drive poverty in different regions It can also be used to track changes in poverty over time
The global MPI was developed in 2010 by the Oxford Poverty and Human Development Initiative (OPHI) and the United Nations Development Programme (UNDP) for the UNDPrsquos flagship Human Development Reports 2010ndash2015 (Alkire and Santos 2014) The figures and analysis are updated by OPHI using newly released data twice per year In 2018 we may further align the global MPI with the SDGs A measure of lsquomoderatersquo poverty may be developed to reflect challenges in countries that have low levels of acute poverty according to the global MPI
INSIDE THE MPI THREE DIMENSIONS TEN INDICATORSWho is poor A person is identified as multidimensionally poor (or lsquoMPI poorrsquo) if she is deprived in at least one third of the weighted MPI indicators set out in Figure 1
WHAT IS THE GLOBAL MPI CONSTRUCTING THE GLOBAL MPIThe global MPI was created using a method developed by Alkire and Foster (2011) The Alkire Foster method is flexible and can be used with different dimensions indicators weights and cutoffs to create measures specific to different societies and situations
The MPI is the product of incidence and intensity
MPI = H x A
bull Incidence is the percentage of people who are poor (or the headcount ratio H)
bull Intensity is the average share of indicators in which poor people are deprived (A)
ThreeDimensions
of Poverty
Nutrition
Child Mortality
Years of Schooling
School Attendance
Cooking FuelImproved SanitationSafe Drinking WaterElectricityFlooringAsset Ownership
Health
Education
LivingStandard
Fig 1 Dimensions and indicators of global MPI
Table 2 The dimensions indicators deprivation thresholds and weights of the MPI
Dimension Indicator Deprived if
Health
Education
Living Standard
Nutrition
Child Mortality
Years of Education
School Attendance
Cooking Fuel
Sanitation
Drinking Water
Electricity
Floor
Assets
Any adult or child for whom there is nutritional information is malnourished
Any child has died in the household within the last five years
No household member has completed five years of schooling
Any school-aged child is not attending school up to the age at which they would complete class 8
The household cooks with dung wood or charcoal
The householdrsquos sanitation facility is not improved (according to SDG guidelines) or it is improved but shared with other households
The household does not have access to safe drinking water (according to SDG guidelines) or safe drinking water is a 30-minute or longer walk from home roundtrip
The household has no electricity
The household has a dirt sand or dung floor
The household does not own more than one radio TV telephone bike motorbike or refrigerator and does not own a car or truck
Relative weight
16
16
16
16
118
118
118
118
118
118
wwwophiorguk
Alkire and Robles
4 5
WHO ARE THE POOR AND WHERE DO THEY LIVE
Half of MPI poor people are children[5]
When we disaggregate the MPI by children we find child poverty to be strikingly high[6] Of the 145 billion people who are multidimensionally poor 48 are children That is a total of 689 million children who live in multidimensional poverty And poverty rates are higher among children 37 of children are poor whereas 23 of adults aged 18 and above are poor
Disaggregating the global MPI by children we find
Half of all multidimensionally poor people ndash 48 ndash are children
Nearly two out of every five children ndash 37 ndash are multidimensionally poor This means 689 million children are living in multidimensional poverty
Most MPI poor children live in South Asia (44) and in Sub-Saharan Africa (43)
In 36 countries including India at least half of all children are MPI poor
bull
bull
bull
bull
In Ethiopia Niger and South Sudan over 90 of children are MPI poor
Half of MPI poor children live in lsquoalertrsquo level fragile states and child poverty levels are the highest in the worst of the fragile states
Two-thirds of poor children live in middle income countries
Poor children are on average deprived in 52 of weighted indicators
As Figure 2 shows the most common deprivations children face are in cooking fuel sanitation flooring malnutrition and electricity
bull
bull
bull
bull
bull
Figure 2 shows the proportion of people who are poor and deprived in each indicator Childrenrsquos deprivations are significantly higher in each of the ten indicators
40
35
30
25
20
15
10
5
0
Proportion of individuals poor and deprived in
Years of schooling
School attendance
Child mortality
Nutrition ElectricitySanitation Water FloorCooking fuel
Assets
1314
5
18
9
22
13
22
10
30
1615
8
26
14
35
1917
9
Children 0 ndash17 Adults 18+
Fig 2 Child and adult deprivations in ten MPI indicators
7
OPHI Briefing 47 | May 2017
Global Multidimensional Poverty Index 2017
4 5
Half of MPI poor people live in South AsiaAbout half of the MPI poor live in South Asia (48) and 36 live in Sub-Saharan Africa This is a different distribution from $190day income poverty estimations aggregated in the same
way ndash because MPI is higher in South Asia In South Asia 416 of the population are MPI poor and 192 are poor by the extreme income poverty measure ndash so the rate is more than doubled[7] In Sub-Saharan Africa multidimensional poverty affects 601 of the population $190day poverty 464 so MPI poverty is one-third higher
Over one billion MPI poor people live in middle income countries[8]
Over one billion people ndash almost three quarters of all multi-dimensionally poor people (72) ndash live in middle income
countries Of these 86 million poor people live in in upper middle income countries and 961 million in lower middle income countries[9] What is striking is that the income cate-gories have overlapping levels of multi dimensio nal poverty In upper middle income countries the incidence of MPI varies from 0ndash42 in lower middle income countries itrsquos 0ndash68 and in low income countries 29ndash91 of national
Fig 4a Distribution of population by income category
Fig 4b Distribution of MPI poor persons by income category
Fig 3a Distribution of population by region
Sub-Saharan Africa (16)
Europe and Central Asia (2)
Latin America and Caribbean (9)
South Asia (31)
Arab States (6)
East Asia and the Pacific (36)
Fig 3b Distribution of MPI poor persons by region
Sub-Saharan Africa (36)
Europe and Central Asia (0)
Latin America and Caribbean (2)
East Asia and the Pacific (10)
Arab States (4)
South Asia (48)
Upper middle income (6)
High income non-OECD (0)
Low income (28)
Lower middle income (66)
Upper middle income (35)
High income non-OECD (0)
Low income (10)
Lower middle income (52)
wwwophiorguk
Alkire and Robles
6 7
populations live in acute multidimensional poverty When we focused on subnational regions the incidence of MPI varies from 0ndash74 in upper middle income countries from 0ndash92 in lower middle income countries and from 4ndash99 in low income countries
International aid and multidimensional poverty Differently distributedAid flows are complex and are only part of any poverty reduction strategy Measured in international currencies they do not reflect the unit costs of reducing a deprivation They must be analyzed alongside national public expenditures and other flows they supplement Yet the MPI portrays acute multidimensional poverty and unmet needs for public health and nutrition inputs basic education water sanitation housing electricity and other needs So a natural question is to what extent is the aid that deliberately targets those priority sectors flowing to the places where people who experience these overlapping deprivations live
To start such a conversation we describe aid allocations for 101 of the countries included in the global MPI 2017[10] using the information in the Creditor Reporting System (CRS) from the Organisation of Economic Cooperation and Development (OECD) that contains information from Development Assistance Committee (DAC) countries and International Organizations (IO) We only consider Official Development Assistance (ODA) flows and we do not yet include Other Official Flows (OOF) We also include only aid commitments to priority sectors that reflect MPI indicators[11] in a range of three years from the date of the survey used for each country They add up to $45 billion in 2015 constant USD
Table 3 shows that 28 of the MPI poor live in countries classified as low income Those countries received 42 of the donor flows to priority social sectors But 66 of MPI poor people live in lower middle income countries which receive 49 of these aid flows This is shaped by very low allocations to ndia where each poor person is allocated $135 of aid And 6 of MPI poor people live in upper middle income countries which receive a generous 9 of aid flows The flows from IO are more reflective of the distribution of MPI poor than the DAC flows
Analysis of aid flows to individual countries is also important If we consider ODA from DAC donors which is thought to represent the bulk of development aid the countries that receive very low aid flows in priority social sectors may not be those who need it least One of the countries with the lowest aid flows is a high income country Trinidad and Tobago
Fig 5a Priority sector ODA flows from DAC countries
ODA from DAC countries to priority sectors of 101 countries by income category of recipients
Upper middle income (12)
Lower middle income (44)
Low income (44)
Fig 5b Priority Sector ODA flows from DAC countries and IO
ODA from DAC and IO to priority sectors of 101 countries by income category of recipients
Lower middle income (49)
Upper middle income (9)
Low income (42)
and two are upper middle income countries Algeria and also China ndash which has mobilized tremendous domestic resources and political will for poverty reduction by 2020 But eight lower middle income countries including the most populous in terms of MPI poor such as Pakistan ($230) Nigeria ($140) and India ($064) receive very low allocations in priority social sector aid from DAC countries And nine of the 20 countries in which aid allocation from DAC donors in priority social sectors totals less than $550 per person are low income countries These include Ethiopia ($517)
OPHI Briefing 47 | May 2017
Global Multidimensional Poverty Index 2017
6 7
Total priority sectors
ODA from DAC countries three years previous to country-specific MPI
ODA from IO three years previous to country-specific MPI
ODA from IO and DAC three years previous to country-specific MPI
Share of MPI poor people
Low income
Lower middle income
Upper middle income
Total
441
435
124
100
407
545
49
100
421
494
85
100
28
66
6
100
Table 3 Allocation of ODA from DAC countries and IO for priority sectors and distribution of MPI poor income categories
DAC = Development Assistance Committee (bilateral aid) IO = International Organisations (multilateral aid) including the World Bank regional development banks some UN agencies and other multilateral agencies
Note
Niger ($450) Chad ($210) and Somalia ($210) In each of these four countries over 80 of people are MPI poor The remaining low income countries receive $6 to $32 per MPI poor person from DAC countries
To understand whether and when aid is catalyzing action and further public expenditure to fight poverty in multiple dimensions requires in-depth analysis What is clear is that the distribution of ODA flows differ significantly from the distribution of multidimensionally poor people
GOING UP CLOSE MPI WITHIN MYANMAR AFGHANISTAN AND CHAD
The MPI and its indicators are disaggregated by 988 subnational regions in 78 countries revealing an astonishing subnational diversity The poorest regions are in Chad Burkina Faso Niger Ethiopia South Sudan Nigeria Uganda and Afghanistan
For example in 52 subnational regions from 16 countries over 90 of people are poor ndash 110 million out of the 119 million living in these regions are MPI poor
These disaggregations show subnational diversity Inside Afghanistan poverty rates vary from 25 in Kabul to 95 in Urozgan In Chad itrsquos 53ndash99 In Nigeria the range is a massive 8ndash92 always with capital cities having the lowest MPI Of course the range also depends upon the number and size of the subnational regions
The case studies below profile subnational analyses of Myanmar Afghanistan and Chad
The legend used for the maps is the following
125 ndash 281
282 ndash 452
453 ndash 583
584 ndash 651
652 ndash 843844 ndash 954955 ndash 990
MPI incidence ()
wwwophiorguk
Alkire and Robles
8 9
USERrsquoS GUIDE TO INTERPRETING THE MPI
Sometimes people presume that the MPI is lsquojustrsquo an index ndash one number ndash showing the level of poverty But as these case studies show the MPI is always unpacked in different ways to show who is poor and how they are poor By design the MPI can be lsquobroken downrsquo into interesting consistent and partial subindices Here is a userrsquos guide to interpreting the MPI
Headcount Ratio or Incidence Letrsquos start with the most familiar number the percentage of people who are MPI poor This is called the headcount ratio or incidence of poverty or the lsquopoverty ratersquo For example in Myanmar 301 of people are poor because they are deprived in 3333 or more of the weighted MPI indicators
Intensity This is the average deprivation score among the poor In Myanmar intensity is 446 This means that the poor in Myanmar are on average deprived in 446 of the weighted indicators For example consider Neheso She is deprived in both health indicators as well as in cooking fuel sanitation water flooring and assets Her deprivations are labelled on the left hand side of the chart on the right The height of the boxes shows the weight of each indicator On the right hand side we stack up her deprivations and find that her deprivation score is 60 All poor people have deprivation scores between 3333 and 100 The average of the deprivation scores of all poor people is intensity
The MPI When you multiply 301 x 446 you obtain 0134 This is the MPI for Myanmar It shows that poor people in Myanmar are deprived in 134 of the deprivations that would be experienced if every person in Myanmar was poor and was deprived in all indicators The important thing is that MPI ranges from 0 to 1 and higher levels show higher poverty
How to Reduce MPIMPI goes down if a) somebody becomes non-poor so the incidence of poverty goes down or b) the intensity goes down because a poor person gets rid of a deprivation To accomplish either one though what is needed is to reduce deprivations in any one of the MPIrsquos ten indicators So we need to drill down and see how to do that
The MPI can also be broken down by indicators which is a useful tool for public policy The MPI itself is simply the percentage of people who are poor and deprived in each indicator multiplied by the weight on that indicator You add them up and obtain the value of MPI Remember that health and education indicators are weighted at 16 and living standard at 118 So in Myanmar the MPI
(0134) is also equal to (137+ 117+122+85)(16) + (29+222+113+216+51+14)(118) Visually you can see that the height of the graphic on the bottom left of page 9 is 0134 and each indicator lsquocontributesrsquo to it So if we reduce any depri vation of any poor person in any indicator what happens The height of the MPI goes down
If you prefer you can simply look at the table at the bottom of the page which shows the percentage of people in Myanmar who a) are MPI poor (because they have overlapping deprivations that stack up to one-third or more) and b) are deprived in each indicator For example 122 of people are MPI poor and have no one in their household who has completed five years of schooling We call these the lsquocensored headcount ratiosrsquo of each indicator If any of these very important deprivations goes down MPI goes down The bottom right hand chart on page 9 shows the censored headcount ratios for the Rakhine in Myanmar compared to the national average Similarly the chart on page 11 compares censored headcount ratios for two regions in Chad
These are the fundamental building blocks of the MPI Incidence Intensity Censored Headcount ratios and (weighted) Indicator contributions to MPI If you download the online data tables you will find all of these statistics (and some others) for every single country rural-urban area subnational region and for children But the goal is not just to understand poverty it is to use this information to fight poverty and suffering ndash through better policies and actions
140
Health Education Living Standards
NutritionChild
mortalityYears of
schoolingSchool
attendanceCooking
fuel Sanitation Drinking water Electricity Floor Assets
137 117 122 85 290 222 113 216 51
rarr
67
33
40
50
60
70
80
90
100
10
20
30
0
larr
larr
Hea
lthSt
anda
rd o
f Liv
ing
Nutrition
SanitationWater
Assets
Educ
atio
n
Flooring
Cooking Fuel
Child Mortality
NEHESO IS DEPRIVED IN
wwwophiorguk
8
Alkire and Robles
OPHI Briefing 47 | May 2017
Global Multidimensional Poverty Index 2017
8 9
MYANMAR
Myanmar (DHS 2014ndash15) is home to 53 million people Of these nearly 16 million or 30 are multidimensionally poor The poorest regions are Rakhine in the southwest and Shan and Kayin in the east pictured in the lightest green on the map of multidimensional poverty in Myanmar on the left In Rakhine just over half of the population (51) are multidimensionally poor with particularly high deprivations in nutrition cooking fuel sanitation assets and electricity (see the chart below) Among children aged 0-17 37 of them are poor whereas 26 of adults in Myanmar are MPI poor In rural areas child poverty rises to 44 of children whereas in urban areas itrsquos 14
MYANMAR
Kachin 1901
Shan 3952
Kayah 2303
Kayin 3694
Tanintharyi 2895
Mon 2486
Yangon 1257
Mandalay 24112
Chin 33813
8 Ayeyarwadd 390
10 Rakhine 513
11 Magway 274
Sagaing 31614
9 Bago 306
1
2
3
4
5
6
78
9
1011
1213
14
Multidimensional poverty in Myanmar
Cens
ored
hea
dcou
nt ra
tios
in th
e re
gion
pr
opor
tion
who
is p
oor a
nd d
epriv
ed in
Deprivation among the poor in Myanmar
The composition of poverty among Rakhine state and across Myanmar
60
30
50
20
10
40
0
10
20
30
40
50
60
0
Rakhine Myanmar (national)
Years of schooling
School attendance
Child mortality
Nutrition
Electricity
Sanitation
Drinking water
Floor
Cooking fuel
Assets
H ( MPI poor people)000
002
004
006
008
010
012
014
016
Composition of Myanmarrsquos MPIMPIvalue
Paul
Arp
s | F
lickr
CC
BY
20
wwwophiorguk
Alkire and Robles
10 11
Afghanistanrsquos national MPI is the highest in South Asia and 56 of Afghanis are acutely poor by the MPI Afghanistanrsquos poorest region Urozgan near central Afghanistan has an MPI of 0624 which is larger than the national MPI of Niger and 95 of people are poor This is followed by Nooristan (94) in the northeast and Badghis (79) and Kandahar (72) in the west and south of the country (see the map above) We do not have nutritional data for Afghanistan but 28 of people live in a household where a child has died ndash which is the highest figure for this indicator across every region of the world except Sub-Saharan Africa
Fully 59 of children are multidimensionally poor in Afghanistan and 53 of adults That means Afghanistan has 97 million MPI poor child ren and 75 million poor adults So well over half ndash in fact 56 of Afghanistanrsquos poor people are children Unfortunately 38 of poor people live in a household where a school-aged child is not attending school so attention to childrenrsquos deprivations is of critical importance In terms of region three-quarters of Afghanis live in rural areas where 65 of people are poor In the urban areas poverty rates are lower at 29
1
2
3
45 6 7 8
9
101112
1314
15
16
1718
1920
21
22
23
24 25 2627
2829
3031
32
33 34
AFGHANISTAN AFGHANISTAN
Herat 6331
Badghis 7932
Faryab 4943
Jawzjan 6094
Balkh 5575Kunduz 6056
Takhar 6517
Nooristan 9379
Badakhshan 6758
Ghazni 47416
Zabul 34617
Urozgan 94518Kandahar 72119
Helmand 61820
10 Kunarha 583
11 Laghman 704
12 Nangarhar 549
13 Khost 578
14 Paktya 452
15 Paktika 281
Nimroz 45421
Farah 61422
Ghor 74623
Sar-e Pol 67824
Samangan 64325
Baghlan 59726
Panjsher 25827
Daykundi 61532
Bamyan 61033
28 Kapisa 536
30 Logar 414
31 Wardak 679
Parwan 58634
29 Kabul 253
Multidimensional poverty in Afghanistan
John
Ass
elin
| Fl
ickr
CC
BY-
NC
-ND
20
OPHI Briefing 47 | May 2017
Global Multidimensional Poverty Index 2017
10 11
Chad (DHS 2014ndash15) is the fourth poorest among the 103 countries analyzed Fully 87 of people live in multidimensional poverty Over 80 of the population are poor and lack electricity adequate sanitation flooring and clean cooking fuel and over half (52) of the population are multidimensionally poor and have a school-aged child at home who is not attending school The poorest subnational regions in Chad are the drought-affected regions of Lac Wadi Fira Sila and Kanem In the regions of Lac and Kanem nearly 65 of the population are poor and have at least one malnourished woman or child (see the map above)
It might seem that in such a poor country (in 12 of Chadrsquos 20 regions more than 95 of people are poor) the MPI cannot add much analysis But the indicator details tell a new story Letrsquos compare the two poorest regions Lac and Wadi Fira ndash in which 98ndash99 of people are poor In Lac 34 of people are poor and have experienced the death of a child whereas in Wadi Fira itrsquos much lower at 20 But in Wadi Fira 97 of people lack clean drinking water whereas in Lac itrsquos 64 (the chart below) So clearly even between two extremely poor regions policy responses need to differ
CHAD CHAD
Lac and Wadi Fira Deprivation levels by indicator
Multidimensional poverty in Chad
12
3
4
5
6
789
101112
1314 15
1617
1819
Borkou Tibesti 891
Ennedi 9682Wadi Fira 993Ouaddaiuml 9534
Sila 9895Salamat 9786Moyen Chari 7417
Mayo Kebbi Ouest 86312Mayo Kebbi Est 86113
8 Mandoul 881
10 Logone occidental 791
11 Tandjileacute 843
Chari Baguirmi 96914
9 Logone oriental 881
15 Gueacutera 954
16 Hadjer Lamis 954
17 Lac 981
18 Kanem 98519 Barh El Gazal 957
20 Batha 957
20
YS Years of schooling
School attendance
CM Child mortality
N Nutrition
Electricity
Sanitation
Drinking water
Floor
Cooking fuel
Assets
SA
CF
S
DW
E
F
A
30
50
20
10
0
40
60
70
80
90
100
N CM YS SA CF S DW E F A
Ken
Doe
rr |
Flic
kr C
C B
Y 2
0
wwwophiorguk
Alkire and Robles
12 13
NEWS FLASHMPI DISAGGREGATION BY DISABILITY STATUS SOON TO BE STANDARD
In a recent study we disaggregated the global MPI by disability status for the first time[12] It was not previously possible to disaggregate the global MPI by disability but surveys that include standardized questions on disability are set to increase
Ugandarsquos 2011 Demographic and Health Survey (DHS) pioneered the Washington Group questions on disability a form of which will be included in DHS and Multiple Indicator Cluster Surveys (MICS) from 2017 onwards In Uganda 4 of people aged 5 years and above were living with a disability and 22 of all people live in a household where at least one member lives with a severe disability
As Figure 6 above shows households with at least one member with a severe disability faced higher levels of multidimensional poverty ndash a
77 poverty rate as compared with 69 among households without disability As comparable data become available the global MPI will be disaggregated by disability status in order to track ndash and hopefully to help reduce ndash the interlinkages among these conditions
Fig 6 Incidence of multidimensional poverty in Uganda by disability status
0
01
02
03
04
05
06
07
08
09
03
05
02
01
0
04
06
07
08
09
without disabilitywith disability
Bria
n W
olfe
| Fl
ickr
CC
BY-
NC
20
OPHI Briefing 47 | May 2017
Global Multidimensional Poverty Index 2017
12 13
DESTITUTIONThe distressing condition of destitution
bull Half of the MPI poor people live in destitution
bull In six countries and 117 subnational regions 50 or more of people are destitute
bull Most of the highest levels of destitution are found in Sub-Saharan Africa
bull Pakistan has more destitute people ndash 37 million ndash than East Asia and the Pacific (26 million) or the Arab States (26 million)
bull India has more destitute people (295 million) than Sub-Saharan Africa (282 million)
bull But most of the destitute people ndash 362 of the 706 million ndash live in South Asia
The MPI reflects acute multidimensional poverty in developing countries It measures absolute levels of poverty ndash which are very low in a number of countries such as China and many areas of Latin America For many countries a lsquomoderatersquo measure of multidimensional poverty is needed
Even so since 2014 we have reported a measure of destitution that identifies a subset of the MPI poor who are the poorest of the poor Unfortunately nearly half of all MPI poor people are destitute ndash 706 million men women and children
As with the MPI destitute people are deprived in one-third or more weighted indicators but the destitution indicators are more extreme They include severe malnutrition losing two or more children having a child out of primary school having no household member who has completed more than one year of schooling using open defecation fetching water that is unsafe or 45 or more minutes away not owning even a mobile phone or radio and cooking with wood or dung or straw only[13] To leave no one behind we must take urgent action to end the distressing condition of destitution
Figure 7 on the next page shows the percentage of the population who are MPI poor which is the height of the beige bar and the percentage who are living in destitution which is the height of the red subcomponent At a glance we can see that destitution rates ranges from 0 to 714 of the population What else do we see
First there are pockets of destitution even in low MPI countries In countries like Turkmenistan Bosnia and Herzegovina Barbados Uzbekistan and Azerbaijan 30 or more of MPI poor people are destitute But in South Africa less than 9 of the MPI poor are destitute
Second there are positive stories In 57 countries less than 10 of the population are destitute Similarly 506 subnational regions have less than 10 of the population living in destitution
Third in general destitution rates tend to be lower than $190day extreme income poverty rates But destitution is markedly higher than income poverty in Pakistan Mauritania Sudan Gambia Chad Ethiopia Niger and South Sudan This underscores the importance of measuring and fighting poverty in all its forms and dimensions
In some countries and regions destitution is still lsquothe normrsquo because it affects half of more of the population Six countries have more than 50 of their population living in destitution ndash and together they are home to 100 million poor people Drilling down in 117 subnational regions 50-92 of the population are destitute (161 million) These high destitution regions are mainly located in Sub-Saharan Africa Yet there are pockets of destitution in other regions In East Asia and the Pacific eight regions within Timor LrsquoEste have over 50 of people living in destitution Within the Arab States 58 of people in Sudanrsquos Central Darfur and 50 of people in Yemenrsquos Hajjah regions are destitute Within South Asia Afghanistanrsquos Urozgan Nooristan and Kandahar provinces have 50ndash78 of people living in destitution In Latin America six regions of Haiti plus Potosi in Bolivia have 20ndash36 of people living in destitution
Looking at the high rates of destitution we might presume that destitution is largely an African story But it is not Of the 706 million people who are destitute 362 million live in South Asia and 282 million in Sub-Saharan Africa In addition 26 million live in the Arab States another 26 million live in East Asia and over 8 million live in Latin America plus nearly 300000 in Europe and Central Asia India has over 295 million destitute people more than the total number if destitute people in all of Sub-Saharan Africa And Pakistan has 37 million destitute people according to its 201213 dataset more than either the Arab States or East Asia and the Pacific region
The story of destitution is not over But it should be These figures call for vigorous attention to be focused on destitution in South Asia and in Sub-Saharan Africa ndash and for even low poverty countries to track and empty the pockets of deep poverty in their midst
wwwophiorguk
Alkire and Robles
14 15
Fig 7 Comparing the headcount ratios of MPI poor destitute and $190day poor
$190day poorDestituteMPI poor
20 040 6080100
South SudanNigerEthiopiaChadBurkina FasoSomaliaSierra LeoneBurundiMaliCentral African RepublicGuineaDem Rep of CongoLiberiaUgandaMozambiqueTimor-LesteMadagascarGuinea -BissauBeninGambiaSenegalCote drsquoIvoireTanzaniaZambiaAfghanistanRwandaMalawiSudanNigeriaMauritaniaTogoHaitiCameroonYemenPakistanNamibiaIndiaBangladeshKenyaRep of CongoComorosZimbabweLao Peoplersquos Dem RepGhanaCambodiaLesothoVanuatuMyanmarDjiboutiNepalBhutanGuatemalaBoliviaSao Tome and PrincipeGabonNicaraguaSwazilandHondurasIndonesiaMoroccoTajikistanIraqPhilippinesPeruMongoliaSouth AfricaDominican RepublicViet NamEl SalvadorSurinameTrinidad and TobagoColombiaAzerbaijanBrazilMaldivesBelizeSyrian Arab RepublicChinaEgyptEcuadorGuyanaUzbekistanJamaicaJordanLibyaAlgeriaAlbaniaUkraineMexicoTunisiaPalestineSaint LuciaBarbadosThailandMoldovaMacedoniaBosnia and HerzegovinaKyrgyzstanTurkmenistanArmeniaMontenegro
KazakhstanSerbia
OPHI Briefing 47 | May 2017
Global Multidimensional Poverty Index 2017
14 15
REFERENCESAddis Ababa Accord (2015) lsquoAccord of the Third International Conference on Financing for Development Revised Draft 6 Mayrsquo
Alkire S and Foster J (2011) lsquoCounting and multidimensional poverty measurementrsquo Journal of Public Economics vol 95(7ndash8) pp 476ndash487
Alkire S Dorji L Gyeltshen S and Minten T (2016) Child Poverty in Bhutan Insights from Multidimensional Child Poverty Index and Qualitative Interviews with Poor Children National Statistics Bureau Bhutan
Alkire S and Robles G (2017) lsquoMultidimensional Poverty Index ndash summer 2017 brief methodological note and resultsrsquo OPHI MPI Methodological Notes 44 Oxford Poverty and Human Development Initiative University of Oxford
Alkire S and Santos ME (2014) lsquoMeasuring acute poverty in the developing world robustness and scope of the multidimensional poverty indexrsquo World Development vol 59 pp 251ndash274
Alkire S Jindra C Robles G and Vaz A (2017) lsquoChildrenrsquos multidimensional poverty disaggregating the global MPIrsquo OPHI Briefing 46 Oxford Poverty and Human Development Initiative University of Oxford
Organisation of Economic Cooperation and Development (OECD) (2017) lsquoCreditor reporting system (CRS) aid activity databasersquo Available here (Last accessed on 13 May 2017)
Pinilla-Roncancio M and Alkire S (2017) lsquoHow poor are people with disabilities around the globe A multidimensional perspectiversquo OPHI Research in Progress 48a Oxford Poverty and Human Development Initiative University of Oxford
United Nations (2015) Transforming Our World The 2030 Agenda for Sustainable Development ARES701
NOTES[1] All aggregates use 2013 population data[2] Section 51 paragraph 135[3] Addis Ababa Accord 2015 paragraph 119[4] Discussions are underway to consider whether data permit
adjustments to further align the global MPI with the SDGs[5] This section draws on lsquoChildrenrsquos multidimensional poverty
disaggregating the global MPIrsquo by Alkire et al (2017)[6] As with $190day poverty children are identified as poor
if they live in an MPI poor household Alternatively Child MPIs can be constructed that reflect each individual childrsquos deprivations by gender and age cohort (see Alkire et al 2016) but data are not available to build a global Child MPI with individual child data
[7] $190 is not available for Afghanistan Omitting Afghani stan 414 of people are MPI poor in South Asia
[8] We use income category definitions from July 2016 throughout this document
[9] The global MPI covers 92 of all people living in low or middle income countries It covers 99 of people living in low income countries (29 countries) 99 of the population in lower middle income countries (43) and 82 in upper middle income countries (29)
[10] There is no information on allocation to Macedonia and Palestine For those countries with MPI data from 2016 ODA flows allocated between 2011 and 2015 have been considered For South Sudan with 2010 MPI data ODA flows between 2011 and 2015 are used as this is the closest five-year period available
[11] The categories included are basic education basic health basic drinking water supply and basic sanitation (alone and together) electric power transmission and distribution low-cost housing multisector aid for basic social services developmental food aid and food security assistance
[12] Pinilla and Alkire 2017
[13] The indicators of electricity and flooring are unchanged
ONLINE RESOURCES
OPHIrsquos interactive databank enables you to study over 100 developing countries in terms of multidimensional poverty Choose interactive data visualizations to explore where and in which indicators people are poor or destitute and to show how MPI values compare with complementary data such as $190day poverty Or download a country briefing file for any country which contains explanations of its MPI and is illustrated with graphs maps and charts Excel data tables have all the details of MPI plus population standard errors sample sizes and much more Methodological notes provide any particularities of each countryrsquos survey data treatment
See wwwophiorgukmultidimensional-poverty-index
Oxford Poverty and Human Development Initiative (OPHI)
Oxford Department of International Development (ODID)Queen Elizabeth House (QEH)University of Oxford3 Mansfield Road Oxford OX1 3TBUnited Kingdom
ophi_oxford
ophioxford
ophi_oxford
Telephone+44 (0)1865 271915
Emailophiqehoxacuk
Websitewwwophiorguk
wwwophiorguk
Alkire and Robles
16 PB
MU
LTID
IMEN
SIO
NA
L PO
VERT
Y IN
DEX
ACR
OSS
TH
E W
ORL
D
0 ndash
005
01
ndash 0
2
02
ndash 0
3
03
ndash 0
4
04
ndash 0
5
05
+
005
ndash 0
1
OXFORD POVERTY amp HUMAN DEVELOPMENT INITIATIVE
OPHIT E N Y E A R
OPHIANNIVERSARY

OPHI Briefing 47 | May 2017
Global Multidimensional Poverty Index 2017
2 3
The global MPI looks at poverty through a lsquohigh-resolutionrsquo lens It directly measures the nature and magnitude of overlapping deprivations in health education and living standard for each household The MPI relays vital information on who is poor and how they are poor enabling policymakers to target resources and design policies more effectively
As a measure of acute multidimensional poverty the global MPI offers an essential complement to income poverty indices because it measures and compares deprivations directly It can be broken down by social groups and geographical areas to reveal poverty patterns within countries ndash and by indicators to show which deprivations drive poverty in different regions It can also be used to track changes in poverty over time
The global MPI was developed in 2010 by the Oxford Poverty and Human Development Initiative (OPHI) and the United Nations Development Programme (UNDP) for the UNDPrsquos flagship Human Development Reports 2010ndash2015 (Alkire and Santos 2014) The figures and analysis are updated by OPHI using newly released data twice per year In 2018 we may further align the global MPI with the SDGs A measure of lsquomoderatersquo poverty may be developed to reflect challenges in countries that have low levels of acute poverty according to the global MPI
INSIDE THE MPI THREE DIMENSIONS TEN INDICATORSWho is poor A person is identified as multidimensionally poor (or lsquoMPI poorrsquo) if she is deprived in at least one third of the weighted MPI indicators set out in Figure 1
WHAT IS THE GLOBAL MPI CONSTRUCTING THE GLOBAL MPIThe global MPI was created using a method developed by Alkire and Foster (2011) The Alkire Foster method is flexible and can be used with different dimensions indicators weights and cutoffs to create measures specific to different societies and situations
The MPI is the product of incidence and intensity
MPI = H x A
bull Incidence is the percentage of people who are poor (or the headcount ratio H)
bull Intensity is the average share of indicators in which poor people are deprived (A)
ThreeDimensions
of Poverty
Nutrition
Child Mortality
Years of Schooling
School Attendance
Cooking FuelImproved SanitationSafe Drinking WaterElectricityFlooringAsset Ownership
Health
Education
LivingStandard
Fig 1 Dimensions and indicators of global MPI
Table 2 The dimensions indicators deprivation thresholds and weights of the MPI
Dimension Indicator Deprived if
Health
Education
Living Standard
Nutrition
Child Mortality
Years of Education
School Attendance
Cooking Fuel
Sanitation
Drinking Water
Electricity
Floor
Assets
Any adult or child for whom there is nutritional information is malnourished
Any child has died in the household within the last five years
No household member has completed five years of schooling
Any school-aged child is not attending school up to the age at which they would complete class 8
The household cooks with dung wood or charcoal
The householdrsquos sanitation facility is not improved (according to SDG guidelines) or it is improved but shared with other households
The household does not have access to safe drinking water (according to SDG guidelines) or safe drinking water is a 30-minute or longer walk from home roundtrip
The household has no electricity
The household has a dirt sand or dung floor
The household does not own more than one radio TV telephone bike motorbike or refrigerator and does not own a car or truck
Relative weight
16
16
16
16
118
118
118
118
118
118
wwwophiorguk
Alkire and Robles
4 5
WHO ARE THE POOR AND WHERE DO THEY LIVE
Half of MPI poor people are children[5]
When we disaggregate the MPI by children we find child poverty to be strikingly high[6] Of the 145 billion people who are multidimensionally poor 48 are children That is a total of 689 million children who live in multidimensional poverty And poverty rates are higher among children 37 of children are poor whereas 23 of adults aged 18 and above are poor
Disaggregating the global MPI by children we find
Half of all multidimensionally poor people ndash 48 ndash are children
Nearly two out of every five children ndash 37 ndash are multidimensionally poor This means 689 million children are living in multidimensional poverty
Most MPI poor children live in South Asia (44) and in Sub-Saharan Africa (43)
In 36 countries including India at least half of all children are MPI poor
bull
bull
bull
bull
In Ethiopia Niger and South Sudan over 90 of children are MPI poor
Half of MPI poor children live in lsquoalertrsquo level fragile states and child poverty levels are the highest in the worst of the fragile states
Two-thirds of poor children live in middle income countries
Poor children are on average deprived in 52 of weighted indicators
As Figure 2 shows the most common deprivations children face are in cooking fuel sanitation flooring malnutrition and electricity
bull
bull
bull
bull
bull
Figure 2 shows the proportion of people who are poor and deprived in each indicator Childrenrsquos deprivations are significantly higher in each of the ten indicators
40
35
30
25
20
15
10
5
0
Proportion of individuals poor and deprived in
Years of schooling
School attendance
Child mortality
Nutrition ElectricitySanitation Water FloorCooking fuel
Assets
1314
5
18
9
22
13
22
10
30
1615
8
26
14
35
1917
9
Children 0 ndash17 Adults 18+
Fig 2 Child and adult deprivations in ten MPI indicators
7
OPHI Briefing 47 | May 2017
Global Multidimensional Poverty Index 2017
4 5
Half of MPI poor people live in South AsiaAbout half of the MPI poor live in South Asia (48) and 36 live in Sub-Saharan Africa This is a different distribution from $190day income poverty estimations aggregated in the same
way ndash because MPI is higher in South Asia In South Asia 416 of the population are MPI poor and 192 are poor by the extreme income poverty measure ndash so the rate is more than doubled[7] In Sub-Saharan Africa multidimensional poverty affects 601 of the population $190day poverty 464 so MPI poverty is one-third higher
Over one billion MPI poor people live in middle income countries[8]
Over one billion people ndash almost three quarters of all multi-dimensionally poor people (72) ndash live in middle income
countries Of these 86 million poor people live in in upper middle income countries and 961 million in lower middle income countries[9] What is striking is that the income cate-gories have overlapping levels of multi dimensio nal poverty In upper middle income countries the incidence of MPI varies from 0ndash42 in lower middle income countries itrsquos 0ndash68 and in low income countries 29ndash91 of national
Fig 4a Distribution of population by income category
Fig 4b Distribution of MPI poor persons by income category
Fig 3a Distribution of population by region
Sub-Saharan Africa (16)
Europe and Central Asia (2)
Latin America and Caribbean (9)
South Asia (31)
Arab States (6)
East Asia and the Pacific (36)
Fig 3b Distribution of MPI poor persons by region
Sub-Saharan Africa (36)
Europe and Central Asia (0)
Latin America and Caribbean (2)
East Asia and the Pacific (10)
Arab States (4)
South Asia (48)
Upper middle income (6)
High income non-OECD (0)
Low income (28)
Lower middle income (66)
Upper middle income (35)
High income non-OECD (0)
Low income (10)
Lower middle income (52)
wwwophiorguk
Alkire and Robles
6 7
populations live in acute multidimensional poverty When we focused on subnational regions the incidence of MPI varies from 0ndash74 in upper middle income countries from 0ndash92 in lower middle income countries and from 4ndash99 in low income countries
International aid and multidimensional poverty Differently distributedAid flows are complex and are only part of any poverty reduction strategy Measured in international currencies they do not reflect the unit costs of reducing a deprivation They must be analyzed alongside national public expenditures and other flows they supplement Yet the MPI portrays acute multidimensional poverty and unmet needs for public health and nutrition inputs basic education water sanitation housing electricity and other needs So a natural question is to what extent is the aid that deliberately targets those priority sectors flowing to the places where people who experience these overlapping deprivations live
To start such a conversation we describe aid allocations for 101 of the countries included in the global MPI 2017[10] using the information in the Creditor Reporting System (CRS) from the Organisation of Economic Cooperation and Development (OECD) that contains information from Development Assistance Committee (DAC) countries and International Organizations (IO) We only consider Official Development Assistance (ODA) flows and we do not yet include Other Official Flows (OOF) We also include only aid commitments to priority sectors that reflect MPI indicators[11] in a range of three years from the date of the survey used for each country They add up to $45 billion in 2015 constant USD
Table 3 shows that 28 of the MPI poor live in countries classified as low income Those countries received 42 of the donor flows to priority social sectors But 66 of MPI poor people live in lower middle income countries which receive 49 of these aid flows This is shaped by very low allocations to ndia where each poor person is allocated $135 of aid And 6 of MPI poor people live in upper middle income countries which receive a generous 9 of aid flows The flows from IO are more reflective of the distribution of MPI poor than the DAC flows
Analysis of aid flows to individual countries is also important If we consider ODA from DAC donors which is thought to represent the bulk of development aid the countries that receive very low aid flows in priority social sectors may not be those who need it least One of the countries with the lowest aid flows is a high income country Trinidad and Tobago
Fig 5a Priority sector ODA flows from DAC countries
ODA from DAC countries to priority sectors of 101 countries by income category of recipients
Upper middle income (12)
Lower middle income (44)
Low income (44)
Fig 5b Priority Sector ODA flows from DAC countries and IO
ODA from DAC and IO to priority sectors of 101 countries by income category of recipients
Lower middle income (49)
Upper middle income (9)
Low income (42)
and two are upper middle income countries Algeria and also China ndash which has mobilized tremendous domestic resources and political will for poverty reduction by 2020 But eight lower middle income countries including the most populous in terms of MPI poor such as Pakistan ($230) Nigeria ($140) and India ($064) receive very low allocations in priority social sector aid from DAC countries And nine of the 20 countries in which aid allocation from DAC donors in priority social sectors totals less than $550 per person are low income countries These include Ethiopia ($517)
OPHI Briefing 47 | May 2017
Global Multidimensional Poverty Index 2017
6 7
Total priority sectors
ODA from DAC countries three years previous to country-specific MPI
ODA from IO three years previous to country-specific MPI
ODA from IO and DAC three years previous to country-specific MPI
Share of MPI poor people
Low income
Lower middle income
Upper middle income
Total
441
435
124
100
407
545
49
100
421
494
85
100
28
66
6
100
Table 3 Allocation of ODA from DAC countries and IO for priority sectors and distribution of MPI poor income categories
DAC = Development Assistance Committee (bilateral aid) IO = International Organisations (multilateral aid) including the World Bank regional development banks some UN agencies and other multilateral agencies
Note
Niger ($450) Chad ($210) and Somalia ($210) In each of these four countries over 80 of people are MPI poor The remaining low income countries receive $6 to $32 per MPI poor person from DAC countries
To understand whether and when aid is catalyzing action and further public expenditure to fight poverty in multiple dimensions requires in-depth analysis What is clear is that the distribution of ODA flows differ significantly from the distribution of multidimensionally poor people
GOING UP CLOSE MPI WITHIN MYANMAR AFGHANISTAN AND CHAD
The MPI and its indicators are disaggregated by 988 subnational regions in 78 countries revealing an astonishing subnational diversity The poorest regions are in Chad Burkina Faso Niger Ethiopia South Sudan Nigeria Uganda and Afghanistan
For example in 52 subnational regions from 16 countries over 90 of people are poor ndash 110 million out of the 119 million living in these regions are MPI poor
These disaggregations show subnational diversity Inside Afghanistan poverty rates vary from 25 in Kabul to 95 in Urozgan In Chad itrsquos 53ndash99 In Nigeria the range is a massive 8ndash92 always with capital cities having the lowest MPI Of course the range also depends upon the number and size of the subnational regions
The case studies below profile subnational analyses of Myanmar Afghanistan and Chad
The legend used for the maps is the following
125 ndash 281
282 ndash 452
453 ndash 583
584 ndash 651
652 ndash 843844 ndash 954955 ndash 990
MPI incidence ()
wwwophiorguk
Alkire and Robles
8 9
USERrsquoS GUIDE TO INTERPRETING THE MPI
Sometimes people presume that the MPI is lsquojustrsquo an index ndash one number ndash showing the level of poverty But as these case studies show the MPI is always unpacked in different ways to show who is poor and how they are poor By design the MPI can be lsquobroken downrsquo into interesting consistent and partial subindices Here is a userrsquos guide to interpreting the MPI
Headcount Ratio or Incidence Letrsquos start with the most familiar number the percentage of people who are MPI poor This is called the headcount ratio or incidence of poverty or the lsquopoverty ratersquo For example in Myanmar 301 of people are poor because they are deprived in 3333 or more of the weighted MPI indicators
Intensity This is the average deprivation score among the poor In Myanmar intensity is 446 This means that the poor in Myanmar are on average deprived in 446 of the weighted indicators For example consider Neheso She is deprived in both health indicators as well as in cooking fuel sanitation water flooring and assets Her deprivations are labelled on the left hand side of the chart on the right The height of the boxes shows the weight of each indicator On the right hand side we stack up her deprivations and find that her deprivation score is 60 All poor people have deprivation scores between 3333 and 100 The average of the deprivation scores of all poor people is intensity
The MPI When you multiply 301 x 446 you obtain 0134 This is the MPI for Myanmar It shows that poor people in Myanmar are deprived in 134 of the deprivations that would be experienced if every person in Myanmar was poor and was deprived in all indicators The important thing is that MPI ranges from 0 to 1 and higher levels show higher poverty
How to Reduce MPIMPI goes down if a) somebody becomes non-poor so the incidence of poverty goes down or b) the intensity goes down because a poor person gets rid of a deprivation To accomplish either one though what is needed is to reduce deprivations in any one of the MPIrsquos ten indicators So we need to drill down and see how to do that
The MPI can also be broken down by indicators which is a useful tool for public policy The MPI itself is simply the percentage of people who are poor and deprived in each indicator multiplied by the weight on that indicator You add them up and obtain the value of MPI Remember that health and education indicators are weighted at 16 and living standard at 118 So in Myanmar the MPI
(0134) is also equal to (137+ 117+122+85)(16) + (29+222+113+216+51+14)(118) Visually you can see that the height of the graphic on the bottom left of page 9 is 0134 and each indicator lsquocontributesrsquo to it So if we reduce any depri vation of any poor person in any indicator what happens The height of the MPI goes down
If you prefer you can simply look at the table at the bottom of the page which shows the percentage of people in Myanmar who a) are MPI poor (because they have overlapping deprivations that stack up to one-third or more) and b) are deprived in each indicator For example 122 of people are MPI poor and have no one in their household who has completed five years of schooling We call these the lsquocensored headcount ratiosrsquo of each indicator If any of these very important deprivations goes down MPI goes down The bottom right hand chart on page 9 shows the censored headcount ratios for the Rakhine in Myanmar compared to the national average Similarly the chart on page 11 compares censored headcount ratios for two regions in Chad
These are the fundamental building blocks of the MPI Incidence Intensity Censored Headcount ratios and (weighted) Indicator contributions to MPI If you download the online data tables you will find all of these statistics (and some others) for every single country rural-urban area subnational region and for children But the goal is not just to understand poverty it is to use this information to fight poverty and suffering ndash through better policies and actions
140
Health Education Living Standards
NutritionChild
mortalityYears of
schoolingSchool
attendanceCooking
fuel Sanitation Drinking water Electricity Floor Assets
137 117 122 85 290 222 113 216 51
rarr
67
33
40
50
60
70
80
90
100
10
20
30
0
larr
larr
Hea
lthSt
anda
rd o
f Liv
ing
Nutrition
SanitationWater
Assets
Educ
atio
n
Flooring
Cooking Fuel
Child Mortality
NEHESO IS DEPRIVED IN
wwwophiorguk
8
Alkire and Robles
OPHI Briefing 47 | May 2017
Global Multidimensional Poverty Index 2017
8 9
MYANMAR
Myanmar (DHS 2014ndash15) is home to 53 million people Of these nearly 16 million or 30 are multidimensionally poor The poorest regions are Rakhine in the southwest and Shan and Kayin in the east pictured in the lightest green on the map of multidimensional poverty in Myanmar on the left In Rakhine just over half of the population (51) are multidimensionally poor with particularly high deprivations in nutrition cooking fuel sanitation assets and electricity (see the chart below) Among children aged 0-17 37 of them are poor whereas 26 of adults in Myanmar are MPI poor In rural areas child poverty rises to 44 of children whereas in urban areas itrsquos 14
MYANMAR
Kachin 1901
Shan 3952
Kayah 2303
Kayin 3694
Tanintharyi 2895
Mon 2486
Yangon 1257
Mandalay 24112
Chin 33813
8 Ayeyarwadd 390
10 Rakhine 513
11 Magway 274
Sagaing 31614
9 Bago 306
1
2
3
4
5
6
78
9
1011
1213
14
Multidimensional poverty in Myanmar
Cens
ored
hea
dcou
nt ra
tios
in th
e re
gion
pr
opor
tion
who
is p
oor a
nd d
epriv
ed in
Deprivation among the poor in Myanmar
The composition of poverty among Rakhine state and across Myanmar
60
30
50
20
10
40
0
10
20
30
40
50
60
0
Rakhine Myanmar (national)
Years of schooling
School attendance
Child mortality
Nutrition
Electricity
Sanitation
Drinking water
Floor
Cooking fuel
Assets
H ( MPI poor people)000
002
004
006
008
010
012
014
016
Composition of Myanmarrsquos MPIMPIvalue
Paul
Arp
s | F
lickr
CC
BY
20
wwwophiorguk
Alkire and Robles
10 11
Afghanistanrsquos national MPI is the highest in South Asia and 56 of Afghanis are acutely poor by the MPI Afghanistanrsquos poorest region Urozgan near central Afghanistan has an MPI of 0624 which is larger than the national MPI of Niger and 95 of people are poor This is followed by Nooristan (94) in the northeast and Badghis (79) and Kandahar (72) in the west and south of the country (see the map above) We do not have nutritional data for Afghanistan but 28 of people live in a household where a child has died ndash which is the highest figure for this indicator across every region of the world except Sub-Saharan Africa
Fully 59 of children are multidimensionally poor in Afghanistan and 53 of adults That means Afghanistan has 97 million MPI poor child ren and 75 million poor adults So well over half ndash in fact 56 of Afghanistanrsquos poor people are children Unfortunately 38 of poor people live in a household where a school-aged child is not attending school so attention to childrenrsquos deprivations is of critical importance In terms of region three-quarters of Afghanis live in rural areas where 65 of people are poor In the urban areas poverty rates are lower at 29
1
2
3
45 6 7 8
9
101112
1314
15
16
1718
1920
21
22
23
24 25 2627
2829
3031
32
33 34
AFGHANISTAN AFGHANISTAN
Herat 6331
Badghis 7932
Faryab 4943
Jawzjan 6094
Balkh 5575Kunduz 6056
Takhar 6517
Nooristan 9379
Badakhshan 6758
Ghazni 47416
Zabul 34617
Urozgan 94518Kandahar 72119
Helmand 61820
10 Kunarha 583
11 Laghman 704
12 Nangarhar 549
13 Khost 578
14 Paktya 452
15 Paktika 281
Nimroz 45421
Farah 61422
Ghor 74623
Sar-e Pol 67824
Samangan 64325
Baghlan 59726
Panjsher 25827
Daykundi 61532
Bamyan 61033
28 Kapisa 536
30 Logar 414
31 Wardak 679
Parwan 58634
29 Kabul 253
Multidimensional poverty in Afghanistan
John
Ass
elin
| Fl
ickr
CC
BY-
NC
-ND
20
OPHI Briefing 47 | May 2017
Global Multidimensional Poverty Index 2017
10 11
Chad (DHS 2014ndash15) is the fourth poorest among the 103 countries analyzed Fully 87 of people live in multidimensional poverty Over 80 of the population are poor and lack electricity adequate sanitation flooring and clean cooking fuel and over half (52) of the population are multidimensionally poor and have a school-aged child at home who is not attending school The poorest subnational regions in Chad are the drought-affected regions of Lac Wadi Fira Sila and Kanem In the regions of Lac and Kanem nearly 65 of the population are poor and have at least one malnourished woman or child (see the map above)
It might seem that in such a poor country (in 12 of Chadrsquos 20 regions more than 95 of people are poor) the MPI cannot add much analysis But the indicator details tell a new story Letrsquos compare the two poorest regions Lac and Wadi Fira ndash in which 98ndash99 of people are poor In Lac 34 of people are poor and have experienced the death of a child whereas in Wadi Fira itrsquos much lower at 20 But in Wadi Fira 97 of people lack clean drinking water whereas in Lac itrsquos 64 (the chart below) So clearly even between two extremely poor regions policy responses need to differ
CHAD CHAD
Lac and Wadi Fira Deprivation levels by indicator
Multidimensional poverty in Chad
12
3
4
5
6
789
101112
1314 15
1617
1819
Borkou Tibesti 891
Ennedi 9682Wadi Fira 993Ouaddaiuml 9534
Sila 9895Salamat 9786Moyen Chari 7417
Mayo Kebbi Ouest 86312Mayo Kebbi Est 86113
8 Mandoul 881
10 Logone occidental 791
11 Tandjileacute 843
Chari Baguirmi 96914
9 Logone oriental 881
15 Gueacutera 954
16 Hadjer Lamis 954
17 Lac 981
18 Kanem 98519 Barh El Gazal 957
20 Batha 957
20
YS Years of schooling
School attendance
CM Child mortality
N Nutrition
Electricity
Sanitation
Drinking water
Floor
Cooking fuel
Assets
SA
CF
S
DW
E
F
A
30
50
20
10
0
40
60
70
80
90
100
N CM YS SA CF S DW E F A
Ken
Doe
rr |
Flic
kr C
C B
Y 2
0
wwwophiorguk
Alkire and Robles
12 13
NEWS FLASHMPI DISAGGREGATION BY DISABILITY STATUS SOON TO BE STANDARD
In a recent study we disaggregated the global MPI by disability status for the first time[12] It was not previously possible to disaggregate the global MPI by disability but surveys that include standardized questions on disability are set to increase
Ugandarsquos 2011 Demographic and Health Survey (DHS) pioneered the Washington Group questions on disability a form of which will be included in DHS and Multiple Indicator Cluster Surveys (MICS) from 2017 onwards In Uganda 4 of people aged 5 years and above were living with a disability and 22 of all people live in a household where at least one member lives with a severe disability
As Figure 6 above shows households with at least one member with a severe disability faced higher levels of multidimensional poverty ndash a
77 poverty rate as compared with 69 among households without disability As comparable data become available the global MPI will be disaggregated by disability status in order to track ndash and hopefully to help reduce ndash the interlinkages among these conditions
Fig 6 Incidence of multidimensional poverty in Uganda by disability status
0
01
02
03
04
05
06
07
08
09
03
05
02
01
0
04
06
07
08
09
without disabilitywith disability
Bria
n W
olfe
| Fl
ickr
CC
BY-
NC
20
OPHI Briefing 47 | May 2017
Global Multidimensional Poverty Index 2017
12 13
DESTITUTIONThe distressing condition of destitution
bull Half of the MPI poor people live in destitution
bull In six countries and 117 subnational regions 50 or more of people are destitute
bull Most of the highest levels of destitution are found in Sub-Saharan Africa
bull Pakistan has more destitute people ndash 37 million ndash than East Asia and the Pacific (26 million) or the Arab States (26 million)
bull India has more destitute people (295 million) than Sub-Saharan Africa (282 million)
bull But most of the destitute people ndash 362 of the 706 million ndash live in South Asia
The MPI reflects acute multidimensional poverty in developing countries It measures absolute levels of poverty ndash which are very low in a number of countries such as China and many areas of Latin America For many countries a lsquomoderatersquo measure of multidimensional poverty is needed
Even so since 2014 we have reported a measure of destitution that identifies a subset of the MPI poor who are the poorest of the poor Unfortunately nearly half of all MPI poor people are destitute ndash 706 million men women and children
As with the MPI destitute people are deprived in one-third or more weighted indicators but the destitution indicators are more extreme They include severe malnutrition losing two or more children having a child out of primary school having no household member who has completed more than one year of schooling using open defecation fetching water that is unsafe or 45 or more minutes away not owning even a mobile phone or radio and cooking with wood or dung or straw only[13] To leave no one behind we must take urgent action to end the distressing condition of destitution
Figure 7 on the next page shows the percentage of the population who are MPI poor which is the height of the beige bar and the percentage who are living in destitution which is the height of the red subcomponent At a glance we can see that destitution rates ranges from 0 to 714 of the population What else do we see
First there are pockets of destitution even in low MPI countries In countries like Turkmenistan Bosnia and Herzegovina Barbados Uzbekistan and Azerbaijan 30 or more of MPI poor people are destitute But in South Africa less than 9 of the MPI poor are destitute
Second there are positive stories In 57 countries less than 10 of the population are destitute Similarly 506 subnational regions have less than 10 of the population living in destitution
Third in general destitution rates tend to be lower than $190day extreme income poverty rates But destitution is markedly higher than income poverty in Pakistan Mauritania Sudan Gambia Chad Ethiopia Niger and South Sudan This underscores the importance of measuring and fighting poverty in all its forms and dimensions
In some countries and regions destitution is still lsquothe normrsquo because it affects half of more of the population Six countries have more than 50 of their population living in destitution ndash and together they are home to 100 million poor people Drilling down in 117 subnational regions 50-92 of the population are destitute (161 million) These high destitution regions are mainly located in Sub-Saharan Africa Yet there are pockets of destitution in other regions In East Asia and the Pacific eight regions within Timor LrsquoEste have over 50 of people living in destitution Within the Arab States 58 of people in Sudanrsquos Central Darfur and 50 of people in Yemenrsquos Hajjah regions are destitute Within South Asia Afghanistanrsquos Urozgan Nooristan and Kandahar provinces have 50ndash78 of people living in destitution In Latin America six regions of Haiti plus Potosi in Bolivia have 20ndash36 of people living in destitution
Looking at the high rates of destitution we might presume that destitution is largely an African story But it is not Of the 706 million people who are destitute 362 million live in South Asia and 282 million in Sub-Saharan Africa In addition 26 million live in the Arab States another 26 million live in East Asia and over 8 million live in Latin America plus nearly 300000 in Europe and Central Asia India has over 295 million destitute people more than the total number if destitute people in all of Sub-Saharan Africa And Pakistan has 37 million destitute people according to its 201213 dataset more than either the Arab States or East Asia and the Pacific region
The story of destitution is not over But it should be These figures call for vigorous attention to be focused on destitution in South Asia and in Sub-Saharan Africa ndash and for even low poverty countries to track and empty the pockets of deep poverty in their midst
wwwophiorguk
Alkire and Robles
14 15
Fig 7 Comparing the headcount ratios of MPI poor destitute and $190day poor
$190day poorDestituteMPI poor
20 040 6080100
South SudanNigerEthiopiaChadBurkina FasoSomaliaSierra LeoneBurundiMaliCentral African RepublicGuineaDem Rep of CongoLiberiaUgandaMozambiqueTimor-LesteMadagascarGuinea -BissauBeninGambiaSenegalCote drsquoIvoireTanzaniaZambiaAfghanistanRwandaMalawiSudanNigeriaMauritaniaTogoHaitiCameroonYemenPakistanNamibiaIndiaBangladeshKenyaRep of CongoComorosZimbabweLao Peoplersquos Dem RepGhanaCambodiaLesothoVanuatuMyanmarDjiboutiNepalBhutanGuatemalaBoliviaSao Tome and PrincipeGabonNicaraguaSwazilandHondurasIndonesiaMoroccoTajikistanIraqPhilippinesPeruMongoliaSouth AfricaDominican RepublicViet NamEl SalvadorSurinameTrinidad and TobagoColombiaAzerbaijanBrazilMaldivesBelizeSyrian Arab RepublicChinaEgyptEcuadorGuyanaUzbekistanJamaicaJordanLibyaAlgeriaAlbaniaUkraineMexicoTunisiaPalestineSaint LuciaBarbadosThailandMoldovaMacedoniaBosnia and HerzegovinaKyrgyzstanTurkmenistanArmeniaMontenegro
KazakhstanSerbia
OPHI Briefing 47 | May 2017
Global Multidimensional Poverty Index 2017
14 15
REFERENCESAddis Ababa Accord (2015) lsquoAccord of the Third International Conference on Financing for Development Revised Draft 6 Mayrsquo
Alkire S and Foster J (2011) lsquoCounting and multidimensional poverty measurementrsquo Journal of Public Economics vol 95(7ndash8) pp 476ndash487
Alkire S Dorji L Gyeltshen S and Minten T (2016) Child Poverty in Bhutan Insights from Multidimensional Child Poverty Index and Qualitative Interviews with Poor Children National Statistics Bureau Bhutan
Alkire S and Robles G (2017) lsquoMultidimensional Poverty Index ndash summer 2017 brief methodological note and resultsrsquo OPHI MPI Methodological Notes 44 Oxford Poverty and Human Development Initiative University of Oxford
Alkire S and Santos ME (2014) lsquoMeasuring acute poverty in the developing world robustness and scope of the multidimensional poverty indexrsquo World Development vol 59 pp 251ndash274
Alkire S Jindra C Robles G and Vaz A (2017) lsquoChildrenrsquos multidimensional poverty disaggregating the global MPIrsquo OPHI Briefing 46 Oxford Poverty and Human Development Initiative University of Oxford
Organisation of Economic Cooperation and Development (OECD) (2017) lsquoCreditor reporting system (CRS) aid activity databasersquo Available here (Last accessed on 13 May 2017)
Pinilla-Roncancio M and Alkire S (2017) lsquoHow poor are people with disabilities around the globe A multidimensional perspectiversquo OPHI Research in Progress 48a Oxford Poverty and Human Development Initiative University of Oxford
United Nations (2015) Transforming Our World The 2030 Agenda for Sustainable Development ARES701
NOTES[1] All aggregates use 2013 population data[2] Section 51 paragraph 135[3] Addis Ababa Accord 2015 paragraph 119[4] Discussions are underway to consider whether data permit
adjustments to further align the global MPI with the SDGs[5] This section draws on lsquoChildrenrsquos multidimensional poverty
disaggregating the global MPIrsquo by Alkire et al (2017)[6] As with $190day poverty children are identified as poor
if they live in an MPI poor household Alternatively Child MPIs can be constructed that reflect each individual childrsquos deprivations by gender and age cohort (see Alkire et al 2016) but data are not available to build a global Child MPI with individual child data
[7] $190 is not available for Afghanistan Omitting Afghani stan 414 of people are MPI poor in South Asia
[8] We use income category definitions from July 2016 throughout this document
[9] The global MPI covers 92 of all people living in low or middle income countries It covers 99 of people living in low income countries (29 countries) 99 of the population in lower middle income countries (43) and 82 in upper middle income countries (29)
[10] There is no information on allocation to Macedonia and Palestine For those countries with MPI data from 2016 ODA flows allocated between 2011 and 2015 have been considered For South Sudan with 2010 MPI data ODA flows between 2011 and 2015 are used as this is the closest five-year period available
[11] The categories included are basic education basic health basic drinking water supply and basic sanitation (alone and together) electric power transmission and distribution low-cost housing multisector aid for basic social services developmental food aid and food security assistance
[12] Pinilla and Alkire 2017
[13] The indicators of electricity and flooring are unchanged
ONLINE RESOURCES
OPHIrsquos interactive databank enables you to study over 100 developing countries in terms of multidimensional poverty Choose interactive data visualizations to explore where and in which indicators people are poor or destitute and to show how MPI values compare with complementary data such as $190day poverty Or download a country briefing file for any country which contains explanations of its MPI and is illustrated with graphs maps and charts Excel data tables have all the details of MPI plus population standard errors sample sizes and much more Methodological notes provide any particularities of each countryrsquos survey data treatment
See wwwophiorgukmultidimensional-poverty-index
Oxford Poverty and Human Development Initiative (OPHI)
Oxford Department of International Development (ODID)Queen Elizabeth House (QEH)University of Oxford3 Mansfield Road Oxford OX1 3TBUnited Kingdom
ophi_oxford
ophioxford
ophi_oxford
Telephone+44 (0)1865 271915
Emailophiqehoxacuk
Websitewwwophiorguk
wwwophiorguk
Alkire and Robles
16 PB
MU
LTID
IMEN
SIO
NA
L PO
VERT
Y IN
DEX
ACR
OSS
TH
E W
ORL
D
0 ndash
005
01
ndash 0
2
02
ndash 0
3
03
ndash 0
4
04
ndash 0
5
05
+
005
ndash 0
1
OXFORD POVERTY amp HUMAN DEVELOPMENT INITIATIVE
OPHIT E N Y E A R
OPHIANNIVERSARY

wwwophiorguk
Alkire and Robles
4 5
WHO ARE THE POOR AND WHERE DO THEY LIVE
Half of MPI poor people are children[5]
When we disaggregate the MPI by children we find child poverty to be strikingly high[6] Of the 145 billion people who are multidimensionally poor 48 are children That is a total of 689 million children who live in multidimensional poverty And poverty rates are higher among children 37 of children are poor whereas 23 of adults aged 18 and above are poor
Disaggregating the global MPI by children we find
Half of all multidimensionally poor people ndash 48 ndash are children
Nearly two out of every five children ndash 37 ndash are multidimensionally poor This means 689 million children are living in multidimensional poverty
Most MPI poor children live in South Asia (44) and in Sub-Saharan Africa (43)
In 36 countries including India at least half of all children are MPI poor
bull
bull
bull
bull
In Ethiopia Niger and South Sudan over 90 of children are MPI poor
Half of MPI poor children live in lsquoalertrsquo level fragile states and child poverty levels are the highest in the worst of the fragile states
Two-thirds of poor children live in middle income countries
Poor children are on average deprived in 52 of weighted indicators
As Figure 2 shows the most common deprivations children face are in cooking fuel sanitation flooring malnutrition and electricity
bull
bull
bull
bull
bull
Figure 2 shows the proportion of people who are poor and deprived in each indicator Childrenrsquos deprivations are significantly higher in each of the ten indicators
40
35
30
25
20
15
10
5
0
Proportion of individuals poor and deprived in
Years of schooling
School attendance
Child mortality
Nutrition ElectricitySanitation Water FloorCooking fuel
Assets
1314
5
18
9
22
13
22
10
30
1615
8
26
14
35
1917
9
Children 0 ndash17 Adults 18+
Fig 2 Child and adult deprivations in ten MPI indicators
7
OPHI Briefing 47 | May 2017
Global Multidimensional Poverty Index 2017
4 5
Half of MPI poor people live in South AsiaAbout half of the MPI poor live in South Asia (48) and 36 live in Sub-Saharan Africa This is a different distribution from $190day income poverty estimations aggregated in the same
way ndash because MPI is higher in South Asia In South Asia 416 of the population are MPI poor and 192 are poor by the extreme income poverty measure ndash so the rate is more than doubled[7] In Sub-Saharan Africa multidimensional poverty affects 601 of the population $190day poverty 464 so MPI poverty is one-third higher
Over one billion MPI poor people live in middle income countries[8]
Over one billion people ndash almost three quarters of all multi-dimensionally poor people (72) ndash live in middle income
countries Of these 86 million poor people live in in upper middle income countries and 961 million in lower middle income countries[9] What is striking is that the income cate-gories have overlapping levels of multi dimensio nal poverty In upper middle income countries the incidence of MPI varies from 0ndash42 in lower middle income countries itrsquos 0ndash68 and in low income countries 29ndash91 of national
Fig 4a Distribution of population by income category
Fig 4b Distribution of MPI poor persons by income category
Fig 3a Distribution of population by region
Sub-Saharan Africa (16)
Europe and Central Asia (2)
Latin America and Caribbean (9)
South Asia (31)
Arab States (6)
East Asia and the Pacific (36)
Fig 3b Distribution of MPI poor persons by region
Sub-Saharan Africa (36)
Europe and Central Asia (0)
Latin America and Caribbean (2)
East Asia and the Pacific (10)
Arab States (4)
South Asia (48)
Upper middle income (6)
High income non-OECD (0)
Low income (28)
Lower middle income (66)
Upper middle income (35)
High income non-OECD (0)
Low income (10)
Lower middle income (52)
wwwophiorguk
Alkire and Robles
6 7
populations live in acute multidimensional poverty When we focused on subnational regions the incidence of MPI varies from 0ndash74 in upper middle income countries from 0ndash92 in lower middle income countries and from 4ndash99 in low income countries
International aid and multidimensional poverty Differently distributedAid flows are complex and are only part of any poverty reduction strategy Measured in international currencies they do not reflect the unit costs of reducing a deprivation They must be analyzed alongside national public expenditures and other flows they supplement Yet the MPI portrays acute multidimensional poverty and unmet needs for public health and nutrition inputs basic education water sanitation housing electricity and other needs So a natural question is to what extent is the aid that deliberately targets those priority sectors flowing to the places where people who experience these overlapping deprivations live
To start such a conversation we describe aid allocations for 101 of the countries included in the global MPI 2017[10] using the information in the Creditor Reporting System (CRS) from the Organisation of Economic Cooperation and Development (OECD) that contains information from Development Assistance Committee (DAC) countries and International Organizations (IO) We only consider Official Development Assistance (ODA) flows and we do not yet include Other Official Flows (OOF) We also include only aid commitments to priority sectors that reflect MPI indicators[11] in a range of three years from the date of the survey used for each country They add up to $45 billion in 2015 constant USD
Table 3 shows that 28 of the MPI poor live in countries classified as low income Those countries received 42 of the donor flows to priority social sectors But 66 of MPI poor people live in lower middle income countries which receive 49 of these aid flows This is shaped by very low allocations to ndia where each poor person is allocated $135 of aid And 6 of MPI poor people live in upper middle income countries which receive a generous 9 of aid flows The flows from IO are more reflective of the distribution of MPI poor than the DAC flows
Analysis of aid flows to individual countries is also important If we consider ODA from DAC donors which is thought to represent the bulk of development aid the countries that receive very low aid flows in priority social sectors may not be those who need it least One of the countries with the lowest aid flows is a high income country Trinidad and Tobago
Fig 5a Priority sector ODA flows from DAC countries
ODA from DAC countries to priority sectors of 101 countries by income category of recipients
Upper middle income (12)
Lower middle income (44)
Low income (44)
Fig 5b Priority Sector ODA flows from DAC countries and IO
ODA from DAC and IO to priority sectors of 101 countries by income category of recipients
Lower middle income (49)
Upper middle income (9)
Low income (42)
and two are upper middle income countries Algeria and also China ndash which has mobilized tremendous domestic resources and political will for poverty reduction by 2020 But eight lower middle income countries including the most populous in terms of MPI poor such as Pakistan ($230) Nigeria ($140) and India ($064) receive very low allocations in priority social sector aid from DAC countries And nine of the 20 countries in which aid allocation from DAC donors in priority social sectors totals less than $550 per person are low income countries These include Ethiopia ($517)
OPHI Briefing 47 | May 2017
Global Multidimensional Poverty Index 2017
6 7
Total priority sectors
ODA from DAC countries three years previous to country-specific MPI
ODA from IO three years previous to country-specific MPI
ODA from IO and DAC three years previous to country-specific MPI
Share of MPI poor people
Low income
Lower middle income
Upper middle income
Total
441
435
124
100
407
545
49
100
421
494
85
100
28
66
6
100
Table 3 Allocation of ODA from DAC countries and IO for priority sectors and distribution of MPI poor income categories
DAC = Development Assistance Committee (bilateral aid) IO = International Organisations (multilateral aid) including the World Bank regional development banks some UN agencies and other multilateral agencies
Note
Niger ($450) Chad ($210) and Somalia ($210) In each of these four countries over 80 of people are MPI poor The remaining low income countries receive $6 to $32 per MPI poor person from DAC countries
To understand whether and when aid is catalyzing action and further public expenditure to fight poverty in multiple dimensions requires in-depth analysis What is clear is that the distribution of ODA flows differ significantly from the distribution of multidimensionally poor people
GOING UP CLOSE MPI WITHIN MYANMAR AFGHANISTAN AND CHAD
The MPI and its indicators are disaggregated by 988 subnational regions in 78 countries revealing an astonishing subnational diversity The poorest regions are in Chad Burkina Faso Niger Ethiopia South Sudan Nigeria Uganda and Afghanistan
For example in 52 subnational regions from 16 countries over 90 of people are poor ndash 110 million out of the 119 million living in these regions are MPI poor
These disaggregations show subnational diversity Inside Afghanistan poverty rates vary from 25 in Kabul to 95 in Urozgan In Chad itrsquos 53ndash99 In Nigeria the range is a massive 8ndash92 always with capital cities having the lowest MPI Of course the range also depends upon the number and size of the subnational regions
The case studies below profile subnational analyses of Myanmar Afghanistan and Chad
The legend used for the maps is the following
125 ndash 281
282 ndash 452
453 ndash 583
584 ndash 651
652 ndash 843844 ndash 954955 ndash 990
MPI incidence ()
wwwophiorguk
Alkire and Robles
8 9
USERrsquoS GUIDE TO INTERPRETING THE MPI
Sometimes people presume that the MPI is lsquojustrsquo an index ndash one number ndash showing the level of poverty But as these case studies show the MPI is always unpacked in different ways to show who is poor and how they are poor By design the MPI can be lsquobroken downrsquo into interesting consistent and partial subindices Here is a userrsquos guide to interpreting the MPI
Headcount Ratio or Incidence Letrsquos start with the most familiar number the percentage of people who are MPI poor This is called the headcount ratio or incidence of poverty or the lsquopoverty ratersquo For example in Myanmar 301 of people are poor because they are deprived in 3333 or more of the weighted MPI indicators
Intensity This is the average deprivation score among the poor In Myanmar intensity is 446 This means that the poor in Myanmar are on average deprived in 446 of the weighted indicators For example consider Neheso She is deprived in both health indicators as well as in cooking fuel sanitation water flooring and assets Her deprivations are labelled on the left hand side of the chart on the right The height of the boxes shows the weight of each indicator On the right hand side we stack up her deprivations and find that her deprivation score is 60 All poor people have deprivation scores between 3333 and 100 The average of the deprivation scores of all poor people is intensity
The MPI When you multiply 301 x 446 you obtain 0134 This is the MPI for Myanmar It shows that poor people in Myanmar are deprived in 134 of the deprivations that would be experienced if every person in Myanmar was poor and was deprived in all indicators The important thing is that MPI ranges from 0 to 1 and higher levels show higher poverty
How to Reduce MPIMPI goes down if a) somebody becomes non-poor so the incidence of poverty goes down or b) the intensity goes down because a poor person gets rid of a deprivation To accomplish either one though what is needed is to reduce deprivations in any one of the MPIrsquos ten indicators So we need to drill down and see how to do that
The MPI can also be broken down by indicators which is a useful tool for public policy The MPI itself is simply the percentage of people who are poor and deprived in each indicator multiplied by the weight on that indicator You add them up and obtain the value of MPI Remember that health and education indicators are weighted at 16 and living standard at 118 So in Myanmar the MPI
(0134) is also equal to (137+ 117+122+85)(16) + (29+222+113+216+51+14)(118) Visually you can see that the height of the graphic on the bottom left of page 9 is 0134 and each indicator lsquocontributesrsquo to it So if we reduce any depri vation of any poor person in any indicator what happens The height of the MPI goes down
If you prefer you can simply look at the table at the bottom of the page which shows the percentage of people in Myanmar who a) are MPI poor (because they have overlapping deprivations that stack up to one-third or more) and b) are deprived in each indicator For example 122 of people are MPI poor and have no one in their household who has completed five years of schooling We call these the lsquocensored headcount ratiosrsquo of each indicator If any of these very important deprivations goes down MPI goes down The bottom right hand chart on page 9 shows the censored headcount ratios for the Rakhine in Myanmar compared to the national average Similarly the chart on page 11 compares censored headcount ratios for two regions in Chad
These are the fundamental building blocks of the MPI Incidence Intensity Censored Headcount ratios and (weighted) Indicator contributions to MPI If you download the online data tables you will find all of these statistics (and some others) for every single country rural-urban area subnational region and for children But the goal is not just to understand poverty it is to use this information to fight poverty and suffering ndash through better policies and actions
140
Health Education Living Standards
NutritionChild
mortalityYears of
schoolingSchool
attendanceCooking
fuel Sanitation Drinking water Electricity Floor Assets
137 117 122 85 290 222 113 216 51
rarr
67
33
40
50
60
70
80
90
100
10
20
30
0
larr
larr
Hea
lthSt
anda
rd o
f Liv
ing
Nutrition
SanitationWater
Assets
Educ
atio
n
Flooring
Cooking Fuel
Child Mortality
NEHESO IS DEPRIVED IN
wwwophiorguk
8
Alkire and Robles
OPHI Briefing 47 | May 2017
Global Multidimensional Poverty Index 2017
8 9
MYANMAR
Myanmar (DHS 2014ndash15) is home to 53 million people Of these nearly 16 million or 30 are multidimensionally poor The poorest regions are Rakhine in the southwest and Shan and Kayin in the east pictured in the lightest green on the map of multidimensional poverty in Myanmar on the left In Rakhine just over half of the population (51) are multidimensionally poor with particularly high deprivations in nutrition cooking fuel sanitation assets and electricity (see the chart below) Among children aged 0-17 37 of them are poor whereas 26 of adults in Myanmar are MPI poor In rural areas child poverty rises to 44 of children whereas in urban areas itrsquos 14
MYANMAR
Kachin 1901
Shan 3952
Kayah 2303
Kayin 3694
Tanintharyi 2895
Mon 2486
Yangon 1257
Mandalay 24112
Chin 33813
8 Ayeyarwadd 390
10 Rakhine 513
11 Magway 274
Sagaing 31614
9 Bago 306
1
2
3
4
5
6
78
9
1011
1213
14
Multidimensional poverty in Myanmar
Cens
ored
hea
dcou
nt ra
tios
in th
e re
gion
pr
opor
tion
who
is p
oor a
nd d
epriv
ed in
Deprivation among the poor in Myanmar
The composition of poverty among Rakhine state and across Myanmar
60
30
50
20
10
40
0
10
20
30
40
50
60
0
Rakhine Myanmar (national)
Years of schooling
School attendance
Child mortality
Nutrition
Electricity
Sanitation
Drinking water
Floor
Cooking fuel
Assets
H ( MPI poor people)000
002
004
006
008
010
012
014
016
Composition of Myanmarrsquos MPIMPIvalue
Paul
Arp
s | F
lickr
CC
BY
20
wwwophiorguk
Alkire and Robles
10 11
Afghanistanrsquos national MPI is the highest in South Asia and 56 of Afghanis are acutely poor by the MPI Afghanistanrsquos poorest region Urozgan near central Afghanistan has an MPI of 0624 which is larger than the national MPI of Niger and 95 of people are poor This is followed by Nooristan (94) in the northeast and Badghis (79) and Kandahar (72) in the west and south of the country (see the map above) We do not have nutritional data for Afghanistan but 28 of people live in a household where a child has died ndash which is the highest figure for this indicator across every region of the world except Sub-Saharan Africa
Fully 59 of children are multidimensionally poor in Afghanistan and 53 of adults That means Afghanistan has 97 million MPI poor child ren and 75 million poor adults So well over half ndash in fact 56 of Afghanistanrsquos poor people are children Unfortunately 38 of poor people live in a household where a school-aged child is not attending school so attention to childrenrsquos deprivations is of critical importance In terms of region three-quarters of Afghanis live in rural areas where 65 of people are poor In the urban areas poverty rates are lower at 29
1
2
3
45 6 7 8
9
101112
1314
15
16
1718
1920
21
22
23
24 25 2627
2829
3031
32
33 34
AFGHANISTAN AFGHANISTAN
Herat 6331
Badghis 7932
Faryab 4943
Jawzjan 6094
Balkh 5575Kunduz 6056
Takhar 6517
Nooristan 9379
Badakhshan 6758
Ghazni 47416
Zabul 34617
Urozgan 94518Kandahar 72119
Helmand 61820
10 Kunarha 583
11 Laghman 704
12 Nangarhar 549
13 Khost 578
14 Paktya 452
15 Paktika 281
Nimroz 45421
Farah 61422
Ghor 74623
Sar-e Pol 67824
Samangan 64325
Baghlan 59726
Panjsher 25827
Daykundi 61532
Bamyan 61033
28 Kapisa 536
30 Logar 414
31 Wardak 679
Parwan 58634
29 Kabul 253
Multidimensional poverty in Afghanistan
John
Ass
elin
| Fl
ickr
CC
BY-
NC
-ND
20
OPHI Briefing 47 | May 2017
Global Multidimensional Poverty Index 2017
10 11
Chad (DHS 2014ndash15) is the fourth poorest among the 103 countries analyzed Fully 87 of people live in multidimensional poverty Over 80 of the population are poor and lack electricity adequate sanitation flooring and clean cooking fuel and over half (52) of the population are multidimensionally poor and have a school-aged child at home who is not attending school The poorest subnational regions in Chad are the drought-affected regions of Lac Wadi Fira Sila and Kanem In the regions of Lac and Kanem nearly 65 of the population are poor and have at least one malnourished woman or child (see the map above)
It might seem that in such a poor country (in 12 of Chadrsquos 20 regions more than 95 of people are poor) the MPI cannot add much analysis But the indicator details tell a new story Letrsquos compare the two poorest regions Lac and Wadi Fira ndash in which 98ndash99 of people are poor In Lac 34 of people are poor and have experienced the death of a child whereas in Wadi Fira itrsquos much lower at 20 But in Wadi Fira 97 of people lack clean drinking water whereas in Lac itrsquos 64 (the chart below) So clearly even between two extremely poor regions policy responses need to differ
CHAD CHAD
Lac and Wadi Fira Deprivation levels by indicator
Multidimensional poverty in Chad
12
3
4
5
6
789
101112
1314 15
1617
1819
Borkou Tibesti 891
Ennedi 9682Wadi Fira 993Ouaddaiuml 9534
Sila 9895Salamat 9786Moyen Chari 7417
Mayo Kebbi Ouest 86312Mayo Kebbi Est 86113
8 Mandoul 881
10 Logone occidental 791
11 Tandjileacute 843
Chari Baguirmi 96914
9 Logone oriental 881
15 Gueacutera 954
16 Hadjer Lamis 954
17 Lac 981
18 Kanem 98519 Barh El Gazal 957
20 Batha 957
20
YS Years of schooling
School attendance
CM Child mortality
N Nutrition
Electricity
Sanitation
Drinking water
Floor
Cooking fuel
Assets
SA
CF
S
DW
E
F
A
30
50
20
10
0
40
60
70
80
90
100
N CM YS SA CF S DW E F A
Ken
Doe
rr |
Flic
kr C
C B
Y 2
0
wwwophiorguk
Alkire and Robles
12 13
NEWS FLASHMPI DISAGGREGATION BY DISABILITY STATUS SOON TO BE STANDARD
In a recent study we disaggregated the global MPI by disability status for the first time[12] It was not previously possible to disaggregate the global MPI by disability but surveys that include standardized questions on disability are set to increase
Ugandarsquos 2011 Demographic and Health Survey (DHS) pioneered the Washington Group questions on disability a form of which will be included in DHS and Multiple Indicator Cluster Surveys (MICS) from 2017 onwards In Uganda 4 of people aged 5 years and above were living with a disability and 22 of all people live in a household where at least one member lives with a severe disability
As Figure 6 above shows households with at least one member with a severe disability faced higher levels of multidimensional poverty ndash a
77 poverty rate as compared with 69 among households without disability As comparable data become available the global MPI will be disaggregated by disability status in order to track ndash and hopefully to help reduce ndash the interlinkages among these conditions
Fig 6 Incidence of multidimensional poverty in Uganda by disability status
0
01
02
03
04
05
06
07
08
09
03
05
02
01
0
04
06
07
08
09
without disabilitywith disability
Bria
n W
olfe
| Fl
ickr
CC
BY-
NC
20
OPHI Briefing 47 | May 2017
Global Multidimensional Poverty Index 2017
12 13
DESTITUTIONThe distressing condition of destitution
bull Half of the MPI poor people live in destitution
bull In six countries and 117 subnational regions 50 or more of people are destitute
bull Most of the highest levels of destitution are found in Sub-Saharan Africa
bull Pakistan has more destitute people ndash 37 million ndash than East Asia and the Pacific (26 million) or the Arab States (26 million)
bull India has more destitute people (295 million) than Sub-Saharan Africa (282 million)
bull But most of the destitute people ndash 362 of the 706 million ndash live in South Asia
The MPI reflects acute multidimensional poverty in developing countries It measures absolute levels of poverty ndash which are very low in a number of countries such as China and many areas of Latin America For many countries a lsquomoderatersquo measure of multidimensional poverty is needed
Even so since 2014 we have reported a measure of destitution that identifies a subset of the MPI poor who are the poorest of the poor Unfortunately nearly half of all MPI poor people are destitute ndash 706 million men women and children
As with the MPI destitute people are deprived in one-third or more weighted indicators but the destitution indicators are more extreme They include severe malnutrition losing two or more children having a child out of primary school having no household member who has completed more than one year of schooling using open defecation fetching water that is unsafe or 45 or more minutes away not owning even a mobile phone or radio and cooking with wood or dung or straw only[13] To leave no one behind we must take urgent action to end the distressing condition of destitution
Figure 7 on the next page shows the percentage of the population who are MPI poor which is the height of the beige bar and the percentage who are living in destitution which is the height of the red subcomponent At a glance we can see that destitution rates ranges from 0 to 714 of the population What else do we see
First there are pockets of destitution even in low MPI countries In countries like Turkmenistan Bosnia and Herzegovina Barbados Uzbekistan and Azerbaijan 30 or more of MPI poor people are destitute But in South Africa less than 9 of the MPI poor are destitute
Second there are positive stories In 57 countries less than 10 of the population are destitute Similarly 506 subnational regions have less than 10 of the population living in destitution
Third in general destitution rates tend to be lower than $190day extreme income poverty rates But destitution is markedly higher than income poverty in Pakistan Mauritania Sudan Gambia Chad Ethiopia Niger and South Sudan This underscores the importance of measuring and fighting poverty in all its forms and dimensions
In some countries and regions destitution is still lsquothe normrsquo because it affects half of more of the population Six countries have more than 50 of their population living in destitution ndash and together they are home to 100 million poor people Drilling down in 117 subnational regions 50-92 of the population are destitute (161 million) These high destitution regions are mainly located in Sub-Saharan Africa Yet there are pockets of destitution in other regions In East Asia and the Pacific eight regions within Timor LrsquoEste have over 50 of people living in destitution Within the Arab States 58 of people in Sudanrsquos Central Darfur and 50 of people in Yemenrsquos Hajjah regions are destitute Within South Asia Afghanistanrsquos Urozgan Nooristan and Kandahar provinces have 50ndash78 of people living in destitution In Latin America six regions of Haiti plus Potosi in Bolivia have 20ndash36 of people living in destitution
Looking at the high rates of destitution we might presume that destitution is largely an African story But it is not Of the 706 million people who are destitute 362 million live in South Asia and 282 million in Sub-Saharan Africa In addition 26 million live in the Arab States another 26 million live in East Asia and over 8 million live in Latin America plus nearly 300000 in Europe and Central Asia India has over 295 million destitute people more than the total number if destitute people in all of Sub-Saharan Africa And Pakistan has 37 million destitute people according to its 201213 dataset more than either the Arab States or East Asia and the Pacific region
The story of destitution is not over But it should be These figures call for vigorous attention to be focused on destitution in South Asia and in Sub-Saharan Africa ndash and for even low poverty countries to track and empty the pockets of deep poverty in their midst
wwwophiorguk
Alkire and Robles
14 15
Fig 7 Comparing the headcount ratios of MPI poor destitute and $190day poor
$190day poorDestituteMPI poor
20 040 6080100
South SudanNigerEthiopiaChadBurkina FasoSomaliaSierra LeoneBurundiMaliCentral African RepublicGuineaDem Rep of CongoLiberiaUgandaMozambiqueTimor-LesteMadagascarGuinea -BissauBeninGambiaSenegalCote drsquoIvoireTanzaniaZambiaAfghanistanRwandaMalawiSudanNigeriaMauritaniaTogoHaitiCameroonYemenPakistanNamibiaIndiaBangladeshKenyaRep of CongoComorosZimbabweLao Peoplersquos Dem RepGhanaCambodiaLesothoVanuatuMyanmarDjiboutiNepalBhutanGuatemalaBoliviaSao Tome and PrincipeGabonNicaraguaSwazilandHondurasIndonesiaMoroccoTajikistanIraqPhilippinesPeruMongoliaSouth AfricaDominican RepublicViet NamEl SalvadorSurinameTrinidad and TobagoColombiaAzerbaijanBrazilMaldivesBelizeSyrian Arab RepublicChinaEgyptEcuadorGuyanaUzbekistanJamaicaJordanLibyaAlgeriaAlbaniaUkraineMexicoTunisiaPalestineSaint LuciaBarbadosThailandMoldovaMacedoniaBosnia and HerzegovinaKyrgyzstanTurkmenistanArmeniaMontenegro
KazakhstanSerbia
OPHI Briefing 47 | May 2017
Global Multidimensional Poverty Index 2017
14 15
REFERENCESAddis Ababa Accord (2015) lsquoAccord of the Third International Conference on Financing for Development Revised Draft 6 Mayrsquo
Alkire S and Foster J (2011) lsquoCounting and multidimensional poverty measurementrsquo Journal of Public Economics vol 95(7ndash8) pp 476ndash487
Alkire S Dorji L Gyeltshen S and Minten T (2016) Child Poverty in Bhutan Insights from Multidimensional Child Poverty Index and Qualitative Interviews with Poor Children National Statistics Bureau Bhutan
Alkire S and Robles G (2017) lsquoMultidimensional Poverty Index ndash summer 2017 brief methodological note and resultsrsquo OPHI MPI Methodological Notes 44 Oxford Poverty and Human Development Initiative University of Oxford
Alkire S and Santos ME (2014) lsquoMeasuring acute poverty in the developing world robustness and scope of the multidimensional poverty indexrsquo World Development vol 59 pp 251ndash274
Alkire S Jindra C Robles G and Vaz A (2017) lsquoChildrenrsquos multidimensional poverty disaggregating the global MPIrsquo OPHI Briefing 46 Oxford Poverty and Human Development Initiative University of Oxford
Organisation of Economic Cooperation and Development (OECD) (2017) lsquoCreditor reporting system (CRS) aid activity databasersquo Available here (Last accessed on 13 May 2017)
Pinilla-Roncancio M and Alkire S (2017) lsquoHow poor are people with disabilities around the globe A multidimensional perspectiversquo OPHI Research in Progress 48a Oxford Poverty and Human Development Initiative University of Oxford
United Nations (2015) Transforming Our World The 2030 Agenda for Sustainable Development ARES701
NOTES[1] All aggregates use 2013 population data[2] Section 51 paragraph 135[3] Addis Ababa Accord 2015 paragraph 119[4] Discussions are underway to consider whether data permit
adjustments to further align the global MPI with the SDGs[5] This section draws on lsquoChildrenrsquos multidimensional poverty
disaggregating the global MPIrsquo by Alkire et al (2017)[6] As with $190day poverty children are identified as poor
if they live in an MPI poor household Alternatively Child MPIs can be constructed that reflect each individual childrsquos deprivations by gender and age cohort (see Alkire et al 2016) but data are not available to build a global Child MPI with individual child data
[7] $190 is not available for Afghanistan Omitting Afghani stan 414 of people are MPI poor in South Asia
[8] We use income category definitions from July 2016 throughout this document
[9] The global MPI covers 92 of all people living in low or middle income countries It covers 99 of people living in low income countries (29 countries) 99 of the population in lower middle income countries (43) and 82 in upper middle income countries (29)
[10] There is no information on allocation to Macedonia and Palestine For those countries with MPI data from 2016 ODA flows allocated between 2011 and 2015 have been considered For South Sudan with 2010 MPI data ODA flows between 2011 and 2015 are used as this is the closest five-year period available
[11] The categories included are basic education basic health basic drinking water supply and basic sanitation (alone and together) electric power transmission and distribution low-cost housing multisector aid for basic social services developmental food aid and food security assistance
[12] Pinilla and Alkire 2017
[13] The indicators of electricity and flooring are unchanged
ONLINE RESOURCES
OPHIrsquos interactive databank enables you to study over 100 developing countries in terms of multidimensional poverty Choose interactive data visualizations to explore where and in which indicators people are poor or destitute and to show how MPI values compare with complementary data such as $190day poverty Or download a country briefing file for any country which contains explanations of its MPI and is illustrated with graphs maps and charts Excel data tables have all the details of MPI plus population standard errors sample sizes and much more Methodological notes provide any particularities of each countryrsquos survey data treatment
See wwwophiorgukmultidimensional-poverty-index
Oxford Poverty and Human Development Initiative (OPHI)
Oxford Department of International Development (ODID)Queen Elizabeth House (QEH)University of Oxford3 Mansfield Road Oxford OX1 3TBUnited Kingdom
ophi_oxford
ophioxford
ophi_oxford
Telephone+44 (0)1865 271915
Emailophiqehoxacuk
Websitewwwophiorguk
wwwophiorguk
Alkire and Robles
16 PB
MU
LTID
IMEN
SIO
NA
L PO
VERT
Y IN
DEX
ACR
OSS
TH
E W
ORL
D
0 ndash
005
01
ndash 0
2
02
ndash 0
3
03
ndash 0
4
04
ndash 0
5
05
+
005
ndash 0
1
OXFORD POVERTY amp HUMAN DEVELOPMENT INITIATIVE
OPHIT E N Y E A R
OPHIANNIVERSARY

OPHI Briefing 47 | May 2017
Global Multidimensional Poverty Index 2017
4 5
Half of MPI poor people live in South AsiaAbout half of the MPI poor live in South Asia (48) and 36 live in Sub-Saharan Africa This is a different distribution from $190day income poverty estimations aggregated in the same
way ndash because MPI is higher in South Asia In South Asia 416 of the population are MPI poor and 192 are poor by the extreme income poverty measure ndash so the rate is more than doubled[7] In Sub-Saharan Africa multidimensional poverty affects 601 of the population $190day poverty 464 so MPI poverty is one-third higher
Over one billion MPI poor people live in middle income countries[8]
Over one billion people ndash almost three quarters of all multi-dimensionally poor people (72) ndash live in middle income
countries Of these 86 million poor people live in in upper middle income countries and 961 million in lower middle income countries[9] What is striking is that the income cate-gories have overlapping levels of multi dimensio nal poverty In upper middle income countries the incidence of MPI varies from 0ndash42 in lower middle income countries itrsquos 0ndash68 and in low income countries 29ndash91 of national
Fig 4a Distribution of population by income category
Fig 4b Distribution of MPI poor persons by income category
Fig 3a Distribution of population by region
Sub-Saharan Africa (16)
Europe and Central Asia (2)
Latin America and Caribbean (9)
South Asia (31)
Arab States (6)
East Asia and the Pacific (36)
Fig 3b Distribution of MPI poor persons by region
Sub-Saharan Africa (36)
Europe and Central Asia (0)
Latin America and Caribbean (2)
East Asia and the Pacific (10)
Arab States (4)
South Asia (48)
Upper middle income (6)
High income non-OECD (0)
Low income (28)
Lower middle income (66)
Upper middle income (35)
High income non-OECD (0)
Low income (10)
Lower middle income (52)
wwwophiorguk
Alkire and Robles
6 7
populations live in acute multidimensional poverty When we focused on subnational regions the incidence of MPI varies from 0ndash74 in upper middle income countries from 0ndash92 in lower middle income countries and from 4ndash99 in low income countries
International aid and multidimensional poverty Differently distributedAid flows are complex and are only part of any poverty reduction strategy Measured in international currencies they do not reflect the unit costs of reducing a deprivation They must be analyzed alongside national public expenditures and other flows they supplement Yet the MPI portrays acute multidimensional poverty and unmet needs for public health and nutrition inputs basic education water sanitation housing electricity and other needs So a natural question is to what extent is the aid that deliberately targets those priority sectors flowing to the places where people who experience these overlapping deprivations live
To start such a conversation we describe aid allocations for 101 of the countries included in the global MPI 2017[10] using the information in the Creditor Reporting System (CRS) from the Organisation of Economic Cooperation and Development (OECD) that contains information from Development Assistance Committee (DAC) countries and International Organizations (IO) We only consider Official Development Assistance (ODA) flows and we do not yet include Other Official Flows (OOF) We also include only aid commitments to priority sectors that reflect MPI indicators[11] in a range of three years from the date of the survey used for each country They add up to $45 billion in 2015 constant USD
Table 3 shows that 28 of the MPI poor live in countries classified as low income Those countries received 42 of the donor flows to priority social sectors But 66 of MPI poor people live in lower middle income countries which receive 49 of these aid flows This is shaped by very low allocations to ndia where each poor person is allocated $135 of aid And 6 of MPI poor people live in upper middle income countries which receive a generous 9 of aid flows The flows from IO are more reflective of the distribution of MPI poor than the DAC flows
Analysis of aid flows to individual countries is also important If we consider ODA from DAC donors which is thought to represent the bulk of development aid the countries that receive very low aid flows in priority social sectors may not be those who need it least One of the countries with the lowest aid flows is a high income country Trinidad and Tobago
Fig 5a Priority sector ODA flows from DAC countries
ODA from DAC countries to priority sectors of 101 countries by income category of recipients
Upper middle income (12)
Lower middle income (44)
Low income (44)
Fig 5b Priority Sector ODA flows from DAC countries and IO
ODA from DAC and IO to priority sectors of 101 countries by income category of recipients
Lower middle income (49)
Upper middle income (9)
Low income (42)
and two are upper middle income countries Algeria and also China ndash which has mobilized tremendous domestic resources and political will for poverty reduction by 2020 But eight lower middle income countries including the most populous in terms of MPI poor such as Pakistan ($230) Nigeria ($140) and India ($064) receive very low allocations in priority social sector aid from DAC countries And nine of the 20 countries in which aid allocation from DAC donors in priority social sectors totals less than $550 per person are low income countries These include Ethiopia ($517)
OPHI Briefing 47 | May 2017
Global Multidimensional Poverty Index 2017
6 7
Total priority sectors
ODA from DAC countries three years previous to country-specific MPI
ODA from IO three years previous to country-specific MPI
ODA from IO and DAC three years previous to country-specific MPI
Share of MPI poor people
Low income
Lower middle income
Upper middle income
Total
441
435
124
100
407
545
49
100
421
494
85
100
28
66
6
100
Table 3 Allocation of ODA from DAC countries and IO for priority sectors and distribution of MPI poor income categories
DAC = Development Assistance Committee (bilateral aid) IO = International Organisations (multilateral aid) including the World Bank regional development banks some UN agencies and other multilateral agencies
Note
Niger ($450) Chad ($210) and Somalia ($210) In each of these four countries over 80 of people are MPI poor The remaining low income countries receive $6 to $32 per MPI poor person from DAC countries
To understand whether and when aid is catalyzing action and further public expenditure to fight poverty in multiple dimensions requires in-depth analysis What is clear is that the distribution of ODA flows differ significantly from the distribution of multidimensionally poor people
GOING UP CLOSE MPI WITHIN MYANMAR AFGHANISTAN AND CHAD
The MPI and its indicators are disaggregated by 988 subnational regions in 78 countries revealing an astonishing subnational diversity The poorest regions are in Chad Burkina Faso Niger Ethiopia South Sudan Nigeria Uganda and Afghanistan
For example in 52 subnational regions from 16 countries over 90 of people are poor ndash 110 million out of the 119 million living in these regions are MPI poor
These disaggregations show subnational diversity Inside Afghanistan poverty rates vary from 25 in Kabul to 95 in Urozgan In Chad itrsquos 53ndash99 In Nigeria the range is a massive 8ndash92 always with capital cities having the lowest MPI Of course the range also depends upon the number and size of the subnational regions
The case studies below profile subnational analyses of Myanmar Afghanistan and Chad
The legend used for the maps is the following
125 ndash 281
282 ndash 452
453 ndash 583
584 ndash 651
652 ndash 843844 ndash 954955 ndash 990
MPI incidence ()
wwwophiorguk
Alkire and Robles
8 9
USERrsquoS GUIDE TO INTERPRETING THE MPI
Sometimes people presume that the MPI is lsquojustrsquo an index ndash one number ndash showing the level of poverty But as these case studies show the MPI is always unpacked in different ways to show who is poor and how they are poor By design the MPI can be lsquobroken downrsquo into interesting consistent and partial subindices Here is a userrsquos guide to interpreting the MPI
Headcount Ratio or Incidence Letrsquos start with the most familiar number the percentage of people who are MPI poor This is called the headcount ratio or incidence of poverty or the lsquopoverty ratersquo For example in Myanmar 301 of people are poor because they are deprived in 3333 or more of the weighted MPI indicators
Intensity This is the average deprivation score among the poor In Myanmar intensity is 446 This means that the poor in Myanmar are on average deprived in 446 of the weighted indicators For example consider Neheso She is deprived in both health indicators as well as in cooking fuel sanitation water flooring and assets Her deprivations are labelled on the left hand side of the chart on the right The height of the boxes shows the weight of each indicator On the right hand side we stack up her deprivations and find that her deprivation score is 60 All poor people have deprivation scores between 3333 and 100 The average of the deprivation scores of all poor people is intensity
The MPI When you multiply 301 x 446 you obtain 0134 This is the MPI for Myanmar It shows that poor people in Myanmar are deprived in 134 of the deprivations that would be experienced if every person in Myanmar was poor and was deprived in all indicators The important thing is that MPI ranges from 0 to 1 and higher levels show higher poverty
How to Reduce MPIMPI goes down if a) somebody becomes non-poor so the incidence of poverty goes down or b) the intensity goes down because a poor person gets rid of a deprivation To accomplish either one though what is needed is to reduce deprivations in any one of the MPIrsquos ten indicators So we need to drill down and see how to do that
The MPI can also be broken down by indicators which is a useful tool for public policy The MPI itself is simply the percentage of people who are poor and deprived in each indicator multiplied by the weight on that indicator You add them up and obtain the value of MPI Remember that health and education indicators are weighted at 16 and living standard at 118 So in Myanmar the MPI
(0134) is also equal to (137+ 117+122+85)(16) + (29+222+113+216+51+14)(118) Visually you can see that the height of the graphic on the bottom left of page 9 is 0134 and each indicator lsquocontributesrsquo to it So if we reduce any depri vation of any poor person in any indicator what happens The height of the MPI goes down
If you prefer you can simply look at the table at the bottom of the page which shows the percentage of people in Myanmar who a) are MPI poor (because they have overlapping deprivations that stack up to one-third or more) and b) are deprived in each indicator For example 122 of people are MPI poor and have no one in their household who has completed five years of schooling We call these the lsquocensored headcount ratiosrsquo of each indicator If any of these very important deprivations goes down MPI goes down The bottom right hand chart on page 9 shows the censored headcount ratios for the Rakhine in Myanmar compared to the national average Similarly the chart on page 11 compares censored headcount ratios for two regions in Chad
These are the fundamental building blocks of the MPI Incidence Intensity Censored Headcount ratios and (weighted) Indicator contributions to MPI If you download the online data tables you will find all of these statistics (and some others) for every single country rural-urban area subnational region and for children But the goal is not just to understand poverty it is to use this information to fight poverty and suffering ndash through better policies and actions
140
Health Education Living Standards
NutritionChild
mortalityYears of
schoolingSchool
attendanceCooking
fuel Sanitation Drinking water Electricity Floor Assets
137 117 122 85 290 222 113 216 51
rarr
67
33
40
50
60
70
80
90
100
10
20
30
0
larr
larr
Hea
lthSt
anda
rd o
f Liv
ing
Nutrition
SanitationWater
Assets
Educ
atio
n
Flooring
Cooking Fuel
Child Mortality
NEHESO IS DEPRIVED IN
wwwophiorguk
8
Alkire and Robles
OPHI Briefing 47 | May 2017
Global Multidimensional Poverty Index 2017
8 9
MYANMAR
Myanmar (DHS 2014ndash15) is home to 53 million people Of these nearly 16 million or 30 are multidimensionally poor The poorest regions are Rakhine in the southwest and Shan and Kayin in the east pictured in the lightest green on the map of multidimensional poverty in Myanmar on the left In Rakhine just over half of the population (51) are multidimensionally poor with particularly high deprivations in nutrition cooking fuel sanitation assets and electricity (see the chart below) Among children aged 0-17 37 of them are poor whereas 26 of adults in Myanmar are MPI poor In rural areas child poverty rises to 44 of children whereas in urban areas itrsquos 14
MYANMAR
Kachin 1901
Shan 3952
Kayah 2303
Kayin 3694
Tanintharyi 2895
Mon 2486
Yangon 1257
Mandalay 24112
Chin 33813
8 Ayeyarwadd 390
10 Rakhine 513
11 Magway 274
Sagaing 31614
9 Bago 306
1
2
3
4
5
6
78
9
1011
1213
14
Multidimensional poverty in Myanmar
Cens
ored
hea
dcou
nt ra
tios
in th
e re
gion
pr
opor
tion
who
is p
oor a
nd d
epriv
ed in
Deprivation among the poor in Myanmar
The composition of poverty among Rakhine state and across Myanmar
60
30
50
20
10
40
0
10
20
30
40
50
60
0
Rakhine Myanmar (national)
Years of schooling
School attendance
Child mortality
Nutrition
Electricity
Sanitation
Drinking water
Floor
Cooking fuel
Assets
H ( MPI poor people)000
002
004
006
008
010
012
014
016
Composition of Myanmarrsquos MPIMPIvalue
Paul
Arp
s | F
lickr
CC
BY
20
wwwophiorguk
Alkire and Robles
10 11
Afghanistanrsquos national MPI is the highest in South Asia and 56 of Afghanis are acutely poor by the MPI Afghanistanrsquos poorest region Urozgan near central Afghanistan has an MPI of 0624 which is larger than the national MPI of Niger and 95 of people are poor This is followed by Nooristan (94) in the northeast and Badghis (79) and Kandahar (72) in the west and south of the country (see the map above) We do not have nutritional data for Afghanistan but 28 of people live in a household where a child has died ndash which is the highest figure for this indicator across every region of the world except Sub-Saharan Africa
Fully 59 of children are multidimensionally poor in Afghanistan and 53 of adults That means Afghanistan has 97 million MPI poor child ren and 75 million poor adults So well over half ndash in fact 56 of Afghanistanrsquos poor people are children Unfortunately 38 of poor people live in a household where a school-aged child is not attending school so attention to childrenrsquos deprivations is of critical importance In terms of region three-quarters of Afghanis live in rural areas where 65 of people are poor In the urban areas poverty rates are lower at 29
1
2
3
45 6 7 8
9
101112
1314
15
16
1718
1920
21
22
23
24 25 2627
2829
3031
32
33 34
AFGHANISTAN AFGHANISTAN
Herat 6331
Badghis 7932
Faryab 4943
Jawzjan 6094
Balkh 5575Kunduz 6056
Takhar 6517
Nooristan 9379
Badakhshan 6758
Ghazni 47416
Zabul 34617
Urozgan 94518Kandahar 72119
Helmand 61820
10 Kunarha 583
11 Laghman 704
12 Nangarhar 549
13 Khost 578
14 Paktya 452
15 Paktika 281
Nimroz 45421
Farah 61422
Ghor 74623
Sar-e Pol 67824
Samangan 64325
Baghlan 59726
Panjsher 25827
Daykundi 61532
Bamyan 61033
28 Kapisa 536
30 Logar 414
31 Wardak 679
Parwan 58634
29 Kabul 253
Multidimensional poverty in Afghanistan
John
Ass
elin
| Fl
ickr
CC
BY-
NC
-ND
20
OPHI Briefing 47 | May 2017
Global Multidimensional Poverty Index 2017
10 11
Chad (DHS 2014ndash15) is the fourth poorest among the 103 countries analyzed Fully 87 of people live in multidimensional poverty Over 80 of the population are poor and lack electricity adequate sanitation flooring and clean cooking fuel and over half (52) of the population are multidimensionally poor and have a school-aged child at home who is not attending school The poorest subnational regions in Chad are the drought-affected regions of Lac Wadi Fira Sila and Kanem In the regions of Lac and Kanem nearly 65 of the population are poor and have at least one malnourished woman or child (see the map above)
It might seem that in such a poor country (in 12 of Chadrsquos 20 regions more than 95 of people are poor) the MPI cannot add much analysis But the indicator details tell a new story Letrsquos compare the two poorest regions Lac and Wadi Fira ndash in which 98ndash99 of people are poor In Lac 34 of people are poor and have experienced the death of a child whereas in Wadi Fira itrsquos much lower at 20 But in Wadi Fira 97 of people lack clean drinking water whereas in Lac itrsquos 64 (the chart below) So clearly even between two extremely poor regions policy responses need to differ
CHAD CHAD
Lac and Wadi Fira Deprivation levels by indicator
Multidimensional poverty in Chad
12
3
4
5
6
789
101112
1314 15
1617
1819
Borkou Tibesti 891
Ennedi 9682Wadi Fira 993Ouaddaiuml 9534
Sila 9895Salamat 9786Moyen Chari 7417
Mayo Kebbi Ouest 86312Mayo Kebbi Est 86113
8 Mandoul 881
10 Logone occidental 791
11 Tandjileacute 843
Chari Baguirmi 96914
9 Logone oriental 881
15 Gueacutera 954
16 Hadjer Lamis 954
17 Lac 981
18 Kanem 98519 Barh El Gazal 957
20 Batha 957
20
YS Years of schooling
School attendance
CM Child mortality
N Nutrition
Electricity
Sanitation
Drinking water
Floor
Cooking fuel
Assets
SA
CF
S
DW
E
F
A
30
50
20
10
0
40
60
70
80
90
100
N CM YS SA CF S DW E F A
Ken
Doe
rr |
Flic
kr C
C B
Y 2
0
wwwophiorguk
Alkire and Robles
12 13
NEWS FLASHMPI DISAGGREGATION BY DISABILITY STATUS SOON TO BE STANDARD
In a recent study we disaggregated the global MPI by disability status for the first time[12] It was not previously possible to disaggregate the global MPI by disability but surveys that include standardized questions on disability are set to increase
Ugandarsquos 2011 Demographic and Health Survey (DHS) pioneered the Washington Group questions on disability a form of which will be included in DHS and Multiple Indicator Cluster Surveys (MICS) from 2017 onwards In Uganda 4 of people aged 5 years and above were living with a disability and 22 of all people live in a household where at least one member lives with a severe disability
As Figure 6 above shows households with at least one member with a severe disability faced higher levels of multidimensional poverty ndash a
77 poverty rate as compared with 69 among households without disability As comparable data become available the global MPI will be disaggregated by disability status in order to track ndash and hopefully to help reduce ndash the interlinkages among these conditions
Fig 6 Incidence of multidimensional poverty in Uganda by disability status
0
01
02
03
04
05
06
07
08
09
03
05
02
01
0
04
06
07
08
09
without disabilitywith disability
Bria
n W
olfe
| Fl
ickr
CC
BY-
NC
20
OPHI Briefing 47 | May 2017
Global Multidimensional Poverty Index 2017
12 13
DESTITUTIONThe distressing condition of destitution
bull Half of the MPI poor people live in destitution
bull In six countries and 117 subnational regions 50 or more of people are destitute
bull Most of the highest levels of destitution are found in Sub-Saharan Africa
bull Pakistan has more destitute people ndash 37 million ndash than East Asia and the Pacific (26 million) or the Arab States (26 million)
bull India has more destitute people (295 million) than Sub-Saharan Africa (282 million)
bull But most of the destitute people ndash 362 of the 706 million ndash live in South Asia
The MPI reflects acute multidimensional poverty in developing countries It measures absolute levels of poverty ndash which are very low in a number of countries such as China and many areas of Latin America For many countries a lsquomoderatersquo measure of multidimensional poverty is needed
Even so since 2014 we have reported a measure of destitution that identifies a subset of the MPI poor who are the poorest of the poor Unfortunately nearly half of all MPI poor people are destitute ndash 706 million men women and children
As with the MPI destitute people are deprived in one-third or more weighted indicators but the destitution indicators are more extreme They include severe malnutrition losing two or more children having a child out of primary school having no household member who has completed more than one year of schooling using open defecation fetching water that is unsafe or 45 or more minutes away not owning even a mobile phone or radio and cooking with wood or dung or straw only[13] To leave no one behind we must take urgent action to end the distressing condition of destitution
Figure 7 on the next page shows the percentage of the population who are MPI poor which is the height of the beige bar and the percentage who are living in destitution which is the height of the red subcomponent At a glance we can see that destitution rates ranges from 0 to 714 of the population What else do we see
First there are pockets of destitution even in low MPI countries In countries like Turkmenistan Bosnia and Herzegovina Barbados Uzbekistan and Azerbaijan 30 or more of MPI poor people are destitute But in South Africa less than 9 of the MPI poor are destitute
Second there are positive stories In 57 countries less than 10 of the population are destitute Similarly 506 subnational regions have less than 10 of the population living in destitution
Third in general destitution rates tend to be lower than $190day extreme income poverty rates But destitution is markedly higher than income poverty in Pakistan Mauritania Sudan Gambia Chad Ethiopia Niger and South Sudan This underscores the importance of measuring and fighting poverty in all its forms and dimensions
In some countries and regions destitution is still lsquothe normrsquo because it affects half of more of the population Six countries have more than 50 of their population living in destitution ndash and together they are home to 100 million poor people Drilling down in 117 subnational regions 50-92 of the population are destitute (161 million) These high destitution regions are mainly located in Sub-Saharan Africa Yet there are pockets of destitution in other regions In East Asia and the Pacific eight regions within Timor LrsquoEste have over 50 of people living in destitution Within the Arab States 58 of people in Sudanrsquos Central Darfur and 50 of people in Yemenrsquos Hajjah regions are destitute Within South Asia Afghanistanrsquos Urozgan Nooristan and Kandahar provinces have 50ndash78 of people living in destitution In Latin America six regions of Haiti plus Potosi in Bolivia have 20ndash36 of people living in destitution
Looking at the high rates of destitution we might presume that destitution is largely an African story But it is not Of the 706 million people who are destitute 362 million live in South Asia and 282 million in Sub-Saharan Africa In addition 26 million live in the Arab States another 26 million live in East Asia and over 8 million live in Latin America plus nearly 300000 in Europe and Central Asia India has over 295 million destitute people more than the total number if destitute people in all of Sub-Saharan Africa And Pakistan has 37 million destitute people according to its 201213 dataset more than either the Arab States or East Asia and the Pacific region
The story of destitution is not over But it should be These figures call for vigorous attention to be focused on destitution in South Asia and in Sub-Saharan Africa ndash and for even low poverty countries to track and empty the pockets of deep poverty in their midst
wwwophiorguk
Alkire and Robles
14 15
Fig 7 Comparing the headcount ratios of MPI poor destitute and $190day poor
$190day poorDestituteMPI poor
20 040 6080100
South SudanNigerEthiopiaChadBurkina FasoSomaliaSierra LeoneBurundiMaliCentral African RepublicGuineaDem Rep of CongoLiberiaUgandaMozambiqueTimor-LesteMadagascarGuinea -BissauBeninGambiaSenegalCote drsquoIvoireTanzaniaZambiaAfghanistanRwandaMalawiSudanNigeriaMauritaniaTogoHaitiCameroonYemenPakistanNamibiaIndiaBangladeshKenyaRep of CongoComorosZimbabweLao Peoplersquos Dem RepGhanaCambodiaLesothoVanuatuMyanmarDjiboutiNepalBhutanGuatemalaBoliviaSao Tome and PrincipeGabonNicaraguaSwazilandHondurasIndonesiaMoroccoTajikistanIraqPhilippinesPeruMongoliaSouth AfricaDominican RepublicViet NamEl SalvadorSurinameTrinidad and TobagoColombiaAzerbaijanBrazilMaldivesBelizeSyrian Arab RepublicChinaEgyptEcuadorGuyanaUzbekistanJamaicaJordanLibyaAlgeriaAlbaniaUkraineMexicoTunisiaPalestineSaint LuciaBarbadosThailandMoldovaMacedoniaBosnia and HerzegovinaKyrgyzstanTurkmenistanArmeniaMontenegro
KazakhstanSerbia
OPHI Briefing 47 | May 2017
Global Multidimensional Poverty Index 2017
14 15
REFERENCESAddis Ababa Accord (2015) lsquoAccord of the Third International Conference on Financing for Development Revised Draft 6 Mayrsquo
Alkire S and Foster J (2011) lsquoCounting and multidimensional poverty measurementrsquo Journal of Public Economics vol 95(7ndash8) pp 476ndash487
Alkire S Dorji L Gyeltshen S and Minten T (2016) Child Poverty in Bhutan Insights from Multidimensional Child Poverty Index and Qualitative Interviews with Poor Children National Statistics Bureau Bhutan
Alkire S and Robles G (2017) lsquoMultidimensional Poverty Index ndash summer 2017 brief methodological note and resultsrsquo OPHI MPI Methodological Notes 44 Oxford Poverty and Human Development Initiative University of Oxford
Alkire S and Santos ME (2014) lsquoMeasuring acute poverty in the developing world robustness and scope of the multidimensional poverty indexrsquo World Development vol 59 pp 251ndash274
Alkire S Jindra C Robles G and Vaz A (2017) lsquoChildrenrsquos multidimensional poverty disaggregating the global MPIrsquo OPHI Briefing 46 Oxford Poverty and Human Development Initiative University of Oxford
Organisation of Economic Cooperation and Development (OECD) (2017) lsquoCreditor reporting system (CRS) aid activity databasersquo Available here (Last accessed on 13 May 2017)
Pinilla-Roncancio M and Alkire S (2017) lsquoHow poor are people with disabilities around the globe A multidimensional perspectiversquo OPHI Research in Progress 48a Oxford Poverty and Human Development Initiative University of Oxford
United Nations (2015) Transforming Our World The 2030 Agenda for Sustainable Development ARES701
NOTES[1] All aggregates use 2013 population data[2] Section 51 paragraph 135[3] Addis Ababa Accord 2015 paragraph 119[4] Discussions are underway to consider whether data permit
adjustments to further align the global MPI with the SDGs[5] This section draws on lsquoChildrenrsquos multidimensional poverty
disaggregating the global MPIrsquo by Alkire et al (2017)[6] As with $190day poverty children are identified as poor
if they live in an MPI poor household Alternatively Child MPIs can be constructed that reflect each individual childrsquos deprivations by gender and age cohort (see Alkire et al 2016) but data are not available to build a global Child MPI with individual child data
[7] $190 is not available for Afghanistan Omitting Afghani stan 414 of people are MPI poor in South Asia
[8] We use income category definitions from July 2016 throughout this document
[9] The global MPI covers 92 of all people living in low or middle income countries It covers 99 of people living in low income countries (29 countries) 99 of the population in lower middle income countries (43) and 82 in upper middle income countries (29)
[10] There is no information on allocation to Macedonia and Palestine For those countries with MPI data from 2016 ODA flows allocated between 2011 and 2015 have been considered For South Sudan with 2010 MPI data ODA flows between 2011 and 2015 are used as this is the closest five-year period available
[11] The categories included are basic education basic health basic drinking water supply and basic sanitation (alone and together) electric power transmission and distribution low-cost housing multisector aid for basic social services developmental food aid and food security assistance
[12] Pinilla and Alkire 2017
[13] The indicators of electricity and flooring are unchanged
ONLINE RESOURCES
OPHIrsquos interactive databank enables you to study over 100 developing countries in terms of multidimensional poverty Choose interactive data visualizations to explore where and in which indicators people are poor or destitute and to show how MPI values compare with complementary data such as $190day poverty Or download a country briefing file for any country which contains explanations of its MPI and is illustrated with graphs maps and charts Excel data tables have all the details of MPI plus population standard errors sample sizes and much more Methodological notes provide any particularities of each countryrsquos survey data treatment
See wwwophiorgukmultidimensional-poverty-index
Oxford Poverty and Human Development Initiative (OPHI)
Oxford Department of International Development (ODID)Queen Elizabeth House (QEH)University of Oxford3 Mansfield Road Oxford OX1 3TBUnited Kingdom
ophi_oxford
ophioxford
ophi_oxford
Telephone+44 (0)1865 271915
Emailophiqehoxacuk
Websitewwwophiorguk
wwwophiorguk
Alkire and Robles
16 PB
MU
LTID
IMEN
SIO
NA
L PO
VERT
Y IN
DEX
ACR
OSS
TH
E W
ORL
D
0 ndash
005
01
ndash 0
2
02
ndash 0
3
03
ndash 0
4
04
ndash 0
5
05
+
005
ndash 0
1
OXFORD POVERTY amp HUMAN DEVELOPMENT INITIATIVE
OPHIT E N Y E A R
OPHIANNIVERSARY

wwwophiorguk
Alkire and Robles
6 7
populations live in acute multidimensional poverty When we focused on subnational regions the incidence of MPI varies from 0ndash74 in upper middle income countries from 0ndash92 in lower middle income countries and from 4ndash99 in low income countries
International aid and multidimensional poverty Differently distributedAid flows are complex and are only part of any poverty reduction strategy Measured in international currencies they do not reflect the unit costs of reducing a deprivation They must be analyzed alongside national public expenditures and other flows they supplement Yet the MPI portrays acute multidimensional poverty and unmet needs for public health and nutrition inputs basic education water sanitation housing electricity and other needs So a natural question is to what extent is the aid that deliberately targets those priority sectors flowing to the places where people who experience these overlapping deprivations live
To start such a conversation we describe aid allocations for 101 of the countries included in the global MPI 2017[10] using the information in the Creditor Reporting System (CRS) from the Organisation of Economic Cooperation and Development (OECD) that contains information from Development Assistance Committee (DAC) countries and International Organizations (IO) We only consider Official Development Assistance (ODA) flows and we do not yet include Other Official Flows (OOF) We also include only aid commitments to priority sectors that reflect MPI indicators[11] in a range of three years from the date of the survey used for each country They add up to $45 billion in 2015 constant USD
Table 3 shows that 28 of the MPI poor live in countries classified as low income Those countries received 42 of the donor flows to priority social sectors But 66 of MPI poor people live in lower middle income countries which receive 49 of these aid flows This is shaped by very low allocations to ndia where each poor person is allocated $135 of aid And 6 of MPI poor people live in upper middle income countries which receive a generous 9 of aid flows The flows from IO are more reflective of the distribution of MPI poor than the DAC flows
Analysis of aid flows to individual countries is also important If we consider ODA from DAC donors which is thought to represent the bulk of development aid the countries that receive very low aid flows in priority social sectors may not be those who need it least One of the countries with the lowest aid flows is a high income country Trinidad and Tobago
Fig 5a Priority sector ODA flows from DAC countries
ODA from DAC countries to priority sectors of 101 countries by income category of recipients
Upper middle income (12)
Lower middle income (44)
Low income (44)
Fig 5b Priority Sector ODA flows from DAC countries and IO
ODA from DAC and IO to priority sectors of 101 countries by income category of recipients
Lower middle income (49)
Upper middle income (9)
Low income (42)
and two are upper middle income countries Algeria and also China ndash which has mobilized tremendous domestic resources and political will for poverty reduction by 2020 But eight lower middle income countries including the most populous in terms of MPI poor such as Pakistan ($230) Nigeria ($140) and India ($064) receive very low allocations in priority social sector aid from DAC countries And nine of the 20 countries in which aid allocation from DAC donors in priority social sectors totals less than $550 per person are low income countries These include Ethiopia ($517)
OPHI Briefing 47 | May 2017
Global Multidimensional Poverty Index 2017
6 7
Total priority sectors
ODA from DAC countries three years previous to country-specific MPI
ODA from IO three years previous to country-specific MPI
ODA from IO and DAC three years previous to country-specific MPI
Share of MPI poor people
Low income
Lower middle income
Upper middle income
Total
441
435
124
100
407
545
49
100
421
494
85
100
28
66
6
100
Table 3 Allocation of ODA from DAC countries and IO for priority sectors and distribution of MPI poor income categories
DAC = Development Assistance Committee (bilateral aid) IO = International Organisations (multilateral aid) including the World Bank regional development banks some UN agencies and other multilateral agencies
Note
Niger ($450) Chad ($210) and Somalia ($210) In each of these four countries over 80 of people are MPI poor The remaining low income countries receive $6 to $32 per MPI poor person from DAC countries
To understand whether and when aid is catalyzing action and further public expenditure to fight poverty in multiple dimensions requires in-depth analysis What is clear is that the distribution of ODA flows differ significantly from the distribution of multidimensionally poor people
GOING UP CLOSE MPI WITHIN MYANMAR AFGHANISTAN AND CHAD
The MPI and its indicators are disaggregated by 988 subnational regions in 78 countries revealing an astonishing subnational diversity The poorest regions are in Chad Burkina Faso Niger Ethiopia South Sudan Nigeria Uganda and Afghanistan
For example in 52 subnational regions from 16 countries over 90 of people are poor ndash 110 million out of the 119 million living in these regions are MPI poor
These disaggregations show subnational diversity Inside Afghanistan poverty rates vary from 25 in Kabul to 95 in Urozgan In Chad itrsquos 53ndash99 In Nigeria the range is a massive 8ndash92 always with capital cities having the lowest MPI Of course the range also depends upon the number and size of the subnational regions
The case studies below profile subnational analyses of Myanmar Afghanistan and Chad
The legend used for the maps is the following
125 ndash 281
282 ndash 452
453 ndash 583
584 ndash 651
652 ndash 843844 ndash 954955 ndash 990
MPI incidence ()
wwwophiorguk
Alkire and Robles
8 9
USERrsquoS GUIDE TO INTERPRETING THE MPI
Sometimes people presume that the MPI is lsquojustrsquo an index ndash one number ndash showing the level of poverty But as these case studies show the MPI is always unpacked in different ways to show who is poor and how they are poor By design the MPI can be lsquobroken downrsquo into interesting consistent and partial subindices Here is a userrsquos guide to interpreting the MPI
Headcount Ratio or Incidence Letrsquos start with the most familiar number the percentage of people who are MPI poor This is called the headcount ratio or incidence of poverty or the lsquopoverty ratersquo For example in Myanmar 301 of people are poor because they are deprived in 3333 or more of the weighted MPI indicators
Intensity This is the average deprivation score among the poor In Myanmar intensity is 446 This means that the poor in Myanmar are on average deprived in 446 of the weighted indicators For example consider Neheso She is deprived in both health indicators as well as in cooking fuel sanitation water flooring and assets Her deprivations are labelled on the left hand side of the chart on the right The height of the boxes shows the weight of each indicator On the right hand side we stack up her deprivations and find that her deprivation score is 60 All poor people have deprivation scores between 3333 and 100 The average of the deprivation scores of all poor people is intensity
The MPI When you multiply 301 x 446 you obtain 0134 This is the MPI for Myanmar It shows that poor people in Myanmar are deprived in 134 of the deprivations that would be experienced if every person in Myanmar was poor and was deprived in all indicators The important thing is that MPI ranges from 0 to 1 and higher levels show higher poverty
How to Reduce MPIMPI goes down if a) somebody becomes non-poor so the incidence of poverty goes down or b) the intensity goes down because a poor person gets rid of a deprivation To accomplish either one though what is needed is to reduce deprivations in any one of the MPIrsquos ten indicators So we need to drill down and see how to do that
The MPI can also be broken down by indicators which is a useful tool for public policy The MPI itself is simply the percentage of people who are poor and deprived in each indicator multiplied by the weight on that indicator You add them up and obtain the value of MPI Remember that health and education indicators are weighted at 16 and living standard at 118 So in Myanmar the MPI
(0134) is also equal to (137+ 117+122+85)(16) + (29+222+113+216+51+14)(118) Visually you can see that the height of the graphic on the bottom left of page 9 is 0134 and each indicator lsquocontributesrsquo to it So if we reduce any depri vation of any poor person in any indicator what happens The height of the MPI goes down
If you prefer you can simply look at the table at the bottom of the page which shows the percentage of people in Myanmar who a) are MPI poor (because they have overlapping deprivations that stack up to one-third or more) and b) are deprived in each indicator For example 122 of people are MPI poor and have no one in their household who has completed five years of schooling We call these the lsquocensored headcount ratiosrsquo of each indicator If any of these very important deprivations goes down MPI goes down The bottom right hand chart on page 9 shows the censored headcount ratios for the Rakhine in Myanmar compared to the national average Similarly the chart on page 11 compares censored headcount ratios for two regions in Chad
These are the fundamental building blocks of the MPI Incidence Intensity Censored Headcount ratios and (weighted) Indicator contributions to MPI If you download the online data tables you will find all of these statistics (and some others) for every single country rural-urban area subnational region and for children But the goal is not just to understand poverty it is to use this information to fight poverty and suffering ndash through better policies and actions
140
Health Education Living Standards
NutritionChild
mortalityYears of
schoolingSchool
attendanceCooking
fuel Sanitation Drinking water Electricity Floor Assets
137 117 122 85 290 222 113 216 51
rarr
67
33
40
50
60
70
80
90
100
10
20
30
0
larr
larr
Hea
lthSt
anda
rd o
f Liv
ing
Nutrition
SanitationWater
Assets
Educ
atio
n
Flooring
Cooking Fuel
Child Mortality
NEHESO IS DEPRIVED IN
wwwophiorguk
8
Alkire and Robles
OPHI Briefing 47 | May 2017
Global Multidimensional Poverty Index 2017
8 9
MYANMAR
Myanmar (DHS 2014ndash15) is home to 53 million people Of these nearly 16 million or 30 are multidimensionally poor The poorest regions are Rakhine in the southwest and Shan and Kayin in the east pictured in the lightest green on the map of multidimensional poverty in Myanmar on the left In Rakhine just over half of the population (51) are multidimensionally poor with particularly high deprivations in nutrition cooking fuel sanitation assets and electricity (see the chart below) Among children aged 0-17 37 of them are poor whereas 26 of adults in Myanmar are MPI poor In rural areas child poverty rises to 44 of children whereas in urban areas itrsquos 14
MYANMAR
Kachin 1901
Shan 3952
Kayah 2303
Kayin 3694
Tanintharyi 2895
Mon 2486
Yangon 1257
Mandalay 24112
Chin 33813
8 Ayeyarwadd 390
10 Rakhine 513
11 Magway 274
Sagaing 31614
9 Bago 306
1
2
3
4
5
6
78
9
1011
1213
14
Multidimensional poverty in Myanmar
Cens
ored
hea
dcou
nt ra
tios
in th
e re
gion
pr
opor
tion
who
is p
oor a
nd d
epriv
ed in
Deprivation among the poor in Myanmar
The composition of poverty among Rakhine state and across Myanmar
60
30
50
20
10
40
0
10
20
30
40
50
60
0
Rakhine Myanmar (national)
Years of schooling
School attendance
Child mortality
Nutrition
Electricity
Sanitation
Drinking water
Floor
Cooking fuel
Assets
H ( MPI poor people)000
002
004
006
008
010
012
014
016
Composition of Myanmarrsquos MPIMPIvalue
Paul
Arp
s | F
lickr
CC
BY
20
wwwophiorguk
Alkire and Robles
10 11
Afghanistanrsquos national MPI is the highest in South Asia and 56 of Afghanis are acutely poor by the MPI Afghanistanrsquos poorest region Urozgan near central Afghanistan has an MPI of 0624 which is larger than the national MPI of Niger and 95 of people are poor This is followed by Nooristan (94) in the northeast and Badghis (79) and Kandahar (72) in the west and south of the country (see the map above) We do not have nutritional data for Afghanistan but 28 of people live in a household where a child has died ndash which is the highest figure for this indicator across every region of the world except Sub-Saharan Africa
Fully 59 of children are multidimensionally poor in Afghanistan and 53 of adults That means Afghanistan has 97 million MPI poor child ren and 75 million poor adults So well over half ndash in fact 56 of Afghanistanrsquos poor people are children Unfortunately 38 of poor people live in a household where a school-aged child is not attending school so attention to childrenrsquos deprivations is of critical importance In terms of region three-quarters of Afghanis live in rural areas where 65 of people are poor In the urban areas poverty rates are lower at 29
1
2
3
45 6 7 8
9
101112
1314
15
16
1718
1920
21
22
23
24 25 2627
2829
3031
32
33 34
AFGHANISTAN AFGHANISTAN
Herat 6331
Badghis 7932
Faryab 4943
Jawzjan 6094
Balkh 5575Kunduz 6056
Takhar 6517
Nooristan 9379
Badakhshan 6758
Ghazni 47416
Zabul 34617
Urozgan 94518Kandahar 72119
Helmand 61820
10 Kunarha 583
11 Laghman 704
12 Nangarhar 549
13 Khost 578
14 Paktya 452
15 Paktika 281
Nimroz 45421
Farah 61422
Ghor 74623
Sar-e Pol 67824
Samangan 64325
Baghlan 59726
Panjsher 25827
Daykundi 61532
Bamyan 61033
28 Kapisa 536
30 Logar 414
31 Wardak 679
Parwan 58634
29 Kabul 253
Multidimensional poverty in Afghanistan
John
Ass
elin
| Fl
ickr
CC
BY-
NC
-ND
20
OPHI Briefing 47 | May 2017
Global Multidimensional Poverty Index 2017
10 11
Chad (DHS 2014ndash15) is the fourth poorest among the 103 countries analyzed Fully 87 of people live in multidimensional poverty Over 80 of the population are poor and lack electricity adequate sanitation flooring and clean cooking fuel and over half (52) of the population are multidimensionally poor and have a school-aged child at home who is not attending school The poorest subnational regions in Chad are the drought-affected regions of Lac Wadi Fira Sila and Kanem In the regions of Lac and Kanem nearly 65 of the population are poor and have at least one malnourished woman or child (see the map above)
It might seem that in such a poor country (in 12 of Chadrsquos 20 regions more than 95 of people are poor) the MPI cannot add much analysis But the indicator details tell a new story Letrsquos compare the two poorest regions Lac and Wadi Fira ndash in which 98ndash99 of people are poor In Lac 34 of people are poor and have experienced the death of a child whereas in Wadi Fira itrsquos much lower at 20 But in Wadi Fira 97 of people lack clean drinking water whereas in Lac itrsquos 64 (the chart below) So clearly even between two extremely poor regions policy responses need to differ
CHAD CHAD
Lac and Wadi Fira Deprivation levels by indicator
Multidimensional poverty in Chad
12
3
4
5
6
789
101112
1314 15
1617
1819
Borkou Tibesti 891
Ennedi 9682Wadi Fira 993Ouaddaiuml 9534
Sila 9895Salamat 9786Moyen Chari 7417
Mayo Kebbi Ouest 86312Mayo Kebbi Est 86113
8 Mandoul 881
10 Logone occidental 791
11 Tandjileacute 843
Chari Baguirmi 96914
9 Logone oriental 881
15 Gueacutera 954
16 Hadjer Lamis 954
17 Lac 981
18 Kanem 98519 Barh El Gazal 957
20 Batha 957
20
YS Years of schooling
School attendance
CM Child mortality
N Nutrition
Electricity
Sanitation
Drinking water
Floor
Cooking fuel
Assets
SA
CF
S
DW
E
F
A
30
50
20
10
0
40
60
70
80
90
100
N CM YS SA CF S DW E F A
Ken
Doe
rr |
Flic
kr C
C B
Y 2
0
wwwophiorguk
Alkire and Robles
12 13
NEWS FLASHMPI DISAGGREGATION BY DISABILITY STATUS SOON TO BE STANDARD
In a recent study we disaggregated the global MPI by disability status for the first time[12] It was not previously possible to disaggregate the global MPI by disability but surveys that include standardized questions on disability are set to increase
Ugandarsquos 2011 Demographic and Health Survey (DHS) pioneered the Washington Group questions on disability a form of which will be included in DHS and Multiple Indicator Cluster Surveys (MICS) from 2017 onwards In Uganda 4 of people aged 5 years and above were living with a disability and 22 of all people live in a household where at least one member lives with a severe disability
As Figure 6 above shows households with at least one member with a severe disability faced higher levels of multidimensional poverty ndash a
77 poverty rate as compared with 69 among households without disability As comparable data become available the global MPI will be disaggregated by disability status in order to track ndash and hopefully to help reduce ndash the interlinkages among these conditions
Fig 6 Incidence of multidimensional poverty in Uganda by disability status
0
01
02
03
04
05
06
07
08
09
03
05
02
01
0
04
06
07
08
09
without disabilitywith disability
Bria
n W
olfe
| Fl
ickr
CC
BY-
NC
20
OPHI Briefing 47 | May 2017
Global Multidimensional Poverty Index 2017
12 13
DESTITUTIONThe distressing condition of destitution
bull Half of the MPI poor people live in destitution
bull In six countries and 117 subnational regions 50 or more of people are destitute
bull Most of the highest levels of destitution are found in Sub-Saharan Africa
bull Pakistan has more destitute people ndash 37 million ndash than East Asia and the Pacific (26 million) or the Arab States (26 million)
bull India has more destitute people (295 million) than Sub-Saharan Africa (282 million)
bull But most of the destitute people ndash 362 of the 706 million ndash live in South Asia
The MPI reflects acute multidimensional poverty in developing countries It measures absolute levels of poverty ndash which are very low in a number of countries such as China and many areas of Latin America For many countries a lsquomoderatersquo measure of multidimensional poverty is needed
Even so since 2014 we have reported a measure of destitution that identifies a subset of the MPI poor who are the poorest of the poor Unfortunately nearly half of all MPI poor people are destitute ndash 706 million men women and children
As with the MPI destitute people are deprived in one-third or more weighted indicators but the destitution indicators are more extreme They include severe malnutrition losing two or more children having a child out of primary school having no household member who has completed more than one year of schooling using open defecation fetching water that is unsafe or 45 or more minutes away not owning even a mobile phone or radio and cooking with wood or dung or straw only[13] To leave no one behind we must take urgent action to end the distressing condition of destitution
Figure 7 on the next page shows the percentage of the population who are MPI poor which is the height of the beige bar and the percentage who are living in destitution which is the height of the red subcomponent At a glance we can see that destitution rates ranges from 0 to 714 of the population What else do we see
First there are pockets of destitution even in low MPI countries In countries like Turkmenistan Bosnia and Herzegovina Barbados Uzbekistan and Azerbaijan 30 or more of MPI poor people are destitute But in South Africa less than 9 of the MPI poor are destitute
Second there are positive stories In 57 countries less than 10 of the population are destitute Similarly 506 subnational regions have less than 10 of the population living in destitution
Third in general destitution rates tend to be lower than $190day extreme income poverty rates But destitution is markedly higher than income poverty in Pakistan Mauritania Sudan Gambia Chad Ethiopia Niger and South Sudan This underscores the importance of measuring and fighting poverty in all its forms and dimensions
In some countries and regions destitution is still lsquothe normrsquo because it affects half of more of the population Six countries have more than 50 of their population living in destitution ndash and together they are home to 100 million poor people Drilling down in 117 subnational regions 50-92 of the population are destitute (161 million) These high destitution regions are mainly located in Sub-Saharan Africa Yet there are pockets of destitution in other regions In East Asia and the Pacific eight regions within Timor LrsquoEste have over 50 of people living in destitution Within the Arab States 58 of people in Sudanrsquos Central Darfur and 50 of people in Yemenrsquos Hajjah regions are destitute Within South Asia Afghanistanrsquos Urozgan Nooristan and Kandahar provinces have 50ndash78 of people living in destitution In Latin America six regions of Haiti plus Potosi in Bolivia have 20ndash36 of people living in destitution
Looking at the high rates of destitution we might presume that destitution is largely an African story But it is not Of the 706 million people who are destitute 362 million live in South Asia and 282 million in Sub-Saharan Africa In addition 26 million live in the Arab States another 26 million live in East Asia and over 8 million live in Latin America plus nearly 300000 in Europe and Central Asia India has over 295 million destitute people more than the total number if destitute people in all of Sub-Saharan Africa And Pakistan has 37 million destitute people according to its 201213 dataset more than either the Arab States or East Asia and the Pacific region
The story of destitution is not over But it should be These figures call for vigorous attention to be focused on destitution in South Asia and in Sub-Saharan Africa ndash and for even low poverty countries to track and empty the pockets of deep poverty in their midst
wwwophiorguk
Alkire and Robles
14 15
Fig 7 Comparing the headcount ratios of MPI poor destitute and $190day poor
$190day poorDestituteMPI poor
20 040 6080100
South SudanNigerEthiopiaChadBurkina FasoSomaliaSierra LeoneBurundiMaliCentral African RepublicGuineaDem Rep of CongoLiberiaUgandaMozambiqueTimor-LesteMadagascarGuinea -BissauBeninGambiaSenegalCote drsquoIvoireTanzaniaZambiaAfghanistanRwandaMalawiSudanNigeriaMauritaniaTogoHaitiCameroonYemenPakistanNamibiaIndiaBangladeshKenyaRep of CongoComorosZimbabweLao Peoplersquos Dem RepGhanaCambodiaLesothoVanuatuMyanmarDjiboutiNepalBhutanGuatemalaBoliviaSao Tome and PrincipeGabonNicaraguaSwazilandHondurasIndonesiaMoroccoTajikistanIraqPhilippinesPeruMongoliaSouth AfricaDominican RepublicViet NamEl SalvadorSurinameTrinidad and TobagoColombiaAzerbaijanBrazilMaldivesBelizeSyrian Arab RepublicChinaEgyptEcuadorGuyanaUzbekistanJamaicaJordanLibyaAlgeriaAlbaniaUkraineMexicoTunisiaPalestineSaint LuciaBarbadosThailandMoldovaMacedoniaBosnia and HerzegovinaKyrgyzstanTurkmenistanArmeniaMontenegro
KazakhstanSerbia
OPHI Briefing 47 | May 2017
Global Multidimensional Poverty Index 2017
14 15
REFERENCESAddis Ababa Accord (2015) lsquoAccord of the Third International Conference on Financing for Development Revised Draft 6 Mayrsquo
Alkire S and Foster J (2011) lsquoCounting and multidimensional poverty measurementrsquo Journal of Public Economics vol 95(7ndash8) pp 476ndash487
Alkire S Dorji L Gyeltshen S and Minten T (2016) Child Poverty in Bhutan Insights from Multidimensional Child Poverty Index and Qualitative Interviews with Poor Children National Statistics Bureau Bhutan
Alkire S and Robles G (2017) lsquoMultidimensional Poverty Index ndash summer 2017 brief methodological note and resultsrsquo OPHI MPI Methodological Notes 44 Oxford Poverty and Human Development Initiative University of Oxford
Alkire S and Santos ME (2014) lsquoMeasuring acute poverty in the developing world robustness and scope of the multidimensional poverty indexrsquo World Development vol 59 pp 251ndash274
Alkire S Jindra C Robles G and Vaz A (2017) lsquoChildrenrsquos multidimensional poverty disaggregating the global MPIrsquo OPHI Briefing 46 Oxford Poverty and Human Development Initiative University of Oxford
Organisation of Economic Cooperation and Development (OECD) (2017) lsquoCreditor reporting system (CRS) aid activity databasersquo Available here (Last accessed on 13 May 2017)
Pinilla-Roncancio M and Alkire S (2017) lsquoHow poor are people with disabilities around the globe A multidimensional perspectiversquo OPHI Research in Progress 48a Oxford Poverty and Human Development Initiative University of Oxford
United Nations (2015) Transforming Our World The 2030 Agenda for Sustainable Development ARES701
NOTES[1] All aggregates use 2013 population data[2] Section 51 paragraph 135[3] Addis Ababa Accord 2015 paragraph 119[4] Discussions are underway to consider whether data permit
adjustments to further align the global MPI with the SDGs[5] This section draws on lsquoChildrenrsquos multidimensional poverty
disaggregating the global MPIrsquo by Alkire et al (2017)[6] As with $190day poverty children are identified as poor
if they live in an MPI poor household Alternatively Child MPIs can be constructed that reflect each individual childrsquos deprivations by gender and age cohort (see Alkire et al 2016) but data are not available to build a global Child MPI with individual child data
[7] $190 is not available for Afghanistan Omitting Afghani stan 414 of people are MPI poor in South Asia
[8] We use income category definitions from July 2016 throughout this document
[9] The global MPI covers 92 of all people living in low or middle income countries It covers 99 of people living in low income countries (29 countries) 99 of the population in lower middle income countries (43) and 82 in upper middle income countries (29)
[10] There is no information on allocation to Macedonia and Palestine For those countries with MPI data from 2016 ODA flows allocated between 2011 and 2015 have been considered For South Sudan with 2010 MPI data ODA flows between 2011 and 2015 are used as this is the closest five-year period available
[11] The categories included are basic education basic health basic drinking water supply and basic sanitation (alone and together) electric power transmission and distribution low-cost housing multisector aid for basic social services developmental food aid and food security assistance
[12] Pinilla and Alkire 2017
[13] The indicators of electricity and flooring are unchanged
ONLINE RESOURCES
OPHIrsquos interactive databank enables you to study over 100 developing countries in terms of multidimensional poverty Choose interactive data visualizations to explore where and in which indicators people are poor or destitute and to show how MPI values compare with complementary data such as $190day poverty Or download a country briefing file for any country which contains explanations of its MPI and is illustrated with graphs maps and charts Excel data tables have all the details of MPI plus population standard errors sample sizes and much more Methodological notes provide any particularities of each countryrsquos survey data treatment
See wwwophiorgukmultidimensional-poverty-index
Oxford Poverty and Human Development Initiative (OPHI)
Oxford Department of International Development (ODID)Queen Elizabeth House (QEH)University of Oxford3 Mansfield Road Oxford OX1 3TBUnited Kingdom
ophi_oxford
ophioxford
ophi_oxford
Telephone+44 (0)1865 271915
Emailophiqehoxacuk
Websitewwwophiorguk
wwwophiorguk
Alkire and Robles
16 PB
MU
LTID
IMEN
SIO
NA
L PO
VERT
Y IN
DEX
ACR
OSS
TH
E W
ORL
D
0 ndash
005
01
ndash 0
2
02
ndash 0
3
03
ndash 0
4
04
ndash 0
5
05
+
005
ndash 0
1
OXFORD POVERTY amp HUMAN DEVELOPMENT INITIATIVE
OPHIT E N Y E A R
OPHIANNIVERSARY

OPHI Briefing 47 | May 2017
Global Multidimensional Poverty Index 2017
6 7
Total priority sectors
ODA from DAC countries three years previous to country-specific MPI
ODA from IO three years previous to country-specific MPI
ODA from IO and DAC three years previous to country-specific MPI
Share of MPI poor people
Low income
Lower middle income
Upper middle income
Total
441
435
124
100
407
545
49
100
421
494
85
100
28
66
6
100
Table 3 Allocation of ODA from DAC countries and IO for priority sectors and distribution of MPI poor income categories
DAC = Development Assistance Committee (bilateral aid) IO = International Organisations (multilateral aid) including the World Bank regional development banks some UN agencies and other multilateral agencies
Note
Niger ($450) Chad ($210) and Somalia ($210) In each of these four countries over 80 of people are MPI poor The remaining low income countries receive $6 to $32 per MPI poor person from DAC countries
To understand whether and when aid is catalyzing action and further public expenditure to fight poverty in multiple dimensions requires in-depth analysis What is clear is that the distribution of ODA flows differ significantly from the distribution of multidimensionally poor people
GOING UP CLOSE MPI WITHIN MYANMAR AFGHANISTAN AND CHAD
The MPI and its indicators are disaggregated by 988 subnational regions in 78 countries revealing an astonishing subnational diversity The poorest regions are in Chad Burkina Faso Niger Ethiopia South Sudan Nigeria Uganda and Afghanistan
For example in 52 subnational regions from 16 countries over 90 of people are poor ndash 110 million out of the 119 million living in these regions are MPI poor
These disaggregations show subnational diversity Inside Afghanistan poverty rates vary from 25 in Kabul to 95 in Urozgan In Chad itrsquos 53ndash99 In Nigeria the range is a massive 8ndash92 always with capital cities having the lowest MPI Of course the range also depends upon the number and size of the subnational regions
The case studies below profile subnational analyses of Myanmar Afghanistan and Chad
The legend used for the maps is the following
125 ndash 281
282 ndash 452
453 ndash 583
584 ndash 651
652 ndash 843844 ndash 954955 ndash 990
MPI incidence ()
wwwophiorguk
Alkire and Robles
8 9
USERrsquoS GUIDE TO INTERPRETING THE MPI
Sometimes people presume that the MPI is lsquojustrsquo an index ndash one number ndash showing the level of poverty But as these case studies show the MPI is always unpacked in different ways to show who is poor and how they are poor By design the MPI can be lsquobroken downrsquo into interesting consistent and partial subindices Here is a userrsquos guide to interpreting the MPI
Headcount Ratio or Incidence Letrsquos start with the most familiar number the percentage of people who are MPI poor This is called the headcount ratio or incidence of poverty or the lsquopoverty ratersquo For example in Myanmar 301 of people are poor because they are deprived in 3333 or more of the weighted MPI indicators
Intensity This is the average deprivation score among the poor In Myanmar intensity is 446 This means that the poor in Myanmar are on average deprived in 446 of the weighted indicators For example consider Neheso She is deprived in both health indicators as well as in cooking fuel sanitation water flooring and assets Her deprivations are labelled on the left hand side of the chart on the right The height of the boxes shows the weight of each indicator On the right hand side we stack up her deprivations and find that her deprivation score is 60 All poor people have deprivation scores between 3333 and 100 The average of the deprivation scores of all poor people is intensity
The MPI When you multiply 301 x 446 you obtain 0134 This is the MPI for Myanmar It shows that poor people in Myanmar are deprived in 134 of the deprivations that would be experienced if every person in Myanmar was poor and was deprived in all indicators The important thing is that MPI ranges from 0 to 1 and higher levels show higher poverty
How to Reduce MPIMPI goes down if a) somebody becomes non-poor so the incidence of poverty goes down or b) the intensity goes down because a poor person gets rid of a deprivation To accomplish either one though what is needed is to reduce deprivations in any one of the MPIrsquos ten indicators So we need to drill down and see how to do that
The MPI can also be broken down by indicators which is a useful tool for public policy The MPI itself is simply the percentage of people who are poor and deprived in each indicator multiplied by the weight on that indicator You add them up and obtain the value of MPI Remember that health and education indicators are weighted at 16 and living standard at 118 So in Myanmar the MPI
(0134) is also equal to (137+ 117+122+85)(16) + (29+222+113+216+51+14)(118) Visually you can see that the height of the graphic on the bottom left of page 9 is 0134 and each indicator lsquocontributesrsquo to it So if we reduce any depri vation of any poor person in any indicator what happens The height of the MPI goes down
If you prefer you can simply look at the table at the bottom of the page which shows the percentage of people in Myanmar who a) are MPI poor (because they have overlapping deprivations that stack up to one-third or more) and b) are deprived in each indicator For example 122 of people are MPI poor and have no one in their household who has completed five years of schooling We call these the lsquocensored headcount ratiosrsquo of each indicator If any of these very important deprivations goes down MPI goes down The bottom right hand chart on page 9 shows the censored headcount ratios for the Rakhine in Myanmar compared to the national average Similarly the chart on page 11 compares censored headcount ratios for two regions in Chad
These are the fundamental building blocks of the MPI Incidence Intensity Censored Headcount ratios and (weighted) Indicator contributions to MPI If you download the online data tables you will find all of these statistics (and some others) for every single country rural-urban area subnational region and for children But the goal is not just to understand poverty it is to use this information to fight poverty and suffering ndash through better policies and actions
140
Health Education Living Standards
NutritionChild
mortalityYears of
schoolingSchool
attendanceCooking
fuel Sanitation Drinking water Electricity Floor Assets
137 117 122 85 290 222 113 216 51
rarr
67
33
40
50
60
70
80
90
100
10
20
30
0
larr
larr
Hea
lthSt
anda
rd o
f Liv
ing
Nutrition
SanitationWater
Assets
Educ
atio
n
Flooring
Cooking Fuel
Child Mortality
NEHESO IS DEPRIVED IN
wwwophiorguk
8
Alkire and Robles
OPHI Briefing 47 | May 2017
Global Multidimensional Poverty Index 2017
8 9
MYANMAR
Myanmar (DHS 2014ndash15) is home to 53 million people Of these nearly 16 million or 30 are multidimensionally poor The poorest regions are Rakhine in the southwest and Shan and Kayin in the east pictured in the lightest green on the map of multidimensional poverty in Myanmar on the left In Rakhine just over half of the population (51) are multidimensionally poor with particularly high deprivations in nutrition cooking fuel sanitation assets and electricity (see the chart below) Among children aged 0-17 37 of them are poor whereas 26 of adults in Myanmar are MPI poor In rural areas child poverty rises to 44 of children whereas in urban areas itrsquos 14
MYANMAR
Kachin 1901
Shan 3952
Kayah 2303
Kayin 3694
Tanintharyi 2895
Mon 2486
Yangon 1257
Mandalay 24112
Chin 33813
8 Ayeyarwadd 390
10 Rakhine 513
11 Magway 274
Sagaing 31614
9 Bago 306
1
2
3
4
5
6
78
9
1011
1213
14
Multidimensional poverty in Myanmar
Cens
ored
hea
dcou
nt ra
tios
in th
e re
gion
pr
opor
tion
who
is p
oor a
nd d
epriv
ed in
Deprivation among the poor in Myanmar
The composition of poverty among Rakhine state and across Myanmar
60
30
50
20
10
40
0
10
20
30
40
50
60
0
Rakhine Myanmar (national)
Years of schooling
School attendance
Child mortality
Nutrition
Electricity
Sanitation
Drinking water
Floor
Cooking fuel
Assets
H ( MPI poor people)000
002
004
006
008
010
012
014
016
Composition of Myanmarrsquos MPIMPIvalue
Paul
Arp
s | F
lickr
CC
BY
20
wwwophiorguk
Alkire and Robles
10 11
Afghanistanrsquos national MPI is the highest in South Asia and 56 of Afghanis are acutely poor by the MPI Afghanistanrsquos poorest region Urozgan near central Afghanistan has an MPI of 0624 which is larger than the national MPI of Niger and 95 of people are poor This is followed by Nooristan (94) in the northeast and Badghis (79) and Kandahar (72) in the west and south of the country (see the map above) We do not have nutritional data for Afghanistan but 28 of people live in a household where a child has died ndash which is the highest figure for this indicator across every region of the world except Sub-Saharan Africa
Fully 59 of children are multidimensionally poor in Afghanistan and 53 of adults That means Afghanistan has 97 million MPI poor child ren and 75 million poor adults So well over half ndash in fact 56 of Afghanistanrsquos poor people are children Unfortunately 38 of poor people live in a household where a school-aged child is not attending school so attention to childrenrsquos deprivations is of critical importance In terms of region three-quarters of Afghanis live in rural areas where 65 of people are poor In the urban areas poverty rates are lower at 29
1
2
3
45 6 7 8
9
101112
1314
15
16
1718
1920
21
22
23
24 25 2627
2829
3031
32
33 34
AFGHANISTAN AFGHANISTAN
Herat 6331
Badghis 7932
Faryab 4943
Jawzjan 6094
Balkh 5575Kunduz 6056
Takhar 6517
Nooristan 9379
Badakhshan 6758
Ghazni 47416
Zabul 34617
Urozgan 94518Kandahar 72119
Helmand 61820
10 Kunarha 583
11 Laghman 704
12 Nangarhar 549
13 Khost 578
14 Paktya 452
15 Paktika 281
Nimroz 45421
Farah 61422
Ghor 74623
Sar-e Pol 67824
Samangan 64325
Baghlan 59726
Panjsher 25827
Daykundi 61532
Bamyan 61033
28 Kapisa 536
30 Logar 414
31 Wardak 679
Parwan 58634
29 Kabul 253
Multidimensional poverty in Afghanistan
John
Ass
elin
| Fl
ickr
CC
BY-
NC
-ND
20
OPHI Briefing 47 | May 2017
Global Multidimensional Poverty Index 2017
10 11
Chad (DHS 2014ndash15) is the fourth poorest among the 103 countries analyzed Fully 87 of people live in multidimensional poverty Over 80 of the population are poor and lack electricity adequate sanitation flooring and clean cooking fuel and over half (52) of the population are multidimensionally poor and have a school-aged child at home who is not attending school The poorest subnational regions in Chad are the drought-affected regions of Lac Wadi Fira Sila and Kanem In the regions of Lac and Kanem nearly 65 of the population are poor and have at least one malnourished woman or child (see the map above)
It might seem that in such a poor country (in 12 of Chadrsquos 20 regions more than 95 of people are poor) the MPI cannot add much analysis But the indicator details tell a new story Letrsquos compare the two poorest regions Lac and Wadi Fira ndash in which 98ndash99 of people are poor In Lac 34 of people are poor and have experienced the death of a child whereas in Wadi Fira itrsquos much lower at 20 But in Wadi Fira 97 of people lack clean drinking water whereas in Lac itrsquos 64 (the chart below) So clearly even between two extremely poor regions policy responses need to differ
CHAD CHAD
Lac and Wadi Fira Deprivation levels by indicator
Multidimensional poverty in Chad
12
3
4
5
6
789
101112
1314 15
1617
1819
Borkou Tibesti 891
Ennedi 9682Wadi Fira 993Ouaddaiuml 9534
Sila 9895Salamat 9786Moyen Chari 7417
Mayo Kebbi Ouest 86312Mayo Kebbi Est 86113
8 Mandoul 881
10 Logone occidental 791
11 Tandjileacute 843
Chari Baguirmi 96914
9 Logone oriental 881
15 Gueacutera 954
16 Hadjer Lamis 954
17 Lac 981
18 Kanem 98519 Barh El Gazal 957
20 Batha 957
20
YS Years of schooling
School attendance
CM Child mortality
N Nutrition
Electricity
Sanitation
Drinking water
Floor
Cooking fuel
Assets
SA
CF
S
DW
E
F
A
30
50
20
10
0
40
60
70
80
90
100
N CM YS SA CF S DW E F A
Ken
Doe
rr |
Flic
kr C
C B
Y 2
0
wwwophiorguk
Alkire and Robles
12 13
NEWS FLASHMPI DISAGGREGATION BY DISABILITY STATUS SOON TO BE STANDARD
In a recent study we disaggregated the global MPI by disability status for the first time[12] It was not previously possible to disaggregate the global MPI by disability but surveys that include standardized questions on disability are set to increase
Ugandarsquos 2011 Demographic and Health Survey (DHS) pioneered the Washington Group questions on disability a form of which will be included in DHS and Multiple Indicator Cluster Surveys (MICS) from 2017 onwards In Uganda 4 of people aged 5 years and above were living with a disability and 22 of all people live in a household where at least one member lives with a severe disability
As Figure 6 above shows households with at least one member with a severe disability faced higher levels of multidimensional poverty ndash a
77 poverty rate as compared with 69 among households without disability As comparable data become available the global MPI will be disaggregated by disability status in order to track ndash and hopefully to help reduce ndash the interlinkages among these conditions
Fig 6 Incidence of multidimensional poverty in Uganda by disability status
0
01
02
03
04
05
06
07
08
09
03
05
02
01
0
04
06
07
08
09
without disabilitywith disability
Bria
n W
olfe
| Fl
ickr
CC
BY-
NC
20
OPHI Briefing 47 | May 2017
Global Multidimensional Poverty Index 2017
12 13
DESTITUTIONThe distressing condition of destitution
bull Half of the MPI poor people live in destitution
bull In six countries and 117 subnational regions 50 or more of people are destitute
bull Most of the highest levels of destitution are found in Sub-Saharan Africa
bull Pakistan has more destitute people ndash 37 million ndash than East Asia and the Pacific (26 million) or the Arab States (26 million)
bull India has more destitute people (295 million) than Sub-Saharan Africa (282 million)
bull But most of the destitute people ndash 362 of the 706 million ndash live in South Asia
The MPI reflects acute multidimensional poverty in developing countries It measures absolute levels of poverty ndash which are very low in a number of countries such as China and many areas of Latin America For many countries a lsquomoderatersquo measure of multidimensional poverty is needed
Even so since 2014 we have reported a measure of destitution that identifies a subset of the MPI poor who are the poorest of the poor Unfortunately nearly half of all MPI poor people are destitute ndash 706 million men women and children
As with the MPI destitute people are deprived in one-third or more weighted indicators but the destitution indicators are more extreme They include severe malnutrition losing two or more children having a child out of primary school having no household member who has completed more than one year of schooling using open defecation fetching water that is unsafe or 45 or more minutes away not owning even a mobile phone or radio and cooking with wood or dung or straw only[13] To leave no one behind we must take urgent action to end the distressing condition of destitution
Figure 7 on the next page shows the percentage of the population who are MPI poor which is the height of the beige bar and the percentage who are living in destitution which is the height of the red subcomponent At a glance we can see that destitution rates ranges from 0 to 714 of the population What else do we see
First there are pockets of destitution even in low MPI countries In countries like Turkmenistan Bosnia and Herzegovina Barbados Uzbekistan and Azerbaijan 30 or more of MPI poor people are destitute But in South Africa less than 9 of the MPI poor are destitute
Second there are positive stories In 57 countries less than 10 of the population are destitute Similarly 506 subnational regions have less than 10 of the population living in destitution
Third in general destitution rates tend to be lower than $190day extreme income poverty rates But destitution is markedly higher than income poverty in Pakistan Mauritania Sudan Gambia Chad Ethiopia Niger and South Sudan This underscores the importance of measuring and fighting poverty in all its forms and dimensions
In some countries and regions destitution is still lsquothe normrsquo because it affects half of more of the population Six countries have more than 50 of their population living in destitution ndash and together they are home to 100 million poor people Drilling down in 117 subnational regions 50-92 of the population are destitute (161 million) These high destitution regions are mainly located in Sub-Saharan Africa Yet there are pockets of destitution in other regions In East Asia and the Pacific eight regions within Timor LrsquoEste have over 50 of people living in destitution Within the Arab States 58 of people in Sudanrsquos Central Darfur and 50 of people in Yemenrsquos Hajjah regions are destitute Within South Asia Afghanistanrsquos Urozgan Nooristan and Kandahar provinces have 50ndash78 of people living in destitution In Latin America six regions of Haiti plus Potosi in Bolivia have 20ndash36 of people living in destitution
Looking at the high rates of destitution we might presume that destitution is largely an African story But it is not Of the 706 million people who are destitute 362 million live in South Asia and 282 million in Sub-Saharan Africa In addition 26 million live in the Arab States another 26 million live in East Asia and over 8 million live in Latin America plus nearly 300000 in Europe and Central Asia India has over 295 million destitute people more than the total number if destitute people in all of Sub-Saharan Africa And Pakistan has 37 million destitute people according to its 201213 dataset more than either the Arab States or East Asia and the Pacific region
The story of destitution is not over But it should be These figures call for vigorous attention to be focused on destitution in South Asia and in Sub-Saharan Africa ndash and for even low poverty countries to track and empty the pockets of deep poverty in their midst
wwwophiorguk
Alkire and Robles
14 15
Fig 7 Comparing the headcount ratios of MPI poor destitute and $190day poor
$190day poorDestituteMPI poor
20 040 6080100
South SudanNigerEthiopiaChadBurkina FasoSomaliaSierra LeoneBurundiMaliCentral African RepublicGuineaDem Rep of CongoLiberiaUgandaMozambiqueTimor-LesteMadagascarGuinea -BissauBeninGambiaSenegalCote drsquoIvoireTanzaniaZambiaAfghanistanRwandaMalawiSudanNigeriaMauritaniaTogoHaitiCameroonYemenPakistanNamibiaIndiaBangladeshKenyaRep of CongoComorosZimbabweLao Peoplersquos Dem RepGhanaCambodiaLesothoVanuatuMyanmarDjiboutiNepalBhutanGuatemalaBoliviaSao Tome and PrincipeGabonNicaraguaSwazilandHondurasIndonesiaMoroccoTajikistanIraqPhilippinesPeruMongoliaSouth AfricaDominican RepublicViet NamEl SalvadorSurinameTrinidad and TobagoColombiaAzerbaijanBrazilMaldivesBelizeSyrian Arab RepublicChinaEgyptEcuadorGuyanaUzbekistanJamaicaJordanLibyaAlgeriaAlbaniaUkraineMexicoTunisiaPalestineSaint LuciaBarbadosThailandMoldovaMacedoniaBosnia and HerzegovinaKyrgyzstanTurkmenistanArmeniaMontenegro
KazakhstanSerbia
OPHI Briefing 47 | May 2017
Global Multidimensional Poverty Index 2017
14 15
REFERENCESAddis Ababa Accord (2015) lsquoAccord of the Third International Conference on Financing for Development Revised Draft 6 Mayrsquo
Alkire S and Foster J (2011) lsquoCounting and multidimensional poverty measurementrsquo Journal of Public Economics vol 95(7ndash8) pp 476ndash487
Alkire S Dorji L Gyeltshen S and Minten T (2016) Child Poverty in Bhutan Insights from Multidimensional Child Poverty Index and Qualitative Interviews with Poor Children National Statistics Bureau Bhutan
Alkire S and Robles G (2017) lsquoMultidimensional Poverty Index ndash summer 2017 brief methodological note and resultsrsquo OPHI MPI Methodological Notes 44 Oxford Poverty and Human Development Initiative University of Oxford
Alkire S and Santos ME (2014) lsquoMeasuring acute poverty in the developing world robustness and scope of the multidimensional poverty indexrsquo World Development vol 59 pp 251ndash274
Alkire S Jindra C Robles G and Vaz A (2017) lsquoChildrenrsquos multidimensional poverty disaggregating the global MPIrsquo OPHI Briefing 46 Oxford Poverty and Human Development Initiative University of Oxford
Organisation of Economic Cooperation and Development (OECD) (2017) lsquoCreditor reporting system (CRS) aid activity databasersquo Available here (Last accessed on 13 May 2017)
Pinilla-Roncancio M and Alkire S (2017) lsquoHow poor are people with disabilities around the globe A multidimensional perspectiversquo OPHI Research in Progress 48a Oxford Poverty and Human Development Initiative University of Oxford
United Nations (2015) Transforming Our World The 2030 Agenda for Sustainable Development ARES701
NOTES[1] All aggregates use 2013 population data[2] Section 51 paragraph 135[3] Addis Ababa Accord 2015 paragraph 119[4] Discussions are underway to consider whether data permit
adjustments to further align the global MPI with the SDGs[5] This section draws on lsquoChildrenrsquos multidimensional poverty
disaggregating the global MPIrsquo by Alkire et al (2017)[6] As with $190day poverty children are identified as poor
if they live in an MPI poor household Alternatively Child MPIs can be constructed that reflect each individual childrsquos deprivations by gender and age cohort (see Alkire et al 2016) but data are not available to build a global Child MPI with individual child data
[7] $190 is not available for Afghanistan Omitting Afghani stan 414 of people are MPI poor in South Asia
[8] We use income category definitions from July 2016 throughout this document
[9] The global MPI covers 92 of all people living in low or middle income countries It covers 99 of people living in low income countries (29 countries) 99 of the population in lower middle income countries (43) and 82 in upper middle income countries (29)
[10] There is no information on allocation to Macedonia and Palestine For those countries with MPI data from 2016 ODA flows allocated between 2011 and 2015 have been considered For South Sudan with 2010 MPI data ODA flows between 2011 and 2015 are used as this is the closest five-year period available
[11] The categories included are basic education basic health basic drinking water supply and basic sanitation (alone and together) electric power transmission and distribution low-cost housing multisector aid for basic social services developmental food aid and food security assistance
[12] Pinilla and Alkire 2017
[13] The indicators of electricity and flooring are unchanged
ONLINE RESOURCES
OPHIrsquos interactive databank enables you to study over 100 developing countries in terms of multidimensional poverty Choose interactive data visualizations to explore where and in which indicators people are poor or destitute and to show how MPI values compare with complementary data such as $190day poverty Or download a country briefing file for any country which contains explanations of its MPI and is illustrated with graphs maps and charts Excel data tables have all the details of MPI plus population standard errors sample sizes and much more Methodological notes provide any particularities of each countryrsquos survey data treatment
See wwwophiorgukmultidimensional-poverty-index
Oxford Poverty and Human Development Initiative (OPHI)
Oxford Department of International Development (ODID)Queen Elizabeth House (QEH)University of Oxford3 Mansfield Road Oxford OX1 3TBUnited Kingdom
ophi_oxford
ophioxford
ophi_oxford
Telephone+44 (0)1865 271915
Emailophiqehoxacuk
Websitewwwophiorguk
wwwophiorguk
Alkire and Robles
16 PB
MU
LTID
IMEN
SIO
NA
L PO
VERT
Y IN
DEX
ACR
OSS
TH
E W
ORL
D
0 ndash
005
01
ndash 0
2
02
ndash 0
3
03
ndash 0
4
04
ndash 0
5
05
+
005
ndash 0
1
OXFORD POVERTY amp HUMAN DEVELOPMENT INITIATIVE
OPHIT E N Y E A R
OPHIANNIVERSARY
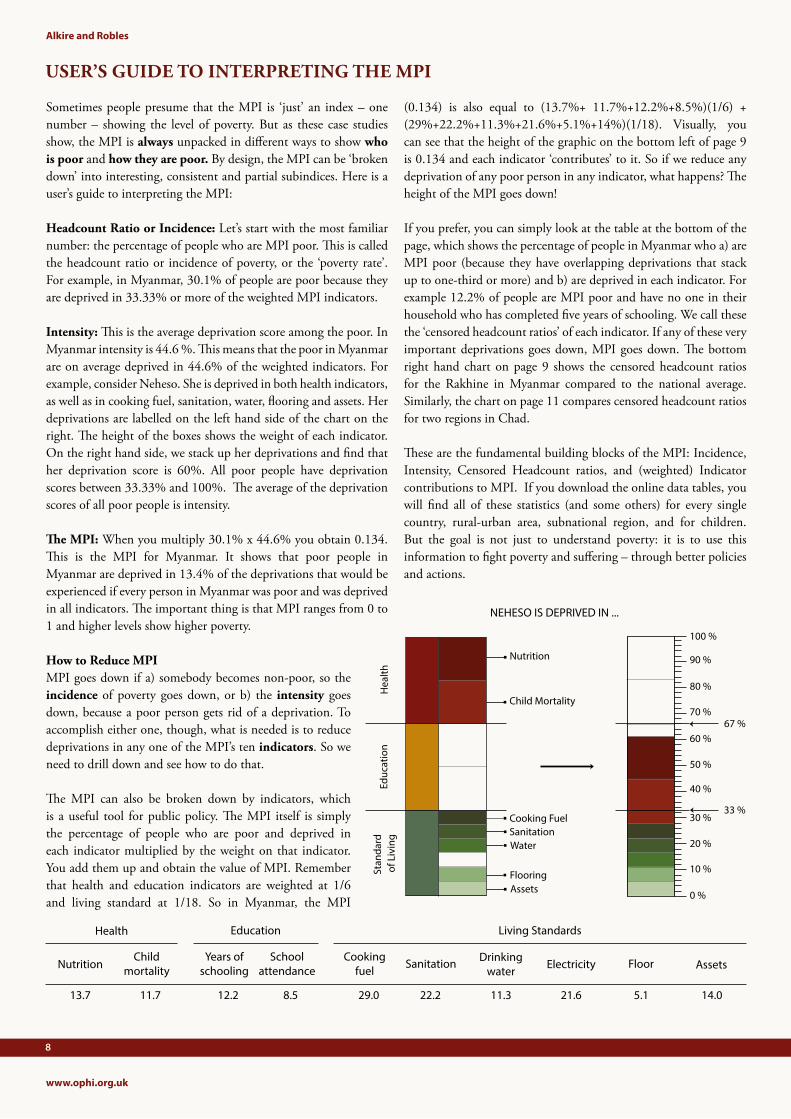
wwwophiorguk
Alkire and Robles
8 9
USERrsquoS GUIDE TO INTERPRETING THE MPI
Sometimes people presume that the MPI is lsquojustrsquo an index ndash one number ndash showing the level of poverty But as these case studies show the MPI is always unpacked in different ways to show who is poor and how they are poor By design the MPI can be lsquobroken downrsquo into interesting consistent and partial subindices Here is a userrsquos guide to interpreting the MPI
Headcount Ratio or Incidence Letrsquos start with the most familiar number the percentage of people who are MPI poor This is called the headcount ratio or incidence of poverty or the lsquopoverty ratersquo For example in Myanmar 301 of people are poor because they are deprived in 3333 or more of the weighted MPI indicators
Intensity This is the average deprivation score among the poor In Myanmar intensity is 446 This means that the poor in Myanmar are on average deprived in 446 of the weighted indicators For example consider Neheso She is deprived in both health indicators as well as in cooking fuel sanitation water flooring and assets Her deprivations are labelled on the left hand side of the chart on the right The height of the boxes shows the weight of each indicator On the right hand side we stack up her deprivations and find that her deprivation score is 60 All poor people have deprivation scores between 3333 and 100 The average of the deprivation scores of all poor people is intensity
The MPI When you multiply 301 x 446 you obtain 0134 This is the MPI for Myanmar It shows that poor people in Myanmar are deprived in 134 of the deprivations that would be experienced if every person in Myanmar was poor and was deprived in all indicators The important thing is that MPI ranges from 0 to 1 and higher levels show higher poverty
How to Reduce MPIMPI goes down if a) somebody becomes non-poor so the incidence of poverty goes down or b) the intensity goes down because a poor person gets rid of a deprivation To accomplish either one though what is needed is to reduce deprivations in any one of the MPIrsquos ten indicators So we need to drill down and see how to do that
The MPI can also be broken down by indicators which is a useful tool for public policy The MPI itself is simply the percentage of people who are poor and deprived in each indicator multiplied by the weight on that indicator You add them up and obtain the value of MPI Remember that health and education indicators are weighted at 16 and living standard at 118 So in Myanmar the MPI
(0134) is also equal to (137+ 117+122+85)(16) + (29+222+113+216+51+14)(118) Visually you can see that the height of the graphic on the bottom left of page 9 is 0134 and each indicator lsquocontributesrsquo to it So if we reduce any depri vation of any poor person in any indicator what happens The height of the MPI goes down
If you prefer you can simply look at the table at the bottom of the page which shows the percentage of people in Myanmar who a) are MPI poor (because they have overlapping deprivations that stack up to one-third or more) and b) are deprived in each indicator For example 122 of people are MPI poor and have no one in their household who has completed five years of schooling We call these the lsquocensored headcount ratiosrsquo of each indicator If any of these very important deprivations goes down MPI goes down The bottom right hand chart on page 9 shows the censored headcount ratios for the Rakhine in Myanmar compared to the national average Similarly the chart on page 11 compares censored headcount ratios for two regions in Chad
These are the fundamental building blocks of the MPI Incidence Intensity Censored Headcount ratios and (weighted) Indicator contributions to MPI If you download the online data tables you will find all of these statistics (and some others) for every single country rural-urban area subnational region and for children But the goal is not just to understand poverty it is to use this information to fight poverty and suffering ndash through better policies and actions
140
Health Education Living Standards
NutritionChild
mortalityYears of
schoolingSchool
attendanceCooking
fuel Sanitation Drinking water Electricity Floor Assets
137 117 122 85 290 222 113 216 51
rarr
67
33
40
50
60
70
80
90
100
10
20
30
0
larr
larr
Hea
lthSt
anda
rd o
f Liv
ing
Nutrition
SanitationWater
Assets
Educ
atio
n
Flooring
Cooking Fuel
Child Mortality
NEHESO IS DEPRIVED IN
wwwophiorguk
8
Alkire and Robles
OPHI Briefing 47 | May 2017
Global Multidimensional Poverty Index 2017
8 9
MYANMAR
Myanmar (DHS 2014ndash15) is home to 53 million people Of these nearly 16 million or 30 are multidimensionally poor The poorest regions are Rakhine in the southwest and Shan and Kayin in the east pictured in the lightest green on the map of multidimensional poverty in Myanmar on the left In Rakhine just over half of the population (51) are multidimensionally poor with particularly high deprivations in nutrition cooking fuel sanitation assets and electricity (see the chart below) Among children aged 0-17 37 of them are poor whereas 26 of adults in Myanmar are MPI poor In rural areas child poverty rises to 44 of children whereas in urban areas itrsquos 14
MYANMAR
Kachin 1901
Shan 3952
Kayah 2303
Kayin 3694
Tanintharyi 2895
Mon 2486
Yangon 1257
Mandalay 24112
Chin 33813
8 Ayeyarwadd 390
10 Rakhine 513
11 Magway 274
Sagaing 31614
9 Bago 306
1
2
3
4
5
6
78
9
1011
1213
14
Multidimensional poverty in Myanmar
Cens
ored
hea
dcou
nt ra
tios
in th
e re
gion
pr
opor
tion
who
is p
oor a
nd d
epriv
ed in
Deprivation among the poor in Myanmar
The composition of poverty among Rakhine state and across Myanmar
60
30
50
20
10
40
0
10
20
30
40
50
60
0
Rakhine Myanmar (national)
Years of schooling
School attendance
Child mortality
Nutrition
Electricity
Sanitation
Drinking water
Floor
Cooking fuel
Assets
H ( MPI poor people)000
002
004
006
008
010
012
014
016
Composition of Myanmarrsquos MPIMPIvalue
Paul
Arp
s | F
lickr
CC
BY
20
wwwophiorguk
Alkire and Robles
10 11
Afghanistanrsquos national MPI is the highest in South Asia and 56 of Afghanis are acutely poor by the MPI Afghanistanrsquos poorest region Urozgan near central Afghanistan has an MPI of 0624 which is larger than the national MPI of Niger and 95 of people are poor This is followed by Nooristan (94) in the northeast and Badghis (79) and Kandahar (72) in the west and south of the country (see the map above) We do not have nutritional data for Afghanistan but 28 of people live in a household where a child has died ndash which is the highest figure for this indicator across every region of the world except Sub-Saharan Africa
Fully 59 of children are multidimensionally poor in Afghanistan and 53 of adults That means Afghanistan has 97 million MPI poor child ren and 75 million poor adults So well over half ndash in fact 56 of Afghanistanrsquos poor people are children Unfortunately 38 of poor people live in a household where a school-aged child is not attending school so attention to childrenrsquos deprivations is of critical importance In terms of region three-quarters of Afghanis live in rural areas where 65 of people are poor In the urban areas poverty rates are lower at 29
1
2
3
45 6 7 8
9
101112
1314
15
16
1718
1920
21
22
23
24 25 2627
2829
3031
32
33 34
AFGHANISTAN AFGHANISTAN
Herat 6331
Badghis 7932
Faryab 4943
Jawzjan 6094
Balkh 5575Kunduz 6056
Takhar 6517
Nooristan 9379
Badakhshan 6758
Ghazni 47416
Zabul 34617
Urozgan 94518Kandahar 72119
Helmand 61820
10 Kunarha 583
11 Laghman 704
12 Nangarhar 549
13 Khost 578
14 Paktya 452
15 Paktika 281
Nimroz 45421
Farah 61422
Ghor 74623
Sar-e Pol 67824
Samangan 64325
Baghlan 59726
Panjsher 25827
Daykundi 61532
Bamyan 61033
28 Kapisa 536
30 Logar 414
31 Wardak 679
Parwan 58634
29 Kabul 253
Multidimensional poverty in Afghanistan
John
Ass
elin
| Fl
ickr
CC
BY-
NC
-ND
20
OPHI Briefing 47 | May 2017
Global Multidimensional Poverty Index 2017
10 11
Chad (DHS 2014ndash15) is the fourth poorest among the 103 countries analyzed Fully 87 of people live in multidimensional poverty Over 80 of the population are poor and lack electricity adequate sanitation flooring and clean cooking fuel and over half (52) of the population are multidimensionally poor and have a school-aged child at home who is not attending school The poorest subnational regions in Chad are the drought-affected regions of Lac Wadi Fira Sila and Kanem In the regions of Lac and Kanem nearly 65 of the population are poor and have at least one malnourished woman or child (see the map above)
It might seem that in such a poor country (in 12 of Chadrsquos 20 regions more than 95 of people are poor) the MPI cannot add much analysis But the indicator details tell a new story Letrsquos compare the two poorest regions Lac and Wadi Fira ndash in which 98ndash99 of people are poor In Lac 34 of people are poor and have experienced the death of a child whereas in Wadi Fira itrsquos much lower at 20 But in Wadi Fira 97 of people lack clean drinking water whereas in Lac itrsquos 64 (the chart below) So clearly even between two extremely poor regions policy responses need to differ
CHAD CHAD
Lac and Wadi Fira Deprivation levels by indicator
Multidimensional poverty in Chad
12
3
4
5
6
789
101112
1314 15
1617
1819
Borkou Tibesti 891
Ennedi 9682Wadi Fira 993Ouaddaiuml 9534
Sila 9895Salamat 9786Moyen Chari 7417
Mayo Kebbi Ouest 86312Mayo Kebbi Est 86113
8 Mandoul 881
10 Logone occidental 791
11 Tandjileacute 843
Chari Baguirmi 96914
9 Logone oriental 881
15 Gueacutera 954
16 Hadjer Lamis 954
17 Lac 981
18 Kanem 98519 Barh El Gazal 957
20 Batha 957
20
YS Years of schooling
School attendance
CM Child mortality
N Nutrition
Electricity
Sanitation
Drinking water
Floor
Cooking fuel
Assets
SA
CF
S
DW
E
F
A
30
50
20
10
0
40
60
70
80
90
100
N CM YS SA CF S DW E F A
Ken
Doe
rr |
Flic
kr C
C B
Y 2
0
wwwophiorguk
Alkire and Robles
12 13
NEWS FLASHMPI DISAGGREGATION BY DISABILITY STATUS SOON TO BE STANDARD
In a recent study we disaggregated the global MPI by disability status for the first time[12] It was not previously possible to disaggregate the global MPI by disability but surveys that include standardized questions on disability are set to increase
Ugandarsquos 2011 Demographic and Health Survey (DHS) pioneered the Washington Group questions on disability a form of which will be included in DHS and Multiple Indicator Cluster Surveys (MICS) from 2017 onwards In Uganda 4 of people aged 5 years and above were living with a disability and 22 of all people live in a household where at least one member lives with a severe disability
As Figure 6 above shows households with at least one member with a severe disability faced higher levels of multidimensional poverty ndash a
77 poverty rate as compared with 69 among households without disability As comparable data become available the global MPI will be disaggregated by disability status in order to track ndash and hopefully to help reduce ndash the interlinkages among these conditions
Fig 6 Incidence of multidimensional poverty in Uganda by disability status
0
01
02
03
04
05
06
07
08
09
03
05
02
01
0
04
06
07
08
09
without disabilitywith disability
Bria
n W
olfe
| Fl
ickr
CC
BY-
NC
20
OPHI Briefing 47 | May 2017
Global Multidimensional Poverty Index 2017
12 13
DESTITUTIONThe distressing condition of destitution
bull Half of the MPI poor people live in destitution
bull In six countries and 117 subnational regions 50 or more of people are destitute
bull Most of the highest levels of destitution are found in Sub-Saharan Africa
bull Pakistan has more destitute people ndash 37 million ndash than East Asia and the Pacific (26 million) or the Arab States (26 million)
bull India has more destitute people (295 million) than Sub-Saharan Africa (282 million)
bull But most of the destitute people ndash 362 of the 706 million ndash live in South Asia
The MPI reflects acute multidimensional poverty in developing countries It measures absolute levels of poverty ndash which are very low in a number of countries such as China and many areas of Latin America For many countries a lsquomoderatersquo measure of multidimensional poverty is needed
Even so since 2014 we have reported a measure of destitution that identifies a subset of the MPI poor who are the poorest of the poor Unfortunately nearly half of all MPI poor people are destitute ndash 706 million men women and children
As with the MPI destitute people are deprived in one-third or more weighted indicators but the destitution indicators are more extreme They include severe malnutrition losing two or more children having a child out of primary school having no household member who has completed more than one year of schooling using open defecation fetching water that is unsafe or 45 or more minutes away not owning even a mobile phone or radio and cooking with wood or dung or straw only[13] To leave no one behind we must take urgent action to end the distressing condition of destitution
Figure 7 on the next page shows the percentage of the population who are MPI poor which is the height of the beige bar and the percentage who are living in destitution which is the height of the red subcomponent At a glance we can see that destitution rates ranges from 0 to 714 of the population What else do we see
First there are pockets of destitution even in low MPI countries In countries like Turkmenistan Bosnia and Herzegovina Barbados Uzbekistan and Azerbaijan 30 or more of MPI poor people are destitute But in South Africa less than 9 of the MPI poor are destitute
Second there are positive stories In 57 countries less than 10 of the population are destitute Similarly 506 subnational regions have less than 10 of the population living in destitution
Third in general destitution rates tend to be lower than $190day extreme income poverty rates But destitution is markedly higher than income poverty in Pakistan Mauritania Sudan Gambia Chad Ethiopia Niger and South Sudan This underscores the importance of measuring and fighting poverty in all its forms and dimensions
In some countries and regions destitution is still lsquothe normrsquo because it affects half of more of the population Six countries have more than 50 of their population living in destitution ndash and together they are home to 100 million poor people Drilling down in 117 subnational regions 50-92 of the population are destitute (161 million) These high destitution regions are mainly located in Sub-Saharan Africa Yet there are pockets of destitution in other regions In East Asia and the Pacific eight regions within Timor LrsquoEste have over 50 of people living in destitution Within the Arab States 58 of people in Sudanrsquos Central Darfur and 50 of people in Yemenrsquos Hajjah regions are destitute Within South Asia Afghanistanrsquos Urozgan Nooristan and Kandahar provinces have 50ndash78 of people living in destitution In Latin America six regions of Haiti plus Potosi in Bolivia have 20ndash36 of people living in destitution
Looking at the high rates of destitution we might presume that destitution is largely an African story But it is not Of the 706 million people who are destitute 362 million live in South Asia and 282 million in Sub-Saharan Africa In addition 26 million live in the Arab States another 26 million live in East Asia and over 8 million live in Latin America plus nearly 300000 in Europe and Central Asia India has over 295 million destitute people more than the total number if destitute people in all of Sub-Saharan Africa And Pakistan has 37 million destitute people according to its 201213 dataset more than either the Arab States or East Asia and the Pacific region
The story of destitution is not over But it should be These figures call for vigorous attention to be focused on destitution in South Asia and in Sub-Saharan Africa ndash and for even low poverty countries to track and empty the pockets of deep poverty in their midst
wwwophiorguk
Alkire and Robles
14 15
Fig 7 Comparing the headcount ratios of MPI poor destitute and $190day poor
$190day poorDestituteMPI poor
20 040 6080100
South SudanNigerEthiopiaChadBurkina FasoSomaliaSierra LeoneBurundiMaliCentral African RepublicGuineaDem Rep of CongoLiberiaUgandaMozambiqueTimor-LesteMadagascarGuinea -BissauBeninGambiaSenegalCote drsquoIvoireTanzaniaZambiaAfghanistanRwandaMalawiSudanNigeriaMauritaniaTogoHaitiCameroonYemenPakistanNamibiaIndiaBangladeshKenyaRep of CongoComorosZimbabweLao Peoplersquos Dem RepGhanaCambodiaLesothoVanuatuMyanmarDjiboutiNepalBhutanGuatemalaBoliviaSao Tome and PrincipeGabonNicaraguaSwazilandHondurasIndonesiaMoroccoTajikistanIraqPhilippinesPeruMongoliaSouth AfricaDominican RepublicViet NamEl SalvadorSurinameTrinidad and TobagoColombiaAzerbaijanBrazilMaldivesBelizeSyrian Arab RepublicChinaEgyptEcuadorGuyanaUzbekistanJamaicaJordanLibyaAlgeriaAlbaniaUkraineMexicoTunisiaPalestineSaint LuciaBarbadosThailandMoldovaMacedoniaBosnia and HerzegovinaKyrgyzstanTurkmenistanArmeniaMontenegro
KazakhstanSerbia
OPHI Briefing 47 | May 2017
Global Multidimensional Poverty Index 2017
14 15
REFERENCESAddis Ababa Accord (2015) lsquoAccord of the Third International Conference on Financing for Development Revised Draft 6 Mayrsquo
Alkire S and Foster J (2011) lsquoCounting and multidimensional poverty measurementrsquo Journal of Public Economics vol 95(7ndash8) pp 476ndash487
Alkire S Dorji L Gyeltshen S and Minten T (2016) Child Poverty in Bhutan Insights from Multidimensional Child Poverty Index and Qualitative Interviews with Poor Children National Statistics Bureau Bhutan
Alkire S and Robles G (2017) lsquoMultidimensional Poverty Index ndash summer 2017 brief methodological note and resultsrsquo OPHI MPI Methodological Notes 44 Oxford Poverty and Human Development Initiative University of Oxford
Alkire S and Santos ME (2014) lsquoMeasuring acute poverty in the developing world robustness and scope of the multidimensional poverty indexrsquo World Development vol 59 pp 251ndash274
Alkire S Jindra C Robles G and Vaz A (2017) lsquoChildrenrsquos multidimensional poverty disaggregating the global MPIrsquo OPHI Briefing 46 Oxford Poverty and Human Development Initiative University of Oxford
Organisation of Economic Cooperation and Development (OECD) (2017) lsquoCreditor reporting system (CRS) aid activity databasersquo Available here (Last accessed on 13 May 2017)
Pinilla-Roncancio M and Alkire S (2017) lsquoHow poor are people with disabilities around the globe A multidimensional perspectiversquo OPHI Research in Progress 48a Oxford Poverty and Human Development Initiative University of Oxford
United Nations (2015) Transforming Our World The 2030 Agenda for Sustainable Development ARES701
NOTES[1] All aggregates use 2013 population data[2] Section 51 paragraph 135[3] Addis Ababa Accord 2015 paragraph 119[4] Discussions are underway to consider whether data permit
adjustments to further align the global MPI with the SDGs[5] This section draws on lsquoChildrenrsquos multidimensional poverty
disaggregating the global MPIrsquo by Alkire et al (2017)[6] As with $190day poverty children are identified as poor
if they live in an MPI poor household Alternatively Child MPIs can be constructed that reflect each individual childrsquos deprivations by gender and age cohort (see Alkire et al 2016) but data are not available to build a global Child MPI with individual child data
[7] $190 is not available for Afghanistan Omitting Afghani stan 414 of people are MPI poor in South Asia
[8] We use income category definitions from July 2016 throughout this document
[9] The global MPI covers 92 of all people living in low or middle income countries It covers 99 of people living in low income countries (29 countries) 99 of the population in lower middle income countries (43) and 82 in upper middle income countries (29)
[10] There is no information on allocation to Macedonia and Palestine For those countries with MPI data from 2016 ODA flows allocated between 2011 and 2015 have been considered For South Sudan with 2010 MPI data ODA flows between 2011 and 2015 are used as this is the closest five-year period available
[11] The categories included are basic education basic health basic drinking water supply and basic sanitation (alone and together) electric power transmission and distribution low-cost housing multisector aid for basic social services developmental food aid and food security assistance
[12] Pinilla and Alkire 2017
[13] The indicators of electricity and flooring are unchanged
ONLINE RESOURCES
OPHIrsquos interactive databank enables you to study over 100 developing countries in terms of multidimensional poverty Choose interactive data visualizations to explore where and in which indicators people are poor or destitute and to show how MPI values compare with complementary data such as $190day poverty Or download a country briefing file for any country which contains explanations of its MPI and is illustrated with graphs maps and charts Excel data tables have all the details of MPI plus population standard errors sample sizes and much more Methodological notes provide any particularities of each countryrsquos survey data treatment
See wwwophiorgukmultidimensional-poverty-index
Oxford Poverty and Human Development Initiative (OPHI)
Oxford Department of International Development (ODID)Queen Elizabeth House (QEH)University of Oxford3 Mansfield Road Oxford OX1 3TBUnited Kingdom
ophi_oxford
ophioxford
ophi_oxford
Telephone+44 (0)1865 271915
Emailophiqehoxacuk
Websitewwwophiorguk
wwwophiorguk
Alkire and Robles
16 PB
MU
LTID
IMEN
SIO
NA
L PO
VERT
Y IN
DEX
ACR
OSS
TH
E W
ORL
D
0 ndash
005
01
ndash 0
2
02
ndash 0
3
03
ndash 0
4
04
ndash 0
5
05
+
005
ndash 0
1
OXFORD POVERTY amp HUMAN DEVELOPMENT INITIATIVE
OPHIT E N Y E A R
OPHIANNIVERSARY

OPHI Briefing 47 | May 2017
Global Multidimensional Poverty Index 2017
8 9
MYANMAR
Myanmar (DHS 2014ndash15) is home to 53 million people Of these nearly 16 million or 30 are multidimensionally poor The poorest regions are Rakhine in the southwest and Shan and Kayin in the east pictured in the lightest green on the map of multidimensional poverty in Myanmar on the left In Rakhine just over half of the population (51) are multidimensionally poor with particularly high deprivations in nutrition cooking fuel sanitation assets and electricity (see the chart below) Among children aged 0-17 37 of them are poor whereas 26 of adults in Myanmar are MPI poor In rural areas child poverty rises to 44 of children whereas in urban areas itrsquos 14
MYANMAR
Kachin 1901
Shan 3952
Kayah 2303
Kayin 3694
Tanintharyi 2895
Mon 2486
Yangon 1257
Mandalay 24112
Chin 33813
8 Ayeyarwadd 390
10 Rakhine 513
11 Magway 274
Sagaing 31614
9 Bago 306
1
2
3
4
5
6
78
9
1011
1213
14
Multidimensional poverty in Myanmar
Cens
ored
hea
dcou
nt ra
tios
in th
e re
gion
pr
opor
tion
who
is p
oor a
nd d
epriv
ed in
Deprivation among the poor in Myanmar
The composition of poverty among Rakhine state and across Myanmar
60
30
50
20
10
40
0
10
20
30
40
50
60
0
Rakhine Myanmar (national)
Years of schooling
School attendance
Child mortality
Nutrition
Electricity
Sanitation
Drinking water
Floor
Cooking fuel
Assets
H ( MPI poor people)000
002
004
006
008
010
012
014
016
Composition of Myanmarrsquos MPIMPIvalue
Paul
Arp
s | F
lickr
CC
BY
20
wwwophiorguk
Alkire and Robles
10 11
Afghanistanrsquos national MPI is the highest in South Asia and 56 of Afghanis are acutely poor by the MPI Afghanistanrsquos poorest region Urozgan near central Afghanistan has an MPI of 0624 which is larger than the national MPI of Niger and 95 of people are poor This is followed by Nooristan (94) in the northeast and Badghis (79) and Kandahar (72) in the west and south of the country (see the map above) We do not have nutritional data for Afghanistan but 28 of people live in a household where a child has died ndash which is the highest figure for this indicator across every region of the world except Sub-Saharan Africa
Fully 59 of children are multidimensionally poor in Afghanistan and 53 of adults That means Afghanistan has 97 million MPI poor child ren and 75 million poor adults So well over half ndash in fact 56 of Afghanistanrsquos poor people are children Unfortunately 38 of poor people live in a household where a school-aged child is not attending school so attention to childrenrsquos deprivations is of critical importance In terms of region three-quarters of Afghanis live in rural areas where 65 of people are poor In the urban areas poverty rates are lower at 29
1
2
3
45 6 7 8
9
101112
1314
15
16
1718
1920
21
22
23
24 25 2627
2829
3031
32
33 34
AFGHANISTAN AFGHANISTAN
Herat 6331
Badghis 7932
Faryab 4943
Jawzjan 6094
Balkh 5575Kunduz 6056
Takhar 6517
Nooristan 9379
Badakhshan 6758
Ghazni 47416
Zabul 34617
Urozgan 94518Kandahar 72119
Helmand 61820
10 Kunarha 583
11 Laghman 704
12 Nangarhar 549
13 Khost 578
14 Paktya 452
15 Paktika 281
Nimroz 45421
Farah 61422
Ghor 74623
Sar-e Pol 67824
Samangan 64325
Baghlan 59726
Panjsher 25827
Daykundi 61532
Bamyan 61033
28 Kapisa 536
30 Logar 414
31 Wardak 679
Parwan 58634
29 Kabul 253
Multidimensional poverty in Afghanistan
John
Ass
elin
| Fl
ickr
CC
BY-
NC
-ND
20
OPHI Briefing 47 | May 2017
Global Multidimensional Poverty Index 2017
10 11
Chad (DHS 2014ndash15) is the fourth poorest among the 103 countries analyzed Fully 87 of people live in multidimensional poverty Over 80 of the population are poor and lack electricity adequate sanitation flooring and clean cooking fuel and over half (52) of the population are multidimensionally poor and have a school-aged child at home who is not attending school The poorest subnational regions in Chad are the drought-affected regions of Lac Wadi Fira Sila and Kanem In the regions of Lac and Kanem nearly 65 of the population are poor and have at least one malnourished woman or child (see the map above)
It might seem that in such a poor country (in 12 of Chadrsquos 20 regions more than 95 of people are poor) the MPI cannot add much analysis But the indicator details tell a new story Letrsquos compare the two poorest regions Lac and Wadi Fira ndash in which 98ndash99 of people are poor In Lac 34 of people are poor and have experienced the death of a child whereas in Wadi Fira itrsquos much lower at 20 But in Wadi Fira 97 of people lack clean drinking water whereas in Lac itrsquos 64 (the chart below) So clearly even between two extremely poor regions policy responses need to differ
CHAD CHAD
Lac and Wadi Fira Deprivation levels by indicator
Multidimensional poverty in Chad
12
3
4
5
6
789
101112
1314 15
1617
1819
Borkou Tibesti 891
Ennedi 9682Wadi Fira 993Ouaddaiuml 9534
Sila 9895Salamat 9786Moyen Chari 7417
Mayo Kebbi Ouest 86312Mayo Kebbi Est 86113
8 Mandoul 881
10 Logone occidental 791
11 Tandjileacute 843
Chari Baguirmi 96914
9 Logone oriental 881
15 Gueacutera 954
16 Hadjer Lamis 954
17 Lac 981
18 Kanem 98519 Barh El Gazal 957
20 Batha 957
20
YS Years of schooling
School attendance
CM Child mortality
N Nutrition
Electricity
Sanitation
Drinking water
Floor
Cooking fuel
Assets
SA
CF
S
DW
E
F
A
30
50
20
10
0
40
60
70
80
90
100
N CM YS SA CF S DW E F A
Ken
Doe
rr |
Flic
kr C
C B
Y 2
0
wwwophiorguk
Alkire and Robles
12 13
NEWS FLASHMPI DISAGGREGATION BY DISABILITY STATUS SOON TO BE STANDARD
In a recent study we disaggregated the global MPI by disability status for the first time[12] It was not previously possible to disaggregate the global MPI by disability but surveys that include standardized questions on disability are set to increase
Ugandarsquos 2011 Demographic and Health Survey (DHS) pioneered the Washington Group questions on disability a form of which will be included in DHS and Multiple Indicator Cluster Surveys (MICS) from 2017 onwards In Uganda 4 of people aged 5 years and above were living with a disability and 22 of all people live in a household where at least one member lives with a severe disability
As Figure 6 above shows households with at least one member with a severe disability faced higher levels of multidimensional poverty ndash a
77 poverty rate as compared with 69 among households without disability As comparable data become available the global MPI will be disaggregated by disability status in order to track ndash and hopefully to help reduce ndash the interlinkages among these conditions
Fig 6 Incidence of multidimensional poverty in Uganda by disability status
0
01
02
03
04
05
06
07
08
09
03
05
02
01
0
04
06
07
08
09
without disabilitywith disability
Bria
n W
olfe
| Fl
ickr
CC
BY-
NC
20
OPHI Briefing 47 | May 2017
Global Multidimensional Poverty Index 2017
12 13
DESTITUTIONThe distressing condition of destitution
bull Half of the MPI poor people live in destitution
bull In six countries and 117 subnational regions 50 or more of people are destitute
bull Most of the highest levels of destitution are found in Sub-Saharan Africa
bull Pakistan has more destitute people ndash 37 million ndash than East Asia and the Pacific (26 million) or the Arab States (26 million)
bull India has more destitute people (295 million) than Sub-Saharan Africa (282 million)
bull But most of the destitute people ndash 362 of the 706 million ndash live in South Asia
The MPI reflects acute multidimensional poverty in developing countries It measures absolute levels of poverty ndash which are very low in a number of countries such as China and many areas of Latin America For many countries a lsquomoderatersquo measure of multidimensional poverty is needed
Even so since 2014 we have reported a measure of destitution that identifies a subset of the MPI poor who are the poorest of the poor Unfortunately nearly half of all MPI poor people are destitute ndash 706 million men women and children
As with the MPI destitute people are deprived in one-third or more weighted indicators but the destitution indicators are more extreme They include severe malnutrition losing two or more children having a child out of primary school having no household member who has completed more than one year of schooling using open defecation fetching water that is unsafe or 45 or more minutes away not owning even a mobile phone or radio and cooking with wood or dung or straw only[13] To leave no one behind we must take urgent action to end the distressing condition of destitution
Figure 7 on the next page shows the percentage of the population who are MPI poor which is the height of the beige bar and the percentage who are living in destitution which is the height of the red subcomponent At a glance we can see that destitution rates ranges from 0 to 714 of the population What else do we see
First there are pockets of destitution even in low MPI countries In countries like Turkmenistan Bosnia and Herzegovina Barbados Uzbekistan and Azerbaijan 30 or more of MPI poor people are destitute But in South Africa less than 9 of the MPI poor are destitute
Second there are positive stories In 57 countries less than 10 of the population are destitute Similarly 506 subnational regions have less than 10 of the population living in destitution
Third in general destitution rates tend to be lower than $190day extreme income poverty rates But destitution is markedly higher than income poverty in Pakistan Mauritania Sudan Gambia Chad Ethiopia Niger and South Sudan This underscores the importance of measuring and fighting poverty in all its forms and dimensions
In some countries and regions destitution is still lsquothe normrsquo because it affects half of more of the population Six countries have more than 50 of their population living in destitution ndash and together they are home to 100 million poor people Drilling down in 117 subnational regions 50-92 of the population are destitute (161 million) These high destitution regions are mainly located in Sub-Saharan Africa Yet there are pockets of destitution in other regions In East Asia and the Pacific eight regions within Timor LrsquoEste have over 50 of people living in destitution Within the Arab States 58 of people in Sudanrsquos Central Darfur and 50 of people in Yemenrsquos Hajjah regions are destitute Within South Asia Afghanistanrsquos Urozgan Nooristan and Kandahar provinces have 50ndash78 of people living in destitution In Latin America six regions of Haiti plus Potosi in Bolivia have 20ndash36 of people living in destitution
Looking at the high rates of destitution we might presume that destitution is largely an African story But it is not Of the 706 million people who are destitute 362 million live in South Asia and 282 million in Sub-Saharan Africa In addition 26 million live in the Arab States another 26 million live in East Asia and over 8 million live in Latin America plus nearly 300000 in Europe and Central Asia India has over 295 million destitute people more than the total number if destitute people in all of Sub-Saharan Africa And Pakistan has 37 million destitute people according to its 201213 dataset more than either the Arab States or East Asia and the Pacific region
The story of destitution is not over But it should be These figures call for vigorous attention to be focused on destitution in South Asia and in Sub-Saharan Africa ndash and for even low poverty countries to track and empty the pockets of deep poverty in their midst
wwwophiorguk
Alkire and Robles
14 15
Fig 7 Comparing the headcount ratios of MPI poor destitute and $190day poor
$190day poorDestituteMPI poor
20 040 6080100
South SudanNigerEthiopiaChadBurkina FasoSomaliaSierra LeoneBurundiMaliCentral African RepublicGuineaDem Rep of CongoLiberiaUgandaMozambiqueTimor-LesteMadagascarGuinea -BissauBeninGambiaSenegalCote drsquoIvoireTanzaniaZambiaAfghanistanRwandaMalawiSudanNigeriaMauritaniaTogoHaitiCameroonYemenPakistanNamibiaIndiaBangladeshKenyaRep of CongoComorosZimbabweLao Peoplersquos Dem RepGhanaCambodiaLesothoVanuatuMyanmarDjiboutiNepalBhutanGuatemalaBoliviaSao Tome and PrincipeGabonNicaraguaSwazilandHondurasIndonesiaMoroccoTajikistanIraqPhilippinesPeruMongoliaSouth AfricaDominican RepublicViet NamEl SalvadorSurinameTrinidad and TobagoColombiaAzerbaijanBrazilMaldivesBelizeSyrian Arab RepublicChinaEgyptEcuadorGuyanaUzbekistanJamaicaJordanLibyaAlgeriaAlbaniaUkraineMexicoTunisiaPalestineSaint LuciaBarbadosThailandMoldovaMacedoniaBosnia and HerzegovinaKyrgyzstanTurkmenistanArmeniaMontenegro
KazakhstanSerbia
OPHI Briefing 47 | May 2017
Global Multidimensional Poverty Index 2017
14 15
REFERENCESAddis Ababa Accord (2015) lsquoAccord of the Third International Conference on Financing for Development Revised Draft 6 Mayrsquo
Alkire S and Foster J (2011) lsquoCounting and multidimensional poverty measurementrsquo Journal of Public Economics vol 95(7ndash8) pp 476ndash487
Alkire S Dorji L Gyeltshen S and Minten T (2016) Child Poverty in Bhutan Insights from Multidimensional Child Poverty Index and Qualitative Interviews with Poor Children National Statistics Bureau Bhutan
Alkire S and Robles G (2017) lsquoMultidimensional Poverty Index ndash summer 2017 brief methodological note and resultsrsquo OPHI MPI Methodological Notes 44 Oxford Poverty and Human Development Initiative University of Oxford
Alkire S and Santos ME (2014) lsquoMeasuring acute poverty in the developing world robustness and scope of the multidimensional poverty indexrsquo World Development vol 59 pp 251ndash274
Alkire S Jindra C Robles G and Vaz A (2017) lsquoChildrenrsquos multidimensional poverty disaggregating the global MPIrsquo OPHI Briefing 46 Oxford Poverty and Human Development Initiative University of Oxford
Organisation of Economic Cooperation and Development (OECD) (2017) lsquoCreditor reporting system (CRS) aid activity databasersquo Available here (Last accessed on 13 May 2017)
Pinilla-Roncancio M and Alkire S (2017) lsquoHow poor are people with disabilities around the globe A multidimensional perspectiversquo OPHI Research in Progress 48a Oxford Poverty and Human Development Initiative University of Oxford
United Nations (2015) Transforming Our World The 2030 Agenda for Sustainable Development ARES701
NOTES[1] All aggregates use 2013 population data[2] Section 51 paragraph 135[3] Addis Ababa Accord 2015 paragraph 119[4] Discussions are underway to consider whether data permit
adjustments to further align the global MPI with the SDGs[5] This section draws on lsquoChildrenrsquos multidimensional poverty
disaggregating the global MPIrsquo by Alkire et al (2017)[6] As with $190day poverty children are identified as poor
if they live in an MPI poor household Alternatively Child MPIs can be constructed that reflect each individual childrsquos deprivations by gender and age cohort (see Alkire et al 2016) but data are not available to build a global Child MPI with individual child data
[7] $190 is not available for Afghanistan Omitting Afghani stan 414 of people are MPI poor in South Asia
[8] We use income category definitions from July 2016 throughout this document
[9] The global MPI covers 92 of all people living in low or middle income countries It covers 99 of people living in low income countries (29 countries) 99 of the population in lower middle income countries (43) and 82 in upper middle income countries (29)
[10] There is no information on allocation to Macedonia and Palestine For those countries with MPI data from 2016 ODA flows allocated between 2011 and 2015 have been considered For South Sudan with 2010 MPI data ODA flows between 2011 and 2015 are used as this is the closest five-year period available
[11] The categories included are basic education basic health basic drinking water supply and basic sanitation (alone and together) electric power transmission and distribution low-cost housing multisector aid for basic social services developmental food aid and food security assistance
[12] Pinilla and Alkire 2017
[13] The indicators of electricity and flooring are unchanged
ONLINE RESOURCES
OPHIrsquos interactive databank enables you to study over 100 developing countries in terms of multidimensional poverty Choose interactive data visualizations to explore where and in which indicators people are poor or destitute and to show how MPI values compare with complementary data such as $190day poverty Or download a country briefing file for any country which contains explanations of its MPI and is illustrated with graphs maps and charts Excel data tables have all the details of MPI plus population standard errors sample sizes and much more Methodological notes provide any particularities of each countryrsquos survey data treatment
See wwwophiorgukmultidimensional-poverty-index
Oxford Poverty and Human Development Initiative (OPHI)
Oxford Department of International Development (ODID)Queen Elizabeth House (QEH)University of Oxford3 Mansfield Road Oxford OX1 3TBUnited Kingdom
ophi_oxford
ophioxford
ophi_oxford
Telephone+44 (0)1865 271915
Emailophiqehoxacuk
Websitewwwophiorguk
wwwophiorguk
Alkire and Robles
16 PB
MU
LTID
IMEN
SIO
NA
L PO
VERT
Y IN
DEX
ACR
OSS
TH
E W
ORL
D
0 ndash
005
01
ndash 0
2
02
ndash 0
3
03
ndash 0
4
04
ndash 0
5
05
+
005
ndash 0
1
OXFORD POVERTY amp HUMAN DEVELOPMENT INITIATIVE
OPHIT E N Y E A R
OPHIANNIVERSARY

wwwophiorguk
Alkire and Robles
10 11
Afghanistanrsquos national MPI is the highest in South Asia and 56 of Afghanis are acutely poor by the MPI Afghanistanrsquos poorest region Urozgan near central Afghanistan has an MPI of 0624 which is larger than the national MPI of Niger and 95 of people are poor This is followed by Nooristan (94) in the northeast and Badghis (79) and Kandahar (72) in the west and south of the country (see the map above) We do not have nutritional data for Afghanistan but 28 of people live in a household where a child has died ndash which is the highest figure for this indicator across every region of the world except Sub-Saharan Africa
Fully 59 of children are multidimensionally poor in Afghanistan and 53 of adults That means Afghanistan has 97 million MPI poor child ren and 75 million poor adults So well over half ndash in fact 56 of Afghanistanrsquos poor people are children Unfortunately 38 of poor people live in a household where a school-aged child is not attending school so attention to childrenrsquos deprivations is of critical importance In terms of region three-quarters of Afghanis live in rural areas where 65 of people are poor In the urban areas poverty rates are lower at 29
1
2
3
45 6 7 8
9
101112
1314
15
16
1718
1920
21
22
23
24 25 2627
2829
3031
32
33 34
AFGHANISTAN AFGHANISTAN
Herat 6331
Badghis 7932
Faryab 4943
Jawzjan 6094
Balkh 5575Kunduz 6056
Takhar 6517
Nooristan 9379
Badakhshan 6758
Ghazni 47416
Zabul 34617
Urozgan 94518Kandahar 72119
Helmand 61820
10 Kunarha 583
11 Laghman 704
12 Nangarhar 549
13 Khost 578
14 Paktya 452
15 Paktika 281
Nimroz 45421
Farah 61422
Ghor 74623
Sar-e Pol 67824
Samangan 64325
Baghlan 59726
Panjsher 25827
Daykundi 61532
Bamyan 61033
28 Kapisa 536
30 Logar 414
31 Wardak 679
Parwan 58634
29 Kabul 253
Multidimensional poverty in Afghanistan
John
Ass
elin
| Fl
ickr
CC
BY-
NC
-ND
20
OPHI Briefing 47 | May 2017
Global Multidimensional Poverty Index 2017
10 11
Chad (DHS 2014ndash15) is the fourth poorest among the 103 countries analyzed Fully 87 of people live in multidimensional poverty Over 80 of the population are poor and lack electricity adequate sanitation flooring and clean cooking fuel and over half (52) of the population are multidimensionally poor and have a school-aged child at home who is not attending school The poorest subnational regions in Chad are the drought-affected regions of Lac Wadi Fira Sila and Kanem In the regions of Lac and Kanem nearly 65 of the population are poor and have at least one malnourished woman or child (see the map above)
It might seem that in such a poor country (in 12 of Chadrsquos 20 regions more than 95 of people are poor) the MPI cannot add much analysis But the indicator details tell a new story Letrsquos compare the two poorest regions Lac and Wadi Fira ndash in which 98ndash99 of people are poor In Lac 34 of people are poor and have experienced the death of a child whereas in Wadi Fira itrsquos much lower at 20 But in Wadi Fira 97 of people lack clean drinking water whereas in Lac itrsquos 64 (the chart below) So clearly even between two extremely poor regions policy responses need to differ
CHAD CHAD
Lac and Wadi Fira Deprivation levels by indicator
Multidimensional poverty in Chad
12
3
4
5
6
789
101112
1314 15
1617
1819
Borkou Tibesti 891
Ennedi 9682Wadi Fira 993Ouaddaiuml 9534
Sila 9895Salamat 9786Moyen Chari 7417
Mayo Kebbi Ouest 86312Mayo Kebbi Est 86113
8 Mandoul 881
10 Logone occidental 791
11 Tandjileacute 843
Chari Baguirmi 96914
9 Logone oriental 881
15 Gueacutera 954
16 Hadjer Lamis 954
17 Lac 981
18 Kanem 98519 Barh El Gazal 957
20 Batha 957
20
YS Years of schooling
School attendance
CM Child mortality
N Nutrition
Electricity
Sanitation
Drinking water
Floor
Cooking fuel
Assets
SA
CF
S
DW
E
F
A
30
50
20
10
0
40
60
70
80
90
100
N CM YS SA CF S DW E F A
Ken
Doe
rr |
Flic
kr C
C B
Y 2
0
wwwophiorguk
Alkire and Robles
12 13
NEWS FLASHMPI DISAGGREGATION BY DISABILITY STATUS SOON TO BE STANDARD
In a recent study we disaggregated the global MPI by disability status for the first time[12] It was not previously possible to disaggregate the global MPI by disability but surveys that include standardized questions on disability are set to increase
Ugandarsquos 2011 Demographic and Health Survey (DHS) pioneered the Washington Group questions on disability a form of which will be included in DHS and Multiple Indicator Cluster Surveys (MICS) from 2017 onwards In Uganda 4 of people aged 5 years and above were living with a disability and 22 of all people live in a household where at least one member lives with a severe disability
As Figure 6 above shows households with at least one member with a severe disability faced higher levels of multidimensional poverty ndash a
77 poverty rate as compared with 69 among households without disability As comparable data become available the global MPI will be disaggregated by disability status in order to track ndash and hopefully to help reduce ndash the interlinkages among these conditions
Fig 6 Incidence of multidimensional poverty in Uganda by disability status
0
01
02
03
04
05
06
07
08
09
03
05
02
01
0
04
06
07
08
09
without disabilitywith disability
Bria
n W
olfe
| Fl
ickr
CC
BY-
NC
20
OPHI Briefing 47 | May 2017
Global Multidimensional Poverty Index 2017
12 13
DESTITUTIONThe distressing condition of destitution
bull Half of the MPI poor people live in destitution
bull In six countries and 117 subnational regions 50 or more of people are destitute
bull Most of the highest levels of destitution are found in Sub-Saharan Africa
bull Pakistan has more destitute people ndash 37 million ndash than East Asia and the Pacific (26 million) or the Arab States (26 million)
bull India has more destitute people (295 million) than Sub-Saharan Africa (282 million)
bull But most of the destitute people ndash 362 of the 706 million ndash live in South Asia
The MPI reflects acute multidimensional poverty in developing countries It measures absolute levels of poverty ndash which are very low in a number of countries such as China and many areas of Latin America For many countries a lsquomoderatersquo measure of multidimensional poverty is needed
Even so since 2014 we have reported a measure of destitution that identifies a subset of the MPI poor who are the poorest of the poor Unfortunately nearly half of all MPI poor people are destitute ndash 706 million men women and children
As with the MPI destitute people are deprived in one-third or more weighted indicators but the destitution indicators are more extreme They include severe malnutrition losing two or more children having a child out of primary school having no household member who has completed more than one year of schooling using open defecation fetching water that is unsafe or 45 or more minutes away not owning even a mobile phone or radio and cooking with wood or dung or straw only[13] To leave no one behind we must take urgent action to end the distressing condition of destitution
Figure 7 on the next page shows the percentage of the population who are MPI poor which is the height of the beige bar and the percentage who are living in destitution which is the height of the red subcomponent At a glance we can see that destitution rates ranges from 0 to 714 of the population What else do we see
First there are pockets of destitution even in low MPI countries In countries like Turkmenistan Bosnia and Herzegovina Barbados Uzbekistan and Azerbaijan 30 or more of MPI poor people are destitute But in South Africa less than 9 of the MPI poor are destitute
Second there are positive stories In 57 countries less than 10 of the population are destitute Similarly 506 subnational regions have less than 10 of the population living in destitution
Third in general destitution rates tend to be lower than $190day extreme income poverty rates But destitution is markedly higher than income poverty in Pakistan Mauritania Sudan Gambia Chad Ethiopia Niger and South Sudan This underscores the importance of measuring and fighting poverty in all its forms and dimensions
In some countries and regions destitution is still lsquothe normrsquo because it affects half of more of the population Six countries have more than 50 of their population living in destitution ndash and together they are home to 100 million poor people Drilling down in 117 subnational regions 50-92 of the population are destitute (161 million) These high destitution regions are mainly located in Sub-Saharan Africa Yet there are pockets of destitution in other regions In East Asia and the Pacific eight regions within Timor LrsquoEste have over 50 of people living in destitution Within the Arab States 58 of people in Sudanrsquos Central Darfur and 50 of people in Yemenrsquos Hajjah regions are destitute Within South Asia Afghanistanrsquos Urozgan Nooristan and Kandahar provinces have 50ndash78 of people living in destitution In Latin America six regions of Haiti plus Potosi in Bolivia have 20ndash36 of people living in destitution
Looking at the high rates of destitution we might presume that destitution is largely an African story But it is not Of the 706 million people who are destitute 362 million live in South Asia and 282 million in Sub-Saharan Africa In addition 26 million live in the Arab States another 26 million live in East Asia and over 8 million live in Latin America plus nearly 300000 in Europe and Central Asia India has over 295 million destitute people more than the total number if destitute people in all of Sub-Saharan Africa And Pakistan has 37 million destitute people according to its 201213 dataset more than either the Arab States or East Asia and the Pacific region
The story of destitution is not over But it should be These figures call for vigorous attention to be focused on destitution in South Asia and in Sub-Saharan Africa ndash and for even low poverty countries to track and empty the pockets of deep poverty in their midst
wwwophiorguk
Alkire and Robles
14 15
Fig 7 Comparing the headcount ratios of MPI poor destitute and $190day poor
$190day poorDestituteMPI poor
20 040 6080100
South SudanNigerEthiopiaChadBurkina FasoSomaliaSierra LeoneBurundiMaliCentral African RepublicGuineaDem Rep of CongoLiberiaUgandaMozambiqueTimor-LesteMadagascarGuinea -BissauBeninGambiaSenegalCote drsquoIvoireTanzaniaZambiaAfghanistanRwandaMalawiSudanNigeriaMauritaniaTogoHaitiCameroonYemenPakistanNamibiaIndiaBangladeshKenyaRep of CongoComorosZimbabweLao Peoplersquos Dem RepGhanaCambodiaLesothoVanuatuMyanmarDjiboutiNepalBhutanGuatemalaBoliviaSao Tome and PrincipeGabonNicaraguaSwazilandHondurasIndonesiaMoroccoTajikistanIraqPhilippinesPeruMongoliaSouth AfricaDominican RepublicViet NamEl SalvadorSurinameTrinidad and TobagoColombiaAzerbaijanBrazilMaldivesBelizeSyrian Arab RepublicChinaEgyptEcuadorGuyanaUzbekistanJamaicaJordanLibyaAlgeriaAlbaniaUkraineMexicoTunisiaPalestineSaint LuciaBarbadosThailandMoldovaMacedoniaBosnia and HerzegovinaKyrgyzstanTurkmenistanArmeniaMontenegro
KazakhstanSerbia
OPHI Briefing 47 | May 2017
Global Multidimensional Poverty Index 2017
14 15
REFERENCESAddis Ababa Accord (2015) lsquoAccord of the Third International Conference on Financing for Development Revised Draft 6 Mayrsquo
Alkire S and Foster J (2011) lsquoCounting and multidimensional poverty measurementrsquo Journal of Public Economics vol 95(7ndash8) pp 476ndash487
Alkire S Dorji L Gyeltshen S and Minten T (2016) Child Poverty in Bhutan Insights from Multidimensional Child Poverty Index and Qualitative Interviews with Poor Children National Statistics Bureau Bhutan
Alkire S and Robles G (2017) lsquoMultidimensional Poverty Index ndash summer 2017 brief methodological note and resultsrsquo OPHI MPI Methodological Notes 44 Oxford Poverty and Human Development Initiative University of Oxford
Alkire S and Santos ME (2014) lsquoMeasuring acute poverty in the developing world robustness and scope of the multidimensional poverty indexrsquo World Development vol 59 pp 251ndash274
Alkire S Jindra C Robles G and Vaz A (2017) lsquoChildrenrsquos multidimensional poverty disaggregating the global MPIrsquo OPHI Briefing 46 Oxford Poverty and Human Development Initiative University of Oxford
Organisation of Economic Cooperation and Development (OECD) (2017) lsquoCreditor reporting system (CRS) aid activity databasersquo Available here (Last accessed on 13 May 2017)
Pinilla-Roncancio M and Alkire S (2017) lsquoHow poor are people with disabilities around the globe A multidimensional perspectiversquo OPHI Research in Progress 48a Oxford Poverty and Human Development Initiative University of Oxford
United Nations (2015) Transforming Our World The 2030 Agenda for Sustainable Development ARES701
NOTES[1] All aggregates use 2013 population data[2] Section 51 paragraph 135[3] Addis Ababa Accord 2015 paragraph 119[4] Discussions are underway to consider whether data permit
adjustments to further align the global MPI with the SDGs[5] This section draws on lsquoChildrenrsquos multidimensional poverty
disaggregating the global MPIrsquo by Alkire et al (2017)[6] As with $190day poverty children are identified as poor
if they live in an MPI poor household Alternatively Child MPIs can be constructed that reflect each individual childrsquos deprivations by gender and age cohort (see Alkire et al 2016) but data are not available to build a global Child MPI with individual child data
[7] $190 is not available for Afghanistan Omitting Afghani stan 414 of people are MPI poor in South Asia
[8] We use income category definitions from July 2016 throughout this document
[9] The global MPI covers 92 of all people living in low or middle income countries It covers 99 of people living in low income countries (29 countries) 99 of the population in lower middle income countries (43) and 82 in upper middle income countries (29)
[10] There is no information on allocation to Macedonia and Palestine For those countries with MPI data from 2016 ODA flows allocated between 2011 and 2015 have been considered For South Sudan with 2010 MPI data ODA flows between 2011 and 2015 are used as this is the closest five-year period available
[11] The categories included are basic education basic health basic drinking water supply and basic sanitation (alone and together) electric power transmission and distribution low-cost housing multisector aid for basic social services developmental food aid and food security assistance
[12] Pinilla and Alkire 2017
[13] The indicators of electricity and flooring are unchanged
ONLINE RESOURCES
OPHIrsquos interactive databank enables you to study over 100 developing countries in terms of multidimensional poverty Choose interactive data visualizations to explore where and in which indicators people are poor or destitute and to show how MPI values compare with complementary data such as $190day poverty Or download a country briefing file for any country which contains explanations of its MPI and is illustrated with graphs maps and charts Excel data tables have all the details of MPI plus population standard errors sample sizes and much more Methodological notes provide any particularities of each countryrsquos survey data treatment
See wwwophiorgukmultidimensional-poverty-index
Oxford Poverty and Human Development Initiative (OPHI)
Oxford Department of International Development (ODID)Queen Elizabeth House (QEH)University of Oxford3 Mansfield Road Oxford OX1 3TBUnited Kingdom
ophi_oxford
ophioxford
ophi_oxford
Telephone+44 (0)1865 271915
Emailophiqehoxacuk
Websitewwwophiorguk
wwwophiorguk
Alkire and Robles
16 PB
MU
LTID
IMEN
SIO
NA
L PO
VERT
Y IN
DEX
ACR
OSS
TH
E W
ORL
D
0 ndash
005
01
ndash 0
2
02
ndash 0
3
03
ndash 0
4
04
ndash 0
5
05
+
005
ndash 0
1
OXFORD POVERTY amp HUMAN DEVELOPMENT INITIATIVE
OPHIT E N Y E A R
OPHIANNIVERSARY

OPHI Briefing 47 | May 2017
Global Multidimensional Poverty Index 2017
10 11
Chad (DHS 2014ndash15) is the fourth poorest among the 103 countries analyzed Fully 87 of people live in multidimensional poverty Over 80 of the population are poor and lack electricity adequate sanitation flooring and clean cooking fuel and over half (52) of the population are multidimensionally poor and have a school-aged child at home who is not attending school The poorest subnational regions in Chad are the drought-affected regions of Lac Wadi Fira Sila and Kanem In the regions of Lac and Kanem nearly 65 of the population are poor and have at least one malnourished woman or child (see the map above)
It might seem that in such a poor country (in 12 of Chadrsquos 20 regions more than 95 of people are poor) the MPI cannot add much analysis But the indicator details tell a new story Letrsquos compare the two poorest regions Lac and Wadi Fira ndash in which 98ndash99 of people are poor In Lac 34 of people are poor and have experienced the death of a child whereas in Wadi Fira itrsquos much lower at 20 But in Wadi Fira 97 of people lack clean drinking water whereas in Lac itrsquos 64 (the chart below) So clearly even between two extremely poor regions policy responses need to differ
CHAD CHAD
Lac and Wadi Fira Deprivation levels by indicator
Multidimensional poverty in Chad
12
3
4
5
6
789
101112
1314 15
1617
1819
Borkou Tibesti 891
Ennedi 9682Wadi Fira 993Ouaddaiuml 9534
Sila 9895Salamat 9786Moyen Chari 7417
Mayo Kebbi Ouest 86312Mayo Kebbi Est 86113
8 Mandoul 881
10 Logone occidental 791
11 Tandjileacute 843
Chari Baguirmi 96914
9 Logone oriental 881
15 Gueacutera 954
16 Hadjer Lamis 954
17 Lac 981
18 Kanem 98519 Barh El Gazal 957
20 Batha 957
20
YS Years of schooling
School attendance
CM Child mortality
N Nutrition
Electricity
Sanitation
Drinking water
Floor
Cooking fuel
Assets
SA
CF
S
DW
E
F
A
30
50
20
10
0
40
60
70
80
90
100
N CM YS SA CF S DW E F A
Ken
Doe
rr |
Flic
kr C
C B
Y 2
0
wwwophiorguk
Alkire and Robles
12 13
NEWS FLASHMPI DISAGGREGATION BY DISABILITY STATUS SOON TO BE STANDARD
In a recent study we disaggregated the global MPI by disability status for the first time[12] It was not previously possible to disaggregate the global MPI by disability but surveys that include standardized questions on disability are set to increase
Ugandarsquos 2011 Demographic and Health Survey (DHS) pioneered the Washington Group questions on disability a form of which will be included in DHS and Multiple Indicator Cluster Surveys (MICS) from 2017 onwards In Uganda 4 of people aged 5 years and above were living with a disability and 22 of all people live in a household where at least one member lives with a severe disability
As Figure 6 above shows households with at least one member with a severe disability faced higher levels of multidimensional poverty ndash a
77 poverty rate as compared with 69 among households without disability As comparable data become available the global MPI will be disaggregated by disability status in order to track ndash and hopefully to help reduce ndash the interlinkages among these conditions
Fig 6 Incidence of multidimensional poverty in Uganda by disability status
0
01
02
03
04
05
06
07
08
09
03
05
02
01
0
04
06
07
08
09
without disabilitywith disability
Bria
n W
olfe
| Fl
ickr
CC
BY-
NC
20
OPHI Briefing 47 | May 2017
Global Multidimensional Poverty Index 2017
12 13
DESTITUTIONThe distressing condition of destitution
bull Half of the MPI poor people live in destitution
bull In six countries and 117 subnational regions 50 or more of people are destitute
bull Most of the highest levels of destitution are found in Sub-Saharan Africa
bull Pakistan has more destitute people ndash 37 million ndash than East Asia and the Pacific (26 million) or the Arab States (26 million)
bull India has more destitute people (295 million) than Sub-Saharan Africa (282 million)
bull But most of the destitute people ndash 362 of the 706 million ndash live in South Asia
The MPI reflects acute multidimensional poverty in developing countries It measures absolute levels of poverty ndash which are very low in a number of countries such as China and many areas of Latin America For many countries a lsquomoderatersquo measure of multidimensional poverty is needed
Even so since 2014 we have reported a measure of destitution that identifies a subset of the MPI poor who are the poorest of the poor Unfortunately nearly half of all MPI poor people are destitute ndash 706 million men women and children
As with the MPI destitute people are deprived in one-third or more weighted indicators but the destitution indicators are more extreme They include severe malnutrition losing two or more children having a child out of primary school having no household member who has completed more than one year of schooling using open defecation fetching water that is unsafe or 45 or more minutes away not owning even a mobile phone or radio and cooking with wood or dung or straw only[13] To leave no one behind we must take urgent action to end the distressing condition of destitution
Figure 7 on the next page shows the percentage of the population who are MPI poor which is the height of the beige bar and the percentage who are living in destitution which is the height of the red subcomponent At a glance we can see that destitution rates ranges from 0 to 714 of the population What else do we see
First there are pockets of destitution even in low MPI countries In countries like Turkmenistan Bosnia and Herzegovina Barbados Uzbekistan and Azerbaijan 30 or more of MPI poor people are destitute But in South Africa less than 9 of the MPI poor are destitute
Second there are positive stories In 57 countries less than 10 of the population are destitute Similarly 506 subnational regions have less than 10 of the population living in destitution
Third in general destitution rates tend to be lower than $190day extreme income poverty rates But destitution is markedly higher than income poverty in Pakistan Mauritania Sudan Gambia Chad Ethiopia Niger and South Sudan This underscores the importance of measuring and fighting poverty in all its forms and dimensions
In some countries and regions destitution is still lsquothe normrsquo because it affects half of more of the population Six countries have more than 50 of their population living in destitution ndash and together they are home to 100 million poor people Drilling down in 117 subnational regions 50-92 of the population are destitute (161 million) These high destitution regions are mainly located in Sub-Saharan Africa Yet there are pockets of destitution in other regions In East Asia and the Pacific eight regions within Timor LrsquoEste have over 50 of people living in destitution Within the Arab States 58 of people in Sudanrsquos Central Darfur and 50 of people in Yemenrsquos Hajjah regions are destitute Within South Asia Afghanistanrsquos Urozgan Nooristan and Kandahar provinces have 50ndash78 of people living in destitution In Latin America six regions of Haiti plus Potosi in Bolivia have 20ndash36 of people living in destitution
Looking at the high rates of destitution we might presume that destitution is largely an African story But it is not Of the 706 million people who are destitute 362 million live in South Asia and 282 million in Sub-Saharan Africa In addition 26 million live in the Arab States another 26 million live in East Asia and over 8 million live in Latin America plus nearly 300000 in Europe and Central Asia India has over 295 million destitute people more than the total number if destitute people in all of Sub-Saharan Africa And Pakistan has 37 million destitute people according to its 201213 dataset more than either the Arab States or East Asia and the Pacific region
The story of destitution is not over But it should be These figures call for vigorous attention to be focused on destitution in South Asia and in Sub-Saharan Africa ndash and for even low poverty countries to track and empty the pockets of deep poverty in their midst
wwwophiorguk
Alkire and Robles
14 15
Fig 7 Comparing the headcount ratios of MPI poor destitute and $190day poor
$190day poorDestituteMPI poor
20 040 6080100
South SudanNigerEthiopiaChadBurkina FasoSomaliaSierra LeoneBurundiMaliCentral African RepublicGuineaDem Rep of CongoLiberiaUgandaMozambiqueTimor-LesteMadagascarGuinea -BissauBeninGambiaSenegalCote drsquoIvoireTanzaniaZambiaAfghanistanRwandaMalawiSudanNigeriaMauritaniaTogoHaitiCameroonYemenPakistanNamibiaIndiaBangladeshKenyaRep of CongoComorosZimbabweLao Peoplersquos Dem RepGhanaCambodiaLesothoVanuatuMyanmarDjiboutiNepalBhutanGuatemalaBoliviaSao Tome and PrincipeGabonNicaraguaSwazilandHondurasIndonesiaMoroccoTajikistanIraqPhilippinesPeruMongoliaSouth AfricaDominican RepublicViet NamEl SalvadorSurinameTrinidad and TobagoColombiaAzerbaijanBrazilMaldivesBelizeSyrian Arab RepublicChinaEgyptEcuadorGuyanaUzbekistanJamaicaJordanLibyaAlgeriaAlbaniaUkraineMexicoTunisiaPalestineSaint LuciaBarbadosThailandMoldovaMacedoniaBosnia and HerzegovinaKyrgyzstanTurkmenistanArmeniaMontenegro
KazakhstanSerbia
OPHI Briefing 47 | May 2017
Global Multidimensional Poverty Index 2017
14 15
REFERENCESAddis Ababa Accord (2015) lsquoAccord of the Third International Conference on Financing for Development Revised Draft 6 Mayrsquo
Alkire S and Foster J (2011) lsquoCounting and multidimensional poverty measurementrsquo Journal of Public Economics vol 95(7ndash8) pp 476ndash487
Alkire S Dorji L Gyeltshen S and Minten T (2016) Child Poverty in Bhutan Insights from Multidimensional Child Poverty Index and Qualitative Interviews with Poor Children National Statistics Bureau Bhutan
Alkire S and Robles G (2017) lsquoMultidimensional Poverty Index ndash summer 2017 brief methodological note and resultsrsquo OPHI MPI Methodological Notes 44 Oxford Poverty and Human Development Initiative University of Oxford
Alkire S and Santos ME (2014) lsquoMeasuring acute poverty in the developing world robustness and scope of the multidimensional poverty indexrsquo World Development vol 59 pp 251ndash274
Alkire S Jindra C Robles G and Vaz A (2017) lsquoChildrenrsquos multidimensional poverty disaggregating the global MPIrsquo OPHI Briefing 46 Oxford Poverty and Human Development Initiative University of Oxford
Organisation of Economic Cooperation and Development (OECD) (2017) lsquoCreditor reporting system (CRS) aid activity databasersquo Available here (Last accessed on 13 May 2017)
Pinilla-Roncancio M and Alkire S (2017) lsquoHow poor are people with disabilities around the globe A multidimensional perspectiversquo OPHI Research in Progress 48a Oxford Poverty and Human Development Initiative University of Oxford
United Nations (2015) Transforming Our World The 2030 Agenda for Sustainable Development ARES701
NOTES[1] All aggregates use 2013 population data[2] Section 51 paragraph 135[3] Addis Ababa Accord 2015 paragraph 119[4] Discussions are underway to consider whether data permit
adjustments to further align the global MPI with the SDGs[5] This section draws on lsquoChildrenrsquos multidimensional poverty
disaggregating the global MPIrsquo by Alkire et al (2017)[6] As with $190day poverty children are identified as poor
if they live in an MPI poor household Alternatively Child MPIs can be constructed that reflect each individual childrsquos deprivations by gender and age cohort (see Alkire et al 2016) but data are not available to build a global Child MPI with individual child data
[7] $190 is not available for Afghanistan Omitting Afghani stan 414 of people are MPI poor in South Asia
[8] We use income category definitions from July 2016 throughout this document
[9] The global MPI covers 92 of all people living in low or middle income countries It covers 99 of people living in low income countries (29 countries) 99 of the population in lower middle income countries (43) and 82 in upper middle income countries (29)
[10] There is no information on allocation to Macedonia and Palestine For those countries with MPI data from 2016 ODA flows allocated between 2011 and 2015 have been considered For South Sudan with 2010 MPI data ODA flows between 2011 and 2015 are used as this is the closest five-year period available
[11] The categories included are basic education basic health basic drinking water supply and basic sanitation (alone and together) electric power transmission and distribution low-cost housing multisector aid for basic social services developmental food aid and food security assistance
[12] Pinilla and Alkire 2017
[13] The indicators of electricity and flooring are unchanged
ONLINE RESOURCES
OPHIrsquos interactive databank enables you to study over 100 developing countries in terms of multidimensional poverty Choose interactive data visualizations to explore where and in which indicators people are poor or destitute and to show how MPI values compare with complementary data such as $190day poverty Or download a country briefing file for any country which contains explanations of its MPI and is illustrated with graphs maps and charts Excel data tables have all the details of MPI plus population standard errors sample sizes and much more Methodological notes provide any particularities of each countryrsquos survey data treatment
See wwwophiorgukmultidimensional-poverty-index
Oxford Poverty and Human Development Initiative (OPHI)
Oxford Department of International Development (ODID)Queen Elizabeth House (QEH)University of Oxford3 Mansfield Road Oxford OX1 3TBUnited Kingdom
ophi_oxford
ophioxford
ophi_oxford
Telephone+44 (0)1865 271915
Emailophiqehoxacuk
Websitewwwophiorguk
wwwophiorguk
Alkire and Robles
16 PB
MU
LTID
IMEN
SIO
NA
L PO
VERT
Y IN
DEX
ACR
OSS
TH
E W
ORL
D
0 ndash
005
01
ndash 0
2
02
ndash 0
3
03
ndash 0
4
04
ndash 0
5
05
+
005
ndash 0
1
OXFORD POVERTY amp HUMAN DEVELOPMENT INITIATIVE
OPHIT E N Y E A R
OPHIANNIVERSARY

wwwophiorguk
Alkire and Robles
12 13
NEWS FLASHMPI DISAGGREGATION BY DISABILITY STATUS SOON TO BE STANDARD
In a recent study we disaggregated the global MPI by disability status for the first time[12] It was not previously possible to disaggregate the global MPI by disability but surveys that include standardized questions on disability are set to increase
Ugandarsquos 2011 Demographic and Health Survey (DHS) pioneered the Washington Group questions on disability a form of which will be included in DHS and Multiple Indicator Cluster Surveys (MICS) from 2017 onwards In Uganda 4 of people aged 5 years and above were living with a disability and 22 of all people live in a household where at least one member lives with a severe disability
As Figure 6 above shows households with at least one member with a severe disability faced higher levels of multidimensional poverty ndash a
77 poverty rate as compared with 69 among households without disability As comparable data become available the global MPI will be disaggregated by disability status in order to track ndash and hopefully to help reduce ndash the interlinkages among these conditions
Fig 6 Incidence of multidimensional poverty in Uganda by disability status
0
01
02
03
04
05
06
07
08
09
03
05
02
01
0
04
06
07
08
09
without disabilitywith disability
Bria
n W
olfe
| Fl
ickr
CC
BY-
NC
20
OPHI Briefing 47 | May 2017
Global Multidimensional Poverty Index 2017
12 13
DESTITUTIONThe distressing condition of destitution
bull Half of the MPI poor people live in destitution
bull In six countries and 117 subnational regions 50 or more of people are destitute
bull Most of the highest levels of destitution are found in Sub-Saharan Africa
bull Pakistan has more destitute people ndash 37 million ndash than East Asia and the Pacific (26 million) or the Arab States (26 million)
bull India has more destitute people (295 million) than Sub-Saharan Africa (282 million)
bull But most of the destitute people ndash 362 of the 706 million ndash live in South Asia
The MPI reflects acute multidimensional poverty in developing countries It measures absolute levels of poverty ndash which are very low in a number of countries such as China and many areas of Latin America For many countries a lsquomoderatersquo measure of multidimensional poverty is needed
Even so since 2014 we have reported a measure of destitution that identifies a subset of the MPI poor who are the poorest of the poor Unfortunately nearly half of all MPI poor people are destitute ndash 706 million men women and children
As with the MPI destitute people are deprived in one-third or more weighted indicators but the destitution indicators are more extreme They include severe malnutrition losing two or more children having a child out of primary school having no household member who has completed more than one year of schooling using open defecation fetching water that is unsafe or 45 or more minutes away not owning even a mobile phone or radio and cooking with wood or dung or straw only[13] To leave no one behind we must take urgent action to end the distressing condition of destitution
Figure 7 on the next page shows the percentage of the population who are MPI poor which is the height of the beige bar and the percentage who are living in destitution which is the height of the red subcomponent At a glance we can see that destitution rates ranges from 0 to 714 of the population What else do we see
First there are pockets of destitution even in low MPI countries In countries like Turkmenistan Bosnia and Herzegovina Barbados Uzbekistan and Azerbaijan 30 or more of MPI poor people are destitute But in South Africa less than 9 of the MPI poor are destitute
Second there are positive stories In 57 countries less than 10 of the population are destitute Similarly 506 subnational regions have less than 10 of the population living in destitution
Third in general destitution rates tend to be lower than $190day extreme income poverty rates But destitution is markedly higher than income poverty in Pakistan Mauritania Sudan Gambia Chad Ethiopia Niger and South Sudan This underscores the importance of measuring and fighting poverty in all its forms and dimensions
In some countries and regions destitution is still lsquothe normrsquo because it affects half of more of the population Six countries have more than 50 of their population living in destitution ndash and together they are home to 100 million poor people Drilling down in 117 subnational regions 50-92 of the population are destitute (161 million) These high destitution regions are mainly located in Sub-Saharan Africa Yet there are pockets of destitution in other regions In East Asia and the Pacific eight regions within Timor LrsquoEste have over 50 of people living in destitution Within the Arab States 58 of people in Sudanrsquos Central Darfur and 50 of people in Yemenrsquos Hajjah regions are destitute Within South Asia Afghanistanrsquos Urozgan Nooristan and Kandahar provinces have 50ndash78 of people living in destitution In Latin America six regions of Haiti plus Potosi in Bolivia have 20ndash36 of people living in destitution
Looking at the high rates of destitution we might presume that destitution is largely an African story But it is not Of the 706 million people who are destitute 362 million live in South Asia and 282 million in Sub-Saharan Africa In addition 26 million live in the Arab States another 26 million live in East Asia and over 8 million live in Latin America plus nearly 300000 in Europe and Central Asia India has over 295 million destitute people more than the total number if destitute people in all of Sub-Saharan Africa And Pakistan has 37 million destitute people according to its 201213 dataset more than either the Arab States or East Asia and the Pacific region
The story of destitution is not over But it should be These figures call for vigorous attention to be focused on destitution in South Asia and in Sub-Saharan Africa ndash and for even low poverty countries to track and empty the pockets of deep poverty in their midst
wwwophiorguk
Alkire and Robles
14 15
Fig 7 Comparing the headcount ratios of MPI poor destitute and $190day poor
$190day poorDestituteMPI poor
20 040 6080100
South SudanNigerEthiopiaChadBurkina FasoSomaliaSierra LeoneBurundiMaliCentral African RepublicGuineaDem Rep of CongoLiberiaUgandaMozambiqueTimor-LesteMadagascarGuinea -BissauBeninGambiaSenegalCote drsquoIvoireTanzaniaZambiaAfghanistanRwandaMalawiSudanNigeriaMauritaniaTogoHaitiCameroonYemenPakistanNamibiaIndiaBangladeshKenyaRep of CongoComorosZimbabweLao Peoplersquos Dem RepGhanaCambodiaLesothoVanuatuMyanmarDjiboutiNepalBhutanGuatemalaBoliviaSao Tome and PrincipeGabonNicaraguaSwazilandHondurasIndonesiaMoroccoTajikistanIraqPhilippinesPeruMongoliaSouth AfricaDominican RepublicViet NamEl SalvadorSurinameTrinidad and TobagoColombiaAzerbaijanBrazilMaldivesBelizeSyrian Arab RepublicChinaEgyptEcuadorGuyanaUzbekistanJamaicaJordanLibyaAlgeriaAlbaniaUkraineMexicoTunisiaPalestineSaint LuciaBarbadosThailandMoldovaMacedoniaBosnia and HerzegovinaKyrgyzstanTurkmenistanArmeniaMontenegro
KazakhstanSerbia
OPHI Briefing 47 | May 2017
Global Multidimensional Poverty Index 2017
14 15
REFERENCESAddis Ababa Accord (2015) lsquoAccord of the Third International Conference on Financing for Development Revised Draft 6 Mayrsquo
Alkire S and Foster J (2011) lsquoCounting and multidimensional poverty measurementrsquo Journal of Public Economics vol 95(7ndash8) pp 476ndash487
Alkire S Dorji L Gyeltshen S and Minten T (2016) Child Poverty in Bhutan Insights from Multidimensional Child Poverty Index and Qualitative Interviews with Poor Children National Statistics Bureau Bhutan
Alkire S and Robles G (2017) lsquoMultidimensional Poverty Index ndash summer 2017 brief methodological note and resultsrsquo OPHI MPI Methodological Notes 44 Oxford Poverty and Human Development Initiative University of Oxford
Alkire S and Santos ME (2014) lsquoMeasuring acute poverty in the developing world robustness and scope of the multidimensional poverty indexrsquo World Development vol 59 pp 251ndash274
Alkire S Jindra C Robles G and Vaz A (2017) lsquoChildrenrsquos multidimensional poverty disaggregating the global MPIrsquo OPHI Briefing 46 Oxford Poverty and Human Development Initiative University of Oxford
Organisation of Economic Cooperation and Development (OECD) (2017) lsquoCreditor reporting system (CRS) aid activity databasersquo Available here (Last accessed on 13 May 2017)
Pinilla-Roncancio M and Alkire S (2017) lsquoHow poor are people with disabilities around the globe A multidimensional perspectiversquo OPHI Research in Progress 48a Oxford Poverty and Human Development Initiative University of Oxford
United Nations (2015) Transforming Our World The 2030 Agenda for Sustainable Development ARES701
NOTES[1] All aggregates use 2013 population data[2] Section 51 paragraph 135[3] Addis Ababa Accord 2015 paragraph 119[4] Discussions are underway to consider whether data permit
adjustments to further align the global MPI with the SDGs[5] This section draws on lsquoChildrenrsquos multidimensional poverty
disaggregating the global MPIrsquo by Alkire et al (2017)[6] As with $190day poverty children are identified as poor
if they live in an MPI poor household Alternatively Child MPIs can be constructed that reflect each individual childrsquos deprivations by gender and age cohort (see Alkire et al 2016) but data are not available to build a global Child MPI with individual child data
[7] $190 is not available for Afghanistan Omitting Afghani stan 414 of people are MPI poor in South Asia
[8] We use income category definitions from July 2016 throughout this document
[9] The global MPI covers 92 of all people living in low or middle income countries It covers 99 of people living in low income countries (29 countries) 99 of the population in lower middle income countries (43) and 82 in upper middle income countries (29)
[10] There is no information on allocation to Macedonia and Palestine For those countries with MPI data from 2016 ODA flows allocated between 2011 and 2015 have been considered For South Sudan with 2010 MPI data ODA flows between 2011 and 2015 are used as this is the closest five-year period available
[11] The categories included are basic education basic health basic drinking water supply and basic sanitation (alone and together) electric power transmission and distribution low-cost housing multisector aid for basic social services developmental food aid and food security assistance
[12] Pinilla and Alkire 2017
[13] The indicators of electricity and flooring are unchanged
ONLINE RESOURCES
OPHIrsquos interactive databank enables you to study over 100 developing countries in terms of multidimensional poverty Choose interactive data visualizations to explore where and in which indicators people are poor or destitute and to show how MPI values compare with complementary data such as $190day poverty Or download a country briefing file for any country which contains explanations of its MPI and is illustrated with graphs maps and charts Excel data tables have all the details of MPI plus population standard errors sample sizes and much more Methodological notes provide any particularities of each countryrsquos survey data treatment
See wwwophiorgukmultidimensional-poverty-index
Oxford Poverty and Human Development Initiative (OPHI)
Oxford Department of International Development (ODID)Queen Elizabeth House (QEH)University of Oxford3 Mansfield Road Oxford OX1 3TBUnited Kingdom
ophi_oxford
ophioxford
ophi_oxford
Telephone+44 (0)1865 271915
Emailophiqehoxacuk
Websitewwwophiorguk
wwwophiorguk
Alkire and Robles
16 PB
MU
LTID
IMEN
SIO
NA
L PO
VERT
Y IN
DEX
ACR
OSS
TH
E W
ORL
D
0 ndash
005
01
ndash 0
2
02
ndash 0
3
03
ndash 0
4
04
ndash 0
5
05
+
005
ndash 0
1
OXFORD POVERTY amp HUMAN DEVELOPMENT INITIATIVE
OPHIT E N Y E A R
OPHIANNIVERSARY

OPHI Briefing 47 | May 2017
Global Multidimensional Poverty Index 2017
12 13
DESTITUTIONThe distressing condition of destitution
bull Half of the MPI poor people live in destitution
bull In six countries and 117 subnational regions 50 or more of people are destitute
bull Most of the highest levels of destitution are found in Sub-Saharan Africa
bull Pakistan has more destitute people ndash 37 million ndash than East Asia and the Pacific (26 million) or the Arab States (26 million)
bull India has more destitute people (295 million) than Sub-Saharan Africa (282 million)
bull But most of the destitute people ndash 362 of the 706 million ndash live in South Asia
The MPI reflects acute multidimensional poverty in developing countries It measures absolute levels of poverty ndash which are very low in a number of countries such as China and many areas of Latin America For many countries a lsquomoderatersquo measure of multidimensional poverty is needed
Even so since 2014 we have reported a measure of destitution that identifies a subset of the MPI poor who are the poorest of the poor Unfortunately nearly half of all MPI poor people are destitute ndash 706 million men women and children
As with the MPI destitute people are deprived in one-third or more weighted indicators but the destitution indicators are more extreme They include severe malnutrition losing two or more children having a child out of primary school having no household member who has completed more than one year of schooling using open defecation fetching water that is unsafe or 45 or more minutes away not owning even a mobile phone or radio and cooking with wood or dung or straw only[13] To leave no one behind we must take urgent action to end the distressing condition of destitution
Figure 7 on the next page shows the percentage of the population who are MPI poor which is the height of the beige bar and the percentage who are living in destitution which is the height of the red subcomponent At a glance we can see that destitution rates ranges from 0 to 714 of the population What else do we see
First there are pockets of destitution even in low MPI countries In countries like Turkmenistan Bosnia and Herzegovina Barbados Uzbekistan and Azerbaijan 30 or more of MPI poor people are destitute But in South Africa less than 9 of the MPI poor are destitute
Second there are positive stories In 57 countries less than 10 of the population are destitute Similarly 506 subnational regions have less than 10 of the population living in destitution
Third in general destitution rates tend to be lower than $190day extreme income poverty rates But destitution is markedly higher than income poverty in Pakistan Mauritania Sudan Gambia Chad Ethiopia Niger and South Sudan This underscores the importance of measuring and fighting poverty in all its forms and dimensions
In some countries and regions destitution is still lsquothe normrsquo because it affects half of more of the population Six countries have more than 50 of their population living in destitution ndash and together they are home to 100 million poor people Drilling down in 117 subnational regions 50-92 of the population are destitute (161 million) These high destitution regions are mainly located in Sub-Saharan Africa Yet there are pockets of destitution in other regions In East Asia and the Pacific eight regions within Timor LrsquoEste have over 50 of people living in destitution Within the Arab States 58 of people in Sudanrsquos Central Darfur and 50 of people in Yemenrsquos Hajjah regions are destitute Within South Asia Afghanistanrsquos Urozgan Nooristan and Kandahar provinces have 50ndash78 of people living in destitution In Latin America six regions of Haiti plus Potosi in Bolivia have 20ndash36 of people living in destitution
Looking at the high rates of destitution we might presume that destitution is largely an African story But it is not Of the 706 million people who are destitute 362 million live in South Asia and 282 million in Sub-Saharan Africa In addition 26 million live in the Arab States another 26 million live in East Asia and over 8 million live in Latin America plus nearly 300000 in Europe and Central Asia India has over 295 million destitute people more than the total number if destitute people in all of Sub-Saharan Africa And Pakistan has 37 million destitute people according to its 201213 dataset more than either the Arab States or East Asia and the Pacific region
The story of destitution is not over But it should be These figures call for vigorous attention to be focused on destitution in South Asia and in Sub-Saharan Africa ndash and for even low poverty countries to track and empty the pockets of deep poverty in their midst
wwwophiorguk
Alkire and Robles
14 15
Fig 7 Comparing the headcount ratios of MPI poor destitute and $190day poor
$190day poorDestituteMPI poor
20 040 6080100
South SudanNigerEthiopiaChadBurkina FasoSomaliaSierra LeoneBurundiMaliCentral African RepublicGuineaDem Rep of CongoLiberiaUgandaMozambiqueTimor-LesteMadagascarGuinea -BissauBeninGambiaSenegalCote drsquoIvoireTanzaniaZambiaAfghanistanRwandaMalawiSudanNigeriaMauritaniaTogoHaitiCameroonYemenPakistanNamibiaIndiaBangladeshKenyaRep of CongoComorosZimbabweLao Peoplersquos Dem RepGhanaCambodiaLesothoVanuatuMyanmarDjiboutiNepalBhutanGuatemalaBoliviaSao Tome and PrincipeGabonNicaraguaSwazilandHondurasIndonesiaMoroccoTajikistanIraqPhilippinesPeruMongoliaSouth AfricaDominican RepublicViet NamEl SalvadorSurinameTrinidad and TobagoColombiaAzerbaijanBrazilMaldivesBelizeSyrian Arab RepublicChinaEgyptEcuadorGuyanaUzbekistanJamaicaJordanLibyaAlgeriaAlbaniaUkraineMexicoTunisiaPalestineSaint LuciaBarbadosThailandMoldovaMacedoniaBosnia and HerzegovinaKyrgyzstanTurkmenistanArmeniaMontenegro
KazakhstanSerbia
OPHI Briefing 47 | May 2017
Global Multidimensional Poverty Index 2017
14 15
REFERENCESAddis Ababa Accord (2015) lsquoAccord of the Third International Conference on Financing for Development Revised Draft 6 Mayrsquo
Alkire S and Foster J (2011) lsquoCounting and multidimensional poverty measurementrsquo Journal of Public Economics vol 95(7ndash8) pp 476ndash487
Alkire S Dorji L Gyeltshen S and Minten T (2016) Child Poverty in Bhutan Insights from Multidimensional Child Poverty Index and Qualitative Interviews with Poor Children National Statistics Bureau Bhutan
Alkire S and Robles G (2017) lsquoMultidimensional Poverty Index ndash summer 2017 brief methodological note and resultsrsquo OPHI MPI Methodological Notes 44 Oxford Poverty and Human Development Initiative University of Oxford
Alkire S and Santos ME (2014) lsquoMeasuring acute poverty in the developing world robustness and scope of the multidimensional poverty indexrsquo World Development vol 59 pp 251ndash274
Alkire S Jindra C Robles G and Vaz A (2017) lsquoChildrenrsquos multidimensional poverty disaggregating the global MPIrsquo OPHI Briefing 46 Oxford Poverty and Human Development Initiative University of Oxford
Organisation of Economic Cooperation and Development (OECD) (2017) lsquoCreditor reporting system (CRS) aid activity databasersquo Available here (Last accessed on 13 May 2017)
Pinilla-Roncancio M and Alkire S (2017) lsquoHow poor are people with disabilities around the globe A multidimensional perspectiversquo OPHI Research in Progress 48a Oxford Poverty and Human Development Initiative University of Oxford
United Nations (2015) Transforming Our World The 2030 Agenda for Sustainable Development ARES701
NOTES[1] All aggregates use 2013 population data[2] Section 51 paragraph 135[3] Addis Ababa Accord 2015 paragraph 119[4] Discussions are underway to consider whether data permit
adjustments to further align the global MPI with the SDGs[5] This section draws on lsquoChildrenrsquos multidimensional poverty
disaggregating the global MPIrsquo by Alkire et al (2017)[6] As with $190day poverty children are identified as poor
if they live in an MPI poor household Alternatively Child MPIs can be constructed that reflect each individual childrsquos deprivations by gender and age cohort (see Alkire et al 2016) but data are not available to build a global Child MPI with individual child data
[7] $190 is not available for Afghanistan Omitting Afghani stan 414 of people are MPI poor in South Asia
[8] We use income category definitions from July 2016 throughout this document
[9] The global MPI covers 92 of all people living in low or middle income countries It covers 99 of people living in low income countries (29 countries) 99 of the population in lower middle income countries (43) and 82 in upper middle income countries (29)
[10] There is no information on allocation to Macedonia and Palestine For those countries with MPI data from 2016 ODA flows allocated between 2011 and 2015 have been considered For South Sudan with 2010 MPI data ODA flows between 2011 and 2015 are used as this is the closest five-year period available
[11] The categories included are basic education basic health basic drinking water supply and basic sanitation (alone and together) electric power transmission and distribution low-cost housing multisector aid for basic social services developmental food aid and food security assistance
[12] Pinilla and Alkire 2017
[13] The indicators of electricity and flooring are unchanged
ONLINE RESOURCES
OPHIrsquos interactive databank enables you to study over 100 developing countries in terms of multidimensional poverty Choose interactive data visualizations to explore where and in which indicators people are poor or destitute and to show how MPI values compare with complementary data such as $190day poverty Or download a country briefing file for any country which contains explanations of its MPI and is illustrated with graphs maps and charts Excel data tables have all the details of MPI plus population standard errors sample sizes and much more Methodological notes provide any particularities of each countryrsquos survey data treatment
See wwwophiorgukmultidimensional-poverty-index
Oxford Poverty and Human Development Initiative (OPHI)
Oxford Department of International Development (ODID)Queen Elizabeth House (QEH)University of Oxford3 Mansfield Road Oxford OX1 3TBUnited Kingdom
ophi_oxford
ophioxford
ophi_oxford
Telephone+44 (0)1865 271915
Emailophiqehoxacuk
Websitewwwophiorguk
wwwophiorguk
Alkire and Robles
16 PB
MU
LTID
IMEN
SIO
NA
L PO
VERT
Y IN
DEX
ACR
OSS
TH
E W
ORL
D
0 ndash
005
01
ndash 0
2
02
ndash 0
3
03
ndash 0
4
04
ndash 0
5
05
+
005
ndash 0
1
OXFORD POVERTY amp HUMAN DEVELOPMENT INITIATIVE
OPHIT E N Y E A R
OPHIANNIVERSARY

wwwophiorguk
Alkire and Robles
14 15
Fig 7 Comparing the headcount ratios of MPI poor destitute and $190day poor
$190day poorDestituteMPI poor
20 040 6080100
South SudanNigerEthiopiaChadBurkina FasoSomaliaSierra LeoneBurundiMaliCentral African RepublicGuineaDem Rep of CongoLiberiaUgandaMozambiqueTimor-LesteMadagascarGuinea -BissauBeninGambiaSenegalCote drsquoIvoireTanzaniaZambiaAfghanistanRwandaMalawiSudanNigeriaMauritaniaTogoHaitiCameroonYemenPakistanNamibiaIndiaBangladeshKenyaRep of CongoComorosZimbabweLao Peoplersquos Dem RepGhanaCambodiaLesothoVanuatuMyanmarDjiboutiNepalBhutanGuatemalaBoliviaSao Tome and PrincipeGabonNicaraguaSwazilandHondurasIndonesiaMoroccoTajikistanIraqPhilippinesPeruMongoliaSouth AfricaDominican RepublicViet NamEl SalvadorSurinameTrinidad and TobagoColombiaAzerbaijanBrazilMaldivesBelizeSyrian Arab RepublicChinaEgyptEcuadorGuyanaUzbekistanJamaicaJordanLibyaAlgeriaAlbaniaUkraineMexicoTunisiaPalestineSaint LuciaBarbadosThailandMoldovaMacedoniaBosnia and HerzegovinaKyrgyzstanTurkmenistanArmeniaMontenegro
KazakhstanSerbia
OPHI Briefing 47 | May 2017
Global Multidimensional Poverty Index 2017
14 15
REFERENCESAddis Ababa Accord (2015) lsquoAccord of the Third International Conference on Financing for Development Revised Draft 6 Mayrsquo
Alkire S and Foster J (2011) lsquoCounting and multidimensional poverty measurementrsquo Journal of Public Economics vol 95(7ndash8) pp 476ndash487
Alkire S Dorji L Gyeltshen S and Minten T (2016) Child Poverty in Bhutan Insights from Multidimensional Child Poverty Index and Qualitative Interviews with Poor Children National Statistics Bureau Bhutan
Alkire S and Robles G (2017) lsquoMultidimensional Poverty Index ndash summer 2017 brief methodological note and resultsrsquo OPHI MPI Methodological Notes 44 Oxford Poverty and Human Development Initiative University of Oxford
Alkire S and Santos ME (2014) lsquoMeasuring acute poverty in the developing world robustness and scope of the multidimensional poverty indexrsquo World Development vol 59 pp 251ndash274
Alkire S Jindra C Robles G and Vaz A (2017) lsquoChildrenrsquos multidimensional poverty disaggregating the global MPIrsquo OPHI Briefing 46 Oxford Poverty and Human Development Initiative University of Oxford
Organisation of Economic Cooperation and Development (OECD) (2017) lsquoCreditor reporting system (CRS) aid activity databasersquo Available here (Last accessed on 13 May 2017)
Pinilla-Roncancio M and Alkire S (2017) lsquoHow poor are people with disabilities around the globe A multidimensional perspectiversquo OPHI Research in Progress 48a Oxford Poverty and Human Development Initiative University of Oxford
United Nations (2015) Transforming Our World The 2030 Agenda for Sustainable Development ARES701
NOTES[1] All aggregates use 2013 population data[2] Section 51 paragraph 135[3] Addis Ababa Accord 2015 paragraph 119[4] Discussions are underway to consider whether data permit
adjustments to further align the global MPI with the SDGs[5] This section draws on lsquoChildrenrsquos multidimensional poverty
disaggregating the global MPIrsquo by Alkire et al (2017)[6] As with $190day poverty children are identified as poor
if they live in an MPI poor household Alternatively Child MPIs can be constructed that reflect each individual childrsquos deprivations by gender and age cohort (see Alkire et al 2016) but data are not available to build a global Child MPI with individual child data
[7] $190 is not available for Afghanistan Omitting Afghani stan 414 of people are MPI poor in South Asia
[8] We use income category definitions from July 2016 throughout this document
[9] The global MPI covers 92 of all people living in low or middle income countries It covers 99 of people living in low income countries (29 countries) 99 of the population in lower middle income countries (43) and 82 in upper middle income countries (29)
[10] There is no information on allocation to Macedonia and Palestine For those countries with MPI data from 2016 ODA flows allocated between 2011 and 2015 have been considered For South Sudan with 2010 MPI data ODA flows between 2011 and 2015 are used as this is the closest five-year period available
[11] The categories included are basic education basic health basic drinking water supply and basic sanitation (alone and together) electric power transmission and distribution low-cost housing multisector aid for basic social services developmental food aid and food security assistance
[12] Pinilla and Alkire 2017
[13] The indicators of electricity and flooring are unchanged
ONLINE RESOURCES
OPHIrsquos interactive databank enables you to study over 100 developing countries in terms of multidimensional poverty Choose interactive data visualizations to explore where and in which indicators people are poor or destitute and to show how MPI values compare with complementary data such as $190day poverty Or download a country briefing file for any country which contains explanations of its MPI and is illustrated with graphs maps and charts Excel data tables have all the details of MPI plus population standard errors sample sizes and much more Methodological notes provide any particularities of each countryrsquos survey data treatment
See wwwophiorgukmultidimensional-poverty-index
Oxford Poverty and Human Development Initiative (OPHI)
Oxford Department of International Development (ODID)Queen Elizabeth House (QEH)University of Oxford3 Mansfield Road Oxford OX1 3TBUnited Kingdom
ophi_oxford
ophioxford
ophi_oxford
Telephone+44 (0)1865 271915
Emailophiqehoxacuk
Websitewwwophiorguk
wwwophiorguk
Alkire and Robles
16 PB
MU
LTID
IMEN
SIO
NA
L PO
VERT
Y IN
DEX
ACR
OSS
TH
E W
ORL
D
0 ndash
005
01
ndash 0
2
02
ndash 0
3
03
ndash 0
4
04
ndash 0
5
05
+
005
ndash 0
1
OXFORD POVERTY amp HUMAN DEVELOPMENT INITIATIVE
OPHIT E N Y E A R
OPHIANNIVERSARY
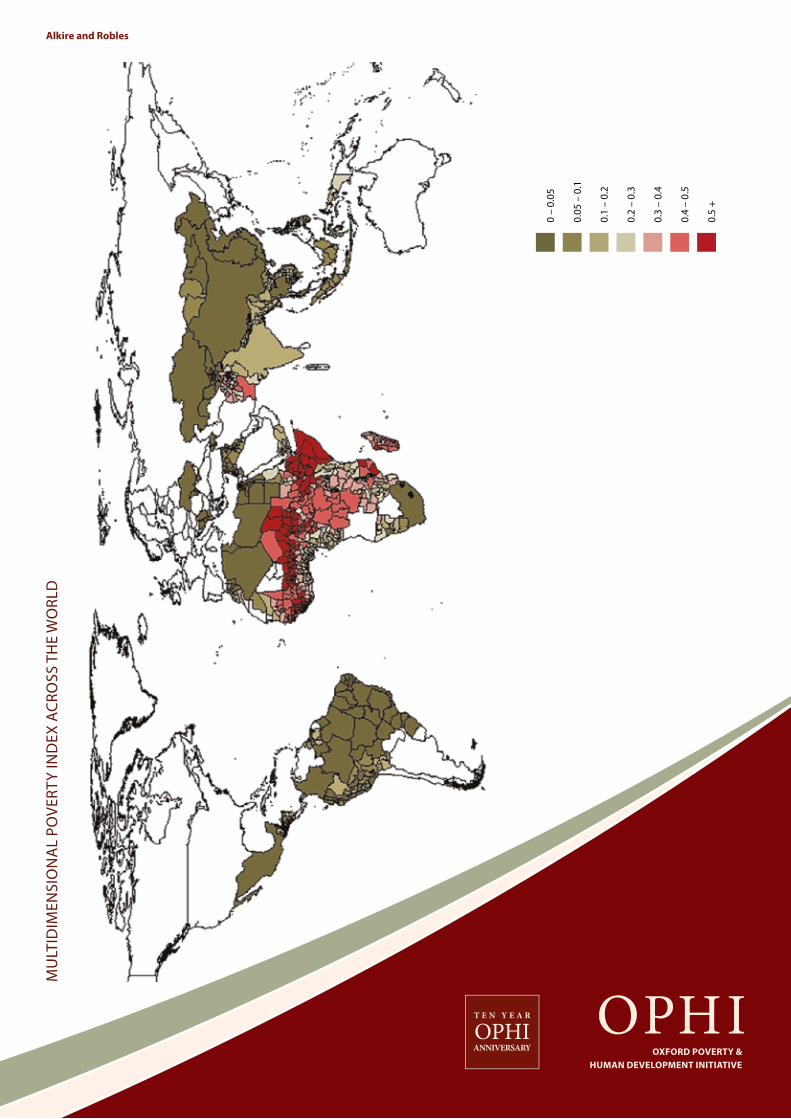
wwwophiorguk
Alkire and Robles
16 PB
MU
LTID
IMEN
SIO
NA
L PO
VERT
Y IN
DEX
ACR
OSS
TH
E W
ORL
D
0 ndash
005
01
ndash 0
2
02
ndash 0
3
03
ndash 0
4
04
ndash 0
5
05
+
005
ndash 0
1
OXFORD POVERTY amp HUMAN DEVELOPMENT INITIATIVE
OPHIT E N Y E A R
OPHIANNIVERSARY