ophi how to build a national multidimensional poverty
TRANSCRIPT

How to Build a National Multidimensional Poverty Index (MPI):Using the MPI to inform the SDGs
OPHIOxford Poverty & Human
Development Initiative
United Nations Development Programme (UNDP) and Oxford Poverty and Human Development Initiative (OPHI), University of Oxford

Copyright © UNDP 2019by the United Nations Development Programme1 UN Plaza, New York 10017 USA
Creative Commons Attribution-NonCommercial 4.0 International (CC BY-NC 4.0) at https://creativecommons.org/licenses/by-nc/4.0/
How to Build a National Multidimensional Poverty Index (MPI):Using the MPI to inform the SDGs
United Nations Development Programme (UNDP) and Oxford Poverty and Human Development Initiative (OPHI), University of Oxford
Sponsored by:
OPHIOxford Poverty & Human
Development Initiative

Foreword
A transformational development agenda, premised on the ambition to eliminate all poverty and rooted in a sustainability framework of complexity, interdependence and multidimensional development, requires a systematic measurement for poverty that is as nuanced and lucid as the 2030 Agenda itself.
UN Member States adopted the 2030 Agenda for Sustainable Development and its 17 Sustainable Development Goals (SDGs) at the General Assembly in September 2015. The Agenda’s Goals and Targets are universal – for all nations and all people – and endeavor to reach the furthest behind first, an idea reinforced by the Agenda’s simple yet powerful commitment to ensure that no one is left behind. Through this shared framework, countries have acknowledged that the eradication of poverty in all its forms and dimensions is the world’s greatest global challenge. They have committed to ending poverty everywhere by 2030, an aspiration captured explicitly in the targets and indicators of SDG1, to end poverty in all its forms everywhere, and echoed across each of the other Goals.
The 2030 Agenda also recognizes the complexity and integrated nature of both the challenges we face and the solutions we must find. Reducing inequalities requires understanding and responding across the social, environmental and economic dimensions of development. All the SDGs are inter-connected within and across these dimensions, and the 2030 Agenda explicitly embraces the concept of multidimensional poverty in SDG Target 17.19. The Agenda invites countries to broaden traditional poverty metrics beyond income, and calls for nationally developed measures of multidimensional poverty in Target 1.2.
This handbook introduces the process for building national multidimensional indices. It has been prepared by the Oxford Poverty and Human Development Initiative (OPHI) and the UN Development Programme (UNDP). A global Multidimensional Poverty Index (MPI) was first developed by OPHI and UNDP for inclusion in UNDP’s flagship Human Development Report in 2010, where it has been since published. The global MPI complements the larger family of measures introduced under the intellectual leadership of Amartya Sen and Mahbub ul Haq, starting with the
Human Development Index in 1990.
As noted by Nobel Laureate Sen: “Poverty is the deprivation of opportunity… [it] is not just a lack of money; it is not having the capability to realize one’s full potential….”
UNDP is pleased to build on this strong collaboration with OPHI supporting nationally developed MPIs. While income-based poverty represents a key factor influencing well-being and societal progress, there is a broader set of deprivations—relating to health, education and basic standards of living—that affects the lives and livelihoods of individuals and families, and their ability to break out of inter-generational cycles of poverty.
Measures of multidimensional poverty, including nationally adapted MPIs, are vital tools for decision-makers, enabling better information, targeting, and tracking of progress across national and sectoral policies. In this way, MPI-informed policies can better integrate the needs and knowledge of women and men facing a range of vulnerabilities and marginalization. They can help identify who is living in poverty by revealing pockets of overlapping disparities within and across groups in different parts of a country and how these deprivations change over time.
This guide responds to the growing demand for a definitive and intuitive measure of poverty levels, by incidence, intensity and composition. National MPIs draw on the rich experience of countries already championing innovative ways to apply MPI results to policy through the Multidimensional Poverty Peer Network and similar global fora. By strengthening the capacities of policymakers, technical experts, statisticians and their institutions, the guide contributes to broader efforts supported by UNDP, OPHI and partners to accelerate progress on the SDGs.
Developing national MPIs represents a critical step forward in further translating this vision into reality. We hope that you find this guide useful and that it helps generate new knowledge and expertise needed to eradicate poverty, reduce inequalities, and Leave No One Behind.
Abdoulaye Mar Dieye,Assistant Administrator and Director,Bureau for Policy and Programme Support,United Nations Development Programme (UNDP)

Acknowledgements
This handbook has been prepared by Sabina Alkire, Adriana Conconi, Mónica Pinilla-Roncancio and Ana Vaz from the Oxford Poverty and Human Development Initiative (OPHI) at the University of Oxford, in collaboration with the United Nations Development Programme (UNDP). This document is the result of wide-ranging discussions and specific experiences in supporting the development of national multidimensional poverty indices (MPIs).
The authors would like to thank all the institutions and individuals who supported this work and provided insightful feedback on previous versions of the handbook. In particular, we thank Serge Kapto, Babatunde Omilola, Sarah Renner and Tim Scott at UNDP for their support and guidance in every step in the elaboration of this handbook and timely advice on content, and the participant countries of the Multidimensional Poverty Peer Network (MPPN) for their insights and for allowing us to share their experiences.
Special thanks go to John Hammock, Gonzalo Hernandez Licona, Pali Lehohla and Maria Emma Santos for their
insightful advice on several sections of the handbook. Additional thanks go to Fedora Carbajal, Juliana Milovich, Carolina Moreno and Diego Zavaleta, who provided support in the elaboration of boxes and the systematization of national experiences, and to Roberto Angulo, who participated in meaningful discussions on the institutionalization of multidimensional poverty measures. Matthew Brack, Paddy Coulter, Cristina Hernandez, Usha Kanagaratnam, Maarit Kivilo, Rebeca Kritsch, Bilal Malaeb, Ricardo Nogales, Christian Oldiges, Natalie Quinn, Felipe Roa-Clavijo, Nicolai Suppa and Frank Vollmer also provided substantial comments and participated in discussions on content throughout the process. We are grateful to Ann Barham for copyediting with an eagle eye.
Finally, Corinne Mitchell deserves a special mention and our heartfelt gratitude for her outstanding support during this process, including participating in discussions on the structure of the handbook, the content of various sections, and editing and proofreading the entire draft.

Content TableForeword iAcknowledgements ii
INTRODUCTION 9Who should use this handbook? 9How to use this handbook 10Purpose of this handbook 10Why multidimensional poverty? 11How can a national MPI be used? 12The value of a national MPI 13
SECTION I. ESTABLISHING THE PROCESS AND GENERATING SUPPORT FOR THE NATIONAL MPI 19
CHAPTER 1. HOW A NATIONAL MPI WILL BE USED: COMMON POLICY PURPOSES 20Introduction 20Common purposes of national MPIs: an overview 20Conclusions 26
CHAPTER 2. ENGAGING RELEVANT STAKEHOLDERS 27Introduction 27Support from other relevant stakeholders 29Congress 31Generating credibility among stakeholders 36An institutional arrangement for the national MPI 36Conclusions 38
CHAPTER 3. COMMUNICATING THE NATIONAL MPI 39Introduction 39Communications strategy 40Conclusions 43
SECTION II. TECHNICAL PROCESS 45
CHAPTER 4. THE ALKIRE-FOSTER METHOD 47Introduction 47The AF class of poverty measures 48Relevant properties of the AF measures 49Example of the AF method 49Conclusions 55

CHAPTER 5. DESIGNING THE NATIONAL MPI 56Introduction 56Purpose of the national MPI 56Space of the measure 56Units of identification and analysis 57Dimensions and indicators 58How to select dimensions and indicators? 58Types of indicators 64Indicator design 64Income as an indicator in a national MPI 70Deprivation cut-offs 73Analysis of potential indicators 76Selection of the weights 78Setting the poverty cut-off 79Conclusions 80
CHAPTER 6. SOURCE OF INFORMATION: SURVEYS, CENSUSES AND OTHER DATA 81Introduction 81Using an existing source of data 82Census 83Administrative data 83Household surveys 84Criteria for selecting a source of data 86Modifying existing data sources 87Designing a new survey 89Using different data sources 91Conclusions 92
CHAPTER 7. BUILDING AND ANALYZING CANDIDATE MEASURES 93Introduction 93Creating the universe of indicators 93Building candidate measures 94Analyzing candidate measures 96Robustness analysis 96Robustness analysis for changes in the poverty cut-off 96Robustness analysis for changes in weights or other parameters 98Statistical inference 100Analyzing the final measure 103

8
Subgroup decomposition 103Dimensional breakdown 108Comparisons with other poverty measures 113Conclusions 114
CHAPTER 8. CHANGES OVER TIME 115Introduction 115Strict comparability 115Absolute and relative changes 116Changes in indicators 118Changes across groups 119Using longitudinal data 123Conclusions 124
CHAPTER 9. PRESENTING THE NATIONAL MPI 125Introduction 125Before the launch 125Launch of the national MPI 126Final report 127Communications tools for the launch 129Conclusions 130
SECTION III. GOING BEYOND THE MEASURE 133
CHAPTER 10. THE NATIONAL MPI AS A POLICY TOOL 134The MPI as a guide to policy implementation 134Monitoring progress in multidimensional poverty 134Evaluation 137Coordination of policies to eradicate poverty 137Budget allocations and planning 138Guiding policy interventions 140Targeting 141Conclusions 142
ANNEX 1. THE ALKIRE-FOSTER METHOD 143ANNEX 2. THE GLOBAL MPI 148ANNEX 3. POST-2015 LIGHT POWERFUL (LP) SURVEY 151
REFERENCES 155

9 How to Build a National Multidimensional Poverty Index (MPI)
Introduction This handbook provides detailed practical guidance for planners, policymakers and statisticians on how to build a technically rigorous permanent national multidimensional poverty index (MPI). In addition, the handbook provides hard evidence on how countries have designed and computed their national MPIs to guide policy and to accelerate progress towards the Sustainable Development Goals (SDGs) of the 2030 Agenda. This introduction presents the main issues covered in the handbook, explaining why a multidimensional approach to eliminating poverty is important and the motivations countries have for computing a national MPI.
Who should use this handbook?
This handbook is primarily intended for people who are actively engaged in developing national and subnational MPIs, including both technicians and politicians. It is written for statisticians in national statistics offices and other technical offices of government, as well as for policymakers in ministries and agencies, such as ministries of social development, planning and finance. It can also be used by other interested stakeholders working in think tanks, civil society organizations, and so on. These are the developers, implementers and true innovators of national MPIs.
The MPI is a comprehensive measurement tool that can provide a holistic understanding of the lives of the poor while enabling more effective and efficient poverty reduction policymaking. Countries from every continent except Antarctica and Oceania have adopted official national MPIs. These countries continue to find new uses for their measures, using them for monitoring poverty trends, evaluating poverty reduction policies, national planning, SDG prioritization, intra-government coordination across ministries, budget allocation and policy formulation.
Because national MPIs are developed and calculated locally by each country, they can be tailored to that particular country and its needs. National governments have complete ownership over these measures, which are embedded into governance systems, ensuring sustainability over time.
The development of a national MPI is both a technical and a political process. Technical teams are needed to design statistics that are rigorous, replicable and robust. Political buy-in at the highest levels of government, often including heads of state, is required to ensure that the measures are implemented both effectively and with an eye towards concrete action. With technical and political support, an MPI can be used to directly address the overlapping deprivations experienced by the poor, resulting in an emphasis on the poorest populations and an acceleration of policies that facilitate their movement out of poverty.
This handbook aims to enable public servants to improve their poverty data and analysis, as well as their programs and solutions to end poverty. Ultimately, the purpose of this handbook is to provide a resource that helps people move out of poverty and builds their capabilities to live fuller and more liberated lives.
“Developing a national MPI is both a technical and political process.”

10
The main purpose of this handbook is to be used as a guide to design national MPIs, or other multidimensional poverty measures. This handbook:
• Illustrates the process of creating a multidimensional poverty measure,• Describes technical and political processes to create sustainable and rigorous measures that are proactively and effectively used in policy to end poverty and,• Provides examples based on countries’ experiences.
This handbook is meant to accompany the design and technical estimation of a national MPI as an official permanent statistic on poverty. At the same time, it is intended to guide the discussions with stakeholders that will inform the MPI’s design and plans for using the MPI for policy. Some readers, therefore, will be coming to it as a technical resource; others as a guide for process and policy. Not every reader will read or use each chapter. So why did we put it all together in one handbook?
Pali Lehohla, former Statistician General of South Africa, described traditional statistics as a process where “statisticians lobbed new numbers over the fence, and hoped that policymakers would catch and use them”. But with the advent of the SDGs, there is a need for statisticians and policy actors to make eye contact, to converse and to understand each other.
This handbook is divided into three self-contained sections and ten chapters. Section I discusses some common goals for the development of national MPIs (chapter 1); the process of engagement with different actors and how institutional arrangements facilitate the process of designing, computing and using national MPIs (chapter 2) and the relevance of a solid communications strategy to guarantee the sustainability of the measure over time (chapter 3).
Ideally, all readers would skim all chapters in Section I, and those planning the national MPI design phase would read the section on process most intently; communications staff might read in depth the communications chapter; the statisticians might pay closer attention to chapter 2.
Section II explores the technical steps in developing a national MPI. It starts by presenting the Alkire-Foster method (chapter 4) then moves to discussing the process of building the measure, from the definition of the unit of analysis to the selection of the poverty cut-off (chapter 5). Chapter 5 also presents real examples of how countries have made these decisions and provides technical and normative arguments to validate each of them. Chapter 6 discusses the different sources of information that can be used when developing a national MPI. In turn, chapter 7 explores how to analyze candidate measures, how to select the final version of the national MPI and what additional analysis should be conducted. Chapter 8 discusses how to analyze changes over time and track progress in the MPI. Finally, chapter 9 provides a summary of how the national MPI could be presented to the public. Chapters 5 to 8 are primarily for the statistical team who is computing the measure, and these chapters offer, in simple language, the key insights and technical steps involved in MPI construction. Often the statistical team will also be trained extensively in
Purpose of this handbook
How to use this handbook
Introduction
11 How to Build a National Multidimensional Poverty Index (MPI)
the issues covered in these chapters. In turn, chapter 9 is for all concerned parties, as it covers the documentation of the first national MPI and the formal launch event. Clearly, the statistics office may take an active role in drafting the final report, and the communications team will create the website, but the launch may also involve ministers and the head of state, so the event coordinators may wish to consult this chapter.
The third and final section of this handbook presents examples of how countries have used their national MPIs as a policy tool to reduce multidimensional poverty (chapter 10).
In an age of transparency, the subject matter here may be of interest to other groups, which is why we wished to make all material accessible in the same handbook. In any government, some policy advisors and even ministers may have a technical background or an interest in measurement, so they also may wish to read these chapters. Similarly, some statisticians may take an interest in the policy and communications tasks or wish to understand their audiences when preparing their presentations. Students, academics, policy advisors and journalists also may wish to have a more complete overview of the process of creating a national MPI that genuinely energizes responses to poverty, thus driving reductions in the deprivations that afflict so many. It is with the hope of sparking such genuinely useful measures and actions that this interdisciplinary handbook has been written.
Many countries now measure multidimensional poverty alongside monetary poverty. This means that a country will estimate and release two complementary official national measures of poverty. The monetary poverty measure assesses income or consumption and expenditure poverty, according to national poverty lines. The multidimensional poverty measure reflects relevant non-monetary aspects of poverty—food insecurity, unemployment, dilapidated housing, lack of healthcare, meager educational levels and so on. These non-monetary aspects reflect national development plans, participatory exercises, the SDGs and policy priorities. Both measures are used to monitor progress over time nationally and by subgroup, according to national definitions. The measures, together, advance a common fundamental motivation: to end poverty in all its forms, leaving no one behind.
The development of multidimensional poverty measures focuses on actively reducing poverty and improving the lives of those currently living in poverty. In this sense, the most important stakeholders in this handbook are those living in multidimensional poverty around the world. It is our hope that by creating national MPIs, countries will have a more effective tool for designing policies to eradicate poverty.
Why multidimensional poverty?
“By creating a national MPI, countries can equip themselves with a policy tool more effective and conducive to the goal of leaving no one behind.”

12
How can a national MPI be used? A national MPI is a headline statistic of multidimensional poverty that is used:
• To announce the official level of multidimensional poverty in a country,
• To compare poverty across subnational regions and groups,• To track poverty over time and say whether it decreased, • To show “how” people are poor, using direct information from the
set of MPI indicators.
Many countries use a national MPI to declare definitively whether poverty has gone up, come down or remained the same. National MPIs are always reported along with several intuitive statistics that show the level and composition of poverty by indicator. These are:
• Incidence, H. The familiar headcount ratio or incidence of poverty, also called “poverty rate”, which shows the percentage of people who are multidimensionally poor.
• Intensity, A. A new indicator of the intensity of poverty that is the average deprivation score among the poor. The intensity shows the percentage of weighted deprivations the average poor person suffers.
• Composition by indicator. The MPI is constructed directly from each poor person’s profile of deprivations across each indicator, profiles built from household surveys that have all the indicators for every person. So, the national MPI (level or change) is always reported together with its composition by indicator. This can be done in one
Introduction
The MPPN is a growing global community of more than 55 countries and 15 organizations that focuses on multidimensional poverty. The network promotes South-South dialogue and capacity building, and distills emerging experiences and lessons learned about measuring multidimensional poverty into magazine articles, policy briefings and a repository of detailed resources.
The MPPN was established in 2013 to provide support to policymakers who are implementing a MPI or are exploring the possibility of developing multidimensional measures of poverty.
The MPPN aims to help eradicate poverty through the use of MPIs that consider the different types of deprivations experienced simultaneously by people living in poverty. Using the MPI evidence base, the MPPN works to promote public policies that have better technical design, greater focus and more effectiveness in reducing poverty in all its dimensions.
The MPPN enables early adopters to share their experiences with newcomers to multidimensional poverty measurement. It provides peer-to-peer technical, statistical and policy support, as well as input into the design and institutional arrangements for successful multidimensional poverty eradication. Through meetings, knowledge sharing and informal exchange, the MPPN supports policymakers in developing more effective poverty eradication policies that are grounded in multidimensional measures of poverty. Its vision is a world in which poverty in all its forms is measured, tracked over time and eventually eliminated.
Box A - The Multidimensional Poverty Peer Network (MPPN)
Source: https://www.mppn.org/about-us/mppn-en/
13 How to Build a National Multidimensional Poverty Index (MPI)
The value of a national MPI
of two ways: (1) analyzing the percentage of people who are poor and deprived in each indicator one by one, and (2) analyzing the weighted contributions of each indicator to the national MPI.
Why do policymakers support the development of a national MPI? There are a number of reasons, depending on the context:
• Enhanced high-level view of national poverty. The international community, including government officials, international agencies, academia and society, understand poverty today as a complex, multidimensional phenomenon. The MPI provides a high-level view of the level of multidimensional poverty and its reduction. This presents an overall picture of poverty in the country, while also enabling closer and more in-depth analyses of areas of interest (such as regions, sectors and demographic groups).
• Complements monetary poverty measures. Monetary poverty measures are important but incomplete. Evidence has shown that people who are experiencing multiple deprivations in crucial areas of their lives, such as education, health, safety or employment, may not be income poor (Bourguignon et al. 2008), and policies to reduce income poverty may not affect other deprivations. The MPI complements existing monetary poverty statistics, and the additional dimensions of the MPI have proven to help identify and achieve targeted policy interventions. Indeed, the ability to provide a better depiction of poverty and inform more precise policy actions has been an incentive in every country that has developed a national MPI so far. Furthermore, public actions in areas like education, infrastructure and housing, which might only impact income in the next generation, are not well captured by traditional monetary metrics. In contrast, an MPI that includes such indicators can show rapid improvements in these areas, making visible the impact of social policies more directly, even within the duration of a national election cycle.
• Information to shape policy. A national MPI can guide coordinated actions by several ministries, provide clear goals and targets for each indicator, and act as a monitoring and accountability tool within the government. One reason for this is that it allows robust disaggregation by groups (such as between urban and rural areas, subnational regions, gender, age groups, indigenous groups and disability status). Also, one can unpack the numbers to see the composition of poverty by dimensions and indicators—nationally and for different population groups—which allows more efficient policy design, policy coordination and assignment of resources.
• Adds value to dashboards. The MPI is based on each person or household’s profile of the overlapping or “joint” deprivations they experience. This provides new information that is not available in many other measures. For example, 20 percent of the population may not have access to adequate sanitation and 20 percent may have insufficient education, but these two indicators separately do not tell us if the 20 percent without adequate sanitation are the same people as those without an adequate education, or if they are different. The MPI does. This new information is extremely relevant for identifying the poorest of
“Policies aimed at income poverty may not affect other critical deprivations that leave people behind.”
Addressing national priorities

14
the poor, who experience the most deprivations at the same time. It is also useful for guiding multisectoral and integrated policies, because the complexity of simultaneous deprivations can be seen.
• Provides incentives for leaving no one behind and reaching the furthest behind first. By reflecting the intensity of poverty (detailing the multiple deprivations that a family has at the same time), the MPI has an advantage over headcount poverty measures, as efforts to reduce the proportion of simultaneous hardships faced by the poor will reduce the MPI even if they have not yet moved out of poverty. For example, if a poor person goes from being deprived in 90 percent of the indicators to being deprived in 50 percent of them, then the MPI goes down, even if they are still identified as poor. Of course, if they come out of poverty, the MPI also goes down. This creates good incentives for tackling the poorest of the poor, because if any deprivation of any poor person is removed, the MPI falls.
• Adaptable to national context and transparent. The MPI technology is flexible, as the dimensions, indicators and weights can be adapted to the national context. These are attributes that can be defined by policymakers to accurately characterize poverty in diverse contexts. The MPI is also transparent and easy to implement. There are no “black boxes”. Instead, the public can understand the MPI calculation. This provides legitimacy for official estimates. In addition, the MPI is intuitive and easy to communicate to the press, private sector and civil society. While there might be some initial resistance or anxiety about a new poverty measure in the country, the experience of other countries that have implemented such measures can help plan how to address any potential concerns.
• Robustness and rigor. Finally, it is crucial that an official poverty measure be robust—meaning that its policy conclusions are not overly sensitive to small changes in its own components, like indicators, cut-offs or weights. This is because in pluralist societies people often agree about a broad range of priorities but disagree about details. A measure that is robust to a number of specifications has more legitimacy among a wider group of citizens and stakeholders. Furthermore, the MPI can be rigorously applied (e.g., using standard errors and tests of statistical inference). This means that policymakers can ensure that their statements (like “poverty has reduced”) refer to statistically significant changes. This handbook and related materials explain how to implement an MPI in robust and rigorous ways.
The MPI uses the Alkire-Foster (AF) method of multidimensional measurement developed by Sabina Alkire and James Foster at the University of Oxford, which ordinarily takes the individual or household as the starting point and counts the different types of deprivations experienced, capturing both the percentage of people who are poor (headcount ratio or incidence of poverty) and the percentage of deprivations that poor people face (intensity of poverty) (Alkire & Foster, 2011a). It is a flexible approach that can be tailored to different contexts and disaggregated according to different subgroups.
The AF method has been used to measure multidimensional poverty in
A globally applied established method
Introduction
“The MPI can be applied to help identify the poorest of the poor, who experience the most deprivations at the same time.”

15 How to Build a National Multidimensional Poverty Index (MPI)
different settings. For instance, it is the method behind the global MPI (Alkire & Santos, 2010). This is a measure of acute multidimensional poverty that provides internationally comparable information for over 100 developing countries. It was developed by OPHI in collaboration with UNDP’s Human Development Report Office and first published by UNDP in the 20th anniversary of the Human Development Report (United Nations Development Programme, 2010 ) It has been updated annually or biannually since then. The global MPI, like the World Bank’s US$1.90 measure of monetary poverty, allows comparisons between countries and regions, and is able to track progress in poverty reduction over time. It can also track progress in Target 1.2. of SDG 1. Going beyond the $1.90/day measure, the global MPI is disaggregated for over 1,000 subnational units, making it a tool for identifying the poorest of the poor and leaving no one behind.
Many countries have developed national adaptations based on the global MPI, and there are also regional MPIs (e.g., in Latin America, in the Arab region and in Eastern Europe and Central Asia).
Countries’ national MPIs are released as official permanent poverty statistics. National MPIs are tailored to their national priorities, so countries choose their own set of dimensions, indicators, weights and cut-offs, according to their national priorities, plans and contexts. National MPIs are disaggregated by region, urban/rural areas, age and other factors in order to leave no one behind. They are also always reported with the indicator breakdown, as those details can guide and monitor national policies such as budget allocation, targeting and policy coordination across sectors. Countries with official national MPIs include Mexico, Colombia, Bhutan, Chile, Costa Rica, El Salvador, Pakistan, Ecuador, Honduras, Armenia, Mozambique, Dominican Republic, Panama, Nepal, Philippines, Nigeria, and Malaysia, among others. As mentioned above, the South-South MPPN, with over 55 participating countries, provides peer support for both technical and policy leaders whose official MPI has not yet been formally launched.
The first regional MPI published was in Latin America and was included in the Social Panorama 2014 published by the Economic Commission for Latin America and the Caribbean (Economic Commission for Latin America and the Caribbean (ECLAC), 2015). This regional MPI kept some of the dimensions and indicators of the global MPI but added a dimension on labor and adjusted specific indicators to reflect the needs of Latin American countries (Santos et al., 2015). In September 2017, the League of Arab States (LAS), OPHI, the Economic and Social Commission for Western Asia (ESCWA) and UNICEF launched the Arab Multidimensional Poverty Report, which includes a measure developed by countries in the Arab region. The Arab MPI includes the same three dimensions used by the global MPI (health, education and living standards), but it uses different indicators (e.g. early pregnancy and overcrowding). It uses two poverty cut-offs, one for the identification of acute poverty and another for poverty (United Nations Economic and Social Commission for Western Asia (ESCWA) et al., 2017). Regional MPIs are very useful because they provide meaningful comparisons between neighboring countries, made by regional statistical commissions, and they are better tailored to the
“To develop a national MPI, countries choose their own set of dimensions, indicators, weights and cut-offs.”
16
Achieving the Sustainable Development Goals
regional context.
There are many motivations that lead countries to adopt a new official measure of multidimensional poverty. Another important motivation is their commitment to meet the SDGs by 2030. With the adoption of the 2030 Agenda at the United Nations in 2015, 193 governments committed to achieving 17 global goals by 2030, promising to “leave no one behind and endeavor to reach the furthest behind first”. Goal 1 addresses multidimensional poverty, aiming to “end poverty in all its forms everywhere.” Meanwhile, the second out of 169 SDG targets—Target 1.2—is to “reduce at least by half the proportion of men, women and children of all ages living in poverty in all its dimensions according to national definitions”. The MPI measures this target.
A country’s MPI reflects key poverty-related SDG priorities and is used to advance and track progress towards Goal 1. MPIs are consistent with the SDGs’ recognition that no one single factor can capture the whole experience of poverty, nor alleviate its interconnected causes and manifestations. The SDGs call for integrated multisectoral policies and for disaggregating indicators by regions, age and other groups to identify and prioritize those furthest behind. In this sense, an MPI is closely aligned with the SDG agenda in the following ways:
• An MPI measures poverty in multiple forms and dimensions.• An MPI complements monetary poverty measures.• An MPI addresses multiple SDGs and their indicators, simultaneously.• An MPI directly reflects interlinkages across indicators at the household level.• An MPI can be disaggregated by age, disability status, region and other sociodemographic characteristics to identify the poorest and leave no one behind.• An MPI can be nationally specific or internationally comparable. A national MPI reflects poverty according to national definitions but cannot be compared. Regional and global MPIs permit comparisons and cross-learning across countries. • An MPI can be used as a tool of governance:
- To shape resource allocation according to the level and composition of multidimensional poverty.- To coordinate policies across sectors and across levels of government.- To design multisectoral policies that reflect interconnected deprivations.- To monitor reduction as a high visibility “headline” across SDGs.- To target poor households and regions for specialized assistance.- To give political leaders a concrete multipurpose action-oriented measure. - To communicate with the private sector and civil society actors.
Introduction
“A national MPI can be applied to facilitate and track progress to achieve SDG 1.2.”
“MPIs are consistent with the SDGs’ recognition that no one factor captures the experience of poverty, nor alleviates its causes and manifestations.”

SDG TARGET 1.2
By 2030, reduce at least by half the proportion of men, women and children of all ages living in poverty in all its dimensions according to national definitions.

19 How to Build a National Multidimensional Poverty Index (MPI)
Section I. Establishing the process and generating support for the national MPI
Recognition of poverty as a multidimensional phenomenon has increased rapidly over the last few decades. At the same time, SDG Target 1.2 explicitly complements the objective of ending $1.90/day with a goal of reducing multidimensional poverty by at least half by 2030. Furthermore, the World Bank’s Commission on Global Poverty led by Sir Tony Atkinson proposed, and the World Bank accepted, the use of a multidimensional poverty indicator as a complement to the $1.90/day measure (World Bank, 2017). There is now global recognition of the importance of having a comprehensive measure of multidimensional poverty that captures the multiple deprivations faced by the poor and provides information related to the intensity and composition of poverty.
Although measurement design may seem like a purely technical process, designing an effective MPI demands strong political commitment and the engagement of various stakeholders, including policymakers, academics, civil society, the private sector and the media. The process of developing a national MPI varies from country to country: different stakeholders need to participate in the design while adhering to different timelines and following different sequences and coordination strategies. However, in all cases, it is important to gain political support for the MPI and to communicate it effectively to a large range of actors.
Coordinating different stakeholders takes time. Each may have different prior understandings of what poverty means and how it should be measured. In addition, the MPI as a concept is still relatively new so journalists may not be familiar with its details. To create an informed debate, a well-thought-out communications strategy is necessary to explain to key reporters and opinion leaders what an MPI is, the value-added of measuring poverty from a multidimensional perspective, and the potential benefits of having a national MPI as an official permanent statistic that is regularly updated.
A key early step is to decide on the purpose of the MPI. Even though this will evolve over time, it is essential to be clear about the reasons why the country wants to implement a national MPI so that the measure follows these reasons. This step is closely related to a process of gaining political buy-in. The idea of having a national MPI can come from members of the government, policymakers, parliaments or other stakeholders. Nevertheless, in all cases it is essential that national governments actively participate in the discussions and feel ownership of the final measure. Other stakeholders are usually also included in the process with the objective of informing discussions and adding credibility and transparency. Finally, institutional arrangements must be put in place to guarantee the sustainability of the MPI over time and through changes in governments. That is, the national MPI should become a permanent policy tool for the country—not just for a specific administration.
Section I of the handbook discusses the process of engaging different stakeholders and communicating the idea of developing a national MPI. It begins by discussing some of the most common goals of national MPIs (chapter 1). Chapter 2 explains the process of engaging relevant stakeholders and explores how countries have established institutional arrangements to ensure the sustainability of the MPI over time—across election cycles and changes of government and political party. Finally, chapter 3 discusses some key characteristics of the communications strategy that accompanies the development of a national MPI. Ideally, all readers should read chapters in this section. We recommend that those planning the national MPI and participating in the design phase study these chapters carefully; also, it is advisable that communications staff read the communications chapter in depth.
“Designing an effective MPI demands strong political commitment and the active engagement of policymakers, academics, civil society, the private sector and media.”

20
Chapter 1. How a national MPI will be used: Common policy purposes
When it seems likely that an official national MPI is going to be seriously explored, a first step is common to all countries: setting out the purpose(s) of the measure. This important step informs data selection and measurement design. To give a basic example, if one purpose of the measure is to inform provincial policies, then the data source used must be representative at least at the province level.
A national MPI usually serves more than one purpose. These purposes are closely linked to the MPI’s policy uses. An MPI always officially establishes the level and trends of poverty, and monitors the fulfillment of national or international goals, such as a national development plan or the SDGs. An MPI is also normally used to track progress in SDG 1.2, which focuses on reducing poverty in all its dimensions; to guide social policies and to identify policy gaps. It is regularly used to target the poorest people or regions, to incentivize coordination across ministries, and to inform budget allocation by sector and region. Outside government, a national MPI is often used by the private sector, charities or NGOs that are also working independently to address poverty.
This chapter explains the most common purposes of national MPIs and provides examples from countries that have already used their measures in these ways.
As discussed in the introduction, the increasing recognition of poverty as a multidimensional phenomenon has encouraged countries to create MPIs that act as a headline number, give visibility to poverty in many forms and dimensions, and monitor a set of key indicators and their interlinkages. A national MPI provides a summary figure based on the transparent identification of the poor and the intensity of their poverty. But, by acting as a high-resolution lens on poverty, it also provides an information platform. This enables it to fulfill its fundamental purpose: to guide policy.
The platform of disaggregated and indicator-specific information that accompanies national MPIs provides useful information for governments to use when designing policy interventions to reduce poverty and leave no one behind. This information shows differences between areas, subnational regions and groups within a country. The information provided by this analysis can improve targeting because it identifies the most deprived areas in a country and the poorest groups. The remaining sections in this chapter discuss the most common goals of some of the existing national MPIs, as well as for the state of Andhra Pradesh in India. A summary of these is presented in table 1.1.
Introduction
Common purposes of national MPIs: an overview
How a national MPI will be used: Common policy purposes
“It is essential for countries to be clear about their reasons for a national MPI.”

21 How to Build a National Multidimensional Poverty Index (MPI)
Country Purpose
Andhra Pradesh To understand the multidimensional deprivations faced by its people, by locationand social categories and to support evidence-based policymaking in reducing multidimensional poverty.
Armenia To complement monetary poverty measures, and monitor progress and development goals.
Bhutan To design, monitor and evaluate national and regional programs to target the poor and allocate resources.
Chile To complement existing poverty statistics and design, and monitor and evaluate public policy.
Colombia To monitor the poverty reduction goal and define goals of specific interventions. Since 2012, it has been used to define the beneficiaries and the graduation criteria of the conditional cash transfer program.
Costa Rica To complement monetary poverty measures, track poverty, target social programs and allocate resources.
Dominican Republic To design public policies and to target the poor in policy interventions.
Ecuador To track poverty and guide public policy.
El Salvador To complement monetary poverty statistics and guide social policy.
Honduras To improve targeting and the evaluation of public policies, and support the design and implementation of more effective policies.
Mexico To monitor poverty, increase government accountability, improve targeting, budget allocation and evaluation of public policies.
Mozambique To complement monetary poverty and to measure and track poverty.
Nepal To monitor key simultaneous disadvantages that affect multidimensionally poor people, track progress in the SDGs, complement the monetary poverty measurement and support more effective and multisectoral policies at both the national and provincial level.
Nigeria To measure multidimensional poverty, revealing the most important dimensions of poverty in Nigeria.
Pakistan To track poverty and improve targeting and the evaluation of public policies, improve allocations and support the design and implementation of more effective social policies to reduce poverty.
Panama To complement monetary poverty statistics and guide public policy (reorientation of social policy with the goal of reducing poverty levels).
Table 1.1. Main purposes of some of the existing national and state-level MPIs

22
One of the most common goals of national MPIs is to monitor poverty reduction. This entails tracking changes in multidimensional poverty over time and analyzing statistically significant changes in the levels of poverty across a country. This purpose has implications for indicators: they must be sensitive to policy changes so they can show poverty reduction accurately.
This purpose also has implications for data: a measure that aims to monitor poverty reduction requires a consistent survey across time. When more or better data eventually become available, an adjustment might be made to the MPI to take advantage of this, but the MPI would then no longer be comparable across time. Thus, in the year of change both old and new measures must be presented. This is relevant because articulating from the start how the measure can be revised (e.g, once per decade) ensures that changes do not compromise the stated purpose of poverty monitoring. In terms of sample design, poverty reduction can be monitored at the national level and for urban or rural areas, subnational regions, and by age or other population groups. The data used should be able to be disaggregated by the necessary groups so countries can build trends of poverty figures to track progress over time.
This purpose is also related to monitoring SDG Target 1.2. Countries with national MPIs can report reductions in multidimensional poverty using this index, as it reflects “poverty in all its dimensions according to national definitions”. Given the properties of the Alkire-Foster (AF) method (see chapter 4 for details), it is possible to disaggregate the MPI across groups and to check that no one is being left behind. Positive trends occur if the poorest group or region reduces MPI the fastest, and/or if all indicators are significantly reduced. In addition, the MPI draws together progress related to SDG targets in addition to Target 1.2, as many of the indicators included in national MPIs are related to other specific SDGs, so reducing the MPI will simultaneously result in progress in these SDGs.
Monitor poverty reduction
Philippines To capture deprivations in various dimensions. The MPI can contribute in the design and implementation of poverty reduction programs and policies.
Vietnam To measure the levels of deprivation on access to basic social services, to identify the beneficiaries of poverty reduction and social protection policies; programs, policies for socio-economic development of the whole country, of each region and sector; and to use the result to advice the government to develop policies and planes to reduce deprivation and poverty.
Source: own elaboration based on official national MPI Reports. Angulo-Salazar et al. (2011); Consejo Nacional de Evaluación de la Política de Desarrollo Social (CONEVAL) (2014); Instituto Nacional de Estadistica (INEC) (2015); Instituto Nacional de Estadistica y Censos (INEC) (2015); Martirosova et al. (2017); Ministerio de Desarrollo Social (2016); Ministerio de Economía y Finanzas et al. (2017); Ministry of Economics and Finance (2016); Ministry of Planning et al. (2016); National Planning Commission & Oxford Poverty and Human Development Initiative (OPHI) (2018); National Statistic Bureau Royal Government of Bhutan (2013); Secretaría de Coordinación General de Gobierno y El Instituto Nacional de Estadística (SCGG-INE) (2016); Secretaría Técnica y de Planificación de la Presidencia (STPP) & Ministerio de Economía a través de la Dirección General de Estadística y Censos (MINEC-DIGESTYC) (2015). Philippine Statistics Authority (2018) United Nations development Programme (UNDP) (2018b) John et al. (2018)
How a national MPI will be used: Common policy purposes
“A national MPI can be used to report progress to achieve SDG target 1.2.”
23 How to Build a National Multidimensional Poverty Index (MPI)
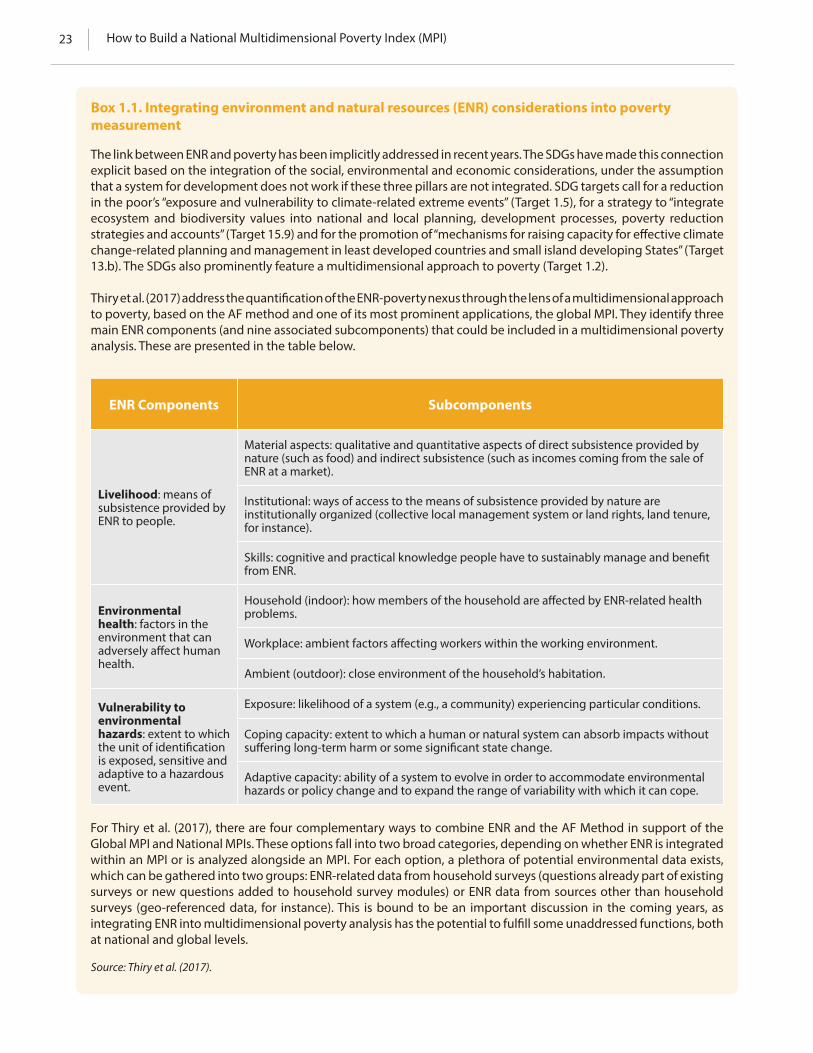
ENR Components Subcomponents
Livelihood: means of subsistence provided by ENR to people.
Material aspects: qualitative and quantitative aspects of direct subsistence provided by nature (such as food) and indirect subsistence (such as incomes coming from the sale of ENR at a market).
Institutional: ways of access to the means of subsistence provided by nature are institutionally organized (collective local management system or land rights, land tenure, for instance).
Skills: cognitive and practical knowledge people have to sustainably manage and benefit from ENR.
Environmental health: factors in the environment that can adversely affect human health.
Household (indoor): how members of the household are affected by ENR-related health problems.
Workplace: ambient factors affecting workers within the working environment.
Ambient (outdoor): close environment of the household’s habitation.
Vulnerability to environmental hazards: extent to which the unit of identification is exposed, sensitive and adaptive to a hazardous event.
Exposure: likelihood of a system (e.g., a community) experiencing particular conditions.
Coping capacity: extent to which a human or natural system can absorb impacts without suffering long-term harm or some significant state change.
Adaptive capacity: ability of a system to evolve in order to accommodate environmental hazards or policy change and to expand the range of variability with which it can cope.
For Thiry et al. (2017), there are four complementary ways to combine ENR and the AF Method in support of the Global MPI and National MPIs. These options fall into two broad categories, depending on whether ENR is integrated within an MPI or is analyzed alongside an MPI. For each option, a plethora of potential environmental data exists, which can be gathered into two groups: ENR-related data from household surveys (questions already part of existing surveys or new questions added to household survey modules) or ENR data from sources other than household surveys (geo-referenced data, for instance). This is bound to be an important discussion in the coming years, as integrating ENR into multidimensional poverty analysis has the potential to fulfill some unaddressed functions, both at national and global levels.
Source: Thiry et al. (2017).
Box 1.1. Integrating environment and natural resources (ENR) considerations into poverty measurement
The link between ENR and poverty has been implicitly addressed in recent years. The SDGs have made this connection explicit based on the integration of the social, environmental and economic considerations, under the assumption that a system for development does not work if these three pillars are not integrated. SDG targets call for a reduction in the poor’s “exposure and vulnerability to climate-related extreme events” (Target 1.5), for a strategy to “integrate ecosystem and biodiversity values into national and local planning, development processes, poverty reduction strategies and accounts” (Target 15.9) and for the promotion of “mechanisms for raising capacity for effective climate change-related planning and management in least developed countries and small island developing States” (Target 13.b). The SDGs also prominently feature a multidimensional approach to poverty (Target 1.2).
Thiry et al. (2017) address the quantification of the ENR-poverty nexus through the lens of a multidimensional approach to poverty, based on the AF method and one of its most prominent applications, the global MPI. They identify three main ENR components (and nine associated subcomponents) that could be included in a multidimensional poverty analysis. These are presented in the table below.

24
Complement monetary poverty measures
Traditionally, poverty has been measured using monetary poverty figures (Ravallion, 2016). Although it is now widely understood that poverty is a multidimensional phenomenon (Sen, 1999), monetary poverty statistics remain essential, as poverty is clearly associated with a shortage in material resources (Lister, 2004). However, quite surprisingly, people who are income poor according to household surveys are often not the same people who are multidimensionally poor (Alkire & Shen, 2017; Klasen et al., 2015; Suppa, 2016). For example, in Bhutan 2012, 12 percent of people were income poor and 12.6 percent of people were MPI poor. However, only 3.2 percent were poor by both monetary poverty measures and the MPI (National Statistic Bureau Royal Government of Bhutan, 2013). Figures for 2017 showed that while 7.2 percent of the population was identified as income poor and 5.8 percent as MPI poor, only 1 percent were found to be poor according to both measures (National Statistic Bureau Royal Government of Bhutan & Oxford Poverty and Human Development Initiative (OPHI), 2017). The MPI thus can help identify people who are not identified as poor by monetary metrics but still face deprivations in basic dimensions, such as education, housing and health.
Many countries have developed national MPIs to complement existing monetary poverty statistics and provide a more comprehensive picture of poverty. Countries such as Panama, Chile and Costa Rica have explicitly mentioned that one goal of their MPIs is to complement measures of income poverty—to shine a light on other deprivations. Some of these countries have calculated both measures using the same source of information, which allows them to see who is both monetarily and multidimensionally poor, who is MPI poor but not monetary poor, and who is monetary poor but not MPI poor (as in the case of Bhutan above), or to jointly analyze both. Others compute official MPIs from different surveys and have clear and distinct purposes for each measure.
Another common purpose of national MPIs is to support the coordination of social policies aiming to eradicate poverty. Because the MPI presents a multisectoral, high-level headline, a reduction in the MPI requires the coordinated action of multiple sectors and ministries, often working at different levels of government. A disaggregated analysis of the MPI can provide the information required to plan (and monitor) a coordinated action strategy, identifying those who are the poorest and making sure that no one is left behind. For instance, Colombia, Costa Rica and Mexico developed national strategies to design and coordinate multisectoral policies, using a reduction in the MPI as the main goal. They regularly convene cross-government social cabinets or poverty round-tables to break silos and bring together different sectors for discussions on the MPI and poverty reduction.
The MPI can be used to guide the allocation of national resources when targeting is more efficient than universal provision. This could mean targeting resources to the regions with the highest rates of multidimensional poverty or targeting individuals or households whose levels of multidimensional poverty are the highest.
Policy coordination
Targeting the poor
“Disaggregated MPI analysis can enable countries to design more effective strategies and policies, identify the poorest and act ensure no one is left behind.”

25 How to Build a National Multidimensional Poverty Index (MPI)
Countries such as Colombia, for example, have used their national MPIs to identify which regions of the country have the highest levels of multidimensional poverty. Colombia computed a simplified version of the national MPI from census data, which allowed them to identify critical areas of the country in terms of the overall MPI figures and the individual indicators. This information was used as an input to prioritize certain regions and municipalities for benefits from social programs.
Other countries used the MPI to target poor households one by one, using census data or a separate targeting survey or administrative data. In these cases, the household’s own deprivation profiles are used, and households with the highest levels of multidimensional poverty are selected as beneficiaries.
Once the national MPI is designed and calculated, a detailed analysis of the indicator composition of poverty, together with unit costs and regional disaggregation, can show whether the current budget allocation responds to the needs of the multidimensionally poor or whether it might be adjusted to address their particular deprivations more effectively, even using the same budget envelope. The information provided by this analysis allows governments to redistribute resources according to the needs of each region or group in order to accelerate reductions of the MPI.
Costa Rica, one of the countries that has adopted this approach, has officially incorporated the MPI into its budget allocation process, aligning resources with the results of its national MPI.
National MPIs can also be used to evaluate social programs or policies aimed at reducing poverty. Governments can look at the rate of MPI reduction—together with the rate of reduction in each of its component indices—to see whether the reductions match the expected outcomes with respect to the programs in each region. When social policies target different types of deprivations simultaneously, an MPI can be used with formal impact evaluation methodologies to assess whether the policies affected those joint deprivations, and by how much. Although impact evaluation itself has not been a main purpose of national MPIs, it has been used in this manner in academic studies (Loschmann et al., 2015; Pasha, 2016; Robano & Smith, 2014).
Budget allocation
Policy evaluation

26
Box 1.2. Using the Mexican MPI
Conclusions A national MPI is a powerful tool for addressing multiple goals. Most countries develop a national MPI to monitor poverty reduction in all its forms. However, in recent years an increasing number of countries are using the national MPI as a more comprehensive policy tool to assist in coordinating social policies, target the poorest groups, allocate social budgets, and complement income poverty measures. The list of examples presented in this chapter is not exhaustive. Countries can have one or several goals for their national MPIs and can include new goals after computing the measure. Nevertheless, it is crucial to have a clear consensus on the main purpose of the measure at the beginning of the process of developing a new index, as this will guide normative decisions on the structure of the measure and provide information about its possible uses.
Source: Consejo Nacional de Evaluación de la Política de Desarrollo Social (CONEVAL) (2014).
In 2009, Mexico implemented an MPI that considers six social dimensions and an income threshold. Multidimensional poverty measurement in the country is conducted by CONEVAL, an autonomous Mexican government institution created in 2004 with the purpose of measuring poverty at a national, state and municipality level, and evaluating social programs as an independent unit from the government.
Ten years after its official launch, Mexico’s MPI serves a wide range of purposes, among them:
• Monitoring poverty reduction: The MPI, updated every two years, shows changes in the levels of poverty and can be disaggregated by different groups, including states and municipalities.• Accountability: As the MPI is disaggregated by states, it makes visible the success of governors whose poverty-reduction policies worked on the ground. • Policy coordination: Different poverty dimensions require the involvement of different sectors and actors. Mexico’s MPI has provided these actors a common framework in which to coordinate, prioritize and plan. For example, it inspired the National Strategy for Social Inclusion, a government development strategy that coordinates efforts for poverty reduction at the federal and local levels. • Targeting the poor: Multidimensional poverty indicators identify those living in the extreme conditions with particular deprivations so that social programs can be designed and targeted accordingly. • Budget allocation: By identifying those living in poverty, CONEVAL can define priority attention areas. Congress annually assigns resources to these areas through the Social Infrastructure Fund. Considering other social program evaluations and multidimensional poverty results, CONEVAL also submits budget recommendations to Congress. These recommendations are aimed at improving budget allocation efficiency. • Policy evaluation: The MPI provides valuable insight into whether Mexico’s social development strategy is on the right track and whether change is happening fast enough.
How a national MPI will be used: Common policy purposes

27 How to Build a National Multidimensional Poverty Index (MPI)
Chapter 2. Engaging relevant stakeholders
Once there is strong interest and commitment from one or more key country institutions and leaders, one of the very strategic early steps in the development of an MPI is to engage other relevant stakeholders. Otherwise, a measure is at risk of being ignored. Former Statistician General of South Africa, Pali Lehohla, put it this way: “As statisticians, we used to make our national statistics, then simply throw them over the policy fence, hoping that policymakers would find and use them. But now, things have changed. The fence has come down, and we are learning how important it is to talk to each other”. Following his idea, this chapter describes the critically important process of securing the input and support of stakeholders in the development of the national MPI.
There are four pivotal requirements to guarantee the sustainability and effectiveness of the national MPI as a policy tool. First, the national MPI must be approved and implemented with the support of the country’s top leadership. In practice, this has been either the president, vice president, a strong minister, or the congress. Second, the national MPI must generate solid information. To do this, its technical implementation must be rigorous, nonpartisan and based on indicators that can be affected by direct action (see section II for details), and it must be updated regularly. Third, the MPI must be proactively communicated to different potential actors. An apt communications strategy creates a better and easier engagement with stakeholders and facilitates the understanding and use of the results. Fourth, poverty figures must be credible to guarantee the sustainability of the measure over time. These four aspects (policy buy-in, technical rigor, a strong communications strategy and credibility) are crucial to guaranteeing that the measure is sustainable and that the national MPI is actively used for policy.
This chapter discusses steps that can help achieve policy buy-in and gain credibility. It illustrates how different countries have designed their MPIs and specifies which actors (and how and when) have been engaged during this process. Though this process is different in each country, there are some common themes that nearly always apply.
Designing and using a national MPI requires support. Without political buy-in and the support of relevant stakeholders, including different policymakers, bureaucrats, experts, civil society, journalists, opinion leaders, academics and statistical offices, the process is unlikely to be effective or viable, and the impact on poverty reduction may be limited. The aim is to avoid technically perfect MPI reports that sit on a shelf but never change poverty. Countries’ experiences suggest that this stage is critical, and it can feel quite overwhelming and difficult at the beginning. This is because each stakeholder must learn about the MPI, which is usually a new concept, and then bring their own views into it. It takes time, discussion and leadership until diverse stakeholders agree on the basic purpose and structure of the measure. However, countries that
Introduction
Securing political buy-in and stakeholder support
“There are four pivotal requirements to guarantee the sustainability and effectiveness of the national MPI as a policy tool.”

28
Box 2.1. How was the Chilean MPI created?
Source: Extract of an article published in Dimensions magazine, issue 3 (2017).
have been through this process have all emphasized the relevance of these dialogues and discussions in building legitimacy and support for the measure.
Having support from the president, vice president or a senior minister is crucial to guarantee the sustainability of the process; however, the leadership in developing the MPI cannot be left only to these offices. It is necessary to have a leader or a champion vested by the senior figure who drives the process, convening one or several committees, going between technical and political actors, and planning the whole design process from initial proposals to launch events. This person may be at the ministerial, vice-ministerial, chief statistician or another level, so long as they are fully backed by high-level officials. In addition, there must be a technical champion. Usually, this is a person in the office of statistics in charge of the technical aspects of computing a national MPI. This person has a good understanding of the MPI and the policy implications of technical decisions.
Engaging relevant stakeholders
Chile began exploring the idea of developing an MPI in 2009, towards the end of Michelle Bachelet’s first administration. However, the measure was only designed years later. A crisis developed in 2012 when the validity of the data on poverty was called into question, triggering a need to review the existing measures. The president at that time, Sebastian Piñera, brought together a panel of experts from various organizations and political backgrounds to participate in the Presidential Advisory Commission of Experts to Update the Poverty and Extreme Poverty Lines, whose mission was to brief the president on all aspects of measuring poverty and extreme poverty and to offer proposals on the matter.
The commission included nine people from academia, NGOs, multilateral organizations and the government, all of them experts on poverty matters. The body engaged in dialogue with a broad group of people from various civil society organizations, Congress, governmental agencies, universities, and international organizations and specialists.
Besides proposing that the monetary poverty line be updated, the commission recommended, after 13 months of discussions, creating a new measure of multidimensional poverty, based on the AF method. This report was delivered to President Piñera at the end of his administration (January 2014). Its implementation by the Ministry of Social Development went into effect therefore under the second administration of President Bachelet.
The Ministry of Social Development took the commission’s recommendations and generally adopted the new proposals for measuring monetary poverty. For the multidimensional measures, an Inter-institutional Technical Panel was established by the ministry and the National Institute of Statistics, and advised by the Economic Commission for Latin America and the Caribbean. The ministry also received technical advice from OPHI.
In December of 2014, a seminar was held to introduce MPI-Chile, which included four dimensions: education, health, employment and social security, and housing, each of them having three indicators. According to MPI-Chile, a person with deprivations in at least three of the 12 indicators—or the equivalent of being deprived in one dimension—would be considered multidimensionally poor.
A revised MPI was launched in 2016, expanding the number of dimensions and indicators to also include deprivations related to environment and networks. The resulting new multidimensional measure includes five dimensions: education, health, employment and social security, housing and local environment, and networks and social cohesion. Each dimension comprises three indicators, for a total of 15.
29 How to Build a National Multidimensional Poverty Index (MPI)
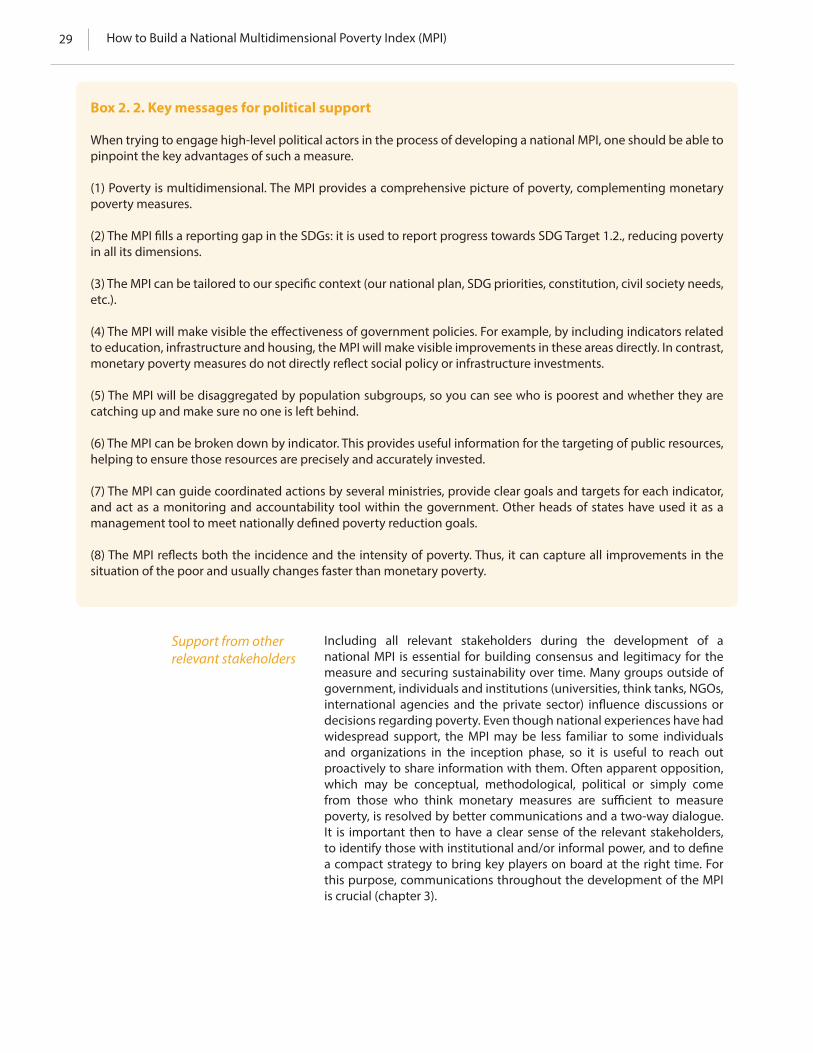
Box 2. 2. Key messages for political support
When trying to engage high-level political actors in the process of developing a national MPI, one should be able to pinpoint the key advantages of such a measure.
(1) Poverty is multidimensional. The MPI provides a comprehensive picture of poverty, complementing monetary poverty measures.
(2) The MPI fills a reporting gap in the SDGs: it is used to report progress towards SDG Target 1.2., reducing poverty in all its dimensions.
(3) The MPI can be tailored to our specific context (our national plan, SDG priorities, constitution, civil society needs, etc.).
(4) The MPI will make visible the effectiveness of government policies. For example, by including indicators related to education, infrastructure and housing, the MPI will make visible improvements in these areas directly. In contrast, monetary poverty measures do not directly reflect social policy or infrastructure investments.
(5) The MPI will be disaggregated by population subgroups, so you can see who is poorest and whether they are catching up and make sure no one is left behind.
(6) The MPI can be broken down by indicator. This provides useful information for the targeting of public resources, helping to ensure those resources are precisely and accurately invested.
(7) The MPI can guide coordinated actions by several ministries, provide clear goals and targets for each indicator, and act as a monitoring and accountability tool within the government. Other heads of states have used it as a management tool to meet nationally defined poverty reduction goals.
(8) The MPI reflects both the incidence and the intensity of poverty. Thus, it can capture all improvements in the situation of the poor and usually changes faster than monetary poverty.
Including all relevant stakeholders during the development of a national MPI is essential for building consensus and legitimacy for the measure and securing sustainability over time. Many groups outside of government, individuals and institutions (universities, think tanks, NGOs, international agencies and the private sector) influence discussions or decisions regarding poverty. Even though national experiences have had widespread support, the MPI may be less familiar to some individuals and organizations in the inception phase, so it is useful to reach out proactively to share information with them. Often apparent opposition, which may be conceptual, methodological, political or simply come from those who think monetary measures are sufficient to measure poverty, is resolved by better communications and a two-way dialogue. It is important then to have a clear sense of the relevant stakeholders, to identify those with institutional and/or informal power, and to define a compact strategy to bring key players on board at the right time. For this purpose, communications throughout the development of the MPI is crucial (chapter 3).
Support from other relevant stakeholders

30
Government
Engaging relevant stakeholders
As with any official national statistic, the government (or an agency/ministry within the government) is the one developing the national MPI. But the word “government” covers a wide and divergent group of key actors who may engage in this process in different ways.
• The president, prime minister and vice president When the president, prime minister and vice president are genuinely committed to poverty reduction and decide to use the MPI as a tool for advancing effective policies and managing and monitoring real change, their impact can be powerful. Sharing information with these officeholders on the potential usefulness of the MPI can be done in personal discussions and presentations by trusted advisors, ministers and the head of the national institute of statistics.
• Ministers and vice ministers Usually, there is at least one leader at the level of minister or vice minister who functions as the political champion or leader of the MPI. This person works to institutionalize the MPI into existing processes and use it to inform and guide policy actions. They also share information and potential policies with other relevant ministers via appropriate channels. A social cabinet or high-level committee of ministers helps to maintain support throughout the process. Presentations of other countries’ experiences to relevant ministers, and one-on-one discussions may also be useful in the early stages.
• National institute of statistics The national institute of statistics (NSO) is usually the lead agency responsible for the technical aspects of the MPI’s implementation, as they can usually provide independent, accurate and regular estimations of the MPI. In many countries, the NSO has the responsibility for calculating official poverty statistics, hence, it is natural for them to calculate and present the national MPI. However, in some countries, the computation of and role of technical lead for the development of the national MPI has fallen to a ministry—usually the ministry of planning or social development. In any case, the institution that computes the MPI should guarantee that the process is technically rigorous and that the methodological aspects related to the MPI datasets and estimations are transparent and replicable. Usually an MPI report or methodological document is produced for this purpose.
• Civil servantsSupport from civil servants and bureaucrats is truly key for the long-term sustainability of the MPI, given that they continue after a change in government and are often the key users of the MPI figures. Thus, the process of developing a national MPI must explicitly seek to engage them. While the points of engagement may vary, workshops, consultations and presentations may be conducted in order to explain what the MPI is and how it can be used, and to provide a forum for exchange of input during the design and roll-out of the national MPI.
• Subnational levels of governmentState, provincial, municipality, city and community levels of governments sometimes participate in regional consultations for measurement design, as the national measure must be accurate for different cultural, climatic
“Where a committed president or prime minister decides to use the MPI to advance poverty reducing policies, their impact can be powerful.”

31 How to Build a National Multidimensional Poverty Index (MPI)
and economic zones of the country. Furthermore, in decentralized contexts, these actors can be the main users of the measure. They might be an important audience for discussion of MPI indicators and deprivation thresholds. Where policy space exists, these leaders must be briefed before the launch of the final measure so they know what the MPI is and how it can be useful for policy. When the MPI is launched, the disaggregated findings need to be shared proactively and in local languages (e.g., with briefings for each region, or via visits and presentations).
In most democracies, the congress or parliament play a central role in the country. Without their support, a national MPI may not last beyond the limits of a certain administration. Parliaments could be a strategic ally for the assurance of a permanent MPI. If this relationship is fostered carefully and grounded in a shared concern for poverty that spans political platforms, it may bring important support for the MPI. In the case of Mexico, for instance, the congress not only supported the national multidimensional measure, but its representatives, in response to a legal mandate, were the ones who decided to develop it.
Academics are a crucial audience in this process. Their endorsement of the MPI adds local credibility and legitimacy to the measure. Furthermore, they and their students may do necessary research for the country or region, uncovering policy-relevant pathways out of poverty. The methodology of the MPI needs then to be presented in detail, and academic concerns need to be addressed directly through open and on-going discussions. Academics teach the next generation of political leaders, technical advisors and statisticians, so they can be a strategic partner in familiarizing the next generation with the concept and applications of multidimensional poverty measures.
Opinion leaders are those who communicate ideas to a mass audience and can build support on a various number of issues: journalists, novelists, entrepreneurs and filmmakers being prime examples. Opinion leaders are pivotal actors as they represent a crucial link with the population. They shape ideas and have the ability to build a common understanding of the purpose and usefulness of the MPI. They might be in the media, in faith-based groups (churches, mosques, synagogues or temples), in social movements and unions, in the government, in film or entertainment industries, international agencies or private sector. They may be retired global leaders, activists, academics or sports stars who have taken on a public voice. These key people should be identified and concrete ways found to connect with them.
In particular, when disaggregation of the national MPI occurs by social groups—for example, indigenous groups, children or people living with disability—it can be useful to share findings with key opinion leaders working with each group and engage them in productive debates.
Congress
Academia
Opinion leaders

32
The MPI should be adopted by government in such a way that it is sustained as a permanent official measure of poverty. This means that there should be an outreach strategy to explain the MPI to all political parties and their leaders. This is particularly important during the run up to elections. During this period, the aim would be for all the presidential or party candidates to embrace the MPI as a measure of poverty, to commit to reporting the MPI honestly (even if it increases), and to articulate in campaign platforms their plans to reduce the MPI. Candidates should competitively differentiate themselves not on whether to fight multidimensional poverty, but on how do so. In countries such as Costa Rica, Chile and El Salvador, among others, there were pre-election activities, such as briefing different political parties about the MPI, so that candidates could appropriately form their policy action plans and share these on the campaign trail.
The media in all its forms is an important tool for communicating the MPI and building momentum across the broader population, so that members of the public become informed about the levels and trends of multidimensional poverty and can do their part to redress it. The national media is crucial for the process of developing a national measure. At the same time, a well-placed article in an outlet that has regional or international reach can help with local credibility. It is therefore vital to target those who work in the media so that they understand the MPI, can write or talk intelligently about it, and can be accurate and passionate in their reporting of it.
Some major media outlets are listed below. The MPI communications strategy should involve reaching out to those who are influential in each.
• Print media (i.e. newspapers, magazines, etc.). Outreach should not be limited to news departments and mainstream media but should include more niche markets like publications about people, issues, actors (the private sector), etc.
• Broadcast media (i.e. TV and radio). Interviews with key MPI stakeholders can provide a platform for explaining the MPI, as well as for responding to questions from the public.
• Blogosphere. Well-placed blogs, podcasts and similar digital media can help shape opinions.
• Social media (i.e. YouTube, Facebook, Twitter, Instagram, infographics, etc.). These have become essential in any media strategy, especially in reaching larger numbers of people both nationally and internationally.
With the notable exception of Costa Rica, the private sector has not been visible in the development of national MPIs. Most countries to date have not included this sector within outreach efforts during the process. However, this may change moving forward as others learn from the Costa Rican example. The involvement of the private sector in the development and implementation of the national MPI in Costa Rica has promoted a continuous dialogue between the government and the private sector,
The media and social media
Other political leaders, including those in the opposition
Engaging relevant stakeholders
Private sector
“It is vital for members of the media to write or talk intelligently about the national MPI.”

33 How to Build a National Multidimensional Poverty Index (MPI)
engaging this important actor in the fight against multidimensional poverty (see box 2.3.).
Box 2.3. “Involving the private sector is the right idea for ramping up the fight against poverty”, excerpt of interview with Ana Helena Chacon Echeverria, Vice President of Costa Rica.
Source: Full interview available in Dimensions magazine, issue 4, 2017.Note: Horizonte Positivo is a think-and-do tank of the private sector that promotes intersectoral agreements between the government, academia, civil society and the private sector, to cooperate in the design and reform of key public policies for human development in Costa Rica. More information available at: www.horizontepositivo.org
Why has the government of Costa Rica decided to measure poverty multidimensionally?
In this administration, we believe that a change of focus in the fight against poverty was necessary. We saw the need to include a multidimensional measure that allowed a comprehensive view of poverty and identified its causes in the national context. This measure complements the traditional income method and provides a more precise analysis of poverty. Both measures will be used for analysis and social policy.
Why was this done in collaboration with the private sector? How has this alliance benefitted the government?
This administration prioritized the coordination and articulation of programs at public institutions and emphasized the shared responsibility of other social actors at an intersectoral level. A tripartite alliance was established with the government of Costa Rica, OPHI and Horizonte Positivo, with the objectives of implementing the MPI in Costa Rica, promoting joint research, and developing tools for the measurement, design and analysis of public policies. Horizonte Positivo (an association of private Costa Rican businesses) has been a great ally in this effort. With their participation, the official launch of the MPI took place in October 2015, with the goals of supporting the efficient targeting of resources, maximizing the impact of these resources and encouraging transparency of institutional activities.
What recommendations would you give to other countries that are starting the process of creating a national MPI? What factors facilitated the MPI being used as a tool for better governance?
Understanding the determinants of poverty is essential in the fight to eradicate it. It is necessary to keep each country’s reality in mind and to prioritize the most relevant areas in a national context when creating the national MPI. This measure complements income poverty measurement. The use of both measures allows a precise diagnostic of poverty. The MPI is more than just a measurement instrument as it allows us to understand the determinants of poverty. This is a valuable tool because it supports both institutional management and public policy design. Accordingly, we encourage countries that are embarking on the MPI process not to use it only to understand poverty but also as a technical tool to improve the quality of social policies.
The fight against poverty in the current administration has set in motion the coordinated actions of the state’s institutions through the creation of inter-institutional and intersectoral responses to this problem. The joint interaction of the different actors who are responsible for the social development and provision of aid to the most vulnerable populations has been gradually achieved. Also, the public-private collaboration with Horizonte Positivo shows that involving the private sector is the correct decision when seeking to accelerate progress in the fight against poverty.
34 Engaging relevant stakeholders
The non-profit, civil society sector, which may include NGOs, activists, social movements, faith-based groups, advocacy groups, trade unions and others, often includes many actors who are already fighting disadvantages of many types hence have insights relevant to developing a national MPI. For example, if there are participatory activities or consultations with poor people and their communities about how the national MPI should be structured, NGOs are often involved in facilitating these activities. If the national MPI builds on existing participatory work rather than initiating new studies, the government often seeks the advice of sectors of the civil society that work in the areas of the MPI, because they know poor people’s realities up close and their voice gives legitimacy to the new MPI. Hence, is important to reach out and invite civil society actors to meetings, workshops and seminars, to solicit inputs and to explain findings. This may also require more personal approaches to key people or movements.
Engaging the “protagonists” of poverty, meaning those living in poverty, is essential when developing a national MPI. In many cases, this means direct participatory work to validate the structure for the national MPI, as has been done in countries such as El Salvador and Panama. In other countries, engagement with the poor has meant seriously considering an existing vibrant literature and involving key community leaders in the process. Sometimes, as in Bhutan, ground reality checks, which include focus group discussions and small surveys in different communities, are used to validate or introduce needed changes to the proposed national MPI (National Statistic Bureau Royal Government of Bhutan, 2013). In some places, MPI analysis is shared with these communities using infographics, visuals and materials translated into local languages, so they too can see their level and composition of poverty in comparison with others. Discussions of strategies to empower poor persons individually and collectively to fight their deprivations are also vital as empowerment can be highly cost effective. In any case, such interactions help those designing the measure put a human face onto the numbers, to listen where it matters and to speak with authenticity. This is good for the long-term sustainability of the measure and helps to communicate this new conception of poverty.
Civil society
Poor people and their communities
“Engaging the “protagonists” of poverty, meaning those living in poverty, is essential to developing a national MPI.”

35 How to Build a National Multidimensional Poverty Index (MPI)
Box 2.4. Defining MPI dimensions through participation: The case of El Salvador
Source: Excerpt of an article published in Dimensions magazine, issue 1, 2016.
In 2009, El Salvador began the process of creating its national MPI. A central issue was how to choose the dimensions that would best reflect what Salvadorian society considers to be the core aspects of poverty. After internal discussions and revisions of the literature, the advisory board leading the process, chaired by the Technical and Planning Secretariat of El Salvador and UNDP, moved to checking the data available in the country.
The Multi-Purpose Household Survey (EHPM is its Spanish acronym) was the main source of data, but it lacked information on relevant topics such as health or security. There was a gap between the proposed components of the MPI and the available survey data. This gap could only be remedied by changing and adding to the EHPM those questions for which there were sufficient resources and political will. It was decided then to promote a participative process with the “protagonists”—the population living in poverty—to learn how to adjust the survey questionnaire. This qualitative study was intended to inform policy actors about poverty using the words of people living in poverty themselves.
A series of 23 focus groups were conducted in 2012 with residents of 20 communities living in poverty. Different focus groups convened adults, children, community leaders and women. In total, about 250 people collaborated. Study areas were identified using the Map of Poverty and Social Exclusion, a tool that was used to define the settlements and squatter homes that were more vulnerable.
One of the factors that made the process was collaboration with a civil society organization, TECHO, which helped carry out the focus groups. This organization is dedicated to working with vulnerable communities in El Salvador, so its members already had the trust of the people from the different at-risk populations. This community work ensured that people would not feel intimidated when talking about their lives. No poverty dimensions were identified in advance, as the goal was to let these become apparent naturally in the course of the conversation.
Once the groups were finalized, the analysis allowed the identification of the deprivations most deeply felt by the Salvadorian population and the categories or dimensions that were most frequently repeated in the different groups. The next step was to provide a technical translation, meaning constructing questions to be included in the EHPM that would capture these privations.
“Look at what I eat”, “see where and how we live”, “there is no work here”, “worse if we get sick”, or “if I had been educated” are some of the powerful phrases that marked the analysis and informed the indicators to be used in the national MPI. While many underlying aspects of poverty were expected, dimensions of violence and outdoor spaces for community and leisure also surfaced strongly and were eventually included. As a result of this exercise, around 70 new EHPM questions were tested in the field by two pilot tests in 2013. The final indicators to be included in the MPI were chosen based on their success in those tests, their priority for the people and their statistical robustness. In the end, 20 indicators were included in the MPI, organized into five dimensions of poverty.
By offering capacity development for technical computations and disseminating the MPI’s findings through their networks, international donors can provide valuable support for the development of a national MPI. Engaging these actors, who also support interventions, can strengthen the poverty reduction agenda and help ensure the sustainability and policy uptake of the measure. The support of international donors and agencies has varied across countries. In some cases, they have supported the process with funds, communications products and with country and policy expertise, all of which are extremely relevant when designing and implementing a new poverty measure.
International community

36 Engaging relevant stakeholders
Generating credibility among stakeholders
Statistical capacity and independence
The MPI or any other indicator cannot succeed without having a high degree of credibility. Since poverty measures can become politicized quickly, it is crucial that the national MPI is trusted and that its process has been legitimized.
The quality of the results of the national MPI directly depends on the quality of the survey used to calculate the index. Rigor of analysis is essential to obtaining accurate and credible MPI estimations that the wider public will trust. It is vital that the statistical office and the technical team working directly with the data are independent from political parties and policymakers. This increases the credibility of the figures and helps gain support from other political parties.
In this sense, the team or institution delivering the MPI figures to all stakeholders should be independent and have a good reputation. Whether this team is under the presidency, within any ministry, in parliament or an independent body, the technical team should be able to compute and release MPI figures without changing any single number due to political pressure. This needs to be said, because it is not uncommon for such political pressure to arise in subtle ways. If statistical authorities fail, even once, to be impartial, their credibility is virtually destroyed.
To avoid these issues, several countries have opted to release not only the final figures but also the microdata and syntax used for the computations, so that anybody who wants to can replicate the official numbers.
Normally the national MPI is used to measure poverty and to guide social policy. This requires engaging actors embedded in political processes. It is sometimes believed that official statistics are not subject to political considerations, but as Nobel Laureate Angus Deaton has observed, “there is (usually) no measurement without politics” (Deaton, 2014). Given this reality, the national MPI should be institutionalized in such a way that the measure is less likely to be manipulated for political purposes. At the same time, it must be acknowledged that politics permeates every step of the process of designing a national MPI and that this is a positive thing, because the pressure and impatience of political leaders facing elections can be a powerfully constructive energy driving poverty reduction.
Depending on the context, institutional arrangements can take many forms and be guided by multiple political realities. In particular, there are some key issues that should be considered when discussing the institutions necessary for the MPI to become a sustainable measure. The first issue is the source of data used to compute the MPI. The survey used to compute the MPI needs to have high quality data. The questions used for the MPI must be implemented in a consistent and comparable way, using a reliable sample, with a known frequency, and in such a way as to produce good quality data. This requires a stable budgetary allocation and sufficient capacity across all aspects of sample design, survey design, enumerator training, data entry, cleaning and publication. Ideally, the data could be “open data”, which are publicly available so that many persons could study poverty and perhaps (at no additional cost) find or verify high-impact pathways or critically important bottlenecks.
The second key issue is to define which institution will have the authority to estimate, validate, finalize and release the MPI figures and create the information platform. In some countries, the national statistics institute takes this role; in other contexts, it may be an independent institution, such as
An institutional arrangement for the national MPI

37 How to Build a National Multidimensional Poverty Index (MPI)
CONEVAL in Mexico (see box 1.2.), or a ministry, such as the ministry of social development or finance. In addition, this institution will be in charge of data management. The MPI estimations are ordinarily calculated using a program such as Stata, SPSS, R, SAS or even Excel. Once the design of the MPI has been authorized, the final computational files need to be kept together with the data used, all analyses, electronic files and technical notes, so that when the next dataset is available—after one, two or three years, normally—the previous results can be replicated, and new estimations undertaken swiftly and easily.
The Agenda 2030 will naturally need to have a formal institutional link to the MPI, and how SDGs are reported is the third key issue to consider. Target 1.2 is unique because it is the only SDG indicator for which national governments are custodian agencies. This means that, unlike any other SDG indicator, the government will have to proactively work to ensure that the MPI and its disaggregated data are communicated to the supporting agencies (UNDP, UNICEF and the World Bank) in the correct format and at the correct time.
In the event that multiple institutions are involved in the process of designing, computing and analyzing an MPI, conventions for inter-institutional coordination must be fashioned. For example, if the national institute of statistics gathers data but another group estimates the MPI, then the timeline and mechanism of exchanging data must be clarified. This key issue is also related to ensuring that an institutional agreement of computing the national MPI is sustainable over time. In practice, stakeholders are usually convened during the design phase, but institutional cooperation can weaken progressively as tasks become routine. Even after the official MPI launch, it is necessary to continue the discussion of the results and how those results can influence policies. In addition, the dissemination and implementation functions remain dynamic and in need of continuous improvement.
Finally, institutions should participate in a methodological revision, which is recommended once every ten years. The MPI indicators, dimensions, weights and cut-offs will need to be examined to see if they are still the best possible ones to guide policy. New indicators may be required, new data may be available, or even a complete re-thinking of the measurement’s structure may be undertaken. Furthermore, occasionally some interim methodological changes may be necessary for one of two reasons. Either (1) the original survey did not include all indicators (e.g., habitat and social networks in Chile), so revisions to the method were planned from the start; or (2) it may be that one indicator seems problematic. In any of these three cases—the ten-year “checkup” or the orderly survey change or the indicator adjustment—the methodological revisions must be done in such a way as to maintain the credibility of the measure. Part of the institutionalization process requires establishing which body or institution has the power to authorize these occasional methodological revisions. It is also important to have very clear conventions. If the MPI is changed, then, in the year that the change is made, both the old MPI and the new MPI must be computed and reported, so that there is no break in the series.
“Normally a national MPI is used to measure poverty and guide social policy. This requires engaging actors embedded in political processes.”

38 Engaging relevant stakeholders
The multidimensional nature of the MPI requires engaging with a wide variety of actors and sectors, as support from relevant stakeholders, including opposition political parties, academia, civil society, the private sector, and, of course, the poor can strengthen the credibility of the measure and the impact that it has on poverty.
However, the process of gaining support from these various stakeholders can be one of the most difficult stages in the development of a national MPI, as it often relies on the development of personal relationships and the bridging of differences in pursuit of a common goal. It is important to involve high-level authorities such as ministers, the president, the vice president or the prime minister, and to get support from stakeholders inside and outside the government. It also implies finding a leader or champion, who will oversee the interactions between the technical and political aspects of the process of developing the national MPI. Engaging with different actors and transmitting the right information is fundamental to establish political buy-in. This can be achieved only with a targeted and comprehensive communications strategy that builds support across sectors and actors.
Conclusions
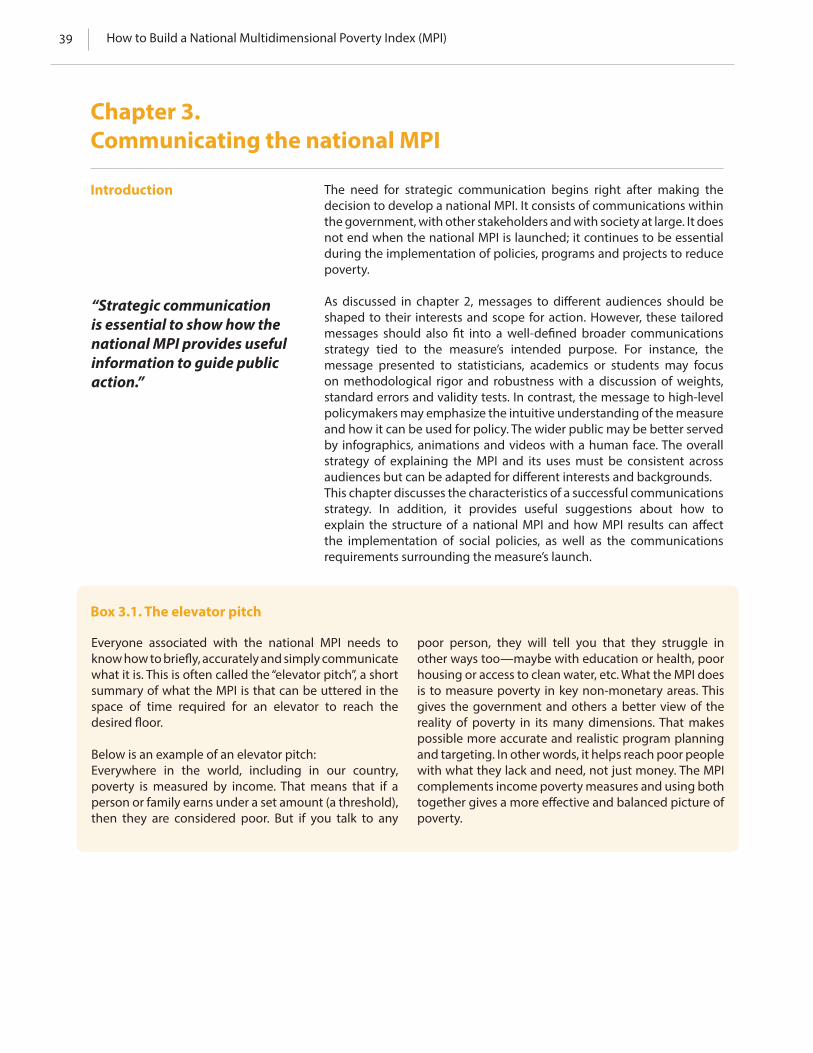
39 How to Build a National Multidimensional Poverty Index (MPI)
Chapter 3. Communicating the national MPI
The need for strategic communication begins right after making the decision to develop a national MPI. It consists of communications within the government, with other stakeholders and with society at large. It does not end when the national MPI is launched; it continues to be essential during the implementation of policies, programs and projects to reduce poverty.
As discussed in chapter 2, messages to different audiences should be shaped to their interests and scope for action. However, these tailored messages should also fit into a well-defined broader communications strategy tied to the measure’s intended purpose. For instance, the message presented to statisticians, academics or students may focus on methodological rigor and robustness with a discussion of weights, standard errors and validity tests. In contrast, the message to high-level policymakers may emphasize the intuitive understanding of the measure and how it can be used for policy. The wider public may be better served by infographics, animations and videos with a human face. The overall strategy of explaining the MPI and its uses must be consistent across audiences but can be adapted for different interests and backgrounds.This chapter discusses the characteristics of a successful communications strategy. In addition, it provides useful suggestions about how to explain the structure of a national MPI and how MPI results can affect the implementation of social policies, as well as the communications requirements surrounding the measure’s launch.
Box 3.1. The elevator pitch
Introduction
Everyone associated with the national MPI needs to know how to briefly, accurately and simply communicate what it is. This is often called the “elevator pitch”, a short summary of what the MPI is that can be uttered in the space of time required for an elevator to reach the desired floor.
Below is an example of an elevator pitch:Everywhere in the world, including in our country, poverty is measured by income. That means that if a person or family earns under a set amount (a threshold), then they are considered poor. But if you talk to any
poor person, they will tell you that they struggle in other ways too—maybe with education or health, poor housing or access to clean water, etc. What the MPI does is to measure poverty in key non-monetary areas. This gives the government and others a better view of the reality of poverty in its many dimensions. That makes possible more accurate and realistic program planning and targeting. In other words, it helps reach poor people with what they lack and need, not just money. The MPI complements income poverty measures and using both together gives a more effective and balanced picture of poverty.
“Strategic communication is essential to show how the national MPI provides useful information to guide public action.”

40
Three communication plans should be created when producing a national MPI. Each strategy covers one specific stage of the process. The first communication plan must be implemented during the design of the MPI. Another should be prepared for the launch of the MPI (chapter 10), and the last communication plan should cover the period after the launch and work to keep the MPI in the public discourse and to show how the MPI is providing useful information to guide public action. The three plans can be part of a general communication strategy, but it is critical to prepare different tools to communicate each of the stages of the process. In addition, it might be helpful to design an evaluation form to analyze how successful each plan was in order to make revisions if necessary.
The overall communications strategy determines what channels to use depending on the audience. A president is unlikely to be convinced of the MPI’s usefulness via a social media campaign, while academics are unlikely to be convinced through a national popular radio broadcast. Some channels are more efficient to communicate certain messages and approaches:
• The print media is important for broad messages to the public. An editorial endorsement from an influential daily can be particularly helpful. This usually requires a one-on-one meeting or an extensive interview with an editor or with someone who has access to the editorial page of the newspaper.
• Radio is an excellent medium for general audiences but can also be more targeted, depending on the type of show and the region in which it is broadcast.
• Well-targeted media interventions through key friendly media channels may be more effective than press releases sent en-masse to journalists who may or may not respond. Yet press releases, particularly in advance of the launch of the MPI, may help generate broader media attention from more diverse outlets (see chapter 10 for more details on launch communications).
When developing a comprehensive communications strategy, it is necessary to consider the appropriate timeline. These vary considerably. In general, it is advisable to communicate with the political leaders from the beginning and wait to announce the MPI to the public until it is fully developed. Engaging academics, as well as giving radio and television, may be useful for building support for the MPI.
Those who produce the main poverty figures (the statistical office, the ministry of planning or social development, or even international experts, etc.) should clearly explain the measure and the results to the main political leaders (president, prime minister and the minister leading the process). A similar process should happen with the media. Before releasing figures officially, it is advisable to explain to leading media organizations what a national MPI is, how the MPI differs from monetary poverty figures and how the results of the MPI should be interpreted. That way, when the MPI is launched, the reporting is likely to be more accurate.
Communicating the national MPI
Communications strategy
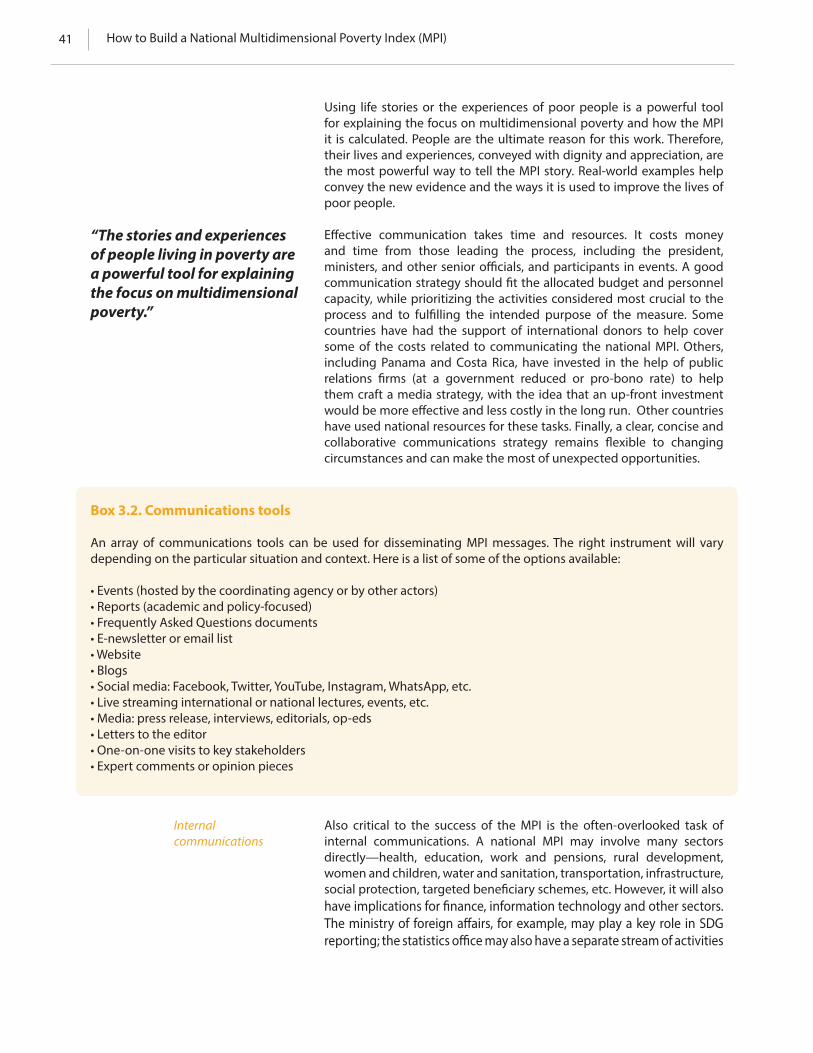
41 How to Build a National Multidimensional Poverty Index (MPI)
Box 3.2. Communications tools
An array of communications tools can be used for disseminating MPI messages. The right instrument will vary depending on the particular situation and context. Here is a list of some of the options available:
• Events (hosted by the coordinating agency or by other actors) • Reports (academic and policy-focused) • Frequently Asked Questions documents• E-newsletter or email list• Website • Blogs• Social media: Facebook, Twitter, YouTube, Instagram, WhatsApp, etc.• Live streaming international or national lectures, events, etc.• Media: press release, interviews, editorials, op-eds• Letters to the editor• One-on-one visits to key stakeholders• Expert comments or opinion pieces
Using life stories or the experiences of poor people is a powerful tool for explaining the focus on multidimensional poverty and how the MPI it is calculated. People are the ultimate reason for this work. Therefore, their lives and experiences, conveyed with dignity and appreciation, are the most powerful way to tell the MPI story. Real-world examples help convey the new evidence and the ways it is used to improve the lives of poor people.
Effective communication takes time and resources. It costs money and time from those leading the process, including the president, ministers, and other senior officials, and participants in events. A good communication strategy should fit the allocated budget and personnel capacity, while prioritizing the activities considered most crucial to the process and to fulfilling the intended purpose of the measure. Some countries have had the support of international donors to help cover some of the costs related to communicating the national MPI. Others, including Panama and Costa Rica, have invested in the help of public relations firms (at a government reduced or pro-bono rate) to help them craft a media strategy, with the idea that an up-front investment would be more effective and less costly in the long run. Other countries have used national resources for these tasks. Finally, a clear, concise and collaborative communications strategy remains flexible to changing circumstances and can make the most of unexpected opportunities.
Also critical to the success of the MPI is the often-overlooked task of internal communications. A national MPI may involve many sectors directly—health, education, work and pensions, rural development, women and children, water and sanitation, transportation, infrastructure, social protection, targeted beneficiary schemes, etc. However, it will also have implications for finance, information technology and other sectors. The ministry of foreign affairs, for example, may play a key role in SDG reporting; the statistics office may also have a separate stream of activities
Internal communications
“The stories and experiences of people living in poverty are a powerful tool for explaining the focus on multidimensional poverty.”

42
Box 3.3. A communications strategy template
related to SDG reporting in collaboration with a UN agency; and the local areas development group or a group focused on minorities, conflict-affected areas or vulnerable populations may also have overlaps. As discussed in chapter 2, mapping these groups is useful when designing the MPI, but even if some are not directly involved in MPI design, communicating the MPI and its potential value-added to their own work plan is essential. If powerful leaders have concerns about the MPI, these must be listened to, understood and responded to accurately so that the most effective strategy for fighting poverty emerges. A dedicated and responsive internal communications strategy is thus required to complement the outward-facing strategy.
With a steadily increasing number of official national MPIs, there is now a growing body of knowledge on the MPI and how to communicate it. A country beginning the process of developing its own national MPI can learn from other countries’ experiences and get guidance on developing and implementing a communications strategy. To that effect, the MPPN website (www.mppn.org) is a rich source of information on the experiences of many countries that have developed their national MPIs.
Additional communications resources
Following the development of the strategy, put together an action plan to implement it, with dates and events.
Source: OPHI communications team.
Communicating the national MPI
1. Overall program/project objectives2. Communications objectives3. Target audiences4. Key messages for each target audiences5. Communications tools and activities
External Communications- Media- Online- Social Media- Print and audiovisual materials- Advertising- Public Relations- Others
Internal Communications- Face-to-face meetings- Conference calls- Seminars/workshops- E-mail- Intranet- Print and audiovisual materials
6. Resources/budget7. Timeline8. Evaluation
The following list indicates the main sections of a communications plan for a national MPI. Separate plans might be developed for the MPI design phase, the launch and the implementation, as their audiences are likely to be different. More communications resources for the launch are discussed in chapter 10.

43 How to Build a National Multidimensional Poverty Index (MPI)
A compact but powerful communications strategy will promote a greater awareness and understanding of multidimensional poverty and of the MPI as a relevant and useful policy tool. A good communications strategy will use the MPI process to energize the action and commitment of people, both in government and in other parts of society, to confront human suffering. It can also help to prevent misalignment, misunderstanding or missed opportunities for synergy.
Communications help drive the conversation in the public arena in which the MPI is debated, launched and implemented. A strong communications strategy is then a vital component of any effective national MPI process and should be considered with care from the beginning.
Conclusions


45 How to Build a National Multidimensional Poverty Index (MPI)
Section II. Technical process
Alongside the more policy-oriented processes—such as establishing the purpose, the political buy-in and a communications strategy—is the technical process of creating a national MPI. Three main areas are vital to guaranteeing the sustainability of a national MPI: technical correctness, political usefulness and administrative sustainability. Naturally, the technical and policy processes are interlinked; there is a need to have a back and forth conversation between the technical team and the steering committee at several points in time. However, when and how these “conversations” occur varies between countries. This section covers the entire technical process of designing a national MPI; it also signals points at which input from the policy process is especially useful.
Any estimation of poverty figures needs to address two basic stages—identification and aggregation (Sen, 1976). Identification refers to the process of classifying people in the society as poor or non-poor according to certain criteria. Aggregation refers to the mechanism for bringing together the information for each individual into one summarizing statistic. In the context of multidimensional poverty, the process of designing the national MPI usually advances through the following steps:
1. Select the purpose.2. Select the space of the measure.3. Select the unit(s) of identification and analysis.4. Select the dimensions and indicators.5. Set the deprivation cut-offs for each indicator.6. Set the weights for each dimension/indicator. 7. Set the poverty cut-off.8. Computation of the incidence and intensity of poverty, and of the MPI.
The first seven decisions are part of identifying who is poor and who is not, and should have a strong normative basis to reflect what poverty really means and what the priority areas are. The last step is the aggregation stage—taking the individual profiles of deprivation to the aggregate level through the computation of the incidence, intensity and the MPI.
Countries have used a diverse range of criteria for making these decisions. In many instances, national development plans and legislation are used. In these cases, the measures’ indicators and dimensions mirror the priorities articulated there, so that the MPI is aligned with and monitors progress toward national priorities. Countries also usually conduct public consultations and hold discussions with expert groups such as national statisticians, academics, technical experts from each sector, and other national and international experts. In addition, participatory exercises or consultations are held with those living in poverty. Sometimes international standards, including the SDGs, are considered. These various insights are then triangulated and drawn together by the lead agency and technical group.
Throughout the process of measurement design, the technical team and policymakers are to be in direct and regular contact. The purpose of the measure should guide both the normative discussions and the technical decisions. The normative choices about the structure of the measure should reflect the context and priorities of the country, whereas technical inputs address issues such as data availability, indicators that are possible, robustness to a range of weights and cut-offs, and accuracy.
This section of the handbook starts by briefly introducing the method that underlies the MPI—the Alkire-Foster (AF) method (chapter 4). It then explores three main tasks that the technical team needs to undertake and provides details about how to complete each of these tasks. The first task is exploring potential indicators (chapters 5 and 6). The second task is to create candidate measures for the final national MPI to identify the measure that works best and presents the most robust results (chapter 7).The third task is to conduct rigorous analyses of changes over time based on the MPI, the poverty rate, intensity and trends in each component indicator—nationally and by subgroups (chapter 8). After the measure is designed and computed, the final step is to present the national MPI to
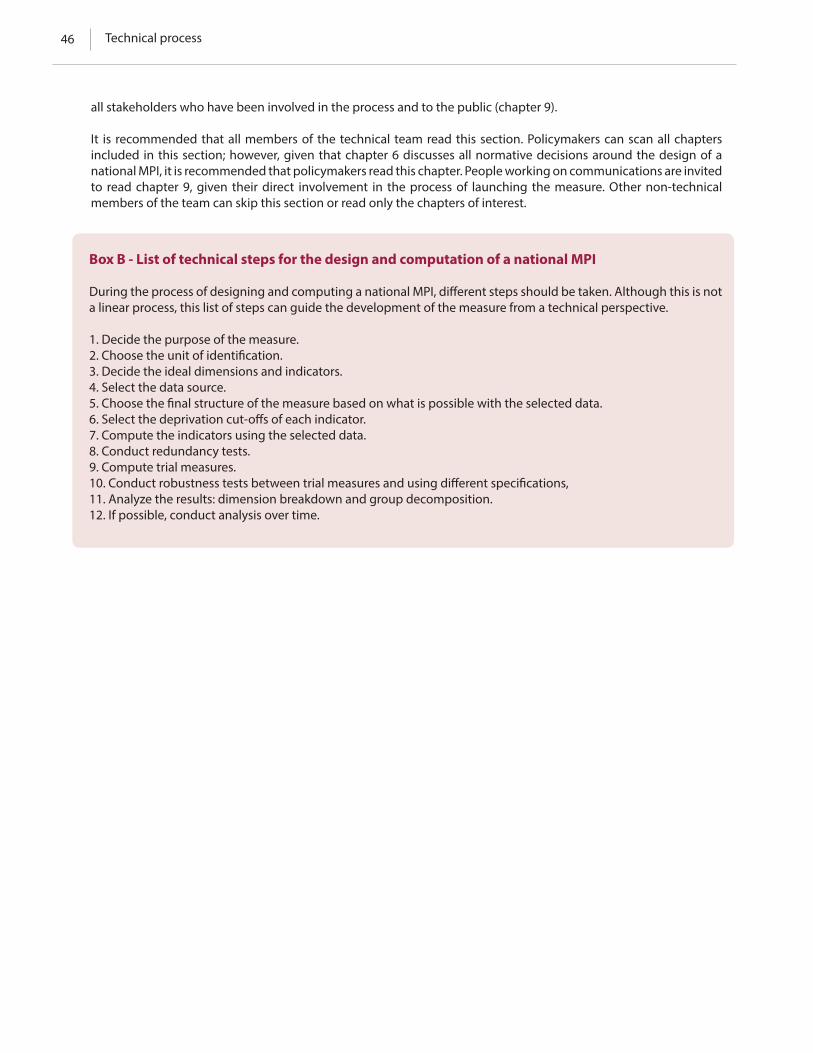
46 Technical process
Box B - List of technical steps for the design and computation of a national MPI
During the process of designing and computing a national MPI, different steps should be taken. Although this is not a linear process, this list of steps can guide the development of the measure from a technical perspective.
1. Decide the purpose of the measure.2. Choose the unit of identification.3. Decide the ideal dimensions and indicators.4. Select the data source. 5. Choose the final structure of the measure based on what is possible with the selected data.6. Select the deprivation cut-offs of each indicator.7. Compute the indicators using the selected data.8. Conduct redundancy tests. 9. Compute trial measures. 10. Conduct robustness tests between trial measures and using different specifications,11. Analyze the results: dimension breakdown and group decomposition.12. If possible, conduct analysis over time.
all stakeholders who have been involved in the process and to the public (chapter 9).
It is recommended that all members of the technical team read this section. Policymakers can scan all chapters included in this section; however, given that chapter 6 discusses all normative decisions around the design of a national MPI, it is recommended that policymakers read this chapter. People working on communications are invited to read chapter 9, given their direct involvement in the process of launching the measure. Other non-technical members of the team can skip this section or read only the chapters of interest.

47 How to Build a National Multidimensional Poverty Index (MPI)
Chapter 4. The Alkire-Foster method1
This chapter provides a systematic overview of the multidimensional measurement method developed by Alkire and Foster (2011a), the AF method, with an emphasis on the first measure of that class: the adjusted headcount ratio or M0. The measure M0 is widely known as a multidimensional poverty index (MPI). This particular method was commended by the Commission on Global Poverty led by Sir Tony Atkinson as an appropriate method for measuring global non-monetary poverty. It is also the method used by the UNDP and OPHI in the global MPI, and by many national governments for their national MPIs, which are reported as Indicator 1.2.2 in the SDGs.
From a technical perspective, the AF measures satisfy several desirable properties, some of them detailed in this chapter. From a practical perspective, the AF family of measures uses an intuitive counting approach to identify the poor and explicitly considers the simultaneous deprivations that people experience. Among the AF measures, the MPI is particularly appealing due to its ability to use ordinal data (including categorical or binary) rigorously, as well as the intuitive nature of the measure and its associated components. The discussion in this chapter will highlight the technical and practical advantages of the MPI that make it a particularly attractive option for informing policy.
It is worth noting from the beginning that the AF method is a general framework for the measurement of multidimensional poverty, though it is also suitable for measuring other phenomena (e.g. empowerment, happiness, etc.), as discussed later in this chapter. The AF method is a measurement framework that each user must fill in with their own specifications. This framework requires that each country or user defines the purpose and the space of the measure and selects the unit of identification, dimensions, indicators, deprivation cut-offs (to determine when a person is deprived in an indicator) weights (to indicate the relative importance of the different deprivations) and poverty cut-off (to determine when a person has enough deprivations to be considered poor). The flexibility of the AF method makes it easy to adapt in diverse contexts.
This chapter first describes how the AF method identifies people as poor using a “dual-cut-off” counting method, building on a long tradition of counting approaches that have been used in policymaking (Alkire & Foster, 2011a; b; Alkire et al., 2015). The aggregation method builds on the unidimensional axiomatic poverty measures and directly extends the famous Foster–Greer–Thorbecke (FGT) class of poverty measures (Foster et al., 1984). The focus of this section is the adjusted headcount ratio, M0 or MPI, which reflects both the incidence and the intensity of poverty, capturing the joint distribution of deprivations. The chapter shows how to break down the MPI to unfold the
Introduction
1This chapter is based heavily on Alkire, S., Foster, J., Seth, S., Santos, M. E., Roche, J. M. & Ballon, P. (2015) Multidimensional poverty measurement and analysis. Oxford: Oxford University Press.
“The Alkire and Foster method is a measurement framework that each user fills in with their own specifications.”

48
distinctive partial indices that reveal the intuitive results and layers of information embedded in the summary measure, such as poverty at subgroup levels and its composition by dimension or indicator. The presentation here straightforward; for a more technical description of the AF method, see annex 1.
The first step when using the AF method is to create a deprivation profile for each individual (or household). For each of the indicators included in the MPI, the achievement of the individual is compared to the respective deprivation cut-off and the individual is classified as deprived or non-deprived. For example, one starts by examining whether the individual has adequate sanitation, access to drinking water, access to health services, if all children attend school, if adults have decent work, etc. The set of indicators is flexible and can be adapted to the context in which poverty is being measured.
Weights (which must add up to one, or 100 percent) are applied to each of the deprivations, which are then summed so that each person has a deprivation score that gives the weighted percentage of deprivations they experience. People are then identified as multidimensionally poor if the weighted sum of their deprivations is greater than or equal to the poverty cut-off—which might be, for example, 20 percent, 33 percent or 50 percent.
After identifying each person as poor or non-poor, the information is aggregated into two informative indices.
• The incidence of poverty (H), which is the proportion of people identified as multidimensionally poor, also referred to as the “headcount ratio”. It is the percentage of people out of the total population whose weighted deprivation score is greater than or equal to the poverty cut-off.
• The intensity of poverty (A), which is the average proportion of indicators in which poor people are deprived—the average deprivation score across all poor people.
The M0 or MPI is computed as the product of these two components [MPI = H x A]. This method not only identifies who is poor but also innovates by incorporating how acute or intense the situation of multidimensional poverty is for the poor.
The MPI can be read as the percentage of deprivations that poor people experience out of the total deprivations that would be experienced by the society if all people were deprived in all indicators simultaneously. While the headcount ratio (H) is familiar, easy to understand and often used for media communications, the MPI is the main official measure for most countries. There are two main reasons this is the case. First, the MPI goes down if a very poor person improves in one deprivation even if they remain poor. This sounds academic, but it is significant because the MPI often goes down faster than the headcount ratio. For example, Nepal halved its MPI statistically significantly between 2006 and 2014, but it did not halve its poverty rate. This added speed reflects actual gains for the poorest of the poor. It is ethically right to include it because it gives
The AF class of poverty measures
The Alkire-Foster method
“After identifying each person as poor or non-poor, the information is aggregated into two informative indices: the incidence of poverty and the intensity of poverty.”

49 How to Build a National Multidimensional Poverty Index (MPI)
policymakers an incentive to reach the poorest and leave no one behind. Second, only the MPI can be broken down by indicator to show how people are poor. The headcount ratio or incidence—although the more familiar statistic—does not have either of these two features. Yet, even though the MPI is the official statistic, media reports and presentations can—and often do—profile the headcount ratio of multidimensional poverty, unless the MPI tells a different story.
AF measures have some very useful properties. Prime among them is population subgroup decomposability, which says that the MPI, H, A and each indicator can be disaggregated by any group for which the data are representative. This is a key priority for the SDGs. In practice, if the MPI is disaggregated to show subgroup poverty levels, then these add up, using population shares, to the national figures. This feature has proven to be of great use in analyzing poverty by regions, by gender, by age and by other relevant subgroups.
Another useful property of the AF measures is dimensional breakdown. Put simply, the MPI is made up of many indicators and it can be unfolded, very precisely, by exactly these same indicators. More specifically, MPI is H x A, but another way you can compute MPI is to take the share of people who are poor and are deprived in each indicator (e.g., 20 percent in health, 30 percent in education, 10 percent in work), multiply these by their weights (e.g. one third each), and the “answer” is the MPI (in this example, MPI = 0.200). This property allows the composition of multidimensional poverty to be analyzed. For example, Alkire & Foster (2011a), after decomposing overall poverty in the United States by ethnic group, break poverty within those groups down by dimensions and show how different ethnic groups have different deprivations—Latinos are, for example, more deprived in health and African Americans in education. Therefore, we can understand how each indicator contributes to poverty nationally and to the poverty of different groups. In practice, this information is used, as section III elaborates, for many of the MPI-related policies.
Suppose one is interested in analyzing the multidimensional poverty of a hypothetical society along four indicators: hectares of land, years of schooling, body mass index (BMI) and access to improved sanitation. The 4x4 matrix X contains the achievements of the four people in the four indicators.
Relevant properties of the AF measures
Example of the AF method
“Each MPI indicator can be disaggregated by any group for which the data is representative; facilitating poverty analysis by region, gender, age and other. “

50
Achievement matrix
For example, person 3 has four hectares of land, while person 4 has eight hectares. Person 1 has completed 14 years of schooling, while Person 2 has completed 13 years of schooling. Person 3 has a BMI of just 17. Two people in our example have access to improved sanitation. Thus, each row of matrix X contains the achievements of each person in each of the four indicators.
The deprivation cut-off vector is denoted by z = (5, 5, 18.5, has access to improved sanitation) and is used to identify who is deprived in each indicator. For instance, a person who has not completed five or more years of schooling is considered deprived in education. Similarly, a person is deprived in sanitation if she does not have access to improved sanitation in her home. By comparing the individuals’ achievements with the indicators’ deprivation cut-offs, we construct the deprivation matrix g0, where a cell has the score of 1 if the person (row) is deprived in the indicator (column), and a score of 0 otherwise. For ease of interpretation, all achievements that are below the corresponding deprivation cut-off in matrix X are underlined; those entries are now replaced by 1 (i.e. deprived) in the g0 matrix.
The Alkire-Foster method
X =
7 14 19 Yes Person 1
3 13 19.5 No Person 2
4 3 17 No Person 3
8 1 22 Yes Person 4
z = 5 5 18.5 Yes
Hectares of landYears of
schoolingBMI
Access to improved sanitation
“The MPI is made up of many indicators and it can be unfolded, very precisely, by these same indicators.”

51 How to Build a National Multidimensional Poverty Index (MPI)
Deprivation matrix
All indicators are equally weighted at one quarter, and thus the weight vector is w = (0.25, 0.25, 0.25, 0.25). We then apply these weights to the deprivation matrix to obtain the weighted deprivation matrix (g0). The weighted sum of the deprivations is the deprivation score (ci) of each person. For example, the person 1 has no deprivations and so the deprivation score is 0, whereas person 3 is deprived in all indicators and thus has the highest deprivation score of 1. Similarly, the deprivation score of the second and fourth people are 0.5 (0.25 + 0.25) and 0.25, respectively.
g0 =
0 0 0 0 Person 1
1 0 0 1 Person 2
1 1 1 1 Person 3
0 1 0 0 Person 4
w = 0.25 0.25 0.25 0.25
Hectares of landYears of
schoolingBMI
Access to improved sanitation

52
So, who is poor in this society? A poverty cut-off, denoted by k, is used to identify who is poor. For example, if k is 0.50 or 50 percent, then a person is poor if she is deprived in half or more of the weighted indicators (if her deprivation score is 0.50 or higher). In this case that would mean that two of the four people are identified as poor (i.e. persons 2 and 3). The poverty cut-off could be set to include two special cases—union and intersection identification, but, in practice, an intermediate value usually is used. The union identification approach identifies a person as poor if they are deprived in at least one indicator. Thus, three of the four people (persons 2, 3 and 4) in this example are identified as multidimensionally poor based on the union approach, which takes a poverty cut-off of 0.25 or 25 percent. In turn, the intersection approach requires a person to be deprived in all indicators at the same time to be considered multidimensionally poor. That means using a poverty cut-off k equal to 1 or 100 percent. In this case, only one of the four people would be identified as poor based on the intersection approach (person 3). All national MPIs to date have used an intermediate value for the poverty cut-off rather than an intersection or union approach.
Once the poor have been identified, the weighted deprivation matrix is censored to focus only on the deprivations of the poor—that is, deprivations of people who were identified as non-poor are replaced with a zero. This leads to the censored deprivation matrix (g0(k)) and the censored deprivation score in which every deprivation belonging to a non-poor person is set to zero. In the example below, we chose a poverty cut-off k of 0.50.
Weighted deprivation matrix
The Alkire-Foster method
g0 =
0 0 0 0 0
0.25 0 0 0.25 0.5
0.25 0.25 0.25 0.25 1
0 0.25 0 0 0.25
Hectares of landYears of
schoolingBMI
Access to improved sanitation
Deprivation score, ci

53 How to Build a National Multidimensional Poverty Index (MPI)
g0 =
0 0 0 0 0
0.25 0 0 0.25 0.5
0.25 0.25 0.25 0.25 1
0 0.25 0 0 0.25
Censored deprivation matrix
There is one case in which censoring is not relevant: when the poverty cut-off corresponds to the union approach. In this case, any person deprived in any indicator is considered poor. Therefore, no censoring is needed and both the censored and the original matrix are identical.
As explained above, the headcount ratio H is the proportion of people who are poor, which is two out of four people in the above matrix. That is, H = 2/4 = 1/2. This means that 50 percent of the people in this example are multidimensionally poor.
The intensity A is the average deprivation share among the poor, which in this example is the average of 0.5 and 1 (i.e. the deprivation scores of the two people who are poor, persons 2 and 3). That is, A = 75 percent. Thus, multidimensionally poor individuals are deprived in 75 percent of weighted indicators, on average.
The MPI can then be obtained as the product of the incidence and the intensity of poverty. That is, MPI = H x A = 50% x 75% = 0.375. Usually H and A are written as percentages, but the MPI is written as an index, usually with three digits, like 0.375. In this example, the MPI means that multidimensionally poor people experience 37.5 percent of the total deprivations that would be experienced if all people were deprived in all indicators at the same time.
g0(k=0.5) =
0 0 0 0 0
0.25 0 0 0.25 0.5
0.25 0.25 0.25 0.25 1
0 0 0 0 0
Hectares of landYears of
schoolingBMI
Access to improved sanitation
Censored deprivation score, ci(k)
“The MPI can facilitate understandings of how each indicator contributes to poverty nationally and the poverty of different populations.”

54
Box 4.1. Other applications of the AF method
Sources: https://www.horizontepositivo.org/ipmesitiodeayuda/
The Alkire-Foster method
Applications of the AF method are rapidly increasing. Though most applications are related to multidimensional poverty measurement (either national MPIs or child-specific measures of multidimensional poverty), other adaptations exist to measure well-being, women’s empowerment, happiness and so on. Three specific examples are presented here.
Bhutan’s Gross National Happiness (GNH) Index
Bhutan’s GNH Index is a multidimensional measure of well-being that goes beyond the traditional subjective characterizations and considers the multidimensional and collective nature of well-being. The GNH Index is an official measure and policy tool, meant to orient the people and the nation towards happiness and well-being.
The GNH Index uses the AF method and analyzes performance across 33 indicators grouped within nine dimensions or domains: psychological well-being, time use, community vitality, cultural diversity, ecological resilience, living standards, health, education and good governance. Each of the 33 indicators, in turn, has a threshold or sufficiency level. All of the nine domains are equally weighted, as they are all considered to be equally important for happiness, though the individual indicators receive different weights.
The GNH Index identifies people as happy if they have sufficiency in 66 percent or more of the (weighted) indicators. Actually, the government reports a “happiness gradient” that has three cut-off points (50 percent, 66 percent and 77 percent) to classify people into four groups depending on their degree of happiness: (1) people who have achieved sufficiency in less than 50 percent of the domains are “unhappy”, (2) those with sufficiency in 50–65 percent of domains are “narrowly happy”, (3) those with sufficiency in 66–76 percent of domains are “extensively happy” and (4) those with sufficiency in 77 percent or more of domains are considered “deeply happy”.
The GNH index is used extensively for both project and program planning as well as to measure the GNH growth and to analyze changes over time nationally, by district and by indicator. It is also based on individual scores and thus is analyzed by gender and age.
Women’s Empowerment in Agriculture Index (WEAI)
The WEAI is a multidimensional index based on the AF method that measures the empowerment, agency and the inclusion of women in the agriculture sector. It was launched in 2012 by OPHI, the United States Agency for International Development (USAID) and the International Food Policy Research Institute (IFPRI).
The WEAI tracks women’s engagement in agriculture in five areas: production, resources, income, leadership and time use. It also measures women’s empowerment relative to men within their households, providing a more robust understanding of gender dynamics within households and communities.
The WEAI was developed to track changes in women’s empowerment levels that occur as a direct or indirect result of the US government’s global hunger and food security initiative, Feed the Future.

55 How to Build a National Multidimensional Poverty Index (MPI)
The AF method uses a counting approach to identify the poor and considers the joint distribution of deprivations. The first step to constructing an MPI based on this method is to create the deprivation matrix, which represents individual deprivations in different indicators. The deprivation score, representing the weighted sum of deprivations of each individual in a society, is then calculated. After this, individuals with a deprivation score higher than the poverty cut-off (k) are identified as multidimensionally poor. Using this information, a censored deprivation matrix is created, and a censored deprivation score is calculated for each individual. The incidence (H) and intensity (A) of poverty and the MPI (H x A) are calculated by aggregating this information over individuals.
Conclusions
Business MPI
In August 2017, Costa Rica launched the Business Multidimensional Poverty Index (bMPI), developed by the Horizonte Positivo Association with the technical support of OPHI. Costa Rica is the first country in the world to use the MPI in the business sector.
The bMPI is an adaptation of the MPI for the business sector that measures the living conditions of employees and their families in a number of priority dimensions for the country: housing, education, health, work and social protection, in addition to including a financial situation section.
The bMPI consists of an online survey, easy to use and fill out, that provides detailed information to the employer about the living conditions of their employees and their families at all levels in the company. Results are being used by companies to develop interventions to assist employees identified as multidimensionally poor by the bMPI.

56
Chapter 5. Designing the national MPI
While the previous chapters describe the conditions necessary to ensure that the national MPI is a legitimate and sustainable measure, this chapter moves to normative choices that need to be considered in order to ensure that the measure is technically robust.
The development of a national MPI using the AF method implies making the following decisions:
1. Select the purpose.2. Select the space of the national MPI.3. Select the unit(s) of identification and analysis.4. Select the dimensions and indicators.5. Set the deprivation cut-offs for each indicator.6. Set the weights for each dimension/indicator. 7. Set the poverty cut-off.
In this chapter, we explore each of these decisions and how normative choices interact with technical requirements to guide the process of designing and computing a national MPI.
The design of a national MPI should be guided by the purpose of the measure, keeping the specific context of each country in mind. As discussed in chapter 1, national MPIs can have different purposes depending on the context—for example, monitoring poverty, policy coordination and targeting. To date, most countries have designed and calculated measures in order to monitor multidimensional poverty, guide and coordinate public policies, and complement existing income poverty statistics. There may be, of course, other purposes, such as tracking environmental indicators, the welfare of certain vulnerable groups, or indicators related to peace or freedom. Chapter 1 provides a detailed discussion of the purposes of national MPIs, with examples from many countries.
The so called “space” of any measure relates to how poverty is measured. One may think of the space of resources, of inputs, of access to services, of outputs or the space of functionings and capabilities.
Following Alkire et al. (2015) some measures might choose the space of functionings and capabilities described by Sen (Sen, 1979). According to Sen, functionings are the beings and doings that people value and have reason to value (e.g. being healthy), and capabilities are the freedoms to achieve valuable functionings. This approach would then mean that indicators included in the national MPI would focus on activities and
Introduction
Purpose of the national MPI
Space of the measure
Designing the national MPI
“The ‘space’ of any measure relates to how poverty is measured.”

57 How to Build a National Multidimensional Poverty Index (MPI)
states of being that people actually achieve. However, not all measures choose to use the space of capabilities. For instance, Mexico framed its six non-monetary dimensions as “social rights” based on its Constitution. Others might relate them to local conceptual frameworks such as Ubuntu. A regional measure of UNDP in Eastern Europe and Central Asia termed theirs a “Social Inclusion” index. Whereas when the index is focused on children, indicators may be interpreted in relation to the “Convention on the Rights of the Child”.
Going beyond outcome-related concepts, some MPIs that are primarily monitoring tools focus on inputs or outputs because these are an intermediate yet vital space that can eventually lead to capability expansion. In practice, it can be helpful to consider the chosen indicators in the MPI and see how you might relate them to a common space.
The “unit of identification” refers to the level at which deprivations are measured, while the “unit of analysis” refers to how the results are reported and analyzed. The unit of identification and analysis might be a person, a household, a region or an institution. They may be the same, but it is not necessary.
Poverty measures usually use the individual or the household as the unit of identification, and nearly always use the individual as the unit of analysis. Using the person as the unit of identification means that any individual-level deprivations—for example, in nutrition, schooling or employment—are recorded for each person separately. This allows for clear comparisons by gender, age, ethnicity and other relevant individual characteristics. With individual unit of identification, one can analyze intra-household inequalities, such as differences between the levels of education of girls and boys, or employment participation for men and women.
As the MPI requires a complete deprivation profile for each unit, information on all indicators must be available for each person and come from the same source of data. However, most existing data sources used for poverty measurement do not have information for all individuals or for all the indicators usually selected for national MPIs. An alternative, then, is to use the household as the unit of identification. In this case, household members’ information is taken together and combined into household-level deprivations. Thus, all members are equally deprived or non-deprived in each indicator and are equally identified as poor or non-poor. This implies that individual-level indicators like schooling or nutrition are combined across household members.
Most national MPIs use the household as the unit of identification. This is not only due to data limitations: it is often argued that there may be “sharing and caring” among household members. For example, a person who lives in a household where no one is literate or educated may find themselves in a very different situation than a person who is the only uneducated household member, because other household members can read their letters or bills. Also, the sharing of resources within households has been found to be considerable and households—and not individuals—are the main beneficiary units of many governmental programs.
Units of identification and analysis
“The ‘unit of identification’ refers to the level at which deprivations are measured; ‘unit of analysis’ refers to how the results are reported and analyzed.”

58
However, it is normal for the unit of analysis to be the individual, even if the unit of identification is the household. That is, one usually reports the percentage of people who are identified as poor rather than the percentage of households, while the unit of identification might remain the household. This is particularly important as poor households tend to have more members (Ravallion & Bidani, 1994). Reporting poverty at the household level could hide the real level of poverty in the population and be less useful, for example, for public expenditure planning where the precise number of poor people matters.
A key step in the development of a national MPI is to decide the structure of the measure—that is, the dimensions and indicators that together measure poverty in the country. The indicators are the fundamental components of the MPI; they should capture deprivations in functionings that define poverty, according to the purpose of the measure. Dimensions are conceptual groupings of indicators that are used to communicate the final measure. National MPIs are estimated based on indicators (which reflect variables in a dataset), but all countries with existing national MPIs have presented their indicators grouped into dimensions.
There may be a variety of arguments supporting the choice of dimensions and indicators to include in a national MPI. Dimensions and indicators might, for instance, represent the categories or goals of national development plans (as was the case in Colombia and Pakistan). They might follow specific legislation (as happened in Mexico) or international conventions (e.g., the Declaration of the Rights of the Child or the SDGs). Other countries, such as El Salvador and Panama, used participatory processes and public consultations to identify the main needs of the poor and translated them into indicators. Others choose dimensions and indicators based on relevant literature, theoretical arguments or by following international or regional examples. Most use a combination of multiple criteria to select the most relevant dimensions and indicators to be included into the MPI as suggested by Alkire (2007).
Decisions related to which data source will be used to compute the MPI will affect the possible list of indicators. If the MPI will use an existing survey or data source, it is normal first to create an exhaustive list (or “universe”) of all the relevant indicators that could be made using the existing survey. If the chosen dataset and associated questionnaire is longstanding but has yet to be fielded during the year of the national MPI’s design, it may be worth considering if there are important indicators to be included in the MPI that would benefit from adjustments to the questionnaire. Finally, if a completely new survey is to be designed and fielded, the dimensions and indicators that are deemed to be highest priority should be included in the measure (see chapter 6). In all cases, it is important to design a universe of possible indicators. The universe of indicators can show all possible indicators that can be made from the survey that are possibility relevant to an MPI, where relevance can also be guided by consultations or participatory approaches. The list can be used to guide discussions on dimensions and indicators that are feasible and relevant for a country.
Dimensions and indicators
How to select dimensions and indicators?
Designing the national MPI
“In all cases, it is important to design a universe of possible indicators.”

59 How to Build a National Multidimensional Poverty Index (MPI)
Although the initial perception may be that the list of the dimensions and indicators is too long, there is emerging agreement on common aspects to be included in a national MPI. While it is true that these vary between countries, most countries with national MPIs have selected a similar set of indicators to include in their national measures, adapting them to their national contexts. Table 5. 1 and table 5. 2 present a simplified grouping of the list of the dimensions and indicators included in some existing national MPIs. As shown in the table, indicators like school attendance, housing, water and sanitation are nearly universal. Others pertaining to childhood and youth conditions, the environment or social networks are included where relevant. It should be noted that the specific definition of the dimensions and indicators is, naturally, not exactly the same for every country.
Table 5.1. Dimensions included in some of the existing national MPIs
Dimension
Glo
bal M
PI
LAC-
MPI
Ara
b M
PI
And
hra
Prad
esh
Arm
enia
Bhut
an
Chile
Colo
mbi
a
Cost
a Ri
ca
Dom
inic
an R
ep.
Ecua
dor
El S
alva
dor
Hon
dura
s
Mex
ico
Moz
ambi
que
Nep
al
Nig
eria
Pana
ma
Paki
stan
Rwan
da
Viet
nam
Education a a a a a a a a a a a a a a a a a a a a a
Health a a a a a a a a a a a a a a a a a a a
Housing, living standards & basic services
a a a a a a a a a a a a a a a a a a a a a
Employment and social protection a a a a a a a a a a a a
Environment a a a a
Digital divide, networks and social cohesion
a a a
Child and youth conditions a
Source: authors’ elaboration based on official national reports available at https://www.mppn.org/
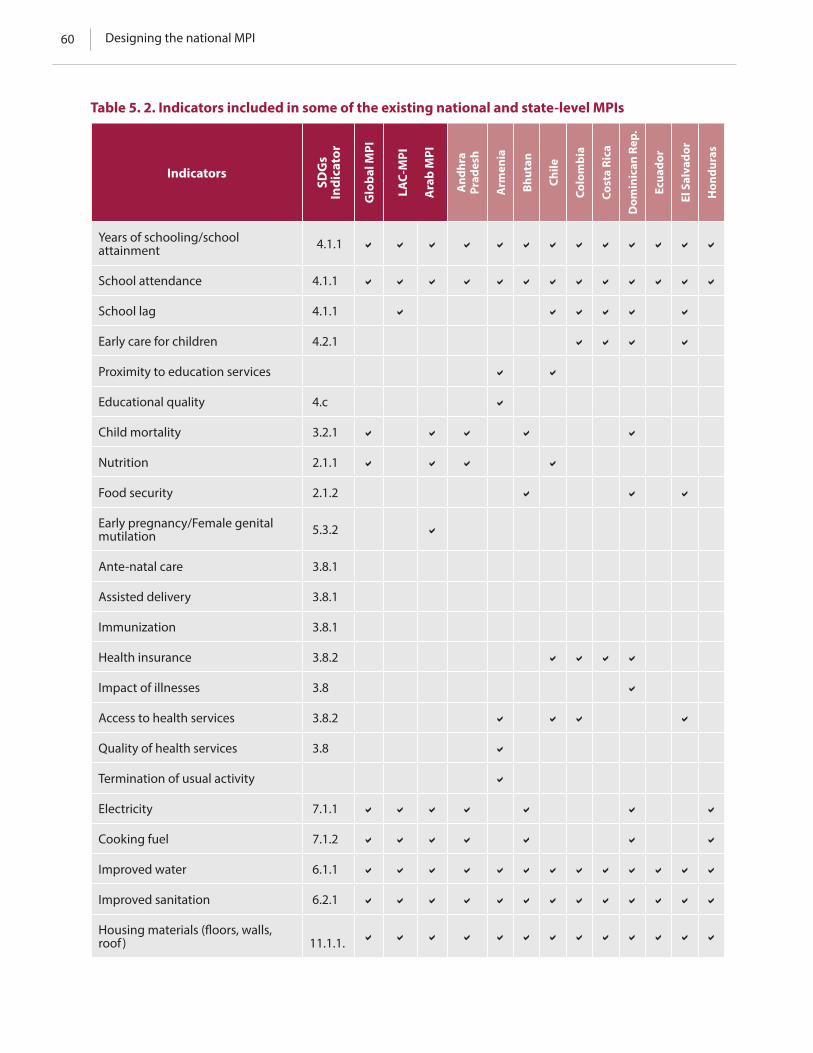
60
Table 5. 2. Indicators included in some of the existing national and state-level MPIs
Designing the national MPI
Indicators
SDG
s In
dica
tor
Glo
bal M
PI
LAC-
MPI
Ara
b M
PI
And
hra
Prad
esh
Arm
enia
Bhut
an
Chile
Colo
mbi
a
Cost
a Ri
ca
Dom
inic
an R
ep.
Ecua
dor
El S
alva
dor
Hon
dura
s
Years of schooling/school attainment 4.1.1 a a a a a a a a a a a a a
School attendance 4.1.1 a a a a a a a a a a a a a
School lag 4.1.1 a a a a a a
Early care for children 4.2.1 a a a a
Proximity to education services a a
Educational quality 4.c a
Child mortality 3.2.1 a a a a a
Nutrition 2.1.1 a a a a
Food security 2.1.2 a a a
Early pregnancy/Female genital mutilation 5.3.2 a
Ante-natal care 3.8.1
Assisted delivery 3.8.1
Immunization 3.8.1
Health insurance 3.8.2 a a a a
Impact of illnesses 3.8 a
Access to health services 3.8.2 a a a a
Quality of health services 3.8 a
Termination of usual activity a
Electricity 7.1.1 a a a a a a a
Cooking fuel 7.1.2 a a a a a a a
Improved water 6.1.1 a a a a a a a a a a a a a
Improved sanitation 6.2.1 a a a a a a a a a a a a a
Housing materials (floors, walls, roof )
11.1.1. a a a a a a a a a a a a a
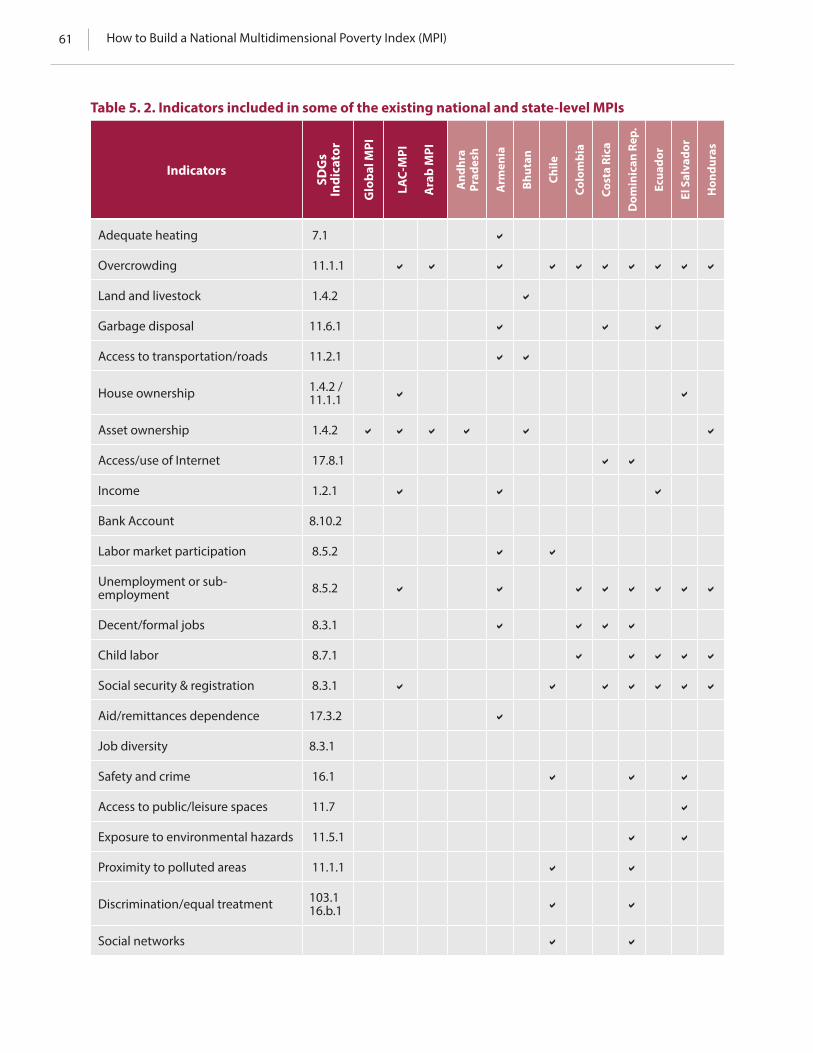
61 How to Build a National Multidimensional Poverty Index (MPI)
Table 5. 2. Indicators included in some of the existing national and state-level MPIs
Adequate heating 7.1 a
Overcrowding 11.1.1 a a a a a a a a a a
Land and livestock 1.4.2 a
Garbage disposal 11.6.1 a a a
Access to transportation/roads 11.2.1 a a
House ownership 1.4.2 / 11.1.1 a a
Asset ownership 1.4.2 a a a a a a
Access/use of Internet 17.8.1 a a
Income 1.2.1 a a a
Bank Account 8.10.2
Labor market participation 8.5.2 a a
Unemployment or sub-employment 8.5.2 a a a a a a a a
Decent/formal jobs 8.3.1 a a a a
Child labor 8.7.1 a a a a a
Social security & registration 8.3.1 a a a a a a a
Aid/remittances dependence 17.3.2 a
Job diversity 8.3.1
Safety and crime 16.1 a a a
Access to public/leisure spaces 11.7 a
Exposure to environmental hazards 11.5.1 a a
Proximity to polluted areas 11.1.1 a a
Discrimination/equal treatment 103.116.b.1 a a
Social networks a a
Indicators
SDG
s In
dica
tor
Glo
bal M
PI
LAC-
MPI
Ara
b M
PI
And
hra
Prad
esh
Arm
enia
Bhut
an
Chile
Colo
mbi
a
Cost
a Ri
ca
Dom
inic
an R
ep.
Ecua
dor
El S
alva
dor
Hon
dura
s

62 Designing the national MPI
Table 5. 2. Indicators included in some of the existing national and state-level MPIs
Indicators
SDG
s In
dica
tor
Mex
ico
Moz
ambi
que
Nep
al
Nig
eria
Pana
ma
Paki
stan
Phili
ppin
es
Rwan
da
Viet
nam
Years of schooling/school attainment 4.1.1 a a a a a a a a a
School attendance 4.1.1 a a a a a a a a
School lag 4.1.1 a
Early care for children 4.2.1
Proximity to education services
Educational quality 4.c a
Child mortality 3.2.1 a a
Nutrition 2.1.1 a a
Food security 2.1.2 a a
Early pregnancy/Female genital mutilation 5.3.2
Ante-natal care 3.8.1 a a
Assisted delivery 3.8.1 a
Immunization 3.8.1 a
Health insurance 3.8.2 a a
Impact of illnesses 3.8
Access to health services 3.8.2 a a a
Quality of health services 3.8
Termination of usual activity
Electricity 7.1.1 a a a a a a a
Cooking fuel 7.1.2 a a a a
Improved water 6.1.1 a a a a a a a a
Improved sanitation 6.2.1 a a a a a a a a
Housing materials (floors, walls, roof ) 11.1.1. a a a a a a a a

63 How to Build a National Multidimensional Poverty Index (MPI)
Source: authors’ elaboration based on official national reports available at https://www.mppn.org/ Notes: The grouping by dimensions presented in the table does not necessarily reflect the dimensions in which the indicators are included in each national MPI. For example, Colombia has a dimension of childhood and youth conditions, which includes child labor.
Table 5. 2. Indicators included in some of the existing national and state-level MPIs
Adequate heating 7.1
Overcrowding 11.1.1 a a a a a
Land and livestock 1.4.2 a
Garbage disposal 11.6.1 a a
Access to transportation/roads 11.2.1 a
House ownership 1.4.2 / 11.1.1 a
Asset ownership 1.4.2 a a a a a a
Access/use of Internet 17.8.1 a
Income 1.2.1 a
Bank Account 8.10.2
Labor market participation 8.5.2
Unemployment or sub-employment 8.5.2 a a
Decent/formal jobs 8.3.1 a a
Child labor 8.7.1 a
Social security & registration 8.3.1 a
Aid/remittances dependence 17.3.2
Job diversity 8.3.1 a
Safety and crime 16.1
Access to public/leisure spaces 11.7
Exposure to environmental hazards 11.5.1 a
Proximity to polluted areas 11.1.1
Discrimination/equal treatment 103.116.b.1
Social networks
Indicators
SDG
s In
dica
tor
Mex
ico
Moz
ambi
que
Nep
al
Nig
eria
Pana
ma
Paki
stan
Phili
ppin
es
Rwan
da
Viet
nam

64
Indicators can be classified into different groups: outcome/input/output, flow/stock, objective/subjective, for individuals/households (Atkinson et al., 2002; Atkinson & Marlier, 2010).
Flow indicators capture aspects of poverty that are sensitive to changes over time and quickly respond to changes created by social policies or programs (e.g. the employment rate). In contrast, stock indicators tend to capture aspects that are stable and are difficult to change with social policies (if at all). Flow indicators are usually preferable for a national MPI because they are better able to guide policymaking and show change in response to concrete interventions.
An indicator can also contain information related to the inputs of a process (e.g. number of schools in the area), the outputs (e.g. school attendance/years of schooling) or the outcome or final results of an intervention (e.g. knowledge). Any of these three types of indicators can be included in a national MPI, though their selection should be considered in light of the purpose of the measure.
In addition, indicators can capture subjective or objective information. In the case of subjective indicators, the aim is to provide information related to the perceptions of individuals about a specific situation (e.g., how they self-assess their health or whether they feel safe in their neighborhoods). On the other hand, objective indicators are associated with aspects that can be measured directly and are not affected by adaptive preferences (e.g. access to healthcare). Changes in objective indicators over time can be easily interpreted and linked to policy interventions more directly, so they are usually preferred for national MPIs.
Another way of explaining this is that indicators can capture four different aspects of the capability approach: (1) indicators can be designed to collect information related to resources a person has (e.g. having a bicycle), (2) indicators can capture capabilities that are related to the ability to do something (e.g. being able to ride the bicycle), (3) indicators can refer to a functioning (e.g. riding the bicycle), or (4) indicators can relate to the utility associated with an action (e.g. feeling happy about being able to ride the bicycle) (Sen, 1999).
Different types of indicators can be included in a national MPI. Given that this measure is usually used as a policy tool, one would want indicators that capture changes resulting from policies over time (flow), reflect the final impact of a policy (outcome) and are (objective) measures of those impacts. This being said, it is not always possible to use such indicators, and MPIs must sometimes include a mix of indicators within their country measures.
Although the inclusion of indicators depends on their normative importance, their statistical characteristics also play an central role in determining their suitability. Atkinson and Marlier (2010) suggest five criteria for selecting indicators to measure poverty and social exclusion: (1) normative considerations, (2) statistical validation, (3) comparability across diverse contexts (here, within countries), (4) the possibility of revision to improve the measurement over time and (5) the avoidance of
Types of indicators
Indicator design
Designing the national MPI

65 How to Build a National Multidimensional Poverty Index (MPI)
a large burden for countries. In addition to these criteria, in the process of selecting the indicators to be included in a national MPI, the following sections introduce other points to consider.
Identification or unit-level accuracy: Multidimensional poverty measures require that each indicator accurately identifies each person’s or household’s deprivations, with the objective that the joint distribution of deprivations is also accurate, on average. In this sense, each indicator should reflect the deprivation faced by each unit of identification across the relevant period and not simply the deprivations faced “on average”.
The selection of indicators may be influenced by the survey design, questionnaire and recall period. For example, questions about healthcare, food security or employment involve, in some cases, a short timeframe (e.g., the last week or two weeks), and the answer for that particular household might therefore not reflect the real situation of the household over the past year or two. Other questions that often have problematic reference periods include time use and consumption. In this context, the selection of indicators should balance indicator precision and unit-level accuracy with the objective of measuring individual or household achievements in the relevant period.
Indicator transformation to match the unit of identification: As already mentioned, all indicators included in a national MPI must be calculated using the same unit of identification (individual, household or regions). In cases where the unit of identification is the individual, indicators related to the household (and, in some cases, community) might be included in the measure. For example, Bhutan’s Child MPI, calculated using the child as the unit of identification, includes information related to walls and floor material at the household level to evaluate if a child is deprived in terms of living standards (e.g. lives in a household with inadequate walls and floors). The main assumption of this process is that all individuals inside a household are assigned the same level of deprivation in the household-level indicator.
In the opposite case, a national MPI using the household as the unit of identification needs to combine information on the education, health and employment achievements of all household members (for whom there is information) into one household-level indicator. For example, a household might be considered deprived if it has at least one member with insufficient years of schooling.
Unit of identification and applicable population: The applicable population refers to the group of people for whom an indicator is relevant and has been effectively measured. It is essential to always keep in mind what the applicable population is for each indicator included in the MPI. Many early errors in MPI estimation happen because this step is not carefully done. For instance, anthropometric indicators are usually collected for specific groups (such as children under five years of age and women of reproductive age). These indicators are not applicable to other population groups. Similarly, information on employment is only relevant for certain adults, and school attendance is only relevant for children of school-going age.
“Although the choice of indicators depends on their normative importance, statistical characteristics also play a central role in determining suitability.”

66
Depending on the purpose of the measure, the selection and definition of indicators can take one of three options: (1) include universally applicable achievements, (2) design poverty measures for specific groups or (3) combine achievements that are only applicable to specific subgroups and test the assumptions related to intra-household distribution. In the first case (universal measures), the measure would only include achievements applicable to the whole population (such as access to a clean source of drinking water or sanitation). Given data limitations, this can substantially reduce the set of possible indicators. In the second case, group-specific measures aim to capture achievement or deprivations of relevant groups (e.g. children, women or people with disabilities). This approach has important policy advantages, as these measures can provide accurate information specific to these groups and their needs. However, if the applicable population is a subgroup, it can no longer serve as a national measure to track multidimensional poverty. In addition, group-specific measures might miss possible overlaps between disadvantaged groups (e.g. women, people with disabilities and minority ethnic groups). Finally, combined measures use achievements from a subset of household members, making assumptions about how achievements are distributed among household members. These assumptions should be clearly stated and justified by available evidence and theory.
Most countries have used the third option, combined measures, to design their national MPIs. In doing so, they have rigorously addressed two practical challenges. First, some households do not have members within the applicable population for certain indicators. For example, households with no small children do not have any member with information on vaccinations; similarly, households with no school-aged children have no member with information on school attendance.
A first step is to ensure that the indicator is available for a sufficient percentage of households. In the examples just mentioned, immunization is often available only for children aged 0–5, and, because of demographic and household structures, many countries only have a small proportion of households with a child in that age bracket. Because of this, indicators on vaccinations are rarely used. In contrast, a much higher proportion of households have school-aged children, so the school attendance indicator is actually very common across present national MPIs. Still, how does one code a household with no school-aged child for the indicator of school attendance? Dropping all households with no applicable population for certain indicators could lead to biases in the estimation of poverty if the households with no information are not randomly distributed in the population. Thus, it is not recommended to drop these observations. In turn, dropping the indicator for this group of households and reweighting the other indicators included in the MPI would violate dimensional breakdown and compromise comparability. Households with no information could have their levels of deprivation imputed, but this would not represent a real deprivation, so would lead to spurious policy conclusions. When measuring poverty, one wants to measure actual deprivations rather than the likelihood of the household facing a deprivation if it had a member within the applicable population, as this speaks more to vulnerability than poverty. The normal alternative, then, is to consider households without applicable populations as non-
Designing the national MPI

67 How to Build a National Multidimensional Poverty Index (MPI)
Box 5.1. An example of how to create an indicator on child school attendance
When computing an indicator on school attendance, the following should be considered:
• Applicable population: school-aged children only. Households with no school-aged children have no member within the applicable population for this indicator.
• Deprivation for the reference population: a school-age child is considered deprived if not attending school. • Deprivation for the household: a household is considered deprived if at least one school-age child is not
attending school.
So, for instance, the syntax to create this indicator in Stata would be as follows:* First, identity the applicable population (for this example, children aged 5–15): gen school_age = (age>5 & age<15) if age!=.* Then, create an indicator considering the deprivation for the applicable population: gen d_attendance = (attendance==0 & school_age==1) replace d_attendance = . if attendance==. & school_age==.
* Then, identify households with no child within the applicable population:bys household_id: egen hh_schoolage = max(school_age) gen hh_no_applicable_pop = (hh_schoolage==0)
* Finally, compute the indicator at the household level:bys household_id: egen hh_d_attendance = min(d_attendance)replace hh_d_attendance = 0 if hh_no_applicable_pop==1
In this example, the normative decision made was to consider that households with no children within the applicable population are non-deprived in the indicator on school attendance. This decision could be different depending on the context.
deprived in that indicator. As there are no school-age children in the household, the household is not deprived in school attendance, so it is considered to be non-deprived.
A second situation occurs when data is missing or not collected for some household members, even though they are part of the applicable population. For instance, though nutrition is a relevant issue for every individual, household surveys may only cover children under five and women of reproductive age. Household members outside of these groups may not be measured for anthropometrics, and households with no small children or women in reproductive age will have no information on nutrition at all. Once again, a decision needs to be made about how to proceed in these cases. As described above, one option is to assume that these households are non-deprived, which is a conservative approach in that it may underestimate poverty levels if those for whom data are not collected are in fact undernourished.
As datasets are improving, these limitations are falling sharply and measures are becoming more accurate. In the meantime, special studies of omitted populations (such as children, the elderly or indigenous groups) can complement poverty figures obtained from the national MPI. For instance, in Colombia, an adaptation of the national MPI was computed for indigenous groups. This exercise provided a better understanding of the nature of poverty among indigenous populations, whose specific deprivations were not all captured in the national MPI (Departamento para la Prosperidad Social (DPS), N.S).

68
Assessing combined measures: Most existing MPIs are “combined measures” that bring together group-specific deprivations. A special issue needs to be considered when using combined measures—the household composition effect. In particular, when including indicators that refer to deprivations of only a specific population (e.g., children below age five), households with children are more or less likely to be classified as poor depending on their composition. For instance, if all indicators refer to deprivations that are relevant for children, households without children will automatically be identified as non-poor. Of course, this does not mean that group-specific indicators should not be included in the national MPI, but rather that there should be a balance of relevant populations.
Missing values: Another step that requires great care during the design of the MPI is the treatment of missing values as mishandling can result in errors. Some indicators with good normative support might have a large number of missing values due to measurement error. Fortunately, the percentage of missing values due to measurement error can easily be identified when computing the levels of deprivation for the applicable population. Remember: a measure based on the AF method can only be created using observations (individuals, households, etc.) that have information on all indicators included in the index. Therefore, this step is fundamental to minimizing the number of observations that are lost.
There are two ways of dealing with missing values. One is to drop the observations with missing values. That is, if the unit of identification is the household, households with a missing value in any MPI indicator are dropped from the sample and not considered when computing the index. The other option is to create a rule to assign a value for the missing data. For instance, if there is information for at least 50 percent or 75 percent of household members, then the observation is kept and the values of those household members for whom there is information are used. If there are not enough household members with information to reach that threshold, then the observation is dropped from the calculations.
The risk is that, if the observations with missing values are systematically different from those with observed values, the reduction in the sample will lead to a bias in the poverty figures, so it is important to assess whether dropping observations with missing values affects the results.2 In the case of deciding to drop observations with missing values, the reduced sample can still be used. However, this decision should be explicitly mentioned by the researcher, clearly stating whether the poverty estimate is likely to be a “lower” or an “upper” bound, based on the results of a bias analysis (Alkire et al., 2015). If the two results are not significantly different, then computations can proceed using the reduced sample without affecting the representativeness of the findings.
When the percentage of missing values is between 1 percent and 10 percent, it is necessary to analyze the real percentage of missing values at the individual and household level by checking whether the questions used were asked of only a specific group of individuals or if the questionnaire used some filters. It is imperative to use care when dealing with answers such as “do not know” or “does not answer”. Usually these answers are considered missing information, and it is a common mistake to fail to classify them as such.
Designing the national MPI
2 To assess whether the sample reduction creates biased estimates, the group with missing values is compared to the rest, using the indicators for which values are present for both groups. Statistical tests can be performed to see if the proportion of people deprived in the remaining indicators in the complete and reduced samples is statistically significantly different, or not.

69 How to Build a National Multidimensional Poverty Index (MPI)
Box 5.2. SDGs and Environment and Natural Resources (ENR) indicators to potentially integrate into a national MPI
The SDGs have several references to issues, dimensions and indicators of environmental degradation and environmental challenges. Almost every one of the 17 SDGs relates to the environment and/or poverty, as Thiry et al. (2017) point out.
Goal Targets/indicators (overview)
Goal 1 1.4. Equal right to assets
1.5. Exposure/vulnerability to climate-related events
Goal 2 2.1. Food security
2.3. Agricultural productivity
Goal 3 3.9. Illnesses from hazardous chemicals and air, water and soil pollution and contamination
Goal 4 4.7. Education for sustainable development
Goal 5 5.a Give women equal rights to assets
Goal 6 Water-related issues
Goal 8 8.8. Promote safe and secure work environments for all workers
Goal 9 9.9.1. Living within 2 km of an all-season road
Goal 11 11.5. Reduce the number of deaths and the number of people affected and substantially decrease the direct economic losses (…) caused by disasters
11.6. Reduce the adverse per capita environmental impact of cities
Goal 12 12.2. Sustainable management and efficient use of natural resources
Goal 13 13.1. Strengthen resilience and adaptive capacity to climate-related hazards and natural disasters in all countries
Goal 14 14.4. Effectively regulate harvesting and end overfishing
Goal 15 15.3. Combat desertification, restore degraded land and soil, including land affected by desertification, drought and floods
15.9. Integrate ecosystem and biodiversity values into national and local planning, development processes, poverty reduction strategies and accounts
Goal 17 17.18. Increase significantly the availability of high-quality, timely and reliable data disaggregated by income, gender, age, race, ethnicity, migratory status, disability, geographic location and other characteristics relevant in national contexts.
If the percentage of missing values in one indicator is between 10 percent and 15 percent, it is recommended that a bias analysis of missing values be conducted by analyzing if observations with missing values systematically differ from those with observed values (for more details see Allison (2001); Enders (2010)).
If the percentage of missing values is higher than 15 percent, it might be worthwhile to consider if other indicators could be created to capture the same or a similar deprivation and thus avoid using the problematic indicator. Even if the bias analysis reveals that the results are not biased, losing 15 percent of the sample might affect the sample’s representativeness.
Finally, after limiting the sample, the sampling weights may need to be adjusted so that the population shares of the original sample, particularly for subnational groups, are preserved in the retained sample. For a more detailed discussion of this issue, see Alkire et al. (2015).

70
Regardless of this mapping, several technical and political challenges need to be addressed in order to further develop and apply an ENR-MPI at national or global levels. First, data availability will constrain this effort as the surveys that are used to calculate the MPI cover ENR-related questions in a very limited way, if at all. These surveys could be amended to include more ENR data, though this would generate significant financial and time costs. Alternatively, other sources of data would have to be found, but this would imply important issues of data merging.
Second, the sample design becomes particularly relevant when integrating ENR data within the MPI methodology, as the heterogeneity of the ENR data is likely to follow different patterns to those of social data (Hein et al., 2006). This means that the criteria according to which the MPI data sampling is stratified (e.g. administrative boundaries such as provinces or districts) may not necessarily ensure that it captures important environmental heterogeneities and, hence, is representative of the ENR data.
Besides the sampling issues, it is crucial to ensure that the spatial, temporal and spectral resolution of the ENR data is fit for purpose and is compatible with that of the MPI data.
At a more conceptual level, the need to select indicators that are relevant across contexts may pose a greater challenge in the ENR dimension than in other dimensions, because the environment is very much context-specific. A measure that incorporates earthquakes and droughts may be more relevant in some countries, while a measure that incorporates hurricanes and floods may be more relevant in others.
However, the ENR-MPI could be more relevant at a national level with respect to tackling specific ENR-poverty nexuses, and, in some contexts, certain ENR variables have universal salience. Also, international comparisons could yet be made through the accurate calibration of the space of the measure, through the inclusion of capability deprivations caused by specific ENR-related sources into comparable categories (of the type as those provided in the framework of Thiry, Alkire and Schleicher 2016), and through the definition of relative measures (such as gaps between targets and actual situations).
Each of these challenges can be met and provide part of the advocacy agenda for affecting the broader agenda at the national and global levels. Each challenge will also need to be addressed if we want the ENR-MPI to live up to its significant potential to impact environmental and poverty policymaking.
Source: Thiry et al. (2017).
During the process of designing a national MPI, there is often the question of whether income or consumption should be included as an indicator. Having one integrated poverty measure that combines both monetary and non-monetary dimensions might be perceived as useful, especially if policymakers lack the time to process information from different indices that might show different figures and trends over time. However, there is a strong argument for keeping income poverty and multidimensional poverty using non-monetary dimensions as separate measures, as they reflect different types of poverty (Santos et al., 2015).
Different aspects should be considered and discussed between the technical team, policymakers and other relevant stakeholders when considering whether or not to include income as an indicator in the national MPI. These issues include:
• The purpose of the measure.• Phenomena that the national MPI aims to measure.• Matches and mismatches between monetary and multidimensional poverty.
Income as an indicator in a national MPI
Designing the national MPI

71 How to Build a National Multidimensional Poverty Index (MPI)
“It is important to acknowledge that monetary and non-monetary indicators capture poverty differently.”
• Measurement error of monetary indicators and its implications for a national MPI.• Sources of data available.
As argued previously, the purpose of the measure should guide all decisions in the process. In this sense, if the purpose of the national MPI is to complement existing income poverty statistics, the inclusion of income as an indicator in the national MPI might add noise. When a national MPI is built to complement existing monetary poverty figures, the precise aim is to go beyond the measurement of income and consumption, and expand the understanding of poverty by looking at non-monetary dimensions of poverty, which are not well captured by looking only at the purchasing power of a person or a family.
It is important to acknowledge that monetary and non-monetary indicators capture poverty differently. On the one hand, monetary indicators are usually known as indirect measures of poverty, because they focus on the lack of resources to acquire basic goods and services that increase the quality of life or wellbeing of a person (Sen, 1999). On the other hand, multidimensional measures based on non-monetary indicators are considered direct measures of poverty because they capture effective access to basic services, goods and opportunities. In this sense, the income method (if current income is used, which is the standard) captures cyclical income fluctuations related to the labor market, and that might affect the level of income of a household or an individual. On the other hand, non-monetary multidimensional poverty measures capture deprivations reflected in less volatile indicators such as poor housing, lack of access to basic services and poor education.
Thus, it is not surprising that, although both monetary and non-monetary measures of poverty aim to capture the same phenomenon, empirical studies have shown that their results are not as closely related. Indeed, monetary measures of poverty have been found to be imperfect predictors of non-monetary measures (Bader et al., 2016; Roelen, 2017; 2018; Roelen et al., 2009; 2012; Ruggeri et al., 2003; Wang et al., 2016). In the case of the Millennium Development Goals (MDGs), Bourguignon et al. (2010) found that there was no correlation between monetary indicators and non-monetary indicators when tracking progress in the MDGs over time. In Chile, an analysis of the mismatch between income poverty and the national MPI showed that, although 20.4 percent of the population was multidimensionally poor and 14.4 percent was income poor, only 5.5 percent were both income and multidimensionally poor (Ministerio de Desarrollo Social, 2015). These mismatches might be due to the fact that both measures (income and MPI) might actually be capturing different phenomena or differences in how each indicator is captured and calculated. Further research is needed to understand the causes of these mismatches and their policy implications.
It is also important to consider that the analysis of matches/mismatches between monetary and multidimensional poverty measures would become significantly harder if income was included as an indicator (and thus determinant in some degree) of multidimensional poverty status (Santos et al., 2015). It would thus be harder to see differences between groups and to provide clear policy recommendations.
“Analysis of the mismatches between monetary and multidimensional poverty measures become harder where income is included.”
72
A more technical issue is related to the potential measurement error of monetary measures. In the case of consumption indicators, questions usually use a mixture of recalls periods, including the year, month and week prior to the survey. Most questions use a seven-day recall period. When creating indicators to be included in a national MPI using a seven-day reference period, it is assumed that the consumption during that time represents the average consumption of a household. This is problematic because consumption can vary a lot across weeks, months or seasons, and it is quite sensitive to external factors (e.g., weather, holidays, illness). Poverty estimations based on this data might generate accurate estimates “on average” (i.e. for a country or a region) but not correct estimates at the household level. That is, there is no unit-level accuracy (Alkire et al., 2015). On the other hand, when using longer reference periods, problems of measurement error appear due to the longer recall period (Bound et al., 2001). With income data, the main difficulty is to obtain accurate data from all sources of income. In fact, usually there is an underreporting of income earned in housing or farming income. These indicators are also affected by the recall period used to collect questions. The greater the length of the recall period, the greater the recall error.
The main practical difficulty in integrating income deprivation into an MPI is that it typically implies giving up the inclusion of some critically important health indicators such as nutrition using biometric indicators and the experience of child mortality in the household. Surveys that collect high quality health indicators of nutritional status and child mortality (along with others) usually do not include income/consumption data and vice versa. This might lead to less accurate poverty measurement, as indicators such as child and women’s nutritional status can reveal intra-household distribution issues that will not be made explicit otherwise.
Box 5.3. Countries that currently include income as an indicator in their national MPIs
To the date, only three countries have included income in their national MPIs: Armenia, Ecuador and Mexico.
Mexico’s measure was launched in 2009 and included income as a dimension of poverty, with a weight of 50 percent. In this measure, a person is considered poor only if he/she is income poor and deprived in at least one non-monetary dimension. A person deprived in one to six social rights is not identified as poor unless they are also income poor (Consejo Nacional de Evaluación de la Politica de Desarrollo Social (CONEVAL), 2014). Thus, in Mexico, reducing income deprivation is by definition a requirement for eliminating poverty. No other country has followed this route.
In the case of Armenia, income is weighted at one twelfth and included within the dimension of basic needs as a proxy for food security. Here, low income is interpreted as indicating inadequate access to a minimum requirement of food, following the national monetary poverty measurement and UN Food and Agriculture Organization’s recommendations (Martirosova, Inan, Meyer, & Sinha, 2017).
Finally, in the case of Ecuador, income was added to the national MPI to compensate for the lack of information on health in the national survey used for the computations. It was understood that in this context income could be considered as a proxy of access to health care (Instituto Nacional de Estadística (INEC), 2015).
Designing the national MPI
“The practical difficulty in integrating income is that it typically implies giving up critically important health indicators.”

73 How to Build a National Multidimensional Poverty Index (MPI)
Deprivation cut-offs refer to the minimum level of achievement that a household or individual must have to be considered non-deprived in each indicator. For instance, the deprivation cut-off for years of schooling could be six years, so that a person is considered deprived if she has not completed at least six years of schooling. Similarly, the deprivation cut-off for nutrition could be having a BMI of 18.5 or above, as recommended by the World Health Organization (WHO). If a person is undernourished (i.e. BMI below 18.5), she is considered deprived in nutrition.
Setting deprivation cut-offs is a normative exercise. These decisions can be guided by international or national standards (such as the SDGs or national legislation on compulsory education), by the results of participatory or consultative exercises, or by targets included in national development plans. Ultimately, the deprivation cut-offs will reflect the purpose of the measure, data availability, the aspirations of poor persons and communities, the unit of identification and aspects of indicators design discussed in the previous section.
Something to consider is that, if the unit of identification is the household, deprivation cut-offs will need to be defined by combining information about different persons in the household—especially in the case of health, education and employment indicators. For example, in the case of years of schooling, a measure could consider information of household members in different ways. A household could be considered deprived if no adult has completed primary education (i.e. only one adult needs to have completed primary school for the household to be non-deprived), or the household could be considered deprived if any adult has not completed primary education (i.e. all adults must have completed primary education for the household to be non-deprived). Alternatively, the deprivation cut-off could require that both a woman and a man have completed primary education, or that half of the adults in the household have received a primary education. Empirical implementation and analysis of several definitions are useful to understand the patterns and select the most appropriate deprivation cut-off.
Deprivation cut-offs
Box 5.4. Creating the indicators for Ecuador’s national MPI
Source: Instituto Nacional de Estadistica (INEC) (2015).
Ecuador’s MPI includes 12 indicators distributed across four dimensions (education; employment and social security; health, water and nutrition; and habitat, housing and safe environment). It uses nested weights and classifies a person as multidimensionally poor if she is deprived in four or more of the weighted indicators. The household is the unit of identification. Therefore, all deprivations are calculated at the household level, even when they measure individual deprivations.
For example, in the case of education, the no school attendance indicator is calculated for school-aged children (5 to 17 years). For this indicator, children aged 5 to 14 are considered deprived if they do not attend primary school, and children between the ages of 15 and 17 are considered deprived if they do not attend high school. After considering the deprivation status of each individual child within this age range, households with school-aged children are considered deprived if at least one child is deprived (that is, if at least one child aged 5 to 17 is not attending school). Households without school-aged children are considered non-deprived in this indicator.
This process was conducted for all indicators in the dimensions of education and employment.
“Setting deprivation cut-offs is a normative exercise. Decisions can be guided by international or national standards, participatory or consultative processes.”

74
Some indicators use deprivation cut-offs that are set across sub-indices. For instance, in the case of housing, some countries might decide to create an indicator that combines information on the materials used for the roof, walls and floors. In this case, the deprivation cut-off would combine the information of these three variables into one threshold. The household could be considered deprived if poor quality materials were used in all three of the indicators for walls, floors and roof. Alternatively, a household could be considered deprived in housing if poor materials were used in any one of the three sub-indicators. The former is a less demanding threshold, while the second requires all roofs, walls and floors to have been constructed using good quality materials. A similar approach is used for assets, which are usually combined into a sub-index when included in the MPI. By using the union approach, however, one major disadvantage for policymakers occurs: the asset index cannot be disaggregated and the contributions of each sub-indicator to overall poverty cannot be calculated. Hence, policymakers cannot attribute improvements in the asset index to any of the sub-indicators.
The commitment to eradicate child multidimensional poverty in the 2030 Agenda for Sustainable Development has instigated a demand for child-specific multidimensional poverty measures.
Bhutan was the first country to develop a national Child Multidimensional Poverty Index (C-MPI), covering children from birth until 17 years old, and using the child as the unit of identification and analysis. The data was drawn from Bhutan’s Multiple Indicators Survey 2010 (BMIS 2010).
Bhutan’s C-MPI retains the three dimensions included in the national MPI (health, education and living standards) and adds a fourth dimension on childhood conditions. Twelve indicators are considered: two under the health dimension (child mortality and food security); one under the education dimension (investment in cognitive skills and school attendance); eight under living standards (electricity, sanitation, water, housing material, cooking fuel, assets, land ownership and livestock ownership); and one under childhood conditions (child conditions). Each of the dimensions is given an equal weight of 25 percent and each of the indicators is also equally weighted within dimensions with some internal groupings, showing the relative importance of deprivations to the overall C-MPI. The poverty cut-off that identifies a child as multidimensionally poor is 26 percent, which means that a child is considered multidimensionally poor if she or he is deprived in strictly more than one dimension. To capture relatively comparable deprivations across different age cohorts, two indicators have the following age-specific specifications: - Investment in cognitive skills and school attendance. A child is deprived if she or he:
- Ages 0–2: Does not have two or more toys, AND does not have three or more books, AND does not have adequate care.- Ages 3–5: Does not attend preschool/early childhood education, AND an adult member of the household did not engage with the child in four or more activities; OR any child 5 years does not attend preschool/early childhood education.- Ages 6–14: Is not attending school.- Ages 15–17: Is not attending school AND has not completed class VIII.
- Childhood Conditions.A child is deprived if she or he:
- Ages 0–4: Is malnourished.- Ages 5–14: Has to do a considerable amount of child labor.- Ages 15–17: Is pregnant (if the child is a girl), OR has a baby OR has experienced domestic violence, OR believes
Box 5.5. Building a Child MPI
Designing the national MPI

75 How to Build a National Multidimensional Poverty Index (MPI)
domestic violence is justified.
Despite some similarities in the design of Bhutan’s national MPI and C-MPI, household poverty and individual child poverty are defined independently. This allows the possibility of identifying poor children living in non-poor households, as well as non-poor children living in poor households. The second country to compute a child MPI was Panama, but it was the first country with an official child MPI. This measure was launched in September 2018 and has five dimensions and ten indicators. It is based on a human rights approach and uses the AF method to compute the levels of multidimensional poverty of girls and boys 17 years or younger. The selection of dimensions and indicators was the result of a long consultation process with communities, academics, civil servants and children. The Panama Child MPI uses a poverty line equal to 20%, thus a child is classified as multidimensionally poor when she is deprived in 20% or more or the weighted deprivations, or faces deprivation in two indicators. The measure uses the individual as the unit of identification, and indicators included in the dimensions of health, education and child protection have different deprivation cut-offs depending on the age group of the reference population (as in the case of Bhutan). For example, the following are the age specifications for health and education and information.
Health dimension: - Prevention of health risks: children younger than 5: vaccination; children 5 to 11: doctor and dentist appointments; and children aged 12 to 17: sexual health education.- Food variety younger than 6 months: exclusive breastfeeding and children 6 months and older: consumption of the five food groups. Education and information: - Education and child education: children younger than 3: early child stimulation; 3 to 4, children aged 4 to 6: regular school attendance and child activities; and children aged 7 years or more, school attendance and grade repetition. - Child protection: children aged 9 years or younger, birth registration and for children aged 10 to 17 years old, child labor.
Given that the Child MPI in Panama was computed used the Multipurpose Household Survey, which is the same survey use to measure income and household multidimensional poverty. It is possible to analyze the percentage of children living in multidimensionally poor household and income poor households. This information is fundamental to characterize the population of multidimensionally poor children in the country.
In order to allow a clear integration of the information obtained from the national MPI and the C-MPI, some countries are currently developing C-MPIs that are directly linked to their national MPIs, using the exact dimensions and indicators as those included in their national MPIs (defined at the household level), plus a “child” dimension that focuses on the child’s specific achievements. These measures use weights and poverty cut-offs that ensure that children living in multidimensionally poor households (by the national MPI) are also identified as poor based on the C-MPI. The analysis of this type of C-MPI expands the information drawn from a national MPI by allowing the identification of poor children living in non-MPI poor households as well as additional child deprivations carried by children living in MPI-poor households.
Source: Alkire et al. (2016), Ministerio de Economía y Finanzas et al. (2018), and Vaz et al. (forthcoming).

76
The definition of the deprivation cut-off for each indicator is a normative decision. However, the technical team needs to check how the available data reflect normative decisions. It may be helpful to create a large set of potential indicators, some of them closely related to each other but using different deprivation cut-offs. This is necessary to assess the sensitivity of measures to a change in deprivation cut-offs and also, in the case of uncertainty about which cut-off to choose, to clarify the implications of a choice to policy users.
Once the list of potential indicators has been created, it is possible to compute the uncensored headcount ratios (i.e. the proportion of people deprived in each indicator) for all indicators and to compare the different versions of the same indicator with different deprivation cut-offs. Indicators with slightly different deprivation cut-offs should have similar uncensored headcount ratios.
Before finalizing indicators into the national MPI, it is useful to run a preliminary analysis and understand the relationship between indicators. This might lead to dropping an indicator, to combining some indicators into a sub-index or to adjusting the categorization of indicators into dimensions.
To analyze potential indicators, one first essential test is to tabulate each of them by relevant groups (e.g. gender, regions, urban/rural areas, income quintiles, ethnic groups, age groups, etc.). If results are different from what would be expected, the technical team should check for possible reasons to explain why the observed levels of deprivation are not consistent with previous evidence. It is important here to ask questions such as: “How might assumptions influence the unexpected results?”, “Is this a new indicator that has never been explored before in this context?”, “Is this capturing a phenomenon that is more relevant for a specific group or area?” (e.g., land and livestock are more relevant in rural areas). Additionally, it might be useful to analyze if similar indicators with different deprivation cut-offs are telling a similar story when disaggregated by groups.
Another essential test is a redundancy test, which analyzes the interaction between indicators to determine if the indicators are capturing the same population. Thus, this redundancy test provides information to support the inclusion or exclusion of different indicators, or to combine the information of two or more indicators, in cases where indicators are highly redundant. However, this test is only informative, and normative decisions should always provide the underlying rationale for the MPI’s structure.
Analysis of potential indicators
Designing the national MPI
“Before finalizing indicators in a national MPI, it is useful to run a preliminary analysis and understand the relationship between indicators.”

77 How to Build a National Multidimensional Poverty Index (MPI)
Box 5.6. Redundancy analysis
Source: Alkire et al. (2015).
Before implementing any measure empirically, it is helpful to understand the indicators that may be entered into the measure. If different indicators are very highly associated, that does not necessarily mean that one of them needs to be dropped. It may be that they should both be retained for normative reasons, such as their respective relevance for policy implications. In any case, the analysis of redundancy would help clarify their justification and treatment.
The commonly used techniques to assess relationships between indicators are principle component analysis (PCA), multiple correspondence analysis (MCA), factor analysis (FA), cluster analysis, and confirmatory structural equation models, as well as simple cross-tabulations and correlations. However, for the MPI, Alkire et al. (2015) propose a measure of overlap or redundancy, R0, that provides clear and precise information for indicator selection.
This measure shows the matches between deprivations as a proportion of the minimum of the marginal deprivation rates. It ranges from zero to one, where zero signifies that no person who is deprived in one indicator is also deprived in the other, and one means that all people who are deprived in the indicator with the lower headcount ratio are also deprived in the other indicator If two deprivation measures are not independent, and if at least one of the headcount ratios is different from zero, then R0 is defined as
𝑅𝑅" = %&&''(
)*+(%-&'( ,%&-
' ) 0 ≤ R0 ≤ 1,
where is the percentage of people simultaneously deprived in any two indicators j and j’, is the percentage of people deprived in indicator j but not in indicator j’, and is the percentage of people deprived in indicator j’ but not in indicator j.
For instance, if R0 takes the value of 60 percent, this shows that 60 percent of the people who are deprived in the indicator having the lower marginal headcount ratio are also deprived in the other indicator. Redundancy between indicator pairs is presented in the same kind of table as correlations.
In practice, if any indicator has a very high headcount ratio, then its row or column in this matrix will normally be higher for the simple reason that there is a higher probability that people are deprived in that indicator. However, if two indicators have relatively low headcount ratios—for example 20 percent of people are undernourished and 20 percent are unemployed—then if the redundancy is 90 percent, then it would alert us to an unexpected relationship. In practice, if redundancy is high both in one period and over time, there might be an argument for dropping one of the two indicators, but this is not necessary—it needs to be normatively considered.
𝑃𝑃""##$ 𝑃𝑃"#
$$% 𝑃𝑃"#$$%

78
The next step is to define the weight of each dimension and indicator. Weights refer to the value that is given to indicators (and, by association, to dimensions) within the MPI. Weights, like dimensions, indicators, and cut-offs, are fixed over time. Setting weights plays a fundamental role in defining the relative importance of each deprivation in the final measure.
The selection of weights reflects normative judgments related to the purpose of the measure. If the objective is to evaluate changes in poverty levels, the weights should aim to reflect the importance of each indicator. On the other hand, if the MPI´s purpose is to monitor progress (in the short and medium term), weights might represent, to some extent, the priorities of the government in reducing deprivations (Alkire et al., 2015). In very general terms, different techniques to select weights can be found in the literature (Decancq & Lugo, 2010). But the weights for the MPI are different in kind from—and far simpler than—the weights in most composite indicators (Alkire et al., 2015 Chapter 6).
The selection of the weighting structure of a measure can be justified using normative arguments, but empirical tests of robustness are also essential. Normative arguments are related to the relative importance that policymakers or other stakeholders place on each indicator in the measure. Empirical arguments are associated with different statistical techniques, including regression analysis, frequency-based weighting and multivariate statistical weighting. Both types of arguments work together as neither is complete alone. In the case of normative arguments, these justifications are usually easy to understand and communicate to the public, and, once decisions have been made, the structure of the index remains stable over time, which brings credibility and sustainability. When the selection of weights is based on statistical methods, different aspects should be considered. Although these weights are considered as “objective” because they are the results of the data, the final results of the MPI are difficult to communicate to policymakers. For example, the final weighing structure of the index varies depending on the sample used and the method used to calculate the weights, which makes communication of the results of the MPI difficult. In addition, statistical weights depend on the data structure; because they analyze correlations between different indicators, which depends on the information collected in the survey, statistical weights change between surveys (Bartholomew et al., 2008; Manly, 2005). Therefore, the structure of the MPI will vary with every wave of the data and it will not be possible to track progress over time.
Participatory approaches may also be used to define the weighting structure of a national MPI. Although the use of these methods provides important information regarding the rankings that poor individuals give to their own deprivations, they can also be affected by personal preferences and situations (Clark, 2012). No country has yet used this approach to assign weights to different indicators. However, in Bhutan, participatory exercises were conducted after the design of the measure to validate the rank of deprivations used in the national MPI (National Statistic Bureau Royal Government of Bhutan, 2013).
In practice, countries with national MPIs have ordinarily used nested weights, departing from these in the case of reasoned and reasonable
Selection of the weights
Designing the national MPI
“Setting weights plays a fundamental role in defining the relative importance of each deprivation. Selection reflects normative judgments that relate to the MPI’s purpose.”

79 How to Build a National Multidimensional Poverty Index (MPI)
exceptions. Colombia, Ecuador and Armenia are examples of countries using a nested weights structure for their national MPIs. This structure gives the same weight to each dimension and weights each indicator equally within dimensions. In Costa Rica, where the same number of indicators are under each dimension, the nested weights structure is actually equivalent to using equal weights for all indicators. In Pakistan and Bhutan, dimensions are equally weighted, but some indicators within dimensions receive different weights for clearly specified reasons. In the case of Chile, four of the dimensions are equally weighted, while a fifth dimension receives a lower weight based on normative considerations.
The poverty cut-off k identifies those who are multidimensionally poor in at least k weighted indicators. The value of k reflects the minimum level of deprivations or deprivation score an individual or household must be suffering simultaneously to be considered poor. The setting of this poverty line needs to reflect the priorities and policy goals of the country. For example, if the purpose is to target resources to the poorest populations, the value of k must capture those who are facing the highest number of simultaneous deprivations. In turn, if the goal is to monitor poverty, k should reflect the minimum level of deprivations acceptable in a country to be considered non-poor.
Different approaches have been presented in the literature and in practice to define the poverty cut-off (Atkinson, 2003). As explained earlier, the union approach identifies people as multidimensionally poor if they experience at least one measured deprivation. This approach is an important tool when the purpose of the measure is related to advocacy, as it clearly identifies people facing any given deprivation and increases the visibility of poverty, because it identifies a larger number of people as poor. However, if the purpose is related to policy, this approach might overestimate the number of people or households who are multidimensionally poor, as a single observed deprivation might be in fact representing individual preferences. Also, as the number of total indicators included in the MPI increases, the likelihood of being deprived in just one of them also rises, increasing the national MPI. Finally, given that the union approach only uses one dimension to define who is or not poor, the multidimensionality of poverty can be lost. On the other extreme, the intersection approach identifies as poor only those individuals who are deprived in all the indicators simultaneously. This leads to low incidence rates as it only captures individuals who are extremely poor. In particular, as the number of indicators increases, the likelihood of being deprived in all of them at the same time will be very low.
As discussed in chapter 4, the AF method uses a dual cut-off approach, which sets a poverty line k that can range between 1 and the total number of indicators included in the measure. The dual cut-off includes the union and intersection approaches as specific cases, as well as intermediate poverty cut-offs (Alkire et al., 2015).
The poverty cut-off establishes who is poor, and, because this decision is pivotal but can be contested in plural societies, it is necessary to establish that changing the poverty cut-off slightly will not affect ensuing policy
Setting the poverty cut-off

80
recommendations. Robustness tests are used for this purpose, as will be covered in chapter 7. It is also important to understand under which conditions some intervals of k will identify the same proportion of the population as multidimensionally poor. For example, if there are five equally weighted indicators, then a poverty cut-off of 21 percent will identify the same set of persons as poor as a cut-off of 25 percent, 33 percent or 40 percent. Given these weights, any person who has at least two deprivations will be identified as poor by any poverty cut-off taking the value 20% < k ≤ 40%. Yet, if communication is a priority, then a poverty cut-off of 40 percent might be chosen, as it most intuitively conveys the fact that poor people are deprived in at least two out of the five indicators.
There is no universal rule for defining the poverty cut-off. Ordinarily, the poverty cut-off reflects the weighting structure of the index. For example, if there are three dimensions, it would be natural to explore cut-offs of 33 percent and 34 percent—which translate to being deprived in at least one dimension or deprived in more than one dimension or the equivalent of weighted indicators. Countries such as Pakistan, Ecuador and Honduras, like the global MPI, use two k values to identify those who are multidimensionally poor and those in severe multidimensional poverty (Instituto Nacional de Estadistica (INEC), 2015; Ministry of Planning et al., 2016; Secretaría de Coordinación General de Gobierno y El Instituto Nacional de Estadística (SCGG-INE), 2016). Colombia also explored the mean of weighted deprivation of households who identified themselves as poor (Angulo et al., 2015), while Bhutan opted for a poverty cut-off that classified a similar percentage of individuals as poor as the monetary poverty line (National Statistic Bureau Royal Government of Bhutan, 2013). In any case, the selection of the poverty cut-off is a normative decision that needs to be easy to communicate and statistically tested.
This chapter discussed the main steps that need to be taken when designing the structure of a national MPI. Each of these steps should be guided by the purpose of the measure and should aim to capture in the best possible way the realities of multidimensional poverty in the context in which the measure will be applied.
The next step is to select the source of information and then to calculate all the potential indicators and specifications of the index, which is discussed in the next chapter.
Conclusions
Designing the national MPI

81 How to Build a National Multidimensional Poverty Index (MPI)
Chapter 6. Source of information: Surveys, censuses and other data
Selecting the data that will be used for the computations is another fundamental step when developing a national MPI. In an ideal world, data restrictions should not affect which dimensions and indicators can be included in a national MPI. However, the reality is that, in most cases, there are few options with respect to data sources. Economic and human resources are usually a constraint, and national MPIs are usually developed with limited time and funding available. Therefore, developers must consider the choices available and make decisions based on their measurement goals and their country’s particular context.
As discussed in the previous chapter, decisions related to the unit of identification, dimensions and indicators should be guided by the purpose of the national MPI. The selection of a data source should also be influenced by normative decisions and considerations, because it determines how often the national MPI needs to be updated, the level of disaggregation possible, information related to the unit of identification and, in some cases, what dimensions of poverty can be considered. For instance, if the general purpose of a national MPI is to create a measure that targets multidimensionally poor individuals in all districts of a country, the data source should be representative at the district level. In turn, if the purpose of the MPI is to create a national measure of multidimensional poverty that can monitor the fulfillment of the SDGs, the source of data needs to be representative at the national level and include dimensions that capture SDGs targets.
However, the availability of data will also influence normative decisions on the structure of the national MPI. As multidimensional poverty measures look at the simultaneous hardships that individuals or households experience, the source of information used to compute the MPI needs to include micro-level data—information for each individual or household, depending on the chosen unit of identification. In most cases, this means that information on all dimensions and indicators needs to come from a single source. This can present a challenge, as in any given context there may be few or even no sources of information covering all relevant dimensions of poverty. For instance, while socioeconomic household surveys usually have information on demographics, employment, education and housing, it is less common for them to include questions on health. In turn, surveys like the Demographic and Health Surveys (DHS) or the Multiple Indicator Cluster Surveys (MICS) do capture comprehensive data on health for women and children and housing, but information on employment is limited, and these surveys, in large part, only obtain data related to age- and gender-specific subgroups of the population (i.e. children under five and women of reproductive age).
In specific cases, it is possible to combine information from different data sources. However, this is a complex process because the MPI requires building a deprivation profile for each household or person and cross-survey identification codes are not commonly available, making it difficult
Introduction
“The availability of data influences normative decisions on the structure of a national MPI.”

82
to merge information for the same unit across the different datasets. It is also possible to merge area-specific data or GIS data if it seems accurate to ignore all inter-household variation within that area: for example, if police data were high quality, one could use administrative records from police stations to code each police station catchment area as “high violence” or “low violence”. In this case, every person whose house was located in a high violence police catchment area would be coded as deprived in violence, and the others as non-deprived. Similar decisions could be made for some environmental indicators such as pollution.
In order to calculate the best possible MPI, governments can decide between three options. First, they may choose to use an existing data source, which has some desirable properties (e.g. is representative at the national level and, at least, of rural and urban areas, and includes questions on aspects of multidimensional poverty). Second, they may choose to modify an existing data source by adding questions on dimensions or indicators that are not currently captured and/or increasing the sample size to obtain representativeness at different levels (e.g. subnational regions, districts, departments, etc.). Finally, they may choose to design and implement a new survey, with the aim of collecting information on the dimensions and indicators that have been selected for the national MPI. Which option is followed depends on time and economic resources—how long and expensive the process may be. Governments should also consider how much more accurate poverty statistics obtained from a new or modified survey would be in comparison to what is possible to compute with existing survey instruments. Additionally, it is important to consider how this decision affects the sustainability of the measure. For example, if a new source of information is collected, what budgetary arrangements need to be in place to guarantee that it is collected annually or every few years, so that the measure can be appropriately updated.
This chapter describes the process of selecting the data source to calculate a national MPI. It also discusses the main challenges faced during this stage and the implications of selecting a specific source.
Using an existing data source is the option that countries usually find most feasible. Such a decision reduces the financial and time costs associated with the design and calculation of the national MPI. Often an MPI made from existing data can also be back-computed over two or more time periods, allowing the tracking of changes in poverty over time.
To assess whether this option is desirable, it necessary to review the quality of data, how often it is collected, and the levels at which it is representative, as well as the type of information that is covered by existing data sources. Censuses, household surveys and administrative records are the three most common sources of micro-data available. A national MPI can be computed using any of these options.
A census is the enumeration of all households and individuals living in a specific territory at a given time (United Nations (UN), 2008). The main advantage of using a census as a source of information for poverty calculations is that it provides information with an almost negligible sampling error, as the whole population is considered. This allows a high
Using an existing source of data
Source of information: Surveys, censuses and other data
“To calculate the best possible MPI, governments can decide between three options.”

83 How to Build a National Multidimensional Poverty Index (MPI)
Box 6.1. Using the census as the source of information in South Africa
Source: Statistics South Africa (2014).
level of disaggregation and the creation of poverty maps. In addition, censuses collect information from groups usually ignored by other sources of data, such as people living in institutions (hospitals, care institutions and prisons) and homeless people (United Nations (UN), 2008).
However, censuses are often conducted only every 10 or so years and contain limited information, which in most cases does not cover all relevant aspects of poverty to be included in a national MPI. Some countries implement special censuses to target and monitor certain social programs, though they do not cover the entire population of the country and still have a limited number of variables (United Nations (UN), 2008). So, censuses can be used, but they might not be the only data source of a national MPI.
Census
The purpose of the South African MPI (SAMPI) is to improve poverty measurement for the country. The SAMPI uses the South African Census 2011, which was the third census conducted in the country in the post-democratic era. The SAMPI has four dimensions: health, education, standard of living and economic activity, and 11 indicators. It uses nested weights and establishes a poverty cut-off equal to 33.3 percent. In this context, a person is considered multidimensionally poor if she or he is deprived in a third of the weighted sum of indicators.
Aiming to compare the levels of poverty of South Africa between 2001 and 2011, the SAMPI was computed using
census data from both years. Given the characteristics of census data, it was possible to analyze the levels of poverty for provinces and municipalities, produce maps and compare their levels of incidence, intensity and MPI between years.
All this information allowed a detailed analysis of the levels of multidimensional poverty of the country and revealed that poverty fell between 2001 and 2011, decreasing from 17.9 percent in 2001 to 8.0 percent in 2011. The regions that reported a higher incidence of multidimensional poverty in 2011 were Eastern, Cape, KwaZulu-Natal Limpopo and North West, all of them with incidences higher than 8.0 percent.
Administrative data Administrative data refers to information collected by government agencies or departments, with the main purpose of registering individuals to deliver a service (Connelly et al., 2016). There are different types of administrative data that cover vital statistics, population, taxes, education, and police and health records, among others.
The main advantages of administrative data are that they cover virtually all the population using a specific service and can include information from individuals who are not normally captured in surveys. If administrative data can be linked to other unit-level data sources, it could become a powerful resource for multidimensional poverty measures, allowing a more detailed analysis of different dimensions and indicators, and providing information on variables that are difficult to collect using household surveys (e.g., education quality).

84
Household surveys
Source of information: Surveys, censuses and other data
However, such information is limited and often not available to researchers. In addition, these records may or may not be updated with the same periodicity, and household surveys and questions may be changed without notice making it impossible to continue a series. Also, data may not be available promptly, limiting the timely release of poverty figures (Alkire & Samman, 2014). Using administrative data also raises ethical concerns, given that individuals have not usually given their consent for the use of their information in this way. Another concern with administrative data is that, although it generally has a large sample, non-users of the services are excluded from registers, so the data is not representative. In addition, administrative records are often affected by severe quality issues (e.g. some types of administrative data might be especially vulnerable to reporting bias and, thus, not suitable for poverty measurement) or require extensive data cleaning (Woollard, 2014).
The most common sources of information used to compute national MPIs are national household surveys. Household surveys are collected from a subset of the population, which is usually representative of a population of interest. Typically, the participants are selected from a frame obtained from the national census and different questions are included, depending on the objective of the survey.
One advantage of household surveys is that they are more comprehensive than other sources of micro-data in terms of the dimensions of poverty that are usually covered. Surveys are also generally used to calculate monetary poverty statistics. One major disadvantage is that some household surveys are designed to cover only a specific segment of the population or a specific topic (United Nations (UN), 2005a; b). This limits the data available for creating indicators. Another disadvantage is that special care must be taken to avoid overlooking key groups in which poverty may be prevalent—such as pavement dwellers, institutionalized populations, mobile slums and squatter settlements, or migrants. Some examples of national household surveys are Living Standard Surveys, Labor Force Surveys, DHS, and Expenditure and Consumption Surveys.
It is worth mentioning that, although the SDGs are leading a “data revolution”, at this time, not all countries have a large number of high quality household surveys. Many low- and middle-income countries have limited resources, which makes it harder for them to design and collect surveys regularly and analyze them promptly. Thus, in some cases, it can be extremely useful to consider existing surveys that are supported by international agencies and conducted periodically, such as DHS or MICS.
Table 6.1 presents a summary of the main characteristics of the three sources of information (census, administrative data and household surveys).

85 How to Build a National Multidimensional Poverty Index (MPI)
Census data Administrative data Household survey data
Sample All households or individuals in a country.
Specific groups of the population.
Representative sample of households.
Purpose
Gather information about the general population. Present a full and reliable picture of the population in the country.
Registration, transaction and record keeping. Associated with the delivery of a service.
Collect detailed quantitative and qualitative information on a representative subset of the population to measure the level and trend of indicators.
Data collection time
Short period (less than five months). From daily to annual. Three to five months, or longer if
stratified by season.
Disaggregation Lowest level: administrative and geographic.
Lowest level: administrative and geographic.
Lower disaggregation depends on the size and design of the survey.
Frequency of data collection 10-year intervals. Variable. One to five-year intervals
(depending on the survey).
Advantages
- Scope: entire household population.- Main national source: reliable benchmark data on key characteristics.- Usage: very comprehensive.- Disaggregation: smallest administrative areas of the country.
- Applicability: often larger sample than survey data.-Scope: usually tracks narrowly defined indicators. - Specificity: small subgroups.
- Cost-effectiveness: possible to collect in situations where complete enumeration is not practical or adequate administrative data are not available.- Scope: possible to ask multiple questions on characteristics of interest.- Reliability: better non-sampling error control if well-trained interviewers and supervisors ensure high-quality data collection.- Most common source of information to monitor poverty and deprivation in all countries.
Disadvantages
- Simplicity and periodicity are not satisfied: complex to administer and cost of data collection and cleaning is very high.- Data quality may be low.
- Usage: complex, difficult to clean and organize.- Availability: not publicly available in many countries. - Legal and ethical issues.- Data quality varies greatly.- Coverage bias: may not be representative for the whole population of interest.
-Periodicity may be infrequent and period between data collection and release may be long. -Scope: gives a “snapshot” of the population but not local details. - Subject to sampling measurement errors as well as non-sampling.
Table 6.1. Main characteristics of census, administrative and survey data
Sources:(Asian Development Bank, 2010 ; Connelly et al., 2016; UNESCO Institute for Statistics (UIS), 2004)

86
In the process of selecting the best data source available, the desired characteristics of the data must be considered. First, it is fundamental that it is representative at the national level and, at least, of rural and urban areas. Whenever the results of the MPI are intended to determine policy priorities within the country and to distribute economic resources, there must be a source of information that is representative at the relevant lower level, such as subnational regions (states, provinces) or districts/municipalities.
The team responsible for designing the MPI should also consider the information available in the current version of national surveys. Given the existence of budgetary constraints, it is always important to analyze the existing sources of information in detail and the possibility of revising questionnaires and reference populations. This analysis should first consider whether the survey captures the relevant dimensions and key indicators of poverty. If some feasible and high priority areas are not currently covered by existing surveys, adjustments to the questionnaire may be necessary.
Other relevant issues are the unit of identification (household or individual) and the frequency or periodicity with which the survey is carried out. The selected data source should ideally allow for the creation of indicators for each unit, and not just subgroups of the population Periodicity, in turn, determines how often MPI figures can be updated. For a national MPI to be able to track changes in multidimensional poverty over time, the surveys need to be comparable—both in terms of the samples and the questionnaire (to allow for the same structure of the MPI to be computed).
The possibility of using information from other data sources, which are collected using a higher unit of identification, should also be examined. For instance, countries that are considering including data on environment and natural resources into the MPI may be able to use information from the city or district level. In this case, all individuals or households living in the same city/district are assigned the same status of deprivations in these indicators. Another possibility is using information on the number of schools or hospitals in a given neighborhood, city or district.
To sum up, scrutinizing the human, financial and time-resource implications when selecting a data source is essential. Using an existing source of data involves few extra costs for the government. If the data is already collected, the timeframe for developing the MPI is shorter and it is possible to launch the measure sooner. The tradeoff is that, in most cases, some information related to important dimensions of poverty is missing. For this reason, some countries have opted to make some adjustments to their existing surveys either before the MPI’s launch or during the first update.
Criteria for selecting a source of data
Source of information: Surveys, censuses and other data
“Where the MPI is intended to inform policy and resource priorities there must be a source of information representative at relevant subnational level[s].”

87 How to Build a National Multidimensional Poverty Index (MPI)
If a country concludes that no existing survey has all the indicators necessary to compute the national MPI, one option is to modify an existing survey. In that case, the country should consider the time needed to make these adjustments, as well as the associated cost. Sometimes, the timeframe for presenting the MPI figures is short, meaning that time constraints underpin this decision. It is also worth clarifying the cost of resources and time. Some indicators, such as school attendance or internet access, only require including a few questions in the survey, whereas others, such as detailed employment modules, require a larger number of questions, increasing the time of the survey by 15 minutes or more. Seeking a good balance between informational richness and cost effectiveness requires clarifying such issues early on as policy actors may not know the implications of decisions otherwise.
Having decided to modify an existing survey, the next step is to decide which questions need to be included in the survey (and, by contrast, what will be left out). First, relevant stakeholders (policymakers, the technical team, experts, civil society, etc.) must engage in a discussion about what dimensions and indicators are fundamental and should be included. Consultations with experts and poor communities, as well as a review of relevant literature, will be a helpful resource for guiding and validating these decisions, as discussed in chapter 5.
Once the list of dimensions and indicators is ready, the technical team should lead the design of the new questions so that they appropriately capture the indicators to be added. This might require adjusting the sample size, applicable populations or, possibly, the reference period of some questions. As discussed in the previous section, the purpose of the measure guides most normative decisions, including at what level the data needs to be disaggregated. In this sense, if the best existing survey has all the questions to necessary calculate the MPI, but it is only representative at the national level (or for specific regions), it might be decided to increase the sample size of the survey, which would make possible the necessary disaggregation.
Although modifying an existing survey is an intermediate option between using an existing data source or designing and collecting a new survey, it still entails considerable resources and time. It can, however, allow for a more accurate MPI than one computed from existing data—one that better captures the complexity of poverty and helps gain long-term sustainability for the index. Several countries have chosen this option. For instance, Chile, Panama and El Salvador implemented changes to existing national surveys, adding some questions or modules and increasing the sample size and representativeness for certain groups. This allowed them to capture additional indicators that were ultimately included in their national MPIs.
Modifying existing data sources
“If a country concludes that no existing survey has all the indicators necessary to compute the national MPI, one option is to modify an existing survey.”
88
Box 6.2. Adjusting the Multipurpose Survey to compute the national MPI in Panama
Source: http://www.mides.gob.pa/wp-content/uploads/2017/06/Informe-del-%C3%8Dndice-de-Pobreza-Multidimensional-de-Panam%C3%A1-2017.pdf
Box 6.3. Adjusting existing household surveys to capture deprivations related to environment and natural resources (ENR)
Source of information: Surveys, censuses and other data
The national MPI in Panama was launched on July 2017. Its purpose is to monitor poverty and provide information to target the needs of multidimensionally poor individuals in the country. The process of developing the national MPI started in June 2016 with consultations on the importance of having a multidimensional poverty measure in Panama and the key dimensions and indicators that should be included in the measure.
Different data sources in the country were analyzed, leading to the selection of the Multipurpose Survey as the source of information to calculate the national MPI. However, despite the large scope of this survey, it lacked information on indicators identified as fundamental during the discussions and consultations with different stakeholders (e.g., prenatal healthcare access, environment and road access). Therefore, the Ministry of Social Development and the Ministry of Finance prepared a proposal with the National Institute of Statistics to include 10 new questions, whose main purpose was to collect information on those missing dimensions/indicators for the MPI.
The list of questions was validated with experts from different ministries, and all were piloted in the field before their final inclusion in the Multipurpose Survey.
Several countries have shown an interest in including ENR indicators in their national MPI. The main challenge for these countries has been the lack of adequate ENR data in national household surveys. However, multi-topic surveys have the potential to identify which economically and socially poor groups are also the victims of specific ENR deprivations. Moreover, household surveys could provide data on the specific impacts of ENR on the poor and allow empirical hypotheses on associations between ENR and poverty to be tested more accurately than is possible with aggregate datasets (e.g., on the link between multidimensional poverty and access to natural resources). In addition, ENR-augmented surveys could provide baseline data on the impact of ENR on the poor. Such data, together with socioeconomic data (e.g., protection against hazards or property destruction due to a hazardous event [such as earthquakes, landslides, floods or storms]), could be decomposed according to the same demographic subpopulations, locations, type and nature disaster, all of which are important information for designing policy.
It could therefore be interesting to use ENR-related household survey modules. Such modules exist and are often country or region specific (Bhutan’s Gross National Happiness Index Survey or Ecuador’s Quality of Life survey, for instance, each have them). However, in many countries ENR data are not fielded within multi-topic household surveys and therefore do not cover the non-ENR aspects of multidimensional poverty (such as health, education, livelihood or living standards).
Having ENR data integrated into the MPI could be done by creating an ENR survey module to be employed alongside other survey modules used to compute the national MPI. This has been done in in El Salvador, Panama and in the most recent wave of Chile’s CASEN survey. The Bangladesh Bureau of Statistics has also begun to include a climate/environment module in their household income expenditure survey. In the Dominican Republic, the national household survey was modified to include a new module on “risk of natural problems and environmental pollution”. These innovative endeavors, which will continue to evolve and improve, are of great interest.
Beyond household surveys, other sources of environmental data could be integrated within a national MPI. But, as argued in Thiry et al. (2017), this comes with several technical requirements: the data should be (1) geo-referenced in ways that can be merged with the relevant aspects of the household’s activities, (2) available at a high-enough resolution, (3) relevant to most if not the entire population under study, (4) reflect deprivations that were actually

89 How to Build a National Multidimensional Poverty Index (MPI)
Source: Thiry et al. (2017).
experienced in the same period as the poverty data, and (5) be accurate at the household level or at the level at which they are merged with the household data (if the merging is done by a larger geographic area). This makes products derived from remotely sensed data (e.g., satellite images), meteorological data, and environmental risk data derived from observations and/or models particularly relevant in this respect (e.g., the global forest based on Landsat images or global maps of environmental risks, including floods, droughts and earthquakes).
To be clear, not all ENR-related aspects can be included in the MPI. They may reflect probabilities of future deprivation (such as climate change) or might not meet the five conditions above. In this case, it would still be highly interesting to map the MPI according to the environmental geospatial data to identify possible correlations between environmental phenomena (floods, droughts, soil erosion, etc.) and the level of MPI. Many new mapping techniques and methodologies are available and create a potentially highly dynamic frontier of research. The outcome would be to highlight and better understand the interlinkages over time between environmental and poverty variables.
Designing a new survey The third and final option is to create a new data source. The new instrument can be designed specifically to capture all relevant dimensions and groups that need to be tracked with the national MPI. Although this option is more demanding in terms of resources, it allows more flexibility. The new survey can be shaped to meet all desired requirements, such as including questions to capture certain innovative dimensions deemed relevant, making improvements to standard questions, being representative at different levels, and including questions that allow for a more detailed analysis of the determinants of poverty.
However, a new survey means that it is impossible to back-compute trends over time, and these can be critical to learning what has or has not worked in the past. In addition, given the extra cost and resources involved with this option, most countries decide against creating a new survey. The Dominican Republic is one country that decided to collect a new survey in order to compute the indicators to be included in their national MPI.
In the Dominican Republic, the national household survey was modified to include a new module on “risk of natural problems and environmental pollution”
“The third and final option is to create a new data source.”
90
Box 6.4. Designing a new survey to compute the national MPI in the Dominican Republic
Source: interviews with representatives from SIUBEN Dominican Republic, January 2018.
The Sistema Unico de Beneficiarios (SIUBEN), which is the national office in charge of identifying beneficiaries for public programs, began the process of designing of the MPI by holding consultations with important stakeholders, including technicians from different ministries, the National Institute of Statistics, international organizations and experts. After these consultations, indicators related to environment, social participation and empowerment were identified as fundamental to the national MPI, along with more the traditional dimensions of health, housing and education.
Following these discussions, all possible sources of information available in the Dominican Republic were reviewed, and it was found that no source of information included all the variables needed to compute the ideal national MPI. The technical committee decided then to design a new nationally representative survey that could also be disaggregated by rural and urban areas. This decision had the objectives of collecting information on all relevant dimensions of poverty and having a new survey that could be used by social programs as a strategic input for the design of public policies.
The design of the questionnaire started in the second half of 2014 and was validated by several stakeholders. In April 2015, a pilot of the survey was conducted, leading to some adjustments to the questionnaire. The final survey went into the field in November 2015, and the evaluation the data was done between January and March 2016. The final structure of the MPI was decided later that year, followed by all necessary computations and analysis. The final MPI of Dominican Republic was launched in June 2017, covering five dimensions and 24 indicators.
Source of information: Surveys, censuses and other data
As with the previous option, a large number of decisions must be made regarding what questions to include and how, and it is important that the new survey is seen as a tool for policymaking. To accomplish this, it is essential that the purpose of the measure is clear and that there is dialogue with the different stakeholders.
In addition, the new data source should be representative at the lowest possible level to obtain the most information-rich MPI, though this will increase costs and might expand the timeframe needed. Questions included in the new survey should reflect individual or household achievements, depending on the unit of identification chosen. The definition of the applicable population for each indicator should also reflect this decision. For example, if an indicator on vaccinations for children younger than five is included, questions should collect information on vaccinations for children younger than five.
Designing a new survey is an opportunity to explore new possibilities, include new questions and capture better data to analyze missing dimensions of poverty. However, it is vital that the data source for a permanent official MPI be sustained, which requires the political and technical commitment to collect the new survey in the future, thus guaranteeing the MPI will be updated in a timely manner.

91 How to Build a National Multidimensional Poverty Index (MPI)
Box 6.5. Stages for designing a new data source
Combining different data sources, including censuses and administrative data, may be an option if the indicators chosen for the MPI are available across different data sources. However, the AF method requires all indicators to be defined for the same unit of identification, because complete deprivation profiles must be created for each household or individual in the sample. In this context, a census and a household survey can be combined if there is an individual identification code for the exact household or individual. This identification code should be the same in all data sources that need to be merged. If this is not possible, then it will not be possible to combine different data sources for the computations.
However, it would still be possible to attribute area-wide deprivations to each household living within a certain radius, if complete information at a higher level is available but this will entail making strong assumptions about inter-household comparability within each region, namely that all households have the same deprivations in that particular indicator.
Using different data sources
Questionnaire designA key step before designing a questionnaire is to decide “what are the things one needs to know from the respondent in order to meet the survey’s objectives” (Crawford, 1997). For this, it is essential to define the targeted population from which the sample data will be collected. The potential dimensions and indicators that will be constructed from the questions’ content also need to be considered.
An important resource is to look at questions that have already been validated in the literature to analyze the different dimensions, and who the respondents were. This needs to be in line with the purpose and unit of identification (individuals or households) of the national MPI. Budget restrictions should also be considered at this stage. Indeed, available resources (budget, personnel, equipment and time) have a significant influence on the choice of data collection method (Statistics Canada 2010).
Sampling design At this stage, it is necessary to examine how representative the surveyed sample is with respect to the general targeted population, and what is the maximum level of disaggregation that can be obtained with the survey. The representativeness of the sample is essential in order to be able to make reliable inferences. Different indicators may require increasing the sample
size for specific groups. The researchers need to be aware of this and of the non-response rate. This is an indicator of survey performance and a high non-response rate may result in a loss in precision in the estimates (Statistics Canada, 2010).
PilotDuring this phase, the researchers evaluate the adequacy of the questionnaire, the suitability of the survey frame, the operational procedures, etc. This leads to validating the questionnaire, assessing potential changes, improving questions and eliminating others.
The pilot phase duplicates the final survey design on a small scale in order to check how well the questionnaire performs throughout all the steps in the survey (Statistics Canada 2010). Usually, a small number of respondents are selected for the pilot survey. These respondents need to be broadly representative of the future survey population (Crawford, 1997).
Final surveyOnce the data has been collected, coded and cleaned, the researchers can proceed with the estimations and tabulations to summarize the data and draw conclusions about the population of interest based on the information gathered from the representative sample (Statistics Canada, 2010).
Source: Crawford (1997); Statistics Canada (2010).
92
Box 6.6. Merging databases to compute the national MPI in Philippines
Source: Philippine Statistics Authority, 2018.
Box 6.7. MPPN’s Light Powerful Survey
Source: Multidimensional Poverty Per Network & Oxford Poverty and Human Development Initiative (2014). Available at http://www.mppn.org/wp-content/uploads/2016/11/MPPN_SDG-Pov_QuexPost2015_Sept-14a.pdf
This chapter discussed the possible data sources to calculate a national MPI. Depending on the financial resources, the time schedule, and the ideal list of dimensions and indicators to be included in the measure, countries can opt to use an existing source of data, modify an existing source of data to better capture the relevant dimensions of poverty, to design and implement a new survey or, if it is possible, different data sources can be merged.
Most MPIs either use an existing survey or modify it. The use of an existing data source has several advantages because it is often quicker to implement, has a larger sample size, and also can be back-computed to show trends over time. It is important to consider aspects such as time and human and financial restrictions when selecting which data source to use.
Conclusions
The main objective of Philippine’s national MPI is to compute the levels of multidimensional poverty of people in the country. It uses the family the as unit of identification and has four dimensions (education, health and nutrition, housing, water and sanitation and employment) and 13 indicators.
The MPI in Philippines was computed using the
merged dataset of the 2016 and 2017 Annual Poverty Indicators Survey (APIS) and Labor Force Survey (LFS) conducted by Philippines Statistical Authority. This was possible because both datasets used the same enumerator units, therefore both collected data from the same households. This allowed an analysis of a larger number of indicators, which are usually not included in the same survey.
The Multidimensional Peer Poverty Network (MPPN) designed a survey to obtain data to calculate national MPIs and track progress in the SDGs. The Light Powerful Survey can be implemented in different contexts, does not impose ethical risks for participants or special conditions for data collection, and is easy to carry out. In addition, it can be regularly implemented on a large scale, and, given the set of questions covered, it is possible to analyze key interconnected deprivations. Also, if the sample design allows it, the information obtained by using the survey can be analyzed by gender, age, marital status, urban/rural areas, regions, disability status, legal status, ethnicity and migration status, providing critical information for achieving the objective of leaving no one behind.
The survey contains different modules, which are included in four questionnaires: (1) a household questionnaire, which provides information on each household member; (2) a children’s questionnaire (0–5 years of age), focused on nutrition; (3) a women’s questionnaire (15–64 years of age), covering employment, reproduction, child mortality and nutrition; and (4) a men’s questionnaire (15–64 years of age), covering employment, child mortality and nutrition. The questionnaires can provide the necessary data for more innovative indicators like violence, empowerment or informal work. For more information, see annex 3.
Source of information: Surveys, censuses and other data

93 How to Build a National Multidimensional Poverty Index (MPI)
Chapter 7. Building and analyzing candidate measures
In many cases, the process of designing a national MPI includes a point at which the technical team presents a number of candidate measures (e.g. two to five) to a steering committee. This chapter discusses the steps necessary to calculate and analyze the candidate measures for a national MPI, what aspects may be considered when selecting the final measure and what additional analyses are useful.
All candidate measures that are presented should have been already validated as being technically sound. There are three main stages in the creation and validation of these measures:
1. Creating a universe of indicators: analyzing the quality of each indicator by considering applicable populations, the results of redundancy tests and an analysis of missing values, as explained in chapter 5. 2. Building candidate measures: several potential structures for the MPI are considered. During this stage, indicators can be placed in different dimensions and alternative weight structures and deprivation and poverty cut-offs are considered.
3. Analyzing candidate measures: the measures are disaggregated by subnational groups, broken down by indicator and compared with monetary measures and other single statistics. Any unexpected findings are probed. Robustness tests are run to evaluate the technical soundness of the alternative structures and to test whether policy-relevant comparisons are robust to changes in weights and cut-offs. After this stage, the validated measures can be presented to the steering committee and the results are analyzed in detail.
This chapter discusses how to carry out the last two stages and discusses the extra analysis that should be done once the final measure is decided.
Given the same purpose and unit of identification, it is possible to imagine versions of the MPIs that differ in their structure, i.e. they may have different dimensions, indicators, weights or cut-offs.
The main goal of this stage is to create a complete set of results for each candidate measure and run robustness tests. To do this, the technical team will first create a comprehensive list of potential indicators, or universe of indicators. They will differ in their specific deprivation cut-offs or the reference population considered. For example, when measuring school attainment, one deprivation cut-off could be that “a household is deprived if at least one member older than 15 does not have six years of schooling”. Other possible cut-offs, for instance, could consider a household to be deprived if (1) the head of the household does not have six or more years of education, (2) the median (or mean) number of years of schooling of members older than 15 is lower than six, (3) at least
Introduction
Creating the universe of indicators
94
one woman older than 15 does not have six years of education, or (4) at least one woman and one man older than 15 does not have six years of schooling. All of these options are measuring school attainment at the household level, but the specification of each of them is different.
Creating a list of potential indicators in this way provides important information on how levels of deprivation change when the deprivation cut-offs or the reference population vary. It does not mean that all of these indicators will be included in the final measure, or that the original list of indicators was not accurate. Instead, this list provides valuable information to analyze and compare the results of the candidate measures before selecting the final measure. Moreover, having this information helps to answer questions about the robustness of results if indicators were defined differently. It helps explain which specifications really affect indicators and which do not, and identifies problems with indicator definitions. This analysis is essential for all data sources: for countries that are using existing surveys, new surveys or those that have added questions or modules to existing surveys.
All indicators included in the candidate measure should be analyzed as detailed in chapter 5. This analysis includes the study of the percentage of missing values, the level of redundancy between pairs of indicators, and differences among the levels of deprivation for different groups (e.g., regions, levels of income, rural and urban areas, gender and age groups).
After the indicators are analyzed, different measures must be computed using a combination of the potential indicators. At the trial stage, indicators can be assigned to different dimensions, and different weights or different poverty cut-offs can be used. For example, water and sanitation might be put in the dimension of “housing” in one measure and in “health” in another.
Several candidate measures are created at this stage, each of them trying to provide an accurate characterization of poverty and fulfill the overall purpose of the national MPI. All candidate measures ordinarily should use the same unit of identification, which, in turn, is directly related to the purpose, as discussed in chapter 5. At the end of this process, the technical team will have a set of candidate measures with different specifications, but which could all potentially be used as the final national MPI.
Table 7.1 presents examples of potential candidate measures. Each of them uses nested weights, with equal weights across dimensions, and equal weights across indicators within each dimension.
Building candidate measures
Building and analyzing candidate measures

95 How to Build a National Multidimensional Poverty Index (MPI)
Table 7.1. Examples of potential candidate measures to be analyzed
Dimension Measure 1 Measure 2 Measure 3 Measure 4 Measure 5
HealthHealth outcomesNutrition
Health outcomesNutritionAccess to healthcare
Access to healthcareNutritionHealth insurance
Health outcomes NutritionWaterSanitation
Access to healthcareHealth insurance
EducationYears of schoolingSchool attendance
Years of schoolingSchool attendance
Years of schoolingSchool attendance
Years of schoolingSchool attendance
Years of schoolingTraining/skills
Living Standards
HousingElectricityWaterSanitationClean energyAssets
HousingElectricityWaterSanitationClean energyAssets
HousingElectricityWaterSanitationClean energyAssets
HousingElectricityClean energyAssets
HousingElectricityClean energyAssetsWaterSanitation
WorkInformal workQuasi-joblessness
Quasi-joblessness
Quasi-joblessness
Informal workQuasi-joblessness
Security Domestic violence
Safety from violence
Safety from violenceDomestic violence
Social Protection
PensionWork benefitsDisability/Child benefits
PensionWork benefitsDisability/Child benefits
Childhood & Youth
School attendanceNutritionChild labor

96
Once the candidate measures have been built, the next step is to analyze and test them. The most basic analysis includes disaggregation by relevant population groups (i.e. rural and urban areas, subnational regions, gender, age groups, etc.) and dimensional breakdown. Results for the different candidate measures should be compared among each other—and against existing evidence. For instance, if it is well established that rural areas are poorer than urban ones and census data also shows that access to basic services and education is limited in the former, candidate MPIs that present rural areas as better off should be double-checked, just to make sure there are no errors in the estimations. Depending on the indicators included in the measure, findings could still be accurate. For example, if some indicators are only for urban areas or assume that rural areas are automatically non-deprived, or if people living in urban areas have a higher probability of being deprived in one specific indicator).
In all cases, it is important to understand clearly what is driving the difference in results, to catch any technical errors and to plan how to communicate the value-added of the MPI in comparison with existing analyses, including by sharing potentially unexpected findings with various stakeholders.
The design of a national MPI involves choosing indicators and setting cut-offs and weights, and, naturally, there could be more than one way to do this. Thus, the robustness of the measure to changes in parameters (e.g., indicators, deprivation cut-offs and weights) should be analyzed as to their statistical significance. Since the MPI will be used to guide public policy, a good measure should be robust to a range of different specifications; that is, the level of MPI by region or trends over time should not change dramatically if the specifications of the measure are altered a little.
In monetary poverty measures, the poverty line is often a source of controversy. In multidimensional poverty measures, dominance analysis is used to assess the robustness of each candidate measure when the poverty cut-off, which represents the minimum proportion of deprivations required to identify someone as multidimensionally poor, varies. Generally, results are surprisingly robust to changes in the poverty cut-off. Naturally, the poverty cut-off is of great political interest because it sets the headcount ratio that journalists publish. When the poverty cut-off increases (decreases) less (more) people will be identified as MPI poor. Thus, this has a direct impact on the incidence of poverty (H), the intensity (A) and the MPI. For this reason, it is essential to consider how changes in the poverty cut-off alter the ranking of states or provinces, and the composition of poverty.3
There are two straightforward robustness tests that could be useful in this context. The more precise looks at “pairwise comparisons”, while the other focuses on “rank correlations”.
Pairwise comparisons examine the percentage of pairwise comparisons that are the same for two (or more) poverty cut-offs. In order to run
Analyzing candidate measures
Robustness analysis
Robustness analysis for changes in the poverty cut-off
Building and analyzing candidate measures
3First-order stochastic dominance (FSD) can be used to evaluate the sensibility of any pairwise combination (i.e. any two regions, or age groups) with respect to the poverty cut-off. This analysis aims to examine if multidimensional poverty in one region “dominates” the level of poverty of another region, regardless of the poverty cut-off used to compute the national MPI. For details, please see Alkire, S., Foster, J., Seth, S., Santos, M. E., Roche, J. M. & Ballon, P. (2015) Multidimensional poverty measurement and analysis. Oxford: Oxford University Press.

97 How to Build a National Multidimensional Poverty Index (MPI)
Both pairwise comparisons and rank correlations are straightforward to perform and analyze. The natural question is which poverty cut-offs should be considered when running these tests. There is no mechanical answer to this question. Conceptually, poverty cut-offs should reflect the range of reasonable disagreements in the society about where the poverty cut-off needs to be set. In addition, while it is possible to test them all, it is recommended to start with the highest and lowest reasonable poverty cut-off and compare those with the chosen k value.
this test, one must consider the MPI and its upper and lower bounds (e.g., the 95 percent confidence interval) for states, provinces, districts or whatever other groups are being compared. The test analyzes how many of these pairwise comparisons are the same when the poverty cut-off changes. For any two comparisons and a given poverty cut-off—of say, 33 percent—there are three potential results: (1) region A could be strictly poorer than region B (the lower bound of its confidence interval is above the upper bound of the confidence interval of region A), (2) region A and region B’s confidence intervals could overlap or (3) region B could be strictly poorer than region A. Again, the options would be the same for any other poverty cut-off (25 percent, etc.). This test looks at whether the result that holds for the first poverty cut-off is the same as that for the second poverty cut-off (or any other).
When looking at rank correlations or rank robustness analysis, the aim is to assess how the rankings of population subgroups derived from more than two specifications of the MPI are maintained. The first step in this analysis is computing the MPI for each region using a given poverty cut-off (e.g., 33 percent). Then, regions are ranked from the poorest to the least poor based on their MPIs, and they are assigned a number representing the position they hold in the ranking (this should always be done considering standard errors). Then, the process should be repeated using a different poverty cut-off (e.g., 50 percent). Following these steps, one should have two columns showing the rank that each region has under each poverty cut-off. The final step is to use this information to compute a Tau-b rank correlation test between the columns.
Box 7.1. Kendall rank correlation coefficients
The Kendall rank correlation coefficient ( ) can be expressed as
where a pair of subgroups (l, l’) is concordant if the comparisons between two objects are the same in both the initial and alternative specification (i.e., robust pairwise comparison), and it is discordant if the comparisons between two objects are altered between the initial and the alternative specification (i.e., non-robust pairwise comparison).
The ranges between -1 and 1. A value equal to -1 implies that two ranks are perfectly negatively associated with each other. By contrast, a value equal to 1 indicates that ranks are perfectly positively associated with each other. Once again, small variations in the specification of the MPI should lead to values of the Kendall coefficient that are close to 1.
Source: Alkire et al., 2015.
𝑅𝑅" =⋕ 𝐶𝐶𝐶𝐶𝐶𝐶𝐶𝐶𝐶𝐶𝐶𝐶𝐶𝐶𝐶𝐶𝐶𝐶𝐶𝐶𝑃𝑃𝐶𝐶𝑃𝑃𝐶𝐶𝑃𝑃−⋕ 𝐷𝐷𝑃𝑃𝑃𝑃𝐶𝐶𝐶𝐶𝐶𝐶𝐶𝐶𝐶𝐶𝐶𝐶𝐶𝐶𝑃𝑃𝐶𝐶𝑃𝑃𝐶𝐶𝑃𝑃
𝑚𝑚(𝑚𝑚 − 1)/2,
𝑅𝑅"
𝑅𝑅"

98
Box 7.2. Robust comparisons using the global MPI
Building and analyzing candidate measures
The global MPI is constructed using three dimensions consisting of 10 indicators. Each dimension is equally weighted at one third; each indicator within a dimension is also equally weighted.
Alkire et al. (2010) estimated the global MPI using three additional weighting structures: (1) giving 50 percent weight to health and 25 percent weight each to education and living standards, (2) giving 50 percent weight to education and 25 percent weight each to health and living standards, and (3) giving 50 percent weight to living standards and 25 percent weight each to health and education. Then they verified if the country rankings were stable using the four approaches. First, the authors calculated the correlation coefficients between each pair of rankings using Pearson’s and Spearman’s correlation coefficients and Kendall’s rank correlation coefficient (Tau-b). Next, they estimated the concordance between all four rankings using three alternative methods: Kendall and Dickinson-Gibbon (KDG), the multiple-rank version of Spearman’s coefficient (by Kendall, KS) and the multiple-rank concordance index of Joe (J); they also performed Friedman’s test of rank independence. In addition, they explored the percentage of pairwise country comparisons that were robust for all weighting structures and explored “large” changes in rankings among different countries.
The table below reports the three pairwise correlation coefficients between the rankings under the equal weight structure and each of the three alternative weighting structures for all 104 countries.
Correlations between MPI and adjusted MPIs having 50 percent weight on each dimension in turn and 25 percent on the remaining two dimensions
Pair of rankings compared Correlation coefficient All countries
MPI with equal weight and MPI with 50% weight on education
Pearson 0.991
Spearman 0.982
Tau-b 0.903
MPI with equal weight and MPI with 50% weight on health
Pearson 0.995
Spearman 0.981
Tau-b 0.909
MPI with equal weight and MPI with 50% weight on living standards
Pearson 0.989
Spearman 0.989
Tau-b 0.916
Their results suggest that changing indicator weights indeed affects poverty estimates. The country rankings, however, turned out to be quite stable. In addition, the measures of concordance across the four ranks (the original one generated by equal weighting and the three alternatives considered) showed that the degree of rank concordance was very high among countries, at 0.975 or higher.
Source: Alkire et al. (2010).

99 How to Build a National Multidimensional Poverty Index (MPI)
The analysis of how robust the results are when different parameters change, including the weights, indicators or deprivation cut-offs, can be conducted using the two tests discussed above for the case of changes in the poverty cut-off. As explained above, these two tests aim to compare the result from one MPI with a second MPI.
When analyzing changes in weights or deprivation cut-offs the same logic of analysis should be followed. For example, the comparison could be between the results of two alternative MPIs with the same structure (for instance, three dimensions, 10 indicators) but different weights (e.g., the first MPI uses nested weights, while the second MPI sets a weight of 50 percent for the first dimension and weights of 25 percent for the other two dimensions). In this case, the percentage of pairwise comparisons that are the same when using the two (or more) sets of weights is the figure to be reported, and values of the rank correlation coefficients closer to one are preferable.
Robustness analysis for changes in weights or other parameters
In most countries, survey data has been used as the source of information to compute the national MPI (see chapter 6 for details). Therefore, statistical tools used to analyze the extent to which sample parameters can be assumed as population parameters (statistical inference) should be used to analyze the reliability of each estimate. Standard errors and confidence intervals are essential statistical tools for robustness analysis and for providing reasonable policy advice.
Statistical inference informs on the reliability of the estimates produced by the candidate measures. Therefore, the analysis of the results should include statistical inference to test differences between groups (e.g., regions, urban/rural areas), among candidate measures and when analyzing the results over time (see chapter 8 for more details).
Statistical inference
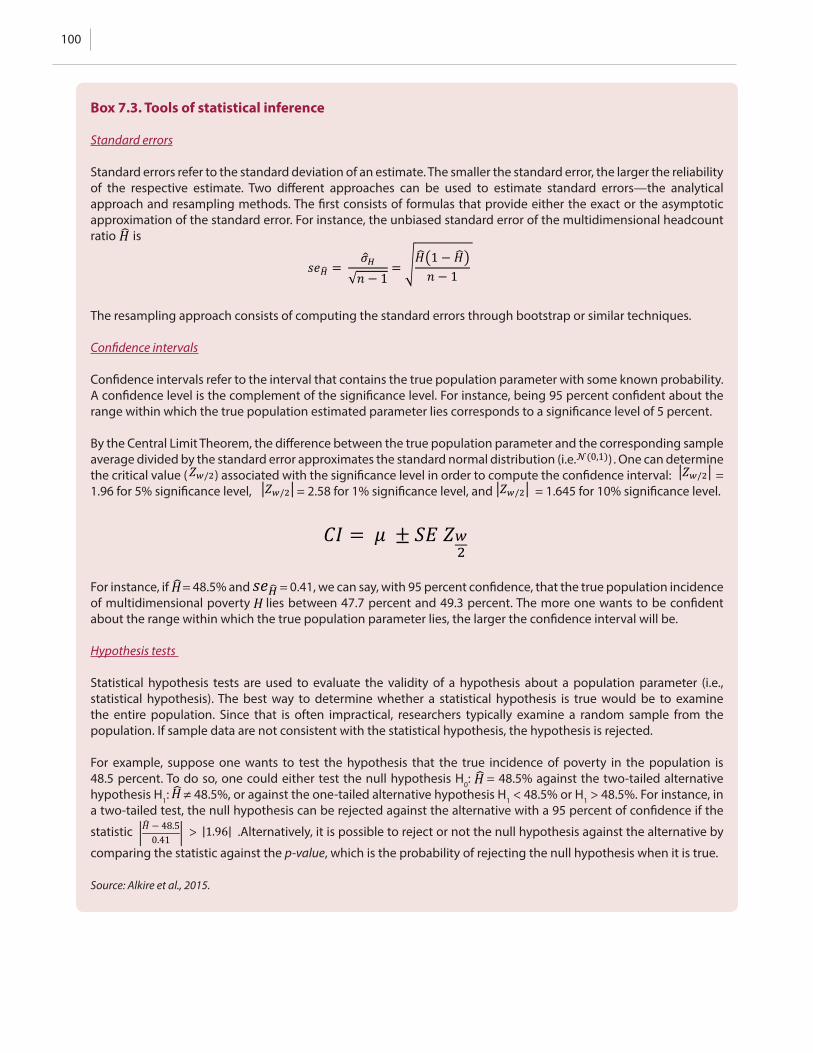
100
Box 7.3. Tools of statistical inference
Standard errors
Standard errors refer to the standard deviation of an estimate. The smaller the standard error, the larger the reliability of the respective estimate. Two different approaches can be used to estimate standard errors—the analytical approach and resampling methods. The first consists of formulas that provide either the exact or the asymptotic approximation of the standard error. For instance, the unbiased standard error of the multidimensional headcount ratio is
The resampling approach consists of computing the standard errors through bootstrap or similar techniques.
Confidence intervals
Confidence intervals refer to the interval that contains the true population parameter with some known probability. A confidence level is the complement of the significance level. For instance, being 95 percent confident about the range within which the true population estimated parameter lies corresponds to a significance level of 5 percent. By the Central Limit Theorem, the difference between the true population parameter and the corresponding sample average divided by the standard error approximates the standard normal distribution (i.e. ) . One can determine the critical value ( ) associated with the significance level in order to compute the confidence interval: = 1.96 for 5% significance level, = 2.58 for 1% significance level, and = 1.645 for 10% significance level.
For instance, if = 48.5% and = 0.41, we can say, with 95 percent confidence, that the true population incidence of multidimensional poverty lies between 47.7 percent and 49.3 percent. The more one wants to be confident about the range within which the true population parameter lies, the larger the confidence interval will be.
Hypothesis tests
Statistical hypothesis tests are used to evaluate the validity of a hypothesis about a population parameter (i.e., statistical hypothesis). The best way to determine whether a statistical hypothesis is true would be to examine the entire population. Since that is often impractical, researchers typically examine a random sample from the population. If sample data are not consistent with the statistical hypothesis, the hypothesis is rejected.
For example, suppose one wants to test the hypothesis that the true incidence of poverty in the population is 48.5 percent. To do so, one could either test the null hypothesis H0: = 48.5% against the two-tailed alternative hypothesis H1: ≠ 48.5%, or against the one-tailed alternative hypothesis H1 < 48.5% or H1 > 48.5%. For instance, in a two-tailed test, the null hypothesis can be rejected against the alternative with a 95 percent of confidence if the
statistic > .Alternatively, it is possible to reject or not the null hypothesis against the alternative by
comparing the statistic against the p-value, which is the probability of rejecting the null hypothesis when it is true.
Source: Alkire et al., 2015.
𝐻𝐻"
𝑠𝑠𝑠𝑠#$ = 𝜎𝜎(#
√𝑛𝑛 − 1= -𝐻𝐻
$/1 − 𝐻𝐻$0𝑛𝑛 − 1
𝒩𝒩(0,1) !𝑍𝑍#/%!
!𝑍𝑍#/%! !𝑍𝑍#/%!
!𝑍𝑍#/%!
𝐶𝐶𝐶𝐶 = 𝜇𝜇 ± 𝑆𝑆𝑆𝑆𝑍𝑍*+
𝐻𝐻" 𝑠𝑠𝑠𝑠#$ 𝐻𝐻"
𝐻𝐻" 𝐻𝐻"
!𝐻𝐻# − 48.50.41
! |1.96|

101 How to Build a National Multidimensional Poverty Index (MPI)
Box 7.4. Robustness analysis Bhutan 2017
The 2017 Bhutan Multidimensional Poverty Report presented different robustness tests that were applied to the national MPI, which includes three dimensions and 13 indicators. The MPI of Bhutan uses nested weights and a poverty cut-off equal to four indicators.
The results from the robustness analysis revealed that the Kendall coefficient was around 0.9 for values of k = 3 and k = 5, implying that around 90 percent of the comparisons are concordant in each case to the national MPI findings with k = 4 (table A).
When the Kendall rank correlation coefficient was calculated for different combinations of weights (each dimension taking the weight of 50 percent and the other two 25 percent), the analysis revealed that, for the three structures, the Kendall Tau-b coefficient was higher than 0.85. This implies that more than 85 percent of the comparisons are concordant in each case (table B), establishing the robustness of the MPI to a range of plausible weights from 25 percent to 50 percent per dimension.
k =4
k = 2Spearman 0.759
Kendall Tau-b 0.583
k = 3Spearman 0.927
Kendall Tau-b 0.808
k = 5Spearman 0.937
Kendall Tau-b 0.821
k = 6Spearman 0.889
Kendall Tau-b 0.764
Table A. Correlation among subnational dzongkhag ranks for different poverty cut-off. Bhutan’s national MPI 2017

102 Building and analyzing candidate measures
Table B. Correlation among dzongkhag ranks for different weight structures, Bhutan’s national MPI 2017
Results showed that 85.3 percent of the pairwise dzongkhag comparisons are robust to changes in the dimensions’ weights from 25 percent to 50 percent per dimension. In the case of variations in the poverty cut-off, 98.4 percent of the pairwise dzongkhag comparisons are robust to changes in k from 25 percent to 45 percent. Thus, the structure of the Bhutanese MPI is robust to a plausible range of weights and poverty cut-offs.
Source: (National Statistic Bureau Royal Government of Bhutan & Oxford Poverty and Human Development Initiative (OPHI), 2017).
MPI Weights 1 MPI Weights 2 MPI Weights 3
Equal weights: 33% each
dimension
50% Education25% Health
25% LS
50% Health25% Education
25% LS
MPI weights 250% education25% health25% LS
SpearmanKendall
0.952
0.852
MPI weights 350% health25% education25% LS
SpearmanKendall
0.979
0.916
0.952
MPI weights 450% LS25% education25% health
SpearmanKendall
0.977
0.884
0.922
0.758
0.934
0.800
In summary, after building the candidate measures, the robustness of each should be analyzed. First, basic disaggregation can provide useful initial results that should be compared to existing evidence. Next, the robustness of the candidate MPIs should be tested to changes in the poverty cut-offs and other parameters (indicators, deprivation cut-offs and weights); this can be done using pairwise comparisons and rank robust analysis. Finally, statistical inference will inform whether each measure generates robust and statistically significant results.
During the process of running this analysis, the technical team should maintain a fluid communication with other relevant stakeholders—in particular, with the group deciding on the final structure of the national MPI. The results should be discussed and analyzed in the context of each country. During these discussions, it is important to consider the contextual factors that may support the results and to evaluate if other candidate measures provide results that better reflect the realities of the poor in the country.

103 How to Build a National Multidimensional Poverty Index (MPI)
After conducting the robustness tests and analyzing the candidate measures, the technical team and other stakeholders are ready to define the final structure of the national MPI. At this point, it is vital to keep the discussion open between the technical and policy sides. Results of the robustness analysis need to be discussed and constant feedback should be provided to the technical team to help ensure that the final version is completely approved and validated.
Once the final structure of the national MPI has been agreed upon, it is the moment to conduct a detailed analysis of the results and some final checks. Among these, the analysis must consider how dimensions and indicators contribute to the national MPI, present results disaggregated by population subgroups and compare MPI figures with other existing poverty figures for the country.
A national MPI can be disaggregated by population subgroups. This analysis provides meaningful comparisons of urban and rural areas, subnational regions and any other groups for which the data used in the computations is representative. This is crucial information for guiding more effective and better-targeted policies aimed at reducing poverty. The results of this analysis provide information to policymakers at different levels in order to prioritize strategies and design policies for the most vulnerable groups, all with the objective of leaving no one behind.
The contribution of a subgroup to the overall MPI depends on both its level of poverty and its population share. Thus, in cases where a group (e.g., people with disabilities) has headcounts of multidimensional poverty higher than its population share, it is possible to conclude that this group is overrepresented among the poor in the country. Given the importance of analyzing the results within a specific context, population shares of each subgroup must always be presented together with the decompositions, as the analysis would be incomplete without considering them when making conclusions.
The list of subgroups can be extensive. The most intuitive are geographical, such as rural and urban areas, regions and the administrative divisions of a country (i.e. states, provinces, departments, municipalities and districts). However, disaggregations can also be done with respect to other population groups, such as by gender, age group, ethnic groups, persons with disabilities, indigenous populations, and so on. These may vary across countries and there is no rule on what disaggregations should be done. This will depend on what are the relevant disaggregations in the specific context in which the MPI is being analyzed, and the level at which the survey is representative and the sample design.
Analyzing the final measure
Subgroup decomposition
“The contribution of a subgroup to the overall MPI depends on both its level of poverty and its population share.”
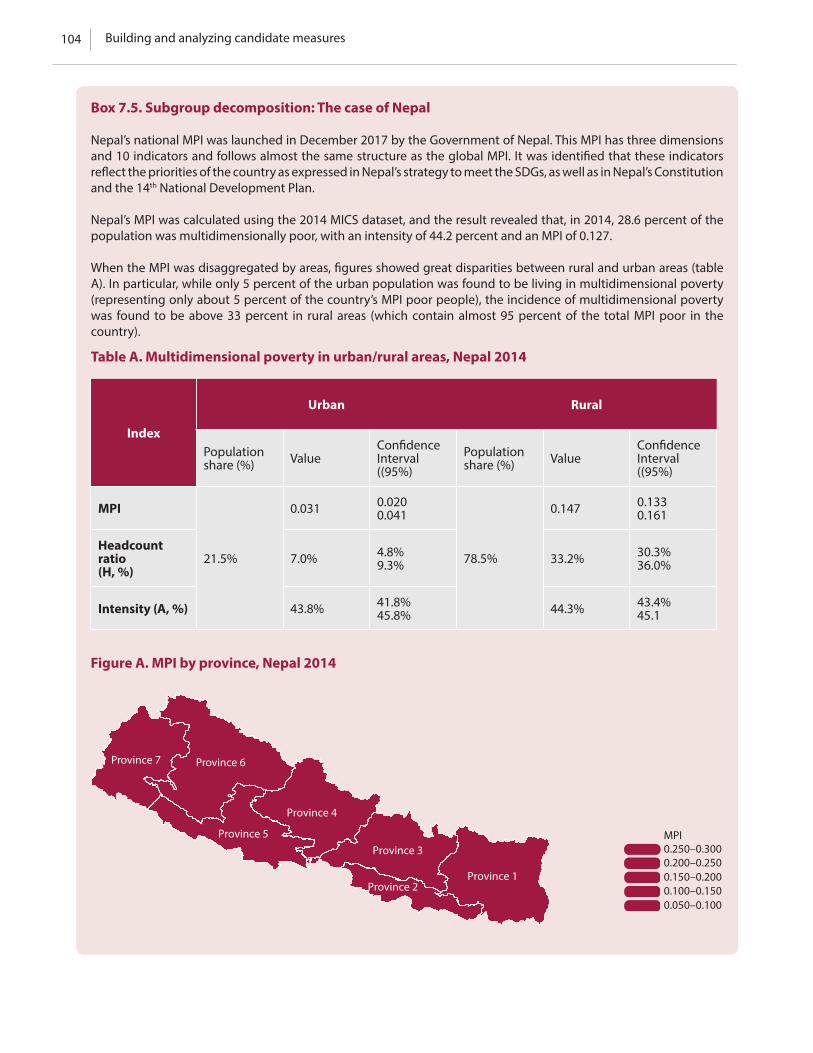
104
Index
Urban Rural
Population share (%) Value
Confidence Interval ((95%)
Population share (%) Value
Confidence Interval ((95%)
MPI
21.5%
0.031 0.020 0.041
78.5%
0.147 0.133 0.161
Headcount ratio(H, %)
7.0% 4.8% 9.3% 33.2% 30.3%
36.0%
Intensity (A, %) 43.8% 41.8% 45.8% 44.3% 43.4%
45.1
Building and analyzing candidate measures
Figure A. MPI by province, Nepal 2014
Box 7.5. Subgroup decomposition: The case of Nepal
Nepal’s national MPI was launched in December 2017 by the Government of Nepal. This MPI has three dimensions and 10 indicators and follows almost the same structure as the global MPI. It was identified that these indicators reflect the priorities of the country as expressed in Nepal’s strategy to meet the SDGs, as well as in Nepal’s Constitution and the 14th National Development Plan.
Nepal’s MPI was calculated using the 2014 MICS dataset, and the result revealed that, in 2014, 28.6 percent of the population was multidimensionally poor, with an intensity of 44.2 percent and an MPI of 0.127.
When the MPI was disaggregated by areas, figures showed great disparities between rural and urban areas (table A). In particular, while only 5 percent of the urban population was found to be living in multidimensional poverty (representing only about 5 percent of the country’s MPI poor people), the incidence of multidimensional poverty was found to be above 33 percent in rural areas (which contain almost 95 percent of the total MPI poor in the country).
Province 7 Province 6
Province 5
Province 4
Province 3
Province 2Province 1
0.250–0.300MPI
0.200–0.2500.150–0.2000.100–0.1500.050–0.100
Table A. Multidimensional poverty in urban/rural areas, Nepal 2014

105 How to Build a National Multidimensional Poverty Index (MPI)
When the MPI was disaggregated by age groups, results revealed that children younger than 10 years had the highest levels of multidimensional poverty, with an MPI equal to 0.194 (figure B). The lowest level of multidimensional poverty was found for individuals aged 18 to 24 years (MPI equal to 0.090).
Figure B. Multidimensional poverty by age group, Nepal 2014
0.00
0.05
0.10
0.15
0.20
0.25
0.30
MPI
0.194
0.1120.090
0.1110.120
0–9 years 10–17 years 18–24 years 25–57 years >57 years
Source: National Planning Commission & Oxford Poverty and Human Development Initiative (OPHI) (2018).
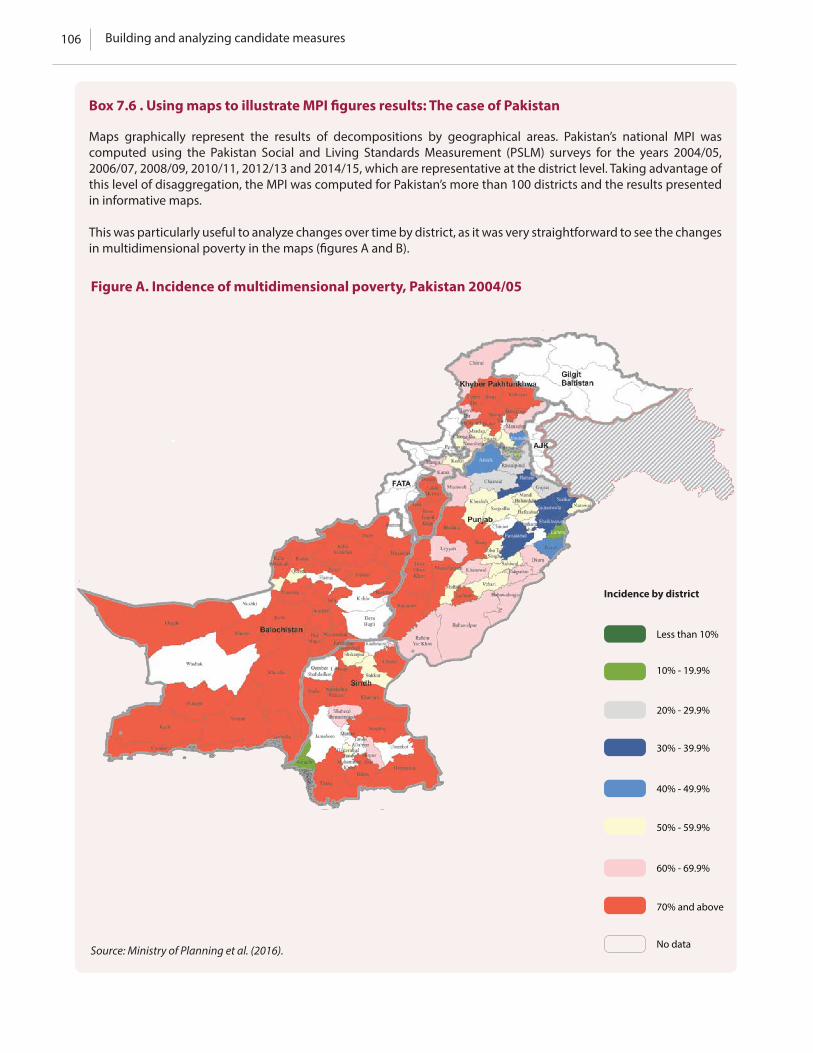
106 Building and analyzing candidate measures
Figure A. Incidence of multidimensional poverty, Pakistan 2004/05
Incidence by district
Less than 10%
10% - 19.9%
20% - 29.9%
30% - 39.9%
40% - 49.9%
50% - 59.9%
60% - 69.9%
70% and above
No dataSource: Ministry of Planning et al. (2016).
Box 7.6 . Using maps to illustrate MPI figures results: The case of Pakistan
Maps graphically represent the results of decompositions by geographical areas. Pakistan’s national MPI was computed using the Pakistan Social and Living Standards Measurement (PSLM) surveys for the years 2004/05, 2006/07, 2008/09, 2010/11, 2012/13 and 2014/15, which are representative at the district level. Taking advantage of this level of disaggregation, the MPI was computed for Pakistan’s more than 100 districts and the results presented in informative maps.
This was particularly useful to analyze changes over time by district, as it was very straightforward to see the changes in multidimensional poverty in the maps (figures A and B).

107 How to Build a National Multidimensional Poverty Index (MPI)
Figure B. Incidence of multidimensional poverty, Pakistan 2014/15
Incidence by district
Less than 10%
10% - 19.9%
20% - 29.9%
30% - 39.9%
40% - 49.9%
50% - 59.9%
60% - 69.9%
70% and above
No dataSource: Ministry of Planning et al. (2016).

108 Building and analyzing candidate measures
Box 7.7. Subgroup decomposition in Vietnam: Ethnic groups
Figure A. Multidimensional poverty incidence in Vietnam, by ethnic groups in 2012 and 2016
Source: United Nations Development Programme (2018a).
As explained in chapter 4, national MPIs based on the AF method can be broken down by dimensions and indicators to see the percentage of poor individuals or households deprived in each indicator, and how each deprivation contributes to overall poverty. That is, the MPI allows the study of the composition of poverty, which is a powerful tool for policy guidance.
It is important to notice that dimensional breakdown can be combined with subgroup decomposition. That is, the MPI can be unpacked to see, for instance, that women aged 15–49 living in urban areas are highly deprived in nutrition and ante-natal care, while young boys in rural areas lack access to proper educational centers. The richness of this information is particularly relevant for programs targeting the poor with the aim of leaving no one behind, as it helps with identifying of pockets of poverty and designing multisectoral, focused interventions for each group.
Dimensional breakdown
The national MPI for Vietnam includes five dimensions (health, education, housing, living standards and information) and ten indicators. It uses nested weights and a poverty line equal to 33%. The disaggregated results for 2016 were computed using the Vietnam Household Living Standard Survey.
A detailed analysis of the levels of multidimensional poverty of different ethnic groups in Vietnam was presented in the 2018 Human Development Report. The results revealed that, although the national incidence of multidimensional poverty is 10.9%, important differences exist between different ethnic groups. For example, on the one hand the incidence of multidimensional poverty among the Kinh majority was 6.4% in 2016, with a reduction of six percentage points between 2012 and 2016. On the other hand, the incidence of poverty among certain groups is much higher. For example, 76.2% of H’Mong are multidimensionally poor, followed by 43.4% of individuals from other ethnic groups and 37.5% of Dzao (Figure A).
It is important to highlight that the reduction in multidimensional poverty between 2012 and 2016 was more pronounced in the Thai population, as the Muong and the Nung populations. In the case of the poorest group (H´Mong), the reduction was not as pronounced.
Kinh Tay Thai Khmer Muong Nung H`Mong Dzao Others
2012 2016
100,0%
50,0%
13%6.4%
28%12%
52%
24%
43%24% 24%
7.3%
32%
13%
89%76%
56%38%
48%43%
“National MPIs can be broken down to see the percentage of people or households deprived in each indicator, and how each deprivation contributes to overall poverty.”

109 How to Build a National Multidimensional Poverty Index (MPI)
Box 7.8. Dimensional breakdown: The case of the Senegal using the global MPI
Figure A. Censored headcount ratios of each global MPI indicator, Senegal 2015
The global MPI was calculated for Senegal using data from DHS 2015 for Senegal. The results of the analysis revealed that 59 percent of people in Senegal are multidimensionally poor, with the poor experiencing an average intensity of poverty of 56.0 percent. The MPI is 0.331.
Further results show that more than 50 percent of the population are MPI poor and deprived in cooking fuel and around 48 percent are poor and deprived in school attendance (figure A).
When disaggregating by rural and urban areas, results show that the percentage of people who are multidimensionally poor and deprived in cooking fuel in rural areas is close to 80 percent, and in the case of school attendance it was higher than 60 percent (figure B). Urban areas show better results for all indicators included in the analysis.
Years of Schooling
School Attendance
Child Mortality
Nutrition
Electricity
Sanitation
Drinking Water
Floor
Cooking Fuel
Assets
0.0% 10.0% 20.0% 30.0% 40.0% 50.0% 60.0%
Note: Higher values indicate higher levels of multidimensional poverty.Source: Andhra Pradesh Multidimensional Proverty Index Report 2017.
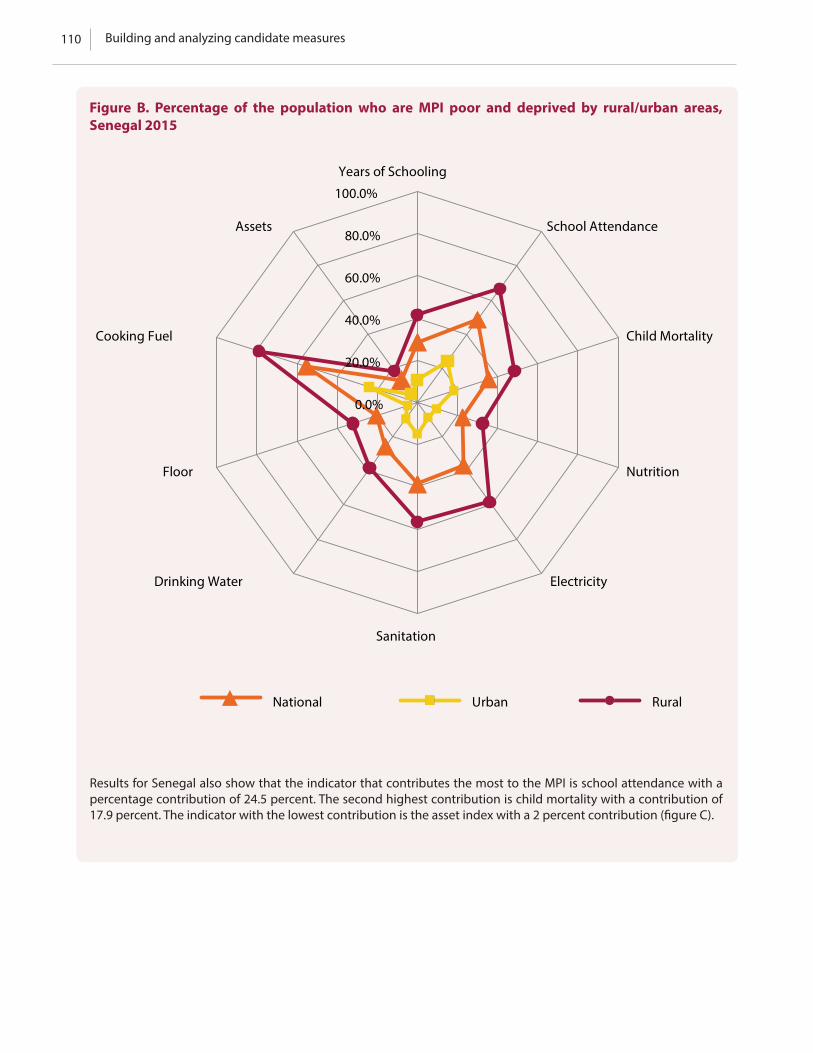
110 Building and analyzing candidate measures
Figure B. Percentage of the population who are MPI poor and deprived by rural/urban areas, Senegal 2015
Results for Senegal also show that the indicator that contributes the most to the MPI is school attendance with a percentage contribution of 24.5 percent. The second highest contribution is child mortality with a contribution of 17.9 percent. The indicator with the lowest contribution is the asset index with a 2 percent contribution (figure C).
0.0%
20.0%
40.0%
60.0%
80.0%
100.0%
Years of Schooling
School Attendance
Child Mortality
Nutrition
Electricity
Sanitation
Drinking Water
Floor
Cooking Fuel
Assets
National Urban Rural
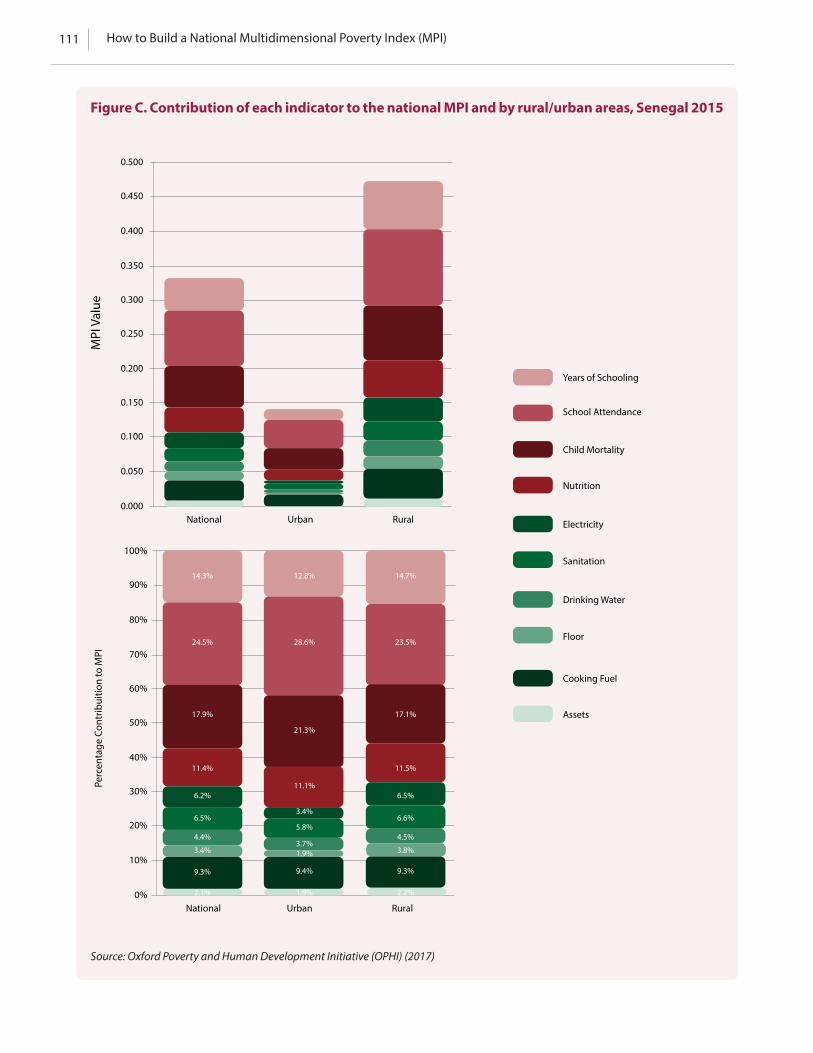
111 How to Build a National Multidimensional Poverty Index (MPI)
Figure C. Contribution of each indicator to the national MPI and by rural/urban areas, Senegal 2015
Source: Oxford Poverty and Human Development Initiative (OPHI) (2017)
0.500
0.450
0.400
0.350
0.300
0.250
0.200
0.150
0.100
0.050
0.000
100%
90%
80%
70%
60%
50%
40%
30%
20%
10%
0%
14.3%
24.5%
17.9%
11.4%
6.2%
6.5%
4.4%
3.4%
9.3%
2.1%
12.8%
28.6%
21.3%
11.1%
3.4%
5.8%
3.7%1.9%
9.4%
1.9%
14.7%
23.5%
17.1%
11.5%
6.5%
6.6%
4.5%
3.8%
9.3%
2.2%
Years of Schooling
School Attendance
Child Mortality
Nutrition
Electricity
Sanitation
Drinking Water
Floor
Cooking Fuel
National Urban Rural
National Urban Rural
Assets

112 Building and analyzing candidate measures
Box 7.9. Multidimensional Poverty Index in Andhra Pradesh, Indian State
Figure A. District levels of MPI
Finally, the analysis of the percentage contribution of each indicator shows that years of schooling and nutrition are the two indicators that contribute the most to the MPI (Figure B).
Andhra Pradesh is the first Indian state to publish an official regional MPI in the country. The MPI was published in 2018, and its objectives are to understand the multidimensional deprivations faced by people living in this state, to support evidence-based policymaking in reducing multidimensional poverty, and to benchmark itself against other states and countries with respect to multidimensional poverty reduction.
Andhra Pradesh has adopted the global MPI structure with three dimensions (education, health, and living standards) and their associated ten indicators.
The results of the MPI for 2018, using the 2016–17 household survey conducted by the Vision Management Unit (VMU), reveal that 21% of individuals living in the state are multidimensionally poor, with an intensity equal to 39.3% and a state MPI of 0.083. Important differences are observed between the levels of incidence and MPI between the 14 districts of the state (Figure A).
0.0468 to 0.07310.0816 to 0.08840.1079 to 0.1271
Srikakulam
Vizianagaram
Visakhapatnam
East Godavari
West Godavari
Krishna
Guntur
Prakasam
Nellore
Chittoor
Kurnool
Anantapur
Kadapa
District MPIEast Godavari 0.0468
Nellore 0.0610
Chittoor 0.0696
Srikakulam 0.0696
West Godavari 0.0705
Guntur 0.0731
Krishna 0.0816
State 0.0825
Kadapa 0.0851
Prakasam 0.0865
Visakhapatnam 0.0884
Anantapur 0.1079
Kurnool 0.1191
Vizianagaram 0.1271
India
Andhra Pradesh Years of Schooling34.6%
School Attendance3.2%
Child Mortality1.2%
Nutrition32.5%
Electricity1.0%
Sanitation 6.7%
Water2.7%
Cooking Fuel10.0%
Assets4.4%
Housing3.9%

113 How to Build a National Multidimensional Poverty Index (MPI)
Figure B. Contribution of each indicator to the MPI for Andhra Pradesh
0.0468 to 0.07310.0816 to 0.08840.1079 to 0.1271
Srikakulam
Vizianagaram
Visakhapatnam
East Godavari
West Godavari
Krishna
Guntur
Prakasam
Nellore
Chittoor
Kurnool
Anantapur
Kadapa
District MPIEast Godavari 0.0468
Nellore 0.0610
Chittoor 0.0696
Srikakulam 0.0696
West Godavari 0.0705
Guntur 0.0731
Krishna 0.0816
State 0.0825
Kadapa 0.0851
Prakasam 0.0865
Visakhapatnam 0.0884
Anantapur 0.1079
Kurnool 0.1191
Vizianagaram 0.1271
India
Andhra Pradesh Years of Schooling34.6%
School Attendance3.2%
Child Mortality1.2%
Nutrition32.5%
Electricity1.0%
Sanitation 6.7%
Water2.7%
Cooking Fuel10.0%
Assets4.4%
Housing3.9%
Comparisons with other poverty measures
As discussed in chapter 1, one of the possible purposes of a national MPI is to complement existing poverty measures in a country. Therefore, after analyzing the results of the national MPI itself, it is advisable to compare and complement these findings with those of existing poverty figures. In particular, if the same data source is used for both the national MPI and other poverty measures, it is possible to build interesting cross-tabulations across these measures. These will show the proportion of people and/or households who are considered multidimensionally poor and poor by other measures and, most interestingly, those who are classified differently by each measure. This type of analysis reveals the complementarity of the national MPI and, for example, income poverty measures, as it shows that people may be poor in both income and multidimensional poverty or in just one of them.
Other illuminating comparisons include looking at the monetary quintiles to which the MPI poor households belong (usually there are some MPI poor people who belong to the richest income or consumption quintiles) and comparing MPI poverty and monetary poverty by household size (usually monetary poverty increases monotonically, whereas the MPI is less sensitive to household size). Finally, the analysis of comparing monetary and non-monetary poverty can also be conducted across time, looking at whether the trends of both measures are similar or whether they lead to different/complementary conclusions.
Source: John et al. (2018)
“After analyzing national MPI findings, compare and complement them with existing poverty figures, particularly where the data source is the same.”

114 Building and analyzing candidate measures
Box 7.10. Comparing income and multidimensional poverty
Source: Secretaría de Coordinación General de Gobierno y El Instituto Nacional de Estadística (SCGG-INE) (2016)
Honduras presented its national MPI in October 2016. The general purpose of this measure is to improve the analysis and evaluation of social policies in the country. The national MPI has four dimensions (health, education, employment and housing) and 15 indicators.
Honduras’ national MPI was computed using the Multipurpose Survey, which is the same survey used to calculate income poverty. This provided an opportunity to not only compare the number of individuals who
are multidimensionally poor with those who are income poor, but to look directly at whether the multidimensionally poor are also income poor, and vice versa. The analysis revealed that, although the incidence of multidimensional and monetary poverty were similar (74 percent and 70 percent, respectively), the proportion of people who are poor by both measures was only 53 percent. That is, 17 percent of the population was identified as being only income poor and 21 percent as only MPI poor.
Box 7.11. How to revise the national MPI
The process of building and analyzing the results of a national MPI implies creating different trial measures and analyzing how the results of the measure change when using different weights, and deprivation and poverty cut-offs. A detailed, robust analysis provides helpful information to support normative decisions.
After the final MPI is chosen, an in-depth analysis of the levels of multidimensional poverty of different subgroups should be conducted, as well as a study of how each dimension and indicator contributes to the national MPI. Maps are always useful to illustrate differences between regions or districts. The measure should only be launched officially only after this analysis has been completed.
Conclusions
Even the best MPI will need updating, and so this should be planned from the beginning. While there are many good practices shared between the MPI and any other statistic in terms of transparency of the revision process (such as consultations with key stakeholders, rigor and clarity of communication), there are three principles that are particularly essential when updating a national MPI:
• The MPI should ordinarily be reviewed every 10 years to see if indicators and specifications need to change. It should not be changed in the first five years unless the MPI is launched with an announcement that some changes will be made in the short term due to improvements in the data used for the calculations, as happened in Chile and Honduras. When revising the indicators, aspects related to how the country has changed in the last 10 years, what the current priorities are, and what other dimensions and indicators have become an issue in the analysis of poverty in the country should be considered. The process of revising the national MPI needs to include discussions with experts, academics, policymakers and the community to gain validity and legitimacy.
• To guarantee the sustainability of the national MPI, it must be very clear to all what institution(s) or committee(s) have
- the authority to undertake the technical work to revise the MPI. - the authority to approve a revised measure as - the official MPI.- the authority to change the survey or data the MPI is based on, in ways that would affect how the MPI could be computed.
• If all institutional arrangements are clear, then it is easier to decide the best moment to start the discussions and consultations that will decide what changes should be implemented. The political and technical implications of revising a national MPI must be considered, as well which institutions should commit human and economic resources to guarantee that this process is undertaken.
• The year the revision is implemented, both the old MPI and the new MPI estimations must be published, so there is no break in the series.

115 How to Build a National Multidimensional Poverty Index (MPI)
Chapter 8. Changes over time
One of the main motivations for computing a poverty measure is to track and analyze changes in poverty over time. All countries with national MPIs will report changes in the levels of multidimensional poverty and its component indicators over time. When they launch their MPI, many countries also back-compute the MPI, insofar as is possible for previous time periods, to provide a series. For example, when Ecuador launched its national MPI in 2015, it also revealed the trend in the MPI since 2009.
This chapter discusses how to build and analyze trends using the MPI and its associated partial indices (incidence, intensity, and censored and uncensored headcount ratios) using repeated cross-sectional data (samples that are independently drawn at different points in time). It also includes a brief section on the analysis that can be done in the unusual cases in which longitudinal or panel data are available.
The main concern when comparing the national MPI or its associated indices across different periods is ensuring that the measures under analysis are strictly comparable. Comparability requires an identical definition of deprivations in the different years, including the definitions of the indicators, cut-offs and weights. Because older questionnaires may have been modified (e.g., questions are added and rephrased, or response options are adjusted to fit a changing context), this requires close verification of survey questions and response structures. It is common that one or more indicators are not comparable or not available in previous surveys. In this case, a reduced-MPI can be computed using only the remaining indicators, which have been re-weighted. In any case, one of the first steps in the analysis of changes over time is to harmonize the parameters of the measures under analysis to guarantee strict comparability.
Box 8.1. Harmonizing indicators in Bhutan
Source: National Statistic Bureau Royal Government of Bhutan (2013).
Introduction
Strict comparability
When Bhutan launched its national measure in 2012, they also published an analysis of how the MPI had changed in recent years. The national measure was built using the Bhutan Living Standards Survey 2012 (BLSS 2012), with an analysis of trends from the BLSS 2007 and the Bhutan Multiple Indicators Survey (BMIS) 2010.
Neither of the previous datasets contained the exact same indicators of the national MPI. Therefore, to assure strict comparability over time, Bhutan created two additional poverty measures, one comparing BLSS 2007 and BLSS 2012, and another comparing BMIS 2010 and BLSS 2012. The indicator definitions, weights and deprivation cut-offs used in these comparisons over time differ from the national MPI figures. For example, unlike BLSS 2012, BLSS 2007 did not include information on child mortality. As a result, the indicator on child mortality was not included in the comparable MPI and the weight of the other health indicator, food security, was adjusted such that the dimension of health had the same weight. To avoid confusion, the main report stressed the MPI and headcount ratios of the official measure; the section on changes over time emphasized the rates of absolute and relative change.

116
Once the measures are comparable across time, it is possible to compute the absolute rate of change, which is the absolute difference in poverty levels between two periods. It is also possible to calculate the relative rate of change, which is the difference in levels of poverty across two periods, presented as a percentage of poverty levels during the initial period.4
For example, if the national MPI has fallen from 0.500 to 0.400 between two consecutive years, then the absolute rate of change is (0.500–0.400) = 0.100. This tells us that 10 percent of the total possible set of deprivations that poor people in that society could have experienced has been eradicated. The relative rate of change is (0.500–0.400)/0.500 = 20%, which tells us that the national MPI has been reduced by 20 percent with respect to the initial level.
Both absolute and relative rates should be reported and analyzed. Absolute changes are easy to understand and compare and are usually given priority. Relative changes have value-added when analyzing changes in regions with lower levels of multidimensional poverty. A region or country with a high initial level of poverty may be able to reduce poverty in absolute terms more than one country with a lower initial level of poverty. However, a small poverty reduction in a region with low initial poverty levels might be quite large relative to its initial level, thus this progress should not be ignored due to its smaller absolute reduction. The analysis of both absolute and relative changes gives a clear sense of the overall progress of poverty reduction across groups with different initial levels of poverty.
An important component of guaranteeing strict comparability is to verify that the sample design of the surveys informing the computation of the measures for different years is meaningfully comparable. This implies that the samples from the different periods were drawn using the same method, have a comparable structure, use the same categories to define the strata (e.g., urban vs. rural, and regions) and primary sampling units (e.g., blocks), and that these categories have the same definition for all the analyzed periods. Furthermore, both samples must be representative for the same groups in order to compare how multidimensional poverty has changed over time for specific subgroups.
Harmonization is less demanding when using national household surveys that are collected regularly, using the same sample frames and questionnaires across time (specific survey questions may still change, however). For example, Ecuador has based its national MPI on an annual survey (the National Survey on Employment, Unemployment and Underemployment) that follows the same sample frame and uses similar questionnaires every year (Instituto Nacional de Estadistica (INEC), 2015). Thus, it was possible to compare the national MPI estimates for the period 2009–2015.
Absolute and relative changes
Changes over time
4 The absolute rate of change (Δ) is the difference in the indices (MPI, H, A, censored and uncensored headcount ratios) between two periods (t2 and t1). It is computed for MPI as: ∆MPI = MPIt2 - MPIt1. The relative rate of change (δ) is the difference in poverty as a percentage of the initial poverty level, computed for MPI as 𝛿𝛿𝛿𝛿𝛿𝛿𝛿𝛿 =
𝛿𝛿𝛿𝛿𝛿𝛿&' − 𝛿𝛿𝛿𝛿𝛿𝛿&)𝛿𝛿𝛿𝛿𝛿𝛿&)
× 100 .

117 How to Build a National Multidimensional Poverty Index (MPI)
When analyzing these changes over time, it is essential to conduct statistical tests to infer if observed poverty reductions (or increases) are real (i.e., statistically significant). Given that the main source of data to calculate national MPIs are household surveys using samples of the population (see chapter 6), changes in the point estimates of the levels are not sufficient to draw reliable conclusions regarding poverty trends. Instead, an analysis using statistical inference should be conducted when analyzing changes in the MPI and its associated partial indices (as discussed in chapter 8). In this case, the differences to be analyzed are the changes in MPI (or in the intensity or incidence of poverty) that are significantly different from zero. In some cases, the differences between the levels of poverty between years 1 and 2 are not significantly different, but the reduction (increase) in poverty can still be significantly different from zero.
A reduction in the levels of the MPI can be driven by a reduction in the incidence or in the intensity of poverty among the poor, or a combination of both (Apablaza & Yalonetzky, 2013). Normally, the absolute reduction in incidence is greater than the one in the intensity. This is partly because, if the poverty cut-off is above one deprivation, the range for the change in incidence will be greater than the range for intensity. For example, in the case of the global MPI, incidence can vary between 0 and 100 percent, while intensity can only vary between 33 percent and 100 percent. A second reason is that the “natural” tendency of intensity might be to rise if the incidence of multidimensional poverty decreases (resulting from the fact that if the least poor are leaving poverty, average deprivation among the remaining poor increases). However, reductions in MPI can be driven by both a reduction in the proportion of people who are poor and/or a reduction in the number of deprivations faced by multidimensionally poor individuals. Therefore, policymakers have incentives to implement strategies to reduce poverty for those close to the poverty line (reduction in the incidence) and for those living in severe poverty (reduction of intensity).
Besides comparing the rate of change in the MPI, H and A, changes in the number of poor people over time must also be examined. It often occurs that, although the incidence of poverty decreases, the number of poor people actually increases. This happens if the population growth rate is larger than the rate of poverty reduction. To reduce the absolute number of poor people in a country, the relative rate of reduction in H needs to be faster than the population growth. The cost of reducing poverty depends on the number of poor people, so this is a fundamental statistic for policy.
“A reduction in the levels of the MPI can be driven by a reduction in the incidence or in the intensity of poverty among the poor, or a combination of both.”

118
Box 8.2. Robustness analysis of changes in poverty over time
Figure A. MPI by different values of the poverty cut-off, Pakistan 2004 and 2011
Source: Ministry of Planning et al. (2016).
A key question for policy is which deprivations were successfully reduced over time. Generally, it is necessary to analyze changes in the uncensored headcount ratios (hj) and in the censored headcount ratios (hj (k)).
Given the MPI’s dimensional breakdown property (see chapter 4), the absolute rate of reduction in the MPI can be expressed as the weighted average of the absolute rate of reduction in the censored headcount ratios of each indicator. The weighting structure of the national MPI affects how strongly changes in the censored headcount ratios affect the MPI. For example, in the global MPI, the nutrition indicator is assigned a weight that is three times higher than electricity’s. This implies that a one percentage point reduction in the censored headcount ratio of nutrition ceteris paribus would lead to an absolute reduction in the global MPI that is three times larger than a one percentage point reduction in the censored headcount ratio of electricity.
Changes in indicators
Changes over time
Even when one concludes that the reduction in MPI (or in its associated partial indices) is statistically significant, it is still possible to question whether the decline in multidimensional poverty is also robust to different poverty cut-offs. This issue was addressed in the analysis of changes over time using Pakistan’s national MPI. After concluding that the national MPI had statistically significantly declined between 2004 and 2011 for a poverty cut-off of 33 percent, changes in
the levels of MPI, H and A were analyzed for all possible poverty cut-offs.
Results showed that the MPI level in 2011 was always lower than the 2004 MPI for all possible poverty cut-offs. Thus, one can conclude that between 2004 and 2011, Pakistan reduced multidimensional poverty significantly, regardless of the poverty cut-off considered (figure A).

119 How to Build a National Multidimensional Poverty Index (MPI)
Although the arithmetic contribution of each indicator to the absolute change is easy to compute, interpreting the real, on-the-ground contribution of each indicator to the change in the MPI is not so mechanical. The reason is that a change in the censored headcount ratio of an indicator is not independent of the changes in other indicators. A reduction in the censored headcount ratio of an indicator can be triggered by two different types of events: a poor person became non-deprived in that indicator or because a poor person who had been deprived in that indicator became non-poor due to reductions in other indicators, but remains deprived in that indicator.5 Having longitudinal data, however, would permit pinpointing on-the-ground changes (Suppa, 2018).
The comparison of changes in uncensored and censored headcount ratios provides information to analyze the relation between dimensional changes among the poor and society-wide changes in deprivations. For example, if the reduction in the uncensored headcount ratio of an indicator is lower than the reduction in its censored headcount ratio, this suggests that some non-poor people remain deprived in this indicator. However, it is important to consider that, when using repeated cross-sectional data, the comparison between changes in uncensored and censored headcount ratios is also affected by migration and demographic shifts, as well as by changes in the deprivation profiles of the non-poor.
The gains in poverty reduction might be distributed very differently across different population subgroups, like regions or ethnic groups (Alkire & Seth, 2015). Therefore, when analyzing poverty over time, it is vital to study poverty reduction by subgroups. In practice, the harmonized poverty indices (MPI, H, A and the uncensored and censored headcount ratios) are first estimated for each subgroup and period, and then the absolute and relative rates of change are estimated for each subgroup. In addition to this, to fully understand the change in overall poverty, it is necessary to examine the evolution of the population shares of each subgroup, and it is useful to perform an analysis of changes in the levels of deprivation across subgroups, in order to examine the key drivers of poverty reduction.
Changes across groups
5 In this case, although the number of people deprived in that indicator does not change, the censored headcount ratio decreases because in the second period the person’s deprivation in that indicator is now censored because the individual became non-poor.

120
Box 8.3. Reporting changes in multidimensional poverty
Figure A. Pakistan’s national MPI, 2004/05–2014/15
Source: Ministry of Planning et al. (2016).
Alternatively, Mozambique has used maps to illustrate changes in the incidence of multidimensional poverty across subnational regions. Figure B shows that between 1996/97 and 2014/15 the incidence of multidimensional poverty fell in all provinces and suggests that the differences in the level of poverty between the North and the South have remained, if not increased.
Changes over time
Different graphs can be used to report the changes in the levels of multidimensional poverty in a country. In all cases it is recommended not only to include the absolute or relative change but also to use statistical inference. As discussed in chapter 7, when working with survey data, conducting statistical inference analysis is mandatory in order to know if differences are real or just the result of the sample used to calculate the national MPI.
A simple bar graph can improve the communication of changes over time. Figure A illustrates an example from Pakistan. Depending on the target audience, one might include the error bars of each estimate in the graph and/or include a table with information on the statistical significance of the changes, or simply mention this in the text.
0.2920.281
0.260
0.2280.207 0.197
0.000
0.050
0.100
0.150
0.200
0.250
0.300
0.350
2004/05 2006/07 2008/09 2010/11 2012/13 2014/15

121 How to Build a National Multidimensional Poverty Index (MPI)
Figure B. Incidence of multidimensional poverty, Mozambique 1996/97–2014/15
Source: Ministry of Economics and Finance (2016).
Incidence by state/province [%]
Ecuador used another variation of bar graph to illustrate the absolute change in the MPI, as well as the change in the absolute contribution of each indicator. Besides presenting the magnitude of the changes in the MPI, figure C also shows that the relative contribution of the indicators was relatively stable between 2009 and 2015.
0 - 10
10 - 20
20 - 30
30 - 40
40 -50
50 -60
60 -70
70 -80
80 -90
90 -100
1996/97 2002/03 2008/09 2014/15
Figure C. Breakdown of Ecuador’s MPI by indicator, 2009–2015
0.272
3.8
3.8
3.9
3.7
2.6
3.5
3.3
3.6
3.32.4
3.0
2.9
3.22.82.0
2.92.8
2.82.71.9
2.82.7
3.02.61.8
2.82.7
2.62.61.9
2.72.62.42.41.9
2009 2010 2011 2012 2013 2014 2015
0.240
0.2060.191 0.190 0.181 0.170
No free higher education
Overcrowding
Without sanitary sewer system
Without public water system
MPI
Child Labour
Extreme income poverty
Lack of housing
Unemployment and underemployment
Without garbage collection service
Lack of attendance primary and secondary school
Lack of contributory pension system
Poor educational achievement
Source: Instituto Nacional de Estadistica (INEC) (2015).

122
A bar graph can also be used to plot changes in the indicators’ headcount ratios. In figure D, produced based on Nepal’s national MPI figures, the height of each bar represents the rate of absolute change in the period under analysis. These changes should be interpreted alongside the starting level of the headcount ratio, if deprivation in year 1 was small, then a small change can be significant and relevant. The figure shows there were significant improvements in all indicators included in Nepal’s national MPI between 2006 and 2014.
Changes over time
Figure D. Absolute change in uncensored headcount ratios, Nepal 2006–2014
Source: National Planning Commission & Oxford Poverty and Human Development Initiative (OPHI) (2018)
In terms of changes across groups, figure E shows an analysis of poverty reduction among dzongkhags in Bhutan. The figure exemplifies a way to show whether the poorer regions are reducing poverty faster than the other regions or not. The starting level of the MPI is plotted on the horizontal axis, with the highest poverty districts on the right. The absolute change in the MPI is plotted vertically, with the best-performing districts appearing at the bottom of the graph. Note that the zero value on the vertical axis denotes no change in poverty, whereas positive values indicate an increase in poverty. Figure E shows a relatively downward trend or convergence Alkire et al. (2017b).
Calculations based on data from MICS 2014 and DHS 2006
-5
-10
-15
-20
-25
-30
-35
-40
-45
0
Perc
enta
ge p
oint
s -15.79***
-8.29***
-20.25***
-12.54***
-31.02***-34.03***
-7.33***
-30.23***-30.1***-31.74***
E FR AN CM S WYS SA CF

123 How to Build a National Multidimensional Poverty Index (MPI)
Figure E: Poverty reduction by dzongkhags, Bhutan 2012–2017
Source: National Statistic Bureau Royal Government of Bhutan & Oxford Poverty and Human Development Initiative (OPHI) (2017).
Abs
olut
e Ch
ange
in M
PI
0.04
0.02
0.00
-0.02
-0.04
-0.06
-0.08
-0.10
Bumthang
Sarpang
Paro
Haa
Pema Gatshel
Lhuentse
Trashigang
Samdrup Jongkhar
Zhemgang
Punakha
Tsirang
Trashi Yangtse
Samtse
Chhukha
Trongsa
Monggar
Wangdue Phodrang
Gasa
MPI in year 1
0.01 0.03 0.05 0.07 0.09 0.11 0.13 0.15
Authors’ calculations based on data from BLSS, various waves
Dagana
There are two basic types of data across time: repeated cross-sectional data and longitudinal data. As noted, the first refers to samples that are independently drawn at different points in time. Examples of this type of data are national household surveys and the different waves of MICS and DHS. In contrast, for longitudinal data, also called panel data, a sample is drawn once, and units are then tracked over several periods. Collecting deprivation data of tracked individuals or households over time is, however, expensive and rare. Thus, most data available for the analysis of changes in multidimensional poverty over time are repeated cross-sectional data.
When using repeated cross-sectional data, it is possible to estimate changes in the MPI, H and A, but it is not possible to infer how or why those changes occurred. For instance, a reduction in incidence might be the result of people exiting poverty or the result of some people leaving poverty while others (fewer) fell into poverty. When using longitudinal data, the analysis can show exactly how poverty reduction occurred, identifying who exited poverty, who fell into poverty, who continued being poor and how an individual’s or household’s deprivations changed over time.
Using longitudinal data

124
Conclusions
Changes over time
For policy purposes, it could be interesting to analyze poverty dynamics more carefully. One could, for instance, identify possible causes of poverty transitions or measure chronic poverty. The intensity of poverty of people who recently became poor would reveal if they are just under the poverty line or whether they face a large number of deprivations (high intensity poverty), perhaps due to a shock or a crisis (e.g., health or natural calamity shocks). Intensity changes among the ongoing poor would show whether their deprivations are declining, even though they have not yet exited poverty. When using panel data, it is possible to estimate these changes precisely. Additionally, the change in the MPI can be decomposed into the change due to households moving into and out of poverty, and the change in the intensity of the ongoing poor population.6
An analysis of changes in the levels of deprivation and multidimensional poverty in a country includes different elements. First, strict comparability of the data in cases where cross-sectional data is used must be guaranteed. Second, indicators should be harmonized so they are comparable over time. Third, the actual analysis should include both absolute and relative changes in H, A, MPI, as well a detailed analysis of the changes in the uncensored and censored headcounts of each indicator to better understand the factors leading the observed trends. Calculating standard errors for statistical inference and other robustness checks is required to analyze changes over time when using a survey. In summary, the analysis of changes over time not only provides important information to understand some of the possible causes of the changes on the national MPI, it also helps to identify both policy failures and policy successes.
6 For more details on dynamic subgroup analysis using panel data, see Alkire, S., Apablaza, M., Chakravarty, S. & Yalonetzky, G. (2017a) Measuring chronic multidimensional poverty. Journal of Policy Modeling, 39(6), 983–1006, Alkire, S., Roche, J. M. & Vaz, A. (2017b) Changes Over Time in Multidimensional Poverty: Methodology and Results for 34 Countries. World Development, 94(Supplement C), 232–249.

125 How to Build a National Multidimensional Poverty Index (MPI)
Chapter 9. Presenting the national MPI
Having reached a consensus about the final structure of the national MPI and computed and analyzed the results, it is time to present the national measure to the public. To do justice to the efforts that went into its making and provide the best chance of success, a well-organized launch is absolutely critical. In preparation, care must be taken to decide how best to communicate the results of the national MPI and who will be involved in this process. The public launch is a turning point for the MPI. It is both the result of the process of developing the index and the beginning of the process of using it a policy tool. Thus, the launch of the MPI is a key moment, and its relevance in solidifying the measure should not be overlooked.
The MPI can be presented at an official high-level event or through the publication of the structure and results. As with any new official statistic, it should have strong political support to ensure sustainability. In this sense, having a launch event usually helps to signal support and raise visibility, especially when the president, vice president or a minister takes part. With their presence, it is also more likely that the media will cover the event.
Some objectives of the launch can be (1) to present the structure of the national MPI and justify it; (2) to announce the results of the first MPI, with details of the headcount, intensity and MPI, and the relevant breakdown of the results; (3) to demonstrate the technical competence and support of the agency that computed the MPI; (4) to show that the MPI is the result of a process of discussion and validation that included local and international experts, civil society, NGOs, etc.; (5) to reveal the poverty trends of recent years; and (6) to explain how the MPI will be used for coordination and policy.
The strategy for presenting the measure starts well before the day of the launch. As analyzed in chapter 2, there are different actors who should be engaged in the process of designing and computing a national MPI. For some time before the launch, the various key audiences will have been involved in on-going communications and discussion. These include the government, academics, civil society, local NGOs, the private sector, the media and international organizations, among others.
Several additional steps may be taken prior to the official presentation of the national MPI, depending on the specific context:
• Ensure that the dimensions and indicators of the national MPI are approved by the appropriate government body. This needs to be solidly confirmed before the launch.
• Determine who is still skeptical or critical of the MPI. Once identified, a strategy for reaching out and building support can be planned. Of
Introduction
Before the launch
“The public launch is both the result of the process of developing the index and the beginning of the process of using it a policy tool.”

126
course, some people might not be fully convinced, but it is always necessary to reach out, listen to their concerns and provide an explanation so that any criticism is informed.
• Offer a one or two-day training workshop for journalists (print, radio, TV, online) on the MPI and how to best report it. Several countries, including Colombia, El Salvador, Costa Rica and Panama, organized such workshops with the media to clarify the purpose of the new measure and present the structure of the MPI before the official presentation to the public. In some cases, embargoed figures were also shown, with explanations on how to read the results and how they related to existing poverty measures in the country. As influencers with large audiences, it is essential to engage the media and opinion leaders, correct any misconceptions about the MPI, and seek their support for the measure as a tool to energize poverty reduction policies. Some countries hired a communication expert to help with messaging and placement of media stories.
The main purpose of the launch of the national MPI is to present the new measure of multidimensional poverty to the country. By the time of the launch, the concept of multidimensional poverty should not be new. Stakeholders and the society at large should be aware that this process has been taking place. However, even if a good communication strategy has been implemented, there will be many who do not know about the MPI or its importance.
This is the first opportunity to present the results of the MPI. Therefore, the launch needs to be a careful mix of technical details with big, clear headlines. The launch is an opportunity to clearly spell out what the MPI is and its value. It is also the place to emphasize the usefulness of the MPI for policy purposes and for reducing poverty. People often remember real cases of people, not just numbers, so it is useful to include real experiences of poverty in the presentation.
Some basic guidelines and steps for the launch would include:
• Be clear about the objectives of the launch and customize the event to the context of the country.
• Make sure that the launch addresses each of the objectives. Since the objectives to engage with different actors are diverse, the messages must be tailored to the various key audiences and stakeholders.
• Decide who will be invited to the launch.
• Choose where to hold the launch. Several countries have launched the MPI in the president’s palace or the vice president’s offices. Others selected a “neutral” setting with the intention of sending the message that the national MPI is a state matter (e.g., Chile).
• Designate a host for the event. Ideally, a high-level authority such as the president or the vice-president should host and open the event. The political leader of the process also needs to be present, as well as
Launch of the national MPI
Presenting the national MPI
“The launch should be a careful mix of technical details and big, clear headlines; clearly spelling out the MPI’s value and usefulness”.

127 How to Build a National Multidimensional Poverty Index (MPI)
the head of the statistical institute, the technical team, donors and other relevant stakeholders. The measure should be presented as the result of teamwork and not the initiative of one individual or ministry. It is good to have a number of ministers whose work will be affected by the MPI present at the launch, showing their support.
• Agree on who will speak at the event. Experience has shown that the speakers need to be a mix of highest-level policymakers and technical people. In Costa Rica, for instance, the launch was held at the President’s palace. The President introduced the session and gave the MPI his full support. He was followed by comments by the Vice-President and the Minister of Human Development, who had jointly led the process. A representative of OPHI validated the technical robustness of the measure and then the head of the National Institute of Statistics made a more detailed presentation of the results. The latter is the only presentation that used graphs and tables, which were important in explaining the MPI. All except the President participated in a Q & A session following the presentations.
• Decide on the speakers’ key messages and make sure that critical points are covered to help guarantee support by key stakeholders and avoid confusion.
• Prepare possible answers to questions that will most likely be asked when the MPI is presented.
All normative and technical decisions made during the process of developing the national MPI should be documented and summarized in a report, including the main results and robustness analysis. This report is essential and should be made available on the day of the official presentation of the measure.
The report should include the purpose of the measure, how normative decisions were made and how the final measure was calculated, as well as describe the main actors involved in the process. Details of the justifications for the selected dimensions and indicators, as well as for the other parameters of the MPI, should also be included. Further, an upfront and clear rationale for keeping some relevant dimensions or indicators outside of the MPI needs to be stated. A report should also have a section that covers robustness analysis and the analysis of candidate measures (see chapter 7 for details), as this provides empirical information that supports the normative decisions.
Some countries have prepared two reports: (1) a public and more accessible report that presents the measure’s structure and logic, as well as the main results, including disaggregations by group and the composition of poverty, and (2) a more formal technical report with all the methodological details of the measure and validation tests. The report(s)’ content will depend on the context, but it should include at least the following elements:
• Motivation: Discussion of the background and context of the country. The existence of a national development plan or mandate to create an
Final report
“Some countries prepare two reports: one public and accessible and the second more formal and technical.”

128
MPI should be mentioned here.
• Purpose: Explanation on the main purpose(s) of the national MPI, which affects all decisions on the structure of the measure.
• Process: Description of who was involved in developing the MPI and what were their roles? What was the timing and how was this process structured?
• Measurement design: Explanation on how normative decisions were made, indicating whether there was a consultative process and what was the rationale behind each parameter in the MPI.
• Data sources: Justification of the data source used to compute the MPI and an explanation of its main attributes.
• Structure of MPI: Clear presentation of the structure of the MPI, showing the dimensions, indicators, cut-offs and weights. Usually, a diagram is used to introduce the MPI.
• National results: Basic charts and figures to present the main findings of the MPI, leaving detailed tables for an appendix. Results should include the incidence and intensity of multidimensional poverty, the MPI, the uncensored and censored headcount ratios, and the contribution of each indicator to the MPI. A full set of robustness tests should be included for these figures.
• Disaggregated results: Disaggregations by rural/urban areas and subnational regions should be presented, as well as other possible breakdowns from the data (by gender, age groups, ethnicity, disability status, etc.). It is essential to show population shares when presenting figures by population groups such as those mentioned here, as the analysis would be incomplete without considering them. It is also important to remember that all comparisons (among regions, gender, etc.) should be tested for their statistical significance.
• Changes over time: If this analysis was conducted, clear statements concerning all adjustments and assumptions necessary to reach comparability over time must be included in the report. Trends may be presented for the incidence and intensity of poverty, as well as for the MPI and the uncensored and censored headcount ratios, to understand changes in the composition of poverty. Any conclusion will have to be based on rigorous tests to check the statistical significance of changes over time.
• Institutionalization: Discussions of the institutional arrangements to follow the presentation of the national MPI. This will include a description of who will be in charge of updating the figures of the MPI and how often. It may also include a structure of accountability for trends in the MPI (e.g., the control panels in Colombia and Costa Rica), and a discussion of how and when the structure of the MPI will be updated.
• Policy uses of the national MPI: Discussion of how the MPI will be used to inform policy, based on the main purposes for which it was created,
Presenting the national MPI

129 How to Build a National Multidimensional Poverty Index (MPI)
and outline of next steps.
• Appendix: Detailed results, data tables, computational files and additional robustness tests.
Naturally, this list is only a guideline and will be adapted in each country to include additional analysis relevant for their contexts. For instance, Nepal included additional chapters that provided detailed province-level analysis. Similarly, several countries have specific sections that explore child poverty using the MPI.
It is worth mentioning that the report should be transparent about all decisions and limitations of the measure. No MPI will be perfect or include every possible dimension of poverty. This is not a drawback in itself, but it needs to be discussed upfront for the measure to gain legitimacy. For instance, in the case of Panama, the government recognized that some deprivations relevant to indigenous communities were not adequately captured in the national MPI. Given the specific characteristics of those populations, it was decided to implement ethnographic studies to complement findings of the MPI and obtain a more complete picture of poverty among them. A similar situation led to Panama developing a child-specific MPI to better capture deprivations and multidimensional poverty during childhood. The governments of Chile and Honduras have committed to start working on relevant dimensions that were not initially included in the MPI because of data limitations—habitat and social networks for Chile and health for Honduras.
Below is a list of tools that may be helpful for the launch. Each launch will be customized to the context and needs of the country, but it might be useful to consider the use of at least some of these tools.
• Presentations. The presentations by speakers at the launch should be synchronized with key messages that need to be emphasized.
• Technical Reports. Copies of these reports should be distributed to interested parties.
• Press releases. These should have a clear and synthetic message, and include a brief review of the process, the structure of the MPI and main findings.
• Press conferences. These should include not only national and local media, but also international or regional media.
• Visits to key media outlets. The leading minister or MPI spokesperson(s) should participate in targeted interviews.
• Op-eds. The president, ministers or high-level academics should submit opinion pieces to key newspapers on the day of the launch, or in the days immediately following the launch.
• Q & A. A sheet can be available for the general public and the media.
Communications tools for the launch

130
The launch of the national MPI is a day of celebration. All the actors who have contributed to the MPI should be thanked for their work. Some countries have invited the full cabinet, international agencies, ambassadors, academics, and leaders of the private and civil society sectors. It is also a day of accomplishment, releasing to the public what has taken months if not years to produce. Credit must be given where it is due. In Chile, for instance, the MPI was adopted officially by a government controlled by a party that had not been in power during the design phase of the measure. The commission responsible for the MPI was honored for bringing together different sectors of the Chilean society to create the measure.
Yet, the purpose of the launch is also to motivate people to redress the disadvantages that many suffer with evidence-based and results-oriented actions. The launch thus helps to build support for efforts to reduce the MPI. This often high-level event that builds political and technical support for this innovative measure is also a day of commitment in which the government is accepting a new measure that will be used to hold them accountable.
The launch therefore needs to be given serious thought and have a clear communication strategy that aims not only to build a good understanding of the MPI, but also to create momentum for its translation into concrete policy actions. This will make the implementation of the MPI much easier and result in greater and swifter impacts on the lives of the poor.
Conclusions
Box 9.1. Honduras’ website for the national MPI
Source: http://www.scgg.gob.hn/ipm/
• Videos and infographics. These should be created to help visualize the MPI and the main findings.
• Website. The government website should post the MPI results on the day of the launch. The website can include the technical report, the press release, any video or infographics, computational files, data tables, human case studies, quotes from key opinion leaders, etc.
• Social media. There should be a hashtag that can be used by those in the audience. Staff should send out key messages and pictures via Facebook, Twitter, Instagram, WhatsApp and other social media platforms.
• Live streaming or podcast. Live streaming of the launch event or posting a podcast of it, allows many more people in the country and internationally to follow the event.
Presenting the national MPI
After launching the national MPI in Honduras, the national government created a website with the main details of the measure and the main results of the MPI. The site also explains how the national MPI helps define social policies and interventions to reduce poverty in Honduras. Further, the site zooms in on specific details of the MPI results.
For example, the website explores multidimensional poverty in rural areas, where four out of five households are multidimensionally poor and one out of three households are severely poor. This online resource also documents that people living in multidimensionally poor households in rural areas are more likely to be younger than 25 years, have less than a primary school education, and work at least 37 hours per week while earning less than a minimum wage. Given these characteristics, younger people are a vulnerable population, at high risk of living in multidimensional poverty. Therefore, the site explains, social policies and interventions should be designed to reduce the levels of multidimensional poverty and deprivation of individuals 12 to 17 years old in rural areas.

131 How to Build a National Multidimensional Poverty Index (MPI)
133 How to Build a National Multidimensional Poverty Index (MPI)
After computing the national MPI and presenting the results to the public, the MPI should not be seen just as another poverty measure but as a strong policy tool. The purpose of the measure will have guided most of the normative decisions. Therefore, the national MPI will aim to monitor poverty reduction, guide the coordination of multisectoral policies, target vulnerable groups, evaluate policies and/or guide budget allocation.
Countries have used their national MPIs in different ways. Early adopters of the MPI are at the forefront of this, implementing innovative ways to use the results of the MPI to address policy objectives. In the next few years, it is
expected that the number of countries following their example will increase as national MPIs become a tool to not only monitor poverty reduction but also to report achievements towards the SDGs.
This final section of the handbook illustrates how countries may go beyond the measure and how the MPI can become a relevant tool for policy. The MPI in itself does not reduce poverty; it is a figure that provides essential information to guide policy. A
strong commitment to this purpose is needed to go further than measurement. In this sense, chapter 10 describes how countries have been using their national MPIs as effective policy tools. This section is not exhaustive but aims to provide useful examples of how countries use their MPIs to guide coordinated policy reduction strategies. Such examples will grow as more countries develop their own national MPIs and put them to use in their particular national contexts. Policymakers and other members of the government are encouraged to read this chapter.
Section III. Going beyond the measure
“In the next few years, the number of countries implementing national MPIs is expected to rise, as the index increasingly becomes a tool to monitor, accelerate and report SDG progress.”

134
Chapter 10. The national MPI as a policy tool
Most countries designed their measures with the objective of monitoring poverty reduction, complementing income poverty or informing social policies. However, some countries have gone beyond these purposes and implemented the MPI as a tool to coordinate and manage multisectoral social policies, prioritize programs, strengthen social protection tools, allocate resources and target beneficiaries. In this context, the national MPI is particularly useful as it provides not just a headline figure but also has an associated information platform, which enables the single overarching indicator (MPI) to be taken apart and scrutinized from different angles. In particular, the incidence H and the intensity A of multidimensional poverty and the set of indicator-level sub-indices are also reported and provide valuable information for policy design (Alkire, 2018).
Box 10.1. Using results from the multidimensional poverty measure to guide policy in Mexico
Interview with Gonzalo Hernández, Executive Director of CONEVAL
Source: Full interview was published in Dimensions magazine, issue 1 (2016).
One of the main objectives of an MPI is to monitor multidimensional poverty over time and track progress in related SDGs. Countries with a national MPI use their measures for this purpose. Disaggregating MPI by group and showing the composition of poverty by indicator for different groups (e.g., multidimensionally poor people in a specific area and how each indicator in the MPI contributes to the levels of poverty of that area) provide a clear view of the situation in a country, incentivize public debate and focus attention on interlinked deprivations.
The MPI as a guide to policy implementation
Monitoring progress in multidimensional poverty
How does the Mexican government use CONEVAL’s data [on multidimensional poverty]?
CONEVAL has carried out a productive and permanent dialogue with governors and federal ministries, regardless of their political background, for them to understand the poverty measurement and the way to use it to reduce poverty. In practice, it has become the national government and local governments’ guide on social policy. The National Development Plan published in 2013 contains 14 indicators, two of which are from CONEVAL and relate to multidimensional poverty. Since poverty has increased from 2012 to 2014, the government has focused on reducing poverty indices, like those measured by CONEVAL.
What is happening is that CONEVAL combines two things that must always be connected from the academic or technical standpoint: a measurement instrument with political incentive for politicians. No governor wants poverty to increase because it looks bad in political terms, and the media can criticize her or him severely. State-level governments are aware that they cannot reduce poverty by modifying the measure, as it used to happen with public data before, and the only way to reduce it is through effective public policy. Therefore, social policy has focused on this measurement.
The national MPI as a policy tool
“Early adopters of the MPI are at the forefront, innovating ways to use the results to advance policy objectives.”

135 How to Build a National Multidimensional Poverty Index (MPI)
Box 10.2. Overcoming the lack of data for local areas
Box 10. 3. Interview with Tatyana Orozco, former Director of Colombia’s Department for Social Prosperity
Could you tell us a little about why the government has found [the MPI] so useful?
Countries also use their national MPIs to track progress in different administrative divisions (national, state level, districts or municipal/local authorities), geographic settings (urban and rural areas, highlands and lowlands, etc.), by population group (gender, ethnicity, age groups, etc.). For instance, in Colombia, MPI figures are used to monitor progress in priority areas established in the peace agreement. The MPI gives a clear picture of deprivations in areas where other data is non-existent and establishes priorities when attempting to reduce poverty and deprivations in those vulnerable areas.
National MPIs can even be tailored to monitor populations with specific needs and different realities (e.g., indigenous groups, people with disabilities, internal migrants and children). In this context, it is necessary to adapt the MPI to capture the needs of these groups. In some cases, ethnographic studies or other qualitative methods should be used to identify the dimensions, indicators and deprivation cut-offs to be included in the measure.
Data at the municipal/local level is desirable for better monitoring and targeting. In the case of Mexico, for instance, municipal-level data, which are particularly useful for local authorities to better manage their resources, is collected and published, including municipal-level multidimensional poverty maps, every five years. Unfortunately, household surveys are usually not representative at this level so this level of information is not usually available. Some countries have tried to resolve problems related to the lack of data for district or municipalities by computing proxy MPIs using other sources of data (e.g., census data). These proxy MPIs use a structure that is the same as (or as close as possible to, given the available data) the national MPI.
In the case of Colombia, using data from the 2005 census, figures on multidimensional poverty were computed at the municipal level, allowing for rich poverty maps to be created. Although some indicators were modified to make the exercise possible, the results provided a proxy of the situation at the municipal level and thus a strong guide for policy. Chile, in turn, is experimenting with small areas estimation techniques to estimate the multidimensional and income poverty situation in 345 municipalities for the first time in the history of the country.
Mainly because poverty is a multidimensional phenomenon which requires a multidimensional political response. Policies that are geared towards reducing poverty cannot operate in isolation because these dimensions have strong interconnections. For example, a child who is frequently absent from school could be missing their education to be a breadwinner. This implies that both the child and the household are deprived in terms of education and work.
In Colombia, working with dimensions has enabled us to establish common goals and improve dialogue between ministers and the bodies responsible for creating and enacting poverty reduction policies. These can be based on education, healthcare, wellbeing, housing and childhood conditions, among others.
Working with the Colombian MPI has shown us various things: What are the dimensions that are more frequently involved with changes in poverty? Which groups require the most attention and where are they located? In our country, for example, we found that the dimensions which contribute most to a reduction in poverty are healthcare and education. As a result, we have achieved universal basic education, and more than 80 percent of Colombians now have health insurance.
“National MPIs can be tailored to monitor populations with specific needs and different realities.”

136
Source: Full interview published in Dimensions magazine, issue 3 (2017).
The MPI in Colombia has also shown us that the country needed to strengthen its social policies to improve early childhood conditions. This led to the creation of the De Cero a Siempre (From Zero to Forever) in 2011 which unifies programs of vaccination, health insurance, growth and development consultations, nutritional evaluations and quality primary education under one banner for those children with the highest poverty levels. The MPI has also helped us realize that we needed to reinforce our housing policy for the extreme poor. In response to this, the government implemented a nationwide scheme that created 100,000 fully subsidized houses.
You have not only been using the MPI to identify poverty but also to identify the deprivations of the new middle class, those who have moved out of poverty, and to design policies to help secure their status. Could you tell us a bit more about this?
Yes. The MPI has indeed been fundamental to the design of policies which seek to strengthen the middle class and prevent the newcomers from falling back into poverty. The MPI has enabled us to see that people in the middle class do not have significant deficiencies in housing. However, they do have deprivations in education and healthcare, aspects they share with the population still living in poverty.Consequently, we understand that in order to support the middle class we need to work on guaranteeing school attendance, reducing illiteracy and improving living conditions. This will determine people’s definitive exit from poverty and their consolidation into the middle class. For this reason, our conditional cash transfer programs are fundamental and are triggered strictly when children attend school and by growth and nutrition controls.
The national MPI as a policy tool
Box 10. 4. The Bridge to Development program to reduce poverty in Costa Rica
Source: http://presidencia.go.cr/puentealdesarrollo/
The program Puente al Desarrollo (or Bridge to Development) is a national poverty reduction strategy in Costa Rica. Puente al Desarrollo seeks to guarantee effective access to goods, services and products offered by public institutions in order to fulfill the human rights of the most impoverished populations. The program gives priority attention to 54,600 families in extreme poverty within 76 priority districts. Currently, 27,399 families are being served, representing 109,484 people.
This strategy seeks to support families by providing opportunities for them to move towards economic independence through the use, generation and empowerment of their abilities. The work of the government is complemented by the commitment of
those families served to take advantage of what the strategy offers so that they can develop their capacities.
Social mapping, which helps locate families in extreme poverty in the 76 priority districts of the country, is used to give priority and preferential attention to the people who need it most. Besides providing access to the social protection system, the program includes the development of skills, links to employment, the advantages of technology, decent housing and territorial development.
Aware that poverty is a multidimensional phenomenon, Bridge to Development looks at the national MPI of Costa Rica when identifying beneficiaries.

137 How to Build a National Multidimensional Poverty Index (MPI)
Evaluation Impact evaluation techniques can be used in some carefully defined contexts to provide rigorous evidence on how policy interventions can cause positive changes. However, to date, impact evaluation techniques have examined the average treatment effect of one variable at a time—yet many interventions are multisectoral and have multiple anticipated outcomes. It is thus essential to extend the first generation of techniques in order to undertake multidimensional impact evaluation. There are two broad approaches to doing so. First, if one wishes to ascertain whether a particular intervention reduced the national MPI, then the national MPI must be included in the relevant surveys so the impact on the MPI and its component indicators can be ascertained. Second, if one wishes to ascertain whether a particular intervention reduced the overlapping disadvantages among beneficiaries across a range of desired outcomes, then a project-MPI can be built reflecting those desired outcomes. Such an MPI cannot be compared with the national MPI but can be used in internal evaluations of clearly defined projects and programs.
When viewing poverty from a multidimensional perspective and as the interaction of different deprivations, it is possible to establish multisectoral policies that work together to reduce poverty. In this context, the policy response is also multidimensional. Policies cannot aim to reduce individual hardships without considering the strong interlinkages that exist between the different dimensions of poverty. In this sense, governments can use the national MPI to establish common goals and improve the communications between sectors with the objective of alleviating poverty.
National MPIs have been used in multiple ways to increase coordination within governments. Some countries, for example, have incorporated their MPIs as one of the guiding indicators for their national development plans. Others have created ministerial poverty cabinets that help to solve implementation problems (e.g., the ministry of finance releasing funds in a prompt manner in order to accelerate specific programs that are behind schedule), redirect programs or projects in order to reduce deprivations in specific indicators (e.g., the ministry of housing changing the geographic target of a housing program to achieve larger reductions in a specific indicator of the MPI), or design combined policies to reduce the most frequent joint deprivations. Countries have also employed national MPIs to standardize entry requirements for social protection programs offered by different government agencies.
Coordinating social policies implies establishing the right institutional framework. This leads to connecting the institutions that calculate the measure with those that design and implement social policies affecting each of the indicators included in the MPI.
Policy coordination can also be achieved with other non-government actors to improve poverty reduction. For example, countries can analyze if the areas with the highest levels of multidimensional poverty are also the ones receiving more social responsibility funds by private firms. This information allows private firms to assess the most important needs in the communities they work with or are planning to work with, as well as the potential contribution of their investment in the poverty reduction efforts of the country.
Coordination of policies to eradicate poverty
“National MPIs are used to improve coordination within governments, establish common goals and communication between sectors.”

138
In addition to using national MPIs as a tool to monitor and coordinate social policies, it is also possible to use its breakdown of dimensions and subgroups to allocate resources according to the needs of each region and group. The national MPI provides details as to which dimensions contribute the most to poverty. This information can be used to analyze the current budget and adjust it if there are clear mismatches between the needs of a group and the budget allocations for each dimension. In this sense, the national social expenditure budget might be guided by the national MPI. For instance, in the case of Mexico, reports on multidimensional poverty are prepared for members of Congress before the annual budget is discussed. In the case of Mozambique, it is expected that the MPI figures will become an important criterion for determining the amount of transfers from the central government to the provinces and districts, as well as the allocation of resources to those sectors with the largest number of individuals deprived (Moreno, 2018).
As noted in the example of Mozambique, budget allocation can also be done by sector. If the MPI is used for budget allocation purposes, then it is essential that the dimensions and indicators clearly reflect those areas of social policy that are priorities in the country. The selection of dimensions and indicators is therefore key.
Budget allocations and planning
The national MPI as a policy tool
“The MPI’s breakdown of dimensions and subgroups can be used to allocate resources according to the needs of each region and group.”
Box 10.5. Round-table to monitor the MPI in Colombia
Source: Zavaleta & Angulo (2017).
Colombia launched its national MPI in 2010. The index was first used to establish specific policy goals for multidimensional poverty reduction, as well as sector-specific targets within the National Development Plan (2010–2014).
A crucial innovation in the Colombian process was the design of a monitoring system to track the progress of the Development Plan. This system was based on two main components. The first was a poverty round-table—a board chaired by the President of Colombia and attended by all ministers and authorities whose work affected particular indicators of the MPI, namely, the ministries of education, health, housing, rural development, labor, and economy, as well as three ministerial-level administrative departments (the National Planning Department, the Department for Social Prosperity, and the National Statistics Department). The second component was a dashboard system that monitored progress in the 15 indicators of the MPI. Both of these were integrated into a management system to monitor and guide public policy responses.
One of the main functions of the round-table is to review the dashboard and take corrective decisions if milestones are not being reached. To do so, annual results are contrasted with the estimates generated by micro-simulations in order to evaluate progress and take corrective actions if needed. Progress towards the achievement of these goals is illustrated through a traffic-light system, in which a green color implies that progress is being made according to the goal, yellow shows some troubles in meeting the goal, and red implies that progress is not enough to meet the goal.The round-table and the dashboard proved useful tools for multidimensional poverty reduction through different channels. First, they provided a practical and straightforward management tool for the country’s highest authorities to monitor their progress towards clearly established goals. The design of the MPI (with a clear policy orientation and indicators that were very sensitive to concrete policy outcomes) and the simplicity of the monitoring system exposed the successes and failures of each responsible manager. Moreover, ministers (who usually tend to focus primarily on their own sectors) were exposed to the overall situation regarding poverty reduction in the country and the need to properly coordinate actions between sectors in order to enhance poverty reduction. Finally, they created internal and external accountability so that both the government and the general public were aware of the specific results of the plan and who was responsible for them.
Budget allocations and planning

139 How to Build a National Multidimensional Poverty Index (MPI)
Between 1987 and 2016, public spending on Costa Rica’s social sector increased considerably: more than sevenfold for education and by almost fivefold for both health and public investment for poverty reduction. However, poverty (measured in monetary terms) did not decline proportionally, and no systems were created to monitor or coordinate poverty reduction programs. Many social benefits were delivered without being subject to technical guidelines or empirical evidence, and without knowing the needs of the population. Consequently, the poverty mitigation efforts were not producing the expected results.
The government of Costa Rica created a commission with representatives from the Presidential Social Council Advisory Team, the Ministry of National Planning and Economic Policy, the Ministry of Finance, the Fund for Social Development and Family Benefits, and the Horizonte Positivo association with the goal of creating a national MPI for Costa Rica as an official measure for allocating resources and monitoring and evaluating social programs.This commission used the MPI to identify trends for each dimension and indicator at the national and regional level. It also compared those trends in deprivations with what was being done by the central government’s social programs. The result was illuminating: there were significant opportunities for improving the allocation of resources to ensure that the largest investments went to the areas most in need.
The commission presented a proposal to use the MPI for an efficient allocation of resources to the Cabinet in March 2016, a meeting attended by the President and various ministers. The Cabinet came to the following agreement: “To request all officials and mid-level officials from the social sector ministries and institutions to use the Multidimensional Poverty Index as an official diagnostic and monitoring tool for social programs, as well as part of the criteria for allocating resources to the different regions of the country and programs with the largest impact on reducing the index” (Government Council Agreement N* 092-16). In May 2016, a Presidential Directive (No. 045) was issued stating that the MPI must be used by a set of institutions for budgetary planning.
After the publication of this directive, a pilot plan was implemented with seven key institutions in which the MPI was used for planning their 2017 budgets. Resources were allocated following the goals for each institution but using MPI data for targeting new beneficiaries for 2017, as well as for determining the total number of beneficiaries. Workshops were then held to train the institutions in how to target their resources using the MPI data, using 2017 as a baseline. After a series of meetings, the final data were available. Some institutions argued that part of their resources had already been allocated to old beneficiaries, but they pledged to use the MPI data for allocations to new beneficiaries.
For 2018, the number of programs increased to 18 from 14 different institutions. A baseline was established based on these programs, and workshops were held to explain the MPI, how to use it, which data to use, and how each institution can target resources using this index. Simulations were then carried out for each indicator and region of the country using this data to estimate how the allocation of resources using the MPI in the 18 programs would affect poverty levels. The current poverty level in Costa Rica is 20.5 percent (2016). If resources are distributed as proposed, poverty could fall by 1.8 or 2.1 percentage points in one year.
The challenge ahead is to incorporate the MPI into the budget process of every public institution so that it is used in a continuous and decisive way.
Box 10.6. Using the MPI to guide budget allocation in Costa Rica
Source: Excerpt of the article published in Dimensions magazine, issue 4 (2017).
Finally, it is also possible to use simulations to establish specific MPI goals. These simulations can estimate how different public investment programs may (or may not) reduce deprivation in specific indicators, given a specific budget allocation. The results of this exercise provide valuable information to formulate the required budget allocation to achieve desired targets in a specific period.

140
Box 10.7. Interview with Heidi Berner, former Undersecretary of Social Evaluation of the Chilean Ministry of Social Development
How is the Chilean MPI used to guide public policies?
Source: Dimensions magazine, issue 2 (2017).
The results of the MPI can also be used to guide new policy interventions or strengthen current ones. Although it is expected that existing national priorities play a role during the process of developing the national MPI, in some cases, especially when participatory approaches are used, it is possible that the MPI includes deprivations that are not covered by current interventions. The MPI can be a useful tool for innovation in the design of new policies and programs to reduce deprivations in specific indicators. For example, the Dominican Republic and El Salvador have included innovative dimensions, such as natural disasters or violence in their MPIs.
Current policies can also be strengthened by information provided by the national MPI. For instance, countries can decide to use the results of the national MPI to select specific groups that are deprived in one indicator and multidimensionally poor. For example, MPI poor individuals aged 18 to 24 and deprived in employment could be targeted for a program to reduce youth unemployment; similarly, MPI poor individuals deprived in nutrition could be identified as beneficiaries of a food program. In cases where new policies are implemented, MPI figures can provide a baseline to monitor if the strategies are successful in reducing deprivations.
Guiding policy interventions
It is used in different ways. In the case of housing, for example, the MPI is completely aligned with the work done by the Ministry of Housing. First, the Ministry of Housing has policies that seek to reduce the quantitative housing deficit, that is, people that require a house because, among other things, they live with a significant level of overcrowding. For the Ministry of Housing, overcrowding is an important factor when selecting recipients for housing benefits. Therefore, overcrowding is included in the MPI.
Second, the Ministry of Housing implements policies that seek to reduce the qualitative deficit, that is, to improve housing that is in poor condition, through programs that help people repair their houses. These issues are also reflected in the MPI. When new residential complexes are constructed, the Ministry of Housing provides the parameters that must be followed when building a neighborhood. These parameters include the distance from education and health facilities and access to public transportation, variables that are included in the local environment indicator of the MPI.
Regarding education, we use the MPI as a guide to identify deprived households through the Social Household Register, especially those with children that do not attend school. What we did was to create a register consistent with multidimensional poverty. If you generate registers, you can know the exact location of families and children that have the problems you are capturing through the MPI. This could not have been done if the registration system was based only on income, where you would hardly know which households are the ones that really suffer the multidimensional poverty problems.
To give you an example, in the Metropolitan Region, we have school enrolment administrative data. Currently, we are looking for those children who do not attend school, amounting to 2.3 percent [of all children] according to the MPI—which may not seem like much, but we are talking about more than 25,000 children who do not attend school in Santiago. This is a relevant number for us, and therefore we are designing policies that allow us, based on the other instrument that is the Social Household Register, to find those children identified through the MPI and to effectively generate support programs that enable us to reintegrate them into the school system.
The national MPI as a policy tool
“The MPI can be a useful tool for innovation in the design of new policies and programs to reduce deprivations in specific indicators.”

141 How to Build a National Multidimensional Poverty Index (MPI)
Box 10. 8. Using the MPI for targeting, the case of Ho Chi Minh City, Vietnam.
Source: Ministry of Labour, 2015.
The MPI in Vietnam is based on human rights and the right to social security. It has five dimensions: education, health, housing, living conditions (water and sanitation) and access to information. There are 10 indicators: adults’ education level, child school attendance, health services accessibility, health insurance, housing quality, per capita housing area, domestic water supply, toilets/latrines, telecommunication services usage, and assets to access information. All indicators have the same weights. A person is multidimensionally poor when the person is deprived in a third or more of the total sum of weighted indicators.
The MPI in Vietnam is a tool to identify individuals who are multidimensionally poor and as a complement to income poverty measures. Using the results from income and multidimensional poverty measures, households can be classified as poor or non-poor, depending on household´s levels of income and social needs deprivation. Depending on the results, households can get access to different social policies and strategies to reduce poverty and deprivation.
This MPI, in combination with income poverty measures, has been part of a targeting mechanism since 2016. Given that it considers both income and multidimensional poverty, the targeting mechanism has a more holistic perspective of what poverty is and takes into account the reality that households can be affected in different ways, depending on their levels of poverty and deprivation under both measures. In addition, the results of the Vietnamese national MPI have been used to redistribute budget allocations between regions in order to prioritize the regions with the largest percentages of poor people.
Some countries have used the results of their national MPI to target poor and vulnerable populations, especially when planning policies to reduce the levels of poverty and deprivation of those groups. For example, in Ho Chi Minh City, Vietnam, it was decided that, for the period of 2016–2020, the criteria of income would be complemented with an index that captures a lack of access to basic social services (education and training, health care, employment and social insurance, living conditions and access to information). The identification of both groups allows the country to plan policies and programs for poverty reduction and social security, as well as to formulate policies to increase the social and economic development in the city.
Targeting

142
A national MPI is an important tool for planning, guiding social policy decisions and improving the implementation of different poverty reduction programs. The MPI is a way of measuring poverty in its many dimensions, but it is also more than a measure. It is a useful policy tool for governments. Where data permit, the MPI can provide an informational platform at every level—from the national to the local municipal level—that can be used to set national goals, target vulnerable groups, allocate resources, shape cost-effective policies and monitor trends.
At the same time, the field of multidimensional poverty measurement and policy is in a period of rapid growth and development. The policies documented here are still being established and improved, as well as being adapted to new contexts. New survey questions and indicators for topics ranging from child poverty and gendered poverty to environmental aspects of poverty are on the work table—as are explorations with satellite and administrative data and big data. Challenges of peace and migration are being viewed alongside poverty reduction to examine synergies. Better alignment between management practices and institutional reform and MPIs are being considered. There is both space and need for new voices and minds to improve the content sketched here for the first time. We hope readers will continue exerting their creativity and that future editions of this handbook will document it.
As the case studies throughout this book have shown, the MPI has shown its effectiveness not only as a measurement tool, but also as a tool for planning and management strategies, plans and policies to eradicate poverty, fulfilling the SDGs and eradicating multidimensional poverty. However, if you think about it, a set of car keys are not very useful if they are sitting on a table. The keys are only useful if they are picked up and used by someone who can drive. Thus throughout this handbook, case studies have documented the need to communicate the MPI and to seek out the proactive engagement of information users from the public and private sectors and civil society and social movements and from across all regions of the country. Why? Because in the same way that a set of car keys cannot drive a car, a poverty statistic cannot end poverty. It cannot move the world. What reduces poverty on the ground are people who align their professional actions with the information and analysis that poverty measures—monetary and multidimensional—provide. Our hope is that this handbook will be of use to many who are striving to end poverty in all its forms—even though their own energy, wisdom and vision will still be required to accomplish that work.
Conclusions
The national MPI as a policy tool
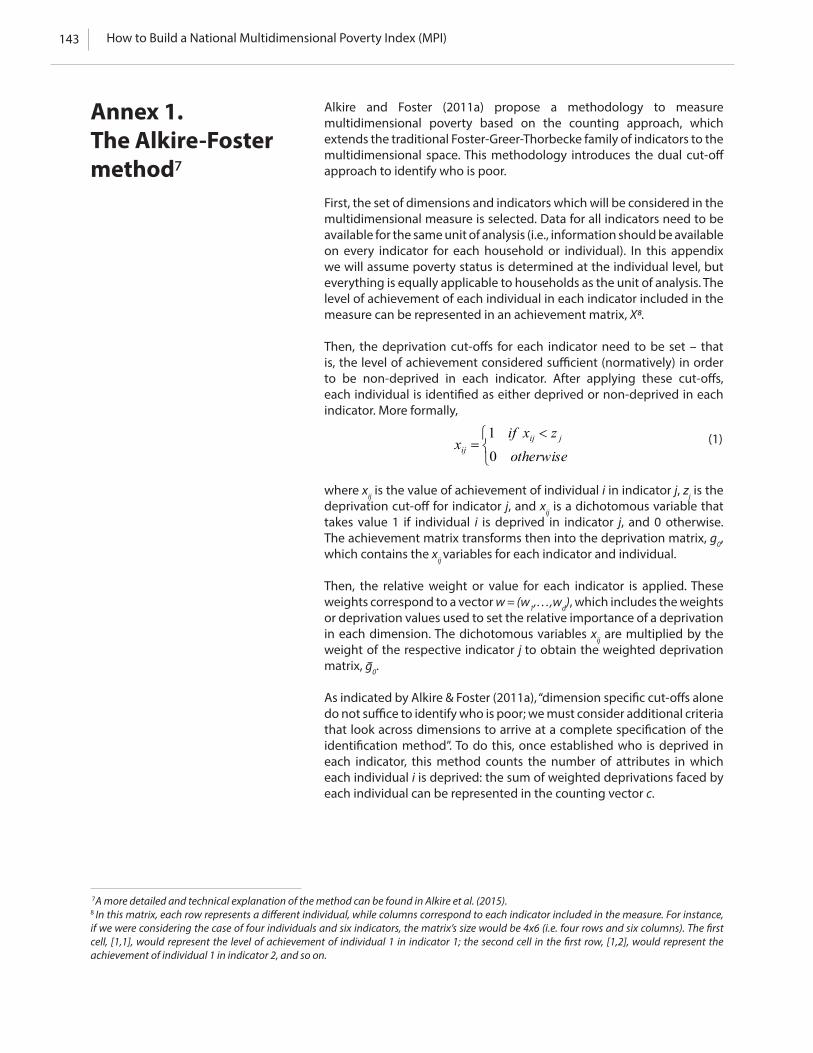
143 How to Build a National Multidimensional Poverty Index (MPI)
Annex 1. The Alkire-Foster method7
Alkire and Foster (2011a) propose a methodology to measure multidimensional poverty based on the counting approach, which extends the traditional Foster-Greer-Thorbecke family of indicators to the multidimensional space. This methodology introduces the dual cut-off approach to identify who is poor.
First, the set of dimensions and indicators which will be considered in the multidimensional measure is selected. Data for all indicators need to be available for the same unit of analysis (i.e., information should be available on every indicator for each household or individual). In this appendix we will assume poverty status is determined at the individual level, but everything is equally applicable to households as the unit of analysis. The level of achievement of each individual in each indicator included in the measure can be represented in an achievement matrix, X8. Then, the deprivation cut-offs for each indicator need to be set – that is, the level of achievement considered sufficient (normatively) in order to be non-deprived in each indicator. After applying these cut-offs, each individual is identified as either deprived or non-deprived in each indicator. More formally,
where xij is the value of achievement of individual i in indicator j, zj is the deprivation cut-off for indicator j, and xij is a dichotomous variable that takes value 1 if individual i is deprived in indicator j, and 0 otherwise. The achievement matrix transforms then into the deprivation matrix, g0, which contains the xij variables for each indicator and individual.
Then, the relative weight or value for each indicator is applied. These weights correspond to a vector w = (w1,…,wd), which includes the weights or deprivation values used to set the relative importance of a deprivation in each dimension. The dichotomous variables xij are multiplied by the weight of the respective indicator j to obtain the weighted deprivation matrix, g0.
As indicated by Alkire & Foster (2011a), “dimension specific cut-offs alone do not suffice to identify who is poor; we must consider additional criteria that look across dimensions to arrive at a complete specification of the identification method”. To do this, once established who is deprived in each indicator, this method counts the number of attributes in which each individual i is deprived: the sum of weighted deprivations faced by each individual can be represented in the counting vector c.
îíì <
=otherwise
zxifx jijij 0
1
7A more detailed and technical explanation of the method can be found in Alkire et al. (2015).8 In this matrix, each row represents a different individual, while columns correspond to each indicator included in the measure. For instance, if we were considering the case of four individuals and six indicators, the matrix’s size would be 4x6 (i.e. four rows and six columns). The first cell, [1,1], would represent the level of achievement of individual 1 in indicator 1; the second cell in the first row, [1,2], would represent the achievement of individual 1 in indicator 2, and so on.
(1)

144
At this stage, the poverty cut-off (k), is set. It defines who is multidimensionally poor and who is not. In other words, k is the minimum deprivation score a person needs to exhibit in order to be identified as multidimensionally poor. Formally,
where ir is a dichotomous variable that takes value 1 if individual i is deprived in at least k weighted indicators. Individual i is poor if = 1 and non-poor if = 0.
This method encompasses the union and intersection approaches to identification of the poor. Setting k equal to the minimum weight considered implements the union approach, setting k = 1 implements the intersection approach. Similarly, an intermediate approach is implemented if the value of k is set between these extremes. That is, the union and intersection approaches can be taken as special cases of this method.
Alkire & Foster (2011a) do not provide an algorithm for determining k, but rather recommend considering the results with all possible values of k to determine whether results are robust to the choice of k.
After identification, the weighted deprivations experienced by people who have not been identified as poor (that is, those whose deprivation score is below the poverty cut-off k) are censored, hence replaced with zeros in the deprivation matrix, which becomes the censored deprivation matrix, g0(k). Similarly, deprivations of non-poor individuals are also censored in the weighted deprivation matrix. The resulting matrix is called the censored weighted deprivation matrix, g0(k). From this matrix one obtains the censored deprivation score ci (k), which is equal to ci if i is poor and equal to 0 if i is non-poor. This censoring of the deprivations of the non-poor is consistent with the property of “poverty focus” which—analogous to the unidimensional case—requires a poverty measure to be independent of the achievements of the non-poor. For further discussion, see Alkire and Foster (2011a).
The next step is to combine information on individuals’ poverty status, to reach an aggregate measure of poverty for the population.
The AF method first computes the proportion of people in the population who have been identified as multidimensionally poor. This is the multidimensional poverty headcount ratio, H, also called the “incidence” of multidimensional poverty.
where q is the number of people identified as multidimensionally poor using the dual cut-off and n is the total number of people.
(3)
îíì ³
=otherwise
kcif ii 0
1r
ir ir
nqH =
(2)

145 How to Build a National Multidimensional Poverty Index (MPI)
Then, the average share of weighted indicators in which poor people are deprived is computed. This entails adding up the deprivation scores of the poor and dividing them by the total number of poor people. This is the “intensity” of multidimensional poverty,
This partial index is the average deprivation score across the poor. It conveys relevant information about multidimensional poverty, since those that experience simultaneous deprivations in a higher fraction of dimensions have a higher intensity of poverty and are poorer than other having a lower intensity.
Finally, the M0, commonly known as MPI can be computed as the product of the two previous partial indices H (the incidence of multidimensional poverty) and A (the intensity of multidimensional poverty). Analogously, it can be obtained as the mean of the censored deprivation scores:
As a simple product of the two partial indices H and A, the measure M0 is sensitive to the incidence and the intensity of multidimensional poverty. It clearly satisfies dimensional monotonicity, since if a poor person becomes deprived in an additional dimension, then A rises and so does M0. Another interpretation of M0 is that it provides the share of weighted deprivations experienced by the poor divided by the maximum possible deprivations that could possibly be experienced if all people were poor and were deprived in all dimensions.
An important characteristic of M0 is that it can be implemented with ordinal data. Ordinal variables have a short number of categories, and where the distance between those categories is unknown (e.g., level of education, type of health care access). This is critical for real-world applications, since many key deprivations are commonly measured using ordinal variables (e.g., education data).
M0 can be unfolded in an array of informative indices, making use of two key properties: subgroup decomposability and dimensional breakdown.
Population subgroup decomposability allows us to understand and monitor poverty in subgroups of the population and compare them with the aggregate M0. The population share and the achievement matrix of
subgroup are denoted by 𝑣𝑣" = 𝑛𝑛"
𝑛𝑛 and Xl, respectively. Overall M0 can be expressed as the population-share weighted sum subgroup M0s,
qkcAn
ii /)(
1å=
= (4)
(5) å=
=n
ii kcn
M1
0 )(1
Subgroup decomposition
ℓ
).()(1
00l
m
l
l XMvXM å=
= (6)

146
Given the additive form of this expression, it is also possible to compute the contribution of each subgroup to overall poverty. Let us denote the relative contribution of subgroup to overall poverty by D0
l , which is formulated as
Note that the relative contribution of subgroup to overall poverty depends both on the level of poverty in subgroup and on the population share of that subgroup. Whenever the relative contribution to poverty of a region or some other group exceeds its population share, this indicates that there is an unequal distribution of poverty in the country, with some regions or groups bearing a disproportionate share of poverty. Clearly, the sum of the relative contributions of all groups needs to be equal to 1.
M0 can be expressed as a weighted sum of the dimensional deprivations after identification. M0 satisfies the dimensional breakdown property and thus can also be expressed as a weighted sum of post-identification dimensional deprivation, which in the particular case of M0 we refer to as the censored headcount ratios.
The censored headcount ratio of an indicator, hj (k), is the proportion of the population who are both multidimensionally poor and simultaneously deprived in that indicator. Formally,
where gij0 (k) is an element of the censored deprivation matrix, which is
equal to 1 if individual i is both poor (c1 > k) and deprived in indicator j (xij < zj), and 0 otherwise.
The additive structure of M0 measure allows it to be expressed as a weighted sum of the censored headcount ratios, where the weight on indicator j, wj, is the relative weight assigned to that indicator.
Analyses based on the censored headcount ratios can be complemented in an interesting way by considering the percentage contribution of each indicator to overall poverty. The censored headcount ratio shows the extent of deprivations among the poor but not the relative importance of the indicators to overall poverty. Two indicators may have the same censored headcount ratios but very different contributions to overall poverty. This is because the contribution not only depends on the
ℓ
ℓ ℓ
)()(
0
00
XMXMvDl
ll = (7)
(8)
Dimensional breakdown
å=
=n
iijj kg
nkh
1
0 )(1)(
ååå= ==
==n
i
d
jijj
n
ii kgw
nkc
nM
1 1
0
10 )(1)(1
åå å== =
=úû
ùêë
é=
d
jjj
d
j
n
iijj khwkg
nwM
11 1
00 )()(1
(9)
(10)

147 How to Build a National Multidimensional Poverty Index (MPI)
(11)
(12)
censored headcount ratio but also on the weight or value assigned to each indicator. Let us denote the contribution of indicator j to the M0 by
0jf . Then, the contribution of indicator j for poverty cut-off k is given by
for each j = 1, …, d. Whenever the contribution to poverty of a certain indicator exceeds its weight, there is a relatively high censored headcount in this indicator. The poor are more deprived in this indicator than in others. Clearly, the sum of the contributions of all indicators is 100 percent. Comparisons of the censored headcount ratios and the percentage contributions have policy relevance for understanding the composition of poverty in different regions.
The uncensored headcount ratio of an indicator is defined as the proportion of the population that is deprived in that indicator. It aggregates deprivations experienced by the poor with deprivations among the non-poor. The uncensored headcount ratio of indicator j, hj, can be defined as
where gij
0 is equal 1 if individual i is deprived in indicator j (xij < zj), and 0 otherwise.
The censored headcount ratio may differ from the uncensored headcount ratio, except when the union identification criterion is used9, or if everyone that has been identified as poor happens to be deprived in that indicator and all non-poor are non-deprived in that specific indicator. In every other case, the censored headcount ratio of an indicator will be lower than the uncensored headcount ratio.
0
0 )()(
Mkh
wk jjj =f
å=
=n
iijj g
nh
1
01
9 In the union approach, a person is identified as poor if she is deprived in at least one indicator, so none of the deprivations are censored. Thus, the censored and uncensored headcount ratios are identical.

148
Annex 2. The global MPI10
The global MPI is an internationally comparable measure of acute poverty covering over 100 developing countries in all regions of the world. It was originally developed by the Oxford Poverty and Human Development Initiative (OPHI) at the University of Oxford and the United Nations Development Programme’s Human Development Report Office for inclusion in UNDP’s flagship Human Development Report (HDR) in 2010. It has been published in the HDR ever since (Alkire et al., 2014; Alkire & Santos, 2010; United Nations Development Programme, 2010). In 2018, OPHI and UNDP released an improved version of the global MPI (global MPI 2018). This new index uses the same three dimensions as the global MPI, but the definition of five of the ten indicators have changed in order to better align with the SDGs.
The MPI is an application of the adjusted headcount ratio, M0 that can be obtained using the Alkire-Foster method. It complements traditional income-based poverty measures by capturing the severe deprivations that each person faces at the same time with respect to education, health and living standards.
The MPI assesses poverty at the individual level. If someone is deprived in a third or more of ten (weighted) indicators (see figure below), the index identifies them as “MPI poor”, and the extent—or intensity—of their poverty is measured by the number of deprivations they are experiencing.
The MPI can be used to create a comprehensive picture of people living in poverty, and permits comparisons both across countries, regions and the world and within countries by ethnic group, urban/rural location, as well as other key household and community characteristics.
10 This annex is a summarized version of the global MPI description presented in Alkire, S., Kanagaratnam, U. & Suppa, N. (2018) The Global Multidimensional Poverty Index (MPI): 2018 Revision. OPHI MPI Methodological notes 46. Oxford Poverty and Human Development Initiative, University of Oxford.
Health
Education
Living Standards
Three Dimensions
of Poverty
Years of schooling
School attendance
Child mortality
Nutrition
Cooking fuelSanitationDrinking waterElectricityHousingAssets

149 How to Build a National Multidimensional Poverty Index (MPI)
As summarized in the figure above, the global MPI uses information from ten indicators that are organized into three dimensions: health, education and living standards, following the same dimensions as the Human Development Index (HDI). Each person is identified as deprived or non-deprived in each indicator based on a deprivation cut-off (table A2. 1). Each person’s deprivation score is then constructed based on a weighted average of the deprivations they experience using a nested weight structure, assigning equal weights across dimensions, and equal weights for each indicator within dimensions. Finally, a poverty cut-off of 33.33 percent identifies as multidimensionally poor those people whose deprivation score meets or exceeds this threshold.
The MPI reflects both the incidence or headcount ratio (H) of poverty and the average intensity (A) of their poverty. To further elaborate, H is the proportion of the population that is multidimensionally poor while A is the average proportion of indicators in which poor people are deprived. The MPI is calculated by multiplying the incidence of poverty by the average intensity across the poor, that is, MPI = H x A.
Two additional poverty cut-offs are reported in addition to the 33.33 percent cut-off. This includes those who are deprived in 20 to 33.33 percent of weighted indicators. This group is identified as “vulnerable to poverty”. From a global MPI perspective, the number related to vulnerability provides a sense of how closely individuals are clustered to the 33.33 percent cut-off. The other reported cut-off refers to those identified as in “severe poverty’. These are individuals who are deprived in 50 percent or more of the weighted indicators. The number related to severity illustrates the proportion of population who is deprived in half or more of the weighted indicators.

150
Table A2. 1: The dimensions, indicators, deprivation cut-offs and weights of the global MPI 2
Dimensions of Poverty Indicator Deprived if… Weight
Education
Years of Schooling
No household member aged ten years or older has completed six years of schooling. 1/6
Child School Attendance
Any school-aged child+ is not attending school up to the age at which he/she would complete class 8. 1/6
Health
Child Mortality Any child has died in the family in the five-year period preceding the survey. 1/6
Nutrition Any adult under 70 years of age or any child for whom there is nutritional information is undernourished.* 1/6
Living Standard
Electricity The household has no electricity. 1/18
Improved Sanitation
The household’s sanitation facility is not im-proved (according to SDG guidelines) or it is improved but shared with other households.**
1/18
Improved Drinking Water
The household does not have access to im-proved drinking water (according to SDG guidelines) or safe drinking water is at least a 30-minute walk from home, roundtrip.***
1/18
Housing The household has inadequate housing: the floor is of natural materials or the roof or wall are of rudimentary materials. 1/18
Cooking Fuel The household cooks with dung, wood, or charcoal. 1/18
Assets Ownership
The household does not own more than one of these assets: radio, TV, telephone, computer, animal cart, bicycle, motorbike, or refrigerator, and does not own a car or truck.
1/18
Notes+ Data source for age children start school: United Nations Educational, Scientific and Cultural Organization, Institute for Statistics database, Table 1. Education systems [UIS, http://stats.uis.unesco.org/unesco/TableViewer/tableView.aspx?ReportId=163 ].* Adults above 20 years are considered malnourished if their BMI is below 18.5 m/kg2; for individuals aged 15-19 implement age-specific BMI cutoffs from WHO are applied. Children are considered malnourished if their z-score of either height-for-age (stunting) or weight-for-age (underweight) is below minus two standard deviations from the median of the reference population.** A household is considered to have access to improved sanitation if it has some type of flush toilet or latrine, or ventilated improved pit or composting toilet, provided that they are not shared. If survey report uses other definitions of ‘adequate’ sanitation, we follow the survey report.*** A household has access to clean drinking water if the water source is any of the following types: piped water, public tap, borehole or pump, protected well, protected spring or rainwater, and it is within 30 minutes’ walk (roundtrip). If survey report uses other definitions of ‘safe’ drinking water, we follow the survey report.
Source: Alkire et al., 2018.

151 How to Build a National Multidimensional Poverty Index (MPI)
Annex 3. Post-2015 Light Powerful (LP) Survey
Survey prepared by the Multidimensional Poverty Peer Network (MPPN) & Oxford Poverty and Human Development Initiative (OPHI), University of Oxford, Revised September 2014.
There is wide agreement regarding the need for a “data revolution’. That revolution will have several drivers. One essential driver is a household survey providing data that are:
a) Frequent and accurate – to be able to track changes over time and inform policy.
b) Large-scale, so they can be disaggregated by groups and regions to leave no one behind.
c) Multi-topic, so they take an integrated, balanced approach, and are used to break silos.
d) Gendered, so they provide data on women and men, and some data on girls & boys.
e) Internationally comparable core module that reflects key SDGs
f ) Flexible: able to incorporate additional modules and questions that reflect national priorities, such as a shortened consumption-expenditure module, or governance and political voice, or the environment, or empowerment, or social capital, or child poverty.
g) Reflecting the post-2015 process: the Open Working Group Outcome Document is reflected; other inputs considered include the High-Level Panel (HLP) and UN Secretary General reports; the Sustainable Development Solutions Network reports; UN Global Compact inputs; and A Million Voices: the World We Want.
h) All-age: includes some variables for children, adults, and elderly. The Multidimensional Poverty Peer Network (MPPN) proposes this a light survey to obtain frequent data from the same survey on a subset of poverty-related SDGs. This thrice-revised survey reflects the technical, cultural, and political insights of MPPN members, and was deemed to be feasible and informative across a wide range of country contexts.
What is included: The included questions fulfill these criteria: a) are including in key post-2015 documents; b) are relevant in many contexts; c) do not require special conditions (enumerator training, privacy); d) pose low ethical risks to respondents; e) can change rapidly; f ) are relatively easy to gather; g) provide relatively accurate data in level and trend.
The present questionnaire is not perfect: no questionnaire can be. It includes only a subset of the OWG outcome indicators related to human poverty. Not all dimensions and indicators can be included. However, there is a trade-off between a perfect survey and a light but powerful survey that can be regularly implemented at large scale, can give an indication of the direction of change of key interconnected deprivations, and allows space for country-selected modules. Many lengthy surveys will continue

152
to exist. It seems crucial to create frequent and disaggregated data; hence this was a key consideration in indicator selection. We presume that this survey will be supplemented by surveys or modules that probe in greater depth topics like child well-being, reproductive and sexual health, domestic and sexual violence, quality of education, employment, and income and expenditure.
This survey instrument would permit:
• Analysis by gender, age, marital status, urban/rural, region, religion, disability, legal status, ethnicity and migration status, if the sample design permits. This will provide information needed to support the agenda to leave no one behind. It also supports gendered analysis, and permits special studies for example on disabilities.
• Basic indicators can be tabulated from this survey at least at the national level and changes tracked over time. A few of many examples include:- Women’s ownership of land- Adult and child malnutrition- Conditions in schools- Teen pregnancy- Safe Delivery- Experience of crime and violence- Fatal incidents of violence - Youth unemployment- Workplace safety- Social protection benefits
• A Multidimensional Poverty Index could be constructed using this survey that includes improved indicators for water, sanitation, assets, electricity, housing, child mortality, school attendance, and energy. The MPI could also include new dimensions like work or violence, and new indicators such as health activity limitations. A basic gendered MPI could be constructed for women and men and children as well.
The MPPN questionnaire would generate information such as the following. The symbol (g) indicates that the question can be gender disaggregated.

153 How to Build a National Multidimensional Poverty Index (MPI)
Demographic Number of jobs (g)
Age (g) Benefits (g)
Gender Exposure to extreme job conditions (g)
Religion (optional) (g) Accident/Injury while working (g)
Ethnicity (optional) (g) Housing
Relationship to head of household (g) Ownership (g)
Contributes to household income (g) Sleeping rooms
Marital status (g) Floor materials
Legal registration of birth (g) Roof materials
Poverty Wall materials
Multidimensional Poverty index (MPI) Services
Imputed consumption poverty Time to schooling
Gendered Poverty Index (GPI) Sanitation (type, shared)
Health Energy (cooking and heating fuels)
Activity limitations (g) Ventilation (cooking and heating)
Disability (g) Drinking water, time to water, treatment
Child malnutrition (height, weight) (g) Non-drinking water source(s)
Adult malnutrition (height, weight) (g) Electricity (load shutting)
Delivery location Assets
If child is in nutrition program (g) Mobile phone (g), fixed telephone
Child mortality (g) Watch, radio, refrigerator, television, iron
Age at first pregnancy Sewing machine
Education Bed or mattress
Literacy (g) Computer
Highest level and grade (g) Bicycle, motorcycle, cart, car, motorboat
Child pre-school & school attendance (g) Internet access
Why not attending (g) Bank account
Quality of school / problems at school Small, medium and large livestock (g)
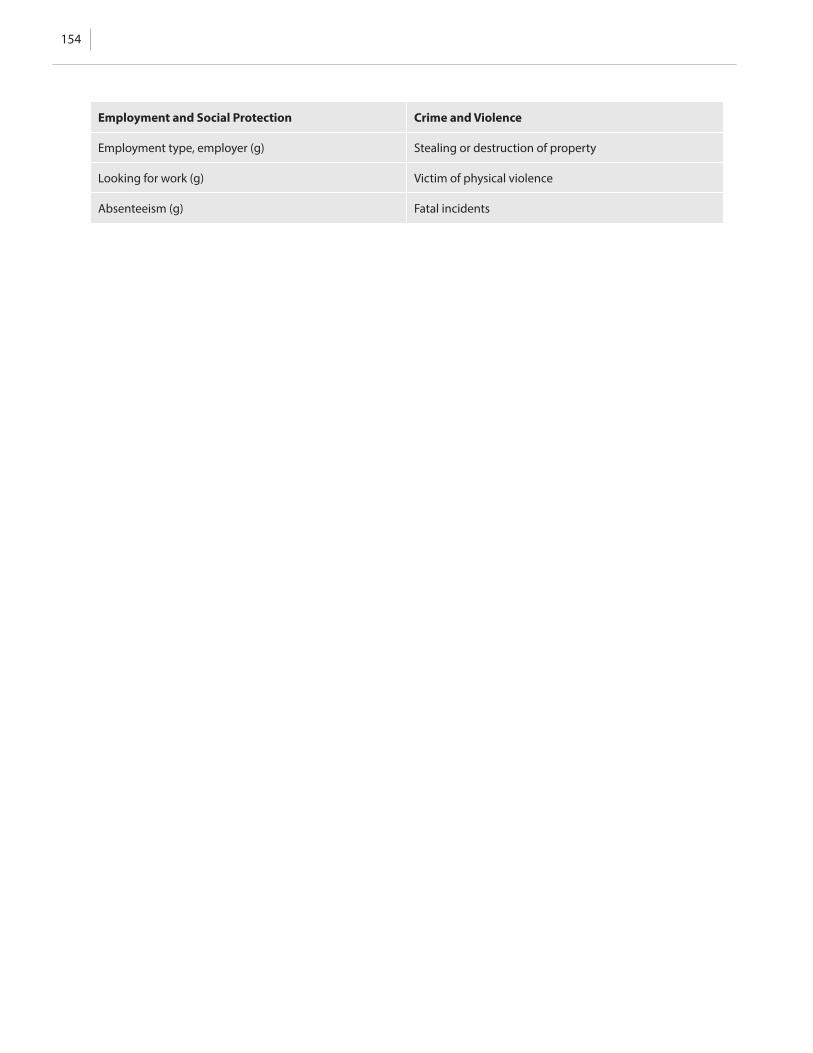
154
Employment and Social Protection Crime and Violence
Employment type, employer (g) Stealing or destruction of property
Looking for work (g) Victim of physical violence
Absenteeism (g) Fatal incidents

155 How to Build a National Multidimensional Poverty Index (MPI)
References
Alkire, S. (2007). Choosing dimensions: The capability approach and multidimensional poverty, in Kakwani, N. & Silber, J. (eds), The many dimensions of poverty. New York: Palgrave Macmillan.
Alkire, S. (2018). Multidimensional poverty measures as relevant policy tools. OPHI Working Paper 118. Oxford: University of Oxford.
Alkire, S., Apablaza, M., Chakravarty, S. & Yalonetzky, G. (2017a). Measuring chronic multidimensional poverty. Journal of Policy Modeling, 39(6), 983–1006.
Alkire, S., Conconi, A. & Seth, S. (2014). Multidimensional destitution: An ordinal counting methodology for constructing linked subsets of the poor. OPHI Research in Progress 42a, University of Oxford.
Alkire, S. & Foster, J. (2011a). Counting and multidimensional poverty measurement. Journal of Public Economics, 95(7–8), 476–487.
Alkire, S. & Foster, J. (2011b). Understanding and misunderstandings of multidimensional poverty measurement. OPHI Working Paper 43. Oxford: University of Oxford.
Alkire, S., Foster, J., Seth, S., Santos, M. E., Roche, J. M. & Ballon, P. (2015). Multidimensional poverty measurement and analysis. Oxford: Oxford University Press.
Alkire, S., Kanagaratnam, U. & Suppa, N. (2018). The Global Multidimensional Poverty Index (MPI): 2018 Revision. OPHI MPI Methodological 46. Oxford: University of Oxford.
Alkire, S., Lham, D., Gyeltshen, S. & Minten, T. (2016). Child Poverty in Bhutan: Insights from Multidimensional Child Poverty Index and Qualitative Interviews with Poor Children. Thimphu, Bhutan.
Alkire, S., Roche, J. M. & Vaz, A. (2017b). Changes over time in multidimensional poverty: Methodology and results for 34 countries. World Development, 94(Supplement C), 232–249.
Alkire, S. & Samman, E. (2014). Mobilising the household data required to progress toward the SDGs. OPHI Working Paper 72. Oxford: University of Oxford.
Alkire, S. & Santos, M. E. (2010). Acute multidimensional poverty: A new index for developing countries. OPHI Working Paper 38. Oxford: University of Oxford.
Alkire, S., Santos, M. E., Seth, S. & Yalonetzky, G. (2010). Is the Multidimensional Poverty Index robust to different weights. OPHI MPI Briefing 3, University of Oxford.
Alkire, S. & Seth, S. (2015). Multidimensional Poverty Reduction in India between 1999 and 2006: Where and How? World Development, 72, 93–108.
Alkire, S. & Shen, Y. (2017). Exploring multidimensional poverty in China: 2010 to 2014, Research on Economic Inequality, 161–228.
Allison, P. D. (2001). Missing Data. California: SAGE.
Angulo-Salazar, R. C., Diaz-Cuervo, Y. & Pardo-Pinzon, R. (2011). Índice de Pobreza Multidimensional para Colombia (IPM-Colombia) 1997–2010. Archivos de Economía. Documento 382.
Angulo, R., Díaz, Y. & Pardo, R. (2015). The Colombian Multidimensional Poverty Index: Measuring Poverty in a Public Policy Context. Social Indicators Research, 1–38.
Apablaza, M. & Yalonetzky, G. (2013). Decomposing Multidimensional Poverty Dynamics need rest of information - here: https://www.younglives.org.uk/sites/www.younglives.org.uk/files/YL-WP101_Apablaza-Yalonetzky-Multidimensional-Poverty-Dynamics.pdf
Asian Development Bank (2010). Administrative Data Sources For Compiling Millennium Development Goals and Related Indicators. A Reference Handbook on Using Data from Education, Health, and Vital Registration Systems Featuring Practices and Experiences from Selected Countries. Philippines. publisher or at least city
Atkinson, A. B. (2003). Multidimensional deprivation: Contrasting social welfare and counting approaches. Journal of economic inequality, 1 (1), 51–65.
Atkinson, A. B., Cantillon, B., Martier, E. & Nolan, B. (2002). Social indicators: The EU and social inclusion. Oxford: Oxford Policy Press.
Atkinson, A. B. & Marlier, E. (2010). Analysing and Measuring Social Inclusion in a Global Context. New York: United Nations.

156
Bader, C., Bieri, S., Wiesmann, U. & Heinimann, A. (2016). Differences Between monetary and multidimensional poverty in the LAO PDR: Implications for targeting of poverty reduction policies and interventions. Poverty & Public Policy, 8(2), 171–197.
Bartholomew, D., Steele, F. & Galbrarth, J. (2008). Analysis of Multivariate Social Science Data. Boca Raton, FL: CRC Press.
Bound, J., Brown, C. & Mathiowetz, N. (2001). Measurement error in survey data. In James, J. H. & Edward, L. (eds), Handbook of Econometrics. Elsevier, 3705–3843.
Bourguignon, F., Bénassy-Quére, A., Dercon, S., Estache, A., Gunning, J. W., Kanbur, R., Klasen, S., Maxwell, S., Platteau, J.-P. & Spadaro, A. (2008). Millennium development goals at midpoint: Where do we stand and where do we need to go? European Report on Development. Brussels page and volume?
Bourguignon, F., Bénassy-Quéré, A., Dercon, S., Estache, A., Gunning, J. W., Kanbur, R., Klasen, S., Maxwell, S., Platteau, J.-P. & Spadaro, A. (2010). Millennium Development Goals: An assessment. In Kanbur, R. & Spencer, M. (eds), Equity and Growth in a Globalizing World. Washington D.C.: World Bank.
Clark, D. A. (ed), (2012). Adaptation, Poverty and Development: The Dynamics of Subjective Well-Being. Hampshire: Palgrave Macmillan.
Connelly, R., Playford, C. J., Gayle, V. & Dibben, C. (2016). The role of administrative data in the big data revolution in social science research. Social Science Research, 59(Supplement C), 1–12.
Consejo Nacional de Evaluación de la Política de Desarrollo Social (CONEVAL) (2014). Metodología para la medición multidimensional de la pobreza en México. Mexico.
Crawford, I. M. (1997). Questionnaire design. In Crawford, I. M. (ed), Marketing Research and Information Systems. Rome: Food and Agriculture Organization of the United Nations (FAO).
Deaton, A. (2014). A Menagerie of Lines: How to Decide Who Is Poor? London. publisher
Decancq, K. & Lugo, M. A. (2010). Weights in multidimensional indices of well-being: An overview. Econometric Reviews, 32(1), 7–34.Departamento para la Prosperidad Social (DPS) (N.S) Índice de Pobreza Multidimensional para población indígena de Colombia, N.S. Available online: http://www.redproteccionsocial.org/sites/default/files/dps_ipm_para_grupos_etnicos.pdf
Dimensions magazine. (2016). Interview with Gonzalo Hernández Licona: In Mexico, social policy has focused on multidimensional measurement. Dimensions Magazine. 12016, 6–10.
Economic Commission for Latin America and the Caribbean (ECLAC) (2015). Panorama Social de América Latina. Santiago de Chile: ECLAC.
Enders, C. (2010). Missing data analysis. New York: The Guilford Press.
Foster, J., Greer, J. & Thorbecke, E. (1984). A class of decomposable poverty measures. Econometrica, 52(3), 761–766.Hein, L., Van Koppen, K., De Groot, R. S. & Van Ierland, E. C. (2006). Spatial scales, stakeholders and the valuation of ecosystem services. Ecological economics, 57(2), 209–228.
Instituto Nacional de Estadistica (INEC) (2015). Medición de la Pobreza Multidimensional en Ecuador. Quito, Ecuador. Instituto Nacional de Estadistica y Censos (INEC) (2015). Índice de Pobreza Multidimensional (IPM): Metodología. San Jose, Costa Rica.
John, A., Somayaji, B. & Guha, S. (2018). Andhra Pradesh becomes the first Indian state to adopt a multidimensional poverty index. Dimensions (5).
Klasen, S., Tran, V. Q. & Alkire, S. (2015). Static and dynamic disparities between monetary and multidimensional poverty measurement: evidence from Vietnam, Measurement of Poverty, Deprivation, and Economic Mobility, 249–281.
Lister, R. (2004). Poverty. Cambridge: Polity Press.
Loschmann, C., Parsons, C. R. & Siegel, M. (2015). Does Shelter assistance reduce poverty in Afghanistan? World Development, 74, 305–322.
Manly, B. F. J. (2005). Multivariate Statistical Methods: A Primer. New York: Chapman & Hall/CRC.
Martirosova, D., Inan, O. K., Meyer, M. & Sinha, N. (2017). The Many Faces of Deprivation: A Multidimensional Approach to Poverty in Armenia. location/publisher
Ministerio de Desarrollo Social (2015). Nueva Metodología de Medición de la Pobreza por Ingresos y Multidimensional. Santiago de Chile: Ministerio de Desarrollo Social.
Ministerio de Desarrollo Social (2016). Metodología de medición de pobreza multidimensional con entorno y redes. Santiago, Chile.
Ministerio de Economía y Finanzas, Ministerio de Desarrollo Social y Instituto Nacional de Estadística y Censo (2017). Índice de Pobreza

157 How to Build a National Multidimensional Poverty Index (MPI)
Multidimensional de Panamá: Año 2017. Panama City, Panama.
Ministerio de Economía y Finanzas, Ministerio de Desarrollo Social & Instituto Nacional de Estadistica y Censos (INEC) (2018). Índice de Pobreza Multidimensional de Niños, Niñas y Adolescentes de Panamá: Año 2018. Panama City, Panama.
Ministry of Economics and Finance (2016). Pobreza e bem-estar em Mozambique: Quarta avaliacao nacional. Mozambique.
Ministry of Labor, I. a. S. A. M. (2015). Master Plan: Transition from one-dimension income-based poverty approach to multidimensional poverty approach 2016–2020. spell out acronym, publisher info?
Ministry of Planning, D. R., UN Pakistan & Oxford Poverty and Human Development Initiative (2016). Multidimensional Poverty in Pakistan. Balochistan.
Moreno, C. (2018). Mozambique: The first African country with an official national MPI. Dimensions Magazine. volume, page
Multidimensional Poverty Peer Network & Oxford Poverty and Human Development Initiative (2014). Post-2015 Light Powerful (LP) Survey Modules. more information
National Planning Commission, Gov. of Nepal & Oxford Poverty and Human Development Initiative (2018). Nepal Multidimensional Poverty Index. Analysis towards actions. Singha Durbar, Kathmandu.
National Statistics Bureau Royal Government of Bhutan (2013). Bhutan Multidimensional Poverty Index 2012. Thimpu, Bhutan.
National Statistics Bureau Royal Government of Bhutan & Oxford Poverty and Human Development Initiative (OPHI) (2017). Bhutan Multidimensional Poverty Index 2017. Thimpu, Bhutan
Oxford Poverty and Human Development Initiative (OPHI) (2017). Senegal Country Briefing, Multidimensional Poverty Index Data Bank. University of Oxford: OPHI
Pasha, A. (2016). Impact of cash grants on multidimensional poverty in South Africa (No. 208). Courant Research Centre: Poverty, Equity and Growth-Discussion Papers.
Philippine Statistics Authority (2018). Technical notes on the estimation of the multidimensional poverty index (MPI) based on the initial methodology. publisher info or web link
Ravallion, M. (2016). The Economics of Poverty New York: Oxford University Press.
Ravallion, M. & Bidani, B. (1994). How robust is a poverty profile? The World Bank Economic Review, 8(1), 71–102.Robano, V. & Smith, S. C. (2014). Multidimensional targeting and evaluation: A general framework with an application to a poverty program in Bangladesh. OPHI Working Paper 65. Oxford: University of Oxford
Roelen, K. (2017). Monetary and multidimensional child poverty: A contradiction in terms? Development and Change, 48(3), 502–533.
Roelen, K. (2018). Poor children in rich households and vice versa: A blurred picture or hidden realities? The European Journal of Development Research, 30(2), 320–341.
Roelen, K., Gassmann, F. & de Neubourg, C. (2009). The Importance of choice and definition for the measurement of child poverty: The case of Vietnam. Child Indicators Research, 2(3), 245–263.
Roelen, K., Gassmann, F. & de Neubourg, C. (2012). False positives or hidden dimensions: What can monetary and multidimensional measurement tell us about child poverty in Vietnam? International Journal of Social Welfare, 21(4), 393–407.
Ruggeri, C., Saith, R. & Stewart, F. (2003). Does it matter that we do not agree on the definition of poverty? A comparison of four approaches. Oxford Development Studies, 31(3), 243–274.
Santos, M. E., Villatoro, P., Mancero, X. & Gerstenfeld, P. (2015). A multidimensional poverty index for Latin America. OPHI Working Paper 79. University of Oxford.Secretaría de Coordinación General de Gobierno y El Instituto Nacional de Estadística (SCGG-INE) (2016). Medición Multidimensional de la Pobreza Tegucigalpa, Honduras.
Secretaría Técnica y de Planificación de la Presidencia (STPP) & Ministerio de Economía a través de la Dirección General de Estadística y Censos (MINEC-DIGESTYC) (2015). Medición Multidimensional de la Pobreza: El Salvador. San Salvador, El Salvador.
Sen, A. (1976). Poverty: An ordinal approach to measurement. Econometrica, 44(2), 219–231.
Sen, A. (1979). Equality of what? The Tanner Lecture on Human Values. add info
158
Sen, A. (1999). Development as Freedom. Oxford: Oxford University Press.
Statistics Canada (2010). Survey Methods and Practices. Ottawa: Ministry of Industry of Canada.
Statistics South Africa (2014). The South African MPI. Creating a Multidimensional Poverty Index Using Census Data. Pretoria , South Africa
Suppa, N. (2016). Comparing monetary and multidimensional poverty in Germany. OPHI Working Paper 103. Oxford: University of Oxford
Suppa, N. (2018). Transitions in Poverty and its Deprivations. An Analysis of Multidimensional Poverty Dynamics. Social Choice and Welfare, forthcoming forthcoming or 2018?
Thiry, G., Alkire, S. & Schleicher, J. (2017). Incorporating environmental and natural resources within analyses of multidimensional poverty. additional info
United Nations Educational, Scientific and Cultural Organization Institute for Statistics (UIS) (2004). Guide to the Analysis and Use of Household Survey and Census Education Data. Montreal.
United Nations (2005a). Designing household survey samples: Practical guidelines. New York: United Nations.
United Nations (2005b). Household Sample Surveys in Developing and Transition Countries. New York: United Nations.
United Nations (2008). Principles and Recommendations for Population and Housing Censuses. Revision 2. New York: United Nations.
United Nations Development Programme (2018a). Human Development Indices and Indicators: Vietnam’s 2018 Statistical Updates. Vietnam. City or publisher?
United Nations Development Programme (2018b). National Human Development Report 2018. Achieving Human Development in North East Nigeria. Nigeria. city of publisher
United Nations Development Programme (2010). Human Development Report 2010, 20th Anniversary Edition. The Real Wealth Of Nations: Pathways to Human Development. New York: UNDP.
United Nations Economic and Social Commission for Western Asia, United Nations Children’s Fund & Oxford Poverty and Human Development Initiative (2017). Arab Multidimensional Poverty Report. Beirut, Lebanon.
United Nations Educational, Scientific and Cultural Organization Institute for Statistics (2004). Guide to the Analysis and Use of Household Survey and Census Education data. Montreal, Canada.
Vaz, A., Alkire, S. & Oldiges, C. (forthcoming). Multidimensional child poverty: Building a measure to inform policy. OPHI Working Paper, University of Oxford Wang, X., Feng, H., Xia, Q. & Alkire, S. (2016). On the relationship between income poverty and multidimensional poverty in China. OPHI Working Paper 101. Oxford: University of Oxford.
Woollard, M. (2014). Administrative data: Problems and benefits. A perspective from the United Kingdom. In Adrian Duşa, Dietrich Nelle, Günter Stock & Wagner, G. G. (eds), Facing the Future: European Research Infrastructures for the Humanities and Social Sciences. Berlin SCIVERO.
World Bank (2017). Monitoring Global Poverty: Report of the Commission on Global Poverty. Washington D.C.: World Bank.
Zavaleta, D. & Angulo, R. (2017). In Brief: Roundtable and dashboard for the reduction of poverty in Colombia. Dimensions Magazine. 22017.

United Nations Development ProgrammeOne United Nations PlazaNew York, NY 10017, USAwww.undp.org
“The Multidimensional Poverty Index has been embraced by many as a methodological advancement and also, in some ways, a broadening of our aperture. It is a privilege for us to not only be part of this conversation, but to also be at the forefront of ensuring that the Agenda 2030 and SDGs never forget that the departure point must always be the poverty of those who have been left behind. That is where we must begin our work.”
- A C H I M S T E I N E R , A D M I N I S T R A T O R , U N D P
“We are pioneers at a global level in the implementation of the Multidimensional Poverty Index, a tool that has allowed us to formulate and follow-up more effectively our public policies against poverty. We no longer act with isolated programs. We are attacking this problem in all its dimensions.”
- J U A N M A N U E L S A N T O S , F O R M E R P R E S I D E N T O F C O L O M B I A , 2 0 1 6 N O B E L P E A C E P R I Z E