multidimensional poverty in a risky world - ophi · hdca summer school september 3, 2009 1...
TRANSCRIPT

HDCA Summer School September 3, 2009
1
Multidimensional poverty in a riskyworld
César CalvoUniversidad de Piura

2HDCA Summer School September 3, 2009
Outline
1. Why risk matters2. Focus on downside risk3. Measurement issues4. An example: Consumption and leisure.
Peru, 1998-20025. Concluding remarks

3HDCA Summer School September 3, 2009
Part 1
Why risk matters

4HDCA Summer School September 3, 2009
The usual risk-free world
� Think of how (unidimensional) povertyis usually measured:
� yi (outcome) is ‘too low’, but certain.� Is it only a matter of available data?
α
��
���
� −=z
yzP i
i

5HDCA Summer School September 3, 2009
The usual risk-free world
� Is it only a matter of available data?� The need of a forward-looking approach
� Policy targets those who will be poor in the‘future’ (at the earliest, at the time whenprogrammes are implemented).
� More importantly, people do look forward, which is why fear exists and deservesattention.

6HDCA Summer School September 3, 2009
What do we mean by risk?
� Stiglitz and Rothschild (1984)� Greater ‘noise’.� A shift of weight from the centre to the
tails.� The choice of a risk-averse individual.
� The individual faces alternative ‘states ofthe world’ – the i-th state materialiseswith probability pi.

7HDCA Summer School September 3, 2009
Is this relevant formultidimensional analysis?
� Best not to tread on the wrong steps ofothers. Let the intuitions behind ‘human security’ shape developments.
� Allow not only ‘other dimensions’ to enterthe analysis, but allow also for ‘otherstates of the world’.

8HDCA Summer School September 3, 2009
Intuition is on our side
� Even mainstream economics assumesrisk-aversion as the usual case.
� ‘Voices of the poor’ studies:� “Security is peace of mind and the
possibility to sleep relaxed”.� “After one poor crop we need three good
harvests ro return to normal”.� “Only the well-off truly can believe in
tomorrow”.

9HDCA Summer School September 3, 2009
Not only an efficiencyargument� By reducing her wealth, a large shock may lock
a household into a poverty trap; ‘ex-post effect’. Galor and Zeira (1993) and any other multiple-equilibria model.
� Risk exposure may induce fearful, unproductivebehaviours; ‘ex-ante effect’. Cattle in Rosenweig and Wolpin (1993), sweet potatoesin Dercon (1996).� ‘The two poverties’ of Banerjee (2000).
� But we are talking about something else.

10HDCA Summer School September 3, 2009
Part 2
Focus ondownside risk

11HDCA Summer School September 3, 2009
The threat of hardship
� Qualitative evidence points towardssomething slightly different from ‘risk’: it is about ‘downside risk’, about thefear to face hardship, about the burdenof a threat.
� Imagine z=100. Take a person withyi=120 when it rains (pRA=50%) andyi=60 in a drought (pDR=50%). Takeanother with yi=90 regardless of theweather.

12HDCA Summer School September 3, 2009
Vulnerability to poverty
� This threat may be large even forthose above the poverty threshold.
� Backward-looking vs forward-looking. Let us use ‘vulnerability to futurepoverty’.
� Two key questions:� a) how likely are poor outcomes?� b) how poor are these poor outcomes?

13HDCA Summer School September 3, 2009
Two benchmarks
� Vulnerability has been viewed as ‘expectedpoverty’ (Ravallion 1998).� This matters for policy planning, but risk is only a
measurement technicality.� Choice of parameters actually implied risk-loving
preferences!
� Vulnerability is also seen as risk-induced loss in well-being (Ligon and Schechter 2003).� But then the ‘poverty threshold’ plays no role.� Recall the farmer and imagine yi = 150 if it rains.

14HDCA Summer School September 3, 2009
A multidimensional frameworkstrengthens the argument
� When does a person face deprivation in some particular dimension of her well-being (e.g. ‘peace of mind’)?
� Vulnerability to future poverty is notunrelated with other dimensions (e.g. ‘social exclusion’ jeopardises risk-sharing opportunities).

15HDCA Summer School September 3, 2009
Part 3
Measurementissues

16HDCA Summer School September 3, 2009
The hurdles
� How to choose dimensions.� How to combine dimensions.� How to focus on downside risk.� How to capture the welfare loss due to
risk.� Forward-looking concept, but backward-
looking data.

17HDCA Summer School September 3, 2009
Two key intuitions
� Failure to reach some outcome level(‘poverty’).
� Variability across states of the world(‘risk’).

18HDCA Summer School September 3, 2009
An axiomatic approach
� NO COMPENSATION: Good states do not compensate for states of hardship.� Uncertainty only matters if it is strong
enough to entail that poverty is an actual threat.
� RISK SENSITIVITY (as defined by Rothschild-Stiglitz).
� A number of other desiderata: Normalisation, Probability-transfers, etc.

19HDCA Summer School September 3, 2009
A measure of VUP
[ ]αii xEVUP −=1
( )
10
,
<<
=
αz
zyMinx i
i

20HDCA Summer School September 3, 2009
What this needs in practice
� Note expected values do not suffice.� A forward-looking concept needs a value
for each ‘state of the world’, even forthose which never materialise.
� Some strong assumption aboutprobability distributions will be necessary.

21HDCA Summer School September 3, 2009
Vulnerability tomultidimensional poverty� A slightly wild analogy, using a CES-like aggregator
� See Bourguignon and Chakravarty (2003), Deutschand Silber (2005).
( )���
�
�−= =
ρα
ργJ
j ijji xEVMP1
1
10 ;10
11
≤≤<<
= =
ρα
γJ
j j

22HDCA Summer School September 3, 2009
Correlations over a population
� In the risk-free setting, correlations over a given population matter.
� The cross-derivative criterion:
( ) ( )2
1
12121
21
2−
=
−
���
����
�−=
∂∂∂
ρα
ρρ γγγαραJ
jijjii
ii
i xxxxx
VMP

23HDCA Summer School September 3, 2009
Correlations over states of theworld
� �=�: weighted average. Covariances do not matter.
� �>�: substitutes. A positive covarianceadds to their suffering (raises VUP).
� �<�: complements. A positive covariance helps (reduces VUP).
� We could have allowed dimensions torelate to each other differently.

24HDCA Summer School September 3, 2009
Part 4
An example:Consumptionand leisure.
Peru, 1998-2002

25HDCA Summer School September 3, 2009
The data
� 1998-2002: Many reasons foruncertainty.
� 272-household, hardly representativepanel.
� Consumption, with the usual povertyline.
� Leisure, with 48 working hours per weekas the threshold (or 0 for those agedbelow 17 or above 65).

26HDCA Summer School September 3, 2009
Basic empirical strategy
� To exploit the (short) time dimension of thepanel, let
� �i: Household-specific fixed effects.� �i,t : Household-specific trends.� �t: Time-specific, covariant shocks (ignored in
simulations).� �i,t: Idiosyncratic shocks
� We cannot afford lagged explanatory variables.
tittiiti ty ,,, εηβµ +++=

27HDCA Summer School September 3, 2009
A probability distribution for �i,t
� Note we need each household to differ in its degree of risk exposure.
� Assume a discrete uniform distribution, with 20% probability for each estimated�i,t.� Normality is an obvious alternative.
� Assume the observed pairs are stable(which settles the degree of correlationbetween dimensions).

28HDCA Summer School September 3, 2009
Descriptive statistics
RuralUrbanRuralUrban
1.081.111.071.56Average1.081.110.991.4420021.081.101.001.3720011.071.131.061.5320001.091.131.131.7719991.081.131.141.681998
LeisureConsumptionYear

29HDCA Summer School September 3, 2009
Results (1)
� We should not expect risk to explain much differencebetween VUPcons and Pcons in urban and rural areas.
� Note greater stability in the aggregate is consistent withgreater individual uncertainty.
---0.093-0.069Corr �cons, �leis
0.570.670.250.24Std Dev of �i,t
1.081.111.071.56AverageRuralUrbanRuralUrban
LeisureConsumption

30HDCA Summer School September 3, 2009
Results (2)
� Note risk explains why rural households are less vulnerable to leisure poverty.
0.0140.018- VUP1.081.11- Average
Leisure0.1260.078- VUP1.071.56- Average
ConsumptionRuralUrban(�=0.50)
31HDCA Summer School September 3, 2009
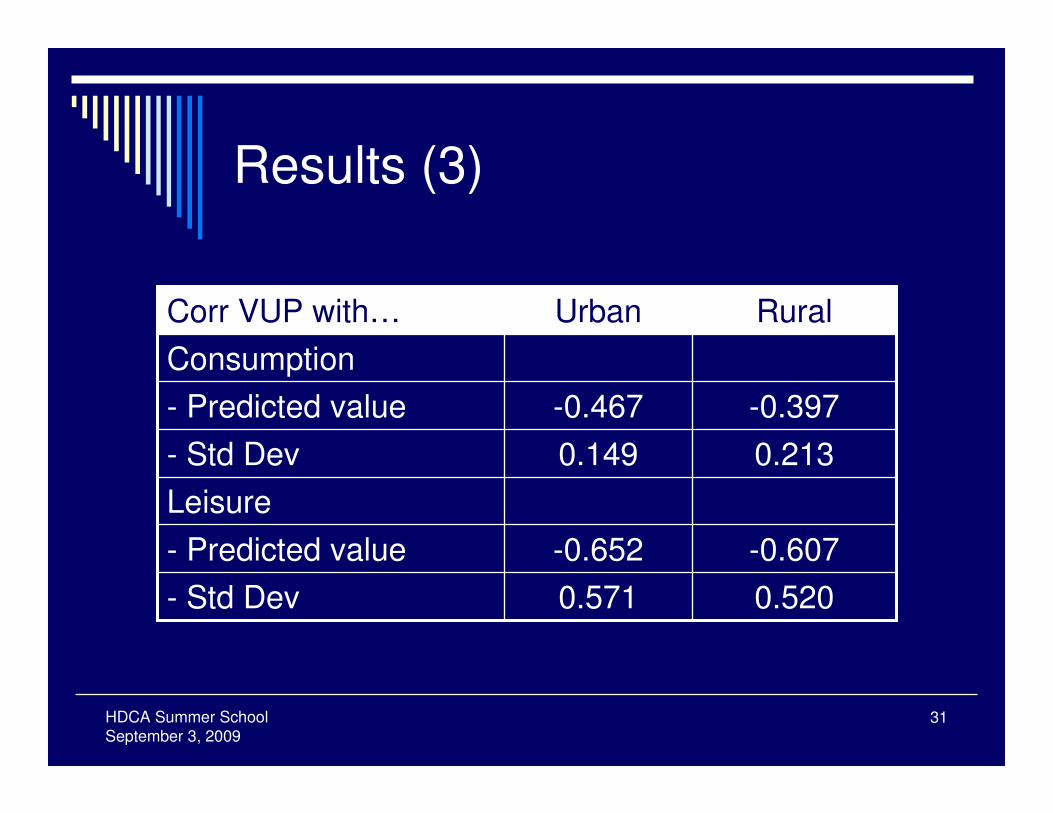
Results (3)
0.5200.571- Std Dev-0.607-0.652- Predicted value
Leisure0.2130.149- Std Dev-0.397-0.467- Predicted value
ConsumptionRuralUrbanCorr VUP with…

32HDCA Summer School September 3, 2009
Results (4)
0.0640.041VMP (�=0.75) [certainty]
0.0670.046VMP (�=0.75)
0.0700.048VMP (�=0.50)
0.0730.049VMP (�=0.25)
RuralUrban(�=.050, �=0.50)
� Vulnerability increases in risk exposure.� Recall Corr(�cons,�leis) is stronger in rural areas.

33HDCA Summer School September 3, 2009
Part 5
Concluding remarks
34HDCA Summer School September 3, 2009
Concluding remarks
� If we think of ‘peace of mind’ as a relevant well-being dimension, then‘vulnerability to future multidimensional poverty’ might be the right way forward.
� New issues arise:� What dimensions can be best predicted?� How do dimensiones substitute for each
other across states of the world?